Abstract
Seismic interferometry using ambient noise provides an effective approach for subsurface imaging through reconstructing passive virtual source (PVS) responses. Traditional crosscorrelation (CC) seismic interferometry relies on a uniform dense distribution of passive sources in the subsurface, which is often challenging in practice. The multidimensional deconvolution method (MDD) alleviates reliance on passive-source distribution, but requires wavefield decomposition of the original data. This is difficult to accurately achieve for uncorrelated noise sources, leading to the existence of non-physical artifacts in the reconstructed PVS data. To address this issue, this study proposes a method to improve the accuracy of PVS data reconstruction using an enhanced U-Net. This data-driven approach circumvents the challenge of noise wavefield decomposition encountered in the traditional MDD. By integrating a feature fusion module into U-Net, multi-scale sampling information is leveraged to improve the network’s ability to capture detailed PVS data features. The combination of active-source data constraints and the modified MDD further optimizes PVS data retrieval during training. Numerical tests show that the proposed method effectively recovers waveform information in PVS retrieval records with non-ideally distributed sources, suppressing coherent noise and false events. The reconstructed recordings have a clear advantage in the reverse time migration (RTM) imaging results, with strong generalization performance across various velocity models.
1. Introduction
Passive source seismic methods based on ambient noise have been commonly applied to detect and evaluate subsurface structures as a non-destructive exploration technique [1]. Seismic interferometry (SI) is capable of improving the signal-to-noise ratio and resolution of seismic data by converting ambient noise signals, which are regarded as useless in conventional seismic surveys, into valuable reflected wave signals [2,3]. SI was first used to synthesize self-stimulating and self-receiving records [4]. Then it was gradually extended to three-dimensional elastic media. A series of seismic interferometry methods based on crosscorrelation (CC) [5], convolution [6,7], deconvolution [8], and cross-coherence [9] have been developed, which have broad application potential in the field of subsurface structure detection [10,11]. Examples include the acquisition of metal ore zones [12], dynamic monitoring of CO2 sequestration [13], and oil and gas reservoir prediction [14,15,16].
The classical SI approach using CC requires that the subsurface passive seismic source distribution be randomly homogeneous and have a wide range of distribution in the lateral direction with respect to the receiver array. However, in practice, the illumination conditions of passive sources often do not satisfy the ideal assumptions [17]. Wapenaar et al. introduced the multidimensional deconvolution method (MDD) instead of CC for SI with known direct waves of the seismic data from passive sources and characterized the artifacts arising from the uneven distribution of the sources by point spread functions (PSF) [18]. The effect of anisotropic illumination can be corrected by removing the PSF from the reconstruction results, thus reducing the sensitivity of SI to the source distribution, and the superior performance of MDD has been demonstrated by its application in real data [19,20,21]. However, for ambient noise data, the direct wave cannot be accurately separated. Therefore, in SI based on ambient noise data, the PSF can currently only be approximated by time windowing the complete Green’s function reconstructed using CC [22]. The accuracy of this approximate result is easily affected by factors, such as surface conditions, medium scattering intensity, and illumination aperture, so the PSF extracted by traditional methods often has errors, leading to the inclusion of nonphysical events in the results obtained by MDD. How to improve the wavefield accuracy of MDD-based SI reconstruction has become a problem that many researchers have endeavored to solve [23,24,25].
Deep learning methods with powerful data fitting and feature extraction capabilities provide new solutions to address the unphysical events that are difficult to overcome by traditional retrieval methods. Convolutional neural networks (CNNs) [26] were proposed in the 1990s. In addition, variants of CNNs, such as ResNet [27], DenseNet [28], and U-Net [29], further improve the accuracy and generalization ability of the models through innovative network architecture design [30]. In the field of seismic exploration, e.g., noise suppression [31,32], low-frequency reconstruction [33], fissure identification [34,35], precise imaging [36] and even waveform inversion [37] are realized by introducing deep learning. In seismic interference, the accuracy of reconstruction results can be improved by training deep neural networks to find the relationship between the empirical Green’s function and correlograms of the ideal Green’s function [38,39,40]. However, most of them are performed based on the traditional CC reconstruction, which needs to be improved for passive-source seismic records with non-ideal acquisitions. Furthermore, although the traditional MDD reconstruction can partially solve the problem of non-ideally distributed sources, the direct waves of the traditional MDD reconstruction are missing, which is unfavorable for shallow imaging in geological formations. The problems of artifactual interference and missing information in this method have not been solved yet. This study aims to overcome the point spread function extraction error problem caused by the difficulty of wavefield separation in the traditional MDD process. Meanwhile, due to the natural existence of direct waves in active-source seismic records, and because the traditional MDD usually uses the approximated scattering Green’s function to perform the inverse pleat product operation on the point spread function, the direct wave signals cannot be obtained in their reconstructed records. This makes it difficult to match the mapping of input and output during network training. By modifying the traditional MDD in order to retain effective direct wave signals, the shallow surface signals can be preserved. To this end, we propose a deep learning method that introduces constraints on the active-source data in the network to suppress interference in the virtual source recordings. The U-Net network structure excels in record segmentation through jump connections but shows its disadvantage in complex geologic structures due to the complexity of the recorded waveform information. We improve the U-Net network by introducing a feature fusion module to enhance the network’s ability to capture the detailed features of PVS data, optimize the mapping relationship between the input dataset and the desired labels, and effectively suppress the unphysical events in the passive virtual source records. The passive virtual source retrieval records of the complete survey line are predicted under the condition of sparse active sources for accurate imaging.
2. Methods
2.1. Enhanced U-Net Architecture
The core challenge of passive-source reconstruction is that the input signal is usually mixed with a large amount of noise and undergoes a complex attenuation and propagation process, which makes it significantly more difficult to recover high-precision virtual source features from low signal-to-noise ratio (SNR) data. To address this issue, supervised learning demonstrates unique advantages. By constructing massive paired datasets of active and passive sources, the system learns intricate nonlinear mappings between them. This data-driven training paradigm not only enhances the model’s adaptability to noise interference but also effectively captures deep-seated physical laws governing wavefield propagation, thereby significantly improving the robustness of the reconstruction system. However, due to the serious noise interference in the passive-source records, these noise intensities are even stronger than the effective signals, such as reflected waves [41], and we mainly use this effective information for imaging and inversion processing in practical applications. Therefore, a multi-scale feature fusion module needs to be added to the network to make the learning of the network more focused on the deep information of seismic records.
We utilize the waveform information extracted from the reconstruction of PVS data and convert it into image-to-image form via a convolutional neural network. The input consists of 2D seismic profiles from PVS acquisition, while the output corresponds to active-source seismic images with identical dimensions. The network adopts a symmetric four-level encoder–decoder structure and introduces Atrous Spatial Pyramid Pooling (ASPP) module at the input [42], which is composed of a 1 × 1 convolutional layer, three parallel 3 × 3 dilated convolutional layers (with dilation rates of 1, 3, and 5), and a global average pooling layer. The outputs of each branch are then connected by channels for cross-scale information complementation as well as redundant noise suppression. By setting parallel convolution paths with different dilation rates, local details (small rates) and large-scale tectonic information (large rates) are captured respectively. The synergistic extraction of multi-scale geological features is realized, which significantly improves the ability to characterize key information, such as reflected waves and diffracted waves, in complex structures. Thus, it can be adjusted according to the input dataset to reduce the complexity of network computation and refine the feature extraction. In addition, Attention U-Net is a grid-based Attention Gate (AG) semantic segmentation network proposed by Oktay [43]. Attention Gates (AGs) are added to the skip-connection paths, which are then optimized for downsampling.
In the network training of this paper, the encoder part is computed by two-way attention weights using a cascaded Convolutional Block Attention Module (CBAM) [44]. It is composed of two modules—CAM (Channel Attention Module) and SAM (Spatial Attention Module). CAM generates channel-wise weights via shared fully connected layers, amplifying informative channels (e.g., reflection dominated) while suppressing noise-correlated ones. SAM performs spatial recalibration through channel-wise max/average pooling followed by 7 × 7 convolution, focusing on salient waveform regions while filtering background noise. The enhanced U-Net structure realized by introducing the feature fusion module is shown in Figure 1. This approach, which utilizes supervised training of deep learning of multiscale feature fusion for the suppression of unphysical events present in the reconstruction results of non-ideally distributed noise sources, can learn more accurate seismic wavefield features, thus improving the quality of reconstructed records.
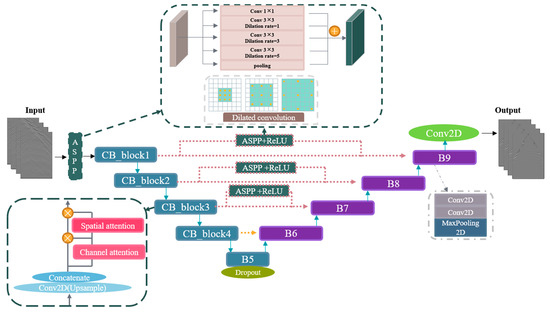
Figure 1.
Feature fusion-based enhanced U-Net.
Since the operation of fully convolutional networks is similar to nonlinear regression, the mean squared error (MSE) function is chosen as the loss function.
where denotes the sum of pixels in a single seismic record; i denotes the number of elements processed by the neural network; and and denote the predicted and target values of the network, respectively. The activation function is selected as ReLU, the optimizer is selected as Adam, and the learning rate is set to 0.00001. The dropout of the fully connected layer in the experiments adopts the commonly used p = 0.5, which prevents the grid from overfitting.
2.2. Modified MDD
2.2.1. Method of Modified MDD
Seismic interferometry reconstructs Green’s functions based on the bilateral focusing assumption. Conventional seismic interferometry typically relies on crosscorrelation (CC) methods, with the detailed CC formulation provided in Appendix A. however, the Green’s functions retrieved through CC are subject to stringent assumptions, such as a lossless medium and isotropic illumination of receivers by wavefields from all directions. These assumptions break down when the source distribution is spatially irregular. For example, assuming a non-uniform distribution of seismic sources located on the left half of the model domain, the wavefield illumination becomes asymmetric, resulting in degraded reconstruction quality. Under such conditions, substantial differences arise in the performance of CC and MDD methods, with MDD demonstrating superior robustness in handling spatially biased source configurations. As illustrated in Figure 2, using active-source data as a reference (Figure 2a), the CC reconstruction result (Figure 2b) displays substantial waveform loss and coherent artifacts, whereas the MDD reconstruction (Figure 2c) demonstrates effective waveform recovery. Further comparison of single trace (tr = 0.5 km) waveforms reveals (Figure 3) that the MDD waveform closely matches the active-source waveform within the 0.3–0.8 s time window, while the CC method achieves waveform convergence with the reference data only within isolated time intervals.
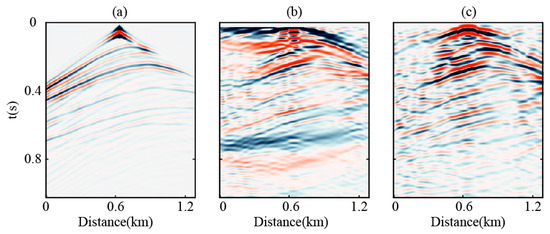
Figure 2.
Comparison of retrieval results with the virtual source located at x = 0.64 km. (a) Active source reference record; (b) reconstructed records using the CC; (c) reconstructed records using the MDD.
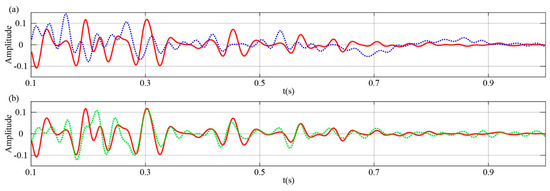
Figure 3.
Single-trace comparison. (a) the red curve represents the active source reference trace, while the blue curve shows the passive source reconstruction obtained using the CC method; (b) the red curve represents the active source reference trace, and the green curve shows the passive source reconstruction obtained using the MDD method.
To address these limitations, the MDD method extended from correlation-based seismic interferometry (Figure 4) and the convolution reciprocity theorem is
where
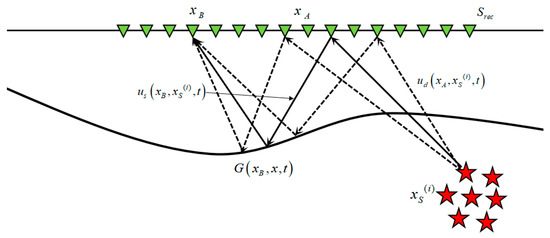
Figure 4.
Multidimensional deconvolution seismic interferometry.
and are two geophones deployed on the surface, is the source positions, is the receiver plane, represents the time series and represents the time-reversed sequence. is the convolution operator, in (1) is a correlation function that reflects the scattered responses between receiver pairs, in (3) represents the subsurface response relative to the reference state, also known as interferometric PSF, is the scattered Green’s function. and , respectively, represent the scattered waves and direct waves excited by a passive source at location .
Hence, The traditional matrix form of MDD is as follows:
Due to the strong incoherence of the noise sources, it is difficult to separate and . An approximate method is used to extract the PSF, while the traditional noise crosscorrelation is
where
where is the complete crosscorrelation record. is the PSF component. and are the causal and acausal parts, respectively. is the weak scattering component. Its matrix form is as follows:
where is the virtual Green’s function.
In traditional MDD, the scattering Green’s function , typically obtained through approximation, is used to perform deconvolution on the PSF . This leads to errors in the deconvolution operation, making the stability relatively insufficient [45]. Moreover, since the direct wave signal cannot be obtained in the reconstructed records, Wapenaar applied a full CC result for deconvolution of the point spread function in surface wave exploration, preserving the effective signals of the shallow subsurface [3]. Based on this theoretical foundation, in order to ensure that the passive source retrieval includes direct wave features from the label set, we modify MDD reconstruction by using CC results for deconvolution of the PSF:
This approach provides an approximate direct-wave response for the training dataset while preserving shallow subsurface seismic information. However, due to the lack of filtering in the CC reconstruction, coherent noise is carried into the MDD records, resulting in significant high-energy noise artifacts in the input data for deep learning, accumulated through the seismic interferometry process. By optimizing the MDD operator, it becomes possible to enhance the matching of useful waveform characteristics, extract a more comprehensive set of effective wavefield information, and isolate incoherent noise components. During the deep learning training process, not only can critical body-wave signals be reconstructed, but interferometric noise can also be effectively suppressed, thereby improving the model’s ability to discriminate between signal and noise.
2.2.2. Validation of the Effectiveness of Modified MDD
We conducted training using both the traditional MDD and the modified MDD incorporating direct wave information. The test model and the distribution of passive sources are shown in Figure 5, where the sources are concentrated on the left side of the fault model. Since the subsurface sources are located on the left side of the survey line (x = 0–0.5 km), when the virtual source is positioned on the right side, far from the actual sources, the retrieval results exhibit two types of typical distortions due to cumulative errors in wavefield extrapolation: (1) Seismic events exhibit linear intersecting patterns (left panels of Figure 6a,b); (2) High-amplitude interference artifacts manifest as band-shaped distributions along wave propagation paths (left panel of Figure 6a). To quantitatively evaluate the correction capabilities of different MDD strategies on far-field waveform distortions, this study conducted comparative analyses on virtual source reconstruction profiles at x = 0.98 km, maintaining identical network architecture configurations. This location, positioned 0.4 km from the true source region, resides within the characteristic zone exhibiting maximum interference artifacts. A total of 300 s of passive-source recordings were acquired, with the active-source reference recordings generated using Ricker wavelet forward modeling. Ricker’s peak frequency is 30 Hz. When the virtual source was placed in the right-side region, the modified MDD (right panel of Figure 6a) exhibited significantly enhanced continuity of shallow reflection events, increased SNR within the 0–600 ms time window, and reduced phase errors in diffracted waves near the fault compared to the baseline method. Compared to traditional MDD, the proposed method demonstrates superior performance in waveform fidelity, noise suppression capability, and adaptability to complex structures.
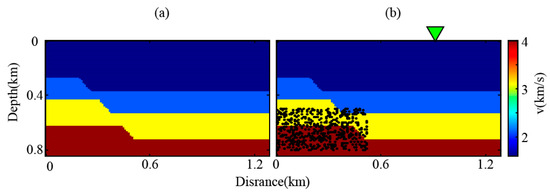
Figure 5.
(a) Test model and (b) its passive-source locations.
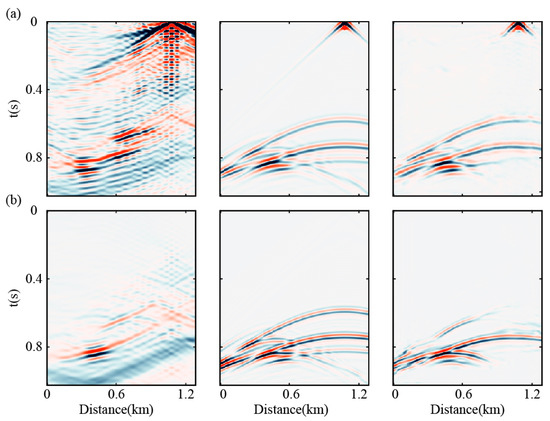
Figure 6.
Comparison of virtual source reconstruction results using enhanced U-Net with different MDD strategies. (a) Left: modified MDD reconstructed record; Center: active-source seismic record; Right: predicted seismic record; (b) Left: traditional MDD reconstructed record; Center: active-source seismic record; Right: predicted seismic record.
Therefore, in all experiments conducted on different velocity models, the modified MDD was adopted for retrieval.
2.3. Training Set and Test Set
In the experiment, we simulate and synthesize the training dataset using 2D velocity models from different geological structures. These geological structures include fault structures and a slice extracted from the SEG/EAGE 2D Overthrust model. These models represent various subsurface configurations and can better generalize and adapt to different subsurface conditions when applied to observed data. The two training velocity models have consistent sizes. The horizontal length is 1280 m, the vertical depth is 840 m, and the grid spacing is 10 m (Figure 5a) in both directions. In the simulation of passive-source seismic data, the same number of sources is set with identical non-ideal distribution locations. Seismic receivers are placed on the model surface with a receiver spacing of 10 m. The finite-difference forward modeling method is used to collect noise source seismic records with non-ideal distribution locations, as well as active-source seismic records, under different velocity models.
To ensure that the network input data is consistent in terms of parameter sizes and that the output ranges between network layers are kept within reasonable intervals, normalization is applied. In this study, min–max normalization is applied individually to each seismic record based on its local maximum and minimum amplitude values. This approach ensures high amplitude contrast and enhances lateral continuity of pixel-level seismic events within each gather. Moreover, scaling the data to a fixed numerical range facilitates network convergence and improves training stability and final reconstruction accuracy in the deep learning workflow.
where is the normalized amplitude, represents a specific data point within the seismic reconstruction profile, denotes the minimum amplitude value across all data points in the profile, and corresponds to the maximum amplitude value. This normalization ensures that the reconstructed waveforms are scaled within a standardized dynamic range, facilitating quantitative comparisons of amplitude fidelity. This helps to avoid slow convergence or overfitting of the model.
After pre-processing the data, we randomly selected 80% of the entire dataset as the training set and the remaining 10% for validation as well as 10% for testing. Furthermore, to evaluate the network’s predictive performance under sparse active-source constraints, both the test passive-source reconstruction dataset and the sparse active-source dataset were fed into the pre-trained network for virtual source signature prediction. This framework rigorously assesses the model’s ability to generalize across variable illumination conditions while maintaining waveform fidelity in data-deficient scenarios.
3. Results
3.1. Test on Fault Model
To validate the effectiveness of the proposed methodology, we trained the network using modified MDD reconstruction results and expanded the dataset by constructing 40 randomized fault models (Figure 7). A total of 600 passive sources were stochastically distributed within the depth range of 0.5–0.8 km and lateral range of 0–0.5 km to simulate a passive survey scenario with unidirectional illumination. The spatial distribution of passive sources is visualized in Figure 8.
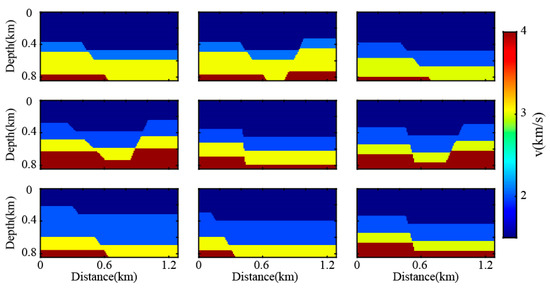
Figure 7.
A portion of randomly generated fault models.
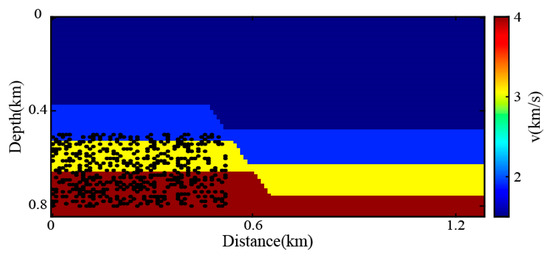
Figure 8.
Source positions in the fault model.
The passive-source wavelets were modeled as random noise sequences with a maximum frequency of 30 Hz, where each noise wavelet was assigned a distinct excitation time to ensure mutual uncorrelatedness between wavelets. We simulated ambient-noise passive seismic records using a finite-difference method. The model incorporated a free-surface boundary condition at the top and perfectly matched layer (PML) boundaries on the remaining three sides. At the initial simulation time, all noise wavelets were simultaneously injected into the model, rather than sequentially simulating individual passive-source wavefields. Passive seismic records were acquired with a 1 ms sampling interval over a 300 s duration. For active sources, the true source signature was defined as a 15 Hz dominant-frequency Ricker wavelet, and active-source records were recorded for 1.1 s.
During the network testing phase, we employed models excluded from the training process to perform reconstruction predictions on passive-source data across the full survey line. Specifically, the complete passive-source reconstruction dataset of the survey line and the sparse active-source dataset were input into the pre-trained network to predict virtual source signatures along the entire line. The sparse active sources were configured with a sampling interval of 0.2 km, aiming to (a) evaluate the model’s generalization capability in scenarios devoid of active-source constraints and (b) validate its adaptability and robustness under complex conditions, including non-uniform source distributions and data sparsity.
The numerical simulation training data were input into the feature fusion enhanced U-Net, with comparative analyses conducted against a conventional four-level U-Net. Under the unidirectional illumination scenario with the virtual source positioned at x = 0.98 km, the traditional MDD reconstruction results (Figure 9a) exhibit significant deviations from the active-source reference records. Reflections and diffractions manifest as linear intersecting artifacts, causing severe wavefield distortion. In contrast, the enhanced U-Net predictions (Figure 9d) successfully recover reflection events, displaying well-defined hyperbolic moveout patterns characteristic of true subsurface reflectors.
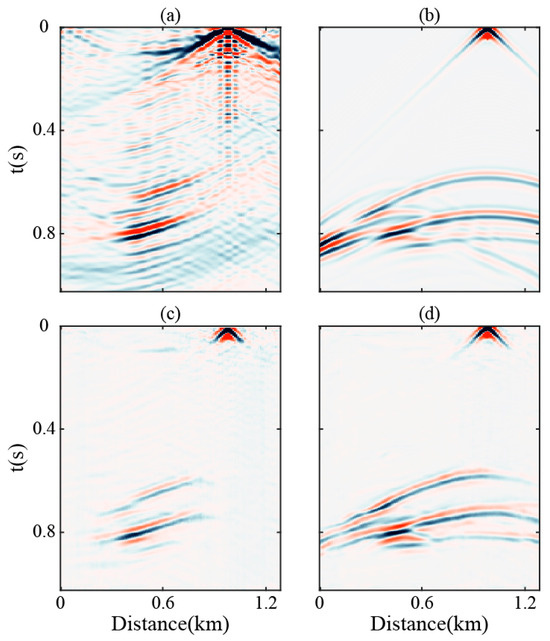
Figure 9.
Source positions in fault model. Comparison of retrieval results with the virtual source located at x = 0.98 km. (a) Reconstructed records using the modified MDD; (b) active source seismic records; (c) prediction results from the conventional U-Net; (d) prediction results from the enhanced U-Net.
A direct comparison between the conventional U-Net predictions (Figure 9c) and the enhanced network outputs (Figure 9d) reveals two critical advantages of the proposed method: The enhanced U-Net achieves superior reconstruction accuracy in deep zones (t > 0.5 s) and model boundaries; The coherent noise energy is reduced.
These results demonstrate that the multi-scale feature fusion mechanisms—integrating ASPP-derived contextual features and CBAM-optimized attention weights—significantly enhance the network’s capacity to learn complex PVS data patterns and suppress non-physical artifacts. The hierarchical feature integration enables robust recovery of diffraction kinematics and amplitude-versus-offset (AVO) trends, critical for subsequent imaging and inversion workflows. For comparative analysis, a detailed examination of single-trace records (with a spatial sampling interval of 8 m) was conducted, as shown in Figure 10, where each trace is convolved with the source wavelet S(t). The results indicate that at far-offset locations (x = 0.05 km and x = 0.12 km), the waveforms reconstructed by the modified MDD method (Figure 10a) exhibit limited accuracy and are contaminated by significant shallow noise interference. The conventional U-Net output (Figure 10b) fails to match the reference waveforms, showing incoherent signals with disrupted phase continuity. In contrast, the enhanced U-Net result (Figure 10c) shows a clear tendency to approximate the active-source waveform. At near-offset locations (around x = 0.1 km), the enhanced U-Net demonstrates a better ability to recover both phase and amplitude characteristics of the reference data. Meanwhile, the conventional U-Net output lacks coherent amplitude and phase features, severely compromising the fidelity of the reconstructed seismic traces.
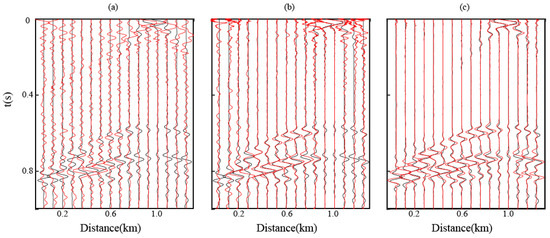
Figure 10.
Waveform comparison. (a) Reconstruction prediction results of the modified MDD (red), compared with active-source reference records (black). (b) Reconstruction prediction results of the traditional U-Net (red), compared with active-source reference records (black). (c) Reconstruction prediction results of the enhanced U-Net (red), compared with active-source reference records (black).
To evaluate the accuracy of the reconstructed virtual shot gathers, we performed reverse time migration (RTM) on the sparsely active-source-constrained PVS intelligent reconstruction data during the network testing phase to verify whether the reconstruction results could reliably recover subsurface reflectivity structures, as illustrated in Figure 11. Figure 11a shows the migrated image obtained using active-source data with a shot spacing of 200 m. In the red-boxed area, the reflectors appear bent, despite no actual structural deformation in the true subsurface model. This artifact arises due to the large shot spacing in active-source acquisition, which, driven by cost constraints, leads to uneven illumination and poor imaging continuity. In contrast, passive-source acquisition allows for denser and more uniform sampling, providing improved illumination of deeper structures and enabling more accurate delineation of subsurface reflectors. The RTM image derived from traditional MDD-processed data (Figure 11b) exhibits coherent noise contamination and distorted deep reflectors on the left flank, compromising imaging fidelity. While the conventional U-Net predicted shot gathers (Figure 11c) partially suppress shallow noise, they still suffer from inadequate resolution and discontinuous stratigraphic structures near deep interfaces and model boundaries. In contrast, the enhanced U-Net predictions (Figure 11d) demonstrate superior resolution and geometrically continuous reflectors in both deep and edge zones, with restored stratigraphic curvature matching the true velocity model, confirming that the proposed network effectively enhances PVS data quality and elevates imaging precision through noise-robust feature learning and physics-constrained waveform optimization.
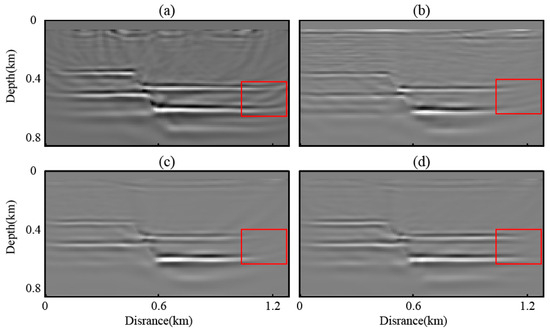
Figure 11.
RTM imaging results. (a) Imaging results of reconstructed records using active source; (b) imaging results of reconstructed records using traditional MDD; (c) imaging results of reconstructed records predicted by the conventional network for virtual sources; (d) imaging results of reconstructed records predicted by the improved network for virtual sources.
To quantitatively evaluate the similarity between the reconstructed virtual shot gathers and the reference active-source data, we introduce data similarity metrics as an auxiliary assessment tool. These metrics are computed within a time window covering key reflection events and across representative offset ranges to ensure robustness. The similarity evaluation complements the RTM imaging results and offers insight into the fidelity of the wavefield reconstruction at the trace level. Specifically, we employ the following metrics (Table 1).

Table 1.
Reconstruction Quality Comparison Based on Data Similarity Metrics.
Normalized Crosscorrelation (NCC) evaluates waveform similarity across traces; Mean Squared Error (MSE) measures amplitude deviation between the reconstructed and reference wavefields, and Structural Similarity Index (SSIM) assesses the structural fidelity of seismic events across common-offset gathers.
To better understand the contribution of individual components within the enhanced U-Net, particularly the ASPP and CBAM modules, we conducted additional ablation studies. Specifically, we evaluated the model performance under three configurations: (1) traditional U-Net, (2) U-Net + CBAM, and (3) U-Net + ASPP. We then compared them to the full model (U-Net + ASPP + CBAM), and the results were visualized to facilitate comparative analysis. These visualization results (Figure 12) demonstrate that both the CBAM and ASPP modules are capable of adaptively enhancing reflection events and attenuating noise-dominated regions to a certain extent, which aligns with their intended design. However, when applied individually, their ability to accurately reconstruct seismic reflectors is limited, particularly in terms of preserving phase continuity and amplitude fidelity. In contrast, the integrated enhanced U-Net architecture (with both ASPP and CBAM) exhibits a markedly improved capacity to recover coherent reflection events, restore accurate waveform morphology, and maintain high spectral fidelity. This indicates its superior effectiveness in reconstructing structurally consistent subsurface features and enhancing signal-to-noise discrimination in complex geological settings.
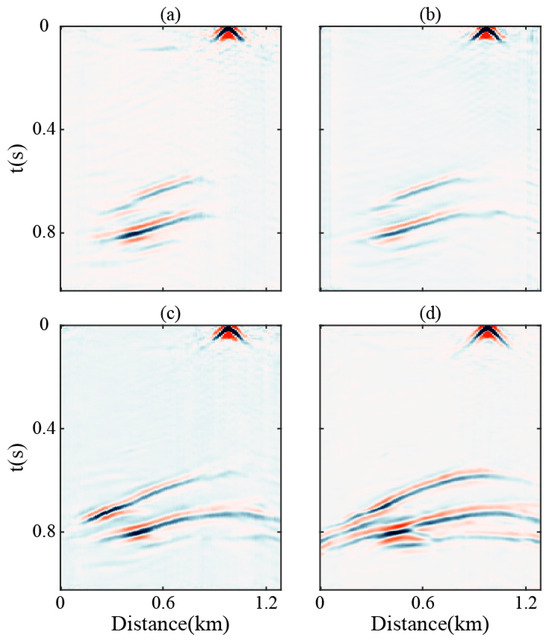
Figure 12.
Visualization results of seismic trace reconstruction for different network configurations. (a) Tditional U-Net; (b) U-Net + CBAM; (c) U-Net + ASPP; (d) U-Net + ASPP + CBAM (enhanced U-Net).
3.2. Test on SEG/EAGE Overthrust Model
To further validate the generalization capability of the enhanced U-Net network, a section of the overthrust model is selected as the training model (Figure 13a). The experiment utilized 600 passive sources distributed within the depth range of 40% of the model’s left flank (Figure 13b) to simulate a unidirectional illumination passive seismic survey scenario. The passive-source wavelets are random noise sequences with a maximum frequency of 40 Hz, where distinct excitation times ensured mutual uncorrelatedness between noise wavelets. Passive seismic records were acquired at a 1 ms sampling interval over a 300 s duration. Active sources employed 20 Hz dominant-frequency Ricker wavelets, with active-source records recorded for 1.1 s. During the testing phase, the full-survey-line passive-source reconstruction dataset and the sparse active-source dataset (0.2 km sampling interval) were input into the pre-trained network to evaluate its performance in reconstructing virtual shot gathers under spatially constrained illumination conditions.

Figure 13.
SEG/EAGE overthrust velocity model (a) and source locations (b).
Under non-ideal source distribution conditions (maximum offset ≤ 1.2 km), traditional reconstruction methods (Figure 14a) exhibit substantial spurious coherent events and coherent noise contamination, with severe waveform loss in far-offset regions, hindering accurate identification of subsurface reflectors. In contrast, active-source reference records (Figure 14b) display well-defined waveform characteristics with a high signal-to-noise ratio, preserving complete reflection kinematics and clear stratigraphic continuity. For virtual sources positioned at x = 0.98 km, while the conventional U-Net predictions (Figure 14c) maintain reasonable shallow waveform accuracy, they exhibit notable signal degradation in deep zones. The enhanced U-Net outputs (Figure 14d), however, demonstrate superior performance by suppressing coherent noise and other non-physical artifacts in the predicted results while preserving more waveform details in deep and far-offset (x > 0.5 km) regions, thereby enhancing data resolution. These results validate the enhanced U-Net’s robust generalization capability and waveform detail recovery capacity, maintaining reconstruction accuracy even under suboptimal acquisition geometries. Further decimation to single-trace records (sampling interval = 8 m) was conducted for comparative analysis, with results presented in Figure 15, for display purposes convolved with S(t). The results demonstrate that at far-offset positions (x = 0.05 km and 0.12 km), the waveforms reconstructed using the modified MDD method (Figure 15a) show reduced accuracy and are notably affected by strong noise contamination in the shallow section. The conventional U-Net waveforms (Figure 15b) fail to match the reference data, exhibiting disordered signals with incoherent phase relationships. In contrast, the enhanced U-Net results (Figure 15c) show significant convergence toward the active-source waveform. Overall, the enhanced U-Net reconstruction achieves higher resolution with superior seismic event alignment and smoother waveform continuity, whereas the conventional U-Net results display pervasive noise contamination that critically degrades reconstruction fidelity.
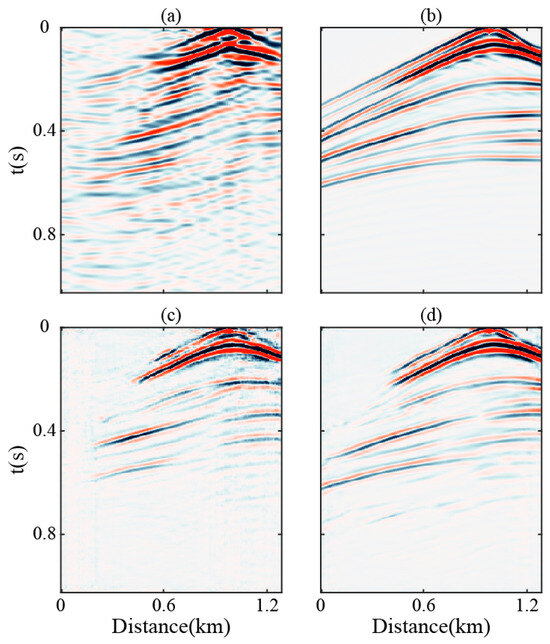
Figure 14.
Comparison of retrieval results with the virtual source located at x = 0.98 km. (a) Reconstructed records using the modified MDD; (b) active source seismic records; (c) prediction results from the conventional U-Net; (d) prediction results from the enhanced U-Net.
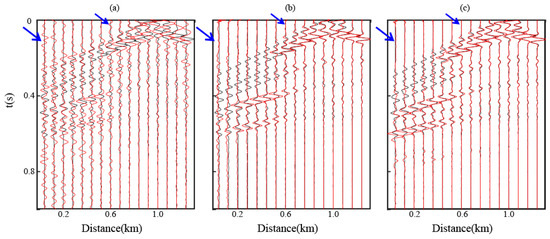
Figure 15.
Waveform comparison. (a) Reconstruction prediction results of the modified MDD (red), compared with active-source reference records (black). (b) Reconstruction prediction results of the traditional U-Net (red), compared with active-source reference records (black). (c) Reconstruction prediction results of the enhanced U-Net (red), compared with active-source reference records (black).
Perform RTM imaging on the tested PVS data, with results illustrated in Figure 16. Similarly, due to the sparse shot interval of 200 m in the active-source acquisition, inadequate illumination causes structural distortion and loss of fidelity in the deep subsurface imaging. The RTM image derived from conventional MDD-processed data (Figure 16b) exhibits severe interference signals, resulting in discontinuous stratigraphic interfaces. While the conventional U-Net predictions (Figure 16c) achieve reasonable accuracy in shallow-layer reflector recovery, deep imaging (>0.5 km) suffers from blurring artifacts, resulting in lower boundary clarity. In contrast, the enhanced U-Net predictions (Figure 16d) demonstrate superior performance through (1) enhanced vertical resolution through multi-scale waveform optimization; (2) reduced amplitude of shallow interference, and (3) effective suppression of coherent noise and non-physical artifacts. The method notably improves thin-layer delineation and maintains stratigraphic continuity in deep zones. These results quantitatively validate the enhanced U-Net’s superiority in handling complex seismic data processing challenges, particularly in noise-ridden environments with intricate subsurface geometries.
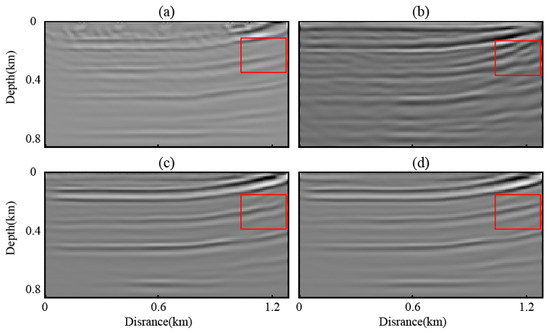
Figure 16.
RTM imaging results. (a) Imaging results of reconstructed records using active source; (b) imaging results of reconstructed records using traditional MDD; (c) imaging results of reconstructed records predicted by the conventional network for virtual sources; (d) imaging results of reconstructed records predicted by the enhanced network for virtual sources.
To further validate the generalization capability of the proposed network across different geological scenarios and source configurations, we conduct a second numerical experiment using the Overthrust model. To quantitatively assess the reconstruction performance under these more challenging acquisition conditions, we apply the same set of data similarity metrics (Table 2). All metrics are computed within carefully selected time-offset windows focusing on key reflection phases and deeper structures. This similarity-based evaluation allows us to assess how well the network retains structural and waveform fidelity in different environments, complementing the visual inspection of RTM images and single-trace comparisons.

Table 2.
Reconstruction quality comparison based on data similarity metrics.
To better assess the contribution of each component within the enhanced U-Net architecture, we conducted an ablation study involving the following configurations: the U-Net, U-Net + CBAM, U-Net + ASPP, and the combined U-Net + ASPP + CBAM. The results were visualized for comparison (Figure 17). When applied individually, CBAM and ASPP modules show limited capability in accurately reconstructing seismic reflectors, particularly in recovering reflection events at far-offset locations. In contrast, the integrated enhanced U-Net architecture, incorporating both ASPP and CBAM, demonstrates significantly improved performance in restoring coherent reflection events, reconstructing accurate waveform morphology, and maintaining high spectral fidelity. These findings highlight the model’s superior ability to reconstruct structurally consistent subsurface features and enhance signal-to-noise discrimination in complex geological settings.
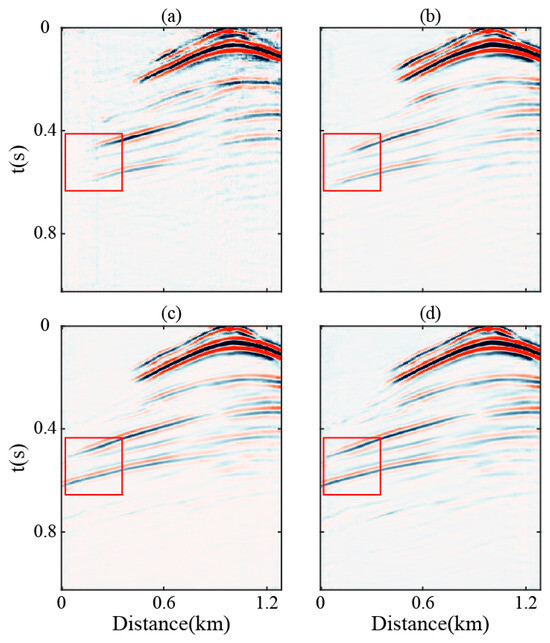
Figure 17.
Visualization results of seismic trace reconstruction for different network configurations. (a) Traditional U-Net; (b) U-Net + CBAM; (c) U-Net + ASPP; (d) U-Net + ASPP + CBAM (enhanced U-Net).
3.3. Overthrust Model Testing with Sparse Active Source Training
Previous studies primarily focused on intelligent passive-source reconstruction optimization methods constrained by active-source data. Due to practical challenges in acquiring sufficient active-source reference records during field acquisition, this study adopts a hybrid training strategy integrating synthetic seismic records with field data. However, the critical challenge lies in effectively utilizing sparse active-source information when only limited shot gathers are available. To address this, we investigate intelligent reconstruction optimization under reduced active-source reference data during training. For dataset construction, the active-source shot sampling interval was extended to 40 m, with initial survey line positions varied across 40 randomized overthrust model slices. Each model’s starting sampling position was sequentially offset from the previous one (Figure 18), while maintaining consistent velocity models and noise levels as illustrated in Figure 13.

Figure 18.
Blended acquisition geometry. Red star symbols denote sources, and black solid triangle symbols represent physical receivers. Black dashed triangle symbols indicate virtual receivers created through signal reconstruction.
The selected sparse active-source configuration is strategically designed to achieve full illumination of key geological structures (such as faults and overthrust structures) using a minimal number of shot points. This arrangement ensures that the training labels contain representative waveform information from both flanks of the model, providing adequate coverage of reflectors on the left and right sides. Despite the limited number of active sources, the configuration enables global illumination of the model domain, which is essential for enhancing the network’s ability to learn meaningful seismic attributes and improve generalization. During the training phase, the PVS data are consistent with the blended acquisition geometry. In the testing phase, only the available PVS data—without any active-source recordings—are used to reconstruct key seismic signals, including reflections and diffractions. This blended acquisition strategy supports accurate prediction of virtual shot gathers across the entire survey line with minimal active-source input, thus maximizing the fidelity of wavefield reconstruction and subsequent imaging quality under spatially constrained yet acquisition-consistent conditions.
Under sparse active-source constraints (75% reduction in training set coverage density), conventional U-Net exhibits severe waveform distortion in PVS data reconstruction. In contrast, the enhanced U-Net architecture, which incorporates feature fusion modules and attention mechanisms, demonstrates performance. This method not only effectively suppresses high-amplitude interference artifacts but also corrects distorted wavefields in distal regions (x = 0.92 km), restoring coherent seismic events to their true kinematic positions (Figure 19d). These results confirm that the enhanced U-Net maintains high-fidelity PVS reconstruction capabilities despite reduced active-source data dependency, achieving 40% faster convergence than conventional approaches and providing an efficient intelligent processing framework for passive seismic data. However, further reductions in active-source reference data or expanded shot sampling intervals (beyond 40 m) lead to substantial waveform distortions.
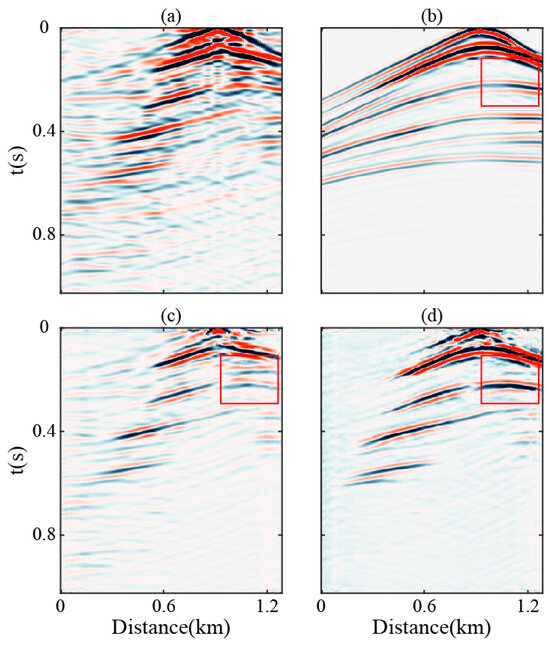
Figure 19.
Comparison of retrieval results with the virtual source located at x = 0.92 km. (a) Reconstructed records using the modified MDD; (b) active source seismic records; (c) prediction results from the conventional U-Net; (d) prediction results from the enhanced U-Net.
4. Discussion
This paper proposes an enhanced U-Net network method based on feature fusion to optimize the reconstruction of virtual shot gathers from passive seismic data. By incorporating multi-scale feature fusion modules and attention mechanisms, the method significantly improves the accuracy of PVS data reconstruction, particularly under conditions of non-uniform source distributions or data sparsity. Numerical experiments demonstrate that the enhanced U-Net outperforms conventional MDD and standard U-Net approaches in waveform recovery, noise suppression, and deep-layer signal preservation. Furthermore, RTM imaging tests confirm its capability to enhance imaging resolution and improve the characterization of fine geological structures.
Although the proposed method has achieved promising results in PVS data reconstruction and imaging optimization, several issues remain for further investigation. First, this study primarily relies on synthetic data for validation, and its generalization ability needs to be further tested on real observational data. Second, since data-driven deep learning methods are highly dependent on data quality, a major challenge in practical applications is how to improve the reconstruction quality of PVS data at virtual source locations that were not covered during training, especially under limited source coverage. Future research could explore neural network architectures incorporating physical priors, integrating data-driven approaches with physics-based modeling to enhance the reliability and interpretability of PVS data reconstruction.
5. Conclusions
To address the challenges of noise-contaminated passive seismic data interferometric reconstruction, this study proposes an intelligent optimization framework that integrates an enhanced U-Net with active-source data constraints to refine MDD reconstructed seismic records. By training the network under the constraints of active-source seismic records, our method achieves full-survey-line passive-data reconstruction while modifying MDD reconstruction fidelity and computational stability, effectively eliminating non-physical artifacts caused by PSF extraction errors. The validity of this approach was rigorously verified through RTM.
Although MDD partially mitigates the impact of non-ideal subsurface source distributions on reconstruction quality, its computational instability and PSF estimation inaccuracies persist. In contrast, the enhanced U-Net—empowered by feature fusion mechanisms and attention gates—generates virtual source reconstructions that exhibit superior alignment with active-source records, suppressing spurious coherent events and incoherent noise more effectively than conventional MDD or standard U-Net approaches. Crucially, cross-validation across diverse velocity models (e.g., simple fault systems and overthrust structures) demonstrates the network’s robust generalization capability, consistently restoring passive virtual source (PVS) records into high-fidelity seismic profiles with preserved kinematic and dynamic attributes.
Author Contributions
All authors made significant contributions to this paper. Data curation, W.H. and P.Z.; Funding acquisition, P.Z.; Methodology, W.H., P.Z. and D.Z.; Software, W.H. and D.Z.; Supervision, P.Z. and L.H.; Validation, P.Z. and B.Z.; Writing—original draft, W.H.; Writing—review and editing, P.Z. and B.Z. All authors have read and agreed to the published version of the manuscript.
Funding
This work was supported by the Deep Earth Probe and Mineral Resources Exploration-National Science and Technology Major Project, grant number 2024ZD1000100, the Fund from SinoProbe Laboratory, Chinese Academy of Geological Sciences, grant number SL202404, the National Natural Science Foundation of China, grant number 42374147 and 42130805, and the Natural Science Foundation of Jilin Province, grant number 20250101038JJ.
Data Availability Statement
The original contributions presented in the study are included in the article, further inquiries can be directed to the corresponding author.
Conflicts of Interest
The authors declare no conflicts of interest.
Abbreviations
The following abbreviations are used in this manuscript:
| PVS | passive virtual source |
| CC | crosscorrelation |
| MDD | multidimensional deconvolution |
Appendix A
Seismic interferometry reconstructs the Green’s function based on the assumption of bilateral focusing. The traditional crosscorrelation method reconstructs the Green’s function as:
where and represent the causal and acausal components of the subsurface Green’s function to be solved, which include both primary reflections and multiple reflections. and denote the velocity and density, respectively. represents the interface where the receivers are located, while and are two receivers deployed on the surface. denotes the time series, represents time reversal, and denotes the convolution operator. Equation (A1) derives the time delay between the two receivers through a correlation operation, thereby obtaining the subsurface reflection response.
References
- Tao, Y.; Fu, L.; Sun, W.; Sun, Q. A review of research progress in seismic wave interferometry. Prog. Geophys. 2010, 25, 1775–1784. (In Chinese) [Google Scholar]
- Shang, X.; Zhang, P.; Han, L.; Yang, Y.; Zhou, Y. Joint FWI of Active Source Data and Passive Virtual Source Data Reconstructed Using an Improved Multidimensional Deconvolution. IEEE Trans. Geosci. Remote Sens. 2023, 61, 1–14. [Google Scholar] [CrossRef]
- Wapenaar, K.; Fokkema, J. Green’s Function Representations for Seismic Interferometry. Geophysics 2006, 71, SI33–SI46. [Google Scholar] [CrossRef]
- Claerbout, J.F. Synthesis of a Layered Medium from Its Acoustic Transmission Response. Geophysics 1968, 33, 264–269. [Google Scholar] [CrossRef]
- Wapenaar, K.; Draganov, D.; Thorbecke, J.; Jacob, F. Theory of Acoustic Daylight Imaging Revisited. In Proceedings of the SEG International Exposition and Annual Meeting, Salt Lake City, UT, USA, 6–11 October 2002. [Google Scholar]
- Slob, E.; Wapenaar, K. Electromagnetic Green’s Functions Retrieval by Cross-correlation and Cross-convolution in Media with Losses. Geophys. Res. Lett. 2007, 34, 2006GL029097. [Google Scholar] [CrossRef]
- Curtis, A.; Gerstoft, P.; Sato, H.; Snieder, R.; Wapenaar, K. Seismic Interferometry—Turning Noise into Signal. Lead. Edge 2006, 25, 1082–1092. [Google Scholar] [CrossRef]
- Snieder, R.; Sheiman, J.; Calvert, R. Equivalence of the Virtual-Source Method and Wave-Field Deconvolution in Seismic Interferometry. Phys. Rev. E 2006, 73, 066620. [Google Scholar] [CrossRef]
- Prieto, G.A.; Lawrence, J.F.; Beroza, G.C. Anelastic Earth Structure from the Coherency of the Ambient Seismic Field. J. Geophys. Res. 2009, 114, 2008JB006067. [Google Scholar] [CrossRef]
- Chamarczuk, M.; Malinowski, M.; Draganov, D.; Koivisto, E.; Heinonen, S.; Rötsä, S. Reflection Imaging of Complex Geology in a Crystalline Environment Using Virtual-Source Seismology: Case Study from the Kylylahti Polymetallic Mine, Finland. Solid Earth 2022, 13, 705–723. [Google Scholar] [CrossRef]
- Ye, Y.; Yao, G.; Zhao, C.; Zhuang, X.; Zhang, H. Sea bottom peg-leg multiple suppression based on seismic interferometry. Oil Geophys. Prospect. 2015, 50, 225–231. (In Chinese) [Google Scholar]
- Cheraghi, S.; Craven, J.A.; Bellefleur, G. Feasibility of Virtual Source Reflection Seismology Using Interferometry for Mineral Exploration: A Test Study in the Lalor Lake Volcanogenic Massive Sulphide Mining Area, Manitoba, Canada. Geophys. Prospect. 2015, 63, 833–848. [Google Scholar] [CrossRef]
- Boullenger, B.; Verdel, A.; Paap, B.; Thorbecke, J.; Draganov, D. Studying CO2 Storage with Ambient-Noise Seismic Interferometry: A Combined Numerical Feasibility Study and Field-Data Example for Ketzin, Germany. Geophysics 2015, 80, Q1–Q13. [Google Scholar] [CrossRef]
- Draganov, D.; Campman, X.; Thorbecke, J.; Verdel, A.; Wapenaar, K. Reflection Images from Ambient Seismic Noise. Geophysics 2009, 74, A63–A67. [Google Scholar] [CrossRef]
- Draganov, D.; Campman, X.; Thorbecke, J.; Verdel, A.; Wapenaar, K. Seismic Exploration-scale Velocities and Structure from Ambient Seismic Noise (>1 Hz). J. Geophys. Res. Solid Earth 2013, 118, 4345–4360. [Google Scholar] [CrossRef]
- Gu, N.; Chamarczuk, M.; Gao, J.; Malinowski, M.; Zhang, H. Passive Seismic Structure Imaging of a Coal Mine by Ambient Noise Seismic Interferometry on a Dense Array. Acta Geol. Sin.-Engl. Ed. 2021, 95, 37–39. [Google Scholar] [CrossRef]
- Ramírez, A.C.; Weglein, A.B. Green’s Theorem as a Comprehensive Framework for Data Reconstruction, Regularization, Wavefield Separation, Seismic Interferometry, and Wavelet Estimation: A Tutorial. Geophysics 2009, 74, W35–W62. [Google Scholar] [CrossRef]
- Wapenaar, K.; Van Der Neut, J.; Ruigrok, E. Passive Seismic Interferometry by Multidimensional Deconvolution. Geophysics 2008, 73, A51–A56. [Google Scholar] [CrossRef][Green Version]
- Bellezza, C.; Poletto, F. Multidimensional Deconvolution and Processing of Seismic-Interferometry Arctic Data. Geophysics 2014, 79, WA25–WA38. [Google Scholar] [CrossRef]
- Van Dalen, K.N.; Wapenaar, K.; Halliday, D.F. Surface Wave Retrieval in Layered Media Using Seismic Interferometry by Multidimensional Deconvolution. Geophys. J. Int. 2014, 196, 230–242. [Google Scholar] [CrossRef][Green Version]
- Shirmohammadi, F.; Draganov, D.; Hatami, M.R.; Weemstra, C. Application of Seismic Interferometry by Multidimensional Deconvolution to Earthquake Data Recorded in Malargüe, Argentina. Remote Sens. 2021, 13, 4818. [Google Scholar] [CrossRef]
- Wapenaar, K.; Van Der Neut, J.; Ruigrok, E.; Draganov, D.; Hunziker, J.; Slob, E.; Thorbecke, J.; Snieder, R. Seismic Interferometry by Crosscorrelation and by Multidimensional Deconvolution: A Systematic Comparison: Seismic Interferometry. Geophys. J. Int. 2011, 185, 1335–1364. [Google Scholar] [CrossRef]
- Luiken, N.; Van Leeuwen, T. Seismic Wavefield Redatuming with Regularized Multi-Dimensional Deconvolution. Inverse Probl. 2020, 36, 095010. [Google Scholar] [CrossRef]
- Ravasi, M.; Selvan, T.; Luiken, N. Stochastic Multi-Dimensional Deconvolution. IEEE Trans. Geosci. Remote Sens. 2022, 60, 1–14. [Google Scholar] [CrossRef]
- Vargas, D.; Vasconcelos, I.; Ravasi, M.; Luiken, N. Time-Domain Multidimensional Deconvolution: A Physically Reliable and Stable Preconditioned Implementation. Remote Sens. 2021, 13, 3683. [Google Scholar] [CrossRef]
- Lee, Y. Handwritten Digit Recognition Using K Nearest-Neighbor, Radial-Basis Function, and Backpropagation Neural Networks. Neural Comput. 1991, 3, 440–449. [Google Scholar] [CrossRef]
- He, K.; Zhang, X.; Ren, S.; Sun, J. Deep Residual Learning for Image Recognition. In Proceedings of the 2016 IEEE Conference on Computer Vision and Pattern Recognition (CVPR), Las Vegas, NV, USA, 27–30 June 2016; IEEE: Piscataway, NJ, USA, 2016; pp. 770–778. [Google Scholar]
- Zhang, K.; Zuo, W.; Chen, Y.; Meng, D.; Zhang, L. Beyond a Gaussian Denoiser: Residual Learning of Deep CNN for Image Denoising. IEEE Trans. Image Process. 2017, 26, 3142–3155. [Google Scholar] [CrossRef]
- Ronneberger, O.; Fischer, P.; Brox, T. U-Net: Convolutional Networks for Biomedical Image Segmentation. In Medical Image Computing and Computer-Assisted Intervention—MICCAI 2015: 18th International Conference, Munich, Germany, 5–9 October 2015, Proceedings, Part III; Navab, N., Hornegger, J., Wells, W.M., Frangi, A.F., Eds.; Lecture Notes in Computer Science; Springer International Publishing: Cham, Switzerland, 2015; Volume 9351, pp. 234–241. ISBN 978-3-319-24573-7. [Google Scholar]
- Wang, Q.; Yan, W.; Yuan, Y.; Tang, H.; Ding, L. Study of a Deep Learning Reconstruction Algorithm for Displaying Small- and Medium-Sized Blood Vessels in Upper Abdominal Energy Spectrum CT. CT Theory Appl. 2025, 34, 37–43. (In Chinese) [Google Scholar] [CrossRef]
- Cao, J.; Gao, K.; Xu, Y.; Wang, N.; Zhang, C.; Zhu, Y. Seismic data de-noising method based on an attention mechanism U-Net. Oil Geophys. Prospect. 2024, 59, 724–735. (In Chinese) [Google Scholar] [CrossRef]
- Yang, W.; Chen, X.; Rao, Y. Seismic Random Noise Attenuation Using DnCNN with Stratigraphic Dip Constraint. J. Geophys. Eng. 2023, 20, 1172–1179. [Google Scholar] [CrossRef]
- Na, D.; Lee, D.; Kim, Y.S.; Chung, W. Low-Frequency Reconstruction of Seismic Data Using Stacked-BiLSTM Networks. J. Geophys. Eng. 2025, 22, 238–249. [Google Scholar] [CrossRef]
- Zhang, Z.; Chen, R.; Ma, J. Improving Seismic Fault Recognition with Self-Supervised Pre-Training: A Study of 3D Transformer Based with Multi-Scale Decoding and Fusion. Remote Sens. 2024, 16, 922. [Google Scholar] [CrossRef]
- Li, Q.; Wang, X.; Zhang, Y.; Wen, X.; Chen, Y. Fault recognition method and application based on 3D U-Net++ convolution neural network. Comput. Tech. Geophys. Geochem. Explor. 2024, 46, 1001–1749. (In Chinese) [Google Scholar]
- Tao, L.; Ren, H.; Gu, Z. Acoustic Impedance Inversion from Seismic Imaging Profiles Using Self Attention U-Net. Remote Sens. 2023, 15, 891. [Google Scholar] [CrossRef]
- Richardson, A. Seismic Full-Waveform Inversion Using Deep Learning Tools and Techniques. arXiv 2018, arXiv:1801.07232. [Google Scholar]
- Sun, H.; Demanet, L. Seismic Interferometry with Neural Networks. In Proceedings of the First International Meeting for Applied Geoscience & Energy Expanded Abstracts; Society of Exploration Geophysicists, Denver, CO, USA, 1 September 2021; pp. 1384–1389. [Google Scholar]
- Sun, H.; Demanet, L. Beyond Correlations: Deep Learning for Seismic Interferometry. IEEE Trans. Neural Netw. Learn. Syst. 2023, 34, 3385–3396. [Google Scholar] [CrossRef]
- Zhao, B.; Han, L.; Zhang, P.; Feng, Q.; Ma, L. Randomly Distributed Passive Seismic Source Reconstruction Record Waveform Rectification Based on Deep Learning. Appl. Sci. 2024, 14, 2206. [Google Scholar] [CrossRef]
- Zhang, P.; Han, L.; Liu, Q.; Zhang, Y.; Chen, X. Interpolation of Active and Passive Source Seismic Data and Joint Data Imaging. Chin. J. Geophys. 2015, 58, 1754–1766. (In Chinese) [Google Scholar]
- Chen, L.-C.; Papandreou, G.; Kokkinos, I.; Murphy, K.; Yuille, A.L. DeepLab: Semantic Image Segmentation with Deep Convolutional Nets, Atrous Convolution, and Fully Connected CRFs. IEEE Trans. Pattern Anal. Mach. Intell. 2018, 40, 834–848. [Google Scholar] [CrossRef]
- Oktay, O.; Schlemper, J.; Folgoc, L.L.; Lee, M.; Heinrich, M.; Misawa, K.; Mori, K.; McDonagh, S.; Hammerla, N.Y.; Kainz, B.; et al. Attention U-Net: Learning Where to Look for the Pancreas. arXiv 2018, arXiv:1804.03999. [Google Scholar]
- Woo, S.; Park, J.; Lee, J.-Y.; Kweon, I.S. CBAM: Convolutional Block Attention Module. In Computer Vision—ECCV 2018: 15th European Conference, Munich, Germany, 8–14 September 2018, Proceedings, Part VII; Ferrari, V., Hebert, M., Sminchisescu, C., Weiss, Y., Eds.; Lecture Notes in Computer Science; Springer International Publishing: Cham, Switzerland, 2018; Volume 11211, pp. 3–19. ISBN 978-3-030-01233-5. [Google Scholar]
- Minato, S.; Matsuoka, T.; Tsuji, T.; Draganov, D.; Hunziker, J.; Wapenaar, K. Application of Seismic Interferometry by Multidimensional Deconvolution to Crosswell Seismic Reflection Using Singular-value Decomposition. In SEG Technical Program Expanded Abstracts 2009; Society of Exploration Geophysicists: Houston, TX, USA, 2009; pp. 1688–1692. [Google Scholar]
Disclaimer/Publisher’s Note: The statements, opinions and data contained in all publications are solely those of the individual author(s) and contributor(s) and not of MDPI and/or the editor(s). MDPI and/or the editor(s) disclaim responsibility for any injury to people or property resulting from any ideas, methods, instructions or products referred to in the content. |
© 2025 by the authors. Licensee MDPI, Basel, Switzerland. This article is an open access article distributed under the terms and conditions of the Creative Commons Attribution (CC BY) license (https://creativecommons.org/licenses/by/4.0/).