Article

A Novel Approach to Generate Large-Scale InSAR-Derived Velocity Fields: Enhanced Mosaicking of Overlapping InSAR Data

1
School of Surveying and Geoinformation Engineering, East China University of Technology, Nanchang 330013, China
2
National Institute of Natural Hazards, Ministry of Emergency Management of China, Beijing 100085, China
3
State Key Laboratory of Precision Geodesy, Innovation Academy for Precision Measurement Science and Technology, Chinese Academy of Sciences, Wuhan 430077, China
4
College of Resources and Environmental Science and Engineering, Hubei University of Science and Technology, Xianning 437100, China
5
Jiangxi Key Laboratory of Watershed Ecological Process and Information, East China University of Technology, Nanchang 330013, China
6
Key Laboratory of Mine Environmental Monitoring and Improving Around Poyang Lake of Ministry of Natural Resources, East China University of Technology, Nanchang 330013, China
*
Author to whom correspondence should be addressed.
Remote Sens. 2025, 17(11), 1804; https://doi.org/10.3390/rs17111804
Submission received: 13 March 2025 / Revised: 18 May 2025 / Accepted: 20 May 2025 / Published: 22 May 2025

Abstract

:
Large-scale deformation fields are crucial for monitoring seismic activity, landslides, and other geological hazards. Traditionally, the acquisition of large-area, three-dimensional deformation fields has relied on GNSS data; however, the inherent sparsity of these data poses significant limitations. The emergence of Interferometric Synthetic Aperture Radar (InSAR) data offers an alternative, enabling the retrieval of large-area, high-resolution deformation velocity fields. Nonetheless, the processing of InSAR data is often complex, time-consuming, and requires substantial storage capacity. To address these challenges, various research institutions have developed online InSAR processing platforms. For instance, the LiCSAR processing platform provides interferometric images covering approximately 250 km × 250 km, facilitating scientific applications of InSAR data. However, the transition from individual interferograms to large-scale, three-dimensional deformation fields often requires additional processing steps, including ramp correction within the images, mosaicking between adjacent images, and the joint inversion of InSAR observations from different viewing angles. In this paper, we propose a novel method for splicing several individual InSAR velocity fields into continent-scale InSAR velocity maps, which takes along-track and cross-track mosaicking into consideration. This method integrates GNSS data with InSAR data and also considers the additional constraint of data overlap region. The efficacy of this methodology is substantiated through its implementation in InSAR observations of the eastern Tibetan Plateau. In some tracks, there are overlapping areas on the east and west sides, and the line-of-sight (LOS) value can be effectively corrected by using these overlapping areas with similar size for two cross-track mosaics. The root mean square error (RMSE) of these tracks was reduced by about 4% to 8% on average when verified using true values of GNSS data compared to no cross-track mosaic. In addition, a significant improvement of 30% in RMSE reduction was achieved for some tracks.

1. Introduction

In recent decades, Interferometric Synthetic Aperture Radar (InSAR) has become a valuable technology for monitoring crustal deformation across continents [1,2,3,4,5]. This radar technique enables the measurement of ground movement with millimeter-level precision [6] and offers spatial resolutions in the tens of meters [7]. Consequently, InSAR provides continuous observations over large areas, making it an essential tool for regional tectonic studies [8,9,10].
Surface deformation serves as a fundamental indicator of various geological hazards, including their initiation and evolution. By analyzing surface deformation data, strain rates can be calculated, which are then used to estimate surface deformation events. An efficient approach involves analyzing three-dimensional (3D) surface deformations. Precise geodetic estimations of ground-surface velocities and strain rates are crucial for understanding localized seismic hazards and the distribution and mechanics of deformation across the ground [11,12,13].
In automated processing of extensive, high-resolution InSAR data, two primary methodologies are widely adopted. The first approach, akin to that proposed by Thollard [14], involves processing InSAR data along a long track and then combining these images. To enhance visual continuity across segments, a constant velocity was added to each image, covering the study area—this process demands substantial high-performance computing power.
Conversely, the second approach partitions the study area into smaller blocks for batch processing. This process begins by processing individual observational frames to generate corresponding products. These products are then aggregated to provide comprehensive coverage of the study area. A joint analysis of these multi-frame outputs then yields the final results. As a quintessential example of this methodology, the LiCSAR project enables users to efficiently select frames corresponding to the designated study areas [15]. This approach is designed to manage large-scale InSAR data within the constraints of computational resources, memory, and storage. However, this approach presents a significant challenge: when multiple images are used to cover the study area, overlapping regions inevitably occur between frames. Resolving these overlaps while ensuring image coherence is particularly difficult. These overlaps often result in substantial mismatches during mosaicking of line-of-sight (LOS) velocity frames, as reported by [16]. InSAR data covering urban areas across Japan were processed by [17]; multiple ascending and descending LOS velocity frames were utilized to derive surface deformation information in urban settings. InSAR data from the eastern Tibetan Plateau were analyzed by [18], with Global Navigation Satellite System (GNSS) data incorporated as constraints for mosaicking along-track LOS velocity frames and performing 3D surface deformation inversion, ultimately leading to the derivation of a strain rate map for the entire study area. InSAR images of the Altyn Tagh Fault were processed by [19] to obtain velocity field data; GNSS and sampled InSAR velocities were jointly inverted during the mosaicking of cross-track LOS velocity frames, resulting in the estimation of the 3D surface deformation field. Conventional InSAR mosaicking methods [18,19,20,21] depend on simplistic assumptions of satellite azimuth and incidence angle continuity, often compromising geometric specificity through spatial smoothing. Our approach advances the field in two critical ways. First, we retain the full LOS geometric fidelity of individual acquisition geometries, ensuring the structural integrity of strain tensor data across overlapping swaths. Second, our multi-source fusion framework addresses the sparse GNSS constraint limitation inherent to traditional velocity mosaicking—where deformation modeling relies primarily on discrete GNSS measurements—by incorporating an interpolated GNSS-derived deformation surface as a continuous boundary condition. These innovations enable geometry-aware data fusion: LOS-centric mosaicking preserves directional deformation components typically attenuated by azimuthal averaging, while GNSS surface interpolation establishes spatially continuous geodetic constraints that improve model reliability in areas with sparse GNSS coverage. Consequently, our method resolves the inherent compromise between geometric specificity and physical consistency plaguing conventional techniques, offering a framework for deformation analysis that is both geometrically precise and physically robust.
Building on prior methodologies, we implemented the along-track mosaicking technique developed by [18,21], integrating GNSS station data from overlapping regions and projecting them onto the LOS direction to minimize interframe discrepancies. For cross-track mosaicking, we enhanced conventional methods by methodically incorporating all available GNSS data across the study area. Notably, we employed Kriging interpolation to construct the 3D deformation field in overlapping regions due to its dual strengths: (1) explicit modeling of spatial autocorrelation via variogram analysis, preserving localized deformation trends [22], and (2) superior validation performance, reducing interpolation errors by approximately 5% compared to Inverse Distance Weighting (IDW) (Table S3). The interpolated field was then projected onto LOS directions to resolve cross-track discrepancies [23].
Kriging is prioritized over alternative methods for its geostatistical rigor in addressing spatially correlated deformation signals—essential for tectonic or subsidence studies where deformation gradients exhibit directional dependencies. Although Kriging’s Gaussian process assumptions may suppress high-frequency deformation signals in data-sparse areas, our workflow mitigated this limitation through GNSS station density optimization and post-interpolation residual analysis. Empirical validation confirmed that Kriging’s ability to quantify interpolation uncertainty offers a quality control mechanism absent in deterministic approaches like IDW.
Our framework minimizes mosaicking errors bidirectionally by integrating along-track GNSS anchoring with cross-track Kriging-optimized fusion, enhancing the accuracy of 3D deformation rate estimations and strain field refinement. This study advances large-scale InSAR velocity mosaicking by resolving the trade-off between spatial continuity (achieved via Kriging’s stochastic interpolation) and geometric specificity (maintained through LOS-constrained fusion), establishing an error-aware standard for InSAR–GNSS integration.

2. Methodology

When visualizing the LOS deformation velocity field data from the same track type on a single map, discontinuities are observed in the overlapping regions between adjacent frames, resulting in non-smooth transitions. This indicates the presence of errors within the individual frames, rendering the direct inversion of the 3D deformation field unsuitable. Consequently, it is essential to correct the LOS deformation velocity field frames by leveraging the information from overlapping regions, followed by the mosaicking process, before performing the inversion. This methodological refinement ensures the accurate reconstruction of large-scale 3D deformation fields.
During the frame mosaicking process, we need to minimize the constant offsets between frames caused by local reference effects and the track’s overlap offsets induced by changes in the incidence angle [24]. At the same time, we must limit the errors introduced by the interferogram processing. Therefore, for an individual frame, we simplify the observation equation for the LOS values as follows:
V ~ L O S = V L O S + N + S
Here, V ~ L O S represents the processed LOS deformation velocity data obtained from the observed data, while V L O S denotes the true value data without errors. N represents the random errors introduced during the processing of the LOS deformation in a single frame within the same track, and S refers to the inherent errors associated with the track.
Due to the inconsistency of local references between frames, there must be a ramp between two adjacent frames [25]. The frame mosaicking process involves eliminating this ramp. Therefore, for two adjacent frames, the difference between their observation equations in the overlapping region can be described as:
V ~ L O S 1 V ~ L O S 2 = V L O S 1 V L O S 2 + N 1 N 2 + S 1 S 2
w h e r e   N 1 N 2 represents the errors introduced during the processing of LOS deformation, including the constant offsets between frames caused by local reference differences and errors arising from interferogram processing, and S 1 S 2 denotes the long-wavelength errors between tracks, specifically the tracks’ overlap offsets induced by changes in the incidence angle.
We divided the frame mosaicking process into two steps: first, mosaicking along the track, and then mosaicking across tracks. For mosaicking along a track, V L O S 1 and V L O S 2 should be equal after correcting for local references, and S 1 and S 2 are also equal since they are on the same track. Therefore, the above equation can be simplified as:
V ~ L O S 1 V ~ L O S 2 = Δ N
Here, Δ N = N 1 N 2 . By calculating the difference between each pixel in the overlapping region, we can determine this ramp. However, there are still some limitations; specifically, the reference frame of the LOS images inherently contains errors. As a result, even after eliminating the ramp, there may still be offsets. Therefore, we introduced GNSS observations to correct these offsets. When GNSS observations were available in the overlapping region, we projected the GNSS data onto the LOS direction using the following equation:
V L O S G N S S = sin θ cos α , sin θ sin α , cos θ V G N S S E , V G N S S N , V G N S S U T
Here, V L O S G N S S represents the GNSS data projected onto the LOS direction; α and θ correspond to the satellite azimuth and incidence angle of the InSAR image at the geographic location of the GNSS data, respectively. V G N S S E , V G N S S N , and V G N S S U represent the 3D deformation velocities measured by GNSS in the east, north, and up directions, respectively.
By projecting the GNSS data, we can obtain a fixed reference plane, which allows the two frames to be aligned with this reference plane. As is well known, GNSS data are sparse. For overlapping regions without GNSS data, an effective approach is to smoothly approximate the average plane between the two frames. Simple methods for this process are provided in [26], such as using polynomial fitting to define a plane or applying a convolution function to create a smooth transition region. These mathematical algorithms for image processing result in a visually pleasing mosaicking of the frames, but they also introduce non-negligible errors. We applied an improved algorithm based on [18,21] for mosaicking frames along the track. This approach considers the uncertainty σ V L O S G N S S of the GNSS data projected onto the LOS direction and is determined by the following equation:
σ 2 V L O S G N S S = s i n 2 θ c o s 2 α s i n 2 θ c o s 2 θ c o s 2 θ σ 2 V G N S S E σ 2 V G N S S N σ 2 V G N S S U
Here, σ V G N S S E ,   σ V G N S S N , and σ V G N S S U represent the uncertainties in the eastward, northward, and vertical deformation velocity data, respectively, obtained from GNSS measurements.
If we do not project the GNSS data onto the LOS direction and instead consider the GNSS-observed 3D deformation as the true surface deformation, the ramp between the two frames can be calculated using the following equation:
V L O S m V L O S n V G N S S E V G N S S N V G N S S U = s i n θ m c o s α m s i n θ m s i n α m c o s θ m x i y i 1 0 0 0 s i n θ n c o s α n s i n θ n s i n α n c o s θ n 0 0 0 x i y i 1 1 0 0 0 0 0 0 0 0 0 1 0 0 0 0 0 0 0 0 0 1 0 0 0 0 0 0 V E V N V U a m b m c m a n b n c n
Here, V L O S m represents the LOS deformation velocity value for a given pixel in the overlapping region of one frame, while V L O S n represents the LOS deformation velocity value for the corresponding pixel in the other frame. The α m , α n , θ m , and θ n correspond to the satellite azimuth and incidence angles of the respective InSAR images. V E , V N , and V U represent the eastward, northward, and vertical surface deformation velocities. T h e   x i and y i are the coordinates of the i-th points; a, b, and c are the model factors used to determine the linear plane for each track.
Since the true 3D surface deformation is an unknown parameter that cannot be directly obtained, and the GNSS measurement data also contain random errors, we can eliminate the related parameters by taking the difference between the two frames. Since the azimuth and incidence angles are the same at the same location, the following equation can be used to solve for the ramp:
V L O S m V L O S n V L O S m V L O S G N S S V L O S n V L O S G N S S = x i y i 1 x i y i 1 x i y i 1 0 0 0 0 0 0 x i y i 1 a m b m c m a n b n c n
For cross-track mosaicking, the difference between the two types of observations in the overlapping region of two adjacent frames can be described as:
V ~ L O S 1 V ~ L O S 2 = Δ N + Δ S
Here, Δ S = S 1 S 2 . Due to the long-wavelength errors between tracks and the tracks’ overlap offsets caused by changes in the incidence angle, V ~ L O S 1 V ~ L O S 2 cannot directly yield a fixed ramp [27]. Consequently, by interpolating three planes utilizing GNSS data and subsequently projecting them into two tracks’ directions, we can obtain two sets of track data projected by distinct GNSS systems. By subtracting these two datasets, we can derive the value of Δ S . Hence, Equation (7) can be reformulated as follows:
V L O S m V L O S n V L O S m V L O S m G N S S V L O S n V L O S n G N S S = x i y i 1 x i y i 1 x i y i 1 0 0 0 0 0 0 x i y i 1 a m b m c m a n b n C n + R
where R = V L O S m G N S S V L O S n G N S S 0 0 , V L O S m G N S S represents the projection of GNSS data onto the m track, and V L O S n G N S S represents the projection of GNSS data onto the n track.
The GNSS reference calibration is the solution of the weighted least squares parity, which is given by the following equation:
min i = 1 n V LOS i a x i + b y i + c + V LOS - GNSS i 2 σ i 2 ( V LOS - GNSS )
where V LOS i represents the LOS velocity value at the i-th point in the overlapping area; V LOS - GNSS i denotes the velocity value of the GNSS projection onto the LOS direction at the i-th point; σ i 2 ( V LOS - GNSS ) represents the measurement uncertainty of the GNSS projection onto the LOS direction at the i-th point. For the i-th point, x i and y i are its coordinates, while a, b, and c are the fitted model factors used to determine the linear plane for each mosaicking frame.
Dealing with overlapping pixels on multiple trajectories is represented by the following equation:
V ^ L O S ( x , y ) = k = 1 K w k [ V L O S ( k ) + δ V L O S ( k ) ] k = 1 K w k
where δ V L O S k represents the track-specific offset value, which is calculated from the interpolated data and the velocity field of LOS.
The weights are determined by
w k = 1 σ GNSS 2 + σ InSAR k 2
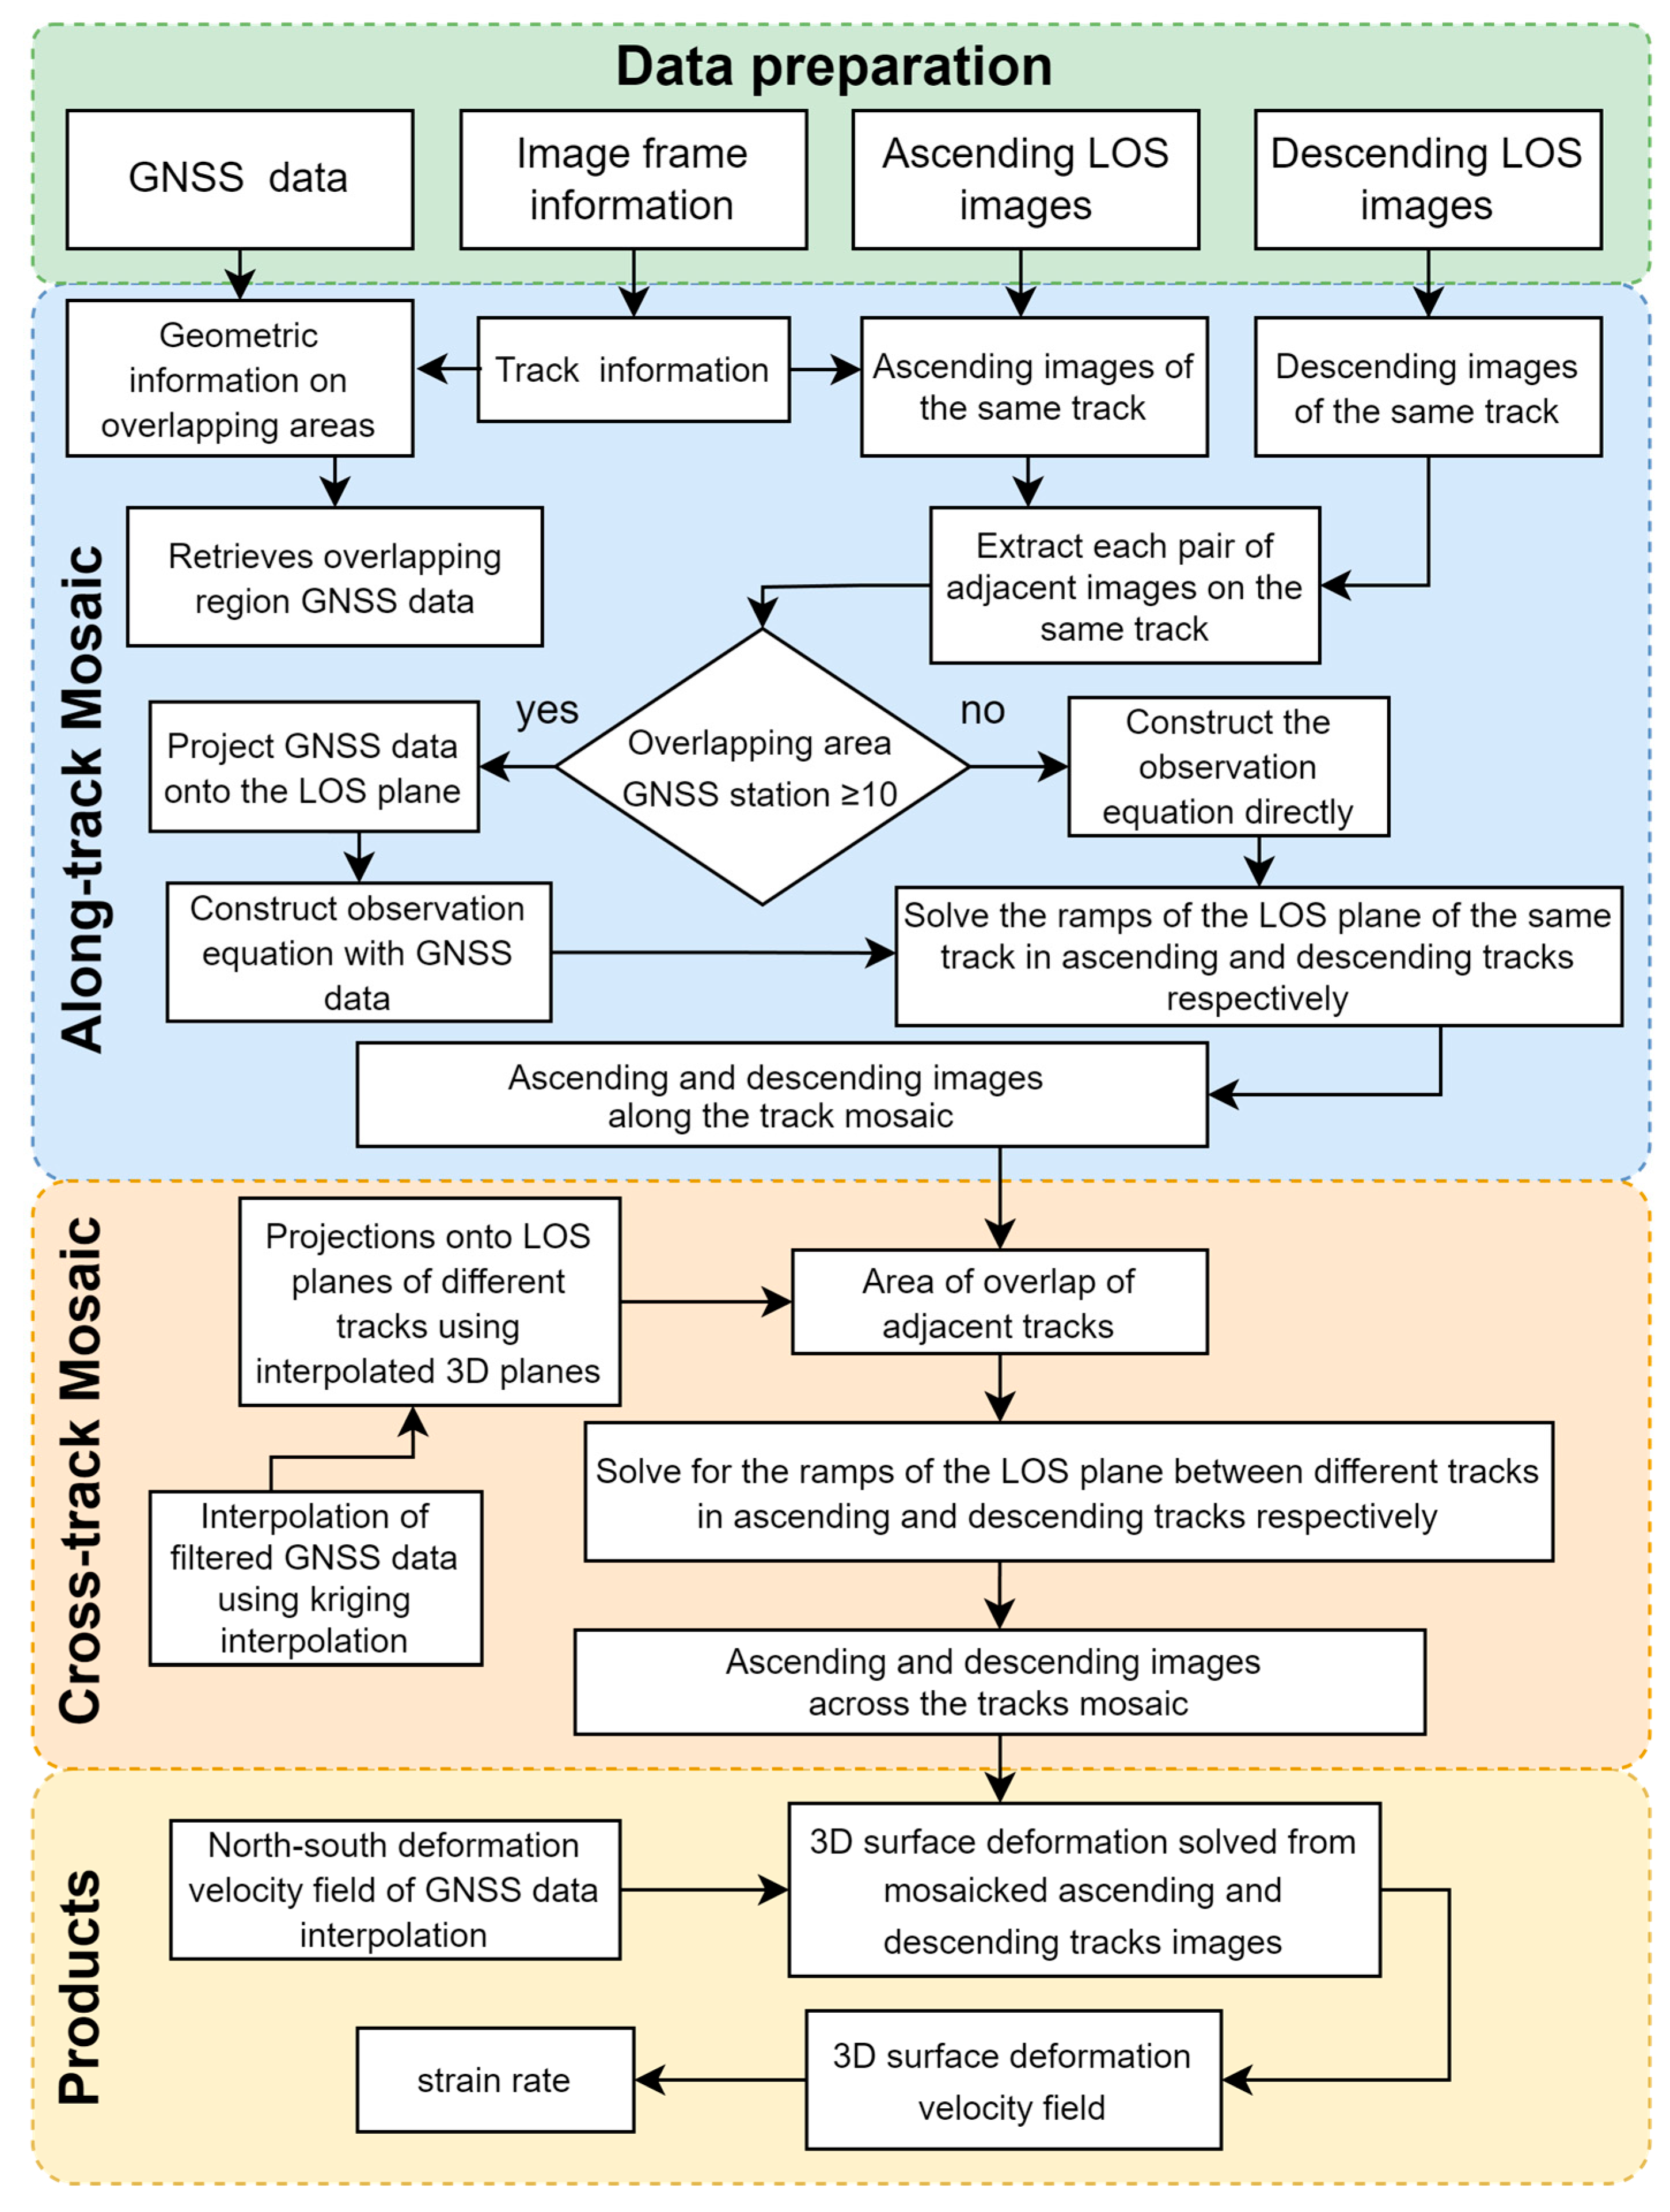
The processing procedure is structured in two stages. First, along-track processing involves aligning the LOS velocity field to the GNSS reference frame using GNSS station data within the frame. Subsequently, the along-track frames are iteratively adjusted by enforcing consistency in overlapping region values for the same track. Second, cross-track processing addresses discrepancies in cross-track overlapping regions. Here, track information is corrected using interpolated GNSS data, followed by a secondary refinement of the LOS velocity field through the integration of relative displacement fields between adjacent tracks. Finally, the overall experimental process of this study is shown in Figure 1.

3. Validation Tests of the Methods in This Paper

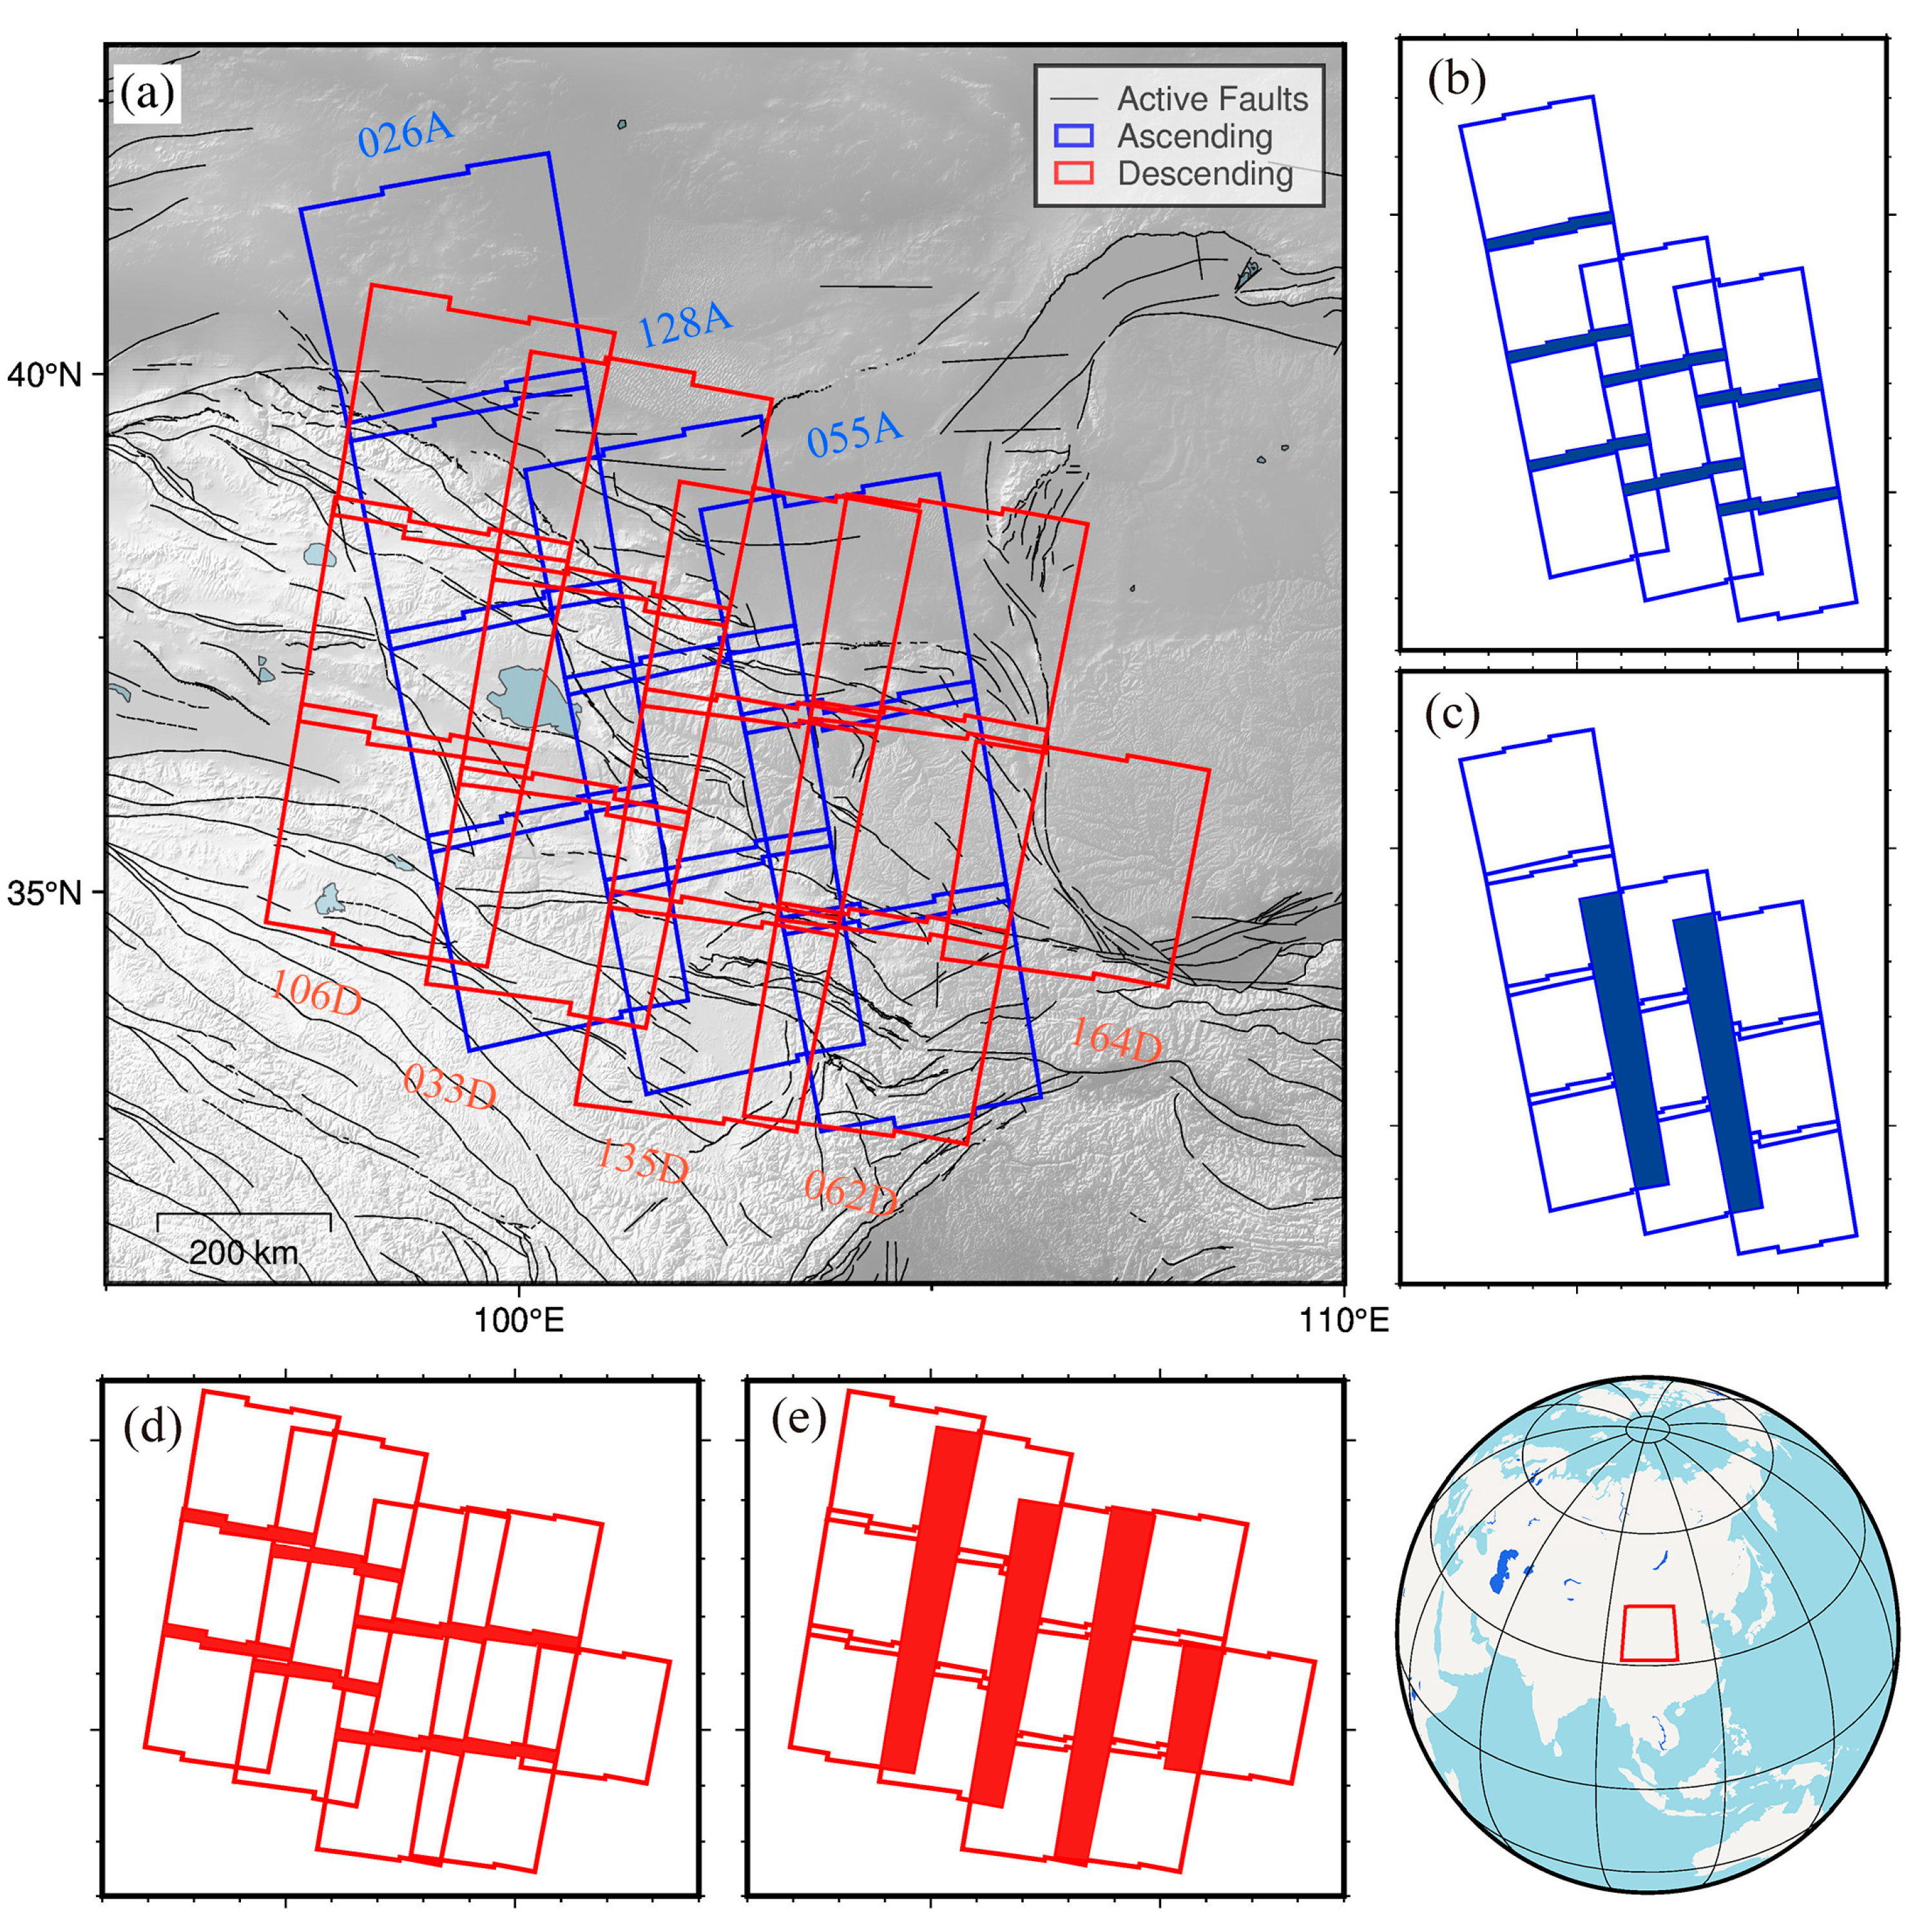
We utilized the preliminary processed LOS deformation velocity field from [18], derived from 23 Sentinel-1 images collected across 9 ascending tracks and 10 descending tracks. Overlaps existed between adjacent frames along a track and among multiple frames of adjacent tracks. As illustrated in Figure 2b,c represent the frames corresponding to ascending tracks, with the blue blocks indicating the overlapping regions of along-track and cross-track data, respectively. Figure 2d,e correspond to frames from descending tracks, with the red blocks representing the overlapping areas of along-track and cross-track data, respectively.
This study focused on the mosaicking of large-scale LOS deformation velocity fields, structured into two distinct phases: along-track mosaicking and cross-track mosaicking. For the along-track mosaicking, we initially applied the methodology outlined in [18] to preprocess 23 LOS velocity fields, each covering an area of 250 km × 250 km. Subsequently, we determined the corresponding uncertainty and azimuth data and extracted the 3D GNSS deformation velocity information from [28,29]. Finally, using the collected data, we implemented the along-track mosaicking model to integrate the LOS velocity fields from each track, thereby generating the mosaicked along-track LOS deformation velocity field.
During the along-track processing phase, the LOS velocity field was calibrated to the Eurasian GNSS reference frame using GNSS station data from overlapping regions. This calibration employs satellite incidence angles and azimuths to project GNSS-derived deformation velocities onto the LOS direction. Adjacent LOS velocity frames were then iteratively refined via planar alignment, ensuring spatial consistency with the fixed GNSS reference frame and removing planar ramp distortions. For overlapping regions, pixel-wise difference analysis between corresponding pixels in paired LOS velocity fields identified discrepancies. The average difference was applied as a ramp correction, guided by the theoretical principle of spatial coherence for velocity fields along the same track.
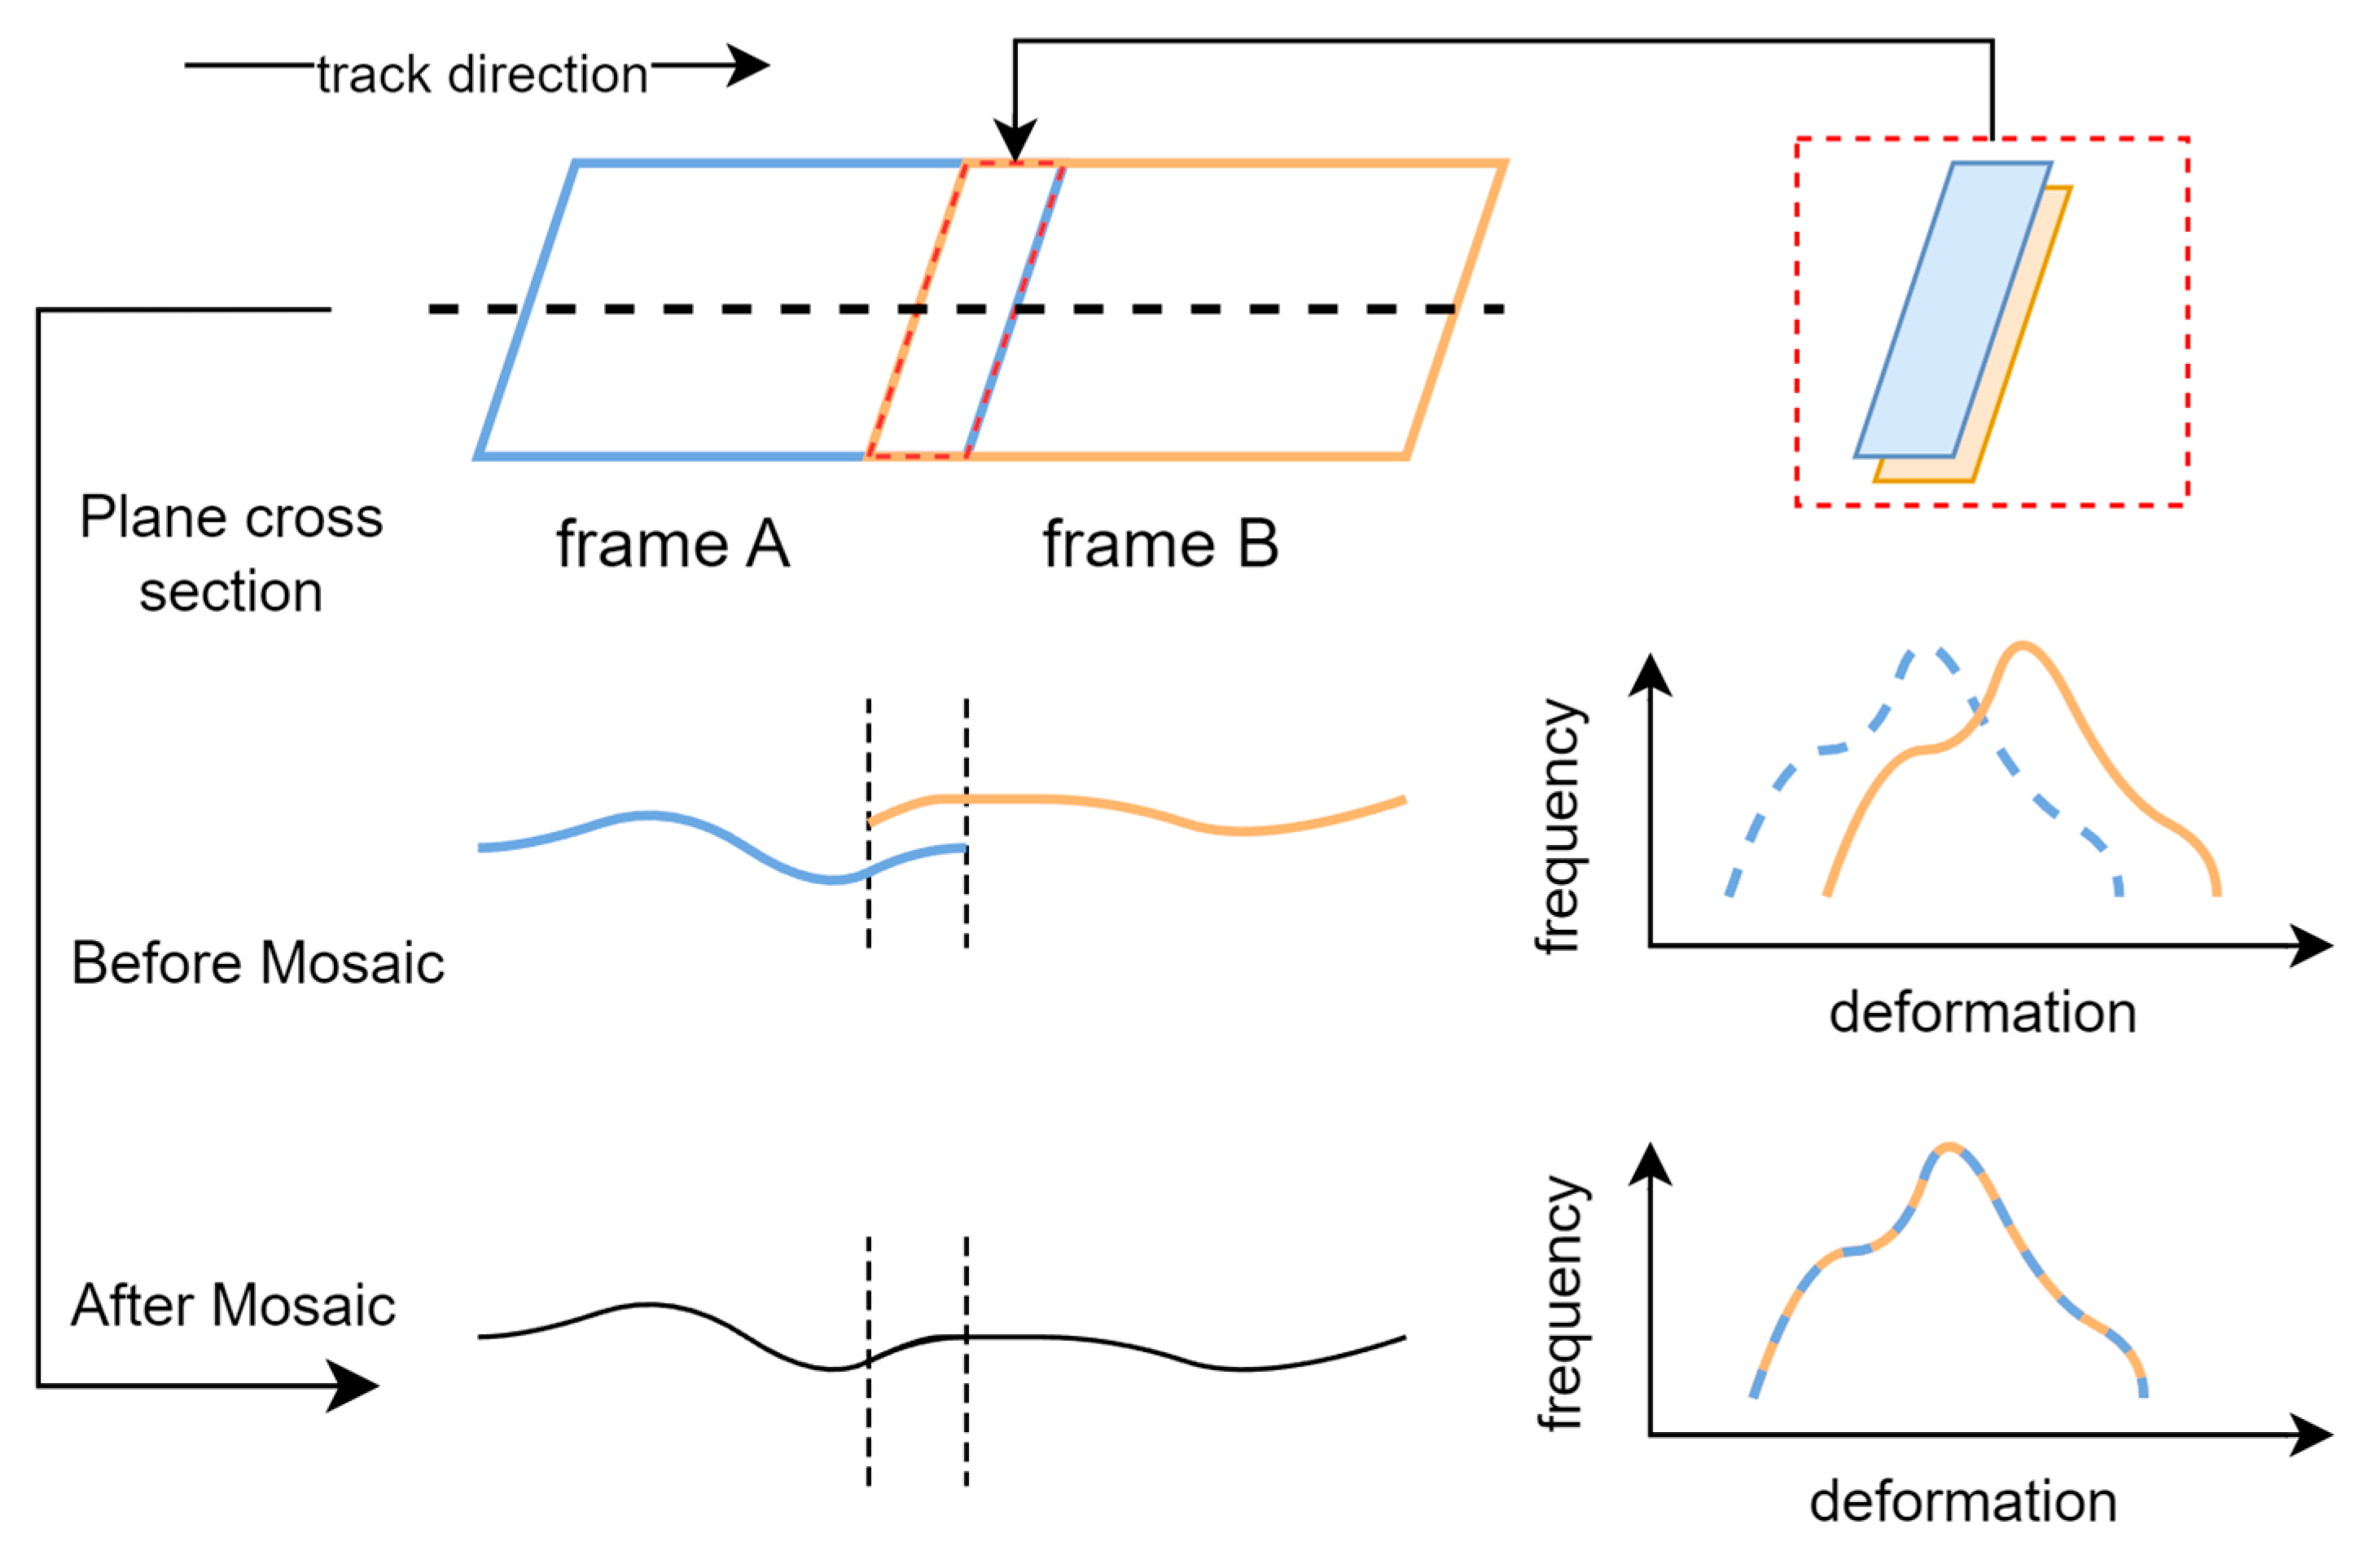
During the mosaicking process along the track, the deformation values of the overlapping areas of two adjacent frames changed from different deformation values to equal values. In Figure 3, the detailed outcome of the mosaicking operation along the track is presented.
The subsequent step involved employing the Kriging interpolation method to process the GNSS east–west and north–south deformation velocity data, considering only data points with an uncertainty below 0.7 mm/year. Initially, we conducted interpolation on both the east–west and north–south deformation fields at a reduced resolution across the study area. Following this, we applied a nearest-neighbor interpolation method to resample these deformation fields, ensuring they align with the resolution of the imagery. Given the limited availability of GNSS measurements in the vertical direction, we did not impose a threshold, thereby allowing all vertical deformation data to contribute to the Kriging computation. The resulting vertical deformation velocity field was also resampled to achieve consistency in resolution.
In the third step, we integrated the LOS deformation rate data from the long tracks, together with the incidence angle and azimuth data, as well as the interpolated east–west, north–south, and vertical deformation velocity fields derived from GNSS data. Utilizing a cross-track mosaicking model, we estimated the ramp discrepancies between long tracks and subsequently eliminated these discrepancies to reassess errors in the LOS deformation velocity data for each long track. Finally, we mosaicked the long-track data corrected for ramp effects to generate the LOS deformation velocity field for both ascending and descending tracks across the entire study area.
In the cross-track processing phase, a two-stage correction strategy resolved discrepancies in cross-track overlaps. First, track-specific errors were minimized by interpolating GNSS data to address spatial gaps. Second, the LOS velocity field underwent secondary refinement by integrating relative displacement fields between adjacent tracks, improving coherence and reducing systematic biases across the observation network. In the cross-track mosaicking process, the deformation values in the overlapping areas of two adjacent frames gradually converged from initially large discrepancies. In Figure 4, the detailed results of the cross-track mosaicking process are presented.
Upon completing the mosaicking of the velocity field for the study area, we recognized that InSAR data exhibited insensitivity to north–south deformation [30]. Consequently, we integrated the ascending and descending tracks’ data with the interpolated north–south GNSS deformation velocity field data to facilitate the inversion of the 3D deformation rate of the surface within the study area. Subsequently, we computed the horizontal strain rate based on the two-dimensional velocity field.
In this processing phase, we aimed to obtain the horizontal dilatation rate map, the maximum shear rate map, and the second invariant of the horizontal strain rate. To ensure meaningful variations and smooth transitions, we employed the interpolated north–south velocity field derived from the GNSS data, along with the east–west velocity field obtained using a 60 km sliding median filter. Additionally, Gaussian filtering was applied to the north–south velocity field, with the sigma parameter set to 2 pixels, to improve the smoothness of the velocity field. This technique was instrumental in mitigating the influence of data points with abrupt variations in strain rate over a minute range, thereby accentuating the effects of strain rate changes across a more extensive range.

4. Results

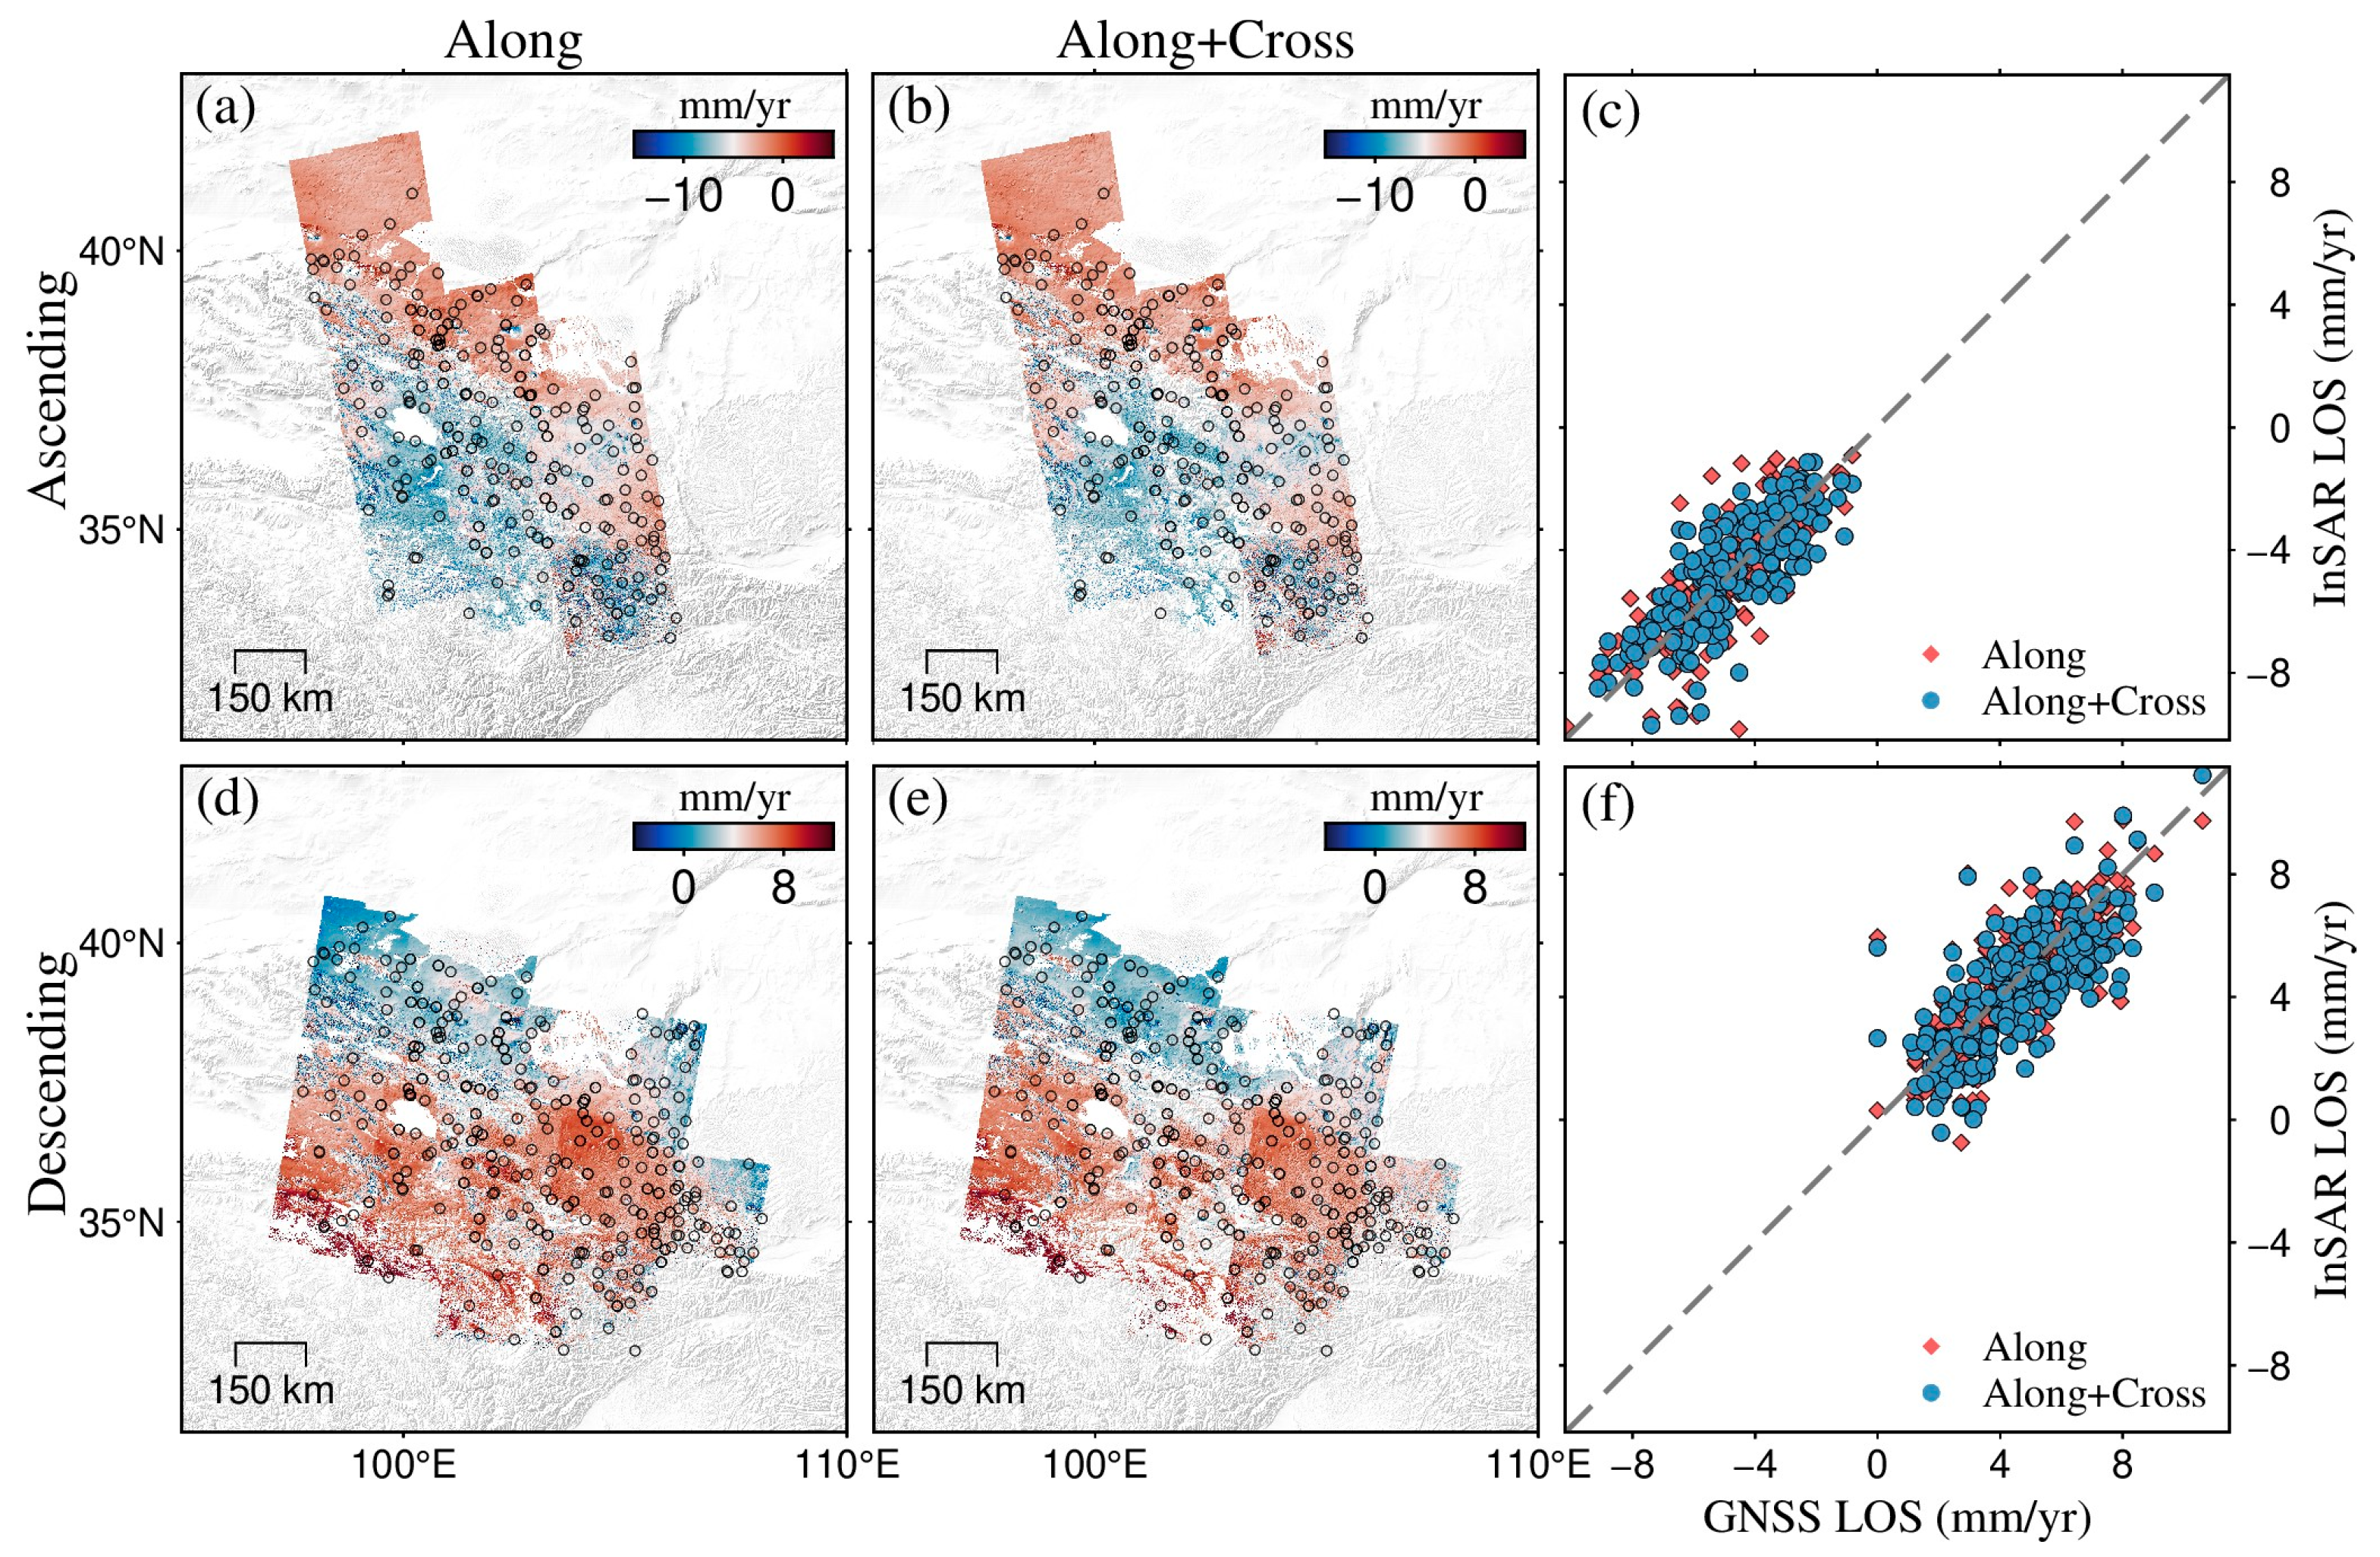
In this study, we conducted a systematic evaluation of two strategies for mosaicking InSAR LOS images: along-track mosaicking exclusively and the combined approach of along-track and cross-track mosaicking. The effects of these methodologies are illustrated in Figure 5, which depicts the differences observed under both ascending and descending track conditions.
First and foremost, it is essential to comprehend that the LOS deformation of each track existed within distinct planes. The final outcome of the mosaic revealed disparities in the LOS deformation planes associated with each track. As illustrated in Figure 5a,b,d,e, whether utilizing the Along mosaic or the Along+Cross mosaic, it was possible to achieve a relatively seamless transition of the LOS deformation values within the overlapping areas of the same track. Nevertheless, significant differences persisted among various tracks, particularly noticeable at the edges of the central tracks within the study area, where abrupt mutations occurred. This phenomenon arose due to the differing planar azimuth and incidence angles of two adjacent tracks, culminating in intrinsic step changes.
Figure 5c,f demonstrate the comparative performance of the Along and Along+Cross methods in processing the LOS deformation velocity field. The horizontal axis represents GNSS-derived LOS velocities, while the vertical axis corresponds to the mean velocity of all pixels within 500 m buffer zones centered on GNSS stations. The Along+Cross method achieves a marginal improvement in accuracy. For instance, in Figure 5c, blue markers (Along+Cross) exhibit tighter clustering along the y = x reference line compared to red markers (Along), with reduced deviation magnitudes quantifying the enhanced alignment of the LOS velocity field. This pattern persists in Figure 5f, where the Along+Cross results show superior agreement with projected GNSS velocities. The proximity of data points to the y = x line directly reflected the efficacy of each processing methodology, with the Along+Cross approach consistently minimizing systematic biases.
Figure 6 and Table S1 demonstrate marked improvements in surface deformation monitoring accuracy achieved by the Along+Cross method compared to the traditional Along method. Table S1 summarizes cross-track validation results: For Track 055A, the root mean square error (RMSE) decreased from 3.33 mm/yr to 3.20 mm/yr (Δ = 0.13 mm/yr, a 3.93% reduction), while Track 164D improved from 3.29 mm/yr to 3.16 mm/yr (Δ = 0.12 mm/yr, 3.80%). Notably, Track 135D exhibited the most substantial improvement, with RMSE declining sharply from 2.45 mm/yr to 1.70 mm/yr (Δ = 0.74 mm/yr, 30.31% reduction).
An analysis of additional tracks’ datasets confirmed broad applicability: Track 106D decreased from 2.22 mm/yr to 2.03 mm/yr (Δ = 0.18 mm/yr, 8.23%), Track 062D decreased from 1.80 mm/yr to 1.68 mm/yr (Δ = 0.11 mm/yr, 6.49%), and Track 128A decreased from 1.66 mm/yr to 1.59 mm/yr (Δ = 0.07 mm/yr, 3.97%). Error reduction magnitude correlated strongly with initial error values (R2 = 0.86), with Track 135D’s outlier performance suggesting disproportionate effectiveness in correcting high-error datasets.
The Along+Cross method systematically reduced measurement errors through integrated cross-validation, achieving peak performance for initial errors exceeding 2.4 mm/yr (mean reduction: 19.27% ± 8.64%). Enhancements included both absolute error reduction and improved error distribution stability (Kolmogorov–Smirnov test, p < 0.05), establishing a robust framework for high-precision deformation monitoring.
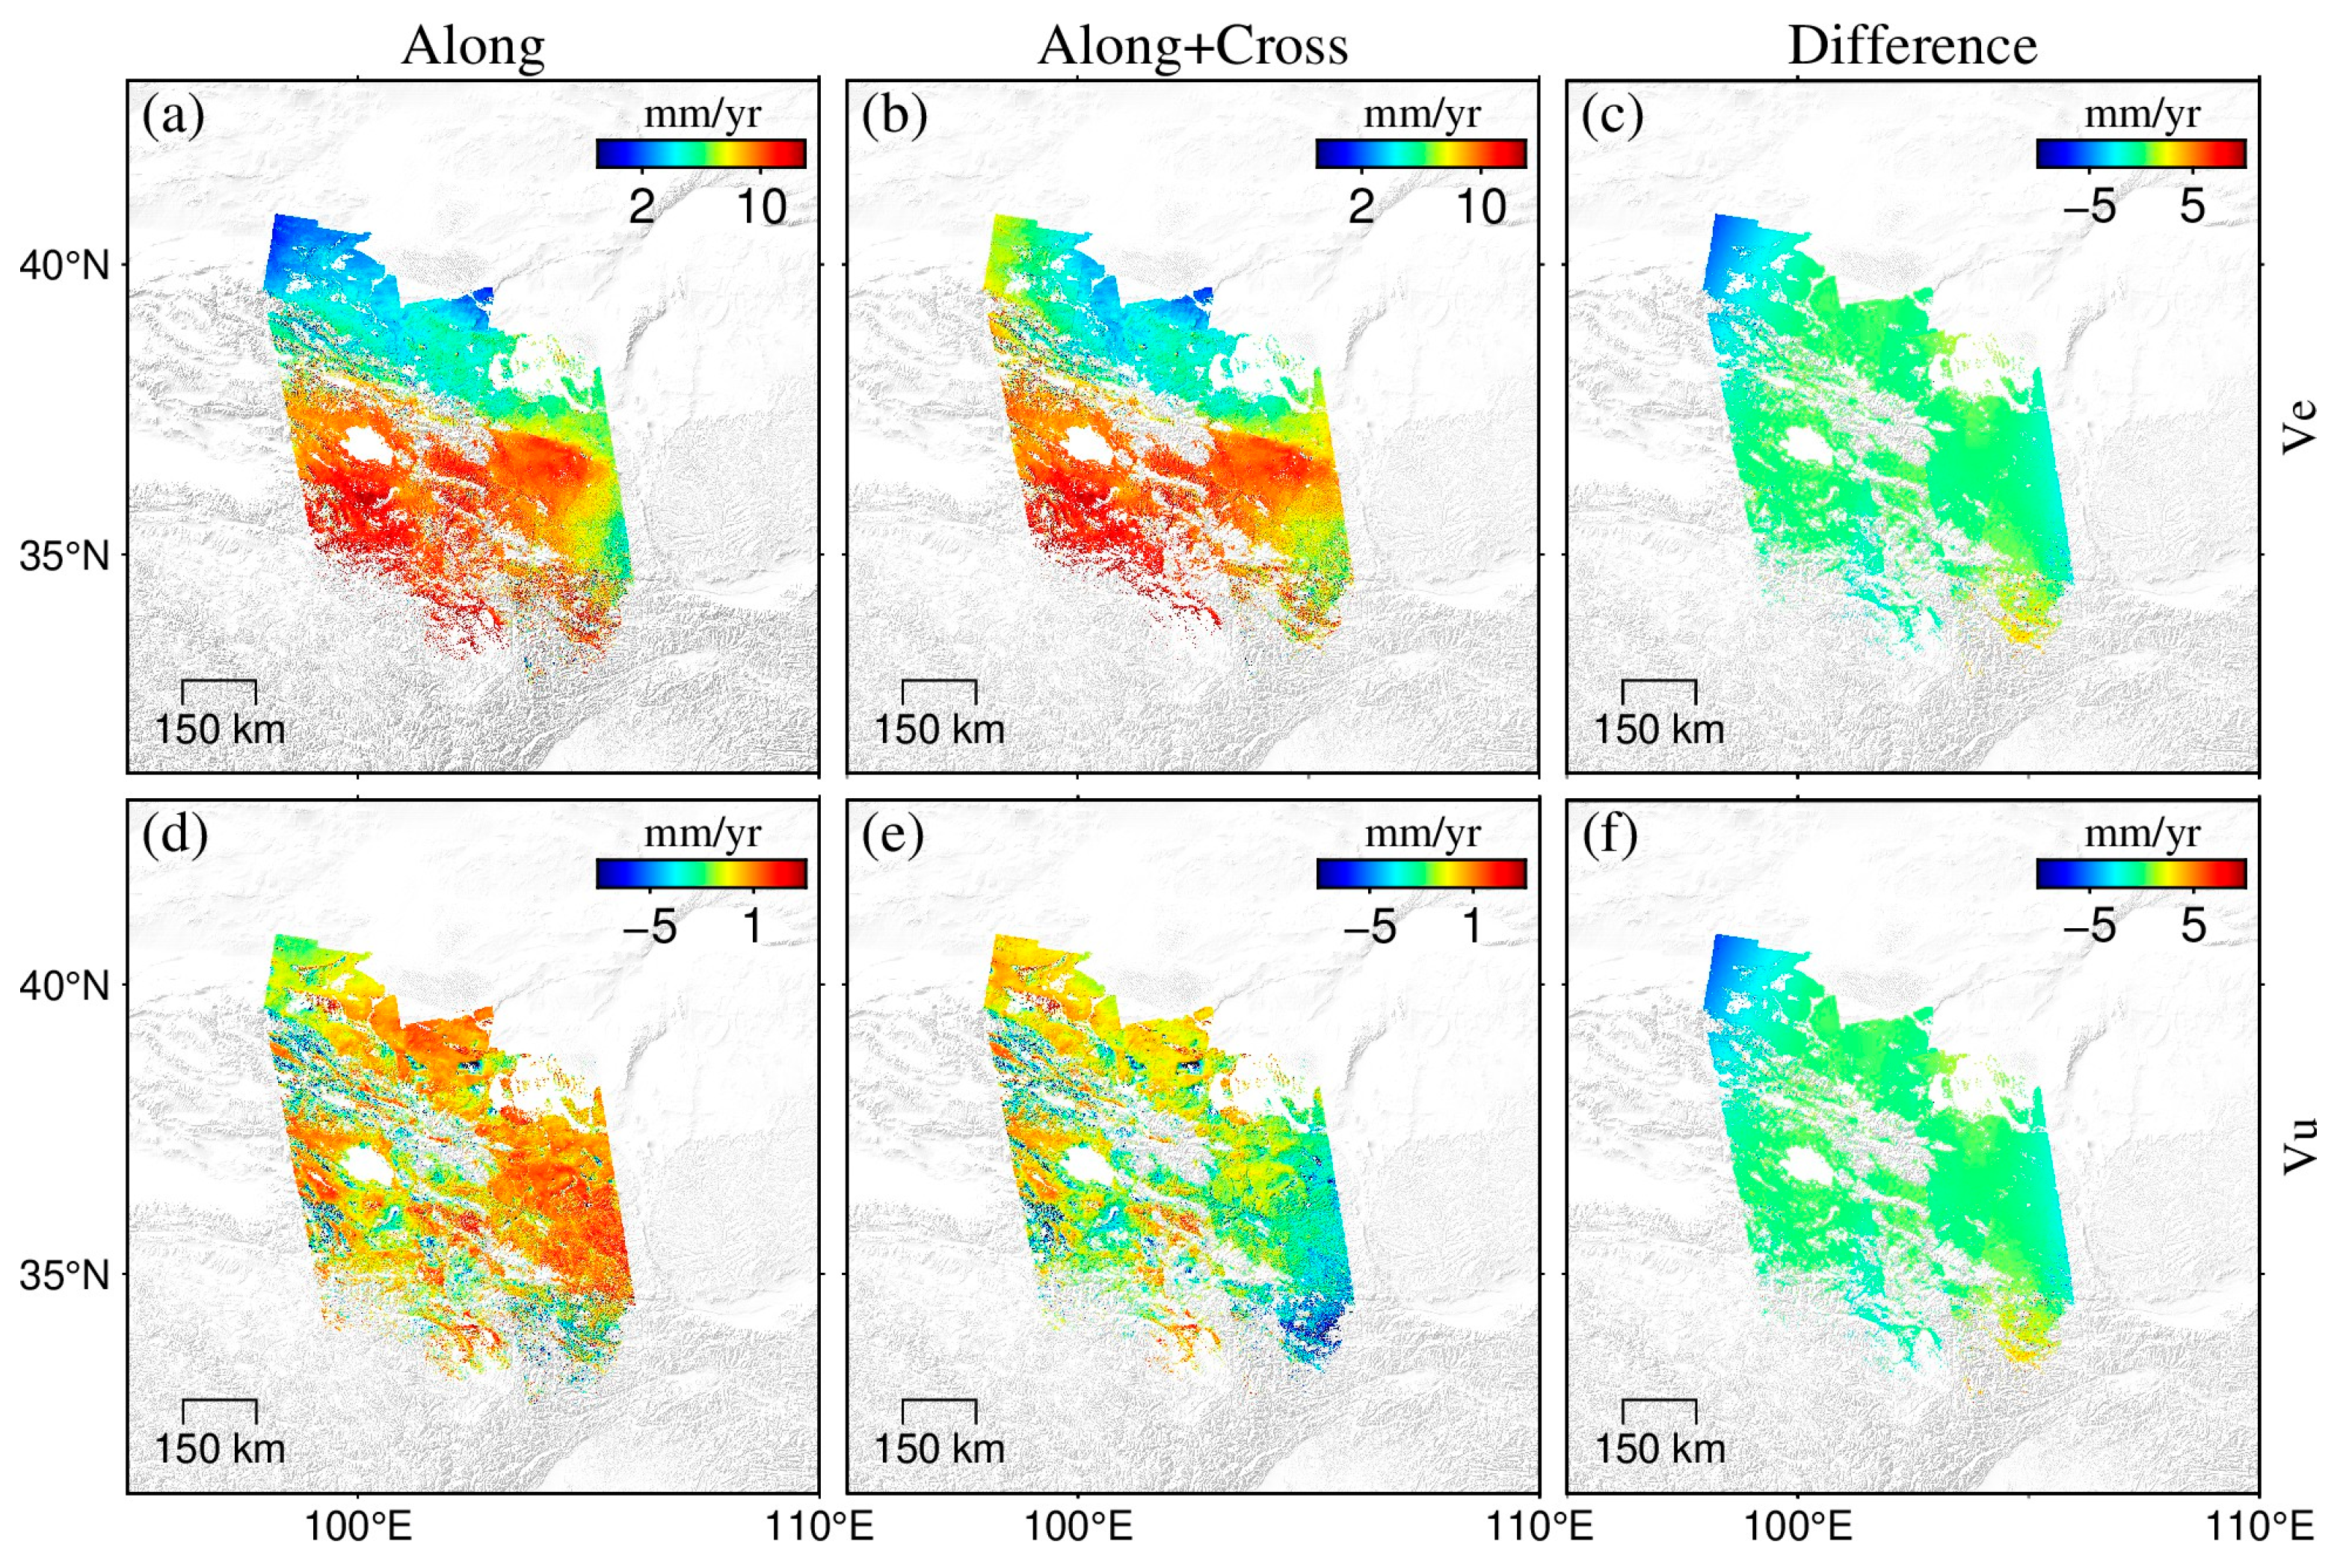
Figure 7 illustrates the velocity fields of deformation in the east–west direction (Ve) and the perpendicular direction (Vu) as determined by the two mosaic methodologies, along with the comparative analysis of the velocity differentials of the same type derived from the incorporated interpolated north–south GNSS velocity field. Generally, the discrepancies in the velocity fields between the two mosaic techniques were minimal. Notably, within the central region of the study area (101°E~103°E), the Ve velocity field exhibited a remarkable similarity (refer to Figure 7a,b). The associated difference plot (subfigure c) predominantly clustered around a zero value, with pronounced deviations observed only at the northwest and southeast corners.
In regard to the Vu velocity field, the difference plot (Figure 7f) indicated that the discrepancies in the central region were also approximately zero; however, the variations in the southeast and northwest corners were more pronounced. Despite the apparent substantial disparities in velocity distributions depicted in Figure 7e,f, a majority of data points in the remaining regions tended to exhibit relative proximity when excluding the ranges along the east–west and north–south axes.

5. Discussion

5.1. LOS Deformation Effects

In the realm of surface deformation monitoring, LOS deformation results pertain to the phenomena induced by the relative movements between observation baselines on the Earth’s surface [31]. The computation of LOS deformation derives from satellite radar interferometry technology, which leverages radar signals transmitted by satellites to ascertain distance discrepancies among two or multiple baselines for the purpose of determining deformation results [32].
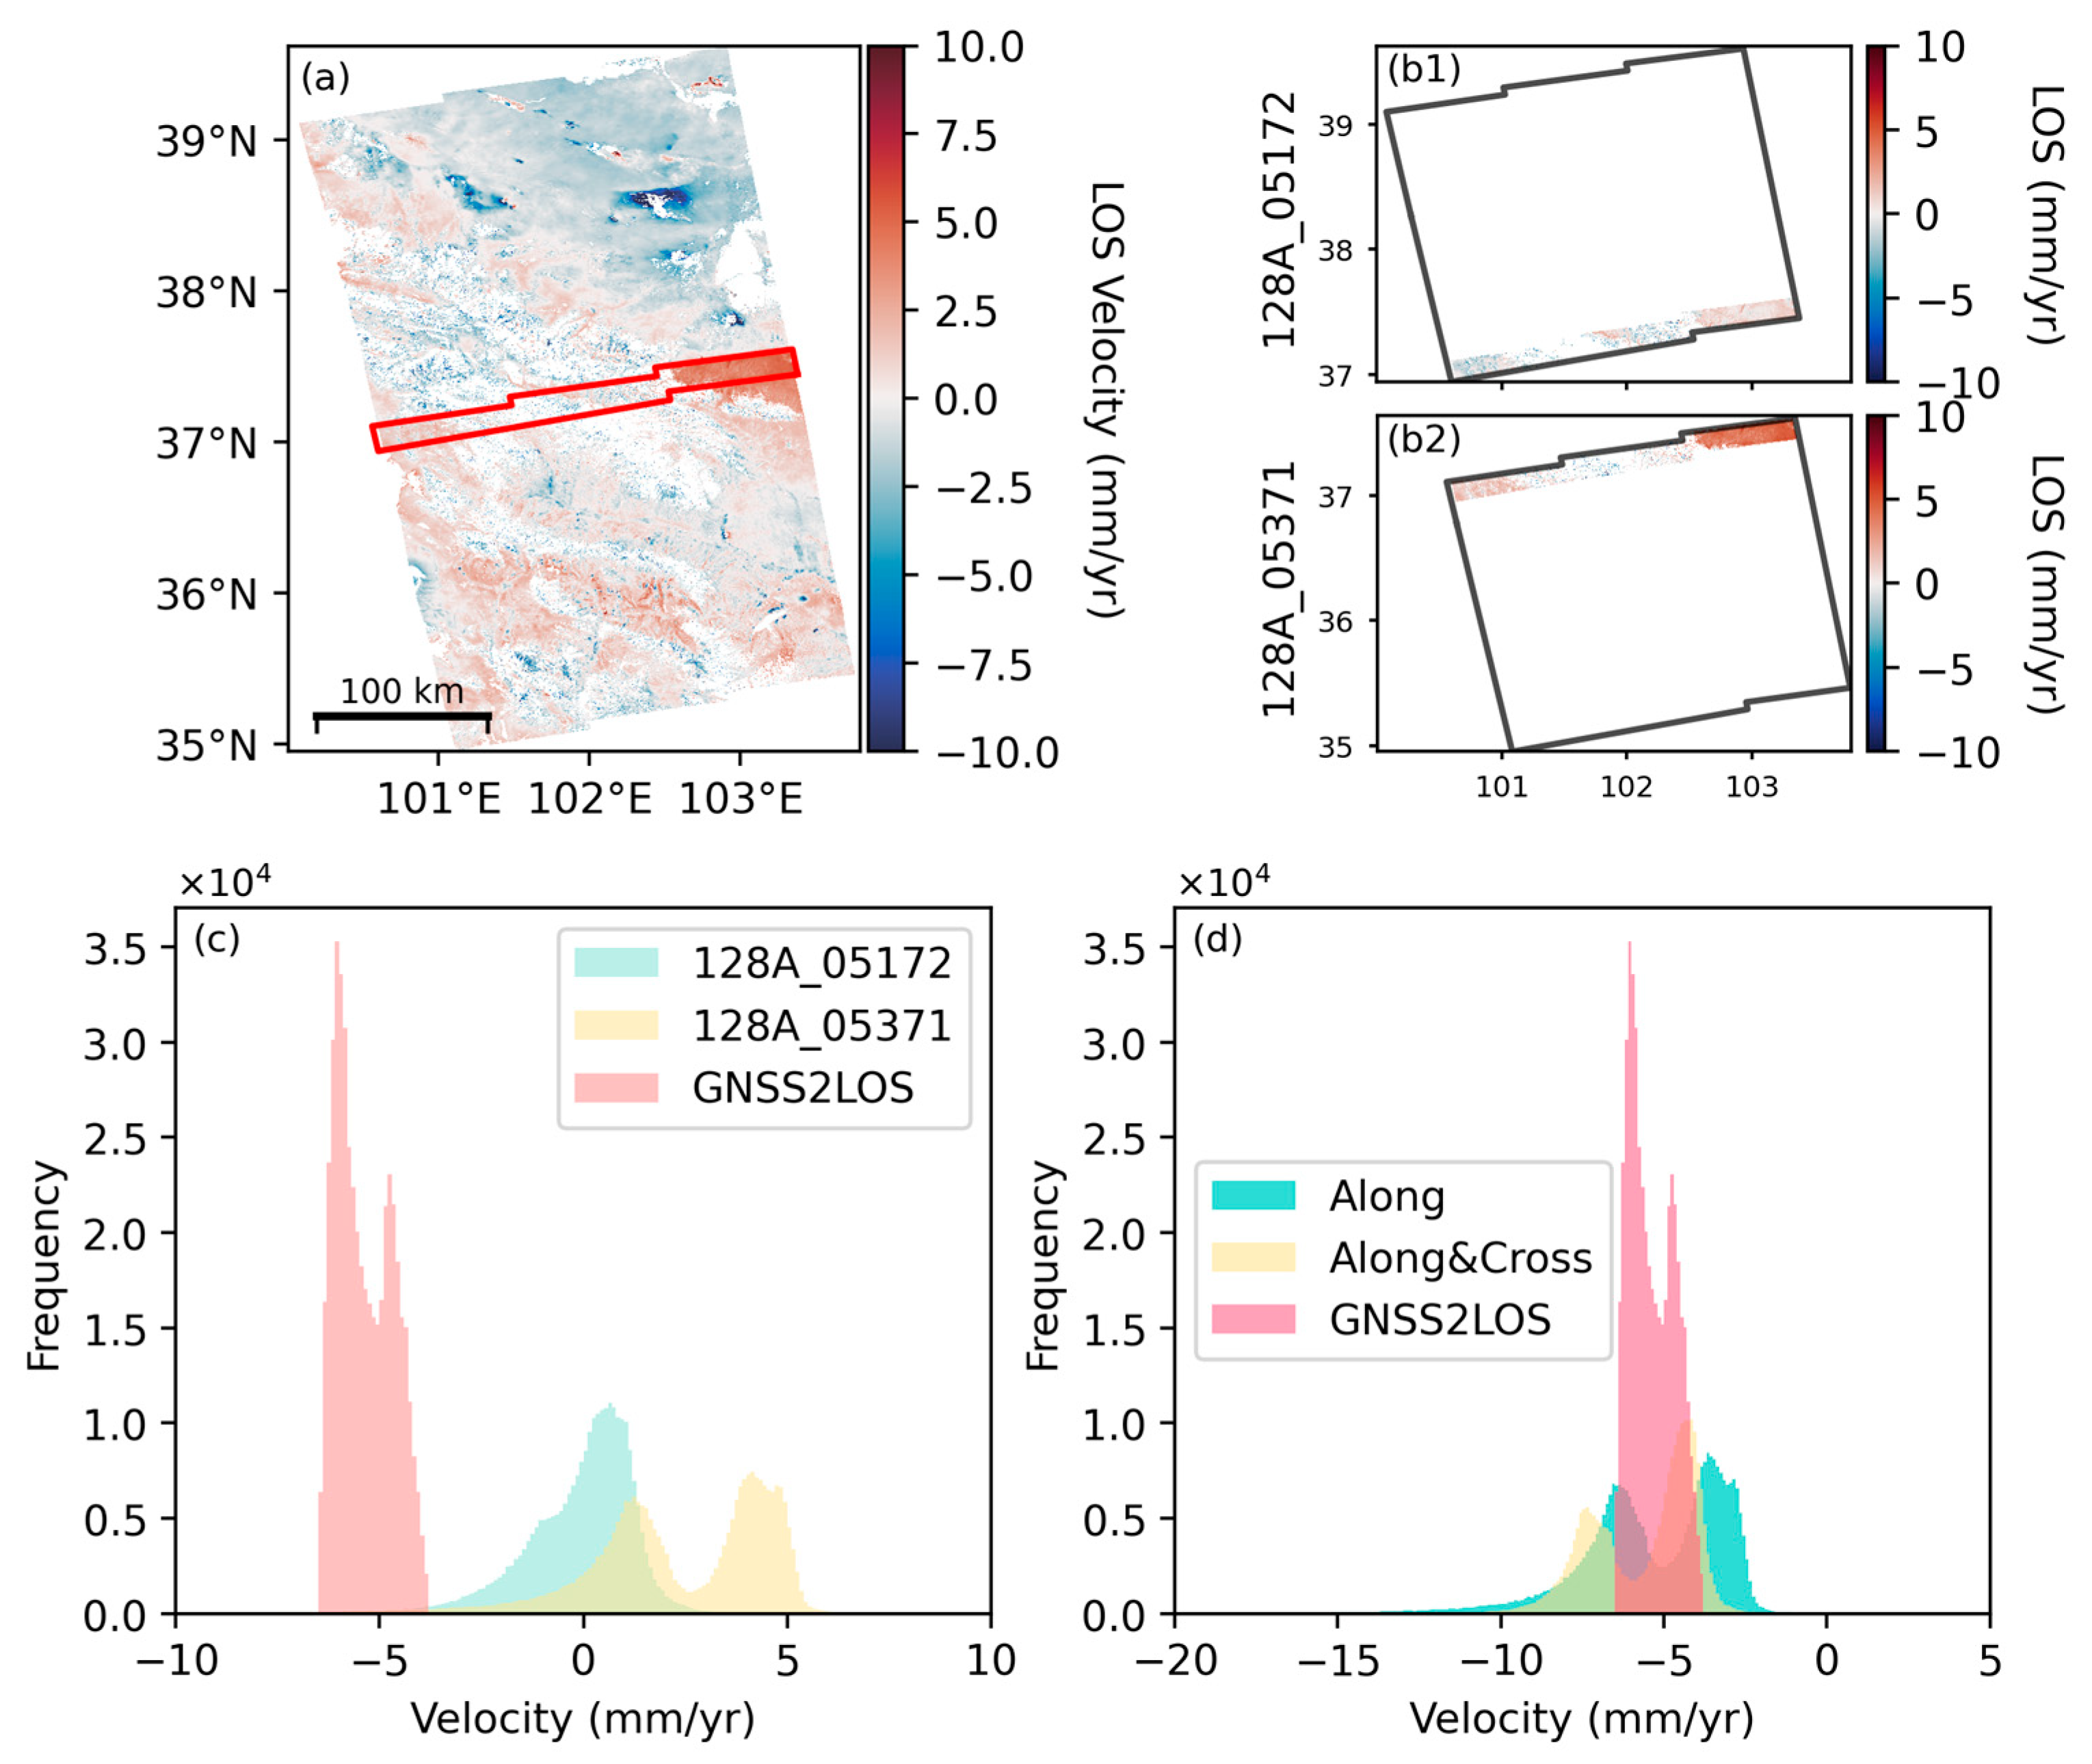
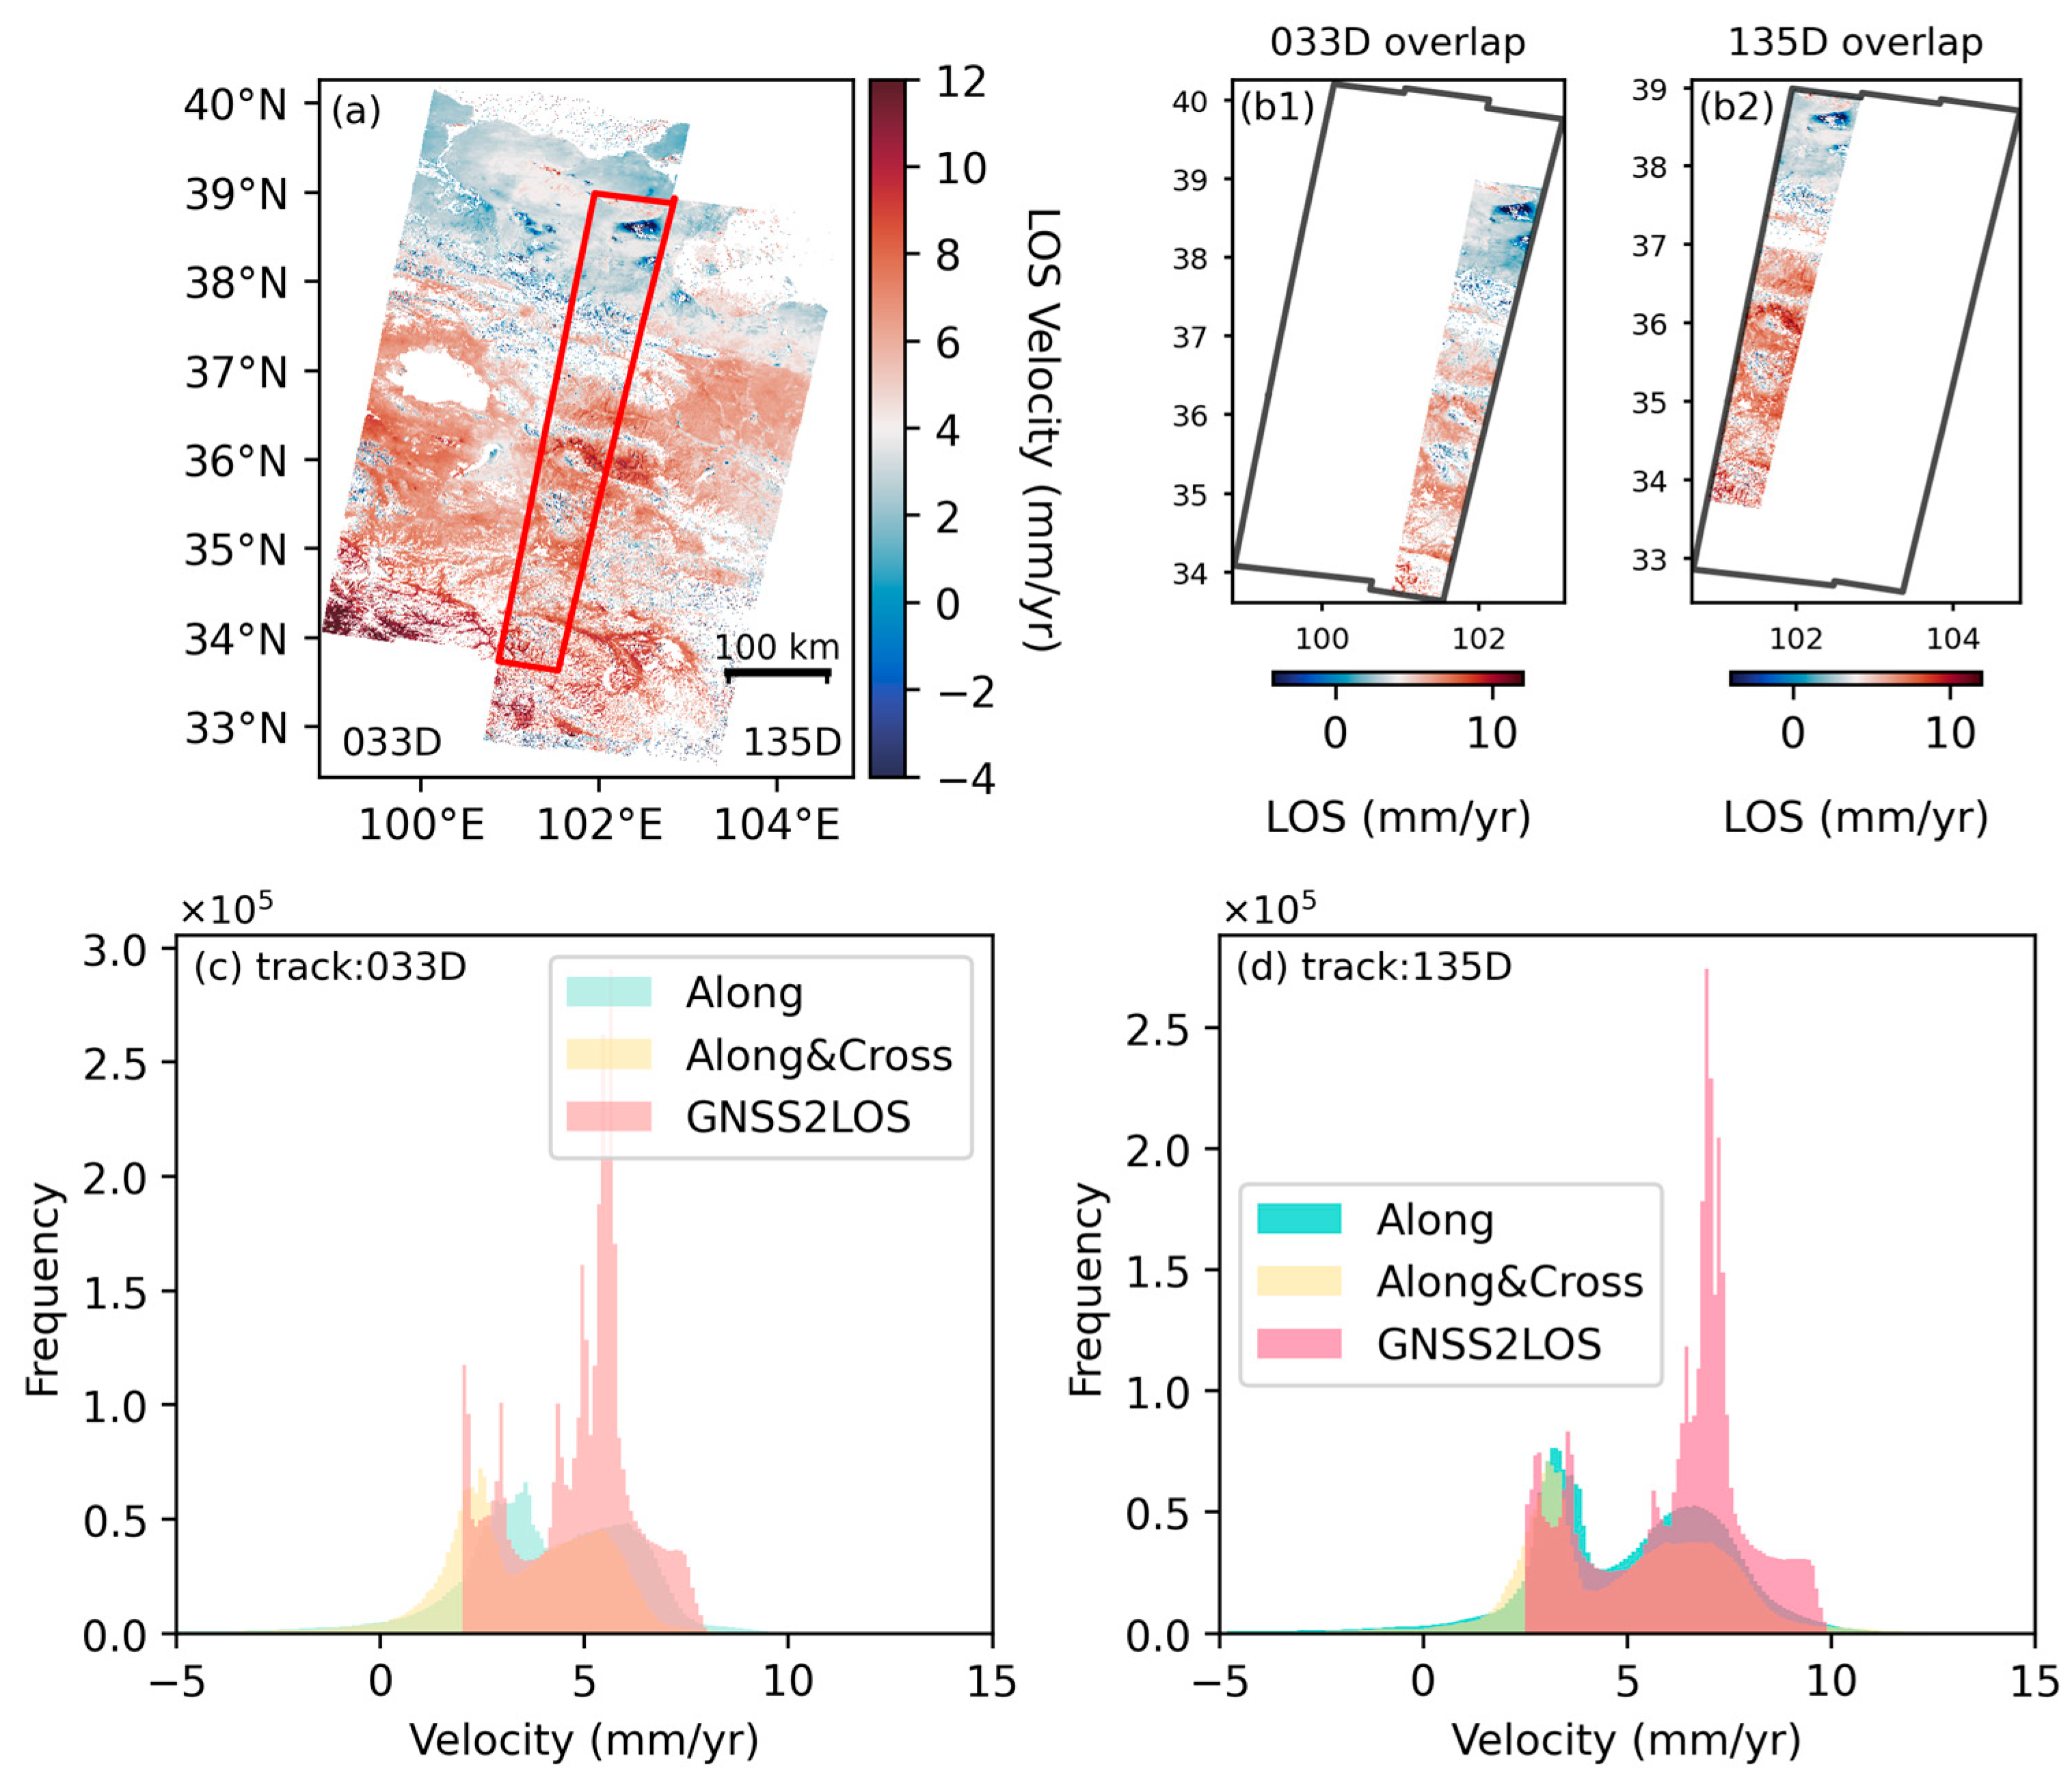
To validate the advantages of our processing methodology, we performed an analysis of the LOS deformation distribution and its variations in the overlapping areas (Figures S5–S25). Figure 8 and Figure 9 illustrate the bilaterally mosaic orbital data corresponding to track IDs 128A, 033D, and 135D. Figure 8 illustrates the distribution of LOS deformation within the overlapping region of two adjacent frames for track 128A. Figure 8c reveals a stark contrast in the LOS distributions of the two frames prior to the mosaic operation, with significant discrepancies also apparent when compared to the GNSS data projections in the LOS direction. Following the application of various mosaic techniques, the LOS values within the overlapping areas exhibited greater consistency. Importantly, after executing the Along mosaic and Along+Cross mosaic operations, the LOS distribution displayed dual peaks that aligned with the distribution characteristics noted in the GNSS data. Furthermore, the peaks in the Along+Cross mosaic were situated closer to the negative values, indicating a heightened congruence with the overall negative values of the GNSS data (Figure 8d).
A similar pattern was observed in the alteration of the LOS deformation distribution within the overlapping region across the tracks (Figure 9). It was evident that, following both the Along mosaic and Along+Cross mosaic methodologies, the LOS deformation distribution exhibited two peaks—one smaller peak on the left and a larger peak on the right—which aligned with the distribution of the GNSS data. The presence of numerous valueless points within this area resulted in an overarching LOS statistical distribution for the GNSS data being more pronounced, as GNSS represents an interpolation plane lacking valueless points. Upon a closer examination of Figure 9c, it became apparent that the trough range of the GNSS data was notably narrower than that of the two mosaic results. Additionally, the trough range in the Along+Cross mosaic was marginally smaller than that of the Along mosaic, leading to a preliminary assessment that the mosaic result of B aligned more closely with the GNSS data. In reviewing Figure 9d, while the trough ranges of both mosaic results were comparable, the trough range for the Along+Cross mosaic was nearly identical to that of the GNSS data, thus allowing us to tentatively conclude that the Along+Cross mosaic result was more congruent with the GNSS data.
In this investigation, the implementation of mosaic techniques both along and across tracks demonstrated clear advantages in LOS deformation analysis. It is worth noting that the deformation distribution of the track was closer to the GNSS data plane, which used a fixed datum, through the Cross mosaic applied to both sides of the track. This suggests that this new mosaic strategy was effective in addressing the accuracy challenges associated with image data from different tracks. This advancement mitigated the risk of error accumulation and distortion during the data mosaicking process, thereby enhancing the accuracy and reliability of the final generated LOS deformation data.

5.2. Effects of the Cross-Track Mosaic Method on Velocity Field

Figure 10 illustrates the impact of secondary refinement on the LOS velocity field for Track 062D using cross-track mosaicking with relative displacement field integration. Due to substantial disparity in overlap area sizes between Track 062D and its adjacent left and right tracks, we evaluated the mosaicking’s influence on the Ve (east–west) velocity field. An analysis of Figure 10a revealed that, by integrating relative displacement fields for LOS refinement, the overlap region introduced a pronounced stepping artifact at the track’s left boundary (103.5° E, 36.5° N) when overlap areas differed significantly. In contrast, Figure 10b—which employed GNSS interpolation for track correction—shows no such artifact. These results suggest that integrating relative displacement fields for LOS refinement is less effective when adjacent track overlaps exhibit marked size discrepancies. Thus, for tracks with asymmetric overlap regions, GNSS-based correction provides a more reliable approach to mitigate systematic errors.
In this study, we found that for overlapping regions on both sides with approximately equal areas, employing two cross-track mosaics enhanced the accuracy of the LOS deformation values, thereby increasing the reliability of the LOS velocity decomposition. Additionally, the velocity fields processed through both the along-track and cross-track mosaicking methods better aligned with the GNSS data in the central region of the study area. This effectively reduced local anomalies in the velocity field caused by insufficient mosaicking techniques, thereby enhancing the overall reliability of the velocity field data. A uniform velocity field is critically important for analyzing trends in surface movement and variations in velocity [33].

5.3. Accuracy of Strain Rate Monitoring

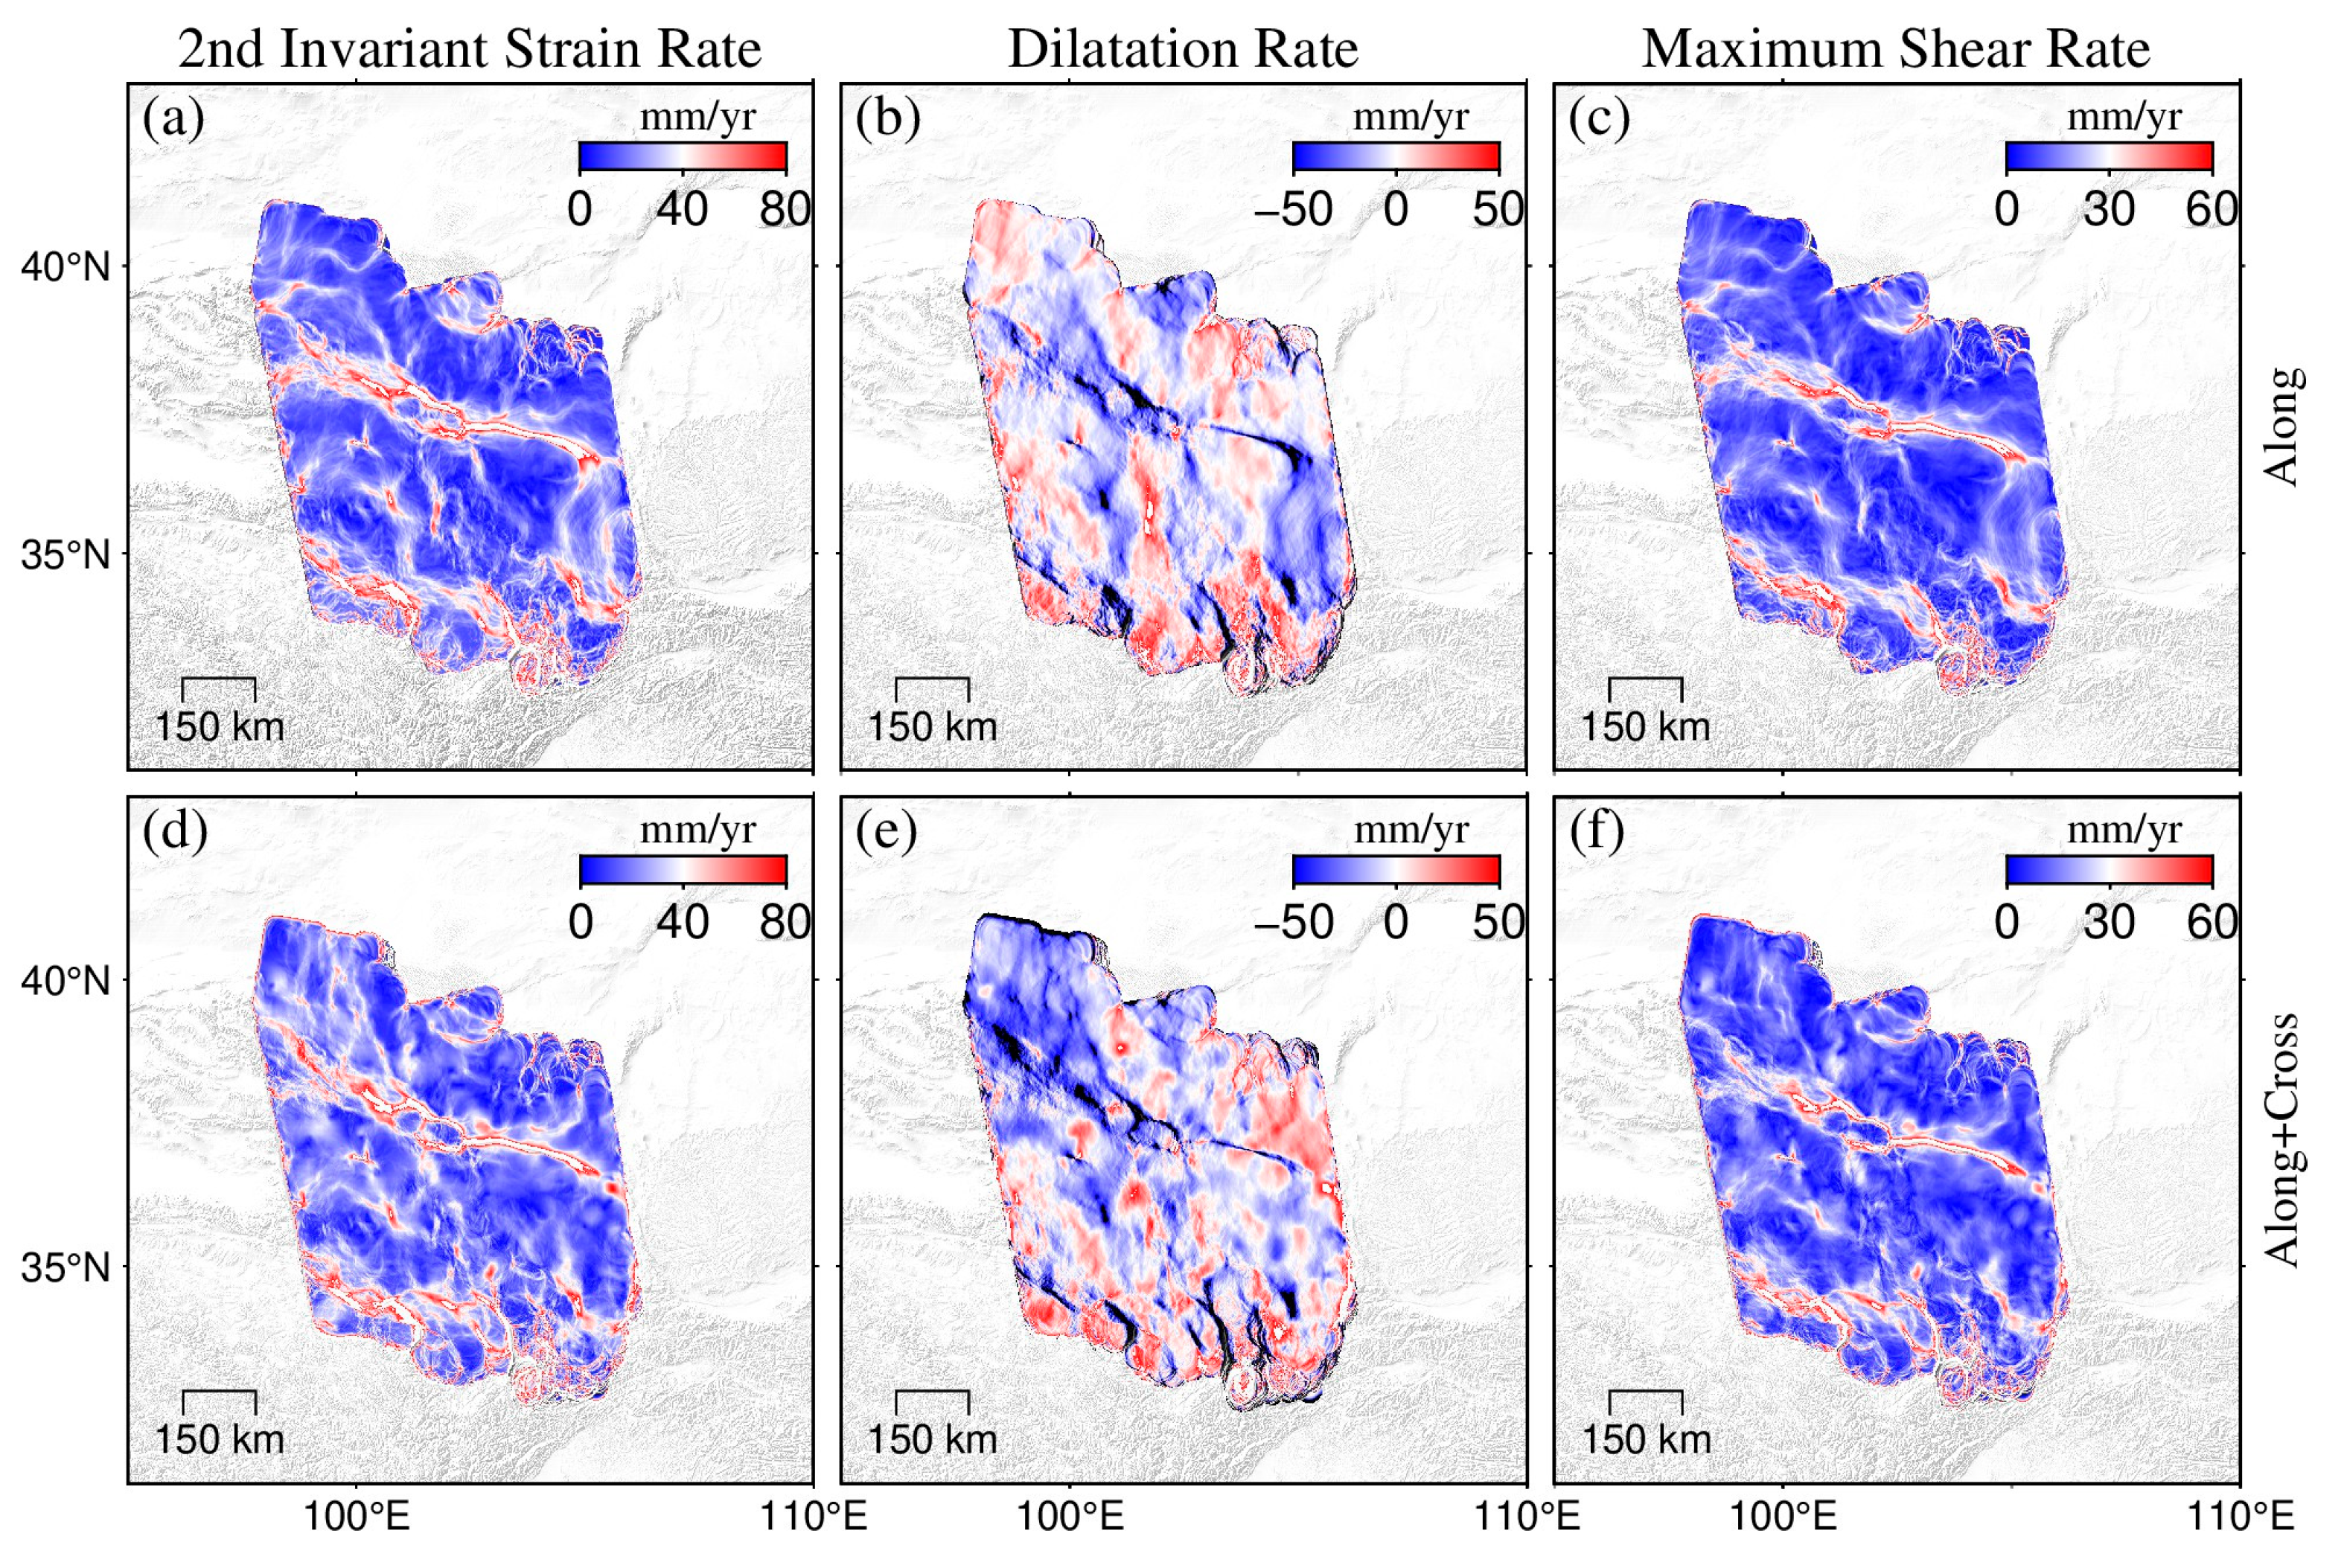
Using the inverted Ve velocity field from the LOS data and the V velocity field from the GNSS interpolation data, we calculated the associated strain rates for the two mosaic processes, as illustrated in Figure 11. First, it is important to highlight that the most accurate region of the Along+Cross mosaic method was situated in the central part of the study area (101°E~105°E, 35°N~37°N). This region circumvented the imperfections associated with mosaicking along only one side of the cross-track. By comparing the central plots of the two mosaic methods, we found that their strain rate distributions were approximately similar, with nearly equal high-value regions for both the dilatation rate and maximum shear rate. However, the Along+Cross mosaic distribution was more fragmented, with the high-value bands of the second invariant strain rate and maximum shear rate displaying a greater degree of bifurcation, while the high-value, flaky distribution of the dilatation rate transitioned to an islet distribution in the response region. This indicated an enhanced sensitivity of the Along+Cross mosaic method in detecting strain rates to some extent. However, it should be noted that the range of reliable regional data decreased.
This discovery indicated that these two Mosaic processes (Along and Along+Cross) were proficient in accurately capturing minute fluctuations in strain rates during surface deformation, which is essential for elucidating the intricate characteristics of surface deformations and facilitating the early warning of potential geological hazards [34]. For instance, when scrutinizing the strain accumulation in active fault zones, precise measurements of strain rates can send out signals of fault activity in advance, thereby providing critical information for the early detection and mitigation of seismic hazards [35]; similarly, in the evaluation of landslide deformations, the timely identification of anomalous strain rate changes can yield a more accurate foundation for stability assessments and the formulation of preventative measures.

5.4. Cross-Validation of the Processing Results and Other Data Validation of the Method

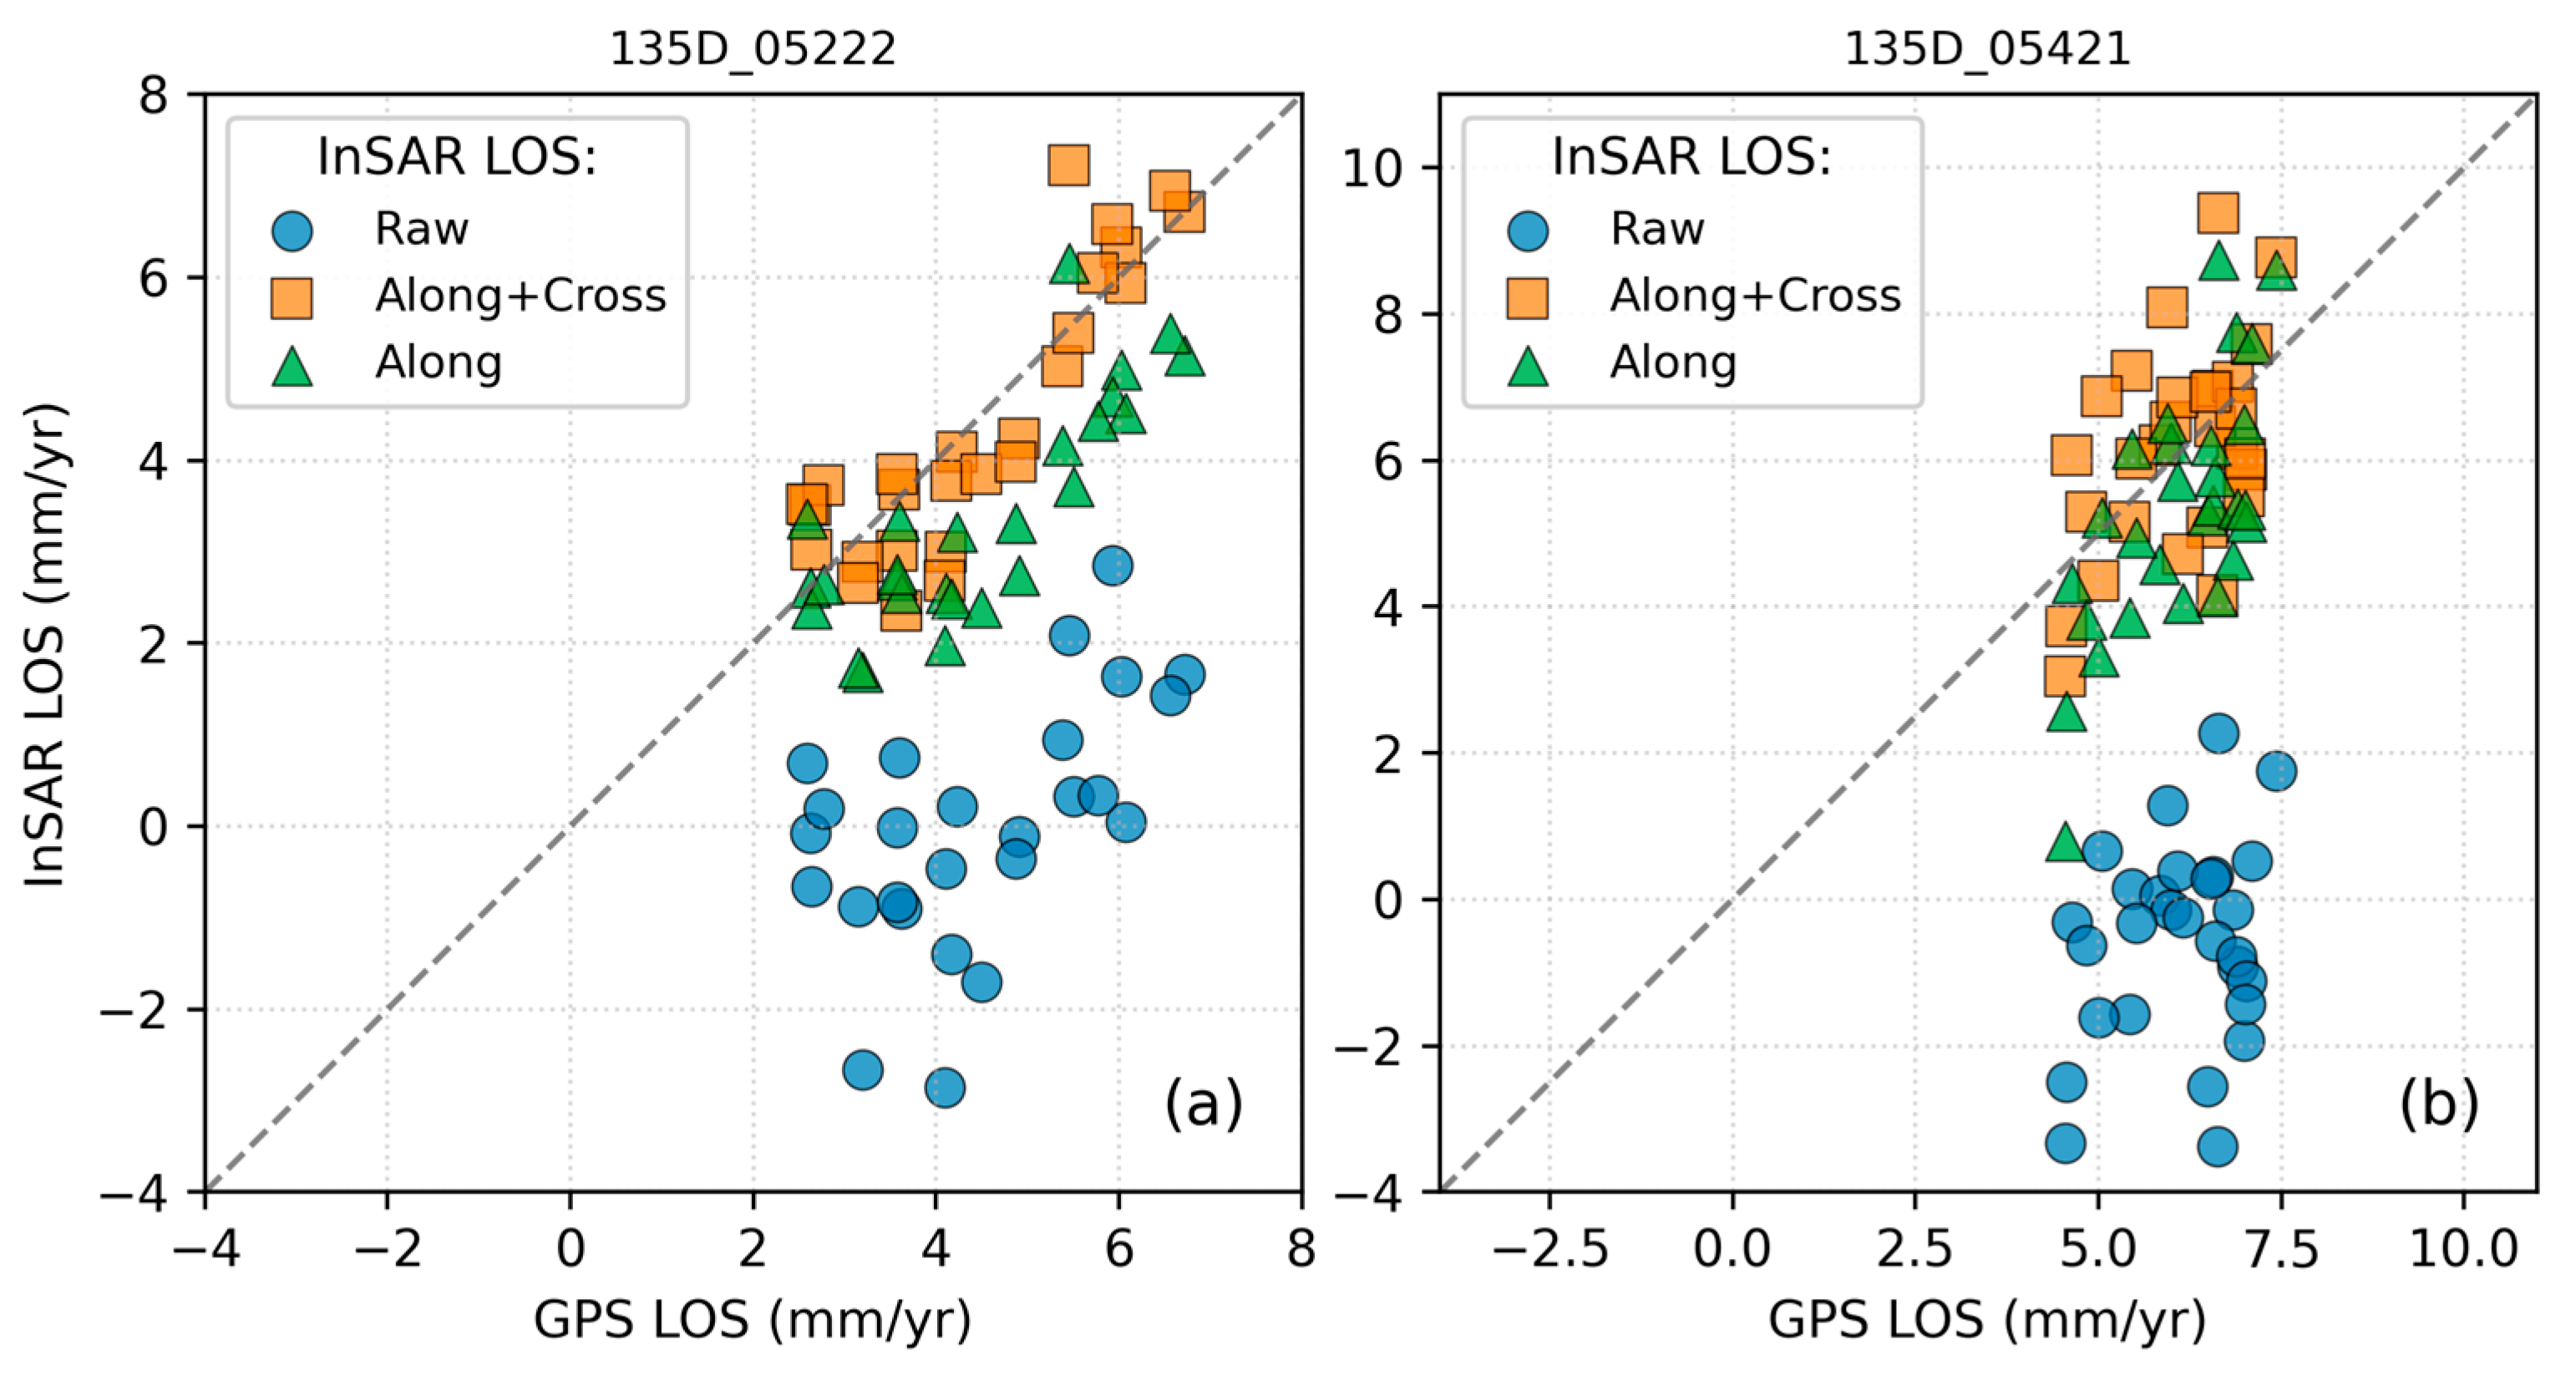
To visually demonstrate the improvement efficacy of our method, we conducted cross-validation using GNSS-projected LOS velocities for frames 135D_05222 and 135D_05421 (Figure 12). The Along+Cross method produced velocities with tighter clustering around GNSS benchmarks compared to the original LOS velocity field, confirming enhanced alignment accuracy.
To evaluate generalizability, we validated the method using InSAR LOS velocity datasets from J. Fang for Tracks 099A, 127A, and 026A, spanning 94° E–104° E and 22° N–37° N. Five consecutive frames per track were analyzed (Table S2), demonstrating consistent performance across diverse geographic and geometric conditions [36].
An analysis revealed distinct RMSE variations between the Along and Along+Cross methods. Track 099A exhibited an RMSE reduction from 1.29 mm/yr (Along) to 1.20 mm/yr (Along+Cross) (Δ = 0.09 mm/yr), highlighting a cross-track correction efficacy. Similarly, Track 026A showed a reduction from 1.21 mm/yr to 1.01 mm/yr (Δ = 0.20 mm/yr), underscoring the method’s capacity for error mitigation.
However, Track 172A displayed a marginal improvement (1.48 mm/yr vs. 1.41 mm/yr, Δ = 0.07 mm/yr), suggesting that cross-track integration benefits depend on track-specific geometries. Overall, the Along+Cross method achieved lower RMSE values in most cases, validating its superiority in deformation pattern characterization and predictive reliability. Further investigation into track-specific factors (e.g., overlap symmetry, GNSS station density) is recommended to optimize method selection under varying conditions.
Finally, it should be noted that we evaluated the interpolated GNSS data to generate the corresponding GNSS uncertainty data (Figures S2–S4), which are used as coefficients of the weighting function when inverting the 3D deformation of the surface.

6. Conclusions

We propose a novel mosaicking method to enhance accuracy in both along-track and cross-track deformation integration. The framework synergizes GNSS data from overlapping regions with InSAR observations, employing Kriging interpolation to recalibrate multi-track datasets and reduce geodetic uncertainties. Validation in the eastern Tibetan Plateau demonstrates its efficacy, particularly for tracks with bilateral overlap zones of comparable spatial extent. By integrating relative displacement fields from symmetric overlaps for LOS refinement, we achieved an average 4–8% reduction in RMSE relative to conventional along-track mosaicking, with localized improvements exceeding 30% on tracks exhibiting high initial discrepancies (e.g., Track 135D). These advancements significantly enhance the precision of derived surface deformation rates and strain field inversions.
To quantify methodological advantages, we analyzed LOS deformation distributions within overlap regions. Pre-mosaicking, adjacent frames exhibited pronounced interframe inconsistencies relative to GNSS-projected velocities. Post-processing with along-track and along-cross mosaicking improved intra-overlap coherence, with the latter showing superior alignment to GNSS deformation patterns (Figure 12). The along-cross approach eliminates bimodal artifacts in deformation profiles, better matching GNSS-derived negative velocity trends. Cross-track validation confirms systematic bias reduction and improved boundary consistency, affirming the method’s capacity to reconcile geometric and geophysical constraints. Our findings highlight the effectiveness of along-track and cross-track mosaicking in mitigating data discontinuities and enhancing deformation monitoring accuracy. The cross-track mosaicking method, in particular, ensures that deformation distributions more closely align with the GNSS data plane, thereby addressing the accuracy challenges posed by multi-track InSAR data integration. By reducing error accumulation and deformation distortion during the mosaicking process, this approach significantly enhances the reliability of LOS deformation data.
With the long-term observation strategy of Sentinel-1 and the continuous development of GNSS technology, we anticipate that these high-resolution products will further improve the accuracy of surface deformation monitoring. Future research should explore the applicability of along-track and cross-track mosaicking methods across diverse geographical settings to achieve higher precision and reliability. These advancements establish a solid foundation for earthquake risk assessment and geological disaster management.
Supplementary Materials

The following supporting information can be downloaded at: https://www.mdpi.com/article/10.3390/rs17111804/s1, Figure S1: The distribution map of GNSS sites in the study area; Figure S2: The Ve velocity field and uncertainty of Kriging interpolation in GNSS data; Figure S3: The Vn velocity field and uncertainty of Kriging interpolation in GNSS data; Figure S4: The Vn velocity field and uncertainty of Kriging interpolation in GNSS data; Figure S5: Comparison of the overlapping areas of 026A_04929_131313 and 026A_05128_131313; Figure S6: Comparison of the overlapping areas of 026A_05128_131313 and 026A_05327_131313; Figure S7: Comparison of the overlapping areas of 026A_05327_131313 and 026A_05526_131313; Figure S8: Comparison of the overlapping areas of 055A_05221_131313 and 055A_05420_131313; Figure S9: Comparison of the overlapping areas of 055A_05420_131313 and 055A_05619_131313; Figure S10: Comparison of the overlapping areas of 128A_05172_131313 and 128A_05371_131313; Figure S11: Comparison of the overlapping areas of 128A_05371_131313 and 128A_05570_131313; Figure S12: Comparison of the overlapping areas of 033D_05106_131313 and 033D_05304_131313; Figure S13: Comparison of the overlapping areas of 033D_05304_131313 and 033D_05503_131313; Figure S14: Comparison of the overlapping areas of 062D_05234_131313 and 062D_05432_131313; Figure S15: Comparison of the overlapping areas of 062D_05432_131313 and 062D_05631_131313; Figure S16: Comparison of the overlapping areas of 106D_05049_131313 and 106D_05248_131313; Figure S17: Comparison of the overlapping areas of 106D_05248_131313 and 106D_05447_131313; Figure S18: Comparison of the overlapping areas of 135D_05222_131313 and 135D_05421_131313; Figure S19: Comparison of the overlapping areas of 135D_05421_131313 and 135D_05620_131313; Figure S20: Comparison of the overlapping areas of 026A and 128A; Figure S21: Comparison of the overlapping areas of 055A and 128A; Figure S22: Comparison of the overlapping areas of 033D and 106D; Figure S23: Comparison of the overlapping areas of 033D and 135D; Figure S24: Comparison of the overlapping areas of 062D and 135D; Figure S25: Comparison of the overlapping areas of 062D and 164D; Table S1: The RMSE of each track after processing by the two methods; Table S2: The verification results of other datasets and frame IDs; Table S3: The accuracy comparison between Kriging and IDW.

Author Contributions

Conceptualization, G.X. and X.L.; methodology, X.L.; software, X.L.; validation, X.L. and G.X.; formal analysis, Y.Y.; investigation, T.Z.; resources, Y.X.; data curation, X.L. and Y.X.; writing—original draft preparation, X.L.; writing—review and editing, G.X.; visualization, Y.Y.; supervision, T.Z. All authors have read and agreed to the published version of the manuscript.

Funding

This research was funded by the National Natural Science Foundation of China (Nos. 42104008, 42204006, 42174055), the Jiangxi Provincial Natural Science Foundation (20232BAB213075), the National Institute of Natural Hazards, Ministry of Emergency Management of China (ZDJ2024-03), the Open Fund of State Key Laboratory of Precision Geodesy, Innovation Academy for Precision Measurement Science and Technology (Grant No. SKLPG2025-2-3), the Open Fund of Wuhan, Gravitation and Solid Earth Tides, National Observation and Research Station (Grant No. WHYWZ202407), and the Education Commission of Hubei Province of China (Grant No. D20232802).

Data Availability Statement

The original contributions presented in this study are included in the article/Supplementary Materials. Further inquiries can be directed to the corresponding author.

Conflicts of Interest

The authors declare no conflicts of interest.

References

  1. Chen, M.; Xu, G.; Zhang, T.; Xie, X.; Chen, Z. A novel method for inverting coseismic 3D surface deformation using InSAR considering the weight influence of the spatial distribution of GNSS points. Adv. Space Res. 2024, 73, 585–596. [Google Scholar] [CrossRef]
  2. Duan, W.; Zhang, H.; Wang, C.; Tang, Y. Multi-Temporal Insar Parallel Processing For Sentinel-1 Large-Scale Surface Deformation Mapping. Remote Sens. 2020, 12, 3749. [Google Scholar] [CrossRef]
  3. Massonnet, D.; Briole, P.; Arnaud, A. Deflation of Mount Etna monitored by spaceborne radar interferometry. Nature 1995, 375, 567–570. [Google Scholar] [CrossRef]
  4. Hu, J.; Ding, X.L.; Li, Z.W.; Zhang, L.; Zhu, J.J.; Sun, Q.; Gao, G.J. Vertical and horizontal displacements of Los Angeles from InSAR and GPS time series analysis: Resolving tectonic and anthropogenic motions. J. Geodyn. 2016, 99, 27–38. [Google Scholar] [CrossRef]
  5. Wu, S.; Yang, Z.; Ding, X.; Zhang, B.; Zhang, L.; Lu, Z. Two decades of settlement of Hong Kong International Airport measured with multi-temporal InSAR. Remote Sens. Environ. 2020, 248, 111976. [Google Scholar] [CrossRef]
  6. Gahalaut, V.K.; Yadav, R.K.; Sreejith, K.M.; Gahalaut, K.; Buergmann, R.; Agrawal, R.; Sati, S.P.; Bansal, A. InSAR and GPS Measurements of Crustal Deformation Due to Seasonal Loading of Tehri Reservoir in Garhwal Himalaya, India. Geophys. J. Int. 2017, 209, 425–433. [Google Scholar] [CrossRef]
  7. Yu, H.; Lan, Y.; Yuan, Z.; Xu, J.; Lee, H. Phase Unwrapping in InSAR: A Review. IEEE Geosci. Remote Sens. Mag. 2019, 7, 40–58. [Google Scholar] [CrossRef]
  8. Chen, J.; Wu, T.; Zou, D.; Liu, L.; Wu, X.; Gong, W.; Zhu, X.; Li, R.; Hao, J.; Hu, G.; et al. Magnitudes and Patterns of Large-Scale Permafrost Ground Deformation Revealed by Sentinel-1 InSAR on the Central Qinghai-Tibet Plateau. Remote Sens. Environ. 2022, 268, 112778. [Google Scholar] [CrossRef]
  9. He, P.; Wen, Y.; Xu, C.; Chen, Y. High-quality three-dimensional displacement fields from new-generation SAR imagery: Application to the 2017 Ezgeleh, Iran, earthquake. J. Geod. 2019, 93, 573–591. [Google Scholar] [CrossRef]
  10. Parizzi, A.; Brcic, R.; Zan, F.D. InSAR Performance for Large-Scale Deformation Measurement. IEEE Trans. Geosci. Remote Sens. 2020, 59, 8510–8520. [Google Scholar] [CrossRef]
  11. Daout, S.; Sudhaus, H.; Kausch, T.; Steinberg, A.; Dini, B. Interseismic and Postseismic Shallow Creep of the North Qaidam Thrust Faults Detected with a Multitemporal InSAR Analysis. J. Geophys. Res. Solid Earth 2019, 124, 7259–7279. [Google Scholar] [CrossRef]
  12. Zhou, Y.; Thomas, M.Y.; Parsons, B.; Walker, R.T. Time-dependent postseismic slip following the 1978 Mw 7.3 Tabas-e-Golshan, Iran earthquake revealed by over 20 years of ESA InSAR observations. Earth Planet. Sci. Lett. 2018, 483, 64–75. [Google Scholar] [CrossRef]
  13. Zhang, Y.; Meng, X.M.; Dijkstra, T.A.; Jordan, C.J.; Chen, G.; Zeng, R.Q.; Novellino, A. Forecasting the Magnitude of Potential Landslides Based on InSAR Techniques. Remote Sens. Environ. 2020, 241, 11738. [Google Scholar] [CrossRef]
  14. Thollard, F.; Clesse, D.; Doin, M.-P.; Donadieu, J.; Durand, P.; Grandin, R.; Lasserre, C.; Laurent, C.; Deschamps-Ostanciaux, E.; Pathier, E.; et al. FLATSIM: The ForM@Ter LArge-Scale Multi-Temporal Sentinel-1 InterferoMetry Service. Remote Sens. 2021, 13, 3734. [Google Scholar] [CrossRef]
  15. Lazecký, M.; Spaans, K.; González, P.J.; Maghsoudi, Y.; Morishita, Y.; Albino, F.; Elliott, J.; Greenall, N.; Hatton, E.; Hooper, A.; et al. LiCSAR: An Automatic InSAR Tool for Measuring and Monitoring Tectonic and Volcanic Activity. Remote Sens. 2020, 12, 2430. [Google Scholar] [CrossRef]
  16. Weiss, J.R.; Walters, R.J.; Morishita, Y.; Wright, T.J.; Lazecky, M.; Wang, H.; Hussain, E.; Hooper, A.J.; Elliott, J.R.; Rollins, C.; et al. High-Resolution Surface Velocities and Strain for Anatolia from Sentinel-1 InSAR and GNSS Data. Geophys. Res. Lett. 2020, 47, e2020GL087376. [Google Scholar] [CrossRef]
  17. Morishita, Y.; Sugimoto, R.; Nakamura, R.; Tsutsumi, C.; Natsuaki, R.; Shimada, M. Nationwide urban ground deformation in Japan for 15 years detected by ALOS and Sentinel-1. Prog. Earth Planet. Sci. 2023, 10, 66. [Google Scholar] [CrossRef]
  18. Ou, Q.; Daout, S.; Weiss, J.R.; Shen, L.; Lazecký, M.; Wright, T.J.; Parsons, B.E. Large-Scale Interseismic Strain Mapping of the NE Tibetan Plateau from Sentinel-1 Interferometry. J. Geophys. Res. Solid Earth 2022, 127, e2022JB024176. [Google Scholar] [CrossRef]
  19. Shen, L.; Hooper, A.; Elliott, J.R.; Wright, T.J. Variability in interseismic strain accumulation rate and style along the Altyn Tagh Fault. Nat. Commun. 2024, 15, 6876. [Google Scholar] [CrossRef]
  20. Shen, L. Characterising Seismic Hazard with InSAR Measurements: Cases Over Large Length Scales. Ph.D. Thesis, University of Leeds, Leeds, UK, 2020. [Google Scholar]
  21. Watson, A.R.; Elliott, J.R.; Lazecký, M.; Maghsoudi, Y.; McGrath, J.D.; Walters, R.J. An InSAR-GNSS Velocity Field for Iran. Geophys. Res. Lett. 2024, 51, e2024GL108440. [Google Scholar] [CrossRef]
  22. Chagas, V.B.P.; Chaffe, P.L.B.; Blöschl, G. Climate and land management accelerate the Brazilian water cycle. Nat. Commun. 2022, 13, 5136. [Google Scholar] [CrossRef]
  23. Bolondi, G.; Rocca, F.; Zanoletti, S. Automatic Contouring of Faulted Subsurfaces. Geophysics 1976, 41, 1377–1393. [Google Scholar] [CrossRef]
  24. Xu, X.; Sandwell, D.T.; Klein, E.; Bock, Y. Integrated Sentinel-1 InSAR and GNSS Time-Series Along the San Andreas Fault System. J. Geophys. Res. Solid Earth 2021, 126, e2021JB022579. [Google Scholar] [CrossRef]
  25. Stephenson, O.L.; Liu, Y.K.; Yunjun, Z.; Simons, M.; Rosen, P.; Xu, X. The Impact of Plate Motions on Long-Wavelength InSAR-Derived Velocity Fields. Geophys. Res. Lett. 2022, 49, e2022GL099835. [Google Scholar] [CrossRef]
  26. Hussain, E.; Wright, T.J.; Walters, R.J.; Bekaert, D.P.S.; Lloyd, R.; Hooper, A. Constant strain accumulation rate between major earthquakes on the North Anatolian Fault. Nat. Commun. 2018, 9, 1392. [Google Scholar] [CrossRef] [PubMed]
  27. Jolivet, R.; Simons, M.; Agram, P.S.; Duputel, Z.; Shen, Z.K. Aseismic slip and seismogenic coupling along the central San Andreas Fault. Geophys. Res. Lett. 2015, 42, 297–306. [Google Scholar] [CrossRef]
  28. Wang, M.; Shen, Z.-K. Present-Day Crustal Deformation of Continental China Derived from GPS and Its Tectonic Implications. J. Geophys. Res. Solid Earth 2020, 125, e2019JB018774. [Google Scholar] [CrossRef]
  29. Liang, S.; Gan, W.; Shen, C.; Xiao, G.; Liu, J.; Chen, W.; Ding, X.; Zhou, D. Three-dimensional velocity field of present-day crustal motion of the Tibetan Plateau derived from GPS measurements. J. Geophys. Res. Solid Earth 2013, 118, 5722–5732. [Google Scholar] [CrossRef]
  30. Wnuk, K.; Zhou, W.; Gutierrez, M. Mapping Urban Excavation Induced Deformation in 3D via Multiplatform InSAR Time-Series. Remote Sens. 2021, 13, 4748. [Google Scholar] [CrossRef]
  31. Xi, C.; Wang, L.; Zhao, X.; Sun, Z.; Zhao, W.; Pang, M.; Wu, F. A simple weighting method for inverting earthquake source parameters using geodetic multisource data under Bayesian algorithm. Geophys. J. Int. 2024, 237, 1142–1156. [Google Scholar] [CrossRef]
  32. Neely, W.R.; Borsa, A.A.; Silverii, F. GInSAR: A Cgps Correction for Enhanced InSAR Time Series. IEEE Trans. Geosci. Remote Sens. 2019, 58, 136–146. [Google Scholar] [CrossRef]
  33. Soldato, M.D.; Confuorto, P.; Bianchini, S.; Sbarra, P.; Casagli, N. Review of Works Combining GNSS and InSAR in Europe. Remote Sens. 2021, 13, 1684. [Google Scholar] [CrossRef]
  34. Liu, Y.; Yang, H.; Wang, S.; Xu, L.; Peng, J. Monitoring and Stability Analysis of the Deformation in the Woda Landslide Area in Tibet, China by the DS-InSAR Method. Remote Sens. 2022, 14, 532. [Google Scholar] [CrossRef]
  35. Kao, H.; Hyndman, R.; Jiang, Y.; Visser, R.; Smith, B.; Mahani, A.B.; Leonard, L.; Ghofrani, H.; He, J. Induced Seismicity in Western Canada Linked to Tectonic Strain Rate: Implications for Regional Seismic Hazard. Geophys. Res. Lett. 2018, 45, 11–104. [Google Scholar] [CrossRef]
  36. Fang, J.; Wright, T.J.; Johnson, K.M.; Ou, Q.; Styron, R.; Craig, T.J.; Elliott, J.R.; Hooper, A.; Zheng, G. Strain Partitioning in the Southeastern Tibetan Plateau From Kinematic Modeling of High-Resolution Sentinel-1 InSAR and GNSS. Geophys. Res. Lett. 2024, 51, e2024GL111199. [Google Scholar] [CrossRef]
Figure 1. Technical flow chart. The processing flow is mainly divided into four parts: data preparation, along-track mosaic, cross-track mosaic and related product generation. The data preparation stage involves preprocessing GNSS data and InSAR image data. The stages of rail inlaying and horizontal rail inlaying describe the specific flow of the inlaying process. The related products include those for 3D surface deformation inversion using the LOS deformation velocity fields of ascending and descending tracks, as well as the calculation of surface strain rates.
Remotesensing 17 01804 g001
Figure 2. Overview map of the study area. Subfigure a shows the spatial distribution of InSAR tracks in the study area. Among them, the red frame represents the ascending tracks, and each subbox represents an observation frame. Similarly, the blue frame represents the descending tracks, and each subframe also represents an observation frame. Subgraphs (b,c) respectively show the observation frames corresponding to the ascending tracks, where the blue area represents the overlapping area of the data along the tracks and across the tracks. Subgraphs (d,e) respectively correspond to the observation frames of the descending tracks, where the red area also represents the overlapping area of the data along the tracks and across the tracks. In the lower right corner of the image, the small globe with a red box indicates the geographical location of the study area, which corresponds to the range shown in subfigure (a).
Remotesensing 17 01804 g002
Figure 3. Plot of deformation values in overlapping areas before and after mosaicking along the track. Different frames are distinguished by different colors, and the overlapping parts are marked with red frames. The blue line on the left represents the cross-sectional value of frame A, and the orange line represents the cross-sectional value of frame B. The blue dotted line on the right represents the deformation value distribution of frame A in the overlapping area, while the orange line represents the deformation value distribution of frame B in the overlapping area. The black line segments represent the cross-sectional values after the mosaic has been completed.
Remotesensing 17 01804 g003
Figure 4. Plot of deformation values in overlapping areas before and after mosaicking across the tracks. Different frames are distinguished by different colors, and the overlapping parts are marked with red frames. The green line on the left represents the cross-sectional value of track A, and the purple line represents the cross-sectional value of track B. The green dotted line on the right represents the deformation value distribution of track A in the overlapping area, while the purple line represents the deformation value distribution of track B in the overlapping area.
Remotesensing 17 01804 g004
Figure 5. InSAR LOS image mosaic technology comparison: Along-track and Along+Cross track. Subfigures (a,b,d,e), respectively, show the ascending and descending LOS velocity fields processed by the Along method and the Along+Cross method, where the black circles indicate the locations used for cross-verification of GNSS stations. Subfigures (c,f) are projections comparing the LOS velocity field data with the GNSS observation data.
Remotesensing 17 01804 g005
Figure 6. RMSE plot of Along-track mosaicking and Along+Cross track mosaicking compared with GNSS data. The horizontal axis represents the comparison cluster of InSAR with different tracks, where blue represents the results using only Along-track mosaicking and orange represents the results using Along+Cross track mosaicking. The vertical axis represents the RMSE value compared to the GNSS data.
Remotesensing 17 01804 g006
Figure 7. The 2D velocity fields were processed Along-track and Along+Cross track (subfigures (a,b,d,e). Subfigures (c,f) represent the differences between the two mosaics in Ve and Vu. The deformation to the east and north was positive.
Remotesensing 17 01804 g007
Figure 8. In the overlapping region along the track, a statistical comparison was conducted between the deformation of the original frame and that of the Along-track and Along+Cross track mosaics. The GNSS2LOS in subfigures (c,d) represents the data projected by GNSS onto the LOS plane. Subfigure (a) shows the spatial distribution of two adjacent frames along the track (128A_05172 and 128A_05371). The red box indicates their overlapping area. Subfigure (b1) displays the LOS velocity field for the overlapping area of the northern frame (128A_05172), while subfigure (b2) shows the LOS velocity field for the overlapping area of the southern frame (128A_05371).
Remotesensing 17 01804 g008
Figure 9. In the overlapping region across the tracks, a statistical comparison was conducted between the deformations of the Along-track and Along+Cross track mosaics. The GNSS2LOS in subfigures (c,d) represents the data projected by GNSS onto the LOS plane. Subfigure (a) shows the spatial distribution of two adjacent tracks (033D and 135D). The red box indicates their overlapping area. Subfigure (b1) displays the LOS velocity field for the overlapping area of the western track (033D), while subfigure (b2) shows the LOS velocity field for the overlapping area of the eastern track (135D).
Remotesensing 17 01804 g009
Figure 10. Analysis of the impact of cross-track mosaicking methods on the LOS velocity field of Track 062D under significant bilateral overlap area differences. Subfigure (a) displays the results obtained using relative displacement field integration for LOS refinement, where distinct step-like artifacts are evident along the left boundary (103.5° E, 36.5° N). In contrast, subfigure (b) shows the results derived solely from GNSS interpolation with orbit correction, which does not exhibit such artifacts.
Remotesensing 17 01804 g010
Figure 11. InSAR strain rate parameter comparison: Along-track and Along+Cross track methods. Subfigures (ac) present the second invariant of horizontal strain tensor and its components derived using along-track mosaicking processing of LOS velocity frames, specifically showing (a) the second invariant, (b) horizontal dilatation rate, and (c) maximum shear rate. Subfigures (df) display corresponding results obtained through combined along-track and cross-track mosaicking processing, showing (d) the second invariant, (e) horizontal dilatation rate, and (f) maximum shear rate respectively.
Remotesensing 17 01804 g011
Figure 12. The cross-validation results of 135D_05222 frame and 135D_05421 frame with GNSS data. Subfigures (a,b) display cross-validation with GNSS data for frames 135D_05222 and 135D_05421, respectively. In both panels, measurement configurations are distinguished by: blue circles = original observation frame data, orange squares = combined along-track and cross-track mosaicking processing results, and green triangles = along-track mosaicking processing results.
Remotesensing 17 01804 g012
Disclaimer/Publisher’s Note: The statements, opinions and data contained in all publications are solely those of the individual author(s) and contributor(s) and not of MDPI and/or the editor(s). MDPI and/or the editor(s) disclaim responsibility for any injury to people or property resulting from any ideas, methods, instructions or products referred to in the content.