Article

Multi-Source DEM Vertical Accuracy Evaluation of Taklimakan Desert Hinterland Based on ICESat-2 ATL08 and UAV Data

1
College of Geography and Remote Sensing Sciences, Xinjiang University, Urumqi 830046, China
2
Institute of Desert Meteorology, China Meteorological Administration, Urumqi 830002, China
3
Xinjiang Key Laboratory of Desert Meteorology and Sandstorm, Urumqi 830002, China
4
Taklimakan Desert Meteorology Field Experiment Station, China Meteorological Administration, Urumqi 830002, China
5
National Observation and Research Station of Desert Meteorology, Taklimakan Desert of Xinjiang, Urumqi 830002, China
*
Author to whom correspondence should be addressed.
Remote Sens. 2025, 17(11), 1807; https://doi.org/10.3390/rs17111807
Submission received: 20 February 2025 / Revised: 9 May 2025 / Accepted: 16 May 2025 / Published: 22 May 2025

Abstract

:
In earth science research, digital elevation models (DEMs) serve as essential tools for acquiring terrain information. However, existing research has primarily focused on geomorphic units like mountainous and forested regions, while research on extreme desert environments remains relatively scarce. This study systematically evaluates the vertical accuracy of six open-access DEMs in the hinterland of the Taklimakan Desert using ICESat-2 ATL08 data and unmanned aerial vehicle (UAV) data. Additionally, it examines the relationship between DEM errors and terrain characteristics, including slope, aspect, and terrain relief. The results reveal that the error distribution of different DEMs in the Taklimakan Desert hinterland follows a normal distribution pattern, but significant differences exist in both the magnitude and stability of the errors. Among the evaluated DEMs, Copernicus and AW3D30s exhibit superior performance, with moderate errors and high stability, making them suitable for high-precision terrain analysis. Further analysis indicates that terrain characteristics significantly influence DEM vertical accuracy in the TD hinterland. Specifically, increasing slope leads to a notable rise in errors across all assessed DEMs, with error fluctuations becoming more pronounced when the slope exceeds 15°. While slope aspect has a relatively minor impact on errors, certain DEMs exhibit error variations in the SE and NW directions. Similarly, increasing terrain relief results in greater errors. Moreover, research has demonstrated that ICESat-2 ATL08 data can effectively validate the vertical accuracy of DEMs in desert regions, offering valuable insights for DEM selection and correction in the hinterland of the Taklimakan Desert and similar arid environments.

1. Introduction

The Taklimakan Desert (TD) is the largest desert in China and the second-largest mobile desert in the world. The surface features of this region are complex and diverse, with dunes of various shapes and forms [1]. In the study of Aeolian geomorphology and dune morphology, field measurements and DEM extraction are the primary methods for obtaining detailed information on the complex terrain of desert regions [2]. For instance, Wang et al. [3] conducted morphological analyses of dunes in the northern TD using UAV data and field surveys, revealing that the dune formations were primarily derived from local alluvial or lacustrine sediments rather than from the eastern Lop Nur region. Similarly, Dong et al. [4] established sampling areas along the desert highway in the TD and found that the average dune migration direction aligned with local wind patterns, with migration rates influenced by wind conditions and morphological measurements.
Although field observations provide accurate and intuitive terrain information, they are limited to localized terrain changes and cannot achieve comprehensive regional coverage. To address these limitations, researchers have increasingly incorporated auxiliary data such as remote sensing imagery and meteorological data. For example, Dong et al. [5] combined field surveys with satellite imagery to identify unique “rake-shaped” linear dunes almost perpendicular to the main ridge in the northern Kumtag Desert, enhancing the understanding of unusual dune morphologies. Li et al. [6] employed DEM data and Google Earth imagery, using deep-learning algorithms to accurately classify landforms in the Loess Plateau, providing insights into its terrain features and the processes driving internal geomorphological formation. Numerous scholars have employed DEM data to investigate the characteristics of desert surfaces and the processes underlying dune development. Telbisz et al. [7] analyzed four major dune pattern types and their subtypes in the northern Sahara Desert using DEM and wind data, finding that some dune types were consistent with prevailing wind conditions. Wang et al. [8] developed a dune density estimation method based on DEM and Google Earth imagery, successfully estimating dune density in the TD. Similarly, Niu et al. [9] proposed a dune height estimation algorithm using DEM data, revealing the spatial distribution of dune heights in the Badain Jaran Desert’s lake–dune system. Megahed et al. [10] utilized DEM data from SRTM and ASTER, combined with GIS techniques, to construct a risk assessment model for dune movement, evaluating the potential environmental hazards of dune migration in the El-Kharga Oasis of western Egypt. Daynac et al. [11] proposed a method for mapping dune features—such as profiles, crests, and defects—leveraging DEMs and convolutional neural networks (CNNs). Experimental results from the Rub’ al Khali desert indicate that this method exhibits strong morphological analysis capabilities. Trevisani et al. [12] introduced a simplified geostatistical approach for the multi-scale analysis of surface roughness aimed at understanding and monitoring topographical factors. This method effectively characterizes isotropic roughness and roughness anisotropy over short ranges, employing straightforward scaling techniques for multi-scale analysis. Shumack et al. [13] developed a linear-dune landform classification method utilizing AW3D30 data and deep learning (U-Net). Experimental results from the Simpson Desert dune field demonstrate that this method effectively analyzes regional-scale dune patterns. White et al. [14] employed ASTER global digital elevation model (GDEM) data to compare the morphological relationships between dune fields in the southwestern Kalahari of South Africa and the Namib Sand Sea. They identified significant morphological differences between the two regions, with distinct spatial variations in morphological data.
The scarcity of terrain data in desert regions is largely attributable to the limitations of field measurement methods, restricted field observations, and the accuracy of DEM data. Over the past two decades, satellite altimetry has been widely used to monitor surface elevations of glaciers, oceans, lakes, and large inland water bodies. Compared to traditional measurement methods, satellite altimetry offers extensive spatial and temporal coverage, reducing the time and cost of data collection and providing a new perspective for monitoring dune migration. For example, Desroches et al. [15] demonstrated that surface water and ocean topography (SWOT) altimetry imagery exhibits strong coherence over dunes, enabling dune migration monitoring through SWOT’s high temporal revisit rate and accuracy. Xu et al. [16] proposed a method for reconstructing intertidal dune topography by integrating ICESat-2 altimetry data with Sentinel-2 optical imagery, accurately retrieving intertidal dune morphology and offering a potential approach for developing integrated global land–sea topography. Ding et al. [17] combined optical imagery, synthetic aperture radar (SAR) offset tracking, and small baseline subset interferometric SAR (InSAR) techniques to quantify dune migration from multiple dimensions, including east–west, north–south, slant range, azimuth, and coherence. They found that feather-like dunes migrated and aligned with prevailing wind directions, with significant spatial heterogeneity in migration rates across different dunes. Li et al. [18] developed a method for estimating the height of low and sparse vegetation in desert ecosystems using ICESat-2 data, which was validated in the Arizona desert, demonstrating its feasibility for extracting vegetation height in arid regions. Rehman et al. [19] highlighted ICESat-2′s ability to provide high-resolution terrain details in desert environments, enhancing the understanding of Aeolian processes compared to traditional DEM methods. In recent years, ICESat-2 data have also provided new perspectives and methods for DEM accuracy assessments, advancing terrain research. For instance, Dandabathula et al. [20] evaluated elevation accuracy in the High Mountain Asia (HMA) region using ICESat-2 photons and found that seasonal snow cover variations contributed to significant elevation estimation errors. Narin et al. [21] compared ICESat-2 and global ecosystem dynamics investigation (GEDI) data with global DEMs (e.g., SRTM, ASTER-GDEM, and ALOS World3D), finding that ICESat-2 achieved comparable point accuracy to other global DEMs and that DEMs combining ICESat-2 and GEDI data outperformed others in terms of accuracy.
In summary, ICESat-2 data exhibit significant potential for DEM vertical accuracy assessments, but their precision is notably influenced by factors such as terrain, vegetation cover, and data registration [22]. Existing studies have primarily focused on forested or moderate terrain regions, with limited systematic evaluations of extreme environments such as deserts. UAV data, with their high spatial resolution and flexibility, provide an important supplement for assessing DEM vertical accuracy in extreme environments like deserts [23]. Therefore, this study utilizes ICESat-2 ATL08 and UAV data to evaluate the accuracy of six commonly used DEMs in the hinterland of TD, quantitatively assessing the accuracy of terrain mapping in desert regions. This research aims to provide a more comprehensive characterization of desert geomorphology, supporting desertification control, ecological protection, and resource development.

2. Materials and Methods
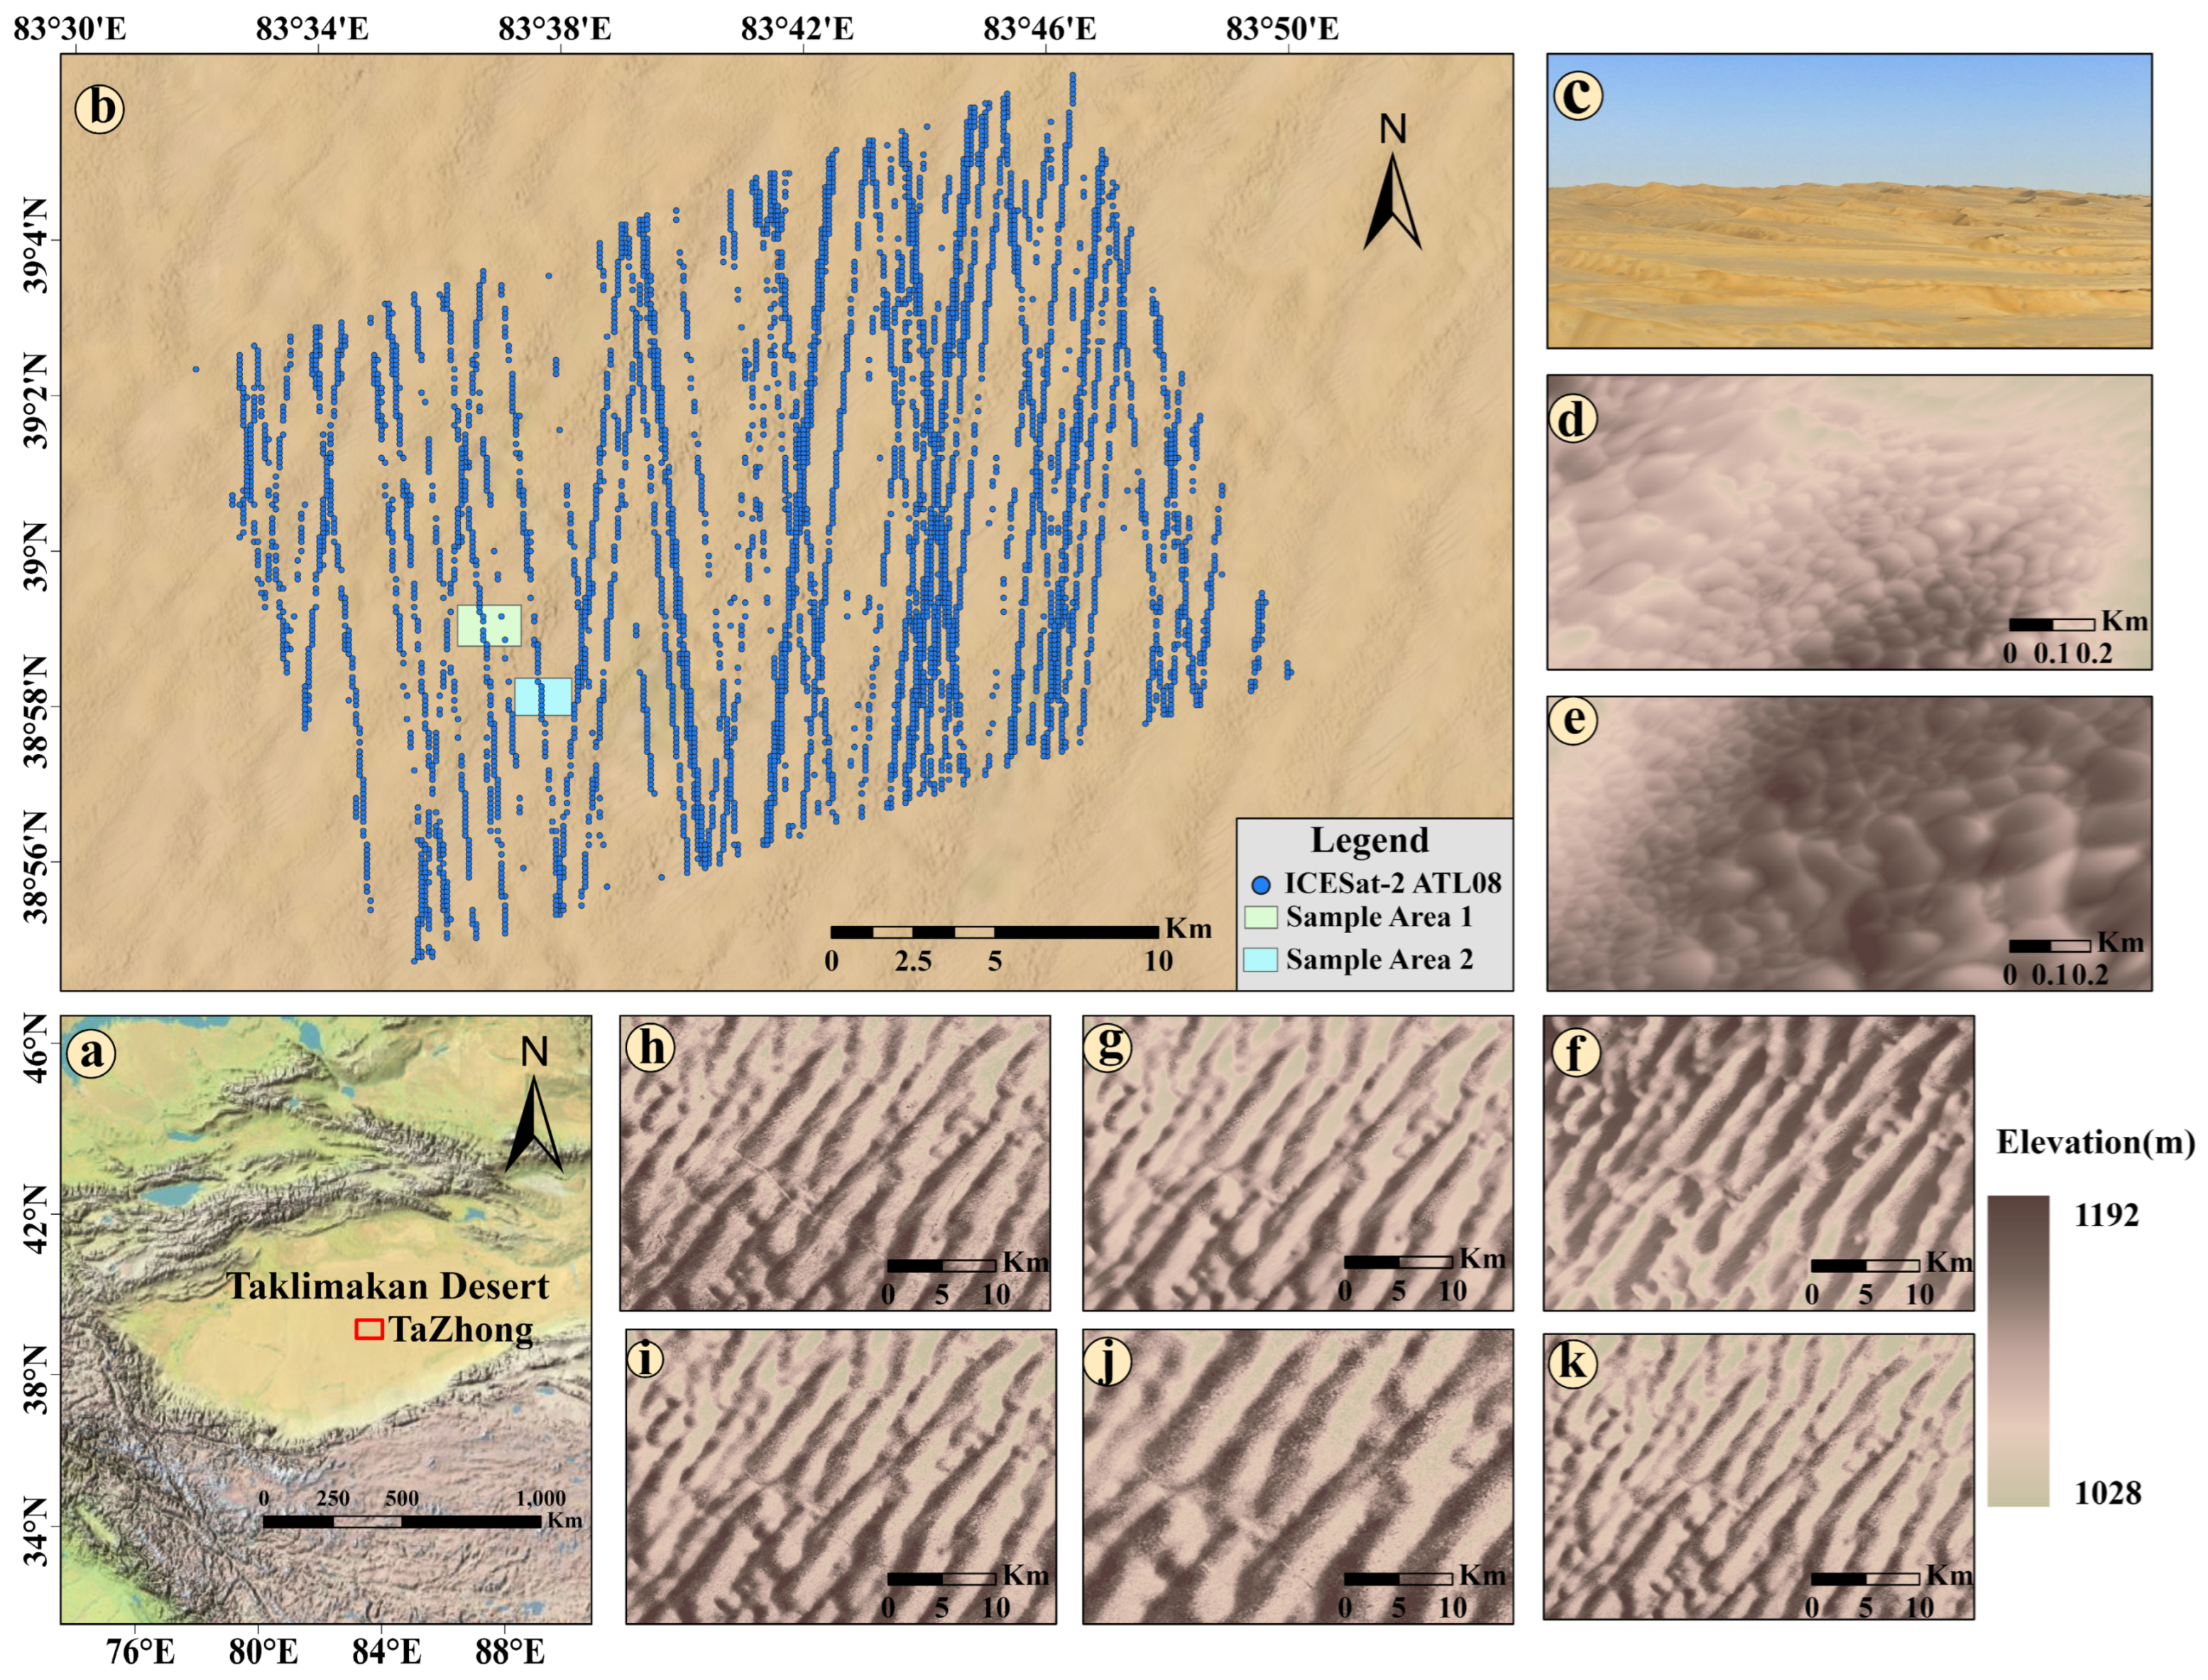
2.1. Study Area

The study area is in Tazhong in the center of Tarim Basin, which extends 200 km into the heart of the desert (Figure 1a). The underlying surface of the study area is characterized by extremely sparse vegetation resources, predominantly consisting of contiguous shifting dunes. The sand particles are fine, lightweight, and highly mobile [24]. The primary dune type in this region is the compound longitudinal dune (Figure 1c), which is topped with various secondary dunes of differing shapes (Figure 1d,e). The dune topography within the study area is characterized by continuous undulation, with average height differences of 3 to 20 m and average spacings of 100 m between the dunes. The interdune areas range from 1 to 3 km in width and feature a variety of dune forms, including dune chains, crescent-shaped dunes, and small sand ridges [25,26].

2.2. Data

This study primarily utilizes six DEM datasets: ALOS PALSAR, AW3D30, Copernicus, SRTM v3, NASADEM, and ASTER GDEM V3. The reference data consists of ICESat-2 ATL08 and UAV photogrammetry-derived DEM data. Table 1 details the specific parameters of these datasets.

2.2.1. ICESat-2 ATL08 Data

In September 2018, NASA launched the ICESat-2 satellite, which utilizes emitted laser photons to obtain information on elevation changes of glaciers and ice sheets in mountainous regions, as well as measurements of land and vegetation heights, inland water elevations, sea surface heights, and cloud and optical thickness [27]. The laser footprint spacing along the satellite’s track is approximately 0.7 m, with a footprint diameter of about 17 m, and the elevation measurement accuracy is around 0.1 m [28]. For this study, we selected 72 Level 3 ATL08 datasets collected on various dates between 28 October 2018 and 17 July 2024 (https://search.earthdata.nasa.gov, accessed on 13 December 2024), resulting in the preliminary identification of 9357 photon footprint points within the study area.

2.2.2. UAV Data

On 9 April 2024, this study conducted surface data collection in the central TD using a DJI Mavic 3M drone (manufactured in Shenzhen, China), selecting an area on both sides of a sand ridge as the study site. The DJI Mavic 3M is equipped with advanced RTK modules, achieving centimeter-level high-precision positioning and microsecond-level synchronization with flight control and camera systems, ensuring image-free aerial surveys. In terms of positioning accuracy, the horizontal accuracy of the RTK module can reach 1 cm ± 1 ppm, and the vertical accuracy can reach 1.5 cm ± 1 ppm in a fixed solution (https://ag.dji.com/cn/mavic-3-m/specs, accessed on 20 March 2025). However, after our processing, we found that the actual vertical error is 0.3 m, and the total error is 0.36 m.
The drone data consists of two sets of photographs corresponding to two research sample areas. All images were obtained using the DJI Mavic 3M drone. The fundamental details of the drone system and flight parameters are as follows: the flight altitude was 80 m, the flight speed was 5 m per second, the side overlap was 70%, and the front overlap was 80%. The photo mode employed timed interval shots, with shutter speeds ranging from 1/320 to 1/800 s and ISO values between 100 and 200 (depending on lighting conditions). The image pixel size was 2.42 cm × 2.42 cm.
For Sample Area 1, the flight line length was 28.09 km, encompassing an area of 1.04 km2 and resulting in 1543 sets of photographs, with a flight task duration of approximately 40 min. For Sample Area 2, the flight line length was 27.40 km, covering an area of 1.02 km2, and yielding 1537 sets of photographs, with a flight task duration of approximately 36 min. After the missions were completed, the data were processed using AgiSoft MetaShape V2.0.2 software (https://www.agisoft.com, accessed on 3 June 2024), resulting in a UAV-DEM with a resolution of 0.1 m. The spatial extent of processed Sample Area 1 was 963 m × 1162 m, while Sample Area 2 had a range of 1030 m × 1025 m.

2.2.3. DEM Data

The Copernicus DEM, released by the European Space Agency (ESA), offers an elevation accuracy of 4 m [29]. Among the global open-access DEM products, Copernicus has high accuracy in both plane and elevation and is known as the best global open-access DEM currently available [30]. This study employs the 30 m resolution DEM (Figure 1f, https://dataspace.copernicus.eu, accessed on 13 December 2024).
AW3D30 is produced from approximately 3 million optical stereo images collected by the panchromatic stereo mapping sensor PRISM on Japan’s ALOS-1 satellite, with a resolution of 2.5 m and an elevation RMSE of about 4.4 m [31]. AW3D30 DEM data has undergone several updates, including corrections for cloud and snow, adjustments for absolute offset errors, and filling of data voids [18]. Strictly speaking, AW3D30 should be classified as a global digital surface model (DSM). However, since our research area is a desert with no vegetation or building distribution, we refer to it as a digital elevation model (DEM) in this study. This study utilizes version 3.2, published in February 2022 (as shown in Figure 1g, https://www.eorc.jaxa.jp/ALOS/en/aw3d30/data/index.htm, accessed on 13 December 2024).
ASTER GDEM v3 is produced from 1.88 million optical stereo images collected by the ASTER sensor on the Terra satellite between 2000 and 2013, offering a resolution of 15 m. It covers all land areas within the latitudes of 83°N and 83°S, accounting for 99% of the global land area, with an elevation accuracy of approximately 8.5 m [32]. This study utilizes the third version of that data (Figure 1h, https://lpdaac.usgs.gov/products/astgtmv003, accessed on 13 December 2024).
SRTM v3 is derived from C-band interferometric radar data collected during the Shuttle Radar Topography Mission, covering terrestrial areas between 60°N and 56°S latitude, with an elevation accuracy of approximately 9 m [33]. This study uses the global 30 m resolution product released in 2015 (as shown in Figure 1i, https://lpdaac.usgs.gov/products/srtmgl1v003, accessed on 13 December 2024).
NASADEM is the successor to SRTM v3, with elevation corrections and void filling performed by NASA’s Jet Propulsion Laboratory (JPL) in 2020 [34]. This study utilizes the updated data released in 2020 (as shown in Figure 1j, https://lpdaac.usgs.gov/products/nasadem_hgtv001, accessed on 13 December 2024).
Japan’s Advanced Land Observing Satellite (ALOS) conducted extensive all-weather observations from 2006 to 2011, providing data that can be utilized to generate DEMs with a resolution of 12.5 m [35]. For this study, the data were sourced from NASA’s Earth Science data website (as shown in Figure 1k, https://www.earthdata.nasa.gov, https://www.earthdata.nasa.gov, accessed on 13 December 2024).

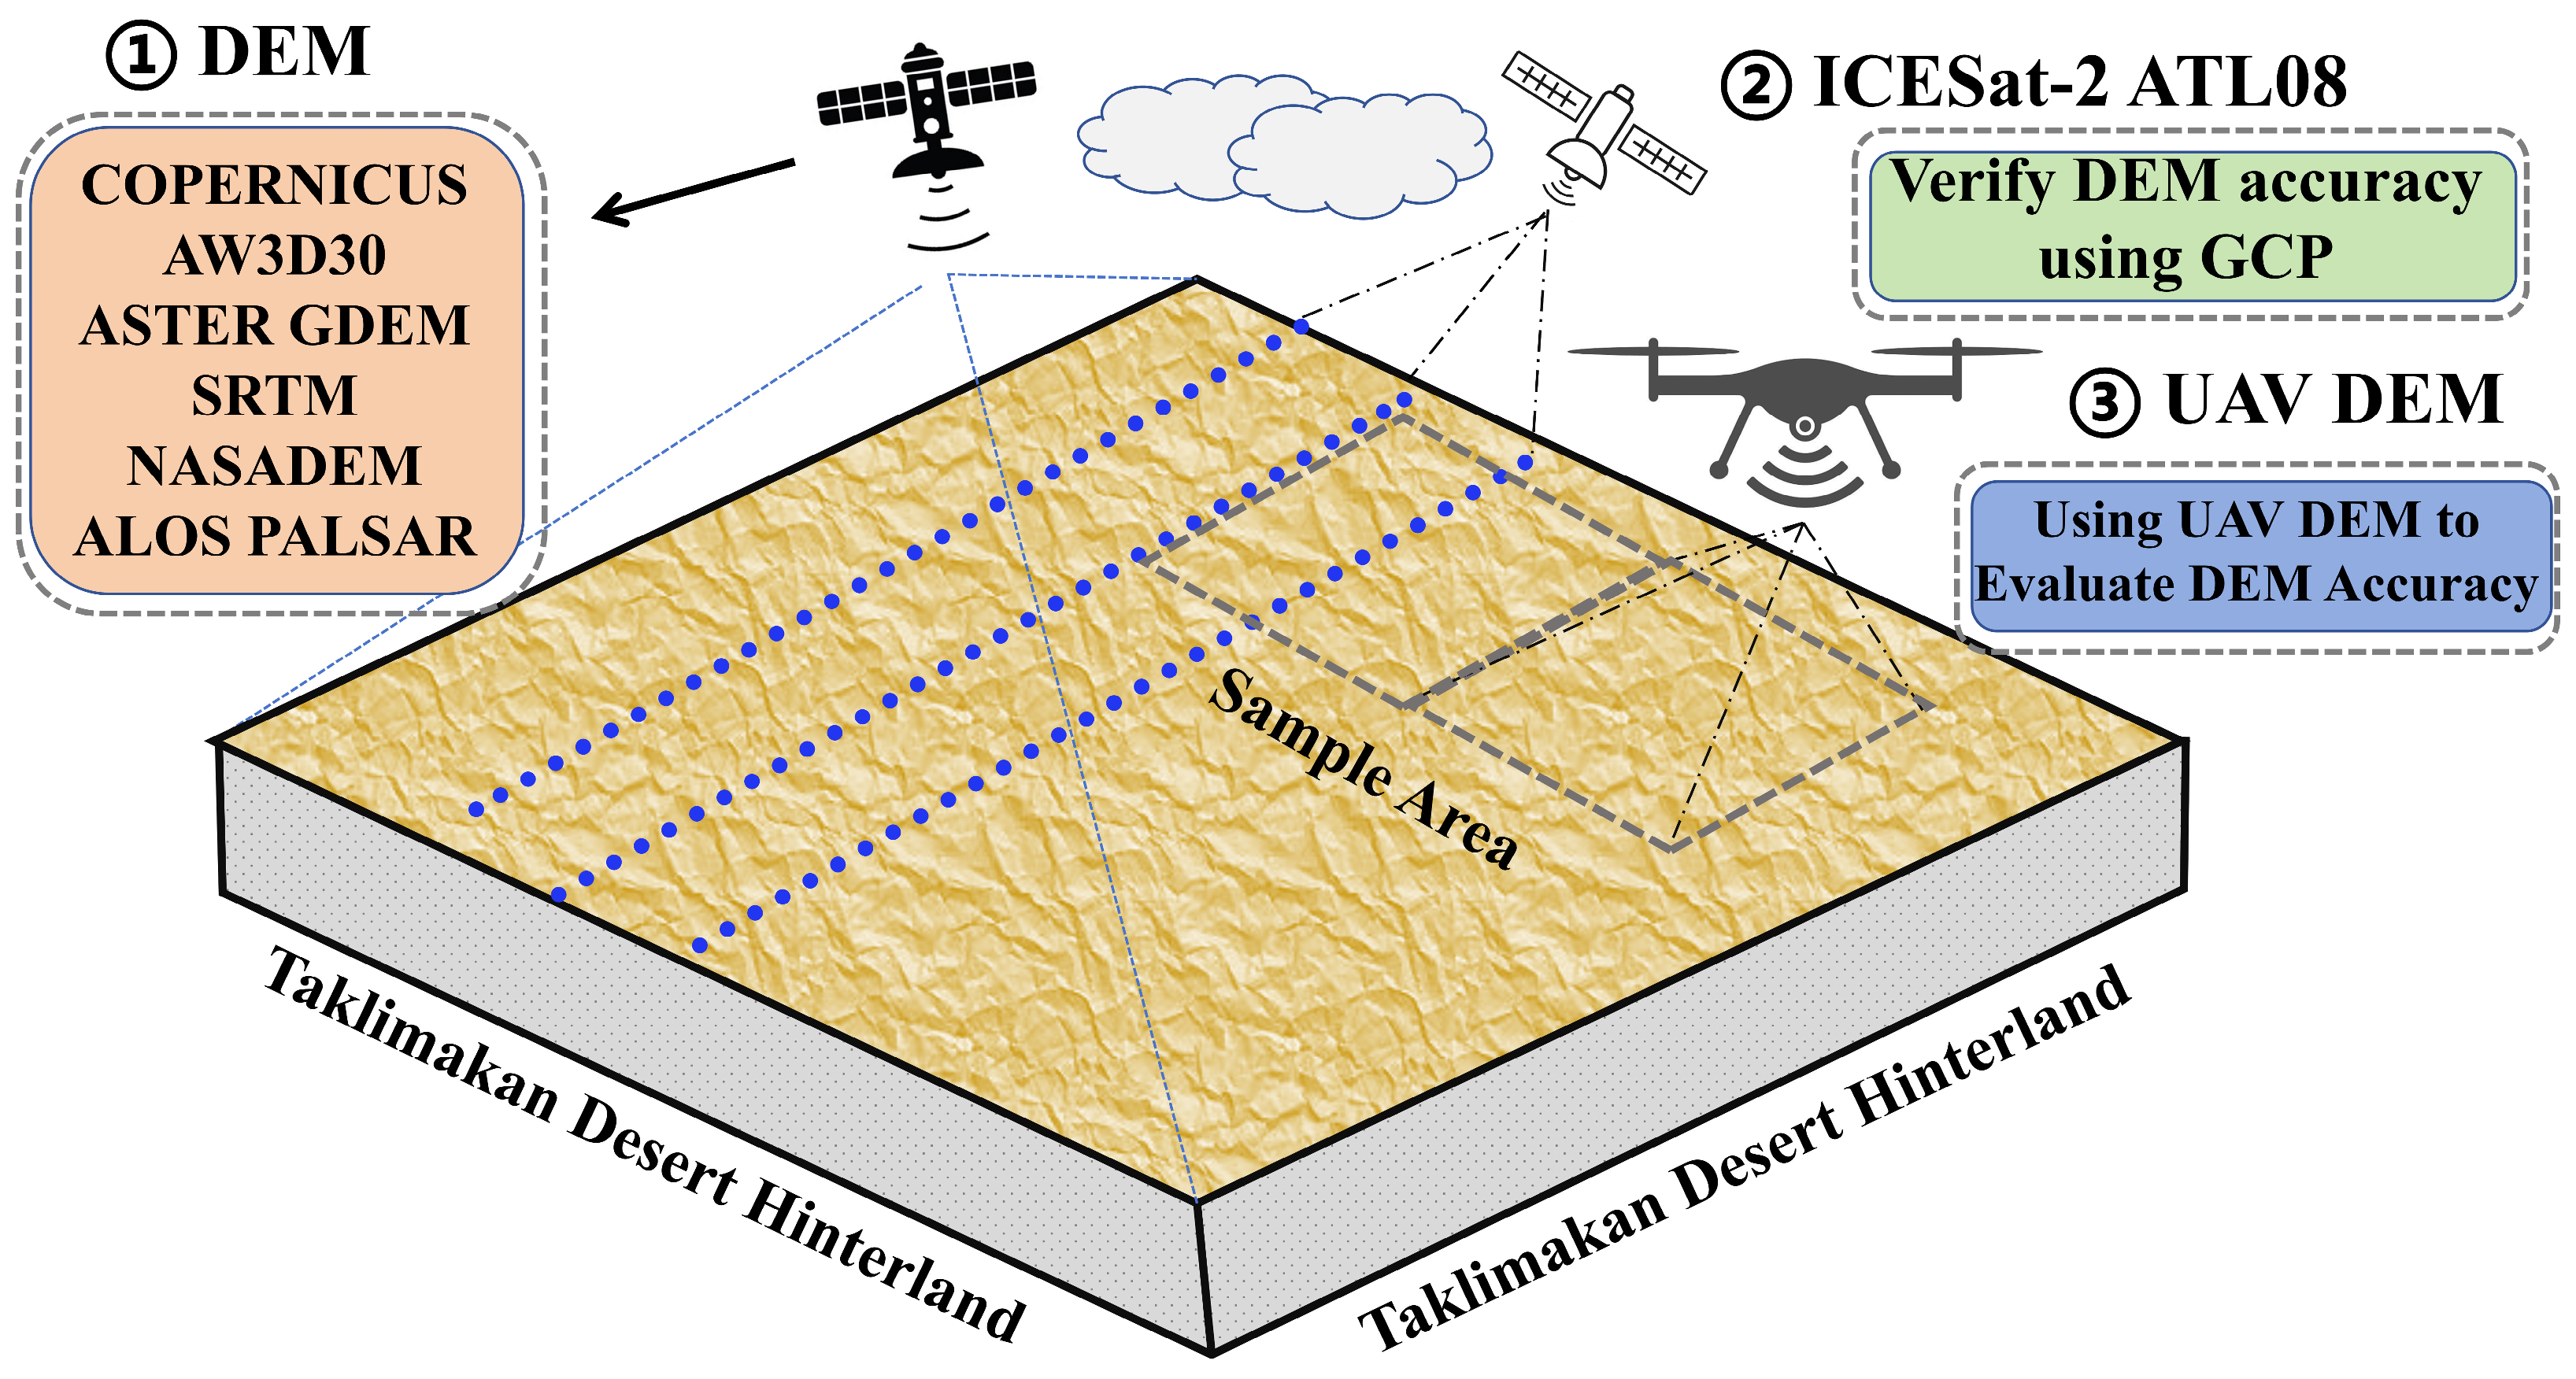
2.3. Research Method

The main workflow of this study is illustrated in Figure 2. Firstly, the DEM data is transformed into a vertical coordinate system, and then ArcGIS 10.8 software (https://desktop.arcgis.com, accessed on 21 June 2023) is used to calculate the slope, aspect, and terrain relief. Next, the ICESat-2 ATL08 data are preprocessed to extract the ground control points (GCPs). Subsequently, bilinear interpolation is used to resample the UAV-DEM to match its resolution with the DEM. Finally, the extracted control points and UAVDEM are used to evaluate the six DEMs in the TD quantitatively.

2.3.1. ICESat-2 ATL08 Data Preprocessing

The preprocessing of ICESat-2 ATL08 data consists of two steps: the removal of outliers and the conversion of the vertical reference frame. Following the multi-parameter joint extraction method for elevation control points based on ICESat-2 ATL08 data proposed by Zheng et al. [36], an initial screening is conducted using indicators such as slope, cloud cover, signal-to-noise ratio, and acquisition time. Additionally, using ALOS PALSAR data as a reference, the height difference (Dh) between the control point GCPs and the ALOS PALSAR dataset is calculated, allowing for the removal of GCPs with Dh values exceeding ±100, which are considered of lower quality. Due to the inconsistent overpass times of different footprint points, the elevations for points with multiple overpass times are averaged, resulting in a final selection of 5553 usable datasets.
Due to the discrepancies in vertical reference frames between ICESat-2 ATL08 data and DEM data, significant errors can arise. Thus, establishing a unified vertical reference frame is essential. We utilize the vertical benchmark conversion tool VDATUM V4.7 (https://vdatum.noaa.gov, accessed on 19 December 2024), developed by the National Oceanic and Atmospheric Administration (NOAA), to convert the vertical benchmarks from EGM2008 and WGS84 to EGM96. This transformation facilitates the alignment of the vertical benchmarks across the two datasets, thereby minimizing errors [37]. The formula for vertical datum conversion is as follows:
H E G M 96 = H E G M 2008 / W G S 84 N
N is the difference in elevation between the two vertical reference frames, which can be derived from the VDATUM tool.

2.3.2. DEM Data Processing

We use VDATUM to set the vertical reference system of six DEMs as EGM96. After unifying the vertical reference system, we use ArcGIS 10.8 to calculate the slope, aspect, and terrain relief of the DEM data, with window sizes of 3 × 3. Terrain relief refers to the difference in height between the highest and lowest points within a range of 3 × 3 in size.
T e r r a i n   r e l i e f = D E M m a x D E M m i n
For UAV-DEM, we resample it to a resolution of 30 m (12.5 m) using bilinear interpolation to ensure that it has the same size and resolution as the DEM to be evaluated.

2.3.3. DEM Vertical Accuracy Evaluation

To evaluate the reliability and applicability of the different DEM datasets, the errors of the six DEMs are measured using the GCPs selected from the ICESat-2 ATL08UAV-DEM. This study adopts six evaluation metrics to characterize the distribution of DEM elevation errors under the unique desert terrain characteristics in the TD hinterland. These evaluation indicators allow for a quantitative evaluation of the distribution patterns of DEM elevation errors across different topographic characteristics [38]. The evaluation indicators are shown in Table 2.

3. Results

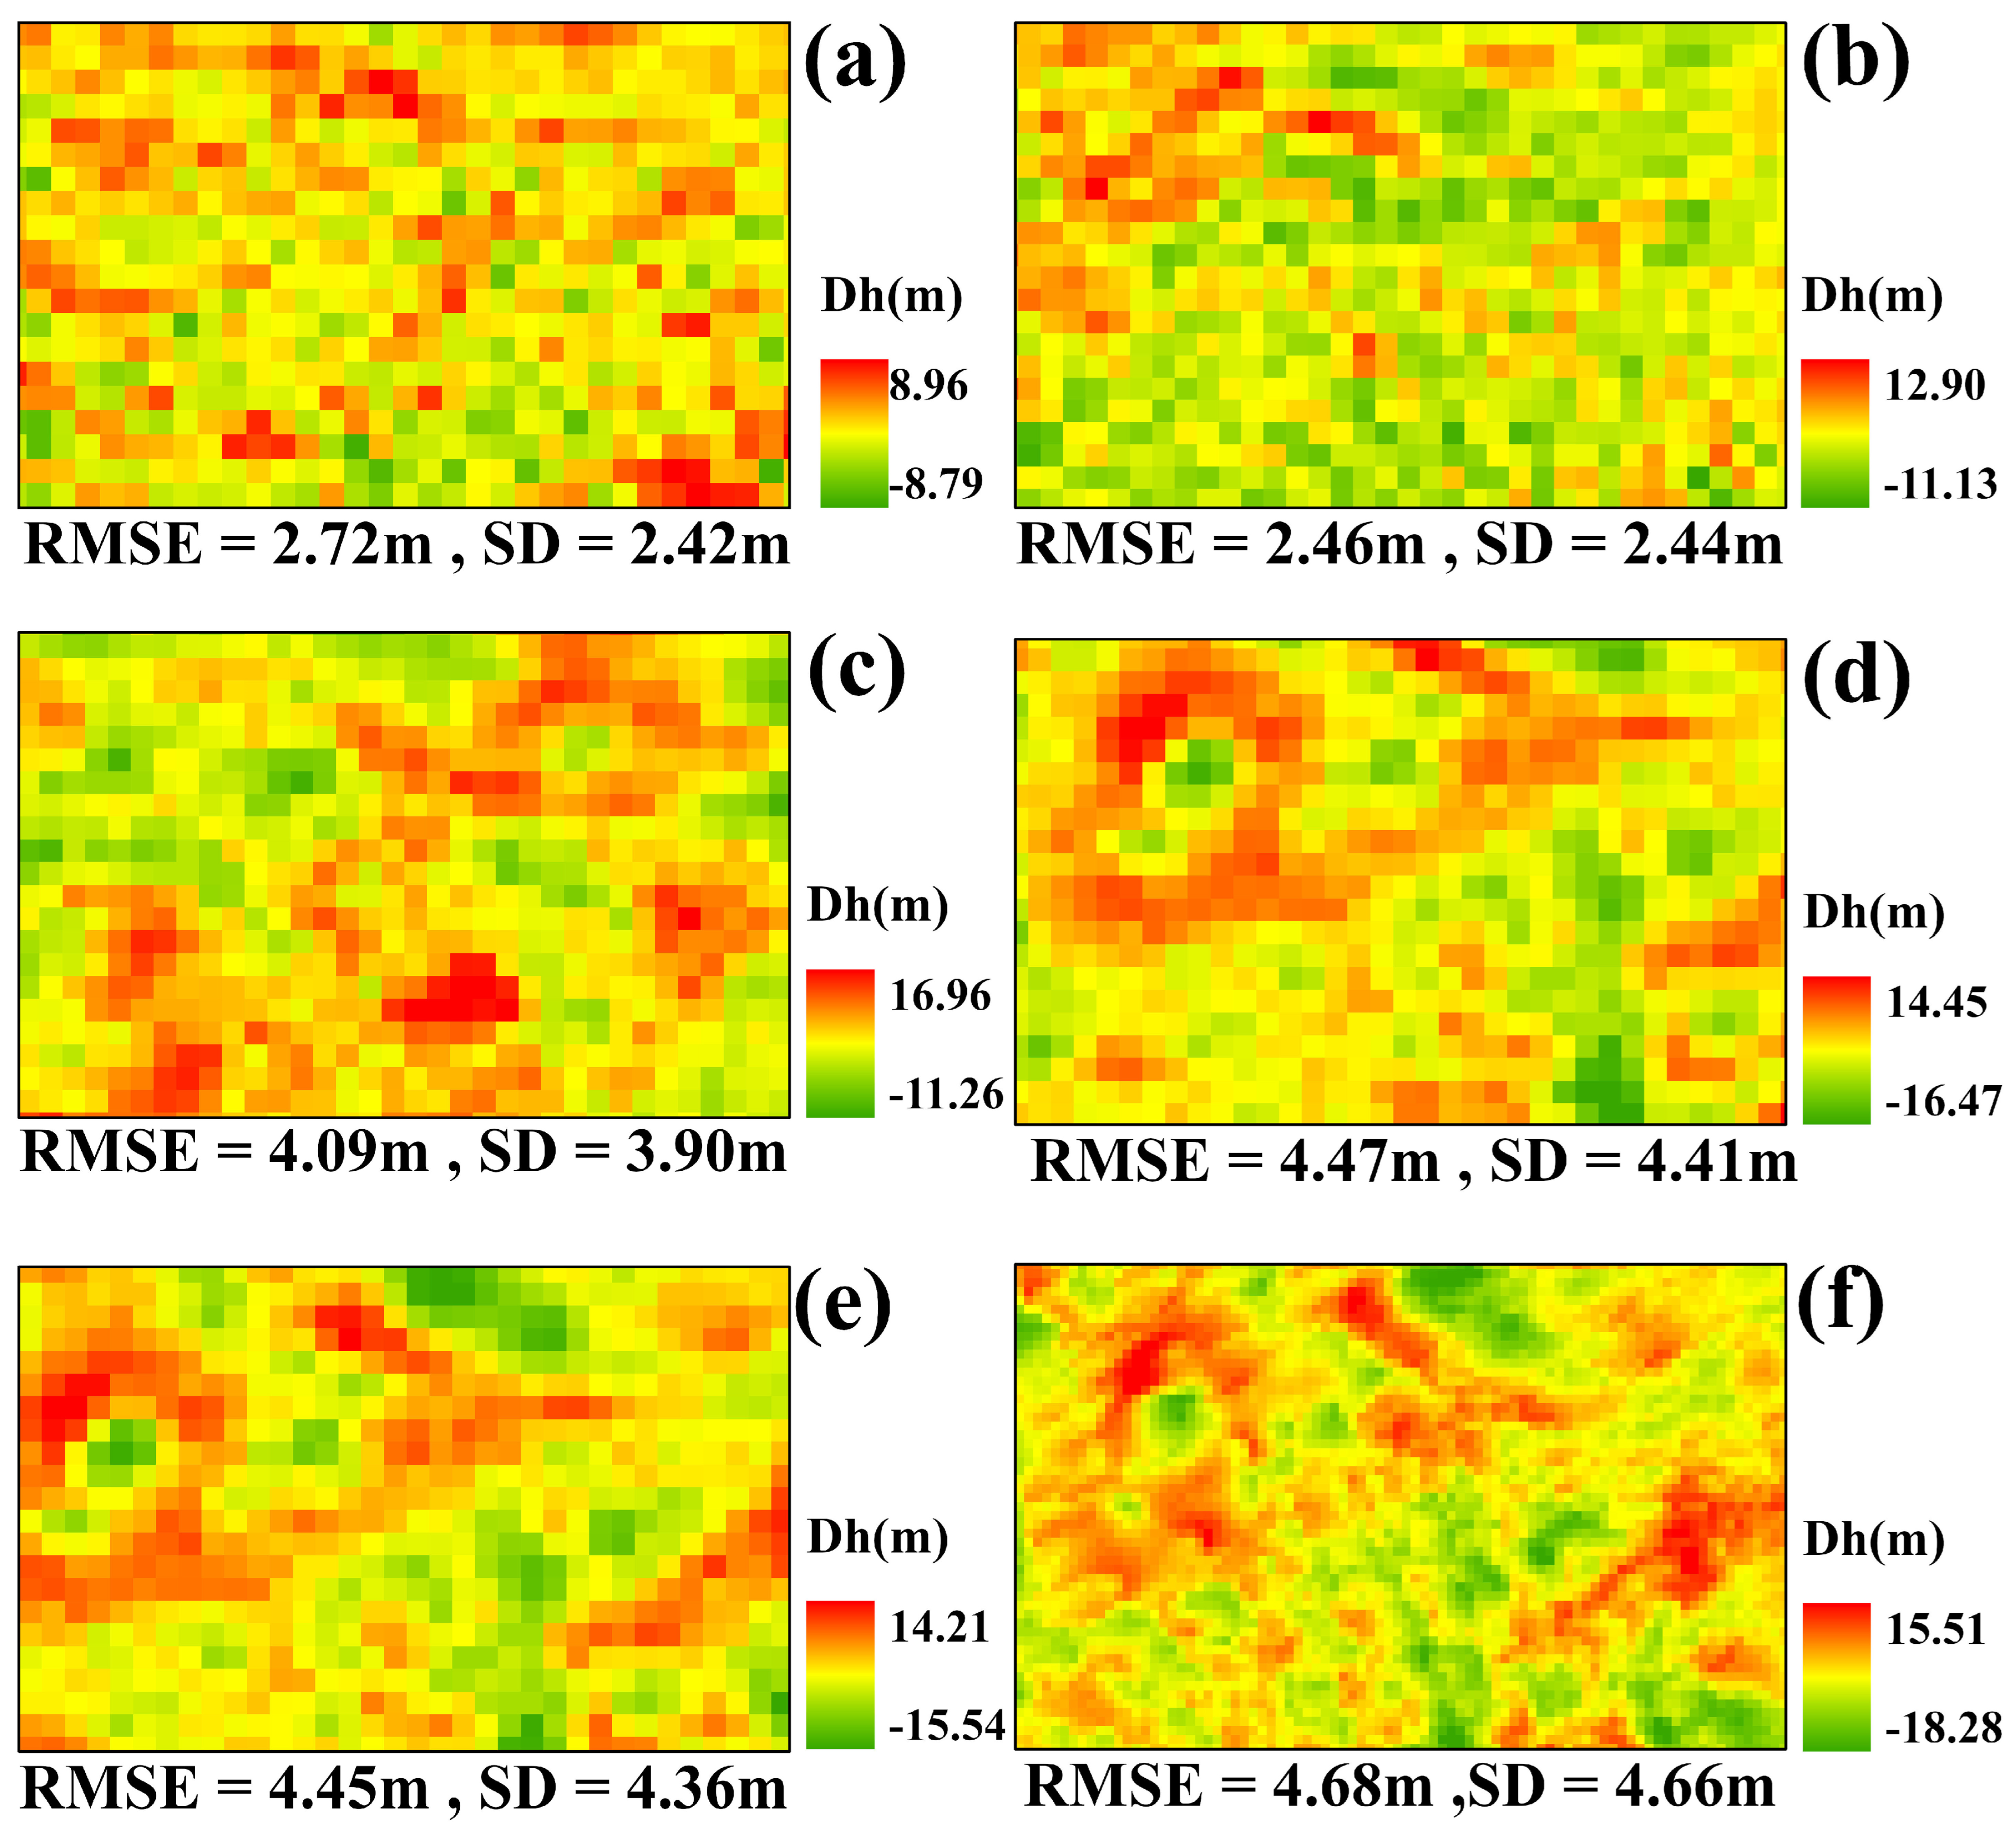
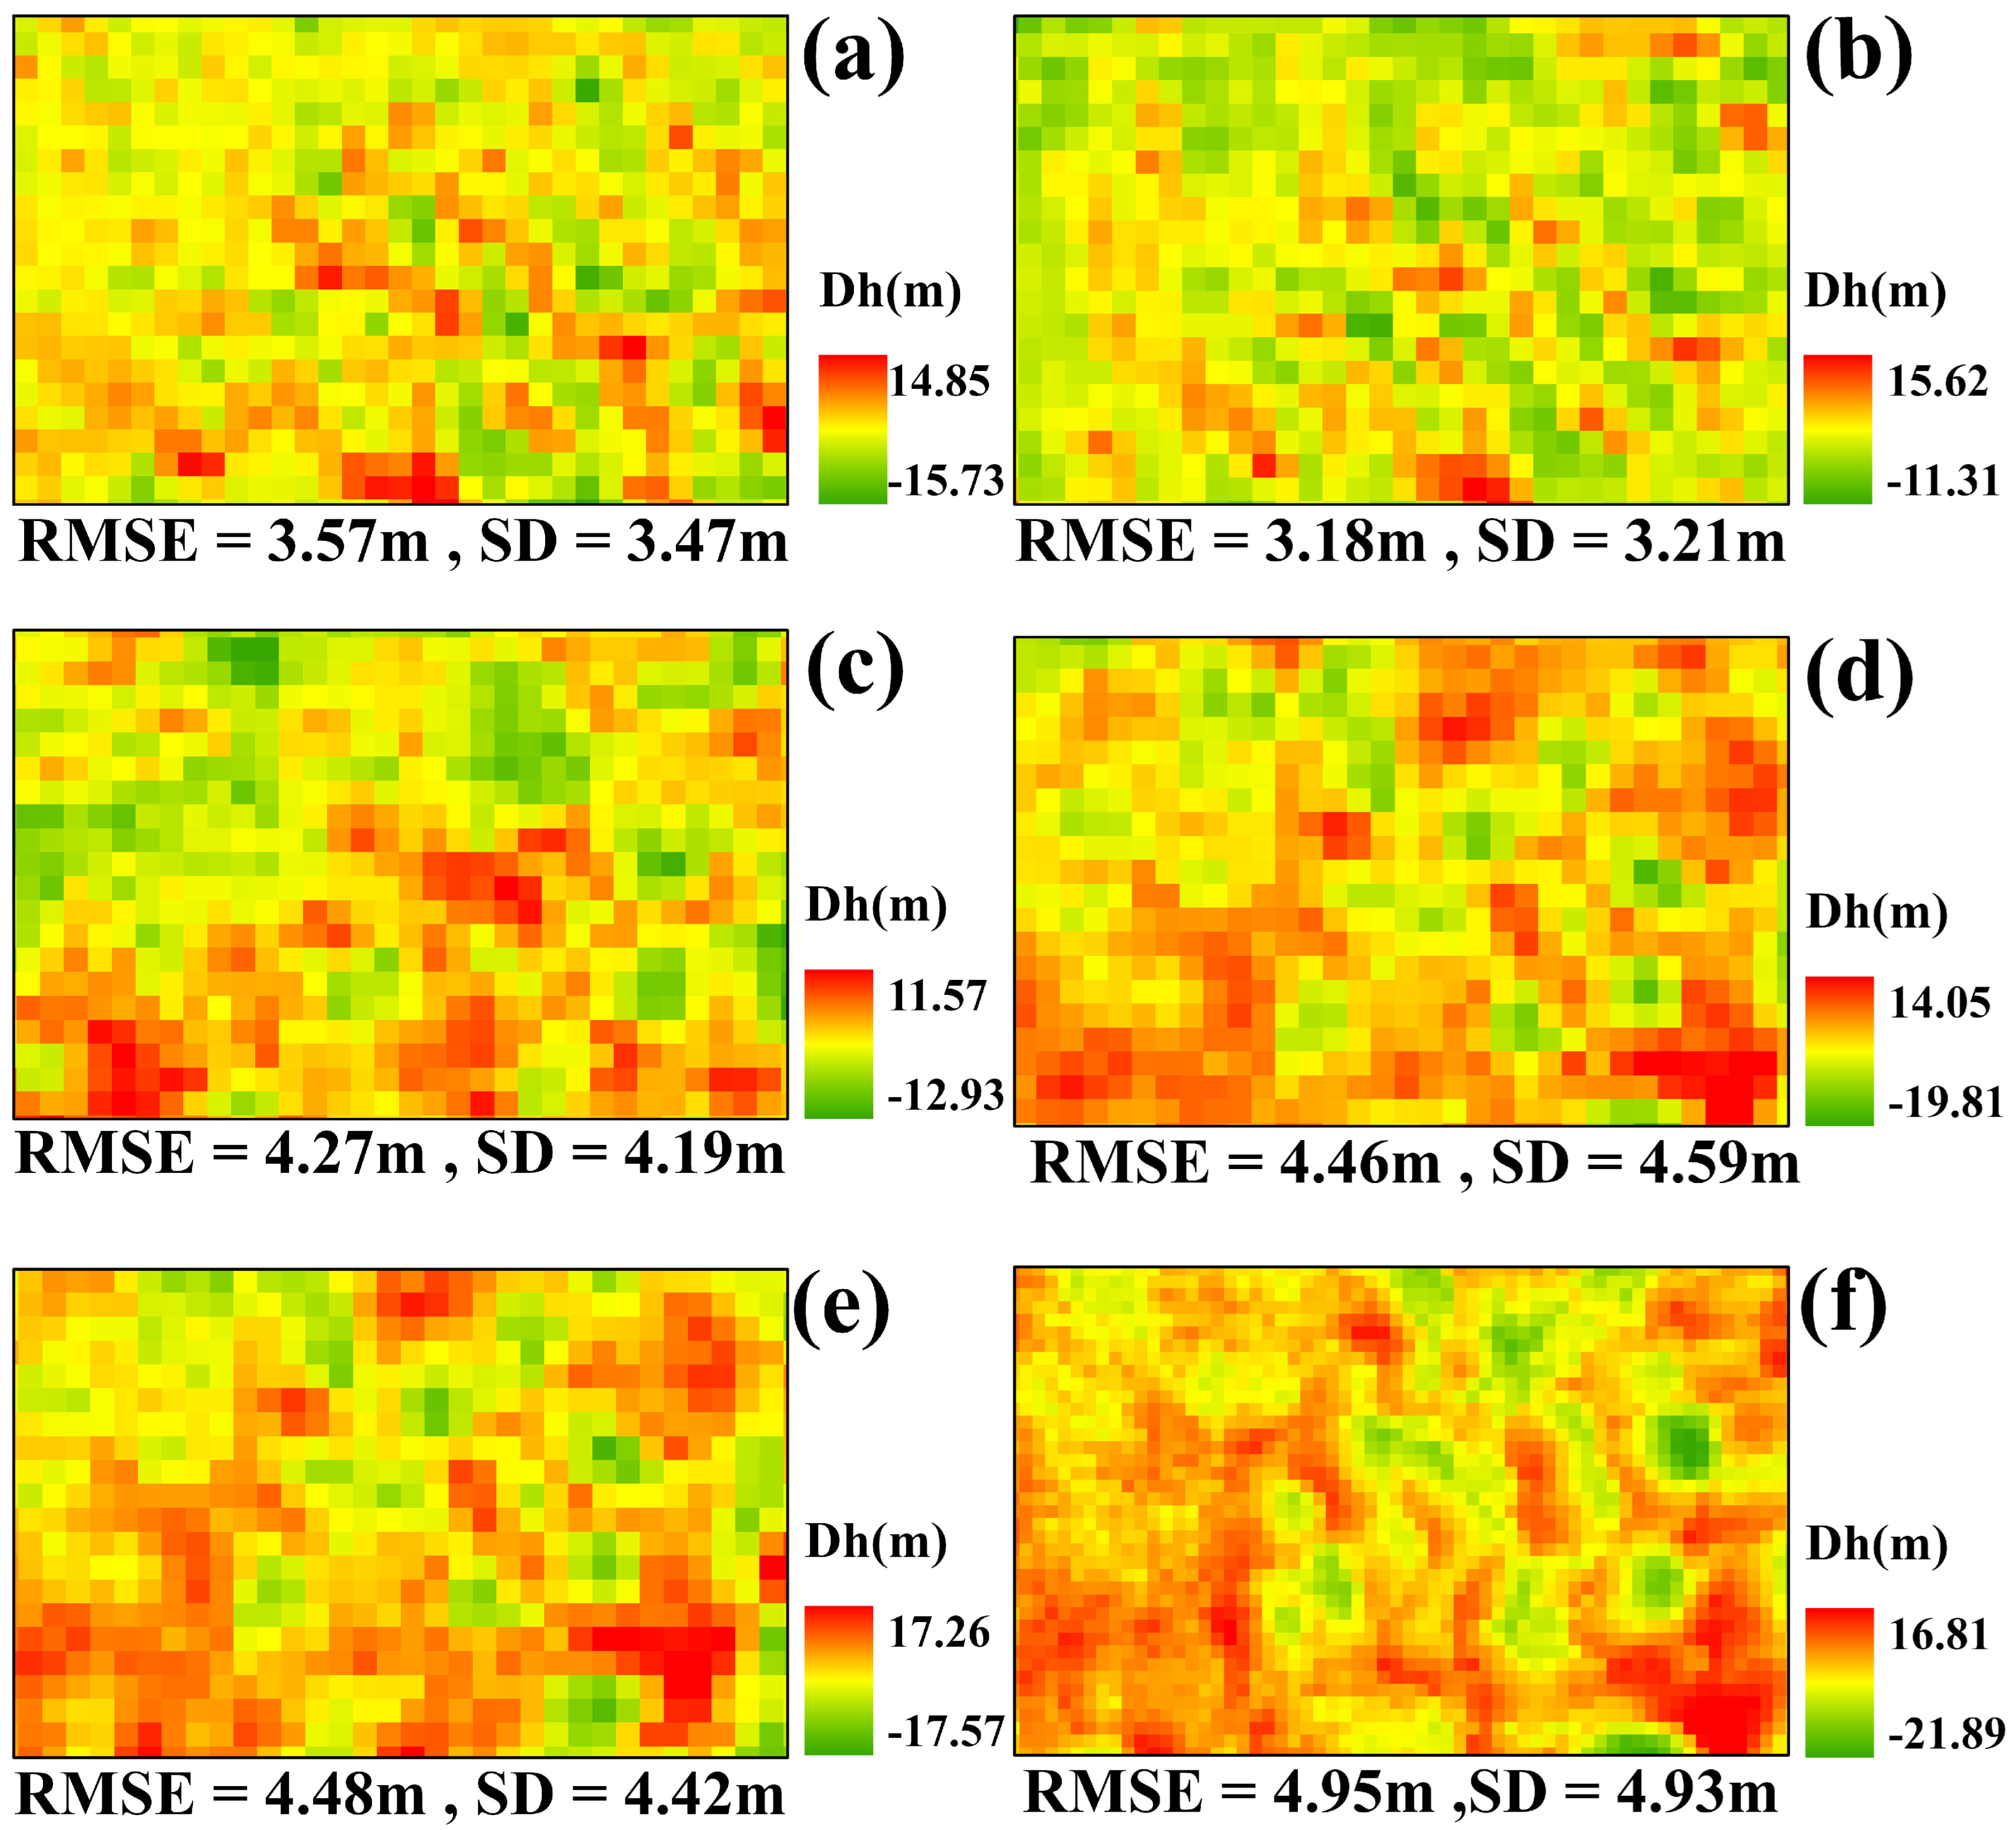
3.1. Evaluation of DEM Elevation Errors in the TD Hinterland

A comprehensive assessment of elevation errors between six DEMs and ICESat-2 ATL08 control points was conducted using six evaluation metrics, as shown in Figure 3. The histogram and scatter plot of error statistics reveal that the error curves for the six DEMs in the TD exhibit similar shapes, generally following a normal distribution. Except for ASTER GDEM V3, the distribution centers of the other DEMs are all less than zero, indicating a slight negative bias and skewness. NASADEM.
The ME values for the six DEMs range from −2.15 m to 0.61 m. Among these, Copernicus, AW3D30, SRTM, NASADEM, and ALOS PALSAR exhibit negative ME values, underestimating the elevation in the TD hinterland. In contrast, ASTER GDEM V3 has a positive ME value, overestimating the terrain height. The MAE values range from 2.77 m to 4.67 m; a smaller MAE indicates a smaller difference between the DEM elevation values and actual values. Notably, AW3D30, with a 30 m resolution, has an MAE of 2.77 m, which is lower than the MAE (2.92 m) of the 12.5 m resolution ALOS PALSAR.
The SD and NMAD values range from 3.48 to 6.04 m and 2.97 to 5.63 m, respectively. These two metrics reflect the degree of dispersion in elevation errors within the desert hinterland, while the RMSE assesses the accuracy of elevation error measurements, ranging from 3.63 to 6.07 m. Overall, AW3D30 exhibits the highest comprehensive accuracy, surpassing other products in terms of RMSE (3.63 m), SD (3.54 m), and error distribution. It is particularly suitable for desert regions or terrains with pronounced undulations.
Figure 4 illustrates the elevation data discrepancies and error characteristics between UAV-DEM and six DEM products. By comparing the RMSE and SD of the six DEM products, the precision and stability of each dataset can be inferred. Additionally, the spatial distribution maps reveal the dispersion and geographic distribution of elevation discrepancies within Sample Area 1. Copernicus and AW3D30 exhibit high elevation accuracy. Copernicus has a Dh range of −8.79 to 8.96 m, with an RMSE of 2.72 m and an SD of 2.42 m. The elevation differences with UAV-DEM are minimal, and its error values are evenly distributed. AW3D30 has a Dh range of −11.13 m to 12.90 m, with an RMSE of 2.46 m and an SD of 2.44 m. It demonstrates the lowest RMSE and SD values among all products, indicating high precision. The areas with larger discrepancies are sparse and locally consistent. ASTER GDEM V3 has a Dh range of −11.26 m to 16.96 m, with an RMSE of 4.09 m and an SD of 3.90 m. The areas with larger discrepancies significantly increase and become more concentrated, reflecting its weaker performance in complex terrain. SRTM exhibits a Dh range of −16.47 to 14.45 m, with RMSE and SD increasing to 4.47 m and 4.41 m, respectively. The regions with larger discrepancies are more densely distributed, and the areas of increased discrepancy show a regionalized pattern, indicating greater spatial dispersion. NASADEM has a Dh range of −15.54 to 14.21 m, with an RMSE of 4.45 m and an SD of 4.36 m. Its error characteristics are like those of SRTM DEM, with larger discrepancy areas accounting for a significant portion of the spatial distribution, limiting its ability to represent terrain features accurately. ALOS PALSAR performs the worst, with the largest Dh range (−18.28–15.21 m), the highest RMSE (4.68 m), and the largest SD (4.66 m). Its error distribution is the most dispersed, and regions with larger discrepancies are highly concentrated. Despite its 12.5 m resolution, its accuracy for undulating terrain is relatively poor.
Figure 5 shows the spatial distribution of elevation differences between UAV-DEM and six DEM products in Sample Area 2 of the TD hinterland. The Copernicus has a Dh range of approximately −15.73 to 14.85 m and the smallest RMSE (3.57 m), indicating relatively high consistency with UAV-DEM and smaller errors. However, the ALOS PALSAR, with a resolution of 12.5 m, exhibits the largest Dh range (−21.89 to −16.81 m), showing the most significant deviation and the highest RMSE (4.95 m). The AW3D30 has an RMSE of 3.18 m and an SD of 3.21 m, both of which are close in value, reflecting a relatively uniform error distribution. NASA DEM and ALOS PALSAR show higher RMSE values (4.48 m and 4.95 m, respectively) and SD values (4.42 m and 4.93 m, respectively), indicating that the elevation discrepancies from these two datasets are more widespread. The AW3D30 shows relatively small elevation differences over most areas, whereas SRTM, NASADEM, and ALOS PALSAR exhibit denser and more concentrated distributions of elevation discrepancies. Especially in areas with overlying sand dunes, the error is more pronounced.
Through a comprehensive comparative analysis of two sample areas located on either side of a sand ridge, it is evident that terrain complexity has a significant impact on the quality of DEM data. Sample Area 2, characterized by more pronounced terrain undulation, shows a markedly expanded Dh range, along with universally higher RMSE and SD values. The complexity of the terrain significantly affects the elevation accuracy of DEM products. Moreover, complex terrains result in concentrated local elevation estimation errors, which are particularly evident in NASADEM and ALOS PALSAR. In contrast, Copernicus and AW3D30 consistently outperform other products in both sample areas, exhibiting the lowest RMSE and SD values along with evenly distributed spatial errors. These characteristics make them better suited for undulating terrains in desert environments.

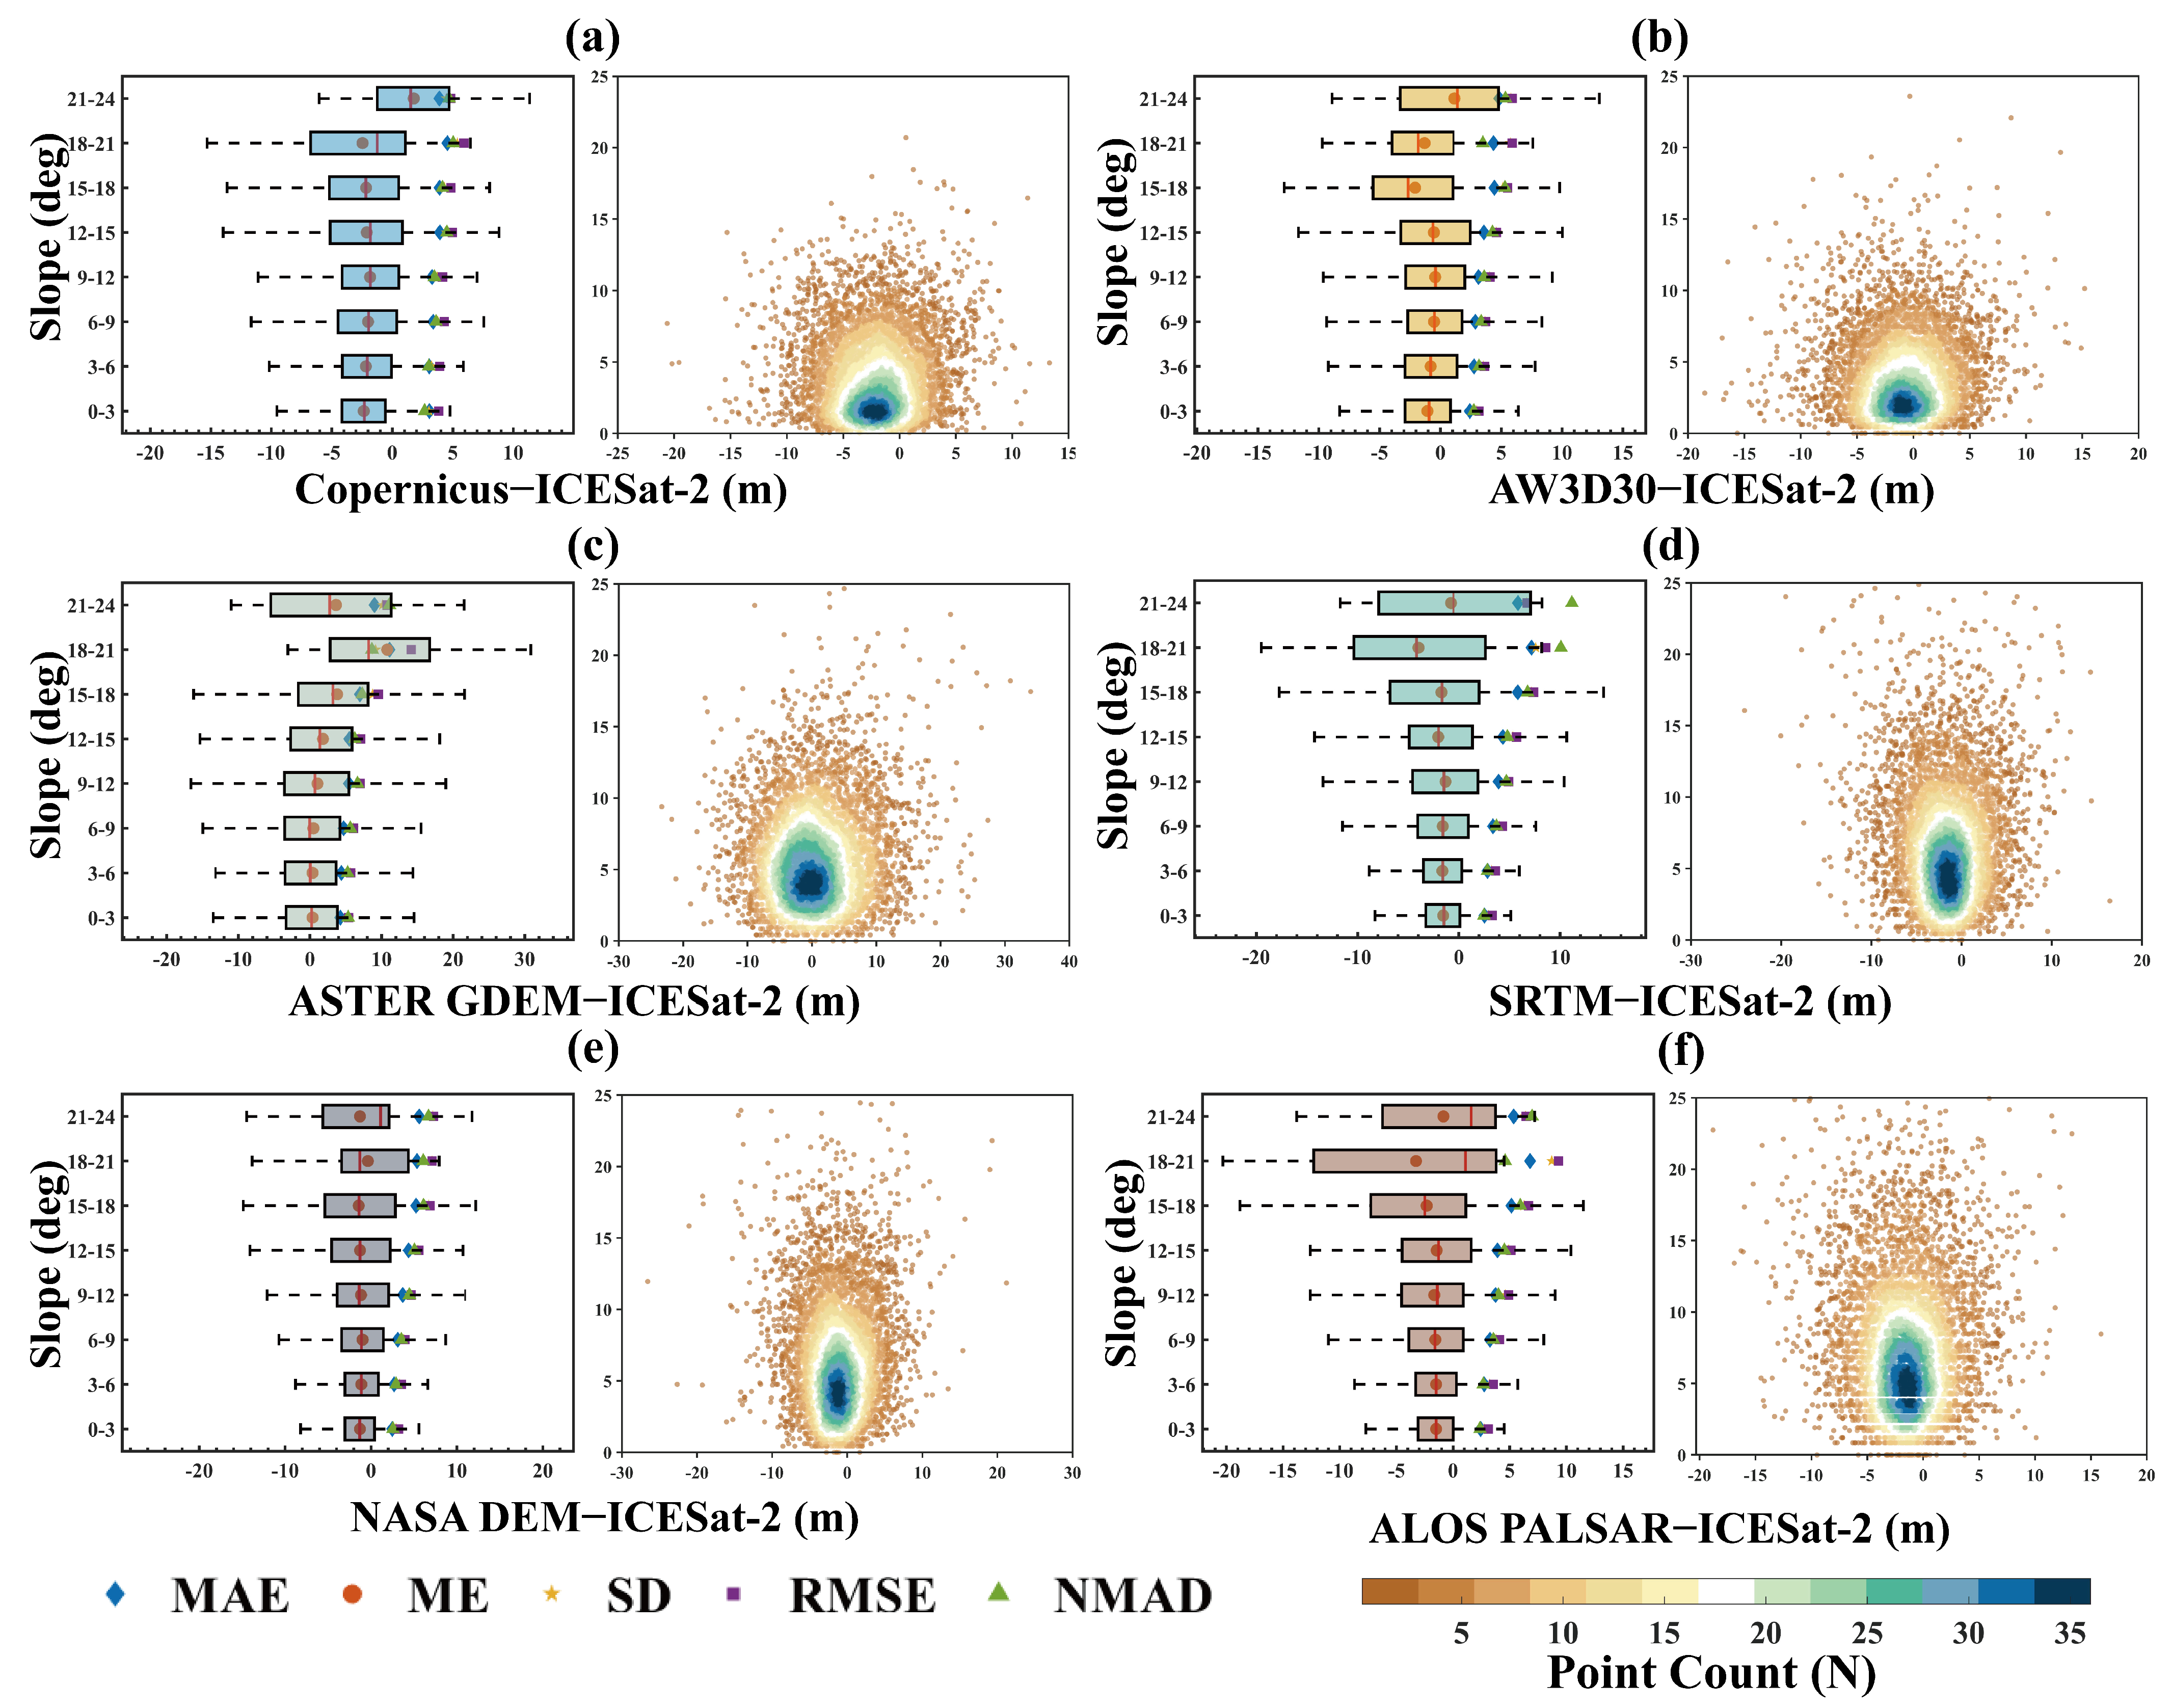
3.2. The Influence of Slope on DEM Vertical Accuracy in the TD Hinterland

The relationship between DEM errors in the TD hinterland and slope variations is illustrated in Figure 6. The box plot indicates that both the range of box values and the MAE increase with rising slope, suggesting that slope significantly affects the vertical accuracy of all DEMs in the TD. Figure 6 also presents scatter plots of error distributions for each DEM, highlighting the dispersion of errors. The MAE and RMSE for Copernicus and AW3D30 are relatively high, particularly in areas with steep slopes, indicating significant variability. In contrast, the MAE of ASTER GDEM V3 remains stable across different slope conditions, demonstrating a small overall error. SRTM and NASADEM show considerable errors and high discreteness in steep slope areas. ALOS PALSAR exhibits moderate performance in various slope ranges; while it shows smaller errors than ASTER GDEM V3 in low slope areas, it exhibits slightly inferior error performance in high slope areas.
DEM errors are mostly concentrated in flat terrain (0–15°), where errors are smaller and more consistently distributed. As the slope increases (>15°), the quality of the DEMs begins to decline. Within the range of gentle slopes (0–15°), ASTER GDEM V3 maintains a relatively stable MAE, demonstrating high consistency across different slope conditions. There is a strong correlation between the ascending and descending orbits of SAR satellites and the slope orientation. During data processing, this correlation may affect the unwrapping process due to the cumulative effects of the interferometric steps. The vertical accuracy of the six DEMs in this study significantly decreases with increasing slope, and slope has a notable impact on the errors of both optical photogrammetry-derived and SAR-derived DEMs.

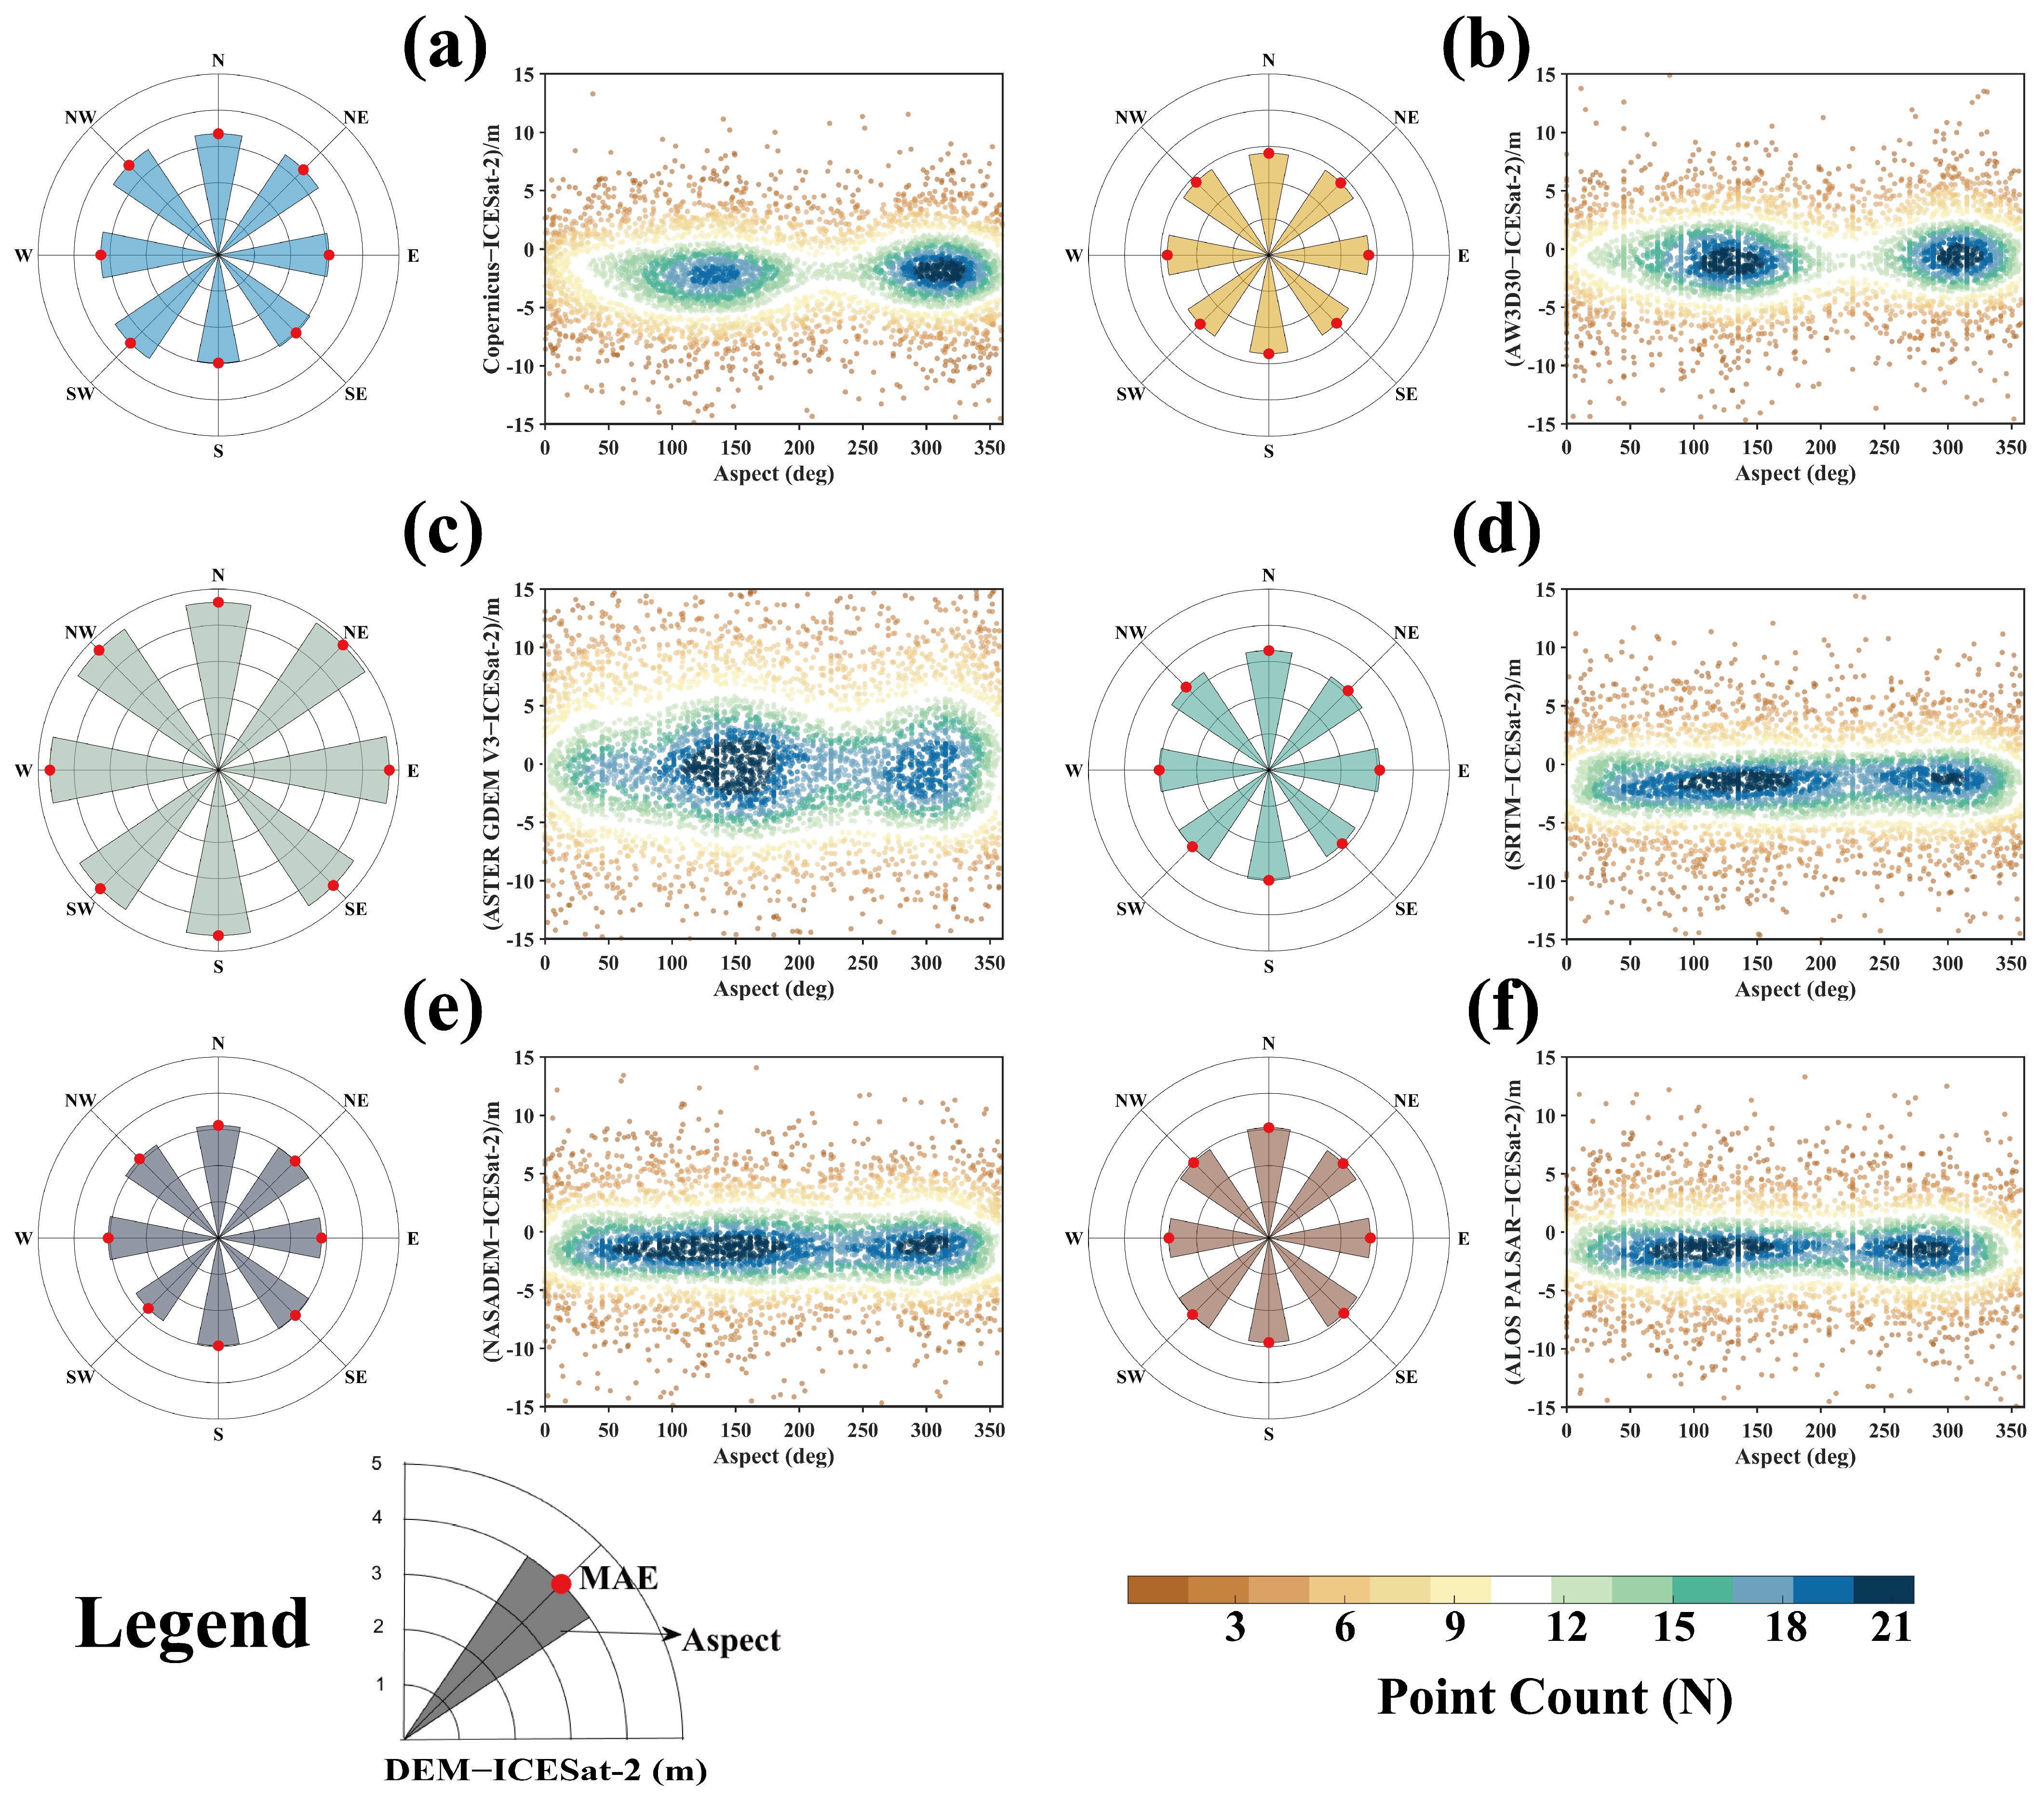
3.3. The Influence of Slope Aspect on the Accuracy of DEMs in the TD Hinterland

The variation in errors between the TD hinterland DEMs and ICESat-2 ATL08 across different slope aspects is illustrated in Figure 7, highlighting the accuracy differences of the TD hinterland DEM data in various terrain directions. Copernicus demonstrates a uniform distribution of MAE across slope aspects, with a small variation range, indicating consistent errors across all aspects. The error is slightly higher in the southeast direction (SE), but the overall difference is not significant. The errors are concentrated within ±5 m, showing a bimodal distribution, with higher density observed at aspect angles around 125° and 300°. The error variation is minimal, highlighting Copernicus’s strong adaptability to slope aspects, with stable overall performance and no notable aspect-related bias.
AW3D30 displays minimal MAE differences across slope aspects, with a peak observed in the southeast (SE). Its overall error range is like Copernicus, with elevation errors concentrated within ±5 m and primarily distributed around 120° and 300°. The overall performance of AW3D30 is close to that of Copernicus, with strong adaptability to slope directions, evenly distributed errors, and low fluctuations.
The MAE of ASTER GDEM V3 varies significantly across slope aspects, with higher values in the northeast direction (NE). Its error range is notably wider, extending from −15 m to +15 m. The distribution also displays a bimodal pattern, with more concentrated errors at specific slope aspects, particularly around 150° and 300°, where fluctuations are larger. ASTER GDEM V3 performs poorly in areas with complex slope directions, demonstrating a higher degree of systematic bias and weaker adaptability to steep terrain. SRTM shows a fairly uniform MAE distribution across slopes, with an overall concentrated range. Errors are primarily constrained within ±5 m, distributed evenly, and exhibit minimal fluctuations. Compared to AW3D30 and Copernicus, SRTM’s performance is slightly inferior but relatively stable. It shows good adaptability to slope directions, with low errors in most directions.
The performance of NASADEM is relatively balanced in all slope directions, with errors generally stabilized within the ±5 m range. However, the distribution density is lower compared to SRTM. The error distribution across slope aspects is uniform, and fluctuations are moderate. NASADEM performs relatively well in complex slope areas, showing evenly distributed errors, but its density and data consistency are slightly inferior to AW3D30 and Copernicus. The MAE range of ALOS PALSAR is much wider. Error distribution is more dispersed, extending from −15 m to +15 m, and slope aspect has a significant impact on the errors. The adaptability to slope direction is weak, especially on steep terrain, and its applicability is poor.
In summary, AW3D30 and Copernicus demonstrate excellent performance, with high accuracy and stable error distribution in areas with complex slope aspects, making them suitable for undulating desert regions. SRTM and NASADEM show moderate performance with good adaptability to slope directions, but they exhibit slightly larger error fluctuations compared to the top-performing DEMs. ASTER GDEM V3 and ALOS PALSAR DEM perform the worst, with significant systematic biases and errors strongly influenced by slope orientation. The complexity of slope directions has a significant impact on elevation errors in the study area, especially in the southeast (135°) and northwest (315°) directions.

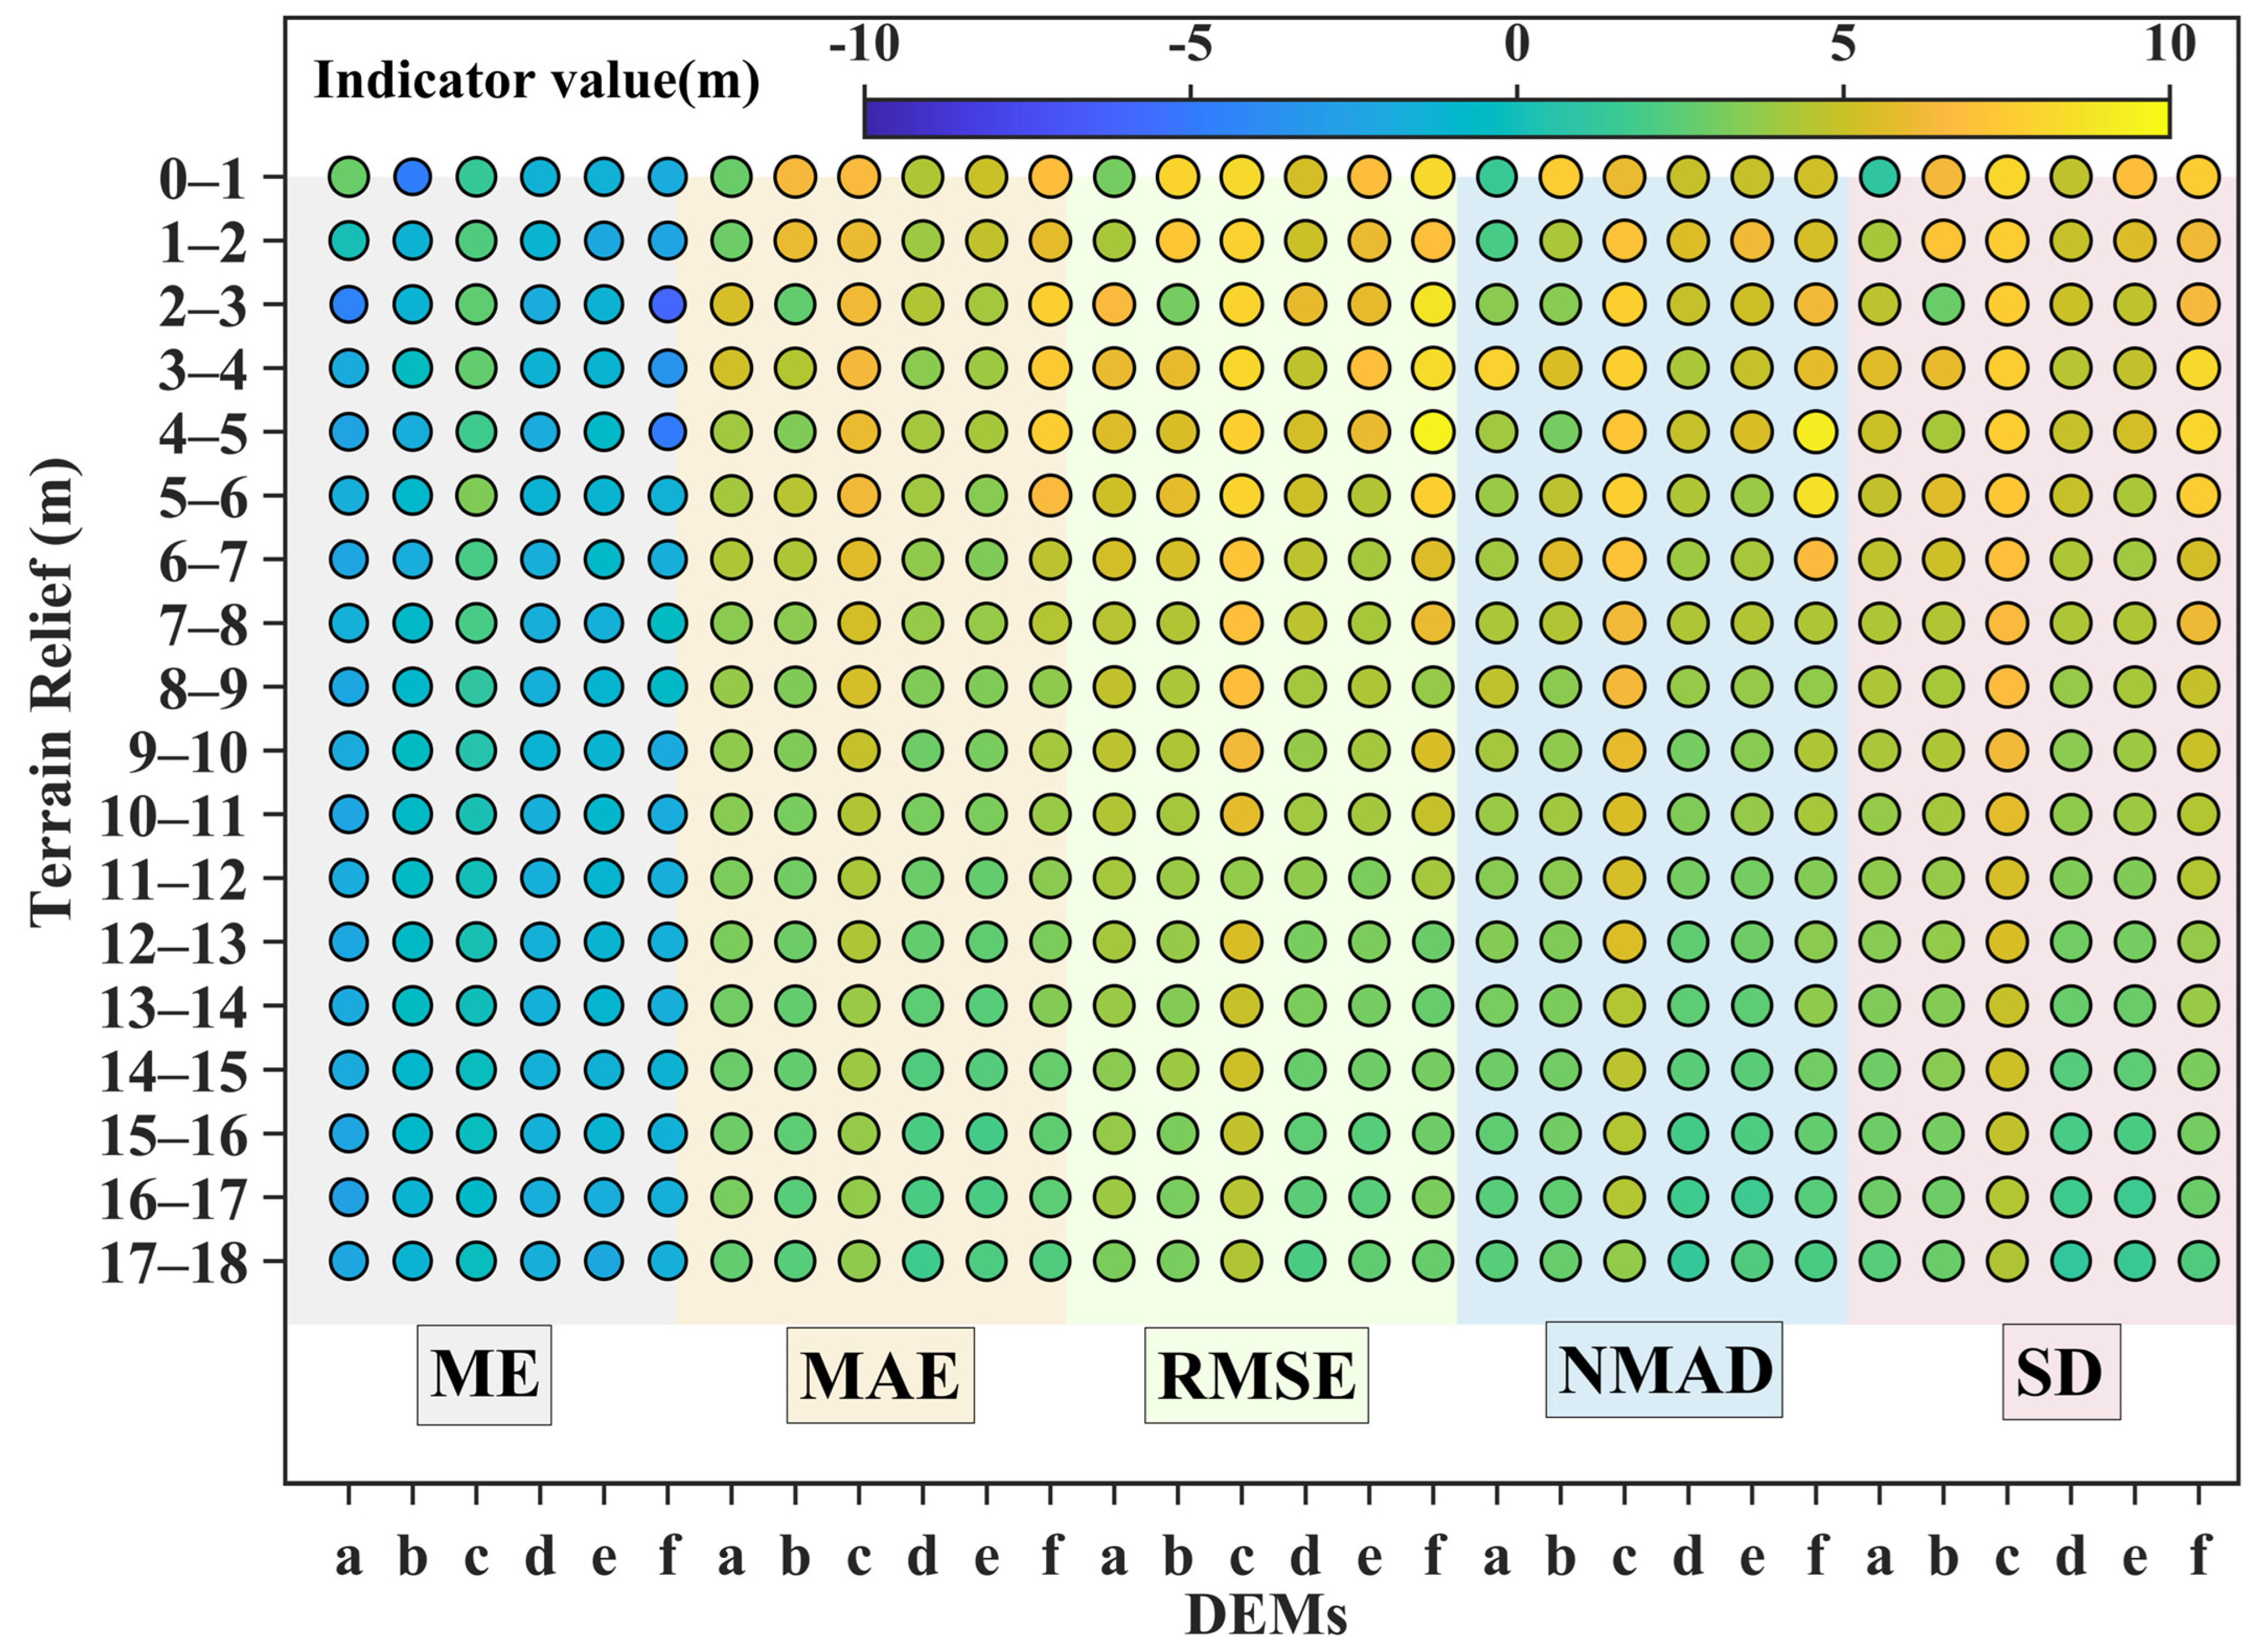
3.4. The Influence of Terrain Relief on the Vertical Accuracy of DEMs in the TD Hinterland

The error ranges of Copernicus, AW3D30, and SRTM are primarily concentrated between −10 m and 10 m (Figure 8), with distributions centered around 0, indicating relatively small errors. Among these, Copernicus exhibits the most concentrated error distribution, with small errors that are symmetrically distributed, indicating good stability. AW3D30 shows a slightly wider distribution compared to Copernicus. In areas with low terrain relief (0–15 m), the error distributions of these data sources are more concentrated. In contrast, in areas with higher terrain relief (>15 m), the errors slightly increase but remain relatively uniform, without significant systematic bias. On the other hand, ASTER GDEM V3 exhibits wider error ranges, approximately −20 m to 20 m. In areas with low terrain relief, the error distributions of these two data sources are more dispersed, and in areas with higher terrain relief, the errors increase significantly, showing greater instability. SRTM exhibits a slight expansion in the error range in regions with higher terrain relief (>15 m). ALOS PALSAR predominantly corresponds to terrain reliefs below 10 m, but in regions with significant relief (>15 m), the errors increase considerably, with a clear increase in areas of steep terrain.
The dunes in the TD hinterland exhibit varying degrees of relief. Based on various evaluation indexes (Figure 9), all DEMs perform better in areas with low terrain relief (0–15 m). However, as terrain relief increases (>15 m), errors begin to grow. In low-relief areas of the TD hinterland, the ME values of Copernicus are generally around −2 m, indicating a tendency for underestimation. AW3D30 shows minimal variation in ME values, demonstrating stability, with a consistent underestimation trend. ASTER GDEM exhibits slight underestimation when terrain relief is below 5 m, but slight overestimation when relief exceeds 5 m. SRTM, NASA DEM, and ALOS PALSAR all show varying degrees of underestimation in low-relief areas. However, as terrain relief increases, nearly all DEMs exhibit increasing ME values, indicating reduced stability. With increasing terrain relief, the SD and RMSE values of the TD hinterland DEMs show slight increases but remain generally stable. Most DEMs maintain stable NMA and MAE values, but ASTER GDEM shows significant deviations in all metrics compared to the other DEMs, indicating poor stability.
In summary, Copernicus and AW3D30 exhibit high stability and accuracy across various error metrics (ME, MAE, RMSE, NMAD, and SD). Their mean error (ME) values are small, absolute errors (MAE) are relatively low, and they demonstrate the strongest adaptability to terrain relief under complex topographic conditions. In contrast, ASTER GDEM V3 shows larger error ranges that increase significantly with terrain relief, accompanied by greater error dispersion and variability. SRTM and NASADEM demonstrate moderate performance, with relatively small errors in areas of low to moderate terrain relief (0–15 m). However, their error slightly increases in areas of steep terrain relief (>15 m), with stability inferior to those of Copernicus and AW3D30. ALOS PALSAR exhibits significant error with pronounced negative bias in ME, and its errors increase considerably in areas with highly rugged terrain relief.

4. Discussion

ICESat-2 ATL08 data offer unique advantages for validating DEM vertical accuracy. Tian et al. [40] reported that the height uncertainty of ICESat-2 ATL08 is approximately 0.2 m in plains and 2 m in mountainous terrain. Studies have shown that the accuracy of ICESat-2 ATL08 in desert regions is about 3 m. Wang et al. [41] found that seasonal variations, particularly changes in snow cover, can affect the accuracy of terrain elevation, while Neuenschwander et al. [42] observed that dense canopy cover can interfere with signal reflection, leading to errors. In the TD hinterland, where vegetation is sparse and snow cover has minimal influence, wind-driven sand movement significantly impacts terrain elevation. The transport of sand particles by wind causes variations in DEM elevation accuracy [43].

4.1. Factors Influencing DEM Vertical Accuracy in the TD Hinterland

The study found that DEM errors in the TD hinterland mostly occur in flat terrain (0–15°), where errors are relatively small and concentrated. However, as the slope increases (>15°), DEM quality begins to decline. Szabó et al. [44], in their evaluation of DEM vertical accuracy in the Bükk Mountains, observed that smaller slopes are associated with smaller deviations, while larger slopes result in greater deviations. Additionally, errors in forested areas were found to be larger than those in non-forested areas, primarily due to shadow effects in high-slope regions during remote sensing or aerial photogrammetry. These shadows can result in missing or inaccurate observational data, leading to lower accuracy in synthesized DEMs. In the TD hinterland, the persistent influence of wind determines the orientation of dunes, while slope aspect reflects the spatial alignment of surface dunes. Variations in illumination and shadow across different slope aspects affect the quality of remote sensing data, thereby influencing DEM vertical accuracy. Like other geomorphic features, terrain has a significant impact on DEM vertical accuracy. In moderately undulating hilly areas, slope variations lead to corresponding changes in errors, although the overall accuracy remains relatively stable [45]. In steeply sloped and highly rugged mountainous regions, DEM vertical accuracy is generally lower, with errors increasing significantly in steep areas [46]. In desert regions, DEM vertical accuracy often exhibits a linear relationship with terrain slope.
The spatial resolution directly affects the ability of DEM to capture terrain changes. In general, high spatial resolution can more accurately depict terrain features, while low spatial resolution can lead to changes in pixel values, resulting in inaccurate terrain representation [47]. However, this study found that the accuracy of ALOS PALSAR, with a resolution of 12.5 m, is inferior to that of Copernicus, which has a resolution of 30 m. This difference is especially pronounced when using UAV DEM to assess the accuracy of the DEM in the sample area, where the errors are particularly significant. This finding is similar to the conclusions drawn by Khattab et al. [48] from the DEM vertical accuracy comparison experiments conducted in the Talat Hamdh Basin in the eastern desert of Egypt. Their research indicated that, despite ALOS PALSAR having a high resolution of 12.5 m, it still fails to accurately represent the topographical features of small basins and exhibits significant noise, including substantial speckle noise and poorly fitted interpolated data, rendering it almost incapable of representing the terrain of the test basin. In contrast, the Copernicus DEM demonstrates the highest accuracy among open-access DEMs and effectively represents the main valley and its primary tributaries. Therefore, different DEMs have different performances under different terrain features, and ALOS performs poorly in desert areas similar to the TD hinterland. However, Weifeng et al. [37] found that ALOS PALSAR exhibited the smallest RMSE when evaluating the accuracy of DEMs in the Tibetan Plateau. He attributed this result to the high resolution of ALOS PALSAR and suggested that land cover significantly affects the accuracy of DEMs. Adiri et al. [49] found that in their evaluation of DEM vertical accuracy in the Tagragra of Akka inlier region, ALOS PALSAR, despite its high spatial resolution, did not exhibit significant differences in accuracy when compared to SRTM3 and NASADEM.
In this study, the high-resolution UAV-derived DEM demonstrated superior elevation accuracy in the TD hinterland, exhibiting exceptional capability in capturing localized details. These findings align with the research by Wu et al., which highlighted the significant influence of spatial resolution on DEM vertical accuracy [50]. Within the 30 m DEM category, Copernicus and AW3D30 were identified as the top performers.

4.2. Limitations and Future Prospects

This study evaluated the accuracy of six DEM datasets, focusing primarily on vertical accuracy while giving limited consideration to the potential effects of horizontal accuracy. Additionally, there are temporal discrepancies between the six DEM datasets and the reference ICESat-2 ATL08 data. These temporal differences may lead to elevation changes in the shifting dunes of the desert, potentially influencing the evaluation results.
Due to the harsh natural conditions of the desert and frequent sandstorm weather, it is challenging to utilize drones for extensive data acquisition. However, recent studies have employed super-resolution techniques to obtain high-resolution DEMs. For instance, Zhou et al. [51] proposed a method for constructing super-resolution DEMs using a deep convolutional neural network based on multiple terrain features. Future research will further consider the development of super-resolution DEMs for the TD hinterland.
Due to the high cost of large-scale mapping, long data processing times, and the harsh natural conditions of desert environments, this study only assessed the accuracy of DEMs in the TD hinterland. Future research will aim to expand the study area and incorporate more high-accuracy ground control points. This study only assessed the accuracy of the DEM in the TD hinterland without performing accuracy calibration. Future research will incorporate more high-precision ground control points to calibrate the DEM in desert regions and will attempt to utilize ICESat-2 ATL08 time series data for long-term monitoring of topographical changes in the TD area.

5. Conclusions

This study conducted a comprehensive evaluation of six DEM products in the TD hinterland using ICESat-2 ATL08 and UAV-DEM data, analyzing the relationship between their errors and terrain characteristics (slope, aspect, and terrain relief). The results indicate that the error distributions of all DEMs exhibit normal distribution characteristics, but there are significant differences in error magnitude and stability. Overall, Copernicus and AW3D30 showed stable performance, with moderate errors and concentrated distributions.
Terrain characteristics significantly influenced DEM vertical accuracy. Increasing slope led to a notable rise in errors for all DEMs, with error fluctuations becoming more pronounced when the slope exceeded 15°. The influence of the slope aspect on errors was relatively minor, but certain directions (e.g., SE and NW) showed larger error fluctuations for some DEMs. Increasing terrain relief also resulted in greater errors. Additionally, this study indicates that UAV-DEM is suitable for small-scale DEM vertical accuracy validation, while ICESat-2 ATL08 data are more suitable for large-scale DEM vertical accuracy evaluation. These findings provide valuable insights for the selection and correction of DEMs in the TD hinterland and similar desert environments, offering a scientific basis for desert geomorphology research.

Author Contributions

Conceptualization, M.W. and Y.L.; methodology, M.W. and H.L. (Huoqing Li); software, M.W. and Y.L.; validation, M.W., H.L. (Huoqing Li) and Y.L.; formal analysis, M.W. and Y.L.; investigation, M.W. and H.L. (Haojuan Li); resources, Y.L.; data curation, Y.L.; writing—original draft preparation, M.W.; writing—review and editing, H.L. (Huoqing Li), Y.L. and H.L. (Haojuan Li); visualization, Y.L.; supervision, Y.L.; project administration, H.L. (Huoqing Li) and Y.L.; funding acquisition, H.L. (Huoqing Li) and Y.L. All authors have read and agreed to the published version of the manuscript.

Funding

This work was supported by the Natural Science Foundation of Xinjiang Uygur Autonomous Region (2022D01A367), the National Science Foundation of China (42275166), and Open Research Project of the State Key Laboratory of Disastrous Weather, Chinese Academy of Meteorological Sciences (2024LASW-B15).

Data Availability Statement

The original contributions presented in this study are included in the article. Further inquiries can be directed to the corresponding author.

Acknowledgments

We appreciate the open-access DEM data provided by NASA, ASF, JAXA, and ESA. All authors are grateful to the Institute of Desert Meteorology, China Meteorological Administration, for helping in data collection. We thank the editors and reviewers of this journal in advance for their efforts.

Conflicts of Interest

The authors declare no conflicts of interest.

References

  1. Ishiyama, T.; Tsuchiya, K.; Sugihara, S. Ground surface features of the Taklimakan Desert. Adv. Space Res. 1996, 17, 41–48. [Google Scholar] [CrossRef]
  2. Saadat, H.; Bonnell, R.; Sharifi, F.; Mehuys, G.; Namdar, M.; Ale-Ebrahim, S. Landform classification from a digital elevation model and satellite imagery. Geomorphology 2008, 100, 453–464. [Google Scholar] [CrossRef]
  3. Wang, X.; Dong, Z.; Zhang, J.; Chen, G. Geomorphology of sand dunes in the Northeast Taklimakan Desert. Geomorphology 2002, 42, 183–195. [Google Scholar] [CrossRef]
  4. Dong, Z.; Wang, X.; Chen, G. Monitoring sand dune advance in the Taklimakan Desert. Geomorphology 2000, 35, 219–231. [Google Scholar] [CrossRef]
  5. Dong, Z.; Wei, Z.; Qian, G.; Zhang, Z.; Luo, W.; Hu, G. “Raked” linear dunes in the Kumtagh Desert, China. Geomorphology 2010, 123, 122–128. [Google Scholar] [CrossRef]
  6. Li, S.; Xiong, L.; Tang, G.; Strobl, J. Deep learning-based approach for landform classification from integrated data sources of digital elevation model and imagery. Geomorphology 2020, 354, 107045. [Google Scholar] [CrossRef]
  7. Telbisz, T.; Keszler, O. DEM-based morphometry of large-scale sand dune patterns in the Grand Erg Oriental (Northern Sahara Desert, Africa). Arab. J. Geosci. 2018, 11, 382. [Google Scholar] [CrossRef]
  8. Wang, M.; Liu, Y.; Li, H.; Wang, M.; Huo, W.; Liu, Z. A Novel Algorithm for Estimating the Sand Dune Density of the Taklimakan Desert Based on Remote Sensing Data. Remote Sens. 2025, 17, 297. [Google Scholar] [CrossRef]
  9. Niu, Z.; Wang, N.; Meng, N.; Liu, J.; Liang, X.; Cheng, H.; Wen, P.; Yu, X.; Zhang, W.; Liang, X. Contribution of Lake-Dune Patterning to the Dune Height of Mega-Dunes in the Badain Jaran Sand Sea, Northern China. Remote Sens. 2021, 13, 4915. [Google Scholar] [CrossRef]
  10. Megahed, H.A.; Hassoup, A.; Farrag, A.E.A.; Wahba, D. Modeling the environmental hazards of el-kharga oasis sand dunes, western desert of Egypt, using remote sensing and GIS techniques. Int. J. Adv. Remote Sens. GIS 2021, 10, 3501–3520. [Google Scholar] [CrossRef]
  11. Daynac, J.; Bessin, P.; Pochat, S.; Mourgues, R.; Shumack, S. A new workflow for mapping dune features (outline, crestline and defects) combining deep learning and skeletonization from DEM-derived data. Geomorphology 2024, 463, 109369. [Google Scholar] [CrossRef]
  12. Trevisani, S.; Guth, P.L. Terrain Analysis According to Multiscale Surface Roughness in the Taklimakan Desert. Land 2024, 13, 1843. [Google Scholar] [CrossRef]
  13. Shumack, S.; Hesse, P.; Farebrother, W. Deep learning for dune pattern mapping with the AW3D30 global surface model. Earth Surf. Process. Landf. 2020, 45, 2417–2431. [Google Scholar] [CrossRef]
  14. White, K.; Bullard, J.; Livingstone, I.; Moran, L. A morphometric comparison of the Namib and southwest Kalahari dunefields using ASTER GDEM data. Aeolian Res. 2015, 19, 87–95. [Google Scholar] [CrossRef]
  15. Desroches, D.; Gasnier, N. Digital Elevation Models of Some Land Surfaces from Interferometric Processing of Swot Images. In Proceedings of the IGARSS 2024—2024 IEEE International Geoscience and Remote Sensing Symposium, Athens, Greece, 7–12 July 2024; pp. 3172–3175. [Google Scholar] [CrossRef]
  16. Xu, N.; Wang, L.; Xu, H.; Ma, Y.; Li, Y.; Wang, X.H. Deriving Accurate Intertidal Topography for Sandy Beaches Using ICESat-2 Data and Sentinel-2 Imagery. J. Remote Sens. 2024, 4, 305. [Google Scholar] [CrossRef]
  17. Ding, C.; Feng, G.; Zhang, L.; Liao, M. A Novel Multidimensional Perspective on Dynamic Characteristics of the Peculiar Feather-Shaped Dunes in Kumtag Desert With Time-Series Optical and SAR Observations. IEEE J. Sel. Top. Appl. Earth Observ. Remote Sens. 2024, 17, 11618–11631. [Google Scholar] [CrossRef]
  18. Li, H.; Zhao, J.; Yan, B.; Yue, L.; Wang, L. Global DEMs vary from one to another: An evaluation of newly released Copernicus, NASA and AW3D30 DEM on selected terrains of China using ICESat-2 altimetry data. Int. J. Digit. Earth. 2022, 15, 1149–1168. [Google Scholar] [CrossRef]
  19. Rehman, K.; Fareed, N.; Chu, H. NASA ICESat-2: Space-Borne LiDAR for Geological Education and Field Mapping of Aeolian Sand Dune Environments. Remote Sens. 2023, 15, 2882. [Google Scholar] [CrossRef]
  20. Dandabathula, G.; Roy, S.; Ghatage, O.S.; Kolase, V.B.; Satpute, S.; Ghosh, K.; Kaur, S.; Pondari, S.; Bera, A.K.; Srivastav, S.K. Performance validation of High Mountain Asia 8-meter Digital Elevation Model using ICESat-2 geolocated photons. J. Mt. Sci. 2024, 21, 2562–2578. [Google Scholar] [CrossRef]
  21. Narin, O.G.; Gullu, M. A comparison of vertical accuracy of global DEMs and DEMs produced by GEDI, ICESat-2. Earth Sci. Inform. 2023, 16, 2693–2707. [Google Scholar] [CrossRef]
  22. Huang, X.; Xie, H.; Liang, T.; Yi, D. Estimating vertical error of SRTM and map-based DEMs using ICESat altimetry data in the eastern Tibetan Plateau. Int. J. Remote Sens. 2011, 32, 5177–5196. [Google Scholar] [CrossRef]
  23. Smith, S.L. Drones over the “Black Desert”: The advantages of rotary-wing UAVs for complementing archaeological fieldwork in the hard-to-access landscapes of preservation of north-eastern Jordan. Geosciences 2020, 10, 426. [Google Scholar] [CrossRef]
  24. Liu, B.; Sun, A.; Zhao, H.; Fan, Y.; Yang, L.; Li, Y.; Li, S.; Wang, K. Physicochemical properties of surface sediments in the Taklimakan desert, northwestern China, and their relationship with oasis-desert evolution. Catena 2022, 208, 105751. [Google Scholar] [CrossRef]
  25. Han, Z.W.; Dong, Z.B.; Wang, T.; Chen, G.T.; Yan, C.Z.; Yao, Z.Y. Observations of several characteristics of aeolian sand movement in the Taklimakan Desert. Sci. China Ser. D-Earth Sci. 2004, 47, 86–96. [Google Scholar] [CrossRef]
  26. Ningbo, W.; Feng, G.; Shengyu, L. Fractality and Stability of Sand Dunes in Lowland among Composite Longitudinal Ridges in the Central Taklimakan Desert. Arid. Zone Res. 2014, 31, 163–168. (In Chinese) [Google Scholar] [CrossRef]
  27. Markus, T.; Neumann, T.; Martino, A.; Abdalati, W.; Brunt, K.; Csatho, B.; Farrell, S.; Fricker, H.; Gardner, A.; Harding, D.; et al. The Ice, Cloud, and land Elevation Satellite-2 ( ICESat-2): Science requirements, concept, and implementation. Remote Sens. Environ. 2017, 190, 260–273. [Google Scholar] [CrossRef]
  28. Neuenschwander, A.; Pitts, K. The ATL08 land and vegetation product for the ICESat-2 Mission. Remote Sens. Environ. 2019, 221, 247–259. [Google Scholar] [CrossRef]
  29. Franks, S.; Rengarajan, R. Evaluation of Copernicus DEM and comparison to the DEM used for Landsat Collection-2 processing. Remote Sens. 2023, 15, 2509. [Google Scholar] [CrossRef]
  30. Guth, P.L.; Geoffroy, T.M. LiDAR point cloud and ICESat-2 evaluation of 1 second global digital elevation models: Copernicus wins. Trans. Gis. 2021, 25, 2245–2261. [Google Scholar] [CrossRef]
  31. Takaku, J.; Tadono, T.; Doutsu, M.; Ohgushi, F.; Kai, H. Updates of ‘AW3D30’ALOS global digital surface model with other open access datasets. Int. Arch. Photogramm. Remote Sens. Spat. Inf. Sci. 2020, 43, 183–189. [Google Scholar] [CrossRef]
  32. Tachikawa, T.; Hato, M.; Kaku, M.; Iwasaki, A. Characteristics of ASTER GDEM version 2. In Proceedings of the 2011 IEEE International Geoscience and Remote Sensing Symposium, Vancouver, BC, Canada, 24–29 July 2011; pp. 3657–3660. [Google Scholar] [CrossRef]
  33. Farr, T.G.; Rosen, P.A.; Caro, E.; Crippen, R.; Duren, R.; Hensley, S.; Kobrick, M.; Paller, M.; Rodriguez, E.; Roth, L.; et al. The shuttle radar topography mission. Rev. Geophys. 2007, 45, RG2004. [Google Scholar] [CrossRef]
  34. Crippen, R.; Buckley, S.; Agram, P.; Belz, E.; Gurrola, E.; Hensley, S.; Kobrick, M.; Lavalle, M.; Martin, J.; Neumann, M.; et al. NASADEM global elevation model: Methods and progress. Int. Arch. Photogramm. Remote Sens. Spat. Inf. Sci. 2016, 41, 125–128. [Google Scholar] [CrossRef]
  35. Wei, Y.; Gan, S.; Yuan, X.; Hu, L.; Gao, S. Analysis of Topographic Feature Parameters of Dinosaur Valley Ring Tectonic Geomorphology Based on the Advanced Land Observing Satellite Digital Elevation Model (ALOS DEM). Appl. Sci. 2023, 13, 13137. [Google Scholar] [CrossRef]
  36. Zheng, Y.; Zhang, Y.; Wang, T.; Zhao, X.; Zhang, K.; Wang, L. Elevation control points extraction and accuracy validation based on ICESat-2 data. J. Geo-Inf. Sci. 2022, 24, 1234–1244. [Google Scholar]
  37. Weifeng, X.; Jun, L.; Dailiang, P.; Jinge, J.; Hongxuan, X.; Hongyue, Y.; Jun, Y. Multi-source DEM accuracy evaluation based on ICESat-2 in Qinghai-Tibet Plateau, China. Int. J. Digit. Earth. 2024, 17, 2297843. [Google Scholar] [CrossRef]
  38. Li, W.; Wang, C.; Zhu, W. Error spatial distribution characteristics of TanDEM-X 90m DEM over China. J. Geo-Inf. Sci. 2020, 22, 2277–2288. [Google Scholar]
  39. Hoehle, J.; Hoehle, M. Accuracy assessment of digital elevation models by means of robust statistical methods. ISPRS-J. Photogramm. Remote Sens. 2009, 64, 398–406. [Google Scholar] [CrossRef]
  40. Tian, X.; Shan, J. Comprehensive evaluation of the ICESat-2 ATL08 terrain product. IEEE Trans. Geosci. Remote Sens. 2021, 59, 8195–8209. [Google Scholar] [CrossRef]
  41. Wang, X.; Liang, X.; Gong, W.; H A Kli, P.; Wang, Y. Accuracy fluctuations of ICESat-2 height measurements in time series. Int. J. Appl. Earth Obs. Geoinf. 2024, 135, 104234. [Google Scholar] [CrossRef]
  42. Neuenschwander, A.; Guenther, E.; White, J.C.; Duncanson, L.; Montesano, P. Validation of ICESat-2 terrain and canopy heights in boreal forests. Remote Sens. Environ. 2020, 251, 112110. [Google Scholar] [CrossRef]
  43. McKee, E.D. A Study of Global Sand Seas; US Government Printing Office: Washington, DC, USA, 1979; Volume 1052. [Google Scholar]
  44. Szabó, G.; Singh, S.K.; Szabó, S. Slope angle and aspect as influencing factors on the accuracy of the SRTM and the ASTER GDEM databases. Phys. Chem. Earth Parts A/B/C 2015, 83, 137–145. [Google Scholar] [CrossRef]
  45. Vaze, J.; Teng, J.; Spencer, G. Impact of DEM accuracy and resolution on topographic indices. Environ. Model. Softw. 2010, 25, 1086–1098. [Google Scholar] [CrossRef]
  46. Liu, Z.; Zhu, J.; Fu, H.; Zhou, C.; Zuo, T. Evaluation of the Vertical Accuracy of Open Global DEMs over Steep Terrain Regions Using ICESat Data: A Case Study over Hunan Province, China. Sensors 2020, 20, 4865. [Google Scholar] [CrossRef]
  47. Sharma, A.; Bagri, D.S. Comparison and Validation of Elevation Data at Selected Ground Control Points and Terrain Derivatives Derived from Different Digital Elevation Models. Remote Sens. Earth Syst. Sci. 2023, 6, 38–59. [Google Scholar] [CrossRef]
  48. Khattab, M.I.; Abotalib, A.Z.; Othman, A.; Selim, M.K. Evaluation of multiple digital elevation models for hypsometric analysis in the watersheds affected by the opening of the Red Sea. Egypt. J. Remote Sens. Space Sci. 2023, 26, 1020–1035. [Google Scholar] [CrossRef]
  49. Adiri, Z.; Lhissou, R.; Maacha, L.; Jilali, A.; Talbi, E.H.; Jellouli, A.; Chakouri, M. Comparison of ASTER GDEM3, SRTM3, NASADEM, TanDEM-X90, AW3D30, and ALOS PALSAR data with TanDEM-X12: A case study of Tagragra of Akka inlier, Moroccan Anti-Atlas. Arab. J. Geosci. 2022, 15, 1654. [Google Scholar] [CrossRef]
  50. Wu, S.; Li, J.; Huang, G.H. A study on DEM-derived primary topographic attributes for hydrologic applications: Sensitivity to elevation data resolution. Appl. Geogr. 2008, 28, 210–223. [Google Scholar] [CrossRef]
  51. Zhou, A.; Chen, Y.; Wilson, J.P.; Chen, G.; Min, W.; Xu, R. A multi-terrain feature-based deep convolutional neural network for constructing super-resolution DEMs. Int. J. Appl. Earth Obs. Geoinf. 2023, 120, 103338. [Google Scholar] [CrossRef]
Figure 1. Research area overview: (a) the location of the research area in the TD, (b) distribution of UAV sampling areas and ICESat-2 ATL08 sampling points, (c) field imagery, (d) UAV-derived DEM for Sample Area 1, (e) UAV-derived DEM for Sample Area 2, (f) Copernicus DEM, (g) AW3D30 DEM, (h) ASTER GDEM V3, (i) SRTM v3 DEM, (j) NASADEM, and (k) ALOS PALSAR DEM.
Remotesensing 17 01807 g001
Figure 2. The workflow of this study.
Remotesensing 17 01807 g002
Figure 3. Error distribution histograms of DEMs and ICESat-2 ATL08 in the TD hinterland: (a) Copernicus, (b) AW3D30, (c) ASTER GDEM V3, (d) SRTM, (e) NASADEM, (f) ALOS PALSAR, and (g) height difference comparison.
Remotesensing 17 01807 g003
Figure 4. The distribution of height difference between UAV-DEM and DEMs in the TD hinterland Sample Area 1: (a) Copernicus, (b) AW3D30, (c) ASTER GDEM V3, (d) SRTM, (e) NASADEM, and (f) ALOS PALSAR.
Remotesensing 17 01807 g004
Figure 5. The distribution of height difference between UAV-DEM and DEM in the TD hinterland Sample Area 2: (a) Copernicus, (b) AW3D30, (c) ASTER GDEM V3, (d) SRTM, (e) NASADEM, and (f) ALOS PALSAR.
Remotesensing 17 01807 g005
Figure 6. Slope and ICESat-2 ATL08 error analysis: (a) Copernicus, (b) AW3D30, (c) ASTER GDEM V3, (d) SRTM, (e) NASADEM, and (f) ALOS PALSAR.
Remotesensing 17 01807 g006
Figure 7. Relationship between slope aspect and ICESat-2 ATL08 errors in the TD hinterland: (a) Copernicus, (b) AW3D30, (c) ASTER GDEM V3, (d) SRTM, (e) NASADEM, and (f) ALOS PALSAR.
Remotesensing 17 01807 g007
Figure 8. Relationship between terrain relief and ICESat-2 ATL08 errors in the TD hinterland: (a) Copernicus, (b) AW3D30, (c) ASTER GDEM V3, (d) SRTM, (e) NASADEM, and (f) ALOS PALSAR.
Remotesensing 17 01807 g008
Figure 9. Relationship between terrain relief and evaluation indicators in the TD hinterland: (a) Copernicus, (b) AW3D30, (c) ASTER GDEM V3, (d) SRTM, (e) NASADEM, and (f) ALOS PALSAR.
Remotesensing 17 01807 g009
Table 1. Overview of data used in this study.
DatasetsResolution (m)AcquiredProducerDatum Plain/VerticalMethod SourceVertical Accuracy (m)
ICESat-2 ATL080.728 October 2018–17 July 2024NASAWGS84/WGS84Photon-counting0.1
UAV-DEM0.19 April 2024/WGS84/WGS84Orthophotography0.3
Copernicus302010–2015ESAWGS84/EGM2008X-band radar4
AW3D30302006–2011JAXAWGS84/EGM96Stereo
pan imagery
~4.4 (RMSE)
ASTER GDEM V3302000–2013NASA/METIWGS84/EGM96Stereo
NIR imagery
~8.5 (RMSE)
SRTM v3302000NASAWGS84/EGM96C-band SAR9
NASADEM301999–2000NASAWGS84/EGM96C-band SARNot reported
ALOS PALSAR12.52006–2011ASFWGS84/WGS84L-band radar∼5
Table 2. Evaluation indicators.
Evaluation
Indicators
ExplanationFormula
Elevation Difference (d)Represents the difference between DEM elevation ( h D E M ) and GCP elevation ( h G C P ) in desert areas. d = h D E M h G C P (3)
Standard Deviation (SD)Indicates the degree of dispersion of elevation difference d near the average error ME. S D = ( d M E ) 2 n (4)
Normalized Median Absolute Deviation (NMAD)Represents the absolute difference between the elevation difference d and the median and is an estimate of the standard deviation with a heavy-tailed non-normal distribution [39]. N M A D = 1.486 * m e d i a n i ( d i m e d i a n i { d i } ) (5)
Root Mean Square Error (RMSE)Measures the overall accuracy of DEM data. R M S E = d 2 n (6)
Mean Error (ME)Represents the average difference between DEM and GCP elevations. M E = d n
d represents elevation error; n represents the number of GCPs.
(7)
Mean Absolute Error (MAE)Represents the average absolute difference between DEM and GCP elevations. M A E = d n (8)
Disclaimer/Publisher’s Note: The statements, opinions and data contained in all publications are solely those of the individual author(s) and contributor(s) and not of MDPI and/or the editor(s). MDPI and/or the editor(s) disclaim responsibility for any injury to people or property resulting from any ideas, methods, instructions or products referred to in the content.

