Abstract
The coupling coordination relationship between ecosystem services supply–demand and human well-being in arid inland regions is increasingly vulnerable to imbalance risks under the combined pressures of climate change and intensified anthropogenic activities. Here, we assessed dynamic changes in ecosystem services supply–demand, human well-being, their coupling relationships and influencing factors in the Hexi Regions by integrating remote sensing data, ecological model, ecosystem services supply–demand ratio (ESDR), coupling coordination degree (CCD) model, and the partial least squares structural equation modeling (PLS-SEM). Our results showed that the six key ecosystem services supply, demand, and ESDR in the Hexi Regions from 1990 to 2020 exhibited greater ecosystem services surplus in the Qilian Mountains and stronger deficits in urban and surrounding areas of the Hexi Corridor. The deficit of water yield accounted for 32% in the Hexi Corridor with large cropland irrigated, four times that of the Qilian Mountains, indicating a serious supply–demand mismatch in space and time. Additionally, survival-oriented human well-being across regions is still dominant. Overall, the coupling relationship between ESDR and human well-being in the Hexi Regions progressed towards a high level of coordination, with higher values observed in the oases of the Hexi Corridor and the central and eastern Qilian Mountains. The ESDR of food production and water yield showed a higher coupling coordination level with human well-being in the Qilian Mountains, where the CCD was generally exceeded by 0.7. Climate, vegetation, and land use intensity were key drivers of spatial heterogeneity in CCD. Human well-being made a greater contribution to CCD than other elements in the influence paths. Our results can provide a reference for promoting coordinated development of the ecological environment and sustainable human well-being in arid inland regions.
1. Introduction
Ecosystem services primarily include provisioning, regulating, supporting, and cultural services, which represent the various goods and services that humans obtain from natural ecosystems [1,2]. As a bridge and link between human society and natural ecosystems, it has played a crucial role in promoting the sustainable development of social and human well-being at different times and space scales [3,4]. Natural conditions determine the capacity of ecosystem services supply, while the demand for these services is driven by population size and socio-economic development level [5,6]. The imbalance of ecosystem services supply and demand increased globally due to urban sprawl, population growth, and ecosystem degradation, directly impacting human well-being in aspects such as livelihood, health, security, choice, and freedom of movement [7,8,9]. Exploring effective strategies to promote the synergistic development of ecosystem services and human well-being has long been a significant topic of scientific inquiry and global concern [10,11,12,13]. For instance, global initiatives and platforms, such as the Intergovernmental Science-Policy Platform on Biodiversity and Ecosystem Services (IPBES) [14], Nature-Based Solutions (Nbs) [15], the Sustainable Development Goals (SDGs), Future Earth and the Paris Agreement on Climate Change, have directly or indirectly contributed to ecosystem protection and sustainable utilization, ecological restoration, enhancement in human well-being, and socio-economic development [16,17,18]. The arid inland regions with water scarcity are more vulnerable to climate change, pastoral activities, and cropland expansion, leading to an intensification of the imbalance between the ecosystem services supply–demand and human well-being under the changing environment [19,20,21]. Therefore, exploring and understanding the relationships between the supply and demand of ecosystem services and their connections to human well-being are essential for promoting sustainable development and maintaining ecological balance.
In recent years, several studies have gradually shifted their focus from integrating ecosystem service supply assessment, trade-off relationships, driving forces, and impacts on human well-being to a deeper exploration of ecosystem services demand for realizing sustainability [22,23,24,25]. The primary methods for quantifying the supply and demand of ecosystem services included valuation methods (e.g., the equivalent factor), ecological models (e.g., InVEST, MIMES, ARIES), public participation surveys by sampling and structural interview, and empirical statistical modeling methods [26,27,28,29,30]. The ecosystem services supply–demand ratio (ESDR) has been widely applied for its operability and visualization, effectively illustrating the supply–demand relationship by identifying spatial and quantitative surpluses and deficits in ecosystem services [12,31,32]. However, obtaining detailed datasets on ecosystem service demand remained challenging, as existing data often rely on short time scales and coarse spatial resolutions, such as provincial or municipal levels. Related research has primarily focused on analyzing the supply and demand dynamics of the provisioning services (e.g., water yield, food production, raw material), as well as regulating services (e.g., climate regulation, soil conservation, carbon sequestration) in the urban agglomerations, metropolitan areas, agricultural areas in developed provinces, major river basins, and nature reserves [33,34,35,36]. Less attention has been directed toward the supply and demand of ecosystem services in arid inland regions characterized by mountain–oasis–desert complex ecosystems, despite their unique ecological and socio-economic importance.
Human well-being refers to a good living state in which residents are healthy, happy, and materially abundant, mainly involving basic materials, health, security, social relations, and free choices [10]. Improving human well-being has always been a common goal of human society. At present, the human development index of the United Nations, the human well-being assessment framework of the Millennium Ecosystem Assessment (MA), and the life satisfaction index have been widely used in rural revitalization, poverty alleviation area determined, post-natural disaster risk assessment, and exploring the relationships between ecosystem services and human well-being [37,38,39]. Meanwhile, previous studies have mostly adopted the MA framework aimed at quantifying the relationships linking ecosystem services and human well-being. The evaluation of human well-being indicators has also become more detailed and specific [40,41,42,43], but its index construction and quantitative research remain in the exploratory stage due to the complexity of integrating objective living conditions, subjective feelings, and emotional experiences [44,45]. Additionally, the mismatches between the supply and demand of ecosystem services in space and time may cause negative effects on human well-being. There is a complex, nonlinear relationship connecting human well-being with ecosystem services, shaped by the interaction of ecological processes and socio-economic conditions across multiple scales, where the connections can be positive, negative, or even non-existent.
The coupling (mutual interaction) relationship between ecosystem services supply–demand and human well-being exists owing to the ecosystem and human society influence each other through different interactions [46,47,48]. The coupling coordination degree (CCD) model provides a valuable framework for understanding the intricate relationship between ecosystem services supply–demand and human well-being, which has been used to characterize the development trend of indicators from disorder to order and synergistic effect among them [49,50]. The links between ecosystem services supply, demand, and human well-being have long been discussed, primarily through case analyses on shorter time scales (within 20 years), gradually shifting from the supply side to the demand side, and from examining simple impacts to exploring coupled interactions [51,52,53]. For example, the coupling coordination relationship between ecosystem services supply and human well-being in typical pastoral areas on the Qinghai–Tibet Plateau has been significantly improved from 2000 to 2018 [54]. The increased supply of ecosystem services in the Manas River Basin in Xinjiang, China, can improve basic material needs and health well-being, but reduce their security well-being [55]. Compared with urban areas, residents’ well-being in suburban and rural areas was more susceptible to ecosystem services in Wuhai, Inner Mongolia, China [56]. Most studies have concentrated on the impact of ecosystem service supply on human well-being. Only a few explored the coupling relationship between ecosystem services supply–demand and human well-being, but ignored the driving factors and the analysis of influential paths about how these services affect well-being or their coupling relationships through the supply–demand dynamics.
As key regions for the construction of the Silk Road Economic Belt and the ecological barrier of the Qinghai–Tibet Plateau [57,58], the Hexi Regions in arid inland regions of Northwest China faced many challenges in balancing ecosystem services supply–demand, ensuring ecological security, and sustainably improving human well-being. These systemic pressures manifested through glacial recession, grassland degradation, water retention decline, and land salinization are primarily driven by intensifying climate change impacts superimposed upon escalating anthropogenic activities. Relevant studies have emphasized the contribution of ecosystem services supply to human well-being, providing valuable insights into ecosystem management, ecological restoration, and regional planning, but largely ignoring the coupling relationships between supply–demand and human well-being [59,60,61]. The Hexi Regions are a mountain–oasis–desert complex systems, mainly including the Qilian Mountains (mountainous areas) and the Hexi Corridor (oasis and desert). These regions are sensitive to extreme climate events and exhibit a complex coupled relationship between human and natural systems. Therefore, it is urgent to clarify the coupling relationship between the supply–demand of ecosystem services and human well-being, as well as to develop effective management strategies in the Hexi Regions. In view of this, this study aimed to conduct the following: (1) analyze the spatiotemporal characteristics of ecosystem services the supply, demand, and their supply–demand relationships using InVEST model, empirical statistical models and ESDR, (2) quantify the spatiotemporal dynamics of human well-being, (3) explore the coupling relationship linking ecosystem services and human well-being using the CCD model, and (4) discuss influencing factors and paths of coupled relationship.
The main contribution of this study is to combine ecosystem services supply–demand with human well-being in arid inland regions with fragile ecosystems. By revealing the spatiotemporal dynamic evolution characteristics of ecosystem services supply–demand and human well-being, we further clarified the differential characteristics of ecosystem services and human well-being between mountains (the Qilian Mountains) and plains (the Hexi Corridor). In addition, this study deeply explored the coupling relationship, driving factors and influencing paths between ecosystem services and human well-being in mountains and plains, and proposed targeted ecological functional zoning management strategies and diversified development paths, providing important theoretical basis and practical guidance for promoting sustainable ecosystem management, enhancing human well-being in arid regions, and supporting the construction of national ecological civilization, Northwest China.
2. Materials and Methods
2.1. Study Area
The Hexi Regions lie at the intersection of the arid region of Northwest China, the Qinghai–Tibetan Plateau, and the eastern monsoon region in China, with a total area of about 380,000 square kilometers (Figure 1a). It is characterized by a distinctive mountain–oasis–desert composite ecosystem, mainly including the Qilian Mountains (average altitude 2000~5838 m, extensive grassland) and the Hexi Corridor (average altitude 660~2000 m, widespread sandy land) [62]. The regions experience a typical arid to semi-arid climate, with average annual precipitation ranging from 50 to 700 mm, potential evapotranspiration from 600 to 1600 mm, and temperatures between −12 °C and 12 °C [63]. The study area is adjacent to the desert, with sandy land, bare land, and grassland as the main land types (Figure 1b). This highlights the region’s severe desertification and fragile ecological environment. The Qilian Mountains, rising above 4500 m and covered with glaciers, serve as crucial water sources for several rivers, including the inland drainage basins (Shiyang River, Heihe River, and Shule River) and the exterior drainage of Huangshui River. These rivers provide vital freshwater for sustaining life in the desert [64]. Notably, the Huangshui River is an important tributary of the Yellow River Basin.
In addition, since the 1980s, the government has established several national nature reserves in the Hexi Regions to protect natural ecosystems, including forests, wetlands, and deserts, as well as wild animals and their habitats, such as snow leopards, wild camels, and wild yaks [65]. The regional disparity of the natural geographical environment significantly affects the distribution of population and economic activities in the region. The Hexi Corridor, a key section of the Silk Road Economic Belt in China, has facilitated the political, economic, and cultural exchanges between countries and developed irrigated agriculture in the oases, supporting a dense population [66]. The population of the Qilian Mountains is mainly concentrated in the eastern river valleys, particularly Xining City and Haidong City, which are characterized by extensive grasslands, relatively flat terrain, favorable temperatures, abundant water resources, and a thriving animal husbandry industry [67]. It is worth noting that the spatial heterogeneity of the natural environment and the immobility of ecosystem service supply areas (certain regions where the ecosystem services supply cannot be easily transferred or replicated elsewhere due to localized natural, geographical, or environmental factors) may have resulted in a mismatch between supply and demand in the Hexi Regions, subsequently hindering improvements in human well-being.
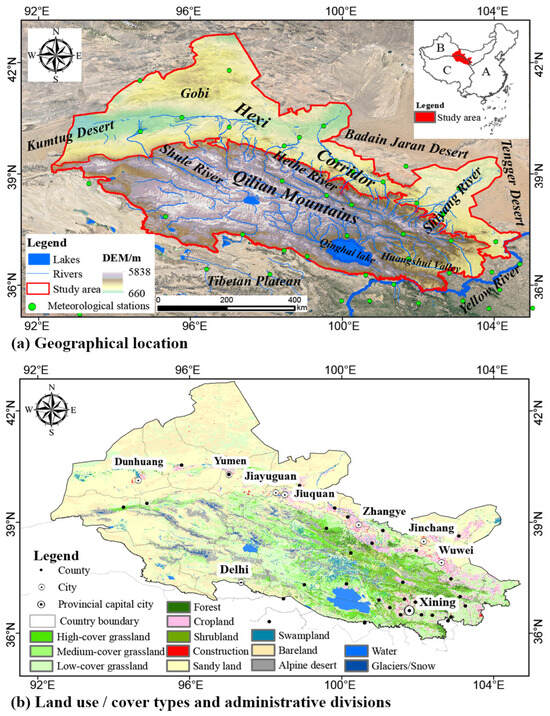
Figure 1.
The geographical location (a), land use/land cover in 2020, and administrative districts of the Hexi Regions, China (b). A, B, and C represent the eastern monsoon region, the northwestern arid region, and the Qinghai Tibetan plateau region of China, respectively [68].
2.2. Data Sources
Data from 1990, 2000, 2010, and 2020 were utilized to evaluate key ecosystem services and environmental factors based on remote sensing data, including land use, topography, climate (temperature, precipitation, potential evapotranspiration), soil properties, vegetation (NPP, NDVI), and socio-economic variables (Table S1). Human well-being indicators, such as per capita income, meat production, grain production, and water resources, were primarily assessed using data from the Statistical Yearbook. Points of interest (POI) data, including information on scenic spots, medical institutions, science and education facilities, were sourced from the Gaode map. Table S1 provides further details on the multi-source data utilized in this research. Figure 2 summarizes the research framework.
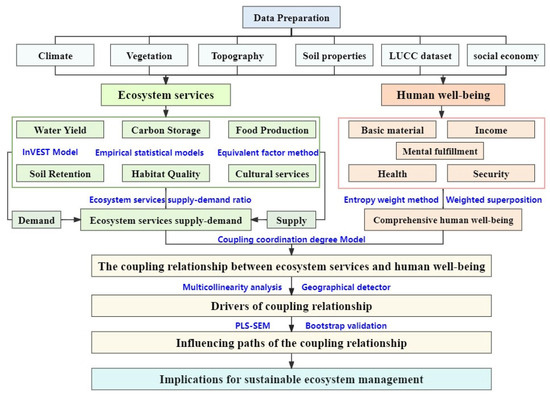
Figure 2.
The research framework in the study.
2.3. Methods
2.3.1. Quantifying the Supply and Demand of Ecosystem Services
The InVEST model, equivalent factor method, and empirical statistical models were used to evaluate the supply and demand of regional key ecosystem services about food, water, biodiversity, carbon, soil, and cultural services (Table S2). Based on land use/cover change, natural environment, and socio-economic data, we employed InVEST software (Version 3.9.2) to assess the supply of ecosystem services, including carbon storage, water yield, habitat quality, and soil retention [69]. More details regarding the calculations for the assessment of ecosystem services supply and demand were provided in Table S2.
The ecosystem services supply–demand ratio (ESDR) was used to measure the deficit, surplus, or balance between the supply and demand of ecosystem services. It was also used to visualize congruences and the mismatches for ecosystem services [24]. The formula is as follows:
where ESDRi is the supply–demand ratio of ecosystem service i, exploring the matching characteristics between them. ESSi and ESDi indicate the supply and demand of ecosystem services i, respectively. ESSimax and ESDimax are the maximum values of supply and demand, respectively [70]. The comprehensive ecosystem service supply–demand ratio (CESDR) was employed to describe the overall status of supply–demand relationships for multiple ecosystem services [61]. The calculation formula is as follows:
where n is the number of ecosystem services, n = 6 in this study; ESDRi is the supply–demand ratio of the ecosystem service i.
2.3.2. Quantifying Human Well-Being
Based on the natural geographical conditions, ecological environment, and socio-economic characteristics of the study area, and combining with the human well-being assessment framework in the Millennium Ecosystem Assessment and related research [10,52,71], we considered the representativeness, accessibility, and comprehensiveness of the data. Ultimately, we selected five dimensional indicators using both county-level and grid-based data, namely income (per capita gross domestic product, per capita disposable income of rural residents), basic material (per capita cultivated land area, per capita grassland area, per capita meat production, per capita grain production, per capita water resources), health (the number of medical personnel in health institutions, the number of beds in health institutions, distance to medical institutions), security (the kernel density of geological disasters, aridity index, fractional vegetation cover) and mental fulfillment (distance to the scientific and cultural institutions, enrollment students in regular primary school, distance to the scenic spots), to construct a comprehensive indicator system for human well-being in the Hexi Regions (Table S3). We utilized tools such as coordinate transformation, feature to raster, kernel density, Euclidean distance, and raster calculator in ArcGIS 10.2 for data processing, and applied the maximum difference normalization method to eliminate the dimensional differences between indicators, ensuring their comparability. The spatial resolution for all data was standardized to 1 km × 1 km, ensuring the accuracy and consistency of the analysis.
The more objective entropy weight method was then used to determine the indicator weights, and on this basis, the weighted summation multi-indicator operation was used to evaluate comprehensive human well-being by weighted superposition of the raster calculator tool. The specific formula is as follows:
where HWB is the comprehensive human well-being; Wj is the entropy weight of the jth well-being indicator; Pj is the standardized value of the jth well-being indicator; Hj is the information entropy of the jth well-being indicator; m is the number of well-being indicators.
2.3.3. Coupled Relationship Between Ecosystem Services Supply–Demand and Human Well-Being
Variations in the capacity to supply and the demand for ecosystem services influence the balance between them. There exists a complex coupling relationship of mutual influence and interaction between the ecosystem services supply–demand and human well-being. The complex interactive relationship can be reflected by calculating the coupling coordination degree between the supply–demand of ecosystem services and human well-being [72]. The specific calculation formula is as follows:
where CCD is the coupling coordination degree between ESDR and human well-being, which is in [0, 1]; the larger value indicates a better coupling and coordinated development of the system, transitioning from disorder to order [73]. C is the coupling degree, the smaller the value, the more discrete the elements; Ts is the comprehensive coordination index; ESDRs and HWBs are the standardized values of ESDR and human well-being respectively; Ts is the comprehensive coordination index; α and β are the comprehensive coordination evaluation coefficients of ESDR and human well-being, respectively. Since there is no unified standard for CCD classification, we defined three coupling coordination levels—high (≥0.65), medium (0.65~0.55), and low (<0.55)—based on the fragile natural environment and complex human–nature relationship in the study area, as well as previous research. If the data follow a normal distribution, the proportions of area under each coordination level are approximately 20~30%, 40~50%, and 20~30%, respectively. This classification may help to better illustrate the spatial differences in regional coordination development.
2.3.4. Influencing Factors of Coupling Relationships
The tolerance and variance inflation factor (VIF) analysis was employed to identify severe multicollinearity (tolerance was less than 0.1 or VIF greater than 10) among variables [74]. Initially, based on the variations in natural geography and socio-economic conditions as well as existing studies, we selected 15 environmental factors, including topography, climate, hydrology, soil, vegetation, and socio-economic conditions (Table S4). Subsequently, we removed those with severe collinearity and low contribution through collinearity tests and the geographical detector analysis, ultimately selected 10 environmental variables as the drivers for the CCD, including five natural conditions—potential evapotranspiration (PET), net primary productivity (NPP), annual mean precipitation (PRE), annual mean temperature (TEMP), organic carbon density (SOCD)—and five social and economic factors—distance to settlements (DST), land use intensity index (LUI), gross domestic product (GDP), population density (POP), road density (ROAD). The geographical detector analysis was employed to quantify the explanatory power of each driving factor in accounting for the spatial heterogeneity of CCD by the factor detector, explore the intensity (weakened or enhanced) of interactive effects and compare whether there are significant differences between different factors on CCD using the interaction detector and ecological detector, respectively [75].
2.3.5. Influencing Paths of Coupling Relationships
Since the partial least squares structural equation modeling (PLS-SEM) was more suitable for variables with non-normal distributions than other models [76], we applied this method to further quantify the influential paths among ecosystem service supply, demand, ESDR, human well-being, and CCD. This approach also allowed us to explore their complex logical relationships and internal connections. When Cronbach’s alpha and Dillon–Goldstein’s rho exceed 0.7, indicating that the latent variable adequately explains the variance in its corresponding block of indicators, the determination coefficient (R2) and Goodness-of-Fit (GoF) were used to evaluate the performance of the entire model [77]. GoF values and R2 range from 0 to 1, with higher values indicating a better model fit. The bootstrap validation was employed to assess the precision of the PLS-SEM parameter estimates using the plspm package in R, which provided bootstrap resampling to obtain the original value of the parameters (e.g., path coefficients, R2, total effects), the bootstrap mean value, the bootstrap standard error, and the lower percentile and upper percentiles of the 95% bootstrap confidence intervals [76]. In the theoretical structural equation model, ecosystem services including water yield (WY), food production (FP), carbon storage (CB), soil retention (SR), habitat quality (HQ) and cultural services (CS) supply, demand, ESDR, human well-being, and CCD were latent variables. The observed variables of supply(S) were CBS, WYS, FPS, HQS, SRS, and CSS. The observed variables of demand(D) were CBD, WYD, FPD, HQD, SRD, and CSD. The observed variables of ESDR were CBESDR, WYESDR, FPESDR, HQESDR, SRESDR, and CSESDR. The observed variables of human well-being included income, basic material, health, security, and mental fulfillment. The observed variables of CCD were CBCCD, WYCCD, FPCCD, HQCCD, SRCCD, and CSCCD. The research hypothesis is as follows: ecosystem service supply, demand, ESDR, and human well-being will affect CCD. The geographical detector and the PLS-SEM were performed using the geodetector package and the plspm package in R software (Version 4.0.2), respectively.
3. Results
3.1. The Spatio-Temporal Dynamics of Ecosystem Service Supply–Demand
Over the past three decades, the supply, demand, and ESDR of the six ecosystem services in the whole Hexi Regions showed obvious spatial heterogeneity (Figure 3, Figure 4, Figure 5, Figure 6, Figure 7 and Figure 8). In particular, the supply of water yield, food production, carbon storage, soil retention, habitat quality, and cultural services for spatial distribution was relatively consistent, with high values in the mountains and low in the plains, increasing from the northwest to the southeast (Figure 3, Figure 4, Figure 5, Figure 6, Figure 7 and Figure 8). However, the spatial distribution of ecosystem services demand was opposite, except for soil retention (Figure 6). High-demand areas for most ecosystem services with high urbanization and consumption expenditure were concentrated in agriculturally rich regions, populous towns, and industrial agglomeration zones, such as the oases of the Hexi Corridor and the Huangshui River basin in the eastern region of the Qilian Mountains. Low-demand areas included glaciers and alpine deserts in the Qilian Mountains, which were characterized by higher altitudes, abundant precipitation, glacier meltwater, relatively low evaporation, and minimal human disturbance, as well as sandy lands in the Hexi Corridor, with sparse populations, lower food consumption, and carbon storage. Except for water yield, the supply and demand of food production, carbon storage, soil retention, habitat quality, and cultural services generally showed an increasing trend over the years (Figure S1). The trend of water yield demand changed in the opposite direction, with the most obvious decline observed in the Hexi Corridor, where the total reduction reached 23.67 billion m3. Besides, the water yield demand was greater than the supply in the Hexi Corridor, which was 3.47 times that of the Qilian Mountains (Figure S1). Obvious mismatches were observed in the spatial distribution of water yield supply–demand.
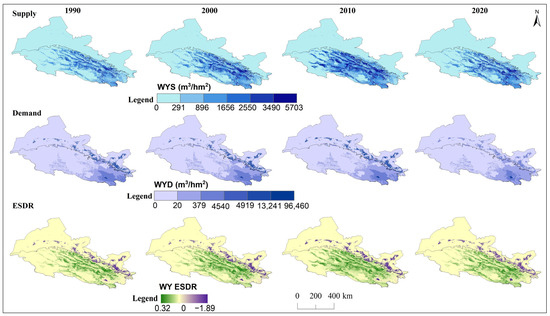
Figure 3.
Spatial distribution of supply, demand, and ESDR for water yield (WY) in the Hexi Regions.
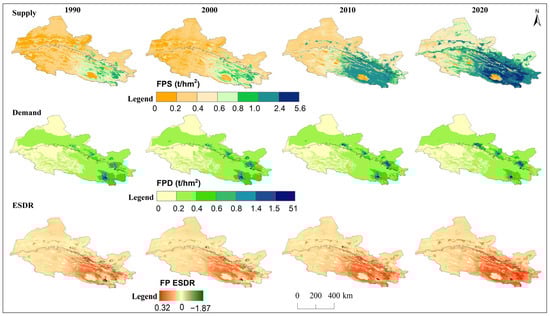
Figure 4.
Spatial distribution of supply, demand, and ESDR for food production (FP) in the Hexi Regions.
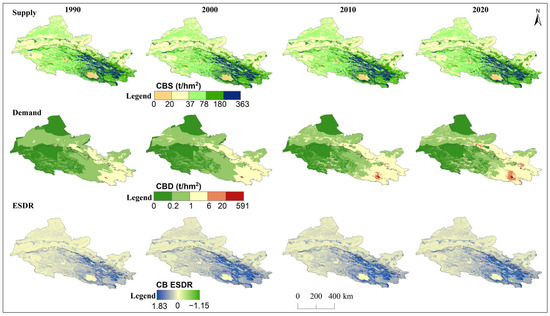
Figure 5.
Spatial distribution of supply, demand, and ESDR for carbon storage (CB) in the Hexi Regions.
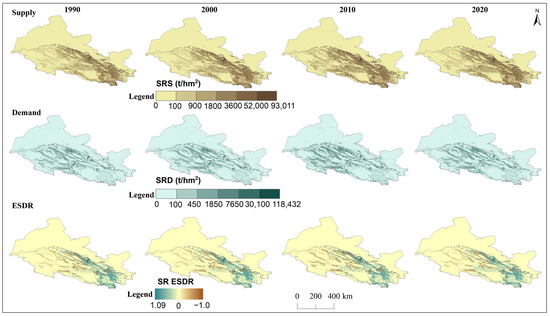
Figure 6.
Spatial distribution of supply, demand, and ESDR for soil retention (SR) in the Hexi Regions.
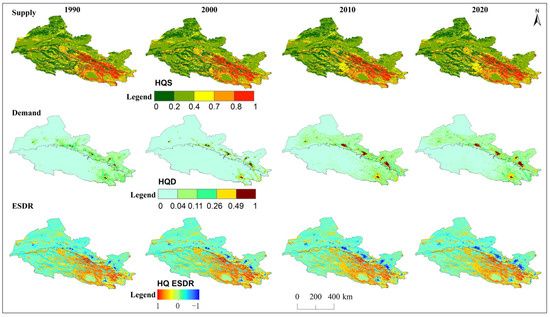
Figure 7.
Spatial distribution of supply, demand, and ESDR for habitat quality (HQ) in the Hexi Regions.
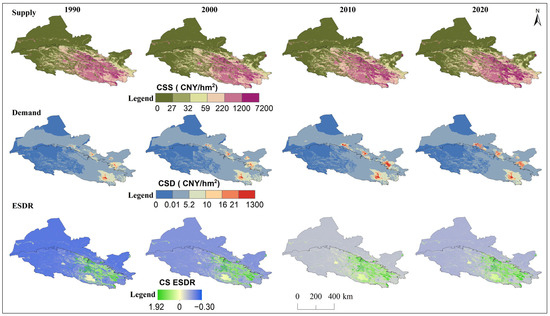
Figure 8.
Spatial distribution of supply, demand, and ESDR for cultural services (CS) in the Hexi Regions.
The ESDR of water yield tended to decline over time (Figure 9), but the water yield supply exceeded demand in the Qilian Mountains and the surrounding areas, resulting in a spatial surplus (Figure 3). The negative ESDR of water yield in oases indicated that most cities experienced water shortfalls during this period due to farmland irrigation. The ESDR of water yield in the Hexi Corridor showed an upward trend, driven by reduced agricultural water consumption. The ESDR for food production showed an increase, with supply consistently surpassing demand. Spatially, food production and carbon storage experienced oversupply in the Qilian Mountains and oases areas, with this oversupply gradually expanding over time, while other regions experienced a short supply (Figure 4 and Figure 5). As intense human activities and economic development may lead to a rapid increase in carbon demand and a decrease in the ESDR (Figure 9). The supply and demand for habitat quality were evident mismatches in the oases of the Hexi Corridor, with low supply and high demand, in contrast to the mountains, which experienced less human interference. The positive values of the ESDR indicated surpluses of soil retention, habitat quality, and cultural services in the whole Hexi Regions (Figure 9). The spatial distribution of ESDR revealed that the six ecosystem services were generally in surplus, with deficits in habitat quality, food production, and carbon storage accounting for less than 2%; cultural services showed an imbalance of 11%. The water yield deficit in the Hexi Corridor accounted for 32%, which was four times higher than that in the Qilian Mountains. Except for water yield in the Hexi Corridor, the ESDR of the other five ecosystem services was always greater than zero, indicating that they were in a state of overall surplus and met internal demand or consumption.
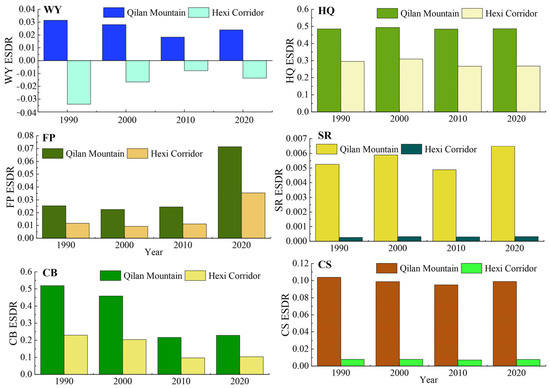
Figure 9.
Temporal changes in ESDR for various ecosystem services in the Hexi Regions.
3.2. The Spatio-Temporal Dynamics of Human Well-Being
Human well-being in the Hexi Regions exhibited obvious spatial variations and generally increased along a gradient from the northwest to the southeast (Figure 10). Specifically, high-value areas of basic material and security well-being were mainly located in the central mountains and oases, benefiting from a favorable ecological environment. These regions had better ecological resilience to withstand the challenges posed by the surrounding harsher environments, leading to more stable living conditions and enhanced quality of life for residents. Moreover, these low-value areas were mainly characterized by harsh living environments with sandy and alpine deserts due to the extreme temperatures, limited precipitation, or infertile soil. Meanwhile, mental fulfillment and health well-being were notably higher in urban areas characterized by intense human activity, advanced urbanization, abundant educational resources, and well-developed health and entertainment facilities, such as Xining City, Wuwei City, Zhangye City, and Jiuquan City. Income well-being was generally prominent in the western regions of the study area compared to other dimensions of well-being. These regions, rich in mineral resources, had been home to several industrial and mining enterprises, yet they had small populations and high per capita GDPs.
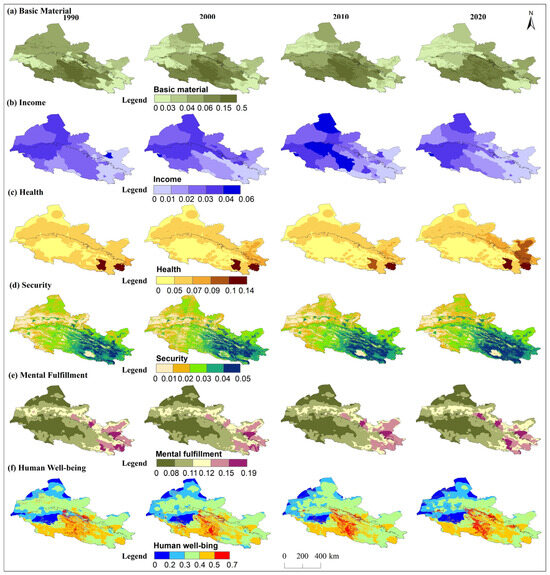
Figure 10.
Spatial distribution of basic material, income, health, security, mental fulfillment, and human well-being in the Hexi Regions.
Overall, human well-being in the Hexi Regions remained relatively stable over the period. Specifically, in 2020, the comprehensive human well-being scores were 0.27 for the Qilian Mountains and 0.20 for the Hexi Corridor, respectively, both of which showed a change of 0.01 compared to 1990 (Figure 11a). Among the five sub-components of human well-being in the Hexi Corridor, mental fulfillment, health, basic material, and income well-being made relatively larger contributions, accounting for approximately 45%, 29%, 16%, and 6%, respectively. The contribution of security well-being was less than 5%, though it has increased slightly. Among the indicators, the most obvious changes were in health and basic material well-being. The proportion of health well-being increased by 3%, while that of material well-being decreased by 3%. In the Qilian Mountains, the largest proportion of human well-being was attributed to basic material well-being and income, which together contributed about 46% (Figure 11b). Mental fulfillment and health well-being accounted for 30% and 20%, respectively, while security well-being made up a relatively low proportion. Basic material well-being showed a noticeable increase of 3%, while changes in other aspects of well-being were around 1%. These changes can be attributed to the high-altitude, cold environment in the central and western parts of the mountains, a sparse population, low overall economic development, and relatively weak and scattered medical and health facilities.
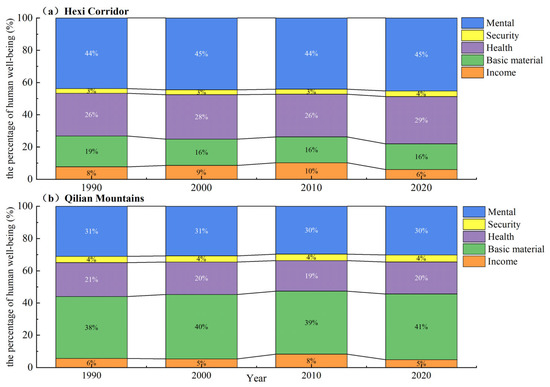
Figure 11.
Temporal changes in various aspects of human well-being in the Hexi Regions.
3.3. The Coupling Relationship Between Ecosystem Services and Human Well-Being
The results showed that, during the study period, approximately 32% of the Hexi Regions exhibited a high coordination level (CCD greater than or equal to 0.65), 50% had a medium coordination level (between 0.55 and 0.65) and 18% were at a low coordination level (less than 0.55) (Figure 12). Overall, the mean CCD linking ecosystem services supply–demand and human well-being across the entire region was generally good, ranging from 0.60 to 0.64, but it is worth noting that low-coordination areas may face the risk of unbalanced development. In particular, the coupling relationship between comprehensive ESDR and human well-being in the Hexi Regions showed evident spatial differences, increasing from northwest to southeast, with high value areas in the oases of the Hexi Corridor and the central and eastern regions of the Qilian Mountains (Figure 12). In 2020, the CCD was 0.67 for the Qilian Mountains and 0.59 for the Hexi Corridor. Compared with 1990, these values increased by 0.042 and 0.024, respectively. This suggests that their CCD was moving toward a higher level of coordination. The CCD in the Hexi Corridor was lower than that in the Qilian Mountains, with values ranging from 0.57 to 0.59, indicating weaker coupling coordination in this region.
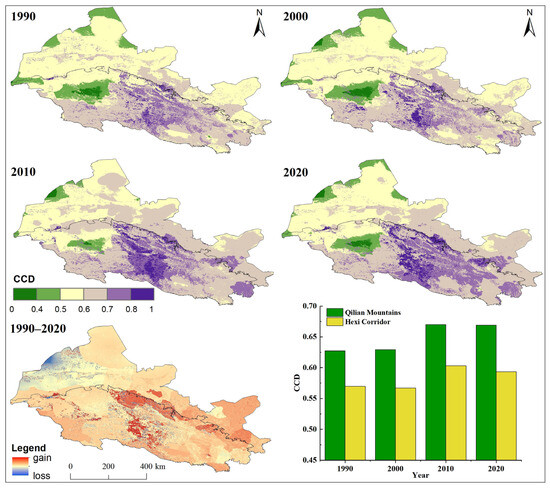
Figure 12.
Spatial distribution of CCD between comprehensive ESDR and human well-being in the Hexi Regions.
From the coupling relationship linking various ESDR with human well-being, it was found that over the past 30 years, the ESDR of food production and water yield had a higher coupling coordination level with human well-being, especially in the Qilian Mountains, where the CCD was generally greater than 0.7 and the changes were relatively stable (Figure 13). The second was the CCD between the ESDR of habitat quality, carbon storage, and soil conservation, and human well-being, ranging from 0.59 to 0.67. Simultaneously, the CCD between the ESDR of cultural services and human well-being was relatively low, with a value below 0.5, indicating that the coordination level needed improvement. In addition, the CCD of carbon storage, cultural services, and human well-being increased obviously, particularly in the Hexi Corridor, with increases of 35.34% and 29.74%, respectively. To further enhance the CCD, local governments should expand cultural services supply channels on the basis of protecting the ecological environment, meeting the diverse needs of residents, and paying attention to the comprehensive development of human well-being.
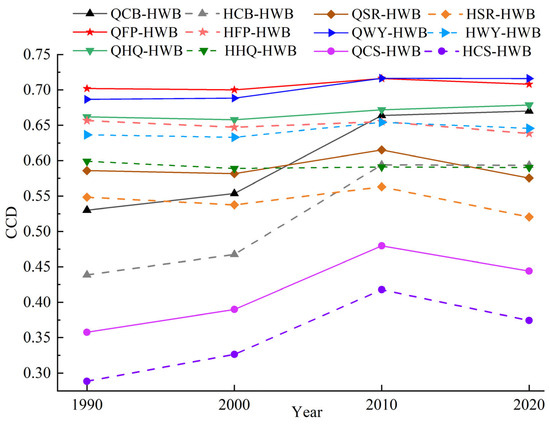
Figure 13.
The CCD between multiple ESDR and human well-being (HWB) in the Hexi Regions. Note: Q and H represent the Qilian Mountains and Hexi Corridor, respectively.
3.4. Drivers of Coupling Relationship
In the Hexi Corridor, the geographical detector analysis revealed that the q value for potential evapotranspiration was 0.45, explaining over 44.54% of the spatial variation in CCD observed over the past 30 years (Table 1); the spatial differentiation of the CCD was influenced by several key factors, with the annual mean precipitation, distance to settlements, land use intensity, NPP, and soil organic carbon density, all accounting for over 27% of the variation. Although the explanatory power of other factors, such as the annual mean temperature, was less than 10%, these factors still played a significant role in influencing CCD (Table 1). Compared to the Hexi Corridor, NPP exhibited the highest q value (0.31), mainly accounting for 31.25% of the CCD observed in the Qilian Mountains, followed by annual mean precipitation (29.85%), potential evapotranspiration (27.50%), soil organic carbon density (22.63%), and annual mean temperature (3.12%). In addition, among human-related factors, LUI accounted for 26.19% of the spatial variation in CCD, whereas other factors in the mountains exhibited a comparatively weaker influence on explaining CCD variability (q values were less than 4.5%). These findings implied that climate, vegetation, and land-use intensity were key elements influencing the CCD in the Hexi Regions over an extended period.

Table 1.
The factors affecting the CCD in the Hexi Regions.
The explanatory power (q(xi∩xk)) of any two drivers on the CCD was enhanced or weakened through their interaction effects (Table S5). Moreover, except for TEMP and ROAD, the statistically significant difference in the paired factors on the spatial distribution of CCD is shown in Figure S2. The results suggested that the combined interactions of drivers exerted a greater influence on the CCD compared to the impact of each individual driver alone, including bilaterally enhanced and nonlinearly enhanced (Figure 14). Specifically, the interactive effects of multiple factors, including NPP, PRE, DST, GDP, POP, ROAD, and LUI, on the CCD in the Hexi Corridor have shown a mutually reinforcing relationship (Figure 14a), which primarily occurred as bilateral interactions among the factors. For example, the q values for LUI and PET were 0.29 and 0.45, respectively (Figure 14a), while the q value for their interaction increased to 0.55 (Max(q(LUI), q(PET)) < q(LUI∩PET) < q(LUI) + q(PET). The q values for TEMP and PET were 0.05 and 0.45, respectively, while the interaction between them exhibited a q value of 0.53. Compared to the Hexi Corridor, the interactive effects of environmental factors on CCD in the Qilian Mountains were predominantly characterized by nonlinear enhancement (as indicated by the red numbers in Figure 14b). Moreover, natural factors played a significantly greater role in influencing CCD than anthropogenic factors. For instance, the q values for NPP and TEMP were 0.03 and 0.3, respectively. However, their interaction significantly increased the q value to 0.38 (q(NPP∩TEMP) > q(NPP) + q (TEMP)). The q values for DST and PET were initially 0.04 and 0.27, respectively. However, following their interaction, the combined q value increased to 0.32 (q(DST∩PET) > q(DST) + q (PET)), exceeding the sum of their individual q values. Furthermore, the mutual effect of LUI and precipitation can account for nearly 45% of the variation in the CCD. Overall, the interaction between human activities and natural conditions has had a stronger impact on CCD in mountainous areas.
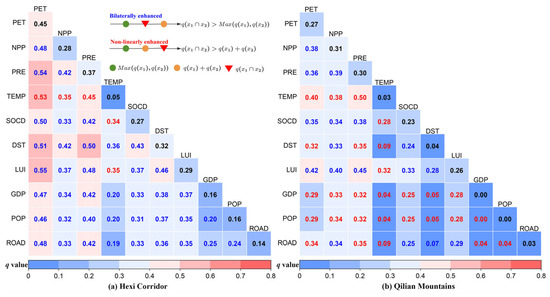
Figure 14.
Interactive effects of each paired factor on the CCD.
3.5. Influencing Paths of the Coupling Relationship
The PLS-SEM results were acceptable because the ecosystem service supply, demand, ESDR, and human well-being collectively explained approximately 75% of the total variation in CCD within the Hexi Corridor and 69% in the Qilian Mountains; the Cronbach’s alpha and Dillon–Goldstein’s rho exceed 0.7, indicating that the latent variable adequately explains the variance in its corresponding block of indicators. Additionally, the values of the GoF, ranging from 0.56 to 0.60, indicated that the model had a moderate fitting effect and reasonably explained the relationships to some extent. The path coefficients (direct), indirect effects, and total effects were estimated and validated using bootstrap validation (Tables S6–S8). Specifically, as shown in Figure 15, in the Qilian Mountains, human well-being demonstrated a direct positive influence on CCD, with a high path coefficient of 0.79. The path coefficient of ecosystem services supply (ESS) was −0.13, suggesting a direct negative impact of ESS on CCD. However, ESS primarily exhibited a predominantly indirect positive effect on CCD (0.65), mediated through improvements in human well-being and ESDR (Table S6, Figure 15). Notably, ESS also exerted a greater direct positive effect on both human well-being (0.96) and ESDR (0.85). ESDR also exerted a direct negative impact on HWB (−0.35), which may result from the overall spatial mismatch with high supply and low demand due to the lower intensity of human activities in mountainous regions. In the Hexi Corridor, human well-being and ESS had stronger direct effects on CCD, with path coefficients of 0.88 and 0.35, respectively. Compared with mountains, due to higher population density and insufficient supply of ecosystem services, ESDR and ESD in the Hexi Corridor exhibited a direct negative impact on CCD, with path coefficients of −0.22 and −0.20, respectively. The indirect positive effect of ESD on CCD through HWB (0.43) was greater than the direct negative effect (−0.20). Meanwhile, the direct effect of ESS on HWB was slightly weaker and positive than that in mountainous areas (Figure 15); on the contrary, ESD had a significant promoting effect on HWB, possibly associated with greater demand exceeding supply.
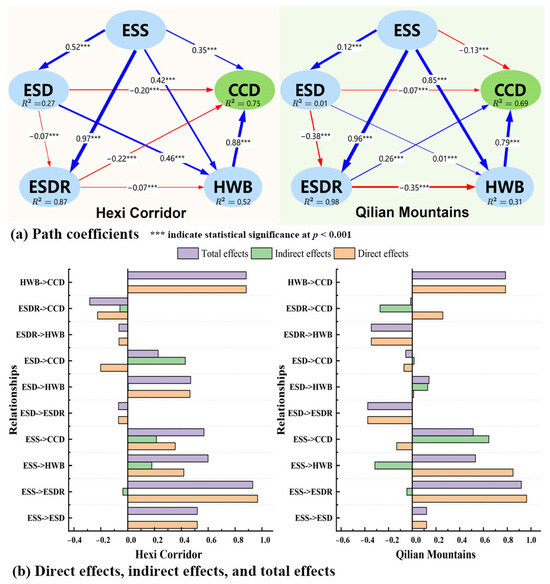
Figure 15.
The impact paths of ecosystem services and human well-being on CCD in the PLS-SEM. ESS, ecosystem services supply; ESD, ecosystem services demand; ESDR, ecosystem service supply–demand ratio; the ecosystem services including CB, WY, FP, SR, HQ, and CS; HWB, human well-being including income, basic material, health, security, and mental fulfillment; CCD, coupling coordination degree.
4. Discussion
4.1. Linking Ecosystem Services Supply, Demand, Human Well-Being, and CCD
There were significant positive effects of ESS on ESDR and promoted human well-being (Figure 15), which was consistent with previous conclusions [78]. However, there were large spatial differences among regions [79], and the impact of ESS on human well-being was obviously greater in the mountainous regions compared to the Hexi Corridor [61]; their economic resources and material satisfaction were more dependent on ecosystem services [80]. In addition, the arid and water-scarce natural environment, higher population density, and intense human activities in the Hexi Corridor, coupled with low grassland coverage, have increased ecosystem services demand and exacerbated the spatial mismatch between supply and demand of ecosystem services, which has had a negative impact on human well-being and CCD. In fact, the supply of water yield contributed to material production services; the supply and demand of water yield in the oases were unbalanced, leading to a series of negative consequences. Previous studies have presented similar results in a typical mountain–oasis–desert region of the Manas River Basin, located in Xinjiang, China [81]. The mismatches between provisioning services supply and demand impacted farmers’ well-being in both humid and semi-arid regions of the agro-ecological zone in the East African Rift, primarily due to population pressure [12]. In general, ESDR had a direct or indirect negative impact on human well-being and CCD in the Qilian Mountains. This may be due to the fact that, in the alpine environment, the generally low intensity of human activities and good ecological capital have not been fully transformed into economic and social benefits due to geographical restrictions and ecological protection policies, making it more difficult to improve human well-being. For example, challenges include incomplete medical infrastructure, limited public facilities, insufficient educational resources, and poor transportation. Moreover, only a small portion of the many ecosystem services generated in the Qilian Mountains benefit residents, with the remainder being exported out of the mountains [82]. The beneficiaries of ecosystem services (such as water conservation, carbon sequestration, and biodiversity) are mostly downstream or external areas (such as cities and industrial areas).
4.2. Impacts of Driving Factors on Coupling Relationship
The above analysis of influencing factors showed that natural environmental characteristics strongly influenced the coupling relationship between the ecosystems and well-being compared to the socio-economic variables, which was also supported by a previous study [50]. The bivariate spatial autocorrelation analysis was used to continually explore significant spatial heterogeneity between CCD and key factors in the Hexi Regions, mainly presented in the positive correlation within high-high clusters and low-low clusters (Figure 16). In the Hexi Corridor, a significant negative correlation between CCD and PET was observed, characterized by low-high aggregation, which accounted for 29.12% of the total area. However, there was a positive correlation between CCD and LUI with high-high aggregation, accounting for 5.73% of the total area, which was mainly distributed in oases with large areas of cropland, dense populations, developed economies, convenient transportation, and sufficient food. The conclusion was also supported by previous studies [72,83,84]. The CCD in the Hexi Corridor showed a positive correlation (low-low cluster) with NPP, PRE, and SOCD, accounting for about 32.37%, and was mainly distributed in sandy land with low vegetation coverage. Additionally, there was a negative correlation between CCD and PET in the Qilian Mountains with high-low aggregation, accounting for 28.24%. There was a positive correlation between CCD and NPP, PRE and SOCD, accounting for 17.94 to 25.77%, mainly concentrated in the central and eastern mountainous areas with better living conditions. There was also a negative correlation between CCD and LUI, accounting for 12.90%, primarily concentrated in the central and eastern Qilian Mountains, characterized by less human interference, abundant water resources, adequate food supply, and limited urban expansion.
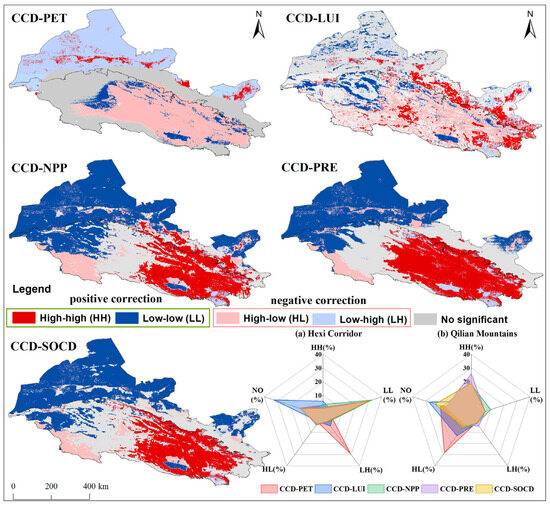
Figure 16.
Bivariate spatial autocorrelation map of environmental factors and CCD. The radar chart indicates positive and negative corrections as a percentage of the total study area.
4.3. Implications for Sustainable Ecosystem Management
Based on human well-being, the ESDR and their coupling relationship, the three-dimensional space was defined with the x-axis, y-axis, and z-axis, and classified into three levels: low, medium, and high. Next, based on the principles of “low ESDR-high well-being and medium to high CCD as priority, medium ESDR-medium well-being and medium CCD as potential, and high ESDR-high well-being and medium to high CCD as moderate”, we aimed to identify the ecological zoning management strategies and governance models. The results indicated that the priority regulated zone, key monitored zone, potential improved zone, and moderate optimized zone accounted for 0.66%, 48.19%, 26.77%, and 24.39% of the total area, respectively (Figure 17). Priority-regulated zones were predominantly concentrated in densely populated urban areas with relatively complete infrastructure, which exhibited medium-high well-being and lower ESDR, but medium–high CCD. Although these areas were spatially dispersed, the social demand for ecosystem services exceeded supply. Priority should be given to expanding ecosystem services supply channels by strengthening intercity connectivity, enhancing green infrastructure by constructing urban ecological corridors, restoring the connectivity of river and lake systems, and further improving water purification processes and the living environment. The well-being, ESDR, and CCD of the potentially improved zone were all at a medium level. This zone was distributed in strips across the oases of the Hexi Corridor. It featured large areas of cropland but faced challenges with water scarcity and salinization. By integrating water-saving irrigation technologies and constructing an intelligent agricultural system, it is possible to efficiently utilize water resources, further enhance crop yields, improve resident income, and promote sustainable farmland development. The well-being and ESDR in the key monitored zone were not well matched (low well-being, medium-high ESDR), and the CCD was at a medium-low level, which was widely distributed throughout the whole region. Particularly, the Hexi Corridor was characterized by an arid climate, low vegetation coverage, extensive sandy land, frequent sandstorms, and a fragile ecological environment. It has been highly susceptible to extreme climate events and irrational human activities. Authorities should further improve and optimize the ecological environment to prevent desertification and build a solid ecological security barrier. For instance, the locals can leverage abundant wind and solar energy resources to develop the wind–solar power station, promote green industries (e.g., ecovoltaics), and enhance infrastructures through the construction of roads and power grids, improving transportation, communication networks, and ensuring a reliable power supply in remote areas. Furthermore, it is crucial to achieve a harmonious balance among ecological restoration, sustainable energy development, and rural revitalization. The comprehensive well-being and ESDR in the moderate optimized zone were at a high level, and the CCD was also highly coordinated. This zone was primarily located in the central and eastern parts of the Qilian Mountains, characterized by high vegetation coverage and less human interference. As an important part of the national key ecological functional area, it should prioritize ecological protection and restoration, while moderately developing ecotourism, ecological agriculture, and husbandry. The locals can promote livelihood diversification, encourage residents to participate in ecotourism, natural study, photography, scientific research, monitoring, etc., and strengthen the vocational skills of farmers and herdsmen to increase income and improve ecological protection and survival skills.
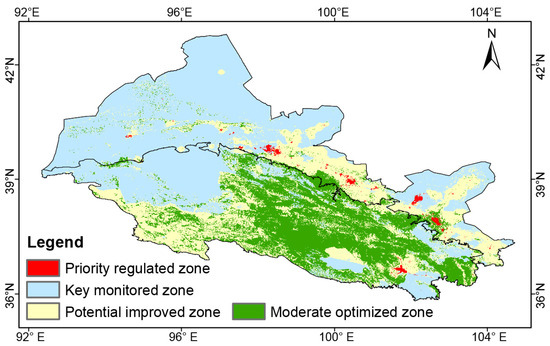
Figure 17.
Spatial pattern of zoning control and strategy in the Hexi Regions.
4.4. Limitations and Directions
We analyzed the spatiotemporal dynamics of key ecosystem services supply, demand, and human well-being in a typical semi-arid region, as well as the coupling relationships, driving factors, and influential paths among them. Most existing studies have primarily focused on how the supply of ecosystem services influences human well-being, while giving comparatively little attention to the demand for these services. What made our study different from previous studies was that it explored the influential paths among ecosystem service supply, demand, supply–demand relationship, human well-being, and coupling relationship in the mountains and plains. However, there are still some limitations and uncertainties that need to be improved. The high cost of subjective well-being surveys (including human, material, and financial resources) limits the availability of data to a certain extent (especially the lack of long-term series data) [85]. Currently, it is still challenging to obtain high-resolution spatiotemporal data on subjective well-being in larger areas, and related studies have been mostly concentrated on smaller scales, such as districts [54], cities [56], small watersheds [86], wetlands, or national reserves [35]. In contrast, objective well-being can better reflect long-term trends and the resident well-being at the group level [87] and is more suitable for research on larger regional scales [88]. In future studies, we will focus on incorporating micro-level subjective well-being to make up for the current shortcomings. It is worth noting that, consistent with other relevant studies, this research also used the arithmetic mean method to calculate the comprehensive ecosystem service supply–demand ratio [89,90,91] and reduce possible subjective bias by assigning equal weights to all indicators. However, this method often overlooks the differences among various services owing to the lack of a robust empirical consensus regarding their relative contributions for each service. In subsequent studies, we plan to introduce resident preference surveys or expert scoring mechanisms, combined with more extensive empirical data, to further explore the feasibility of differentiated weight allocation of ecosystem services. The accuracy of the InVEST model depends on the biophysical parameters, generally derived from the literature and empirical methods. The intricate dynamics of ecosystem services and their interplay with human well-being necessitate higher-resolution, more comprehensive data from field investigations to enhance accuracy [92]. In the future, it will be necessary to obtain more detailed data variables through methods such as targeted sampling, questionnaire survey and in-depth interviews, which further analyze the coupling correlation network and the underlying formation mechanism between multiple ecosystem services supply–demand and human well-being, ultimately leading to more effective strategies for sustainable development and ecosystem management.
5. Conclusions
This study found that the supply, demand, and ESDR of the six key ecosystem services in the Hexi Regions showed obvious spatial heterogeneity from 1990 to 2020. The positive ESDR values over time indicated a surplus in food production, carbon storage, soil retention, habitat quality, and cultural services within the entire regions, whereas water yield showed a deficit in the Hexi Corridor due to a serious supply–demand mismatch in space and time. Additionally, human well-being in the Hexi Regions was relatively stable over time. Basic material, mental fulfillment, and health well-being contributed more, accounting for more than 80%, while security and income well-being accounted for a relatively low proportion. Overall, the coupling relationship between ESDR and human well-being in the Hexi Regions was moving toward a higher level of coordination, with high values in the oases of the Hexi Corridor and in the central and eastern Qilian Mountains. The ESDR of food production and water yield exhibited a higher coupling coordination level (above 0.7) with human well-being in the Qilian Mountains.
The supply of ecosystem services had a direct positive effect on ESDR, which in turn promoted human well-being across the entire region. Human well-being made a greater contribution to CCD than other elements. In the Qilian Mountains, ecosystem service supply had a direct negative effect on CCD (−0.13), but an indirect positive effect on CCD (0.65) through human well-being. ESDR exerted a generally indirect negative impact on CCD (−0.27) through human well-being (−0.35) in mountains because ecological capital had not been fully transformed into economic and social benefits. Conversely, ESDR and ecosystem service demand in the Hexi Corridor had a negative impact on CCD, likely owing to greater water demand exceeding supply. Additionally, climate, vegetation, and land use intensity were key drivers of the spatial heterogeneity in CCD. Our conclusions can provide valuable insights through zoning management and diversified approaches for improving human well-being to promote the coordination of human–environment in arid inland regions with fragile ecosystems.
Supplementary Materials
The following supporting information can be downloaded at: https://www.mdpi.com/article/10.3390/rs17101787/s1. Figure S1: Temporal changes in supply and demand for ecosystem services in the Hexi Regions; Figure S2: The significant differences in the effects of each paired factor on the spatial distribution of CCD. Y indicates statistical significance at p < 0.05, N means not significant; Table S1: Data sources in the study; Table S2: Methods for quantifying supply and demand of ecosystem services [24,61,69,93,94,95,96,97,98,99]; Table S3: The evaluation index system for human well-being in the Hexi Regions; Table S4: Multicollinearity analysis of influencing factors on the CCD; Table S5: Types of interaction between two covariates; Table S6: Direct, indirect and total effects on CCD in the PLS-SEM; Table S7: Direct effects on CCD of original model values and bootstrap-estimated values; Table S8: Total effects on CCD of original model values and bootstrap-estimated values.
Author Contributions
Y.L.: Conceptualization, Methodology, Writing–original draft, Writing–review and editing, Visualization, Funding acquisition. W.L.: Conceptualization, Writing–review and editing, Funding acquisition. M.Z.: Methodology, Software, Resources, Writing–review and editing. Q.F.: Conceptualization, Resources, Supervision. L.Y.: Visualization, Resources, Data curation. J.Z.: Software, Data curation, Supervision. Z.Y. and X.Y.: Methodology, Data curation. All authors have read and agreed to the published version of the manuscript.
Funding
This research was funded by the National Key R&D Program of China (Nos. 2022YFF1303301 and 2022YFF1302603), the Natural Science Foundation of Shandong Province (ZR2024QD288), the National Natural Science Fund of China (Nos. U24A20178, 52179026 and 42201133), the Gansu Provincial Science and Technology Planning Project (Nos. 23ZDFA018 and 23ZDKA017), and the National Grass Industry Technology Innovation Center (preparation) Key Innovation Platform Construction Project (CCPTZX2024GJ04).
Data Availability Statement
The data presented in this study are available on request from the corresponding author.
Conflicts of Interest
The authors declare no conflicts of interest.
References
- Costanza, R.; D’Arge, R.; de Groot, R.; Farber, S.; Grasso, M.; Hannon, B.; Limburg, K.; Naeem, S.; O’Neill, R.V.; Paruelo, J.; et al. The value of the world’ s ecosystem services and natural capital. Nature 1997, 387, 253–260. [Google Scholar] [CrossRef]
- La Notte, A. The importance of ecosystem services to support the governance of critical ecological assets. Ecosyst. Serv. 2024, 68, 101642. [Google Scholar] [CrossRef]
- Saha, S.; Bera, B.; Shit, P.K.; Bhattacharjee, S.; Sengupta, N. Estimation of carbon budget through carbon emission-sequestration and valuation of ecosystem services in the extended part of Chota Nagpur Plateau (India). J. Clean. Prod. 2022, 380, 135054. [Google Scholar] [CrossRef]
- Adem Esmail, B.; Cortinovis, C.; Wang, J.; Geneletti, D.; Albert, C. Mapping and assessing ecosystem services for sustainable policy and decision-making in Eritrea. Ambio 2023, 52, 1022–1039. [Google Scholar] [CrossRef]
- Peng, J.; Wang, X.; Liu, Y.; Zhao, Y.; Xu, Z.; Zhao, M.; Qiu, S.; Wu, J. Urbanization impact on the supply-demand budget of ecosystem services: Decoupling analysis. Ecosyst. Serv. 2020, 44, 101139. [Google Scholar] [CrossRef]
- Feurer, M.; Rueff, H.; Celio, E.; Heinimann, A.; Blaser, J.; Htun, A.M.; Zaehringer, J.G. Regional scale mapping of ecosystem services supply, demand, flow and mismatches in Southern Myanmar. Ecosyst. Serv. 2021, 52, 101363. [Google Scholar] [CrossRef]
- Lorilla, R.S.; Kalogirou, S.; Poirazidis, K.; Kefalas, G. Identifying spatial mismatches between the supply and demand of ecosystem services to achieve a sustainable management regime in the Ionian Islands (Western Greece). Land Use Policy 2019, 88, 104171. [Google Scholar] [CrossRef]
- González-García, A.; Palomo, I.; González, J.A.; López, C.A.; Montes, C. Quantifying spatial supply-demand mismatches in ecosystem services provides insights for land-use planning. Land Use Policy 2020, 94, 104493. [Google Scholar] [CrossRef]
- Chen, W.; Chi, G. Spatial mismatch of ecosystem service demands and supplies in China, 2000–2020. Environ. Monit. Assess. 2022, 194, 295. [Google Scholar] [CrossRef]
- Millennium Ecosystem Assessment, M.E.A. Ecosystems and Human Well-Being; Island Press: Washington, DC, USA, 2005. [Google Scholar]
- Chaplin-Kramer, R.; Sharp, R.P.; Weil, C.; Bennett, E.M.; Pascual, U.; Arkema, K.K.; Brauman, K.A.; Bryant, B.P.; Guerry, A.D.; Haddad, N.M.; et al. Global modeling of nature’s contributions to people. Science 2019, 366, 255–258. [Google Scholar] [CrossRef]
- Ketema, H.; Wei, W.; Legesse, A.; Wolde, Z.; Endalamaw, T. Quantifying ecosystem service supply-demand relationship and its link with smallholder farmers’ well-being in contrasting agro-ecological zones of the East African Rift. Glob. Ecol. Conserv. 2021, 31, e01829. [Google Scholar] [CrossRef]
- Lu, Y.; Fu, B.; Yao, T.; Qin, D. Priority Actions for Enhancing Global Change Program to Provide Global Sustainable Solutions. Ecosyst. Health Sustain. 2023, 9, 0143. [Google Scholar] [CrossRef]
- Berger, E.; Bossenbroek, L.; Beermann, A.J.; Schäfer, R.B.; Znari, M.; Riethmüller, S.; Sidhu, N.; Kaczmarek, N.; Benaissa, H.; Ghamizi, M.; et al. Social-ecological interactions in the Draa River Basin, southern Morocco: Towards nature conservation and human well-being using the IPBES framework. Sci. Total Environ. 2021, 769, 144492. [Google Scholar] [CrossRef]
- Alshehri, K.; Harbottle, M.; Sapsford, D.; Beames, A.; Cleall, P. Integration of ecosystem services and life cycle assessment allows improved accounting of sustainability benefits of nature-based solutions for brownfield redevelopment. J. Clean. Prod. 2023, 413, 137352. [Google Scholar] [CrossRef]
- Fu, B.; Liu, Y.; Meadows, M.E. Ecological restoration for sustainable development in China. Natl. Sci. Rev. 2023, 10, nwad033. [Google Scholar] [CrossRef]
- Longato, D.; Cortinovis, C.; Balzan, M.; Geneletti, D. A method to prioritize and allocate nature-based solutions in urban areas based on ecosystem service demand. Landsc. Urban Plan. 2023, 235, 104743. [Google Scholar] [CrossRef]
- Xu, Z.; Peng, J. Recognizing ecosystem service’s contribution to SDGs: Ecological foundation of sustainable development. Geogr. Sustain. 2024, 5, 511–525. [Google Scholar] [CrossRef]
- Berdugo, M.; Delgado-Baquerizo, M.; Soliveres, S.; Hernandez-Clemente, R.; Zhao, Y.; Gaitan, J.J.; Gross, N.; Saiz, H.; Maire, V.; Lehmann, A.; et al. Global ecosystem thresholds driven by aridity. Science 2020, 367, 787–790. [Google Scholar] [CrossRef]
- Li, C.; Fu, B.; Wang, S.; Stringer, L.C.; Zhou, W.; Ren, Z.; Hu, M.; Zhang, Y.; Rodriguez-Caballero, E.; Weber, B.; et al. Climate-driven ecological thresholds in China’s drylands modulated by grazing. Nat. Sustain. 2023, 6, 1363–1372. [Google Scholar] [CrossRef]
- de Knegt, B.; Lof, M.E.; Le Clec’H, S.; Alkemade, R. Growing mismatches of supply and demand of ecosystem services in the Netherlands. J. Environ. Manage 2025, 373, 123442. [Google Scholar] [CrossRef]
- Iniesta-Arandia, I.; García-Llorente, M.; Aguilera, P.A.; Montes, C.; Martín-López, B. Socio-cultural valuation of ecosystem services: Uncovering the links between values, drivers of change, and human well-being. Ecol. Econ. 2014, 108, 36–48. [Google Scholar] [CrossRef]
- Costa, T.L.D.S.; Mazzochini, G.G.; Oliveira Filho, A.T.; Ganade, G.; Carvalho, A.R.; Manhães, A.P. Priority areas for restoring ecosystem services to enhance human well-being in a dry forest. Restor. Ecol. 2021, 29, e13426. [Google Scholar] [CrossRef]
- Ding, T.; Chen, J.; Fang, L.; Ji, J.; Fang, Z. Urban ecosystem services supply-demand assessment from the perspective of the water-energy-food nexus. Sustain. Cities Soc. 2023, 90, 104401. [Google Scholar] [CrossRef]
- Dem, P.; Hayashi, K.; Fujii, M. Resources time footprint for assessment of human influence on ecosystem service from a sustainability standpoint. J. Clean. Prod. 2024, 436, 140612. [Google Scholar] [CrossRef]
- Boumans, R.; Roman, J.; Altman, I.; Kaufman, L. The Multiscale Integrated Model of Ecosystem Services (MIMES): Simulating the interactions of coupled human and natural systems. Ecosyst. Serv. 2015, 12, 30–41. [Google Scholar] [CrossRef]
- Larondelle, N.; Lauf, S. Balancing demand and supply of multiple urban ecosystem services on different spatial scales. Ecosyst. Serv. 2016, 22, 18–31. [Google Scholar] [CrossRef]
- Hulvey, K.B.; Mellon, C.D.; Kleinhesselink, A.R. Rotational grazing can mitigate ecosystem service trade-offs between livestock production and water quality in semi-arid rangelands. J. Appl. Ecol. 2021, 58, 2113–2123. [Google Scholar] [CrossRef]
- Naselli-Flores, L.; Padisák, J. Ecosystem services provided by marine and freshwater phytoplankton. Hydrobiologia 2022, 850, 2691–2706. [Google Scholar] [CrossRef]
- Fang, G.; Sun, X.; Sun, R.; Liu, Q.; Tao, Y.; Yang, P.; Tang, H. Advancing the optimization of urban–rural ecosystem service supply-demand mismatches and trade-offs. Landsc. Ecol. 2024, 39, 32. [Google Scholar] [CrossRef]
- Du, H.; Zhao, L.; Zhang, P.; Li, J.; Yu, S. Ecological compensation in the Beijing-Tianjin-Hebei region based on ecosystem services flow. J. Environ. Manag. 2023, 331, 117230. [Google Scholar] [CrossRef]
- Yu, Y.; Li, J.; Han, L.; Zhang, S. Research on ecological compensation based on the supply and demand of ecosystem services in the Qinling-Daba Mountains. Ecol. Indic. 2023, 154, 110687. [Google Scholar] [CrossRef]
- Baró, F.; Haase, D.; Gómez-Baggethun, E.; Frantzeskaki, N. Mismatches between ecosystem services supply and demand in urban areas: A quantitative assessment in five European cities. Ecol. Indic. 2015, 55, 146–158. [Google Scholar] [CrossRef]
- Li, T.; Wang, H.; Fang, Z.; Liu, G.; Zhang, F.; Zhang, H.; Li, X. Integrating river health into the supply and demand management framework for river basin ecosystem services. Sustain. Prod. Consum. 2022, 33, 189–202. [Google Scholar] [CrossRef]
- Zhang, P.; Li, X.; Yu, Y. Relationship between ecosystem services and farmers’ well-being in the Yellow River Wetland Nature Reserve of China. Ecol. Indic. 2023, 146, 109810. [Google Scholar] [CrossRef]
- Sun, X.; Liu, H.; Liao, C.; Nong, H.; Yang, P. Understanding recreational ecosystem service supply-demand mismatch and social groups’ preferences: Implications for urban–rural planning. Landsc. Urban Plan. 2024, 241, 104903. [Google Scholar] [CrossRef]
- Aguado, M.; González, J.A.; Bellott, K.; López-Santiago, C.; Montes, C. Exploring subjective well-being and ecosystem services perception along a rural–urban gradient in the high Andes of Ecuador. Ecosyst. Serv. 2018, 34, 1–10. [Google Scholar] [CrossRef]
- Liu, L.; Fang, X.; Wu, J. How does the local-scale relationship between ecosystem services and human wellbeing vary across broad regions? Sci. Total Environ. 2022, 816, 151493. [Google Scholar] [CrossRef]
- Yang, L.; Zhou, X.; Gu, X.; Liang, Y. Impact mechanism of ecosystem services on resident well-being under sustainable development goals: A case study of the Shanghai metropolitan area. Environ. Impact Assess. Rev. 2023, 103, 107262. [Google Scholar] [CrossRef]
- Costanza, R.; Fisher, B.; Ali, S.; Beer, C.; Bond, L.; Boumans, R.; Danigelis, N.L.; Dickinson, J.; Elliott, C.; Farley, J.; et al. Quality of life: An approach integrating opportunities, human needs, and subjective well-being. Ecol. Econ. 2007, 61, 267–276. [Google Scholar] [CrossRef]
- Yang, S.; Zhao, W.; Pereira, P.; Liu, Y. Socio-cultural valuation of rural and urban perception on ecosystem services and human well-being in Yanhe watershed of China. J. Environ. Manage 2019, 251, 109615. [Google Scholar] [CrossRef]
- Yee, S.H.; Paulukonis, E.; Simmons, C.; Russell, M.; Fulford, R.; Harwell, L.; Smith, L.M. Projecting effects of land use change on human well-being through changes in ecosystem services. Ecol. Model. 2021, 440, 109358. [Google Scholar] [CrossRef] [PubMed]
- Fisher, J.C.; Dallimer, M.; Irvine, K.N.; Aizlewood, S.G.; Austen, G.E.; Fish, R.D.; King, P.M.; Davies, Z.G. Human well-being responses to species’ traits. Nat. Sustain. 2023, 6, 1219–1227. [Google Scholar] [CrossRef]
- Huang, Q.; Yin, D.; He, C.; Yan, J.; Liu, Z.; Meng, S.; Ren, Q.; Zhao, R.; Inostroza, L. Linking ecosystem services and subjective well-being in rapidly urbanizing watersheds: Insights from a multilevel linear model. Ecosyst. Serv. 2020, 43, 101106. [Google Scholar] [CrossRef]
- Meli, P.; Vieli, L.; Spirito, F.; Reyes-Riveros, R.; Gonzalez-Suhr, C.; Altamirano, A. The importance of considering human well-being to understand social preferences of ecosystem services. J. Nat. Conserv. 2023, 72, 126344. [Google Scholar] [CrossRef]
- Liu, J.; Dietz, T.; Carpenter, S.R.; Alberti, M.; Folke, C.; Moran, E.; Pell, A.N.; Deadman, P.; Kratz, T.; Lubchenco, J.; et al. Complexity of Coupled Human and Natural Systems. Science 2007, 317, 1513–1516. [Google Scholar] [CrossRef]
- Stevenson, R.J. A revised framework for coupled human and natural systems, propagating thresholds, and managing environmental problems. Phys. Chem. Earth. 2011, 36, 342–351. [Google Scholar] [CrossRef]
- Ji, Q.; Feng, X.; Sun, S.; Zhang, J.; Li, S.; Fu, B. Cross-scale coupling of ecosystem service flows and socio-ecological interactions in the Yellow River Basin. J. Environ. Manage 2024, 367, 122071. [Google Scholar] [CrossRef]
- Wang, C.; Wang, X.; Wang, Y.; Zhan, J.; Chu, X.; Teng, Y.; Liu, W.; Wang, H. Spatio-temporal analysis of human wellbeing and its coupling relationship with ecosystem services in Shandong province, China. J. Geogr. Sci. 2023, 33, 392–412. [Google Scholar] [CrossRef]
- Wang, F.; Shi, X.; Fan, Y. Factors influencing the relationship between perceptions of ecosystem services and well-being of farmers in the ore-agriculture zone, China. Ecol. Indic. 2024, 166, 112350. [Google Scholar] [CrossRef]
- Robinson, B.E.; Zheng, H.; Peng, W. Disaggregating livelihood dependence on ecosystem services to inform land management. Ecosyst. Serv. 2019, 36, 100902. [Google Scholar] [CrossRef]
- Hu, Z.; Yang, X.; Yang, J.; Yuan, J.; Zhang, Z. Linking landscape pattern, ecosystem service value, and human well-being in Xishuangbanna, southwest China: Insights from a coupling coordination model. Glob. Ecol. Conserv. 2021, 27, e01583. [Google Scholar] [CrossRef]
- Ji, Z.; Zou, S.; Zhang, W.; Song, F.; Yuan, T.; Xu, B. Optimizing zoning for ecological management in alpine region by combining ecosystem service supply and demand with ecosystem resilience. J. Environ. Manage 2024, 365, 121508. [Google Scholar] [CrossRef] [PubMed]
- Ren, S.; Jing, H.; Qian, X.; Liu, Y. Spatial and temporal coordinated development research on ecosystem services and human well-being in the typical pastoral area of the Qinghai-Tibet Plateau. J. Geogr. Sci. 2024, 34, 252–288. [Google Scholar] [CrossRef]
- Xu, Z.; Wei, H.; Fan, W.; Wang, X.; Zhang, P.; Ren, J.; Lu, N.; Gao, Z.; Dong, X.; Kong, W. Relationships between ecosystem services and human well-being changes based on carbon flow—A case study of the Manas River Basin, Xinjiang, China. Ecosyst. Serv. 2019, 37, 100934. [Google Scholar] [CrossRef]
- Tang, Z.; Xie, M.; Chen, B.; Xu, M.; Ji, Y. Do social and ecological indicators have the same effect on the subjective well-being of residents? Appl. Geogr. 2023, 157, 102994. [Google Scholar] [CrossRef]
- Feng, Q.; Yang, L.S.; Deo, R.C.; AghaKouchak, A.; Adamowski, J.F.; Stone, R.; Yin, Z.L.; Liu, W.; Si, J.H.; Wen, X.H.; et al. Domino effect of climate change over two millennia in ancient China’s Hexi Corridor. Nat. Sustain. 2019, 2, 957–961. [Google Scholar] [CrossRef]
- Li, Z.X.; Feng, Q.; Li, Z.J.; Wang, X.F.; Gui, J.; Zhang, B.J.; Li, Y.; Deng, X.H.; Xue, J.; Gao, W.D.; et al. Reversing conflict between humans and the environment—The experience in the Qilian Mountains. Renew. Sustain. Energy Rev. 2021, 148, 111333. [Google Scholar]
- Teng, Y.; Zhan, J.; Liu, W.; Chu, X.; Zhang, F.; Wang, C.; Wang, L. Spatial heterogeneity of ecosystem services trade-offs among ecosystem service bundles in an alpine mountainous region: A case-study in the Qilian Mountains, Northwest China. Land Degrad. Dev. 2022, 33, 1846–1861. [Google Scholar] [CrossRef]
- Li, Y.G.; Liu, W.; Feng, Q.; Zhu, M.; Yang, L.; Zhang, J.; Yin, X. The role of land use change in affecting ecosystem services and the ecological security pattern of the Hexi Regions, Northwest China. Sci. Total Environ. 2023, 855, 158940. [Google Scholar] [CrossRef]
- Zhang, X.; Li, X.; Wang, Z.; Liu, Y.; Yao, L. A study on matching supply and demand of ecosystem services in the Hexi region of China based on multi-source data. Sci. Rep. 2024, 14, 1332. [Google Scholar] [CrossRef]
- Li, Y.; Liu, W.; Feng, Q.; Zhu, M.; Yang, L.; Zhang, J. Quantitative Assessment for the Spatiotemporal Changes of Ecosystem Services, Tradeoff–Synergy Relationships and Drivers in the Semi-Arid Regions of China. Remote Sens. 2022, 14, 239. [Google Scholar] [CrossRef]
- Li, Y.; Liu, W.; Feng, Q.; Zhu, M.; Yang, L.; Zhang, J. Effects of land use and land cover change on soil organic carbon storage in the Hexi regions, Northwest China. J. Environ. Manage 2022, 312, 114911. [Google Scholar] [CrossRef]
- Lin, J.; Guan, Q.; Pan, N.; Zhao, R.; Yang, L.; Xu, C. Spatiotemporal variations and driving factors of the potential wind erosion rate in the Hexi region, PR China. Land Degrad. Dev. 2021, 32, 139–157. [Google Scholar] [CrossRef]
- Zhang, B.; Feng, Q.; Lu, Z.; Li, Z.; Zhang, B.; Cheng, W. Ecosystem service value and ecological compensation in Qilian Mountain National Park: Implications for ecological conservation strategies. Ecol. Indic. 2024, 167, 112661. [Google Scholar] [CrossRef]
- Yang, L.; Feng, Q.; Adamowski, J.F.; Deo, R.C.; Yin, Z.; Wen, X.; Tang, X.; Wu, M. Causality of climate, food production and conflict over the last two millennia in the Hexi Corridor, China. Sci. Total Environ. 2020, 713, 136587. [Google Scholar] [CrossRef]
- Da, L.; Lü, Y.; Gao, G.; Liu, S.; Wu, B.; Fu, B. Existent nature reserves not optimal for water service provision and conservation on the Qinghai-Tibet Plateau of China. Glob. Ecol. Conserv. 2021, 32, e01945. [Google Scholar]
- Liu, C.; Shi, R. GIS Dataset of Boundaries among Four Geo-Eco Regions of China. J. Glob. Chang. Data 2018, 2, 42–50. [Google Scholar]
- Sharp, R.; Douglass, J.; Wolny, S.; Arkema, K.; Bernhardt, J.; Bierbower, W.; Chaumont, N.; Denu, D.; Fisher, D.; Glowinski, K.; et al. InVEST 3.9.1 User’s Guide; The Natural Capital Project, Stanford University, University of Minnesota, The Nature Conservancy, and World Wildlife Fund: Gland, Switzerland, 2020. [Google Scholar]
- Pan, Z.; He, J.; Liu, D.; Wang, J.; Guo, X. Ecosystem health assessment based on ecological integrity and ecosystem services demand in the Middle Reaches of the Yangtze River Economic Belt, China. Sci. Total Environ. 2021, 774, 144837. [Google Scholar] [CrossRef]
- Qiu, J.; Yu, D.; Huang, T. Influential paths of ecosystem services on human well-being in the context of the sustainable development goals. Sci. Total Environ. 2022, 852, 158443. [Google Scholar] [CrossRef]
- Liu, W.; Zhan, J.; Zhao, F.; Wei, X.; Zhang, F. Exploring the coupling relationship between urbanization and energy eco-efficiency: A case study of 281 prefecture-level cities in China. Sustain. Cities Soc. 2021, 64, 102563. [Google Scholar] [CrossRef]
- Gan, L.; Shi, H.; Hu, Y.; Lev, B.; Lan, H. Coupling coordination degree for urbanization city-industry integration level: Sichuan case. Sustain. Cities Soc. 2020, 58, 102136. [Google Scholar] [CrossRef]
- Zhou, X.; Wen, H.; Zhang, Y.; Xu, J.; Zhang, W. Landslide susceptibility mapping using hybrid random forest with GeoDetector and RFE for factor optimization. Geosci. Front. 2021, 12, 101211. [Google Scholar] [CrossRef]
- Wang, J.F.; Xu, C.D. Geodetector: Principle and prospective. Acta Geogr. Sin. 2017, 72, 116–134. [Google Scholar]
- Sanchez, G. PLS Path Modeling with R, Trowchez Editions; Berkeley, CA, USA. 2013. Available online: https://www.gastonsanchez.com/PLS_Path_Modeling_with_R.pdf (accessed on 10 January 2024).
- Hair, J.F.; Risher, J.J.; Sarstedt, M.; Ringle, C.M. When to use and how to report the results of PLS-SEM. Eur. Bus. Rev. 2019, 31, 2–24. [Google Scholar] [CrossRef]
- Liu, L.; Ma, Q.; Shang, C.; Wu, J. How does the temporal relationship between ecosystem services and human wellbeing change in space and time? Evidence from Inner Mongolian drylands. J. Environ. Manage 2023, 339, 117930. [Google Scholar] [CrossRef]
- Shen, J.; Li, S.; Wang, H.; Wu, S.; Liang, Z.; Zhang, Y.; Wei, F.; Li, S.; Ma, L.; Wang, Y.; et al. Understanding the spatial relationships and drivers of ecosystem service supply-demand mismatches towards spatially-targeted management of social-ecological system. J. Clean. Prod. 2023, 406, 136882. [Google Scholar] [CrossRef]
- Li, S.; Yu, D.; Li, X. Exploring the impacts of ecosystem services on human well-being in Qinghai Province under the framework of the sustainable development goals. J. Environ. Manage 2023, 345, 118880. [Google Scholar] [CrossRef]
- Wei, H.; Liu, H.; Xu, Z.; Ren, J.; Lu, N.; Fan, W.; Zhang, P.; Dong, X. Linking ecosystem services supply, social demand and human well-being in a typical mountain–oasis–desert area, Xinjiang, China. Ecosyst. Serv. 2018, 31, 44–57. [Google Scholar] [CrossRef]
- Ouyang, Z.Y.; Song, C.; Zheng, H.; Polasky, S.; Xiao, Y.; Bateman, I.J.; Liu, J.; Ruckelshaus, M.; Shi, F.; Xiao, Y.; et al. Using gross ecosystem product (GEP) to value nature in decision making. Proc. Natl. Acad. Sci. USA 2020, 117, 14593–14601. [Google Scholar] [CrossRef]
- Liu, J.; Pei, X.; Zhu, W.; Jiao, J. Water-related ecosystem services interactions and their natural-human activity drivers: Implications for ecological protection and restoration. J. Environ. Manage 2024, 352, 120101. [Google Scholar] [CrossRef]
- Zhang, X.; Du, H.; Feng, H.; Luo, J.; Liu, Y.; Yu, J.; Li, X. Spatial and Temporal Variations in the Coupled Relationship between Ecosystem Services and Human Well-Being in Gansu Province Counties and the Factors Affecting Them. Sustainability 2024, 16, 5816. [Google Scholar] [CrossRef]
- He, W.; Wang, H.; Liu, G.; Bai, Y.; Xue, S.; Fang, Z.; Xiao, Y.; Wang, Y.; Wang, W. Can ecosystem services supply match local residents’ perception: Linking macro-ESs and micro-individual perceptions in the Yellow River Basin. J. Environ. Manage 2025, 374, 124116. [Google Scholar] [CrossRef]
- Fu, L.; Ren, Y.; Lu, L.; Chen, H. Relationship between ecosystem services and rural residential well-being in the Xin’an river Basin, China. Ecol. Indic. 2022, 140, 108997. [Google Scholar] [CrossRef]
- Liu, L.; Wu, J. Ecosystem services-human wellbeing relationships vary with spatial scales and indicators: The case of China. Resour. Conserv. Recy. 2021, 172, 105662. [Google Scholar] [CrossRef]
- Liu, L.; Liu, Y.; Kong, L.; Zhong, Z.; Fang, X. How Do Changes in Ecosystem Services Multifunctionality Influence Human Wellbeing? Evidence From the Yangtze River Delta Urban Agglomeration in China. Land Degrad. Dev. 2024, 35, 5224–5236. [Google Scholar] [CrossRef]
- Liu, H.; Xiao, W.; Zhu, J.; Zeng, L.; Li, Q. Urbanization Intensifies the Mismatch between the Supply and Demand of Regional Ecosystem Services: A Large-Scale Case of the Yangtze River Economic Belt in China. Remote Sens. 2022, 14, 5147. [Google Scholar] [CrossRef]
- Chen, J.; Jiang, B.; Bai, Y.; Xu, X.; Alatalo, J.M. Quantifying ecosystem services supply and demand shortfalls and mismatches for management optimisation. Sci. Total Environ. 2019, 650, 1426–1439. [Google Scholar] [CrossRef]
- Gao, M.; Hu, Y.; Liu, X.; Liang, M. Revealing multi-scale characteristics of ecosystem services supply and demand imbalance to enhance refined ecosystem management in China. Ecol. Indic. 2025, 170, 112971. [Google Scholar] [CrossRef]
- Teng, Y.; Chen, G.; Su, M.; Zhang, Y.; Li, S.; Xu, C. Ecological management zoning based on static and dynamic matching characteristics of ecosystem services supply and demand in the Guangdong–Hong Kong–Macao Greater Bay Area. J. Clean. Prod. 2024, 448, 141599. [Google Scholar] [CrossRef]
- Peng, J.; Hu, X.; Wang, X.; Meersmans, J.; Liu, Y.; Qiu, S. Simulating the impact of Grain-for-Green Programme on ecosystem services trade-offs in Northwestern Yunnan, China. Ecosyst. Serv. 2019, 39, 100998. [Google Scholar] [CrossRef]
- Cui, F.; Tang, H.; Zhang, Q.; Wang, B.; Dai, L. Integrating ecosystem services supply and demand into optimized management at different scales: A case study in Hulunbuir, China. Ecosyst. Serv. 2019, 39, 100984. [Google Scholar] [CrossRef]
- Borrelli, P.; Robinson, D.A.; Fleischer, L.R.; Lugato, E.; Ballabio, C.; Alewell, C.; Meusburger, K.; Modugno, S.; Schütt, B.; Ferro, V.; et al. An assessment of the global impact of 21st century land use change on soil erosion. Nat. Commun. 2017, 8. [Google Scholar] [CrossRef]
- Xu, J.Y.; Chen, J.; Liu, Y.; Fan, F. Identification of the geographical factors influencing the relationships between ecosystem services in the Belt and Road region from 2010 to 2030. J. Clean. Prod. 2020, 275, 124153. [Google Scholar] [CrossRef]
- Li, J.; Geneletti, D.; Wang, H. Understanding supply-demand mismatches in ecosystem services and interactive effects of drivers to support spatial planning in Tianjin metropolis, China. Sci. Total Environ. 2023, 895, 165067. [Google Scholar] [CrossRef]
- Gao, X.; Wang, J.; Li, C.; Shen, W.; Song, Z.; Nie, C.; Zhang, X. Land use change simulation and spatial analysis of ecosystem service value in Shijiazhuang under multi-scenarios. Environ. Sci. Pollut. Res. 2021, 28, 31043–31058. [Google Scholar] [CrossRef]
- Jia, Q.; Jiao, L.; Lian, X.; Wang, W. Linking supply-demand balance of ecosystem services to identify ecological security patterns in urban agglomerations. Sust. Cities Soc. 2023, 92, 104497. [Google Scholar] [CrossRef]
Disclaimer/Publisher’s Note: The statements, opinions and data contained in all publications are solely those of the individual author(s) and contributor(s) and not of MDPI and/or the editor(s). MDPI and/or the editor(s) disclaim responsibility for any injury to people or property resulting from any ideas, methods, instructions or products referred to in the content. |
© 2025 by the authors. Licensee MDPI, Basel, Switzerland. This article is an open access article distributed under the terms and conditions of the Creative Commons Attribution (CC BY) license (https://creativecommons.org/licenses/by/4.0/).