
Mapping of Flood Impacts Caused by the September 2023 Storm Daniel in Thessaly’s Plain (Greece) with the Use of Remote Sensing Satellite Data

 , , ,
, , ,  ,
, 
Abstract
1. Introduction
2. Storm Daniel in Thessaly
3. Materials and Methods
3.1. Data
3.2. Platforms and Software
3.3. Methodology
3.3.1. Monitoring Planning
3.3.2. Multispectral Data Flood Mapping
3.3.3. SAR Data Flood Mapping
3.3.4. Impact Assessment, Results Production, and Comparisons
4. Results
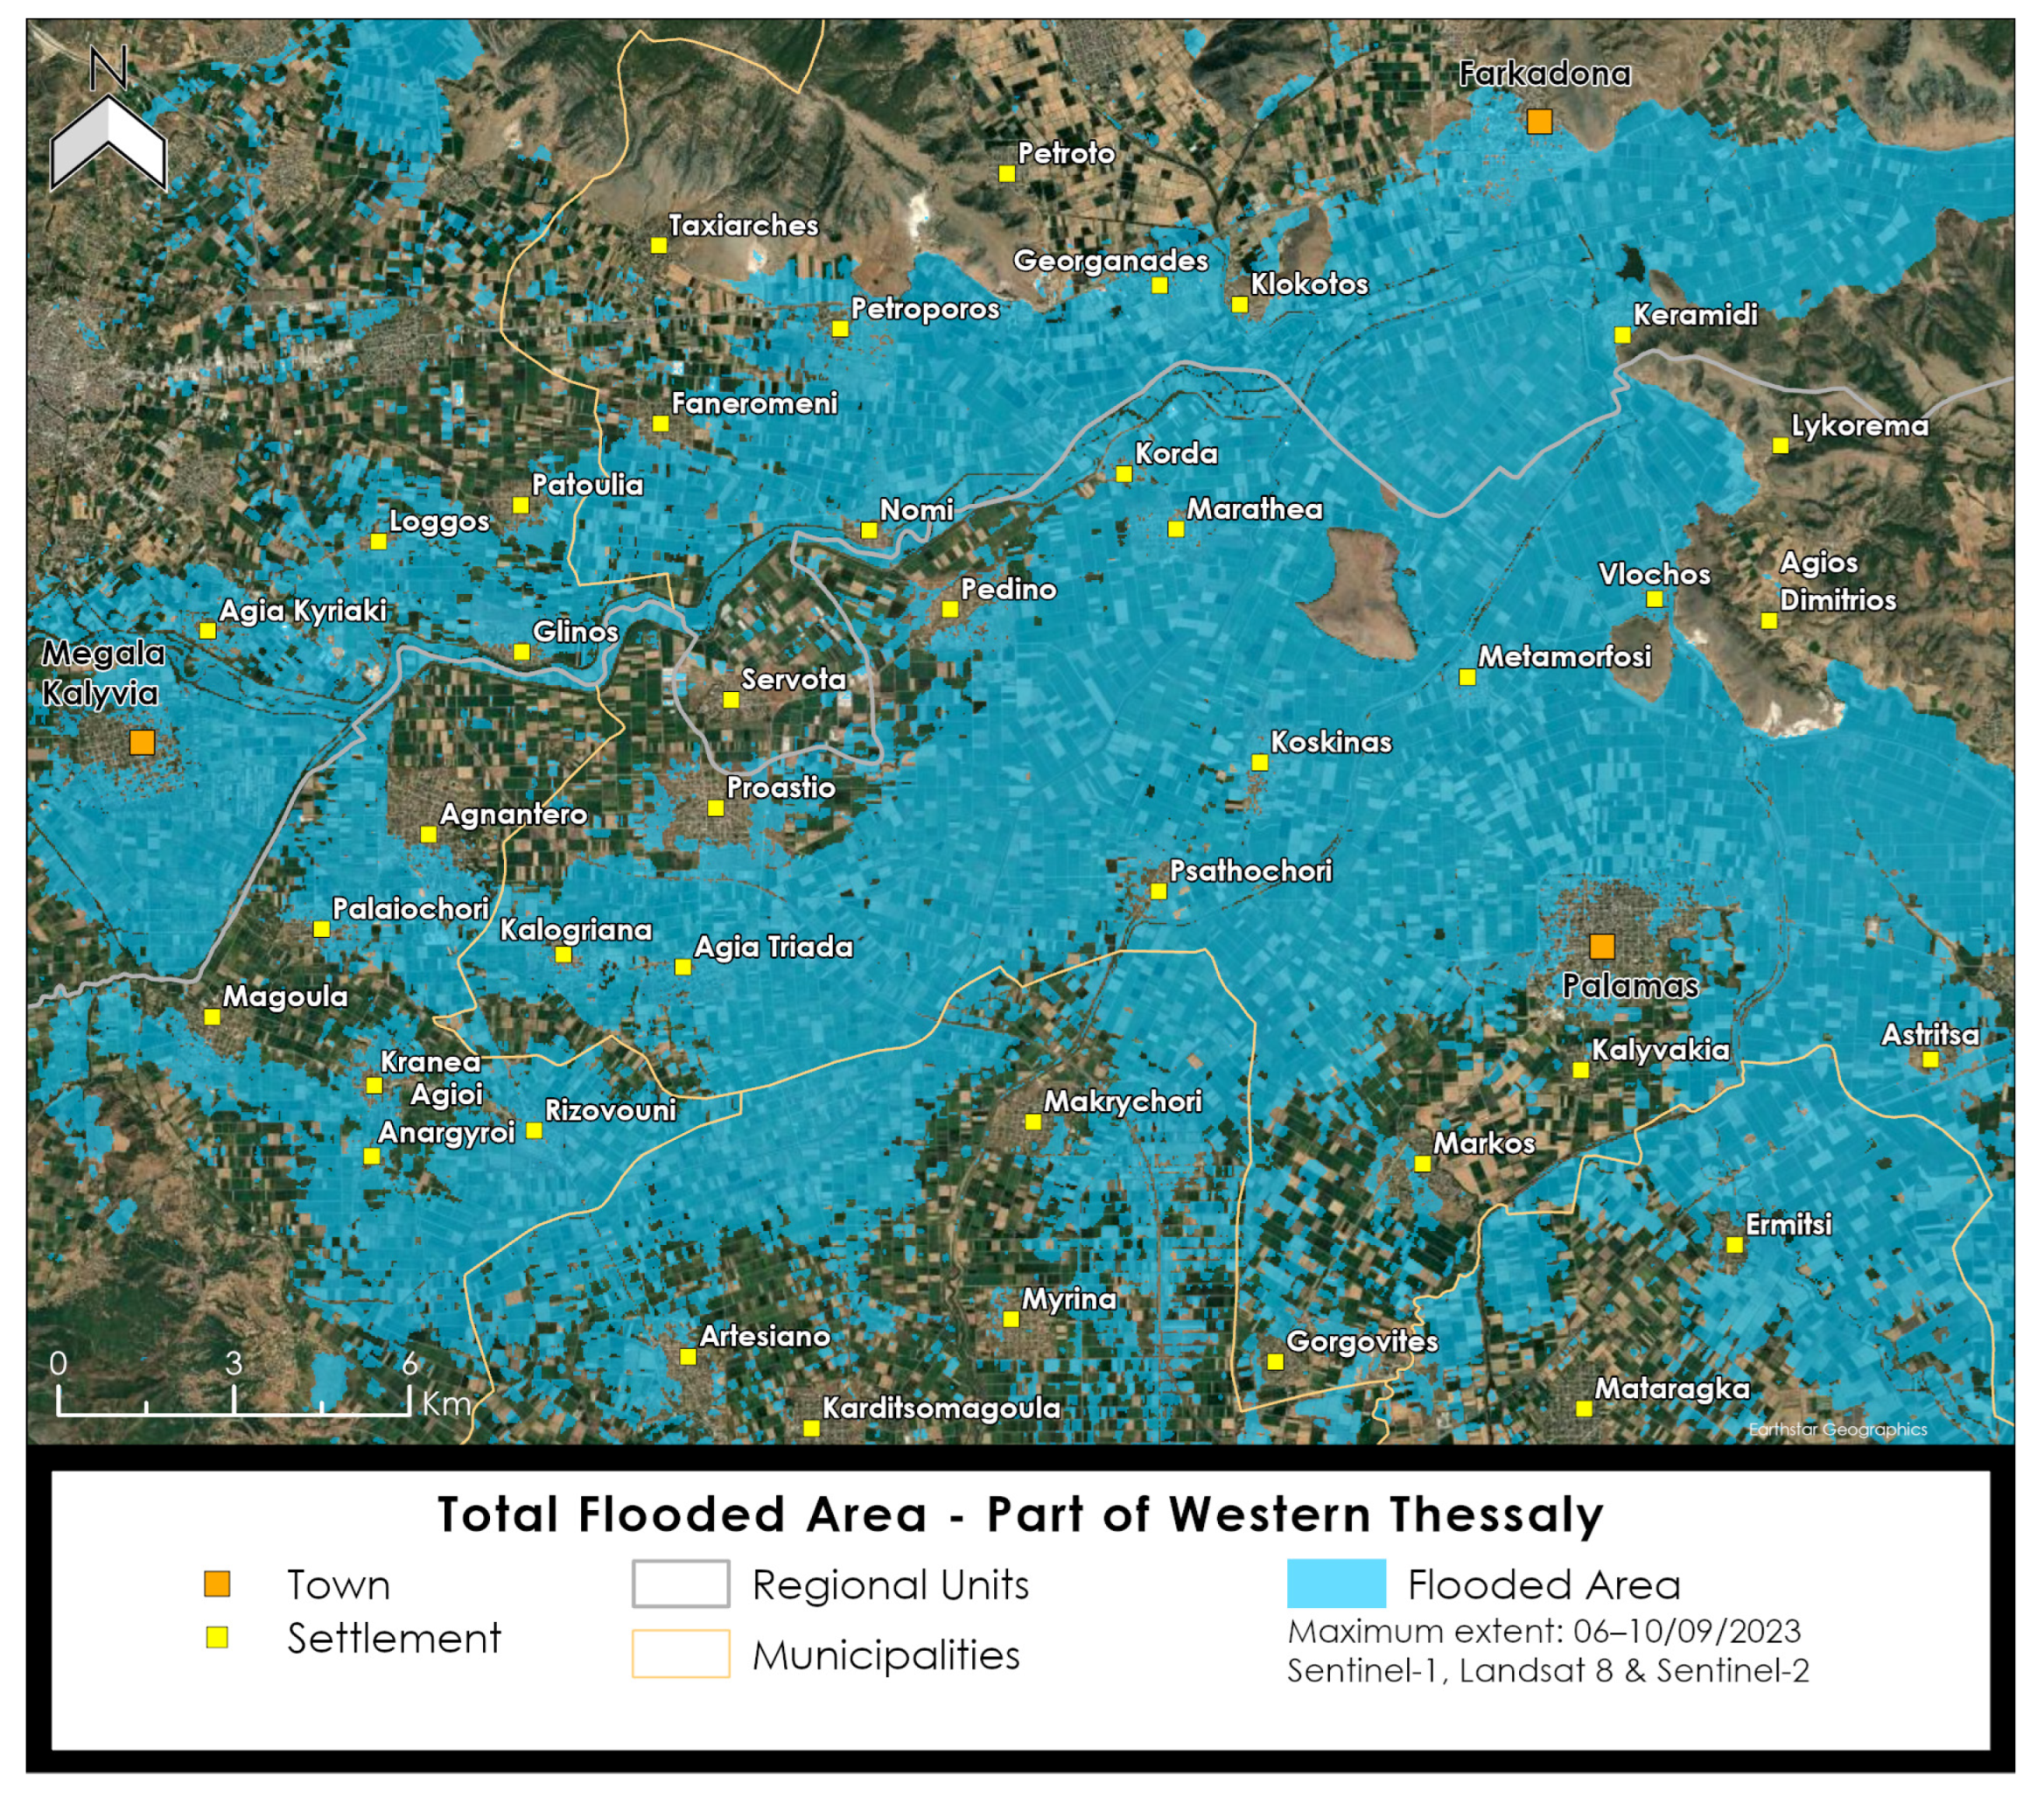
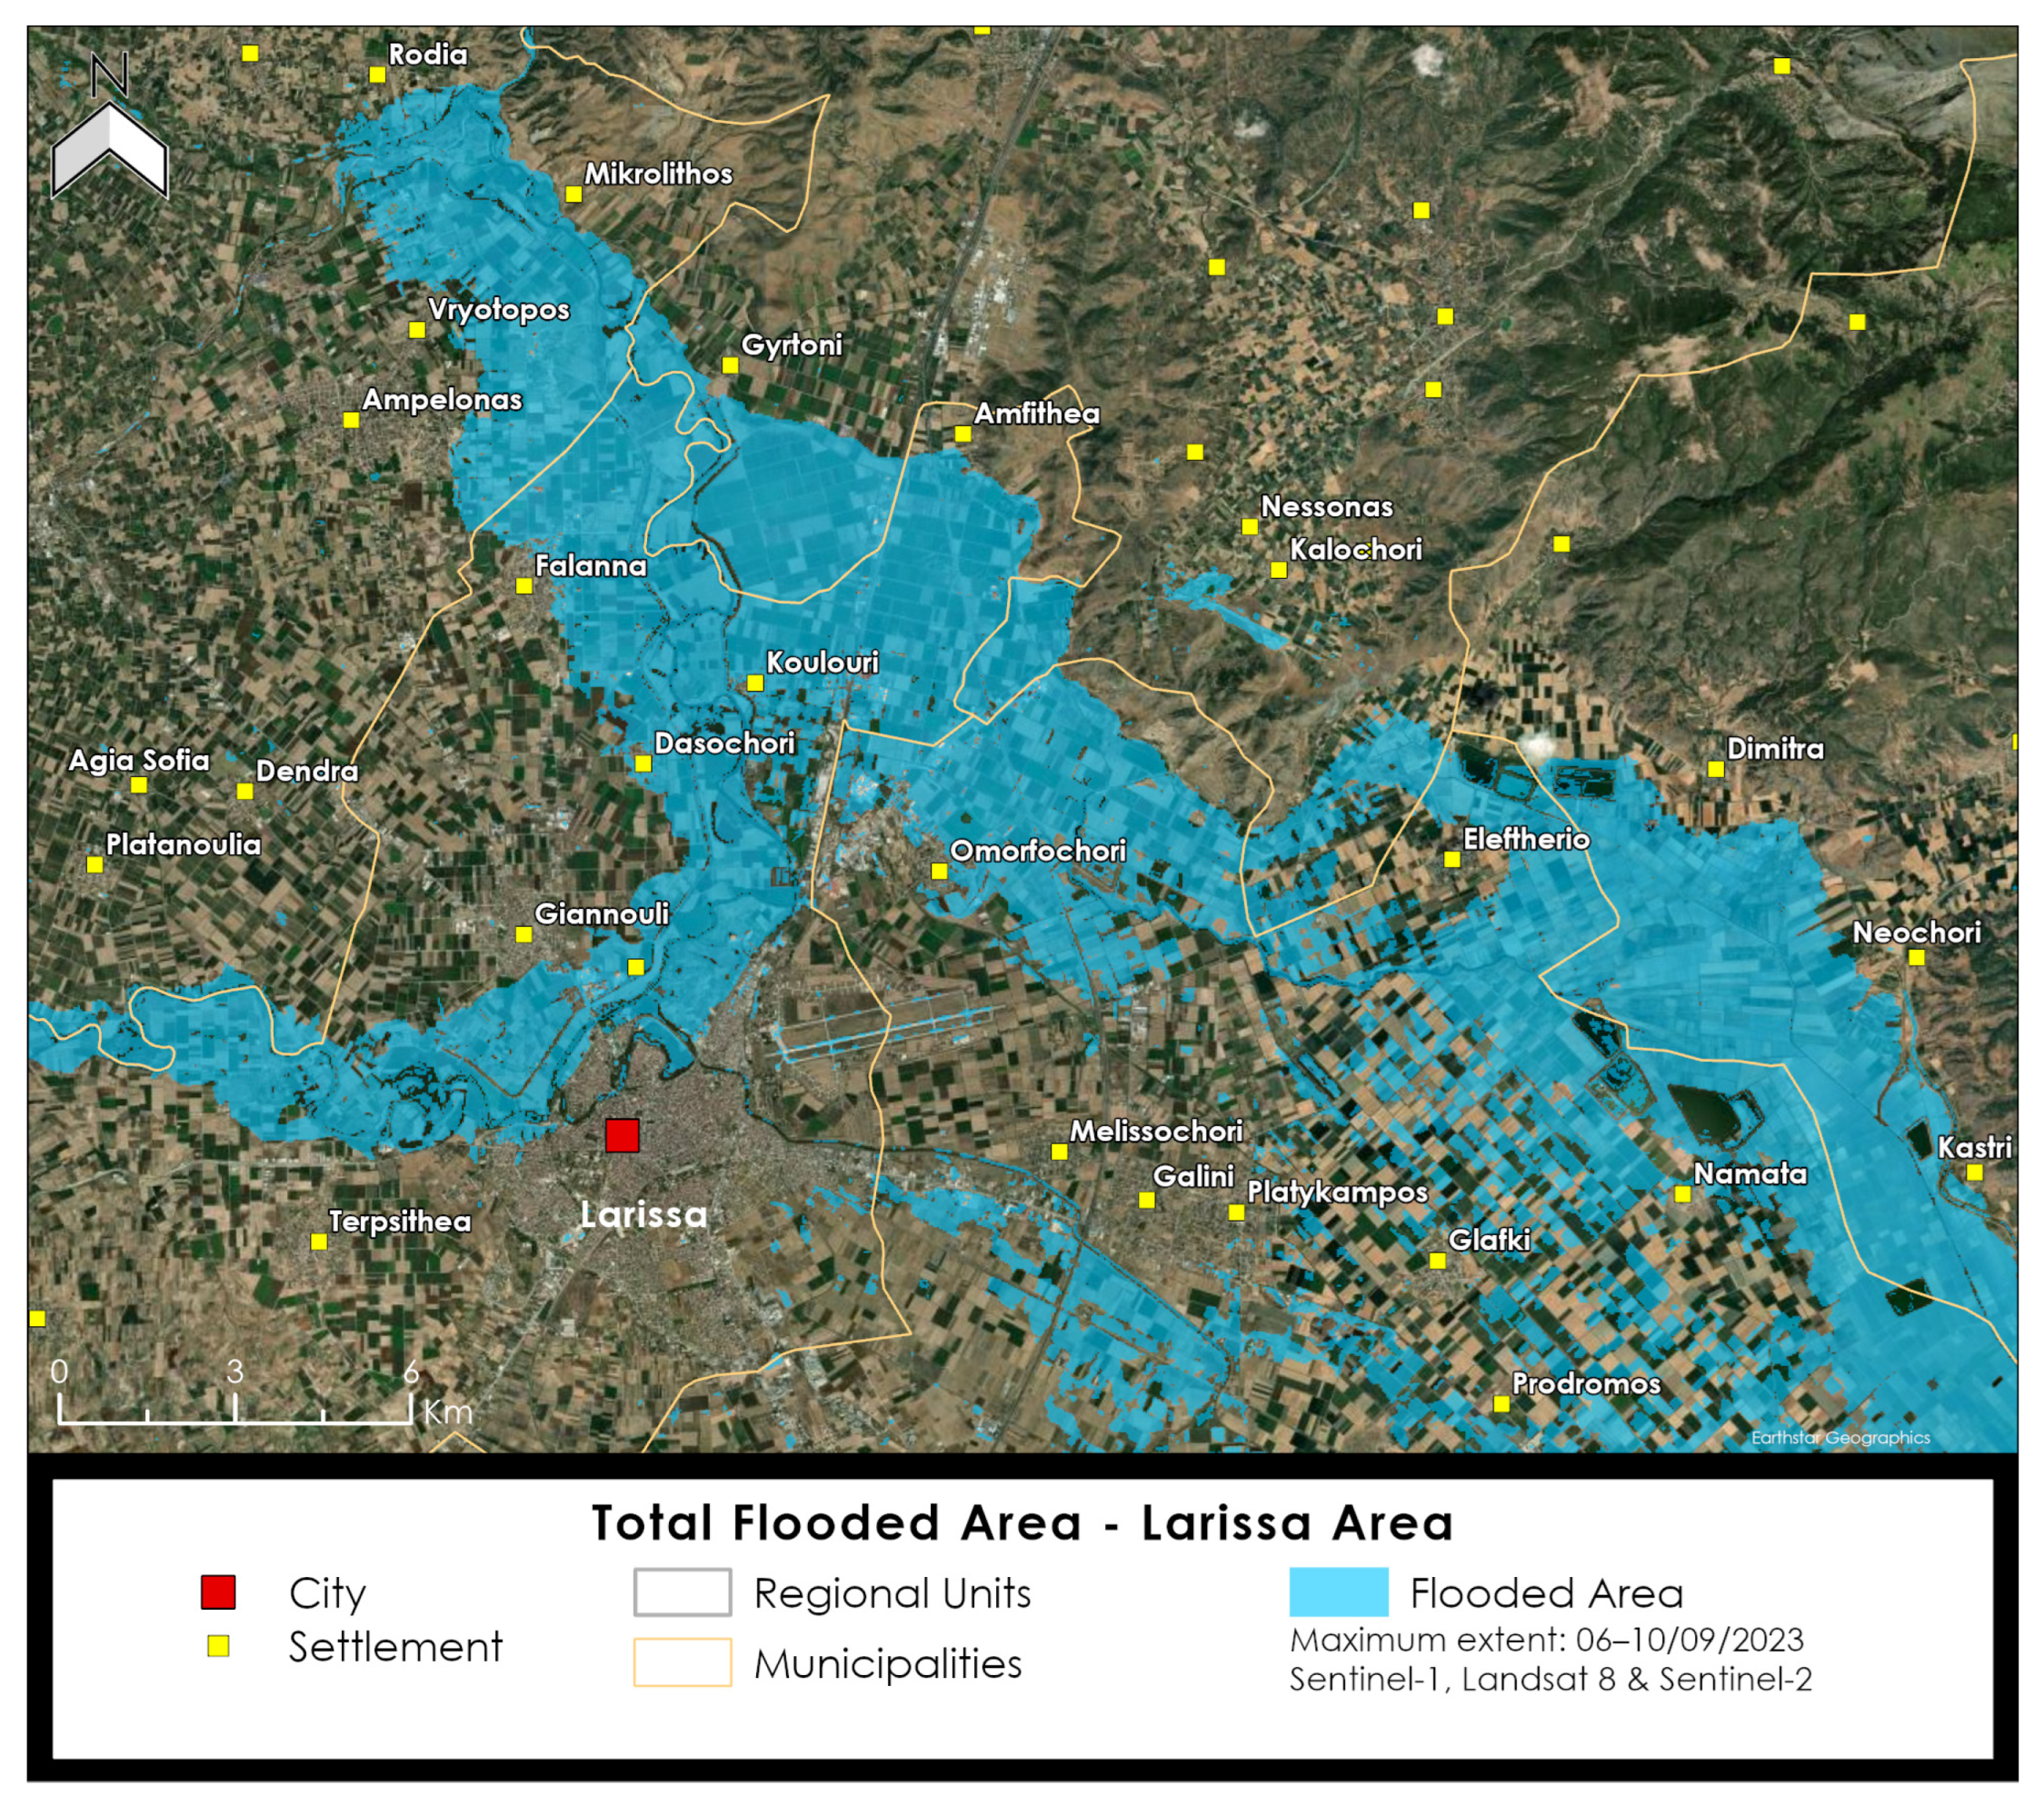
4.1. Flooded Area and Drainage
4.2. Impact Assessment
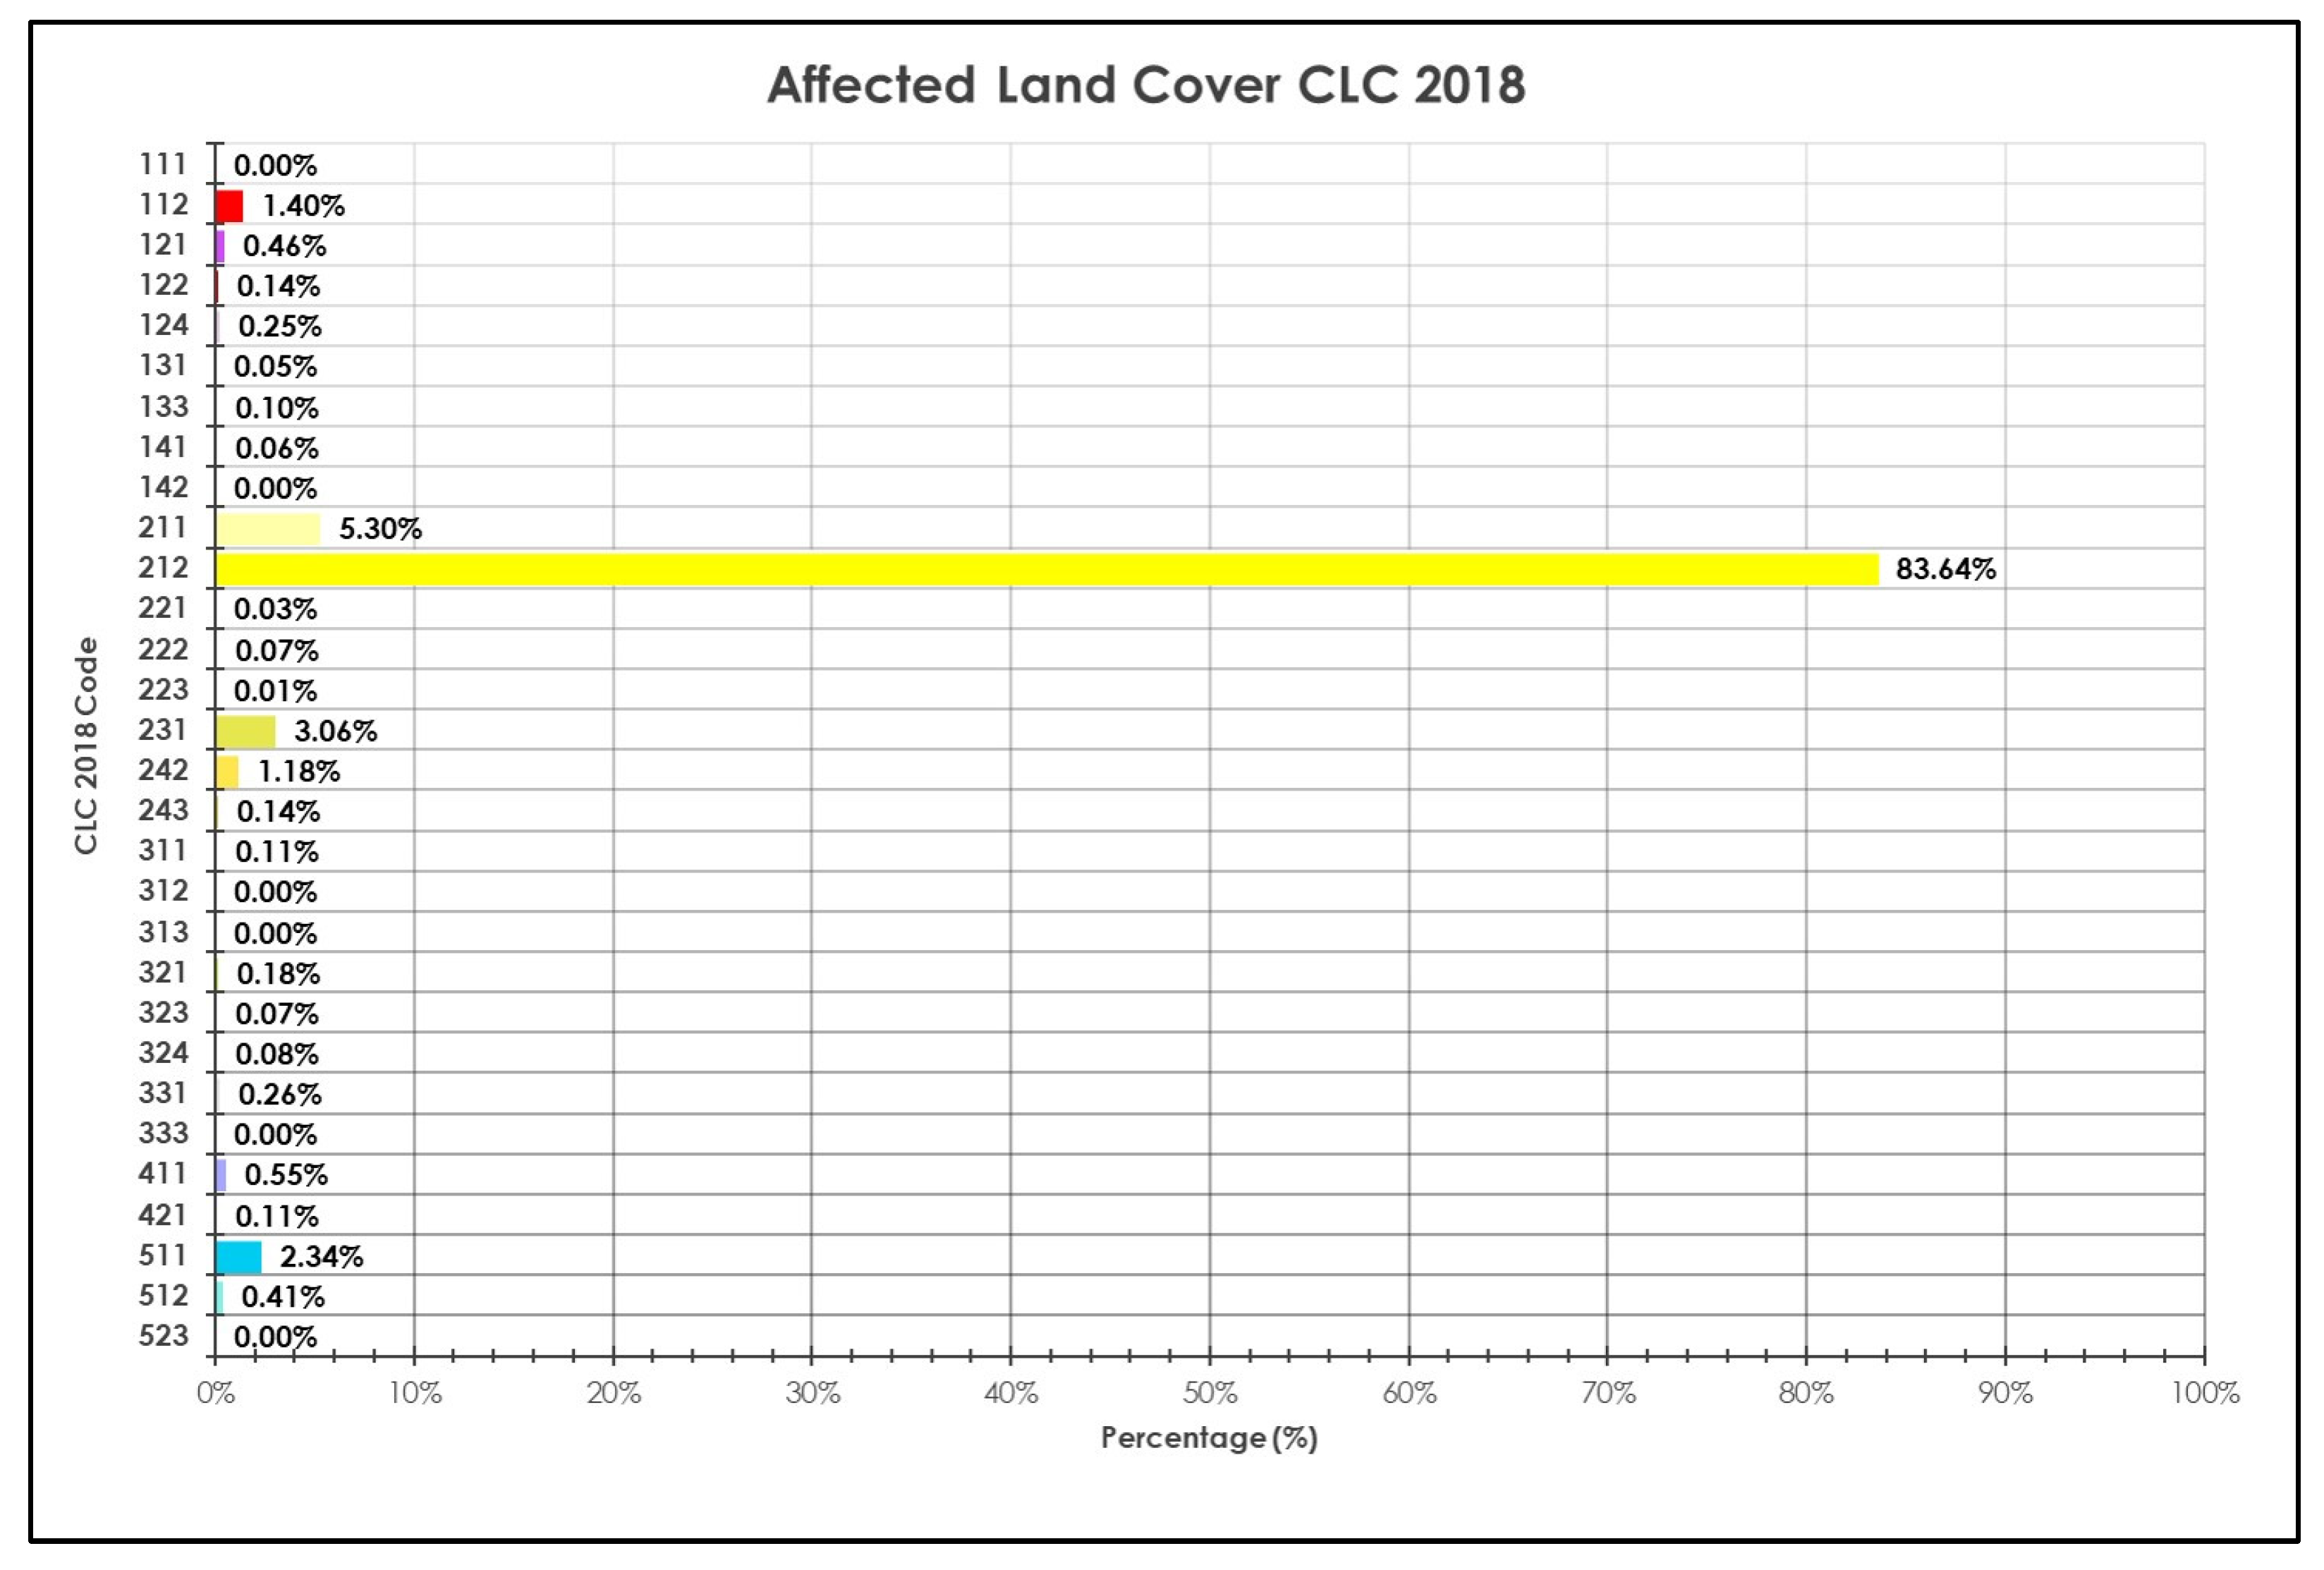
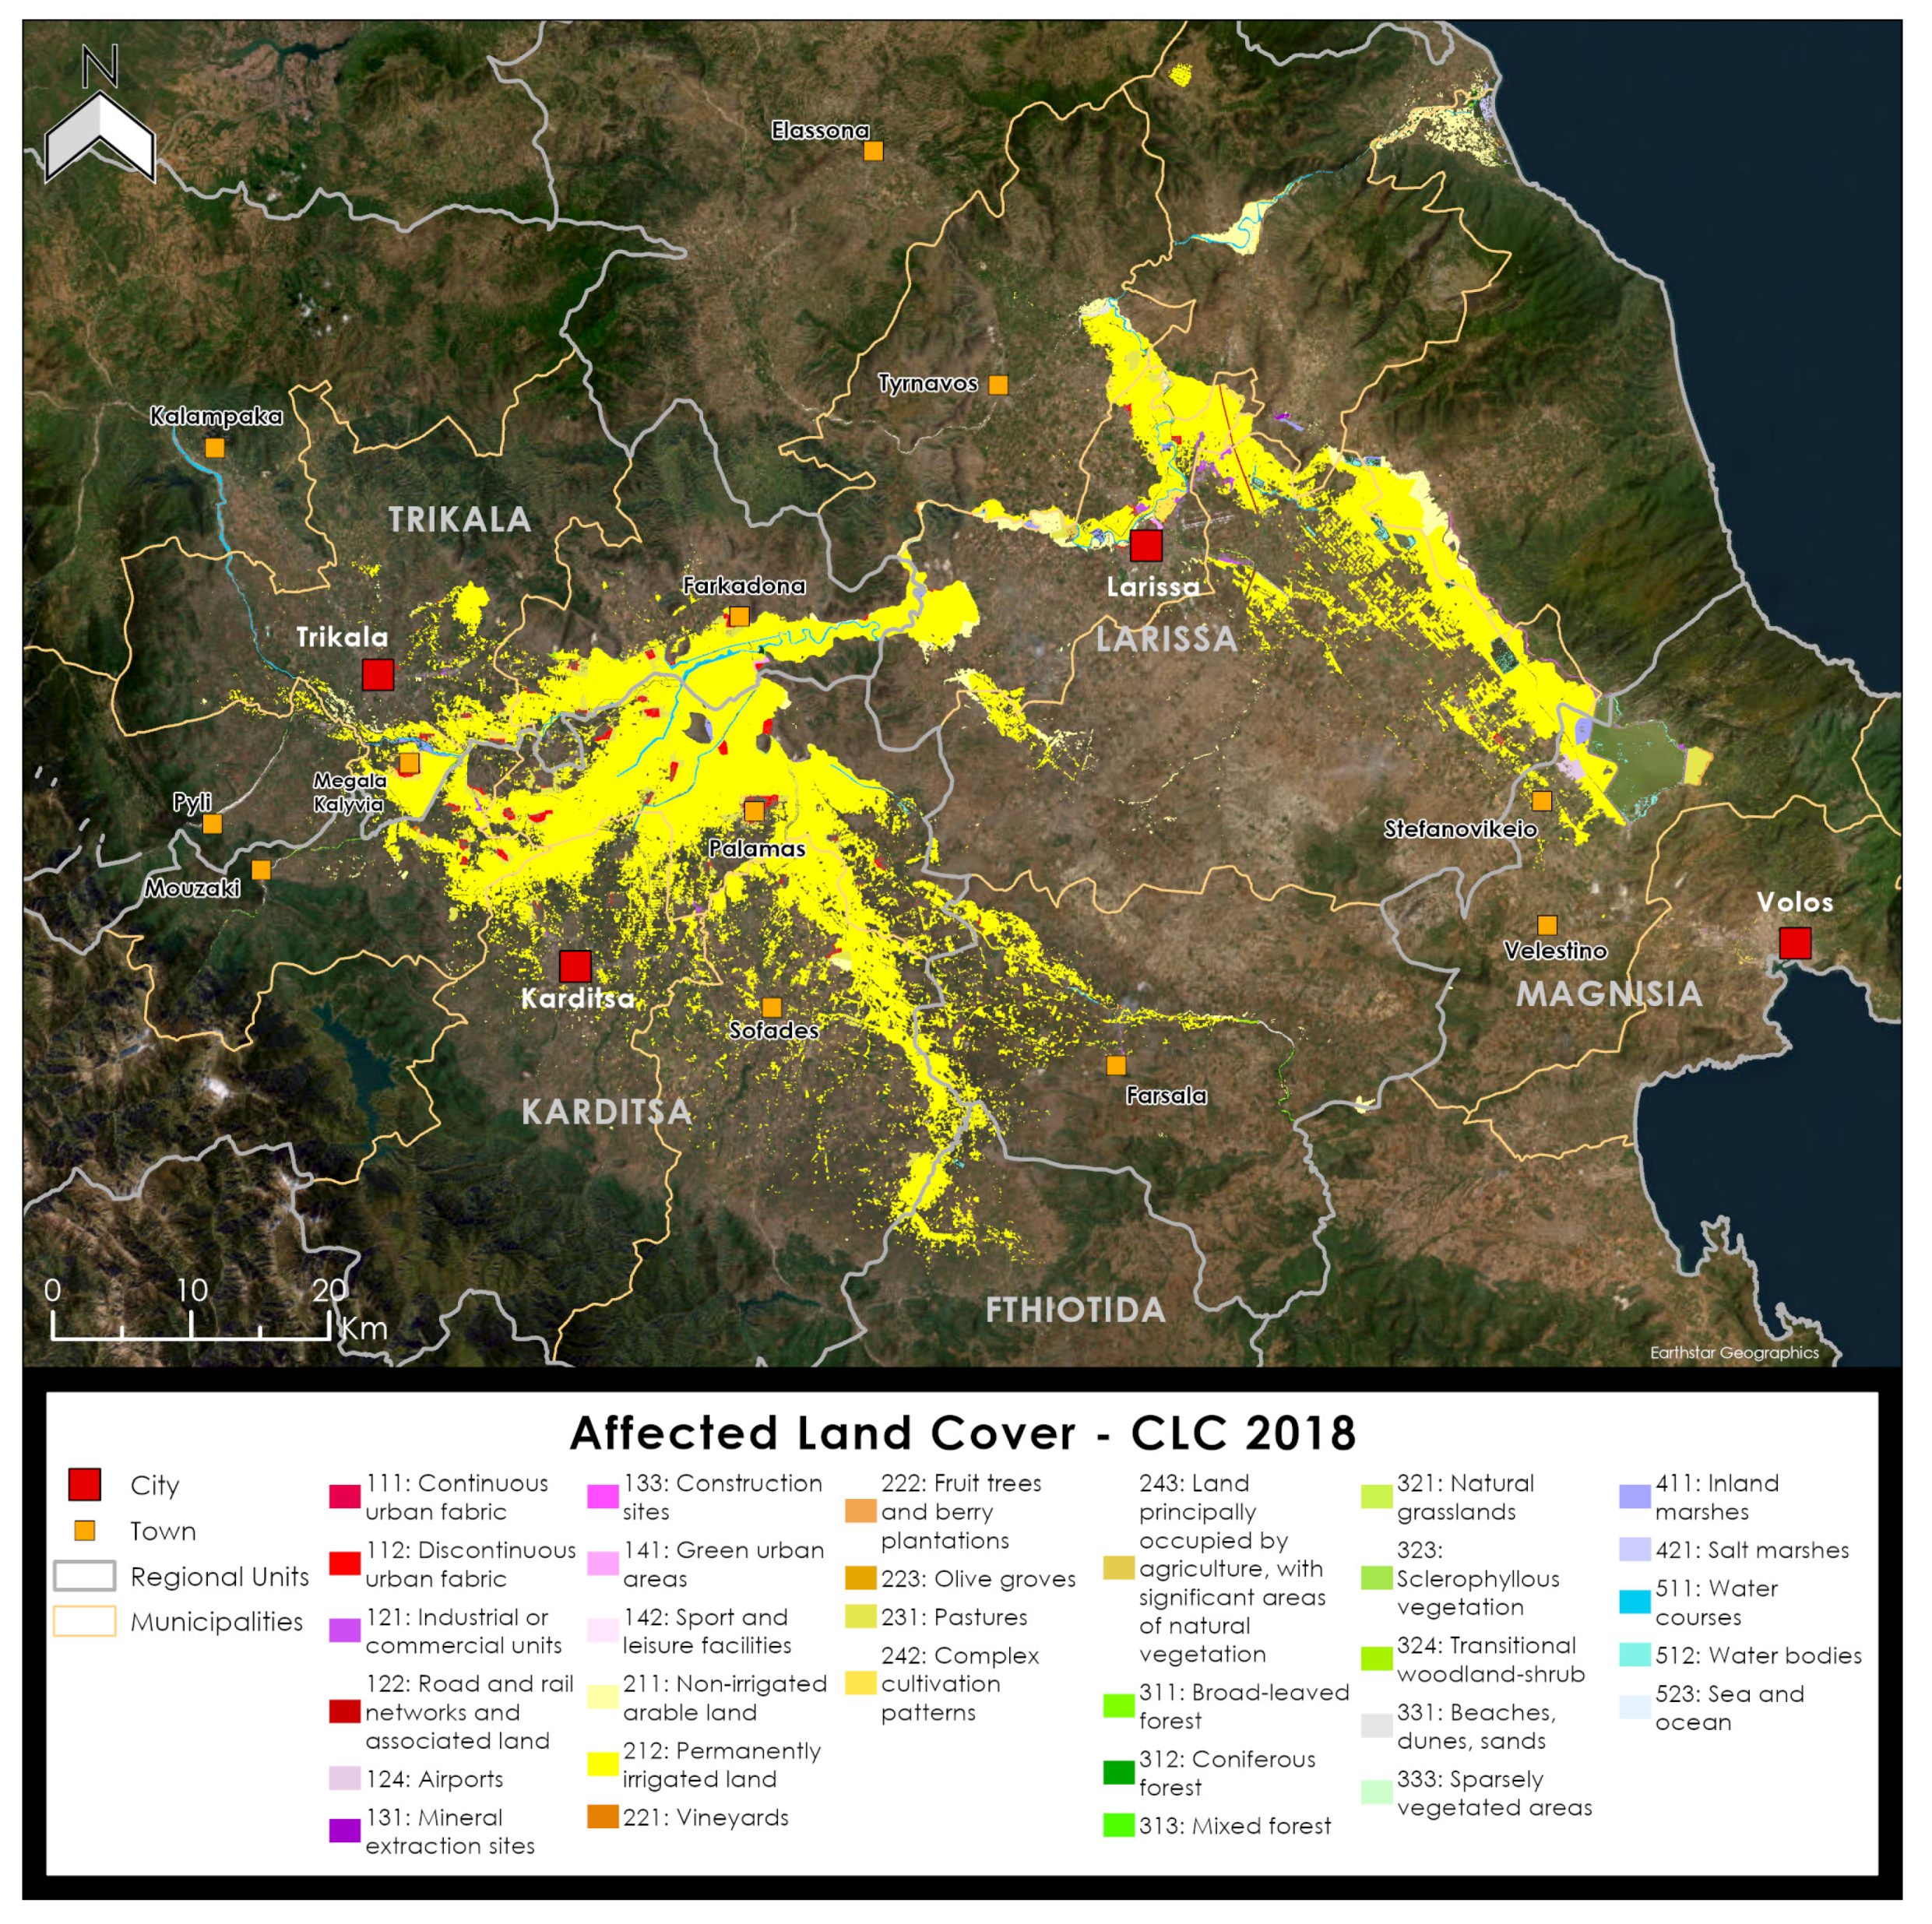
4.2.1. Land Cover
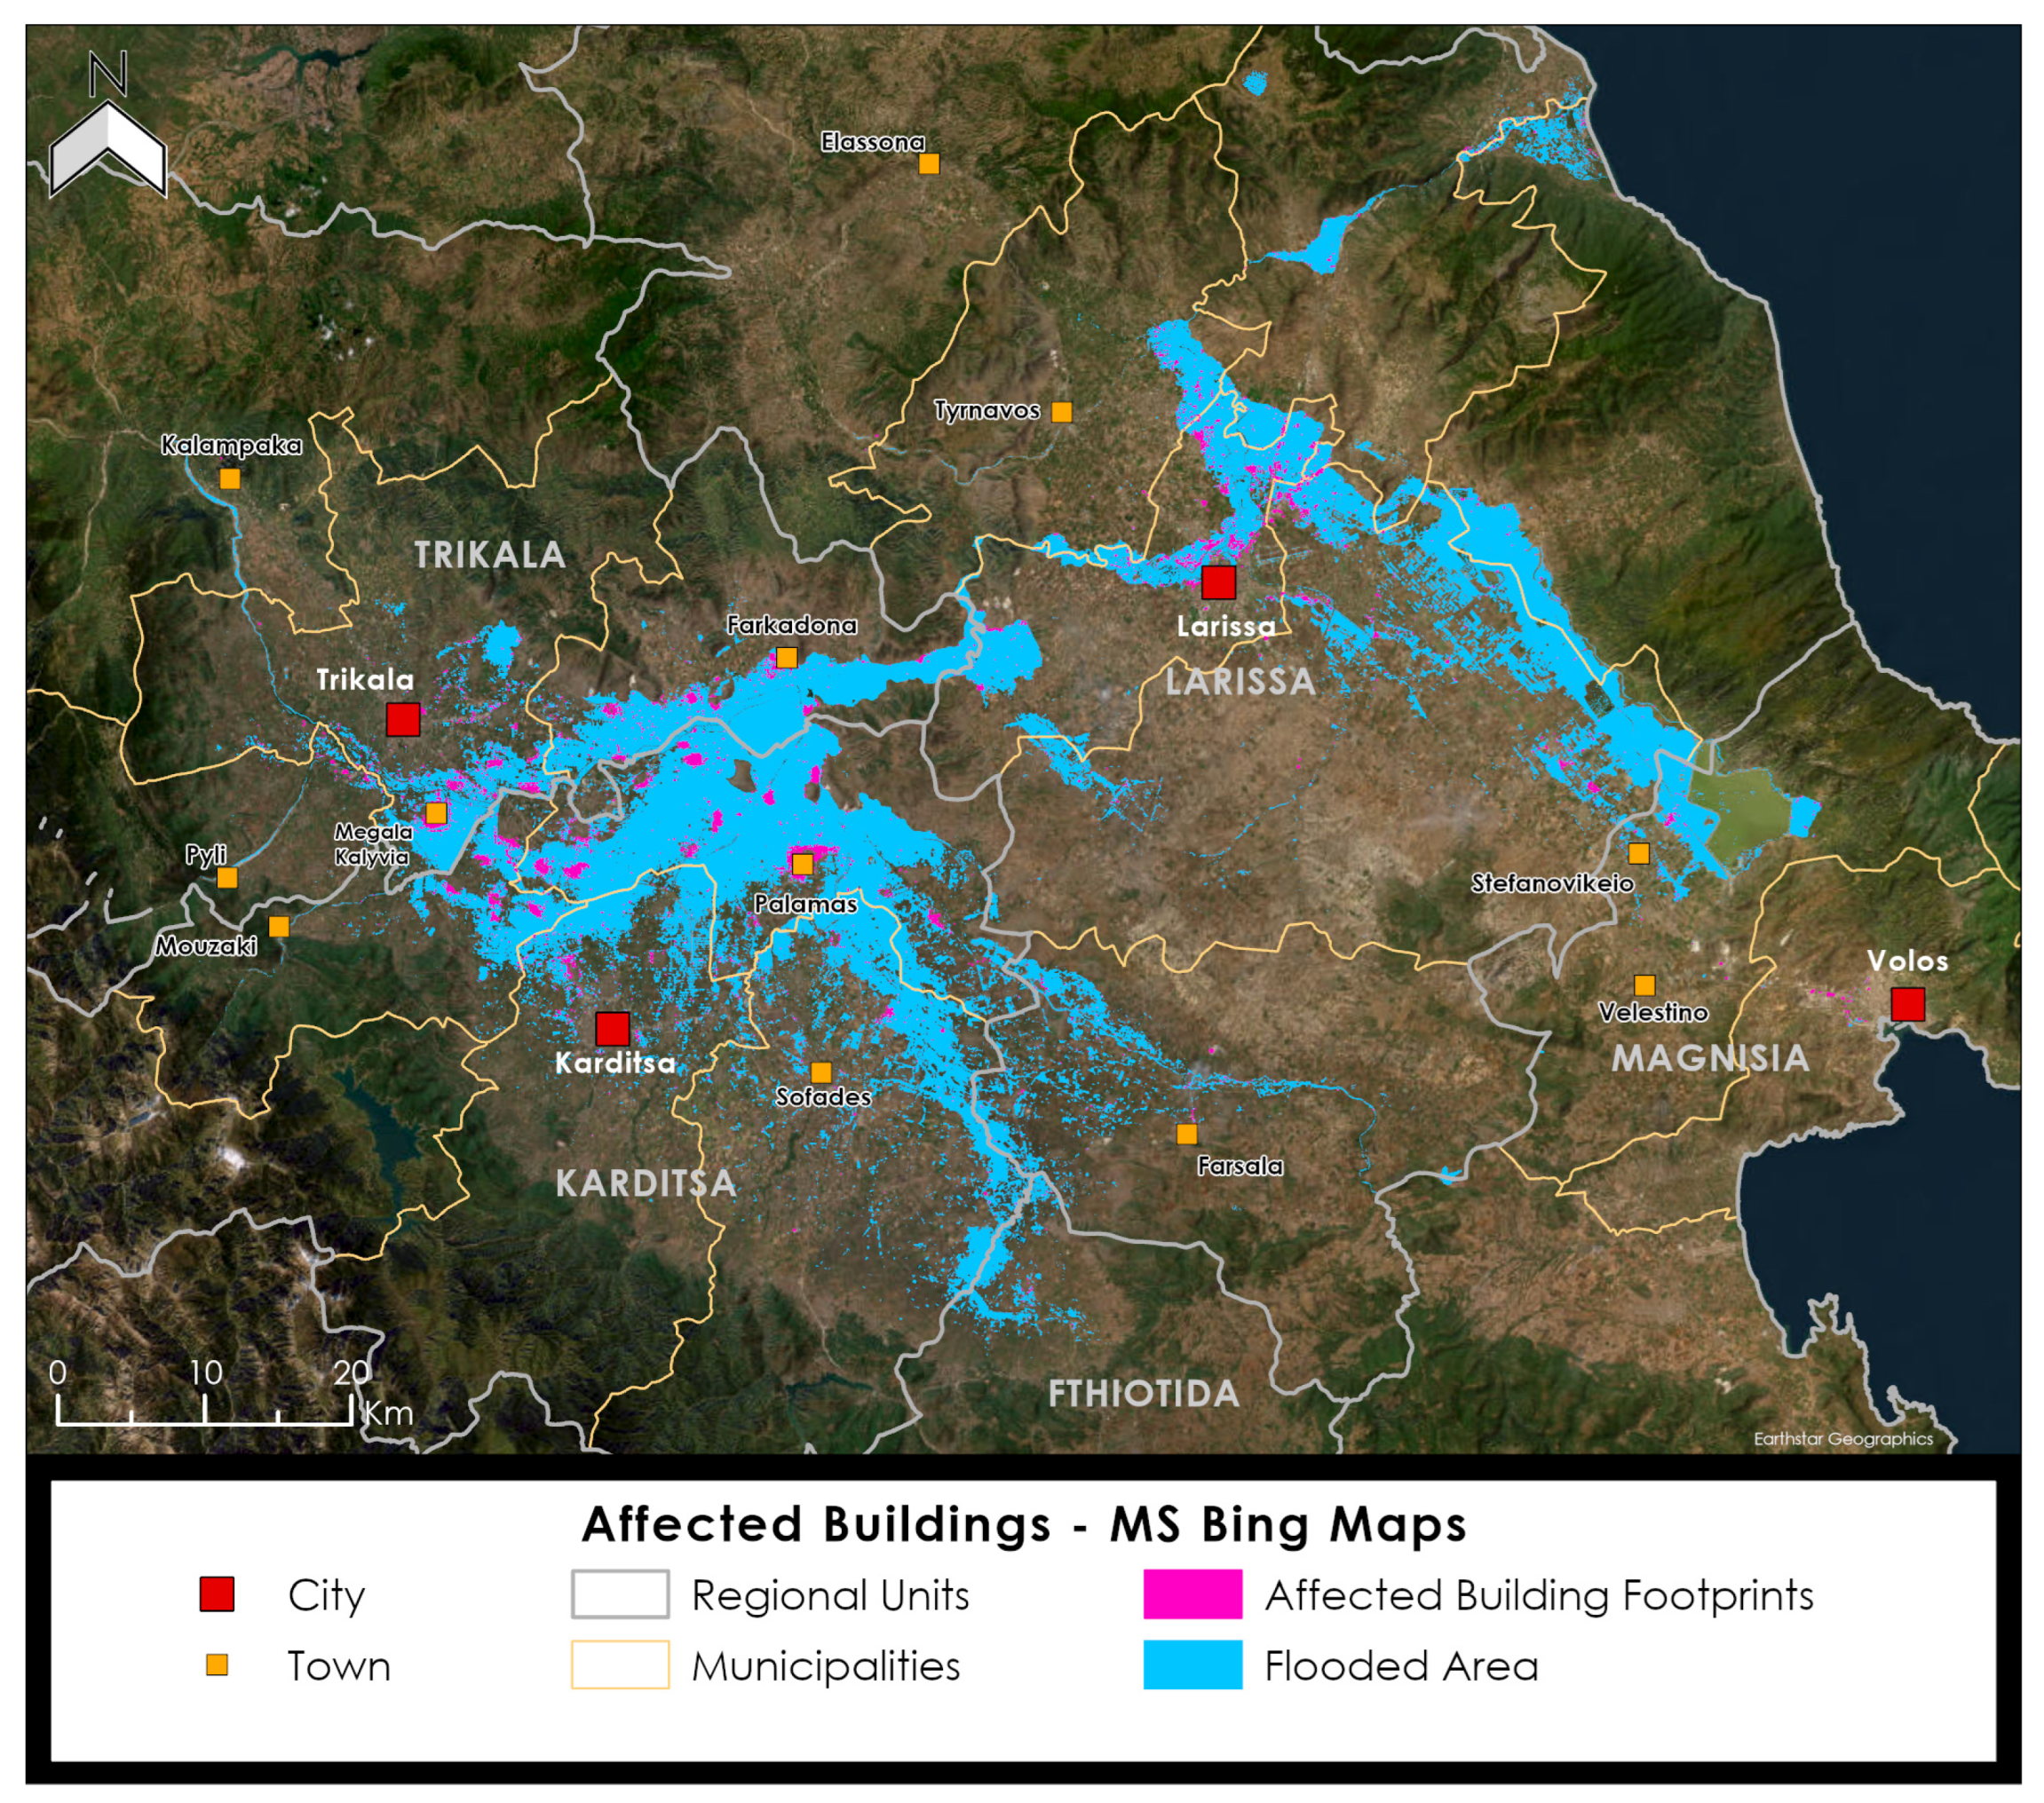
4.2.2. Buildings
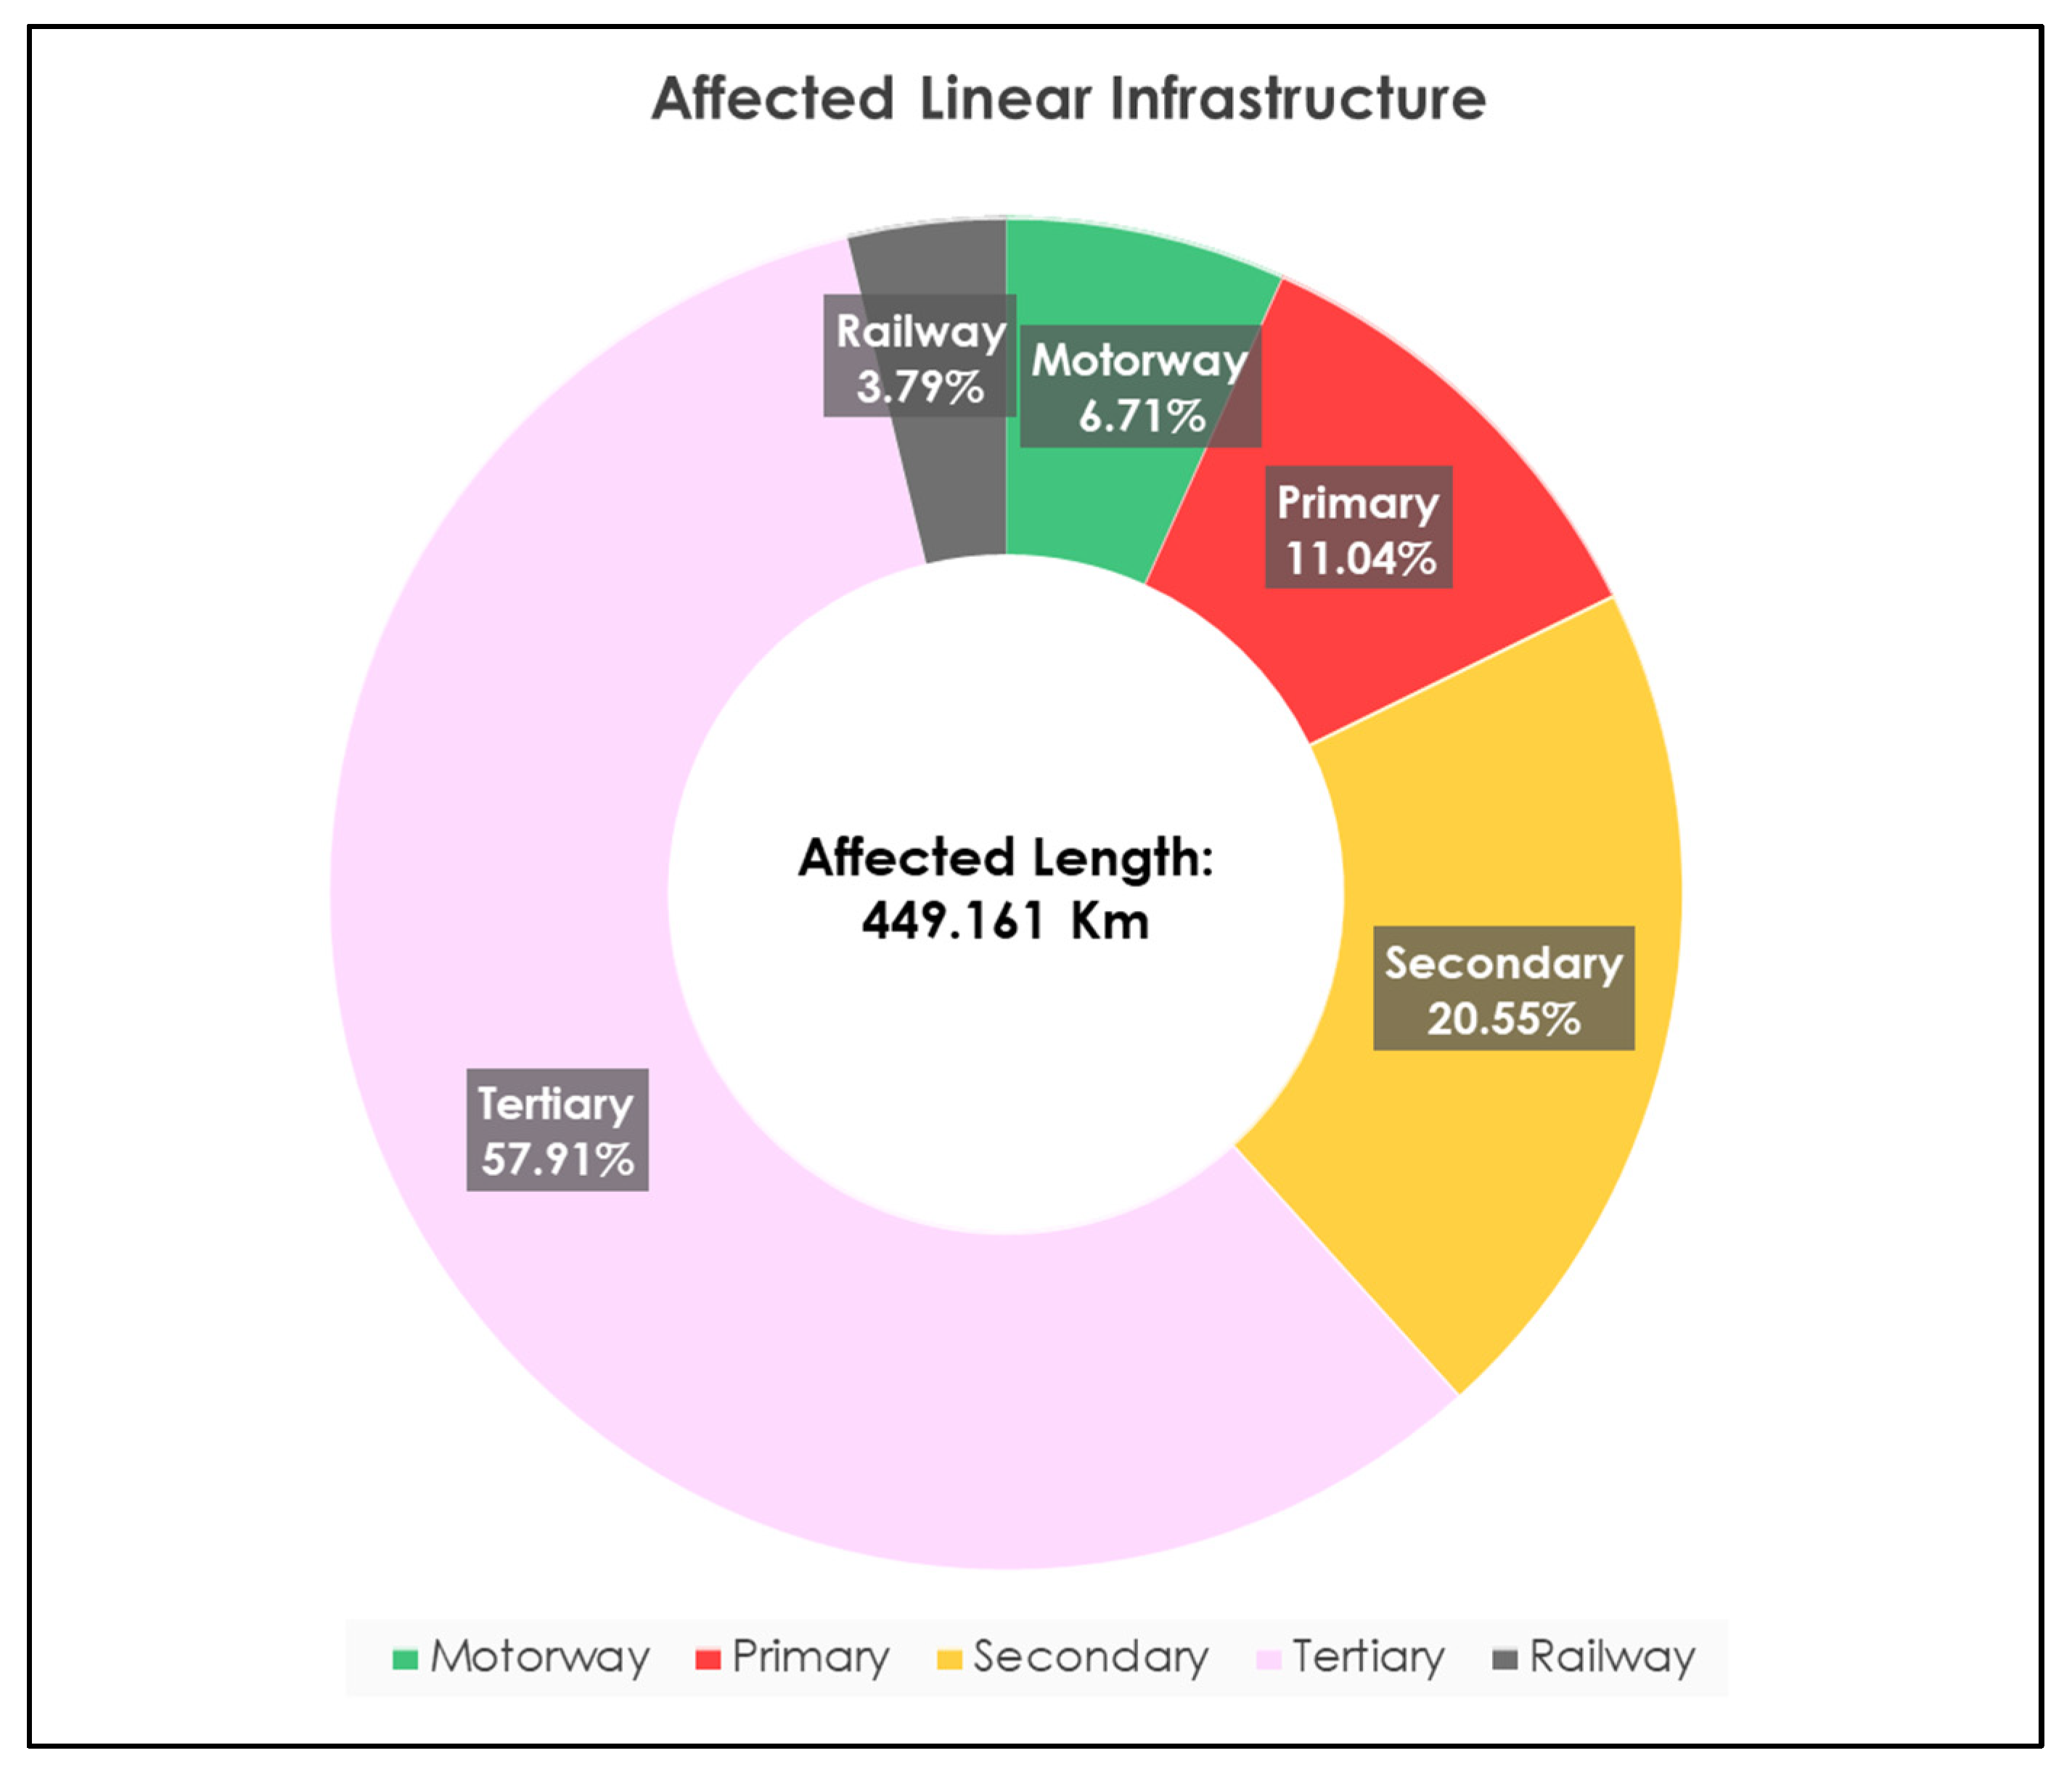
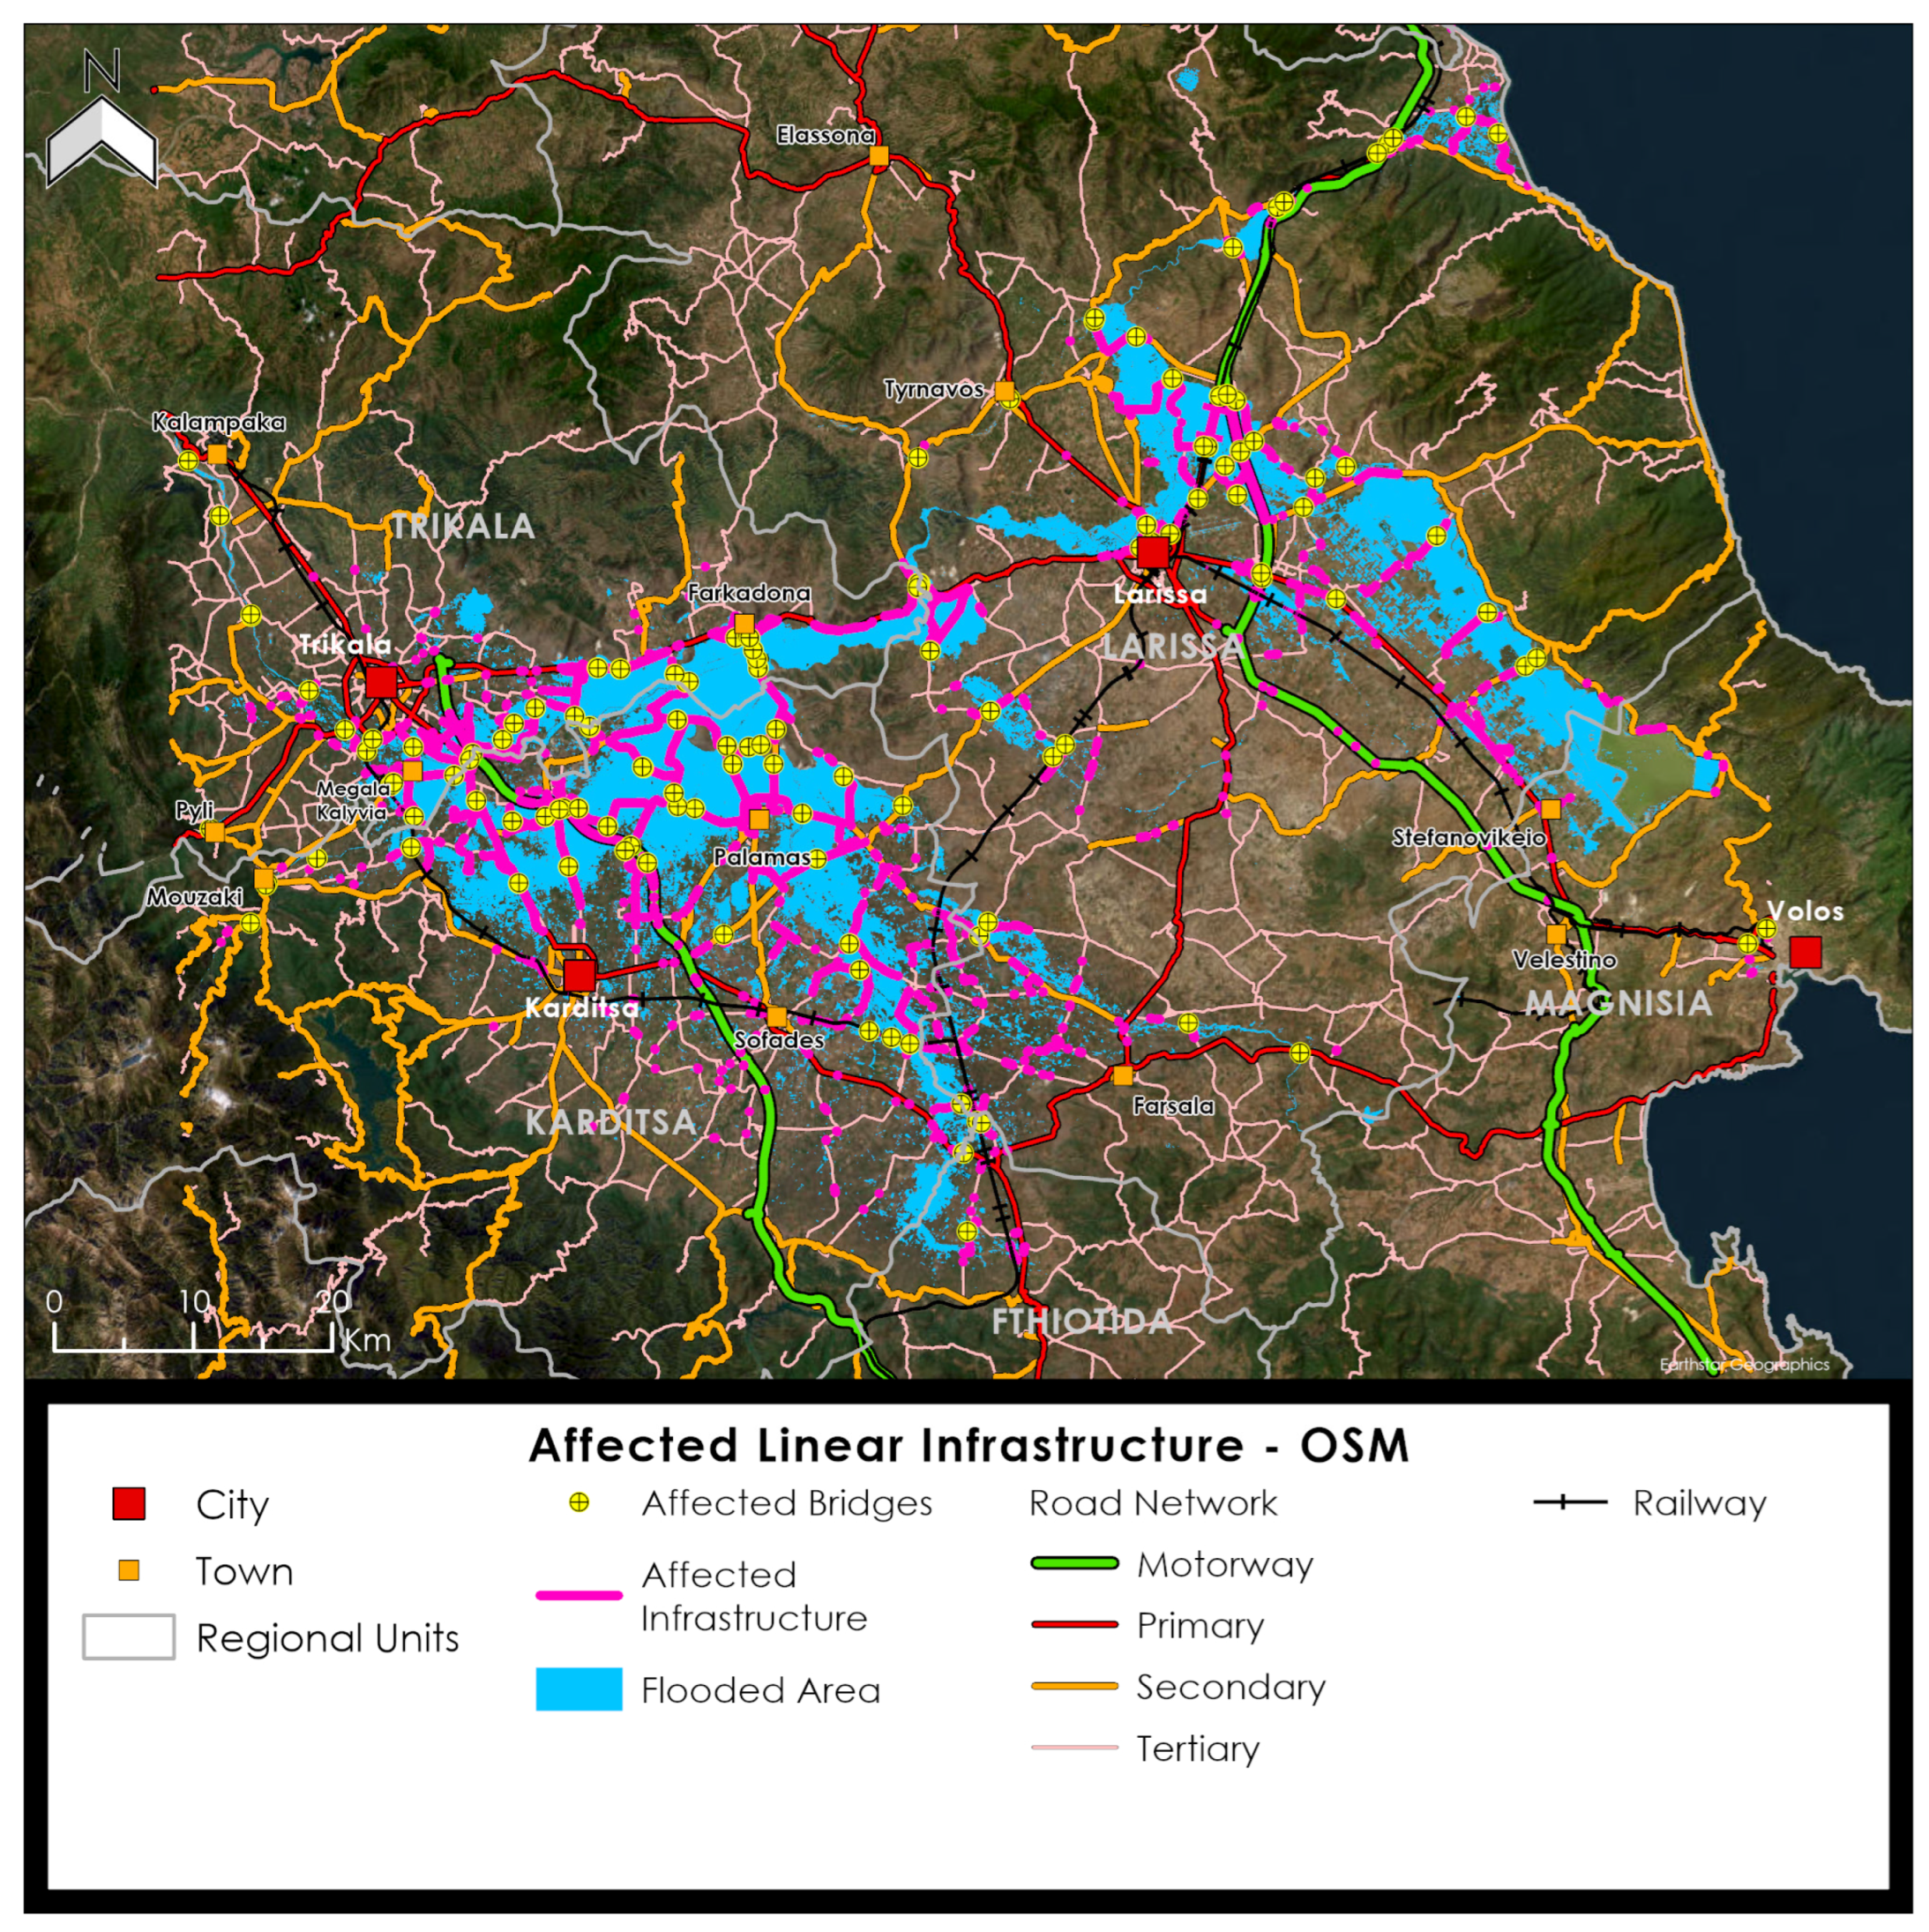
4.2.3. Linear Infrastructure
4.2.4. Population
4.3. Comparative Analysis
5. Discussion
6. Conclusions
Author Contributions
Funding
Data Availability Statement
Conflicts of Interest
Abbreviations
| AOI | Area of Interest |
| ASC | Ascending |
| BOA | Bottom-Of-Atmosphere |
| C2 T1 L2 | Collection 2 Tier-1 Level 2 |
| C3S | Copernicus Climate Change Service |
| CEMS | Copernicus Emergency Management Service |
| CLC | Corine Land Cover |
| CLMS | Copernicus Land Monitoring Service |
| DEM | Digital Elevation Model |
| DES | Descending |
| DNDWI | Difference in Normalized Difference Water Index |
| EOS | Executive Opinion Survey |
| ESA | European Space Agency |
| ESOTC | European State of the Climate |
| GEE | Google Earth Engine |
| GEOINT | Geospatial Intelligence |
| GHS | Global Human Settlement |
| GIS | Geographic Information Systems |
| GRD | Ground-Range Detected |
| HRO | Hellenic Railways Organization |
| IW | Interferometric Wide Swath |
| L2A | Level-2 A |
| LC08 | Landsat 8 |
| LC09 | Landsat 9 |
| MMU | Minimum Mapping Unit |
| MMW | Mapping Minimum Width |
| MNDWI | Modified Normalized Difference Water Index |
| MSI | MultiSpectral Imager |
| MStDev | Modified Standard Deviation |
| NASA | National Aeronautics and Space Administration |
| NDWI | Normalized Difference Water Index |
| NIR | Near-Infrared |
| NUTS | Nomenclature of Territorial Units for Statistics |
| OLI | Operational Land Imager |
| OSM | OpenStreetMap |
| RWDD | Road Works Design Directives of Greece |
| S1 | Sentinel-1 |
| S2 | Sentinel-2 |
| SAR | Synthetic Aperture Radar |
| SR | Surface Reflectance |
| SRTM | Shuttle Radar Topography Mission |
| StDev | Standard Deviation |
| SWIR | Short-Wave Infrared |
| TIRS | Thermal Infrared Sensor |
| USGS | United States Geological Survey |
| VV | Vertical-Vertical |
Appendix A


References
- European Environmental Agency. Climate Change Impacts, Risks and Adaptation. Available online: https://www.eea.europa.eu/en/topics/in-depth/climate-change-impacts-risks-and-adaptation (accessed on 13 March 2025).
- World Health Organization. Climate Crisis—Extreme Weather. Available online: https://www.who.int/europe/emergencies/situations/climate-crisis-extreme-weather (accessed on 13 March 2025).
- Copernicus Climate Change Service (C3S), European State of the Climate 2023, 2024. Available online: https://climate.copernicus.eu/ESOTC/2023 (accessed on 13 March 2025).
- Elsner, M.; Atkinson, G.; Zahidi, S. The Global Risks Report 2025; World Economic Forum: Cologny, Switzerland, 2025; p. 104. ISBN 978-2-940631-30-8. [Google Scholar]
- Hapuarachchi, H.A.P.; Wang, Q.J.; Pagano, T.C. A review of advances in flash flood forecasting. Hydrol. Process 2011, 25, 534–2771. [Google Scholar] [CrossRef]
- Levy, J.K.; Hall, J. Advances in flood risk management under uncertainty. Stoch. Environ. Res. Risk Assess 2005, 19, 375–377. [Google Scholar] [CrossRef]
- Lehmkuhl, F.; Schüttrumpf, H.; Schwarzbauer, J.; Brüll, C.; Dietze, M.; Letmathe, P.; Völker, C.; Hollert, H. Assessment of the 2021 summer flood in Central Europe. Environ. Sci. Eur. 2022, 34, 107. [Google Scholar] [CrossRef]
- Alcaras, E. Flood Mud Index (FMI): A Rapid and Effective Tool for Mapping Muddy Areas After Floods—The Valencia Case. Remote Sens. 2025, 17, 770. [Google Scholar] [CrossRef]
- Diakakis, M.; Andreadakis, E.; Nikolopoulos, E.I.; Spyrou, N.I.; Gogou, M.E.; Deligiannakis, G.; Katsetsiadou, N.K.; Antoniadis, Z.; Melaki, M.; Georgakopoulos, A.; et al. An Integrated Approach of Ground and Aerial Observations in Flash Flood Disaster Investigations. The Case of the 2017 Mandra Flash Flood in Greece. Int. J. Disaster Risk Reduct. 2019, 33, 290–309. [Google Scholar] [CrossRef]
- Diakakis, M.; Papagiannaki, K.; Fouskaris, M. The Occurrence of Catastrophic Multiple-Fatality Flash Floods in the Eastern Mediterranean Region. Water 2023, 15, 119. [Google Scholar] [CrossRef]
- Lionello, P.; Scarascia, L. The relation between climate change in the Mediterranean region and global warming. Reg. Environ. Change 2018, 18, 1481–1493. [Google Scholar] [CrossRef]
- Lin, L.; Di, L.; Yu, E.G.; Kang, L.; Shrestha, R.; Rahman, M.S.; Tang, J.; Deng, M.; Sun, Z.; Zhang, C.; et al. A Review of Remote Sensing in Flood Assessment. In Proceedings of the 2016 Fifth International Conference on Agro-Geoinformatics (Agro-Geoinformatics), Tianjin, China, 18–20 July 2016; pp. 1–4. [Google Scholar] [CrossRef]
- Munawar, H.S.; Hammad, A.W.A.; Waller, S.T. Remote Sensing Methods for Flood Prediction: A Review. Sensors 2022, 22, 960. [Google Scholar] [CrossRef]
- Klemas, V. Remote Sensing of Floods and Flood-Prone Areas: An Overview. J. Coast. Res. 2015, 314, 1005–1013. [Google Scholar] [CrossRef]
- Psomiadis, E.; Diakakis, M.; Soulis, K.X. Combining SAR and Optical Earth Observation with Hydraulic Simulation for Flood Mapping and Impact Assessment. Remote Sens. 2020, 12, 3980. [Google Scholar] [CrossRef]
- Grimaldi, S.; Xu, J.; Li, Y.; Pauwels, V.R.N.; Walker, J.P. Flood Mapping under Vegetation Using Single SAR Acquisitions. Remote Sens. Environ. 2020, 237, 111582. [Google Scholar] [CrossRef]
- DeVries, B.; Huang, C.; Armston, J.; Huang, W.; Jones, J.W.; Lang, M.W. Rapid and Robust Monitoring of Flood Events Using Sentinel-1 and Landsat Data on the Google Earth Engine. Remote Sens. Environ. 2020, 240, 111664. [Google Scholar] [CrossRef]
- Amitrano, D.; Di Martino, G.; Di Simone, A.; Imperatore, P. Flood Detection with SAR: A Review of Techniques and Datasets. Remote Sens. 2024, 16, 656. [Google Scholar] [CrossRef]
- Pandey, A.C.; Kaushik, K.; Parida, B.R. Google Earth Engine for Large-Scale Flood Mapping Using SAR Data and Impact Assessment on Agriculture and Population of Ganga-Brahmaputra Basin. Sustainability 2022, 14, 4210. [Google Scholar] [CrossRef]
- Caballero, I.; Roca, M.; Dunbar, M.B.; Navarro, G. Water Quality and Flooding Impact of the Record-Breaking Storm Gloria in the Ebro Delta (Western Mediterranean). Remote Sens. 2024, 16, 41. [Google Scholar] [CrossRef]
- Albertini, C.; Gioia, A.; Iacobellis, V.; Manfreda, S. Detection of Surface Water and Floods with Multispectral Satellites. Remote Sens. 2022, 14, 6005. [Google Scholar] [CrossRef]
- Eudaric, J.; Kreibich, H.; Camero, A.; Rafiezadeh Shahi, K.; Martinis, S.; Zhu, X.X. A Satellite Imagery-Driven Framework for Rapid Resource Allocation in Flood Scenarios to Enhance Loss and Damage Fund Effectiveness. Sci Rep 2024, 14, 19290. [Google Scholar] [CrossRef]
- Ghosh, S.; Kumar, D.; Kumari, R. Cloud-Based Large-Scale Data Retrieval, Mapping, and Analysis for Land Monitoring Applications with Google Earth Engine (GEE). Environ. Chall. 2022, 9, 100605. [Google Scholar] [CrossRef]
- Johary, R.; Révillion, C.; Catry, T.; Alexandre, C.; Mouquet, P.; Rakotoniaina, S.; Pennober, G.; Rakotondraompiana, S. Detection of Large-Scale Floods Using Google Earth Engine and Google Colab. Remote Sens. 2023, 15, 5368. [Google Scholar] [CrossRef]
- Tran, K.H.; Menenti, M.; Jia, L. Surface Water Mapping and Flood Monitoring in the Mekong Delta Using Sentinel-1 SAR Time Series and Otsu Threshold. Remote Sens. 2022, 14, 5721. [Google Scholar] [CrossRef]
- Moharrami, M.; Javanbakht, M.; Attarchi, S. Automatic Flood Detection Using Sentinel-1 Images on the Google Earth Engine. Env. Monit Assess 2021, 193, 248. [Google Scholar] [CrossRef]
- McFeeters, S.K. The use of the Normalized Difference Water Index (NDWI) in the delineation of open water features. Int. J. Remote Sens. 1996, 17, 1425–1432. [Google Scholar] [CrossRef]
- Xu, H. Modification of Normalised Difference Water Index (NDWI) to Enhance Open Water Features in Remotely Sensed Imagery. Int. J. Remote Sens. 2006, 27, 3025–3033. [Google Scholar] [CrossRef]
- Kulk, G.; Sathyendranath, S.; Platt, T.; George, G.; Suresan, A.K.; Menon, N.; Evers-King, H.; Abdulaziz, A. Using Multi-Spectral Remote Sensing for Flood Mapping: A Case Study in Lake Vembanad, India. Remote Sens. 2023, 15, 5139. [Google Scholar] [CrossRef]
- Samela, C.; Coluzzi, R.; Imbrenda, V.; Manfreda, S.; Lanfredi, M. Satellite Flood Detection Integrating Hydrogeomorphic and Spectral Indices. GIScience Remote Sens. 2022, 59, 1997–2018. [Google Scholar] [CrossRef]
- Falaras, T.; Diakakis, M.; Lagouvardos, K.; Lekkas, E.; Parcharidis, I. Confluence of Operational Tracking of Flood Events in Western Thessaly’s Basin (Greece) in September 2020 Based on Subsequence of Optical and Radar Copernicus Satellite Imagery. In Proceedings of the 8th International Conference on Civil Protection and New Technologies—Safe Greece 2021, Athens, Greece, 24–26 November 2021. [Google Scholar] [CrossRef]
- Lekkas, E.; Nastos, P.T.; Cartalis, C.; Diakakis, M.; Gogou, M.; Mavroulis, S.; Vassilakis, E.; Spyrou, N.I.; Kotsi, E.; Katsetsiadou, K.-N.; et al. Impact of Medicane “IANOS” (September 2020). Newsl. Environ. Disaster Cris. Manag. Strateg. 2020, 20. [Google Scholar] [CrossRef]
- Bacastow, T.S.; Bellafiore, D. Redefining Geospatial Intelligence. Am. Intell. J. 2009, 27, 38–40. Available online: https://www.jstor.org/stable/44327109 (accessed on 20 March 2025).
- Krassakis, P. Geospatial Intelligence for Multi-Hazard Assessment in Coastal Areas of the Hellenic Volcanic Arc. Ph.D. Thesis, Harokopio University of Athens, Athens, Greece, 2024. [Google Scholar]
- Falaras, T.; Tselka, I.; Papadopoulos, I.; Nikolidaki, M.; Karavias, A.; Bafi, D.; Petani, A.; Krassakis, P.; Parcharidis, I. Operational Mapping and Post-Disaster Hazard Assessment by the Development of a Multiparametric Web App Using Geospatial Technologies and Data: Attica Region 2021 Wildfires (Greece). Appl. Sci. 2022, 12, 7256. [Google Scholar] [CrossRef]
- Hellenic Statistical Authority. Available online: https://www.statistics.gr/en/home/ (accessed on 21 July 2024).
- Apostolidis, E.; Koukis, G. Engineering-Geological Conditions of the Formations in the Western Thessaly Basin, Greece. Open Geosci. 2013, 5, 407–422. [Google Scholar] [CrossRef]
- Special Secretariat for Water. 1st Revision of the River Basin Management Plan for the Water Basins of the Water Region of Thessaly (EL08); Ministry of Environment and Energy: Athens, Greece, 2017; 260p. Available online: http://wfdver.ypeka.gr/wp-content/uploads/2017/12/EL08_SDLAP_APPROVED.pdf (accessed on 2 March 2025).
- Dimitriou, E.; Efstratiadis, A.; Zotou, I.; Papadopoulos, A.; Iliopoulou, T.; Sakki, G.-K.; Mazi, K.; Rozos, E.; Koukouvinos, A.; Koussis, A.D.; et al. Post-Analysis of Daniel Extreme Flood Event in Thessaly, Central Greece: Practical Lessons and the Value of State-of-the-Art Water-Monitoring Networks. Water 2024, 16, 980. [Google Scholar] [CrossRef]
- Mavroulis, S.; Mavrouli, M.; Lekkas, E.; Tsakris, A. Impact of the September 2023 Storm Daniel and Subsequent Flooding in Thessaly (Greece) on the Natural and Built Environment and on Infectious Disease Emergence. Environments 2024, 11, 163. [Google Scholar] [CrossRef]
- He, K.; Yang, Q.; Shen, X.; Dimitriou, E.; Mentzafou, A.; Papadaki, C.; Stoumboudi, M.; Anagnostou, E.N. Brief Communication: Storm Daniel Flood Impact in Greece in 2023: Mapping Crop and Livestock Exposure from Synthetic-Aperture Radar (SAR). Nat. Hazards Earth Syst. Sci. 2024, 24, 2375–2382. [Google Scholar] [CrossRef]
- Adamopoulos, I.; Frantzana, A.; Syrou, N. Climate Crises Associated with Epidemiological, Environmental, and Ecosystem Effects of a Storm: Flooding, Landslides, and Damage to Urban and Rural Areas (Extreme Weather Events of Storm Daniel in Thessaly, Greece). Med. Sci. Forum 2024, 25, 7. [Google Scholar] [CrossRef]
- Lekkas, E.; Diakakis, M.; Mavroulis, S.; Filis, C.; Bantekas, I.; Gogou, M.; Katsetsiadou, K.-N.; Mavrouli, M.; Giannopoulos, V.; Sarantopoulou, A.; et al. The early September 2023 Daniel storm in Thessaly Region (Central Greece). Newsl. Environ. Disaster Cris. Manag. Strateg. 2023, 30, 30. [Google Scholar] [CrossRef]
- Diakakis, M.; Sarantopoulou, A.; Gogou, M.; Filis, C.; Nastos, P.; Kapris, I.; Vassilakis, E.; Konsolaki, A.; Lekkas, E. Cascade Effects Induced by Extreme Storms and Floods: The Case of Storm Daniel (2023) in Greece. Water 2025, 17, 912. [Google Scholar] [CrossRef]
- Karakatsani, E. Greece economy briefing: The economic impact of the recent devastating floods in Greece. China-CEE Institute. Wkly. Briefining 2023, 65, 2, ISSN 2939-5933. Available online: https://china-cee.eu/wp-content/uploads/2023/10/2023e09_Greece.pdf (accessed on 15 March 2025).
- Vasileiadis, G. The History of Floods in Thessaly. Master’s Thesis, Faculty of Geology and Geoenvironment, National and Kapodistrian University of Athens, Athens, Greece, 2024; p. 106. [Google Scholar]
- Lagouvardos, K.; Karagiannidis, A.; Dafis, S.; Kalimeris, A.; Kotroni, V. Ianos—A Hurricane in the Mediterranean. Bull. Am. Meteorol. Soc. 2022, 103, E1621–E1636. [Google Scholar] [CrossRef]
- Earth Engine Data Catalog. Available online: https://developers.google.com/earth-engine/datasets/catalog/ (accessed on 10 December 2024).
- European Space Agency. Sentinel-2 User Handbook; European Space Agency: Paris, France, 2015; Available online: https://sentinel.esa.int/documents/247904/685211/Sentinel-2_User_Handbook (accessed on 10 December 2024).
- Sentinel-2. SentiWiki. Available online: https://sentiwiki.copernicus.eu/web/sentinel-2 (accessed on 10 December 2024).
- Harmonized Sentinel-2 MSI: MultiSpectral Instrument, Level-2A (SR). Earth Engine Data Catalog. Available online: https://developers.google.com/earth-engine/datasets/catalog/COPERNICUS_S2_SR_HARMONIZED (accessed on 10 December 2024).
- Sentinel-1. SentiWiki. Available online: https://sentiwiki.copernicus.eu/web/sentinel-1 (accessed on 12 December 2024).
- Sentinel-1 SAR GRD: C-band Synthetic Aperture Radar Ground Range Detected, Log Scaling. Earth Engine Data Catalog. Available online: https://developers.google.com/earth-engine/datasets/catalog/COPERNICUS_S1_GRD (accessed on 12 December 2024).
- Earth Resources Observation and Science (EROS) Center. Landsat 8–9 Operational Land Imager/Thermal Infrared Sensor Level-2, Collection 2; U.S. Geological Survey: Reston, VA, USA, 2020. Available online: https://www.usgs.gov/centers/eros/science/usgs-eros-archive-landsat-archives-landsat-8-9-olitirs-collection-2-level-2 (accessed on 15 December 2024).
- Landsat 8. U.S. Geological Survey. Available online: https://www.usgs.gov/landsat-missions/landsat-8 (accessed on 15 December 2024).
- Landsat 9. U.S. Geological Survey. Available online: https://www.usgs.gov/landsat-missions/landsat-9 (accessed on 15 December 2024).
- USGS Landsat 8 Level 2, Collection 2, Tier 1. Earth Engine Data Catalog. Available online: https://developers.google.com/earth-engine/datasets/catalog/LANDSAT_LC08_C02_T1_L2 (accessed on 15 December 2024).
- USGS Landsat 9 Level 2, Collection 2, Tier 1. Earth Engine Data Catalog. Available online: https://developers.google.com/earth-engine/datasets/catalog/LANDSAT_LC09_C02_T1_L2 (accessed on 15 December 2024).
- U.S. Geological Survey. EarthExplorer. Available online: https://earthexplorer.usgs.gov/ (accessed on 14 December 2024).
- NASA SRTM Digital Elevation 30m. Earth Engine Data Catalog. Available online: https://developers.google.com/earth-engine/datasets/catalog/USGS_SRTMGL1_003 (accessed on 11 December 2024).
- NASA JPL NASA Shuttle Radar Topography Mission Global 1 Arc Second 2013. Available online: https://lpdaac.usgs.gov/products/srtmgl1v003/ (accessed on 11 December 2024).
- Farr, T.G.; Rosen, P.A.; Caro, E.; Crippen, R.; Duren, R.; Hensley, S.; Kobrick, M.; Paller, M.; Rodriguez, E.; Roth, L.; et al. The Shuttle Radar Topography Mission. Rev. Geophys. 2007, 45, 2005RG000183. [Google Scholar] [CrossRef]
- Corine Land Cover. Copernicus Land Monitoring Service. Available online: https://land.copernicus.eu/en/products/corine-land-cover (accessed on 21 July 2024).
- Büttner, G.; Kosztra, B.; Soukup, T.; Sousa, A.; Langanke, T. CLC2018 Technical Guidelines; European Environment Agency: Copenhagen, Denmark, 2017; Available online: https://land.copernicus.eu/user-corner/technicallibrary/clc2018technicalguidelines_final.pdf (accessed on 21 July 2024).
- European Environment Agency. CORINE Land Cover 2018 (vector), Europe, 6-yearly—version 2020_20u1; European Environment Agency: Copenhagen, Denmark, 2020. [Google Scholar] [CrossRef]
- OpenStreetMap. Available online: https://www.openstreetmap.org/ (accessed on 16 December 2024).
- Geofabrik. Available online: https://download.geofabrik.de/ (accessed on 16 December 2024).
- Lagouvardos, K.; Kotroni, V.; Bezes, A.; Koletsis, I.; Kopania, T.; Lykoudis, S.; Mazarakis, N.; Papagiannaki, K.; Vougioukas, S. The Automatic Weather Stations NOANN Network of the National Observatory of Athens: Operation and Database. Geosci. Data J. 2017, 4, 4–16. [Google Scholar] [CrossRef]
- Meteo.gr Meteo Search. Available online: https://meteosearch.meteo.gr/ (accessed on 16 December 2024).
- Geoportal of Special Secretariat for Water. Available online: https://wfdgis.ypeka.gr/ (accessed on 22 July 2024).
- EU-Hydro River Network Database 2006-2012 (vector), Europe. Copernicus Land Monitoring Service. Available online: https://land.copernicus.eu/en/products/eu-hydro/eu-hydro-river-network-database (accessed on 11 February 2025).
- European Environment Agency. EU-Hydro River Network Database 2006–2012 (Vector), Europe—Version 1.3; European Environment Agency: Copenhagen, Denmark, 2020. [Google Scholar] [CrossRef]
- Microsoft Global ML Building Footprints. GitHub. Available online: https://github.com/microsoft/GlobalMLBuildingFootprints/ (accessed on 18 November 2024).
- Copernicus Emergency Management Service. Available online: https://emergency.copernicus.eu/ (accessed on 16 September 2024).
- EMSR692—Flood in Greece. Copernicus Emergency Management Service. Available online: https://rapidmapping.emergency.copernicus.eu/EMSR692 (accessed on 16 September 2024).
- GHSL—Global Human Settlement Layer. Available online: https://human-settlement.emergency.copernicus.eu/ (accessed on 15 January 2025).
- Schiavina, M.; Freire, S.; Carioli, A.; MacManus, K. GHS-POP R2023A—GHS Population Grid Multitemporal (1975–2030); European Commission, Joint Research Centre (JRC): Brussels, Belgium, 2023; Available online: http://data.europa.eu/89h/2ff68a52-5b5b-4a22-8f40-c41da8332cfe (accessed on 15 January 2025).
- Google Earth Engine. Available online: https://earthengine.google.com/ (accessed on 10 July 2024).
- Gorelick, N.; Hancher, M.; Dixon, M.; Ilyushchenko, S.; Thau, D.; Moore, R. Google Earth Engine: Planetary-Scale Geospatial Analysis for Everyone. Remote Sens. Environ. 2017, 202, 18–27. [Google Scholar] [CrossRef]
- Rättich, M.; Martinis, S.; Wieland, M. Automatic Flood Duration Estimation Based on Multi-Sensor Satellite Data. Remote Sens. 2020, 12, 643. [Google Scholar] [CrossRef]
- Ogashawara, I.; Curtarelli, M.P.; Ferreira, C.M. The use of optical remote sensing for mapping flooded areas. Int. J. Eng. Res. Appl. 2013, 3, 1956–1960. Available online: https://www.ijera.com/papers/Vol3_issue5/LL3519561960.pdf (accessed on 10 March 2025).
- Otsu, N. A Threshold Selection Method from Gray-Level Histograms. IEEE Trans. Syst., Man Cybern. 1979, 9, 62–66. [Google Scholar] [CrossRef]
- Demissie, B.; Vanhuysse, S.; Grippa, T.; Flasse, C.; Wolff, E. Using Sentinel-1 and Google Earth Engine Cloud Computing for Detecting Historical Flood Hazards in Tropical Urban Regions: A Case of Dar Es Salaam. Geomat. Nat. Hazards Risk 2023, 14, 2202296. [Google Scholar] [CrossRef]
- Filipponi, F. Sentinel-1 GRD Preprocessing Workflow. Proceedings 2019, 18, 11. [Google Scholar] [CrossRef]
- Lee, J.S.; Jurkevich, L.; Dewaele, P.; Wambacq, P.; Oosterlinck, A. Speckle Filtering of Synthetic Aperture Radar Images: A Review. Remote Sens. Rev. 1994, 8, 313–340. [Google Scholar] [CrossRef]
- Google Earth Engine. Focal Median. Available online: https://developers.google.com/earth-engine/apidocs/ee-image-focalmedian (accessed on 19 December 2024).
- Railway network. Hellenic Railways Organization—OSE. Available online: https://ose.gr/σιδηροδρομικό-δίκτυο/χάρτης/# (accessed on 2 February 2025).
- Ministry of Environment, Urban Development; Public Works, General Secretariat of Public Works, Directorate of Road Construction Works Studies. Road Work. Des. Dir. OMOE 2001, 2. Available online: https://www.ggde.gr/dmdocuments/omoe_2_d.pdf#page=6.67 (accessed on 2 February 2025).
- Ministry of Environment and Energy. Flood Risk Management Plans of the Water Region of Thessaly (EL08); Ministry of Environment and Energy: Athens, Greece, 2023.
- Falaras, T.; Koilakou, M.; Harokopio University; Tsoukalas, L. Multitemporal Observation of Karla Reservoir in Thessaly Greece Utilizing SAR and Optical Remotely Sensing Imagery. Eur. J. Geogr. 2020, 11, 144–156. [Google Scholar] [CrossRef]
- Falaras, T. Analysis and Assessment of Parallel Temporal Monitoring for Inland Water Reservoir and Neighboring Agricultural Basin in the Era of Climate Change. Master’s Thesis, Harokopio University of Athens, Athens, Greece, 2021. [Google Scholar]
- Tsinidis, G.; Koutas, L. Geotechnical and Structural Damage to the Built Environment of Thessaly Region, Greece, Caused by the 2023 Storm Daniel. Geotechnics 2025, 5, 16. [Google Scholar] [CrossRef]
- UN-SPIDER. Step-by-Step: Recommended Practice: Flood Mapping and Damage Assessment Using Sentinel-1 SAR Data in Google Earth Engine. Available online: https://www.un-spider.org/advisory-support/recommended-practices/recommended-practice-google-earth-engine-flood-mapping/step-by-step (accessed on 5 November 2024).
- O’Hara, R.; Green, S.; McCarthy, T. The agricultural impact of the 2015-2016 floods in Ireland as mapped through Sentinel 1 satellite imagery. Ir. J. Agric. Food Res. 2019, 58, 44–65. Available online: https://www.jstor.org/stable/26853504 (accessed on 5 March 2025). [CrossRef]


| Datasets | Format | Resolution Spatial | Temporal | Source | Purpose/Use |
|---|---|---|---|---|
| Sentinel-1 imagery 1 | Synthetic Aperture Radar GRD IW | 10 m and 20 m (Used) | 2023 | ESA Copernicus Google Earth Engine | Flood Mapping |
| Sentinel-2 imagery 1 | Multispectral Level-2A | 10 m (Used) | 2023 | ESA Copernicus Google Earth Engine | Flood Mapping |
| Landsat 8/9 imagery 1 | Multispectral Collection 2 Tier 1 Level-2 | 30 m (Used) | 2023 | NASA/USGS Google Earth Engine | Flood Mapping |
| SRTM DEM 1 Arc-Sec V3 | Raster | 30 m | 2000 | Earth Explorer Google Earth Engine | Masking—Floodwaters—Study area |
| Corine Land Cover 2018 | Vector (Polygon) | - | 2018 | Copernicus Land Monitoring Service | Impact Assessment |
| Meteorological Data | Text | - | 2023 | Meteo.gr of National Observatory of Athens Network | Meteorological Event Data |
| Hydrology | Vector (Lines, Polygons) | - | 2018 - | 2024 - | 2012 | Special Secretariat for Water OpenStreetMap | Geofabrik EU-Hydro | Area of Interest |
| Infrastructure | Vector (Lines) | - | 2023 | OpenStreetMap Geofabrik | Impact Assessment |
| Building Footprints | Vector (GeoJSON Polygons) | - | 2014− | Microsoft Bing Maps Global ML Buildings Footprints | Impact Assessment |
| Population Grid | Raster | 100 m | 2020 | Global Human Settlement Layer (R2023) | Impact Assessment |
| EMSR692—Flood in Greece | Multiple (Vector, Maps, etc.) | - | 2023 | Copernicus Emergency Management Service | Validation |
| Administrative Boundaries and Population | Vector (Points, Polygons) | Spreadsheets | - | 2021 | Hellenic Statistical Authority | Area of Interest |
| Event | Satellite Image Acquisition Date and Time (UTC +03:00) | Satellite | Type | Result | Number of Images |
|---|---|---|---|---|
| Pre-Event | 22 July 2023 12:10 | Landsat 8 C02 T1 L2 |
Landsat 8 Pre-Event Water Mask | 2 |
| 21 August 2023 12:25 | Sentinel-2 L2A | S2 Pre-Event Water Mask | 4 | |
| 25 August 2023 07:40 | Sentinel-1 GRDH IW DES |
S1 Pre-Event Water Mask | 2 | |
| 26 August 2023 19:24 | Sentinel-1 GRDH IW ASC | 2 | ||
| Event | 6 September 2023 07:40 | Sentinel-1 GRDH IW DES | Flooded Area 1 | 2 |
| Post-Event | 7 September 2023 19:24 | Sentinel-1 GRDH IW ASC | Flooded Area 1 | 2 |
| 8 September 2023 12:10 | Landsat 8 C02 T1 L2 | Flooded Area 1 | 2 | |
| 10 September 2023 12:15 | Sentinel-2 L2A | Flooded Area 1 | 7 | |
| 12 September 2023 19:32 | Sentinel-1 GRDH IW ASC | Flooded Area 2 | 2 | |
| 13 September 2023 07:32 | Sentinel-1 GRDH IW DES | Flooded Area 2 | 2 | |
| 16 September 2023 12:10 | Landsat 9 C02 T1 L2 | Flooded Area 3 | 2 | |
| 18 September 2023 07:40 | Sentinel-1 GRDH IW DES | Flooded Area 4 | 2 | |
| 19 September 2023 19:24 | Sentinel-1 GRDH IW ASC | Flooded Area 4 | 2 | |
| 24 September 2023 19:32 | Sentinel-1 GRDH IW ASC | Flooded Area 5 | 2 | |
| 25 September 2023 07:32 | Sentinel-1 GRDH IW DES | Flooded Area 5 | 2 | |
| Post-Event and Storm Elias | 30 September 2023 12:17 | Sentinel-2 L2A | Flooded Area 6 | 4 |
| 30 September 2023 07:40 | Sentinel-1 GRDH IW DES | Flooded Area 6 | 2 | |
| 1 October 2023 19:24 | Sentinel-1 GRDH IW ASC | Flooded Area 6 | 2 | |
| Post-Event | 6 October 2023 19:32 | Sentinel-1 GRDH IW ASC | Flooded Area 7 | 2 |
| 7 October 2023 07:32 | Sentinel-1 GRDH IW DES | Flooded Area 7 | 2 | |
| 10 October 2023 12:18 | Sentinel-2 L2A | Flooded Area 8 | 4 | |
| 15 October 2023 12:20 | Sentinel-2 L2A | Flooded Area 9 | 4 | |
| 18 October 2023 19:32 | Sentinel-1 GRDH IW ASC | Flooded Area 10 | 2 | |
| 19 October 2023 07:32 | Sentinel-1 GRDH IW DES | Flooded Area 10 | 2 | |
| 20 October 2023 12:19 | Sentinel-2 L2A | Flooded Area 11 | 4 | |
| 24 October 2023 07:40 | Sentinel-1 GRDH IW DES | Flooded Area 12 | 2 | |
| 25 October 2023 19:24 | Sentinel-1 GRDH IW ASC | Flooded Area 12 | 2 | |
| 30 October 2023 12:20 | Sentinel-2 L2A | Flooded Area 13 | 4 | |
|
Total Images | Sentinel-1 GRDH IW | 36 | ||
| Sentinel-2 L2A | 31 | |||
| Landsat 8 C02 T1 L2 | 6 | |||
| Total | 73 |
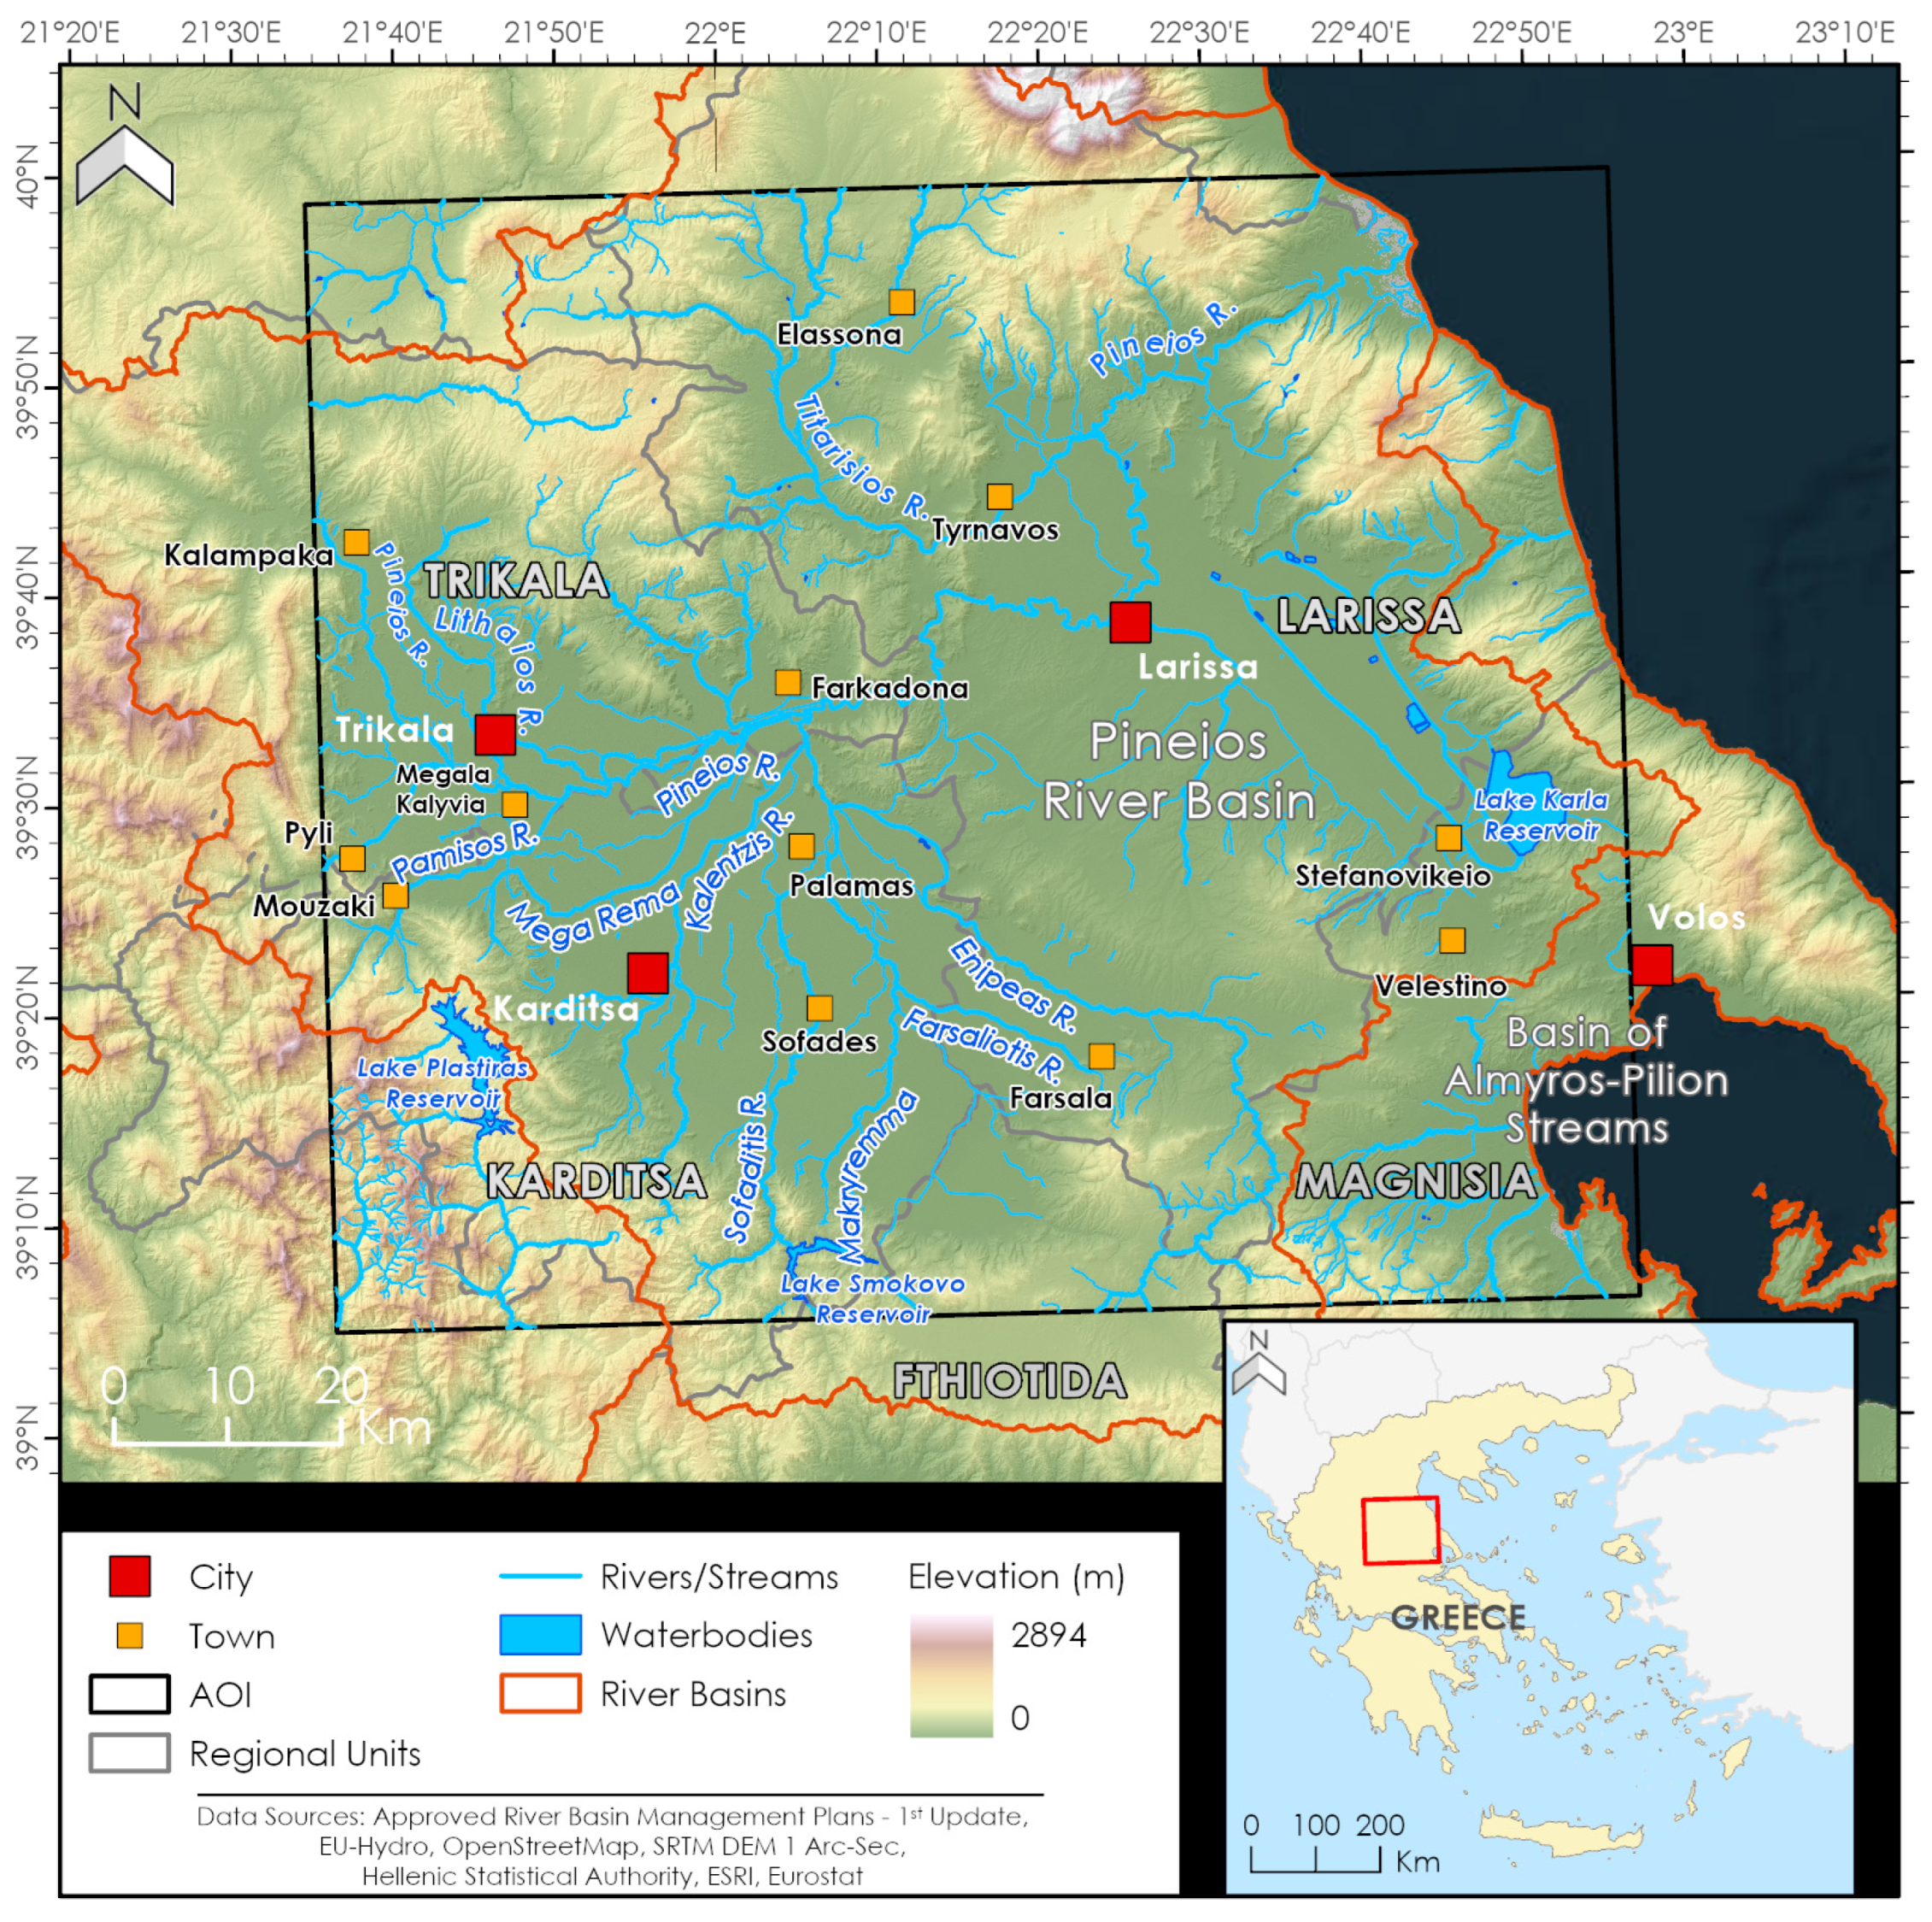
| No. | Regional Unit | Flooded Area (km2) | Flooded Area Distribution (%) | Flooded Area to Regional Unit Area (%) |
|---|---|---|---|---|
| 1 | Regional Unit of Karditsa | 398.37 | 41.96% | 15.11% |
| 2 | Regional Unit of Larissa | 355.21 | 37.41% | 6.59% |
| 3 | Regional Unit of Trikala | 153.24 | 16.14% | 4.53% |
| 4 | Regional Unit of Magnissia | 27.62 | 2.91% | 1.17% |
| 5 | Regional Unit of Fthiotida | 15.08 | 1.59% | 0.34% |
| TOTAL | 949.52 | 100.00% | - |
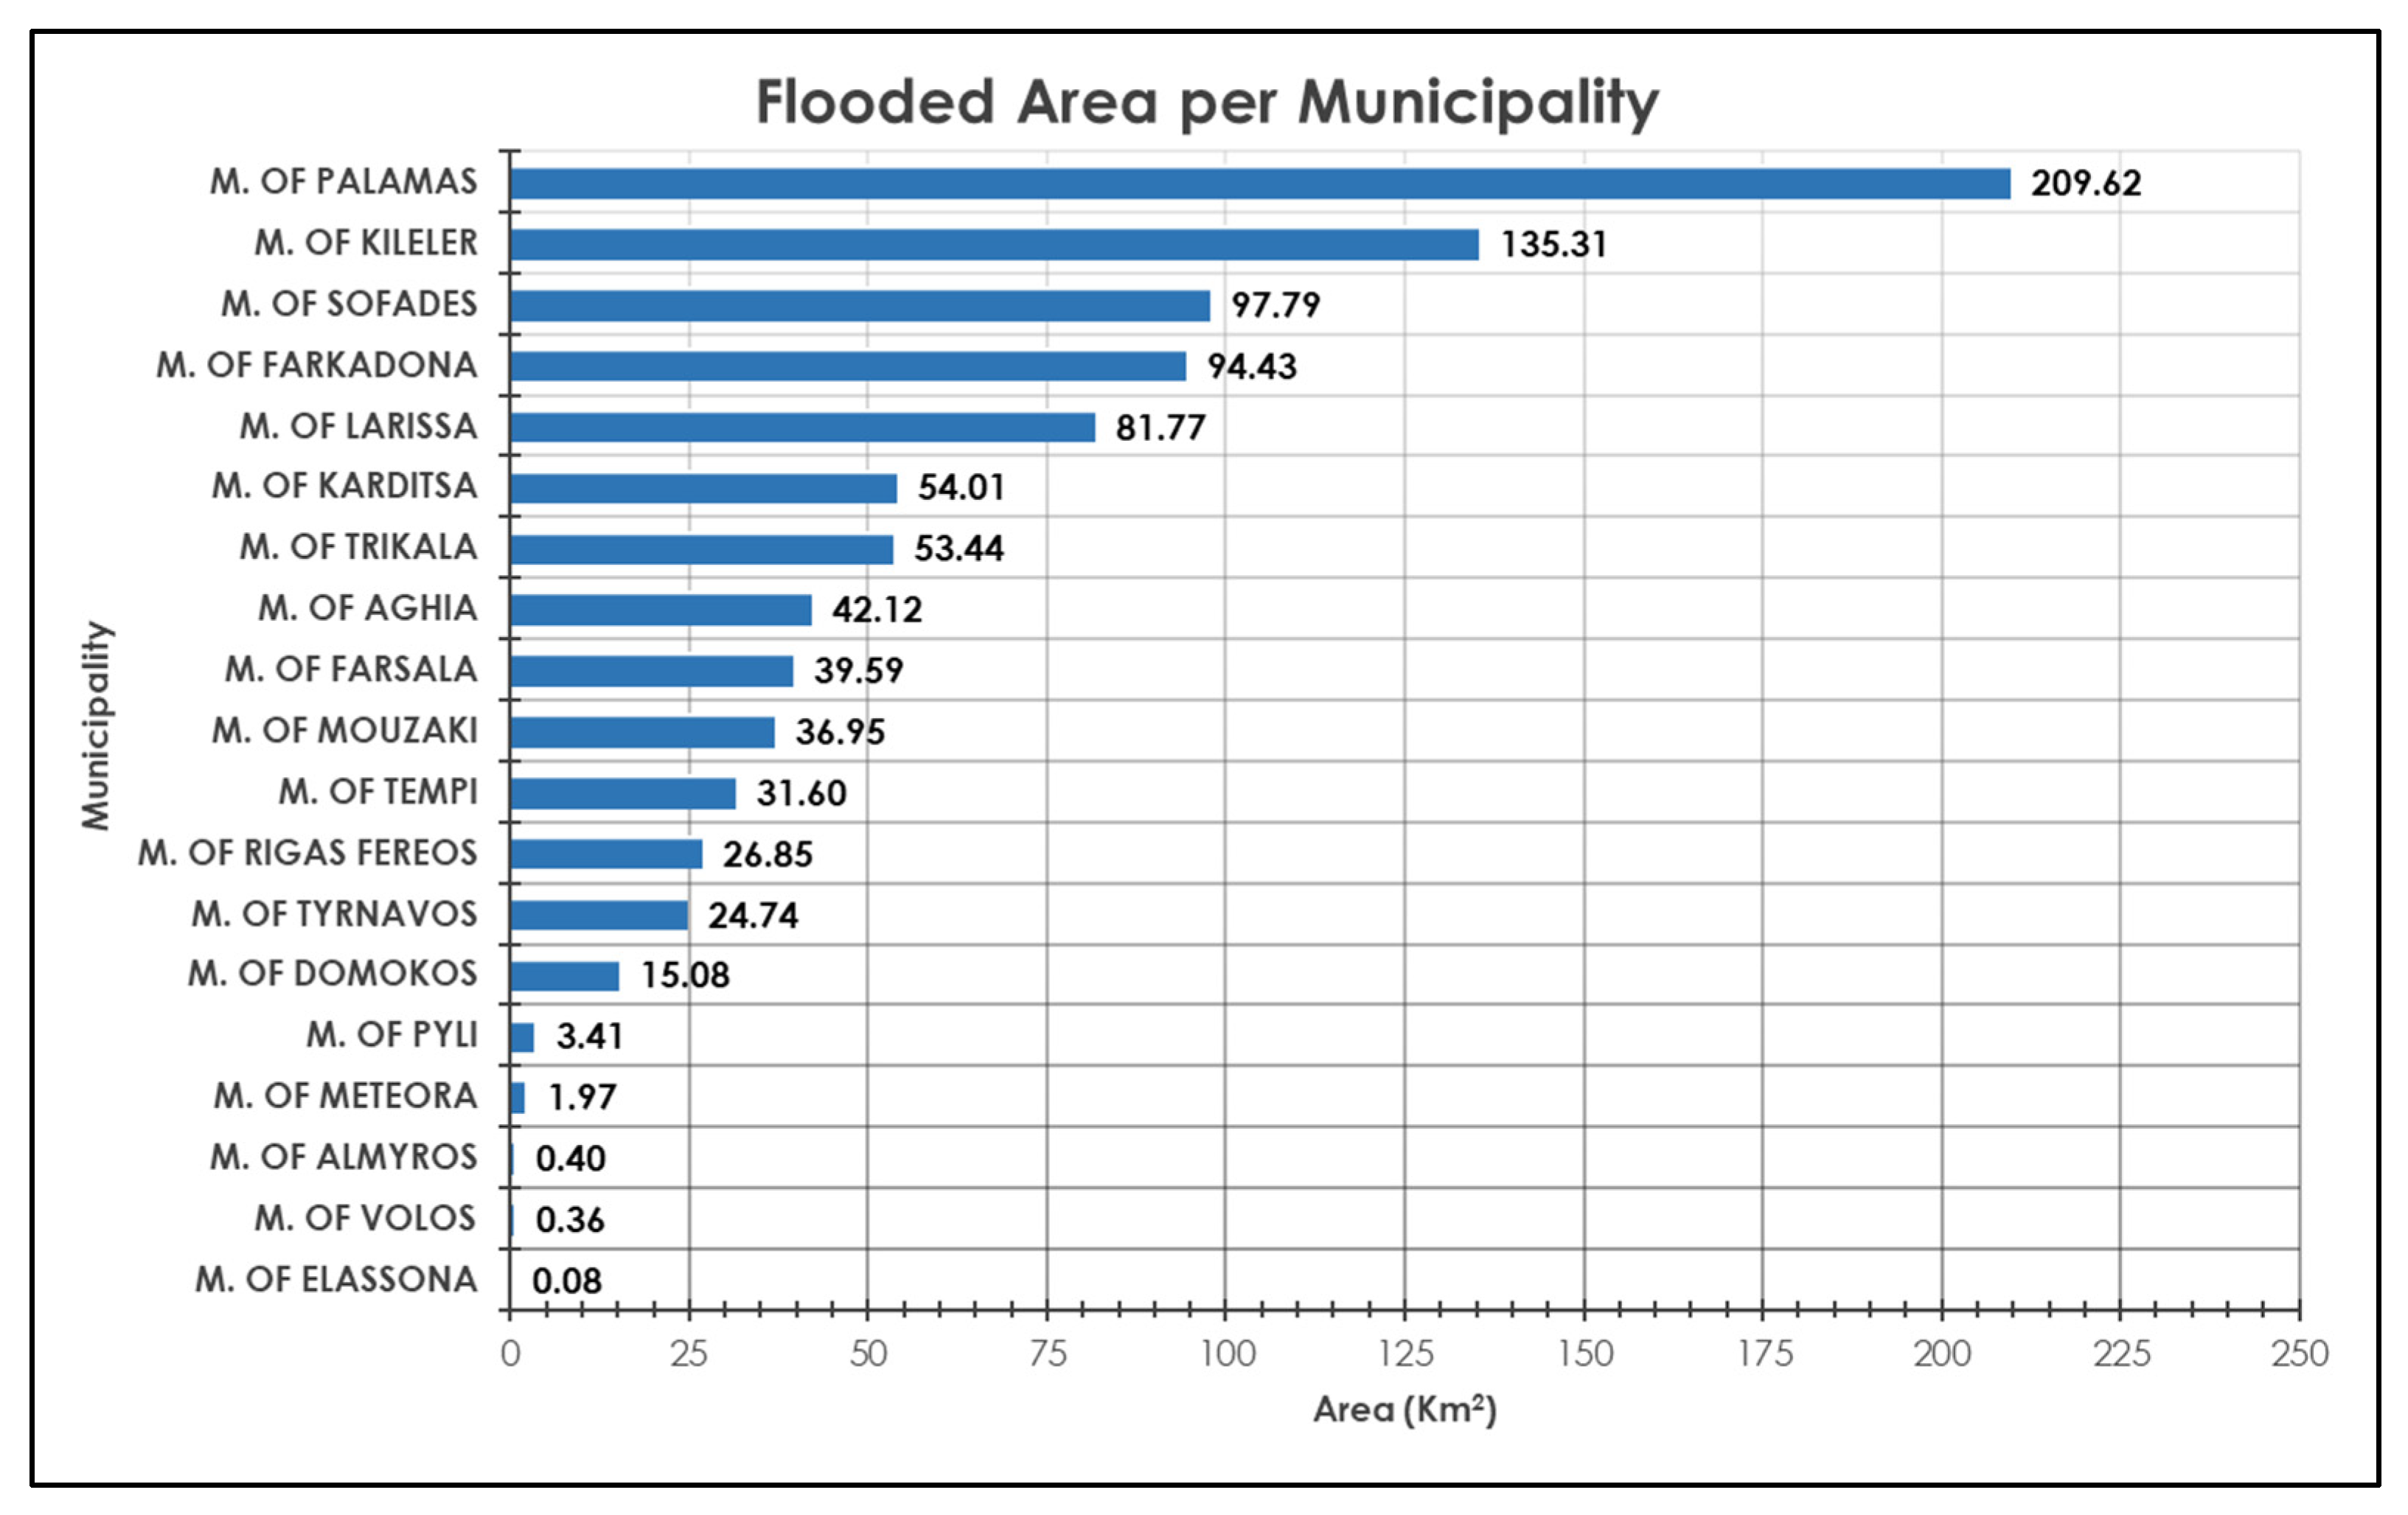
| No. | Municipality | Flooded Area (km2) | Flooded Area Distribution (%) | Flooded Area to Municipality Area (%) |
|---|---|---|---|---|
| 1 | M. of Palamas | 209.62 | 22.08% | 54.86% |
| 2 | M. of Kileler | 135.31 | 14.25% | 13.86% |
| 3 | M. of Sofades | 97.79 | 10.30% | 13.58% |
| 4 | M. of Farkadona | 94.43 | 9.94% | 25.62% |
| 5 | M. of Larissa | 81.77 | 8.61% | 24.32% |
| 6 | M. of Karditsa | 54.01 | 5.69% | 8.31% |
| 7 | M. of Trikala | 53.44 | 5.63% | 8.77% |
| 8 | M. of Aghia | 42.12 | 4.44% | 6.34% |
| 9 | M. of Farsala | 39.59 | 4.17% | 5.35% |
| 10 | M. of Mouzaki | 36.95 | 3.89% | 11.80% |
| 11 | M. of Tempi | 31.60 | 3.33% | 5.48% |
| 12 | M. of Rigas Fereos | 26.85 | 2.83% | 4.88% |
| 13 | M. of Tyrnavos | 24.74 | 2.61% | 4.71% |
| 14 | M. of Domokos | 15.08 | 1.59% | 2.13% |
| 15 | M. of Pyli | 3.41 | 0.36% | 0.45% |
| 16 | M. of Meteora | 1.97 | 0.21% | 0.12% |
| 17 | M. of Almyros | 0.40 | 0.04% | 0.04% |
| 18 | M. of Volos | 0.36 | 0.04% | 0.09% |
| 19 | M. of Elassona | 0.08 | 0.01% | 0.00% |
| TOTAL | 949.52 | 100.00% | - |
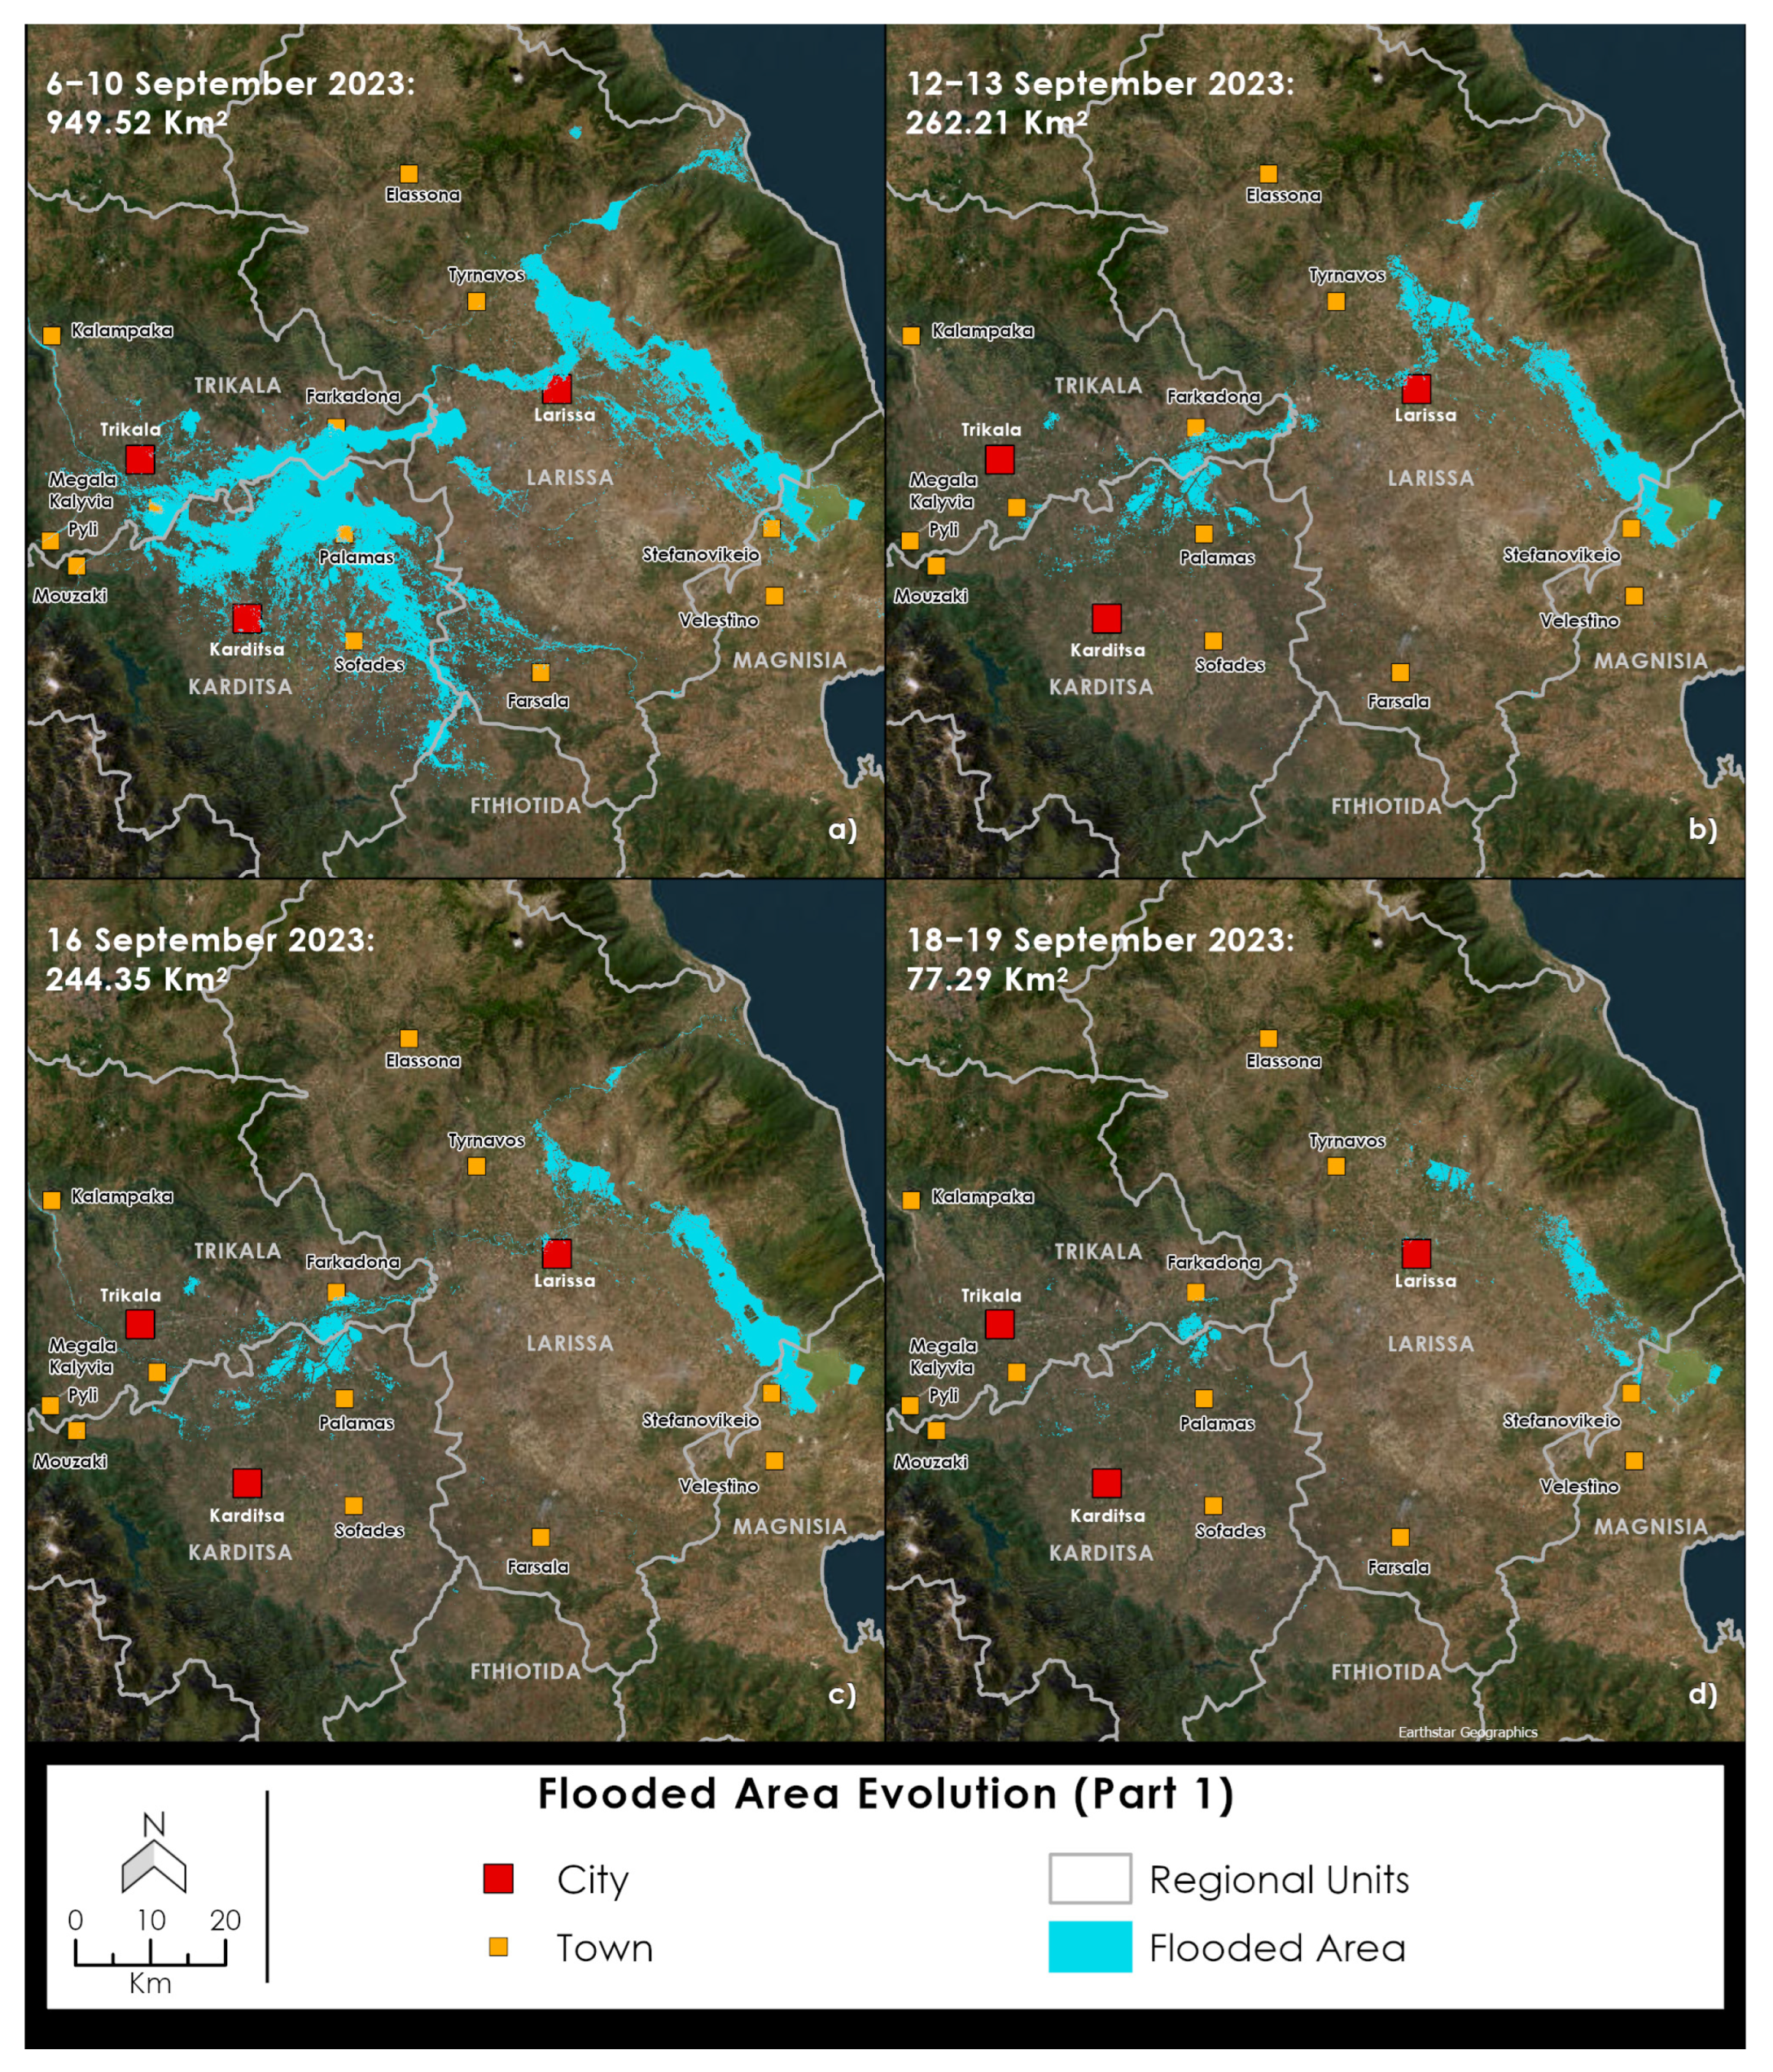
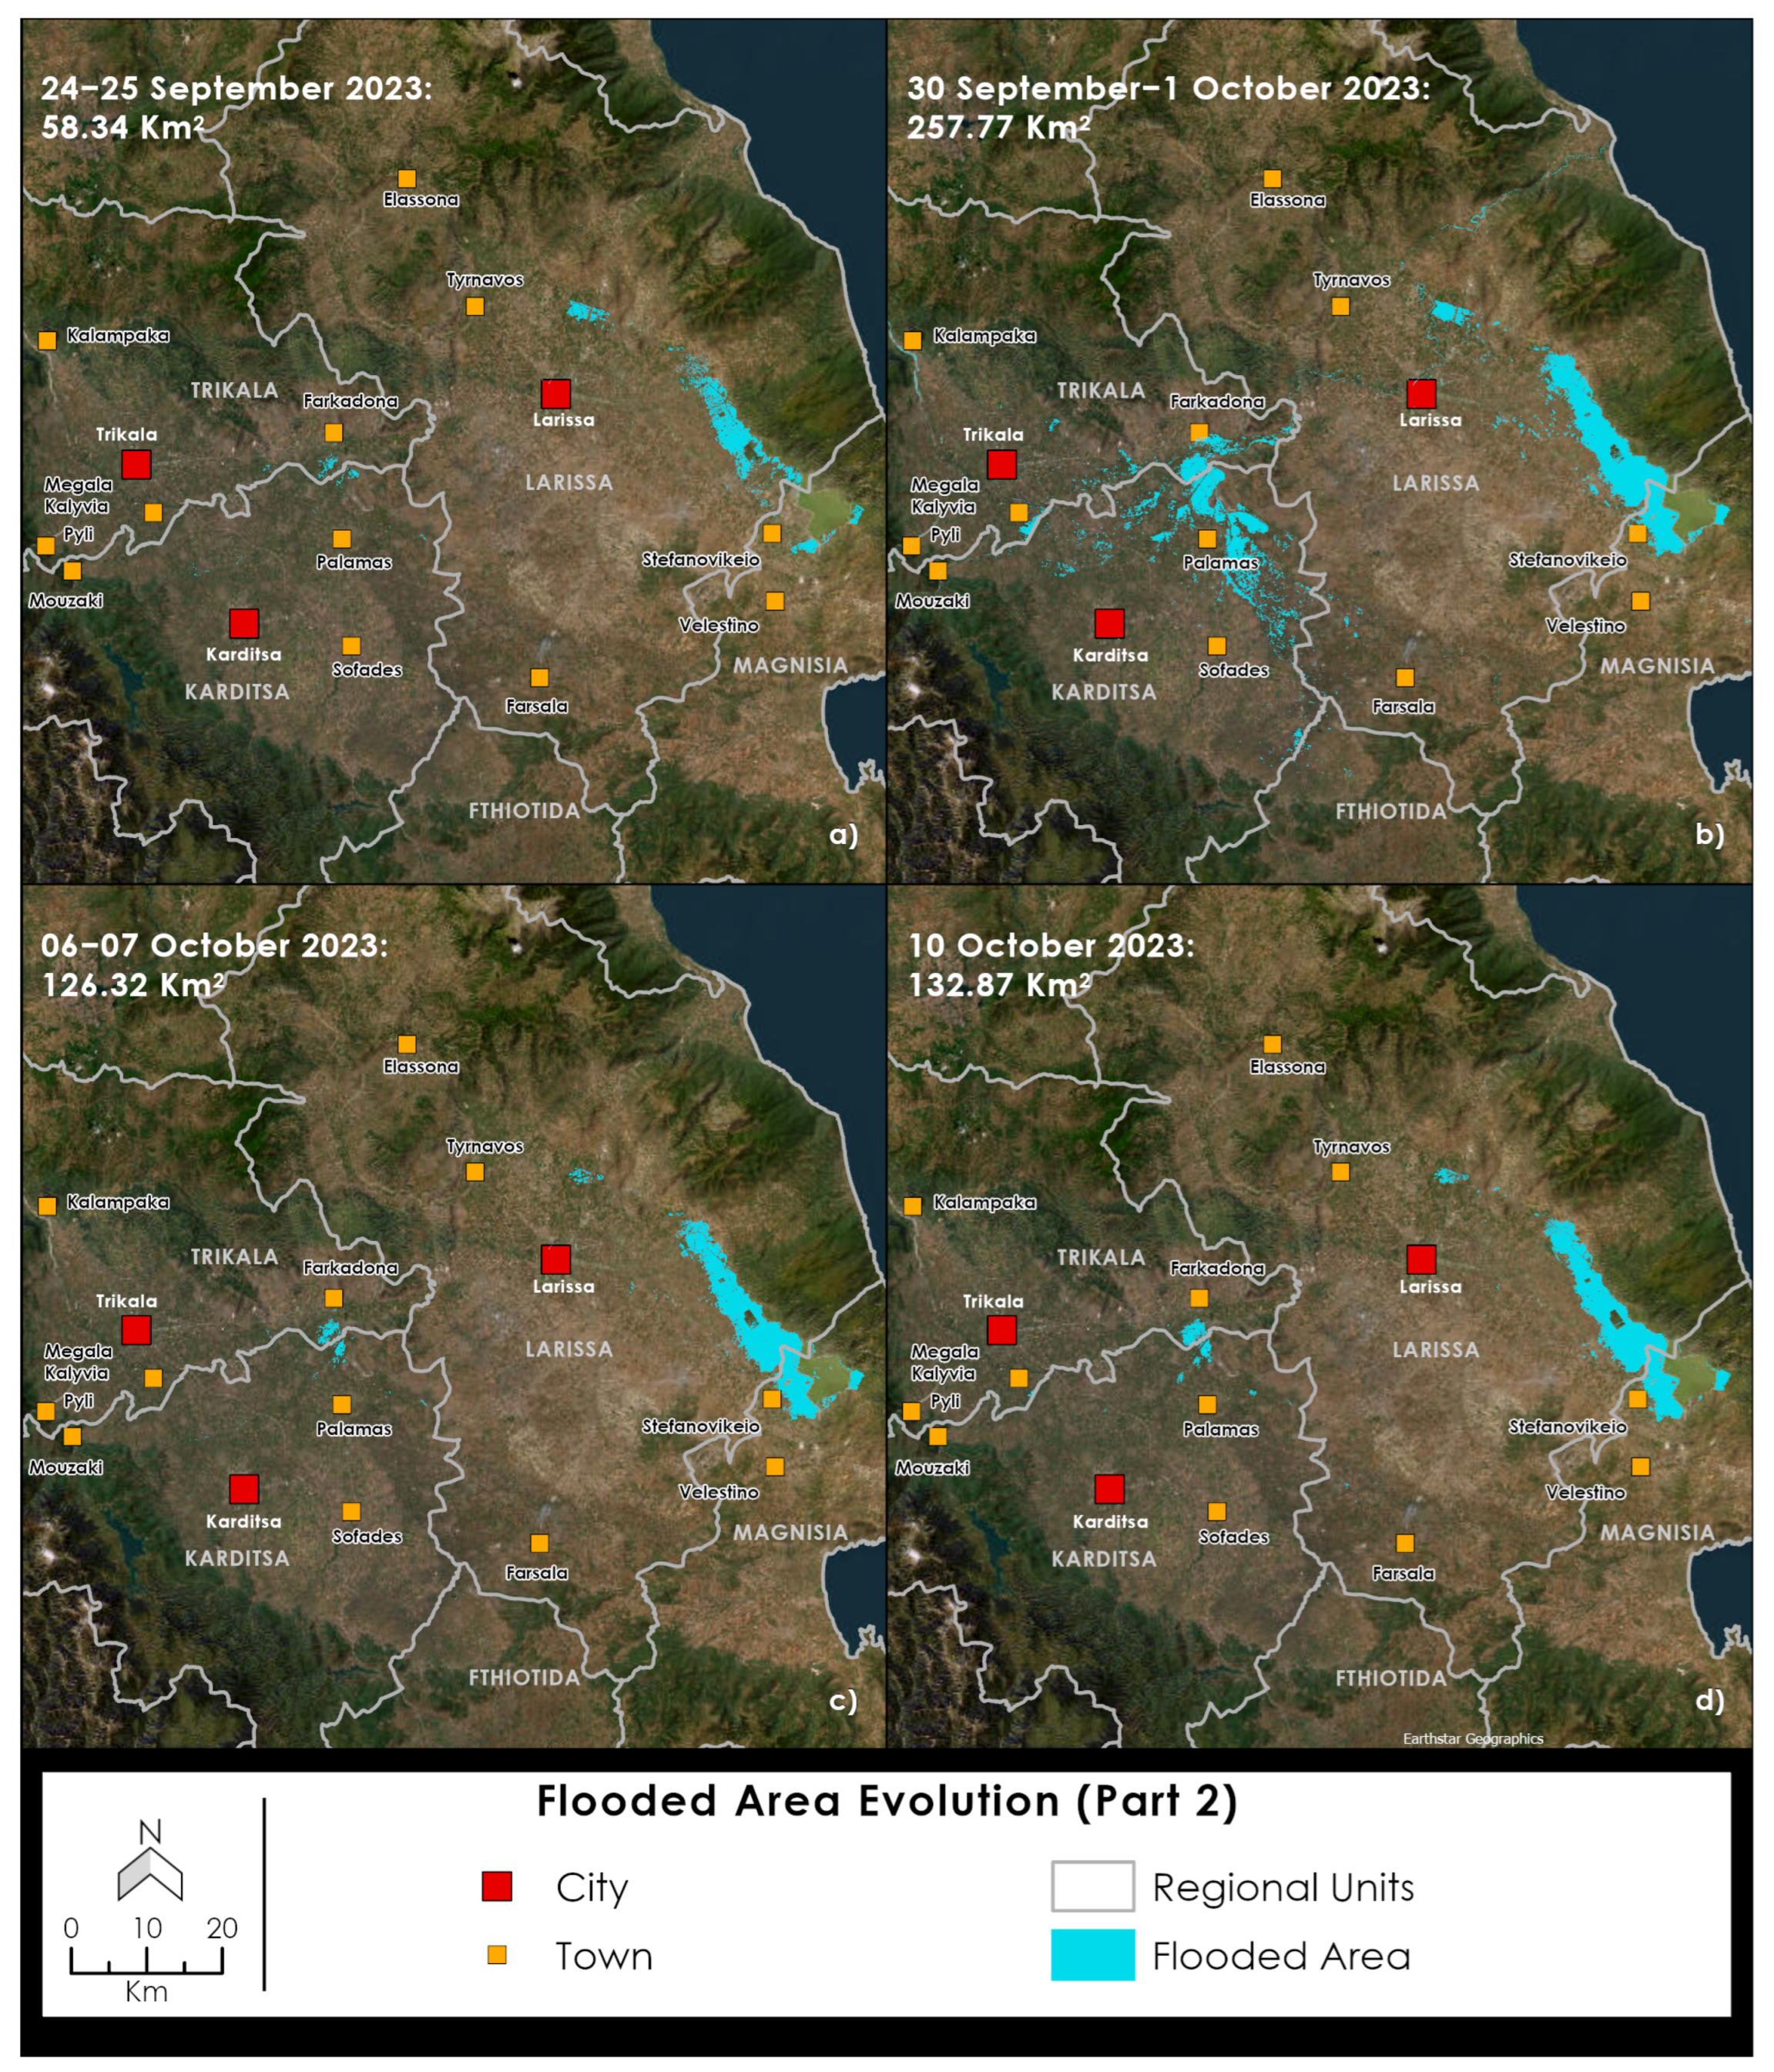
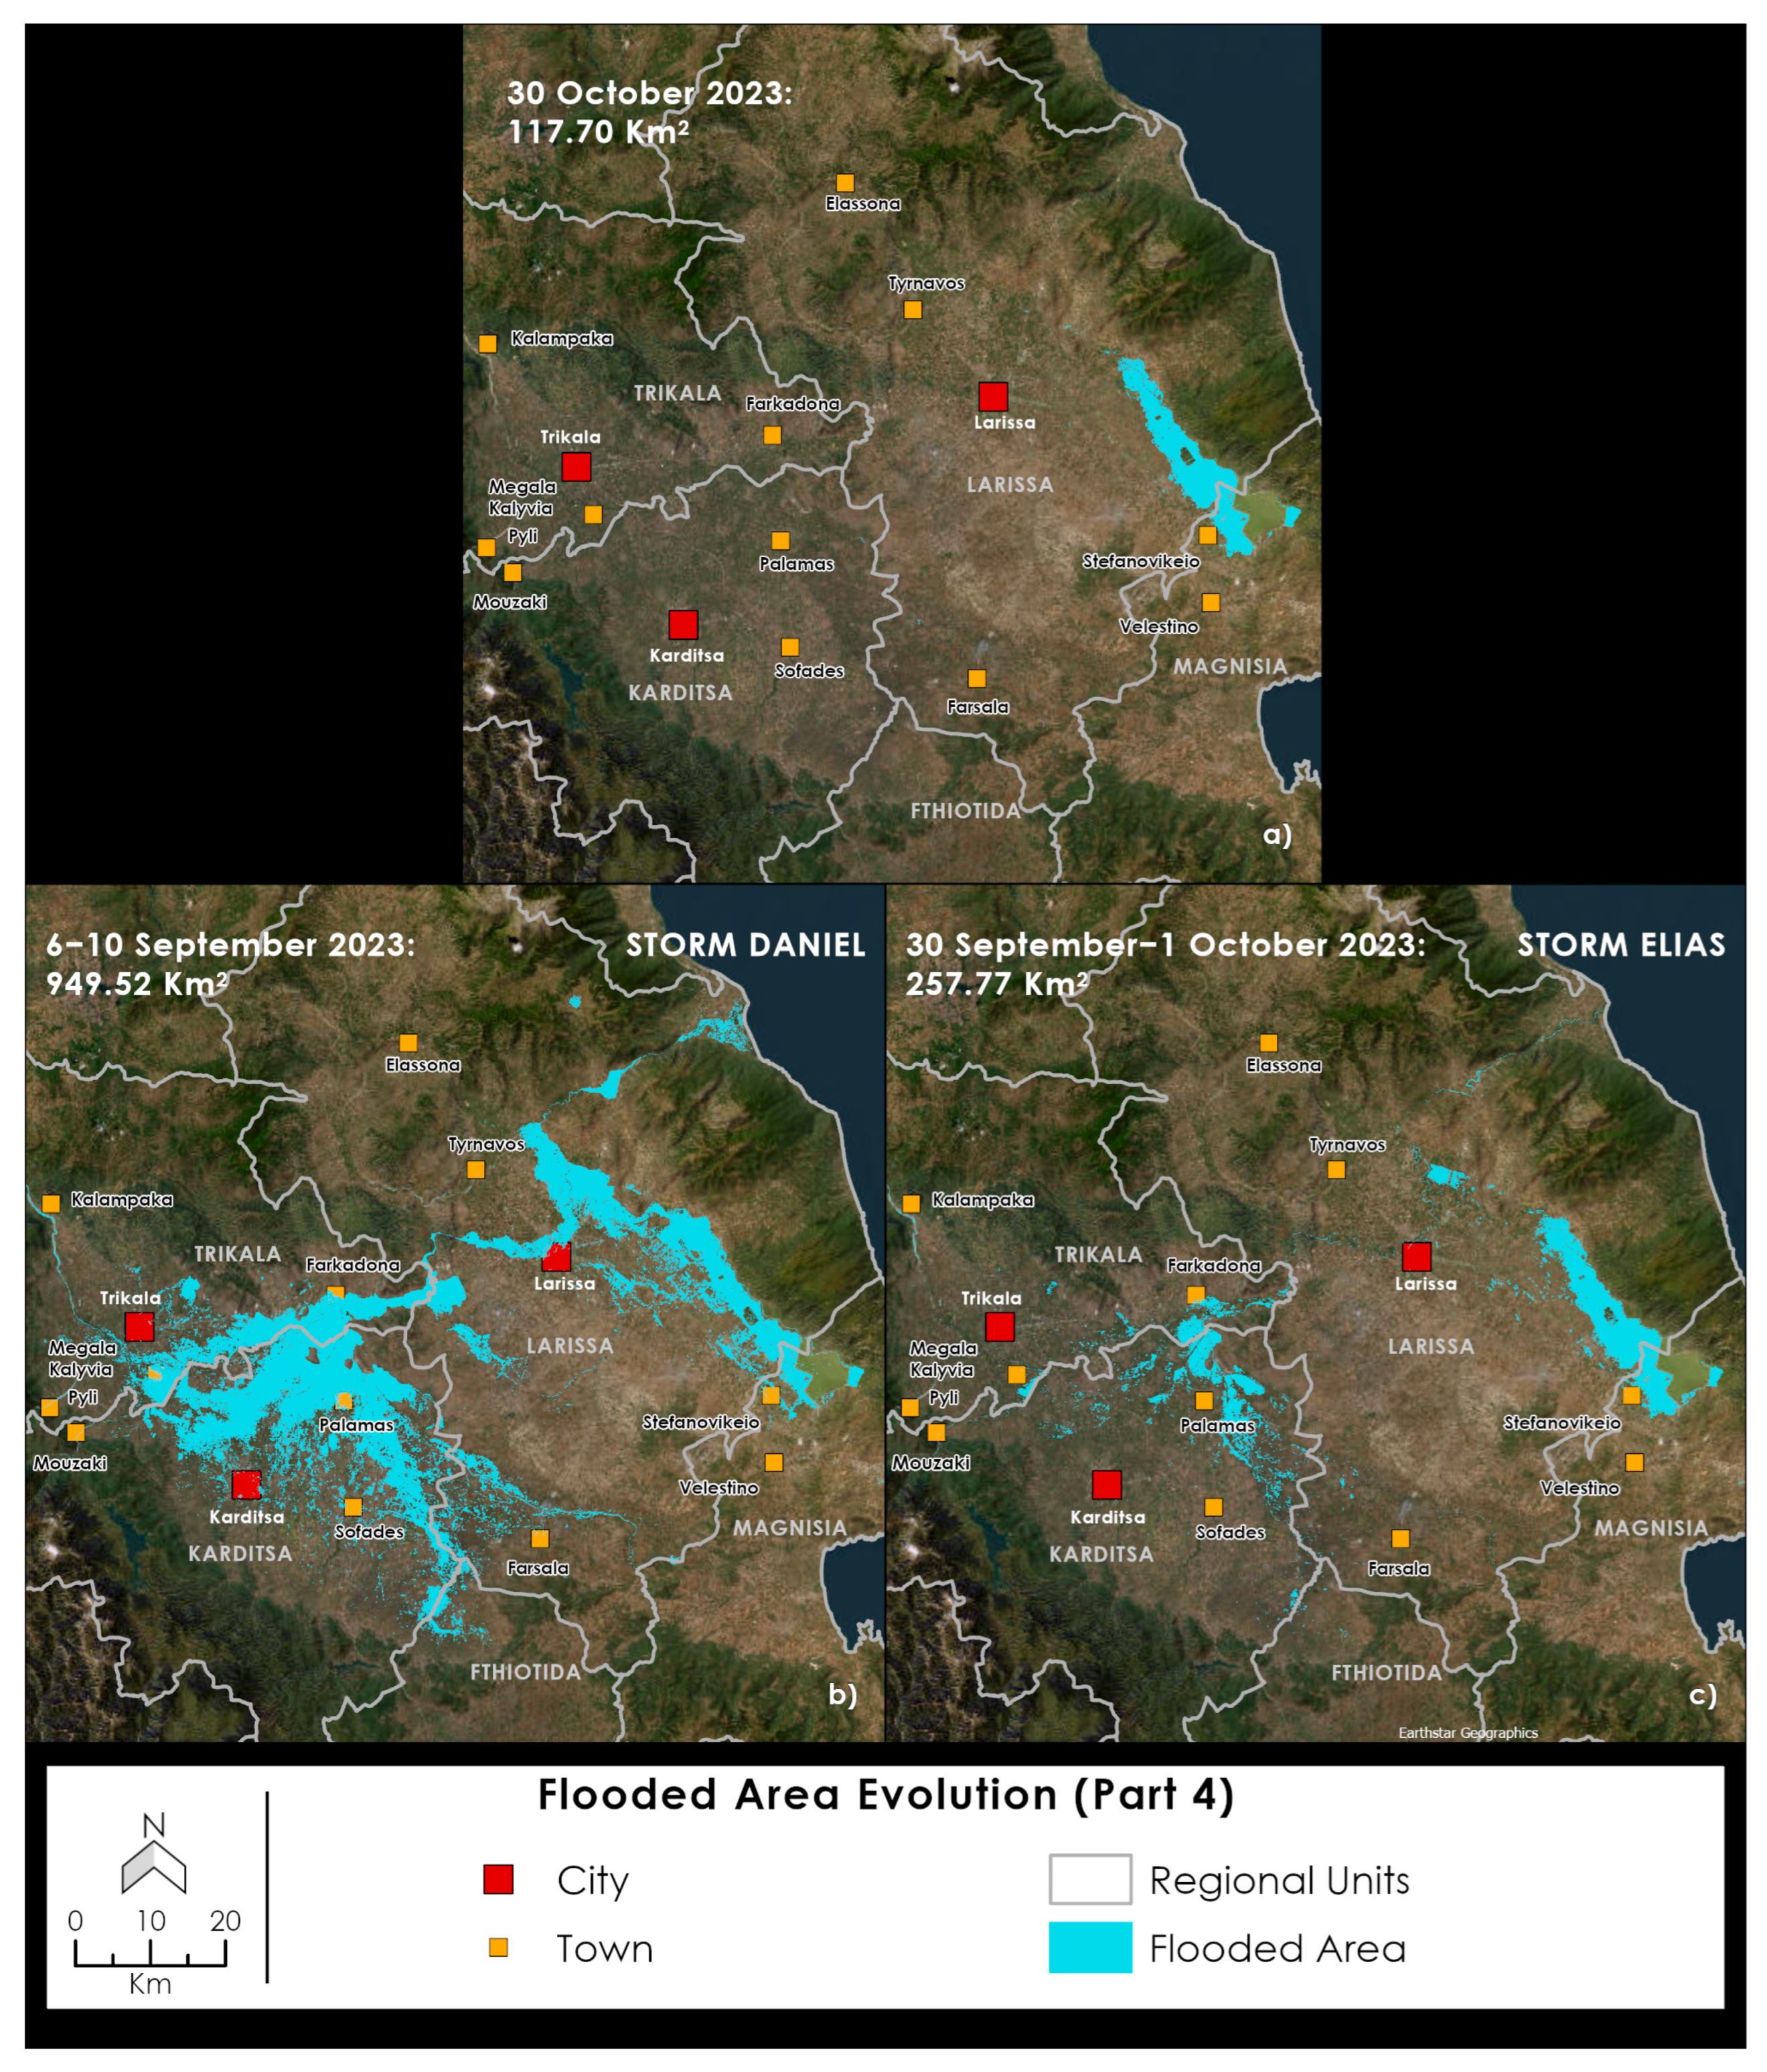
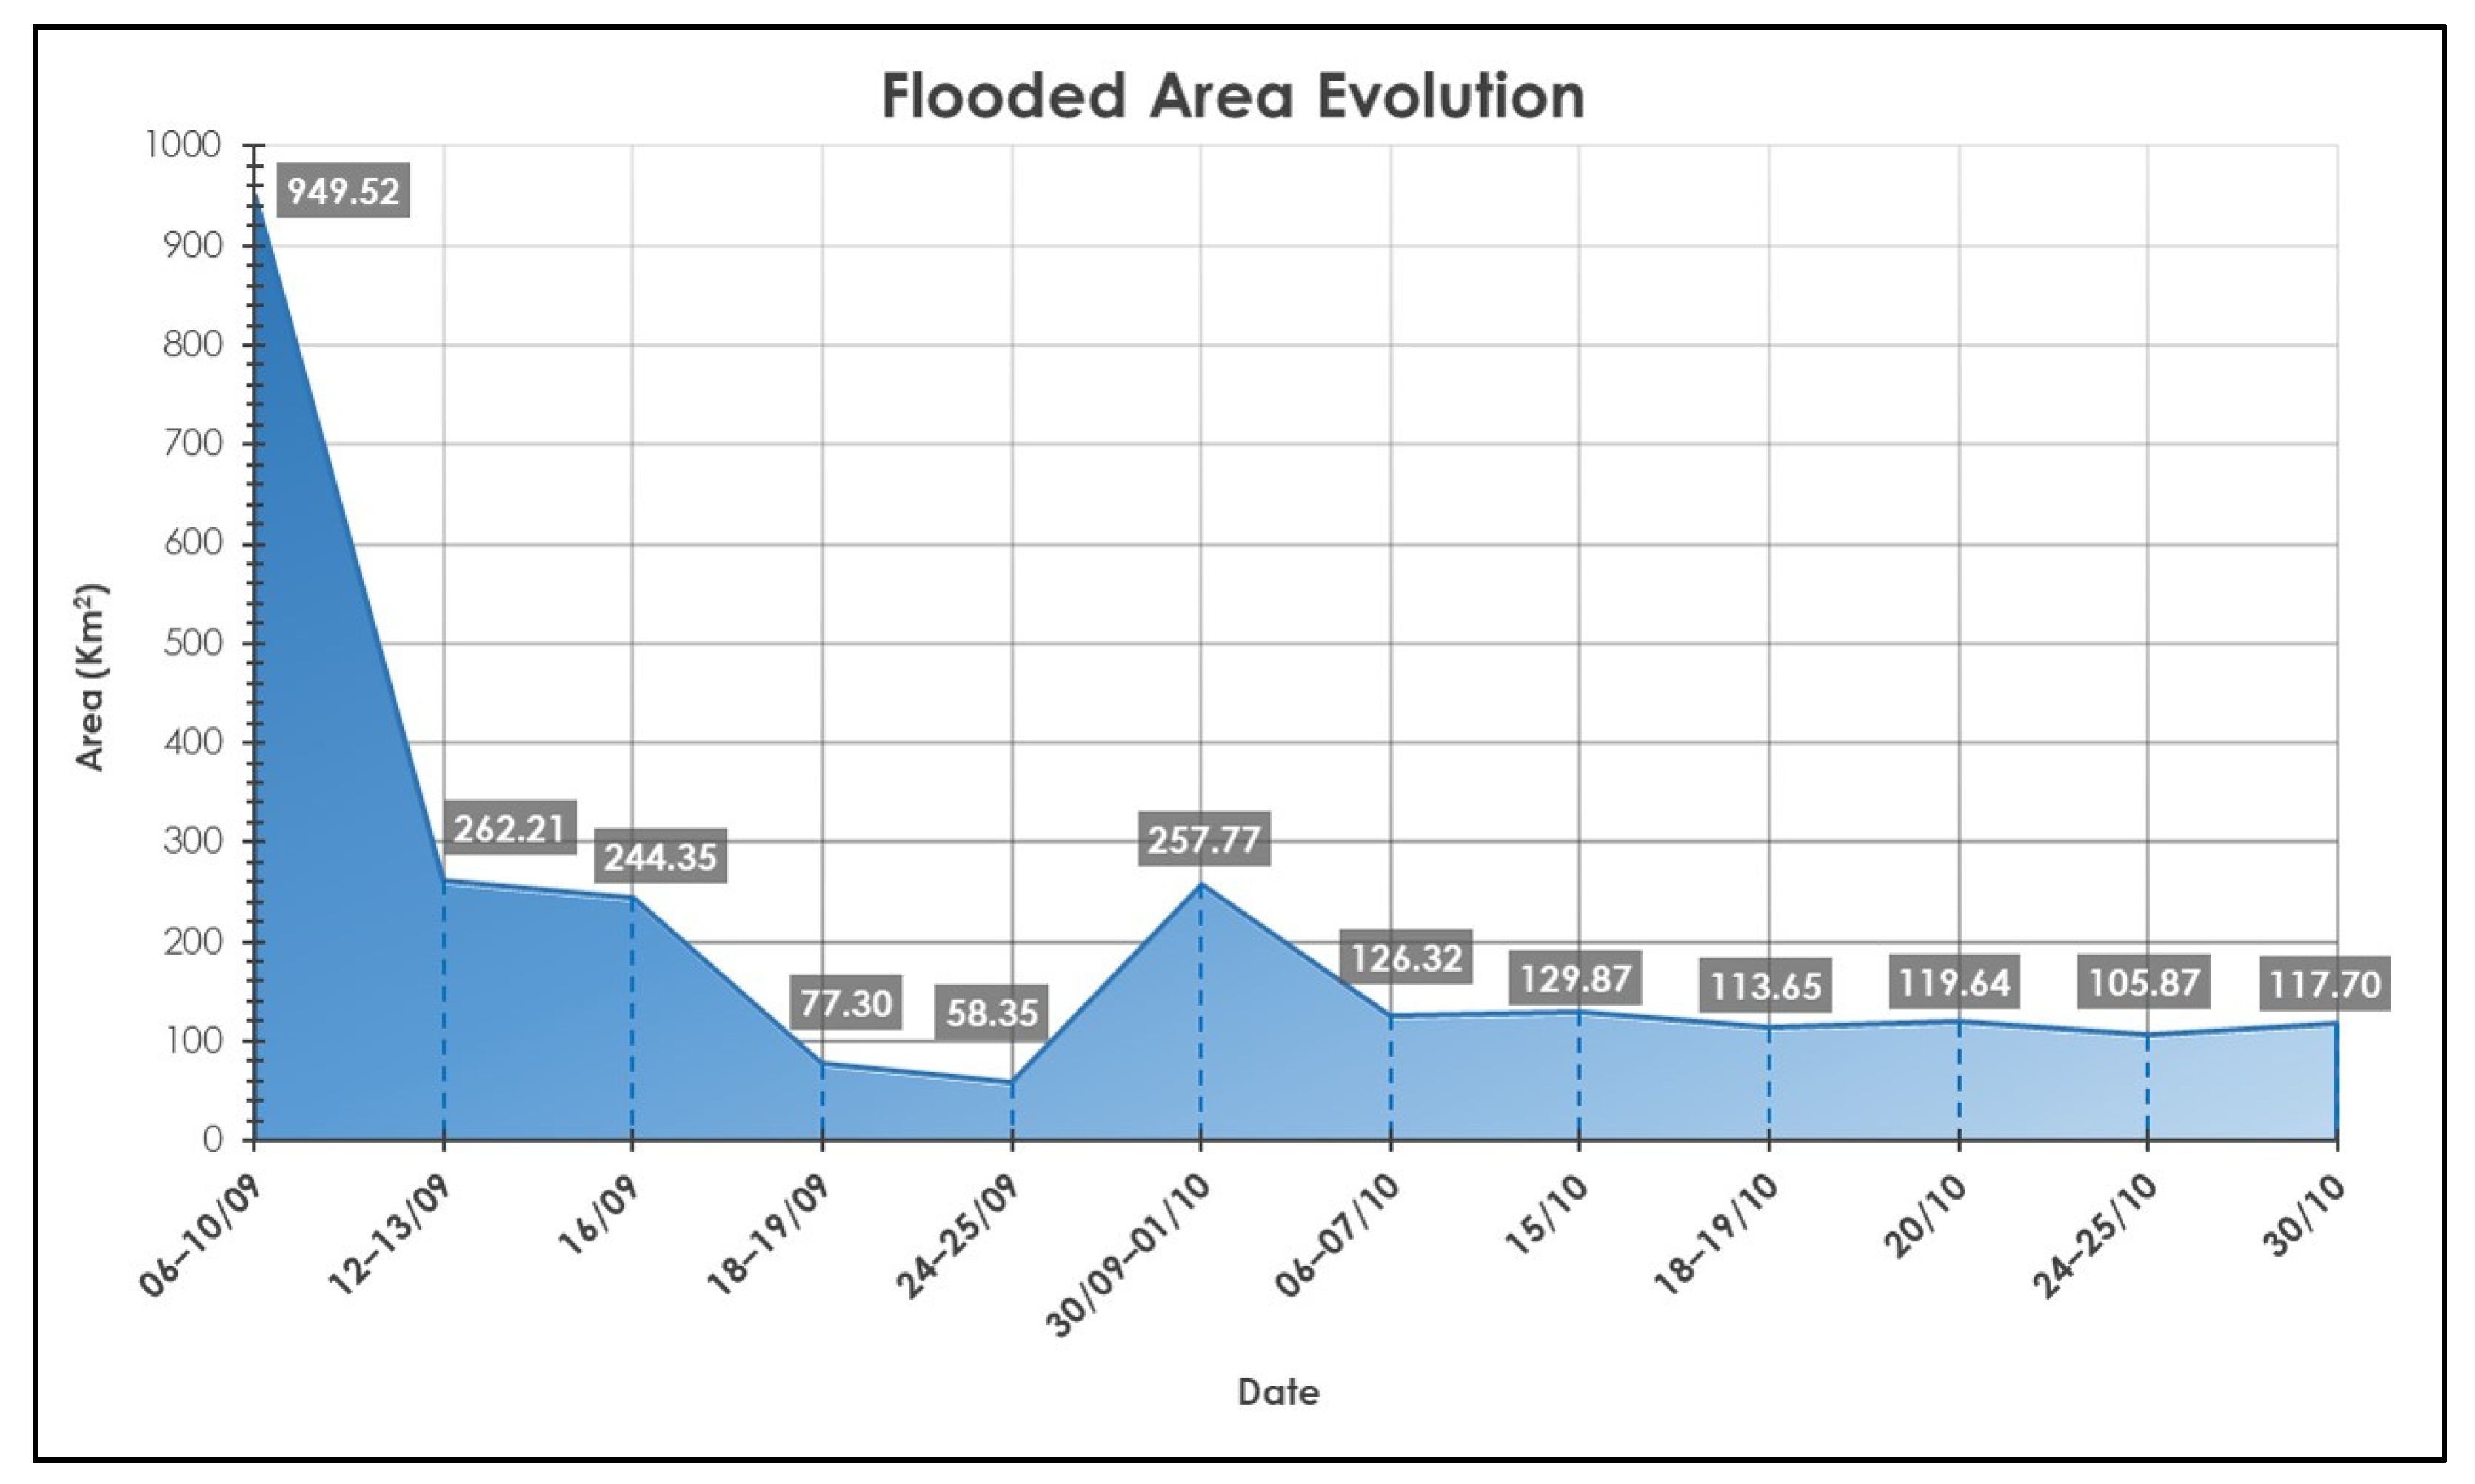
| No. | Satellite Image Acquisition Date | Satellite | Flooded Area (km2) | Change (%) |
|---|---|---|---|---|
| 1 | 6–7–8–10 September 2023 | Sentinel-1, Sentinel-2, and Landsat 8 | 949.52 | - |
| 2 | 12–13 September 2023 | Sentinel-1 | 262.21 | −72.38% |
| 3 | 16 September 2023 | Landsat 9 | 244.35 | −6.81% |
| 4 | 18–19 September 2023 | Sentinel-1 | 77.30 | −68.37% |
| 5 | 24–25 September 2023 | Sentinel-1 | 58.35 | −24.51% |
| 6 | 30 September–1 October 2023 | Sentinel-1 and Sentinel-2 | 257.77 | 341.78% |
| 7 | 6–7 October 2023 | Sentinel-1 | 126.32 | −50.99% |
| 8 | 10 October 2023 | Sentinel-2 | 132.88 | 5.19% |
| 9 | 15 October 2023 | Sentinel-2 | 129.87 | −2.26% |
| 10 | 18–19 October 2023 | Sentinel-1 | 113.65 | −12.49% |
| 11 | 20 October 2023 | Sentinel-2 | 119.64 | 5.27% |
| 12 | 24–25 October 2023 | Sentinel-1 | 105.87 | −11.51% |
| 13 | 30 October 2023 | Sentinel-2 | 117.70 | 11.17% |
| CLC Category | Flooded Area (km2) | Flooded Area (%) |
|---|---|---|
| 111 Continuous urban fabric | 0.003 | 0.00% |
| 112 Discontinuous urban fabric | 13.270 | 1.40% |
| 121 Industrial or commercial units | 4.342 | 0.46% |
| 122 Road and rail networks and associated land | 1.315 | 0.14% |
| 124 Airports | 2.335 | 0.25% |
| 131 Mineral extraction sites | 0.436 | 0.05% |
| 133 Construction sites | 0.905 | 0.10% |
| 141 Green urban areas | 0.613 | 0.06% |
| 142 Sport and leisure facilities | 0.019 | 0.00% |
| 211 Non-irrigated arable land | 50.366 | 5.30% |
| 212 Permanently irrigated land | 794.152 | 83.64% |
| 221 Vineyards | 0.275 | 0.03% |
| 222 Fruit trees and berry plantations | 0.682 | 0.07% |
| 223 Olive groves | 0.117 | 0.01% |
| 231 Pastures | 29.048 | 3.06% |
| 242 Complex cultivation patterns | 11.227 | 1.18% |
| 243 Land principally occupied by agriculture, with significant areas of natural vegetation | 1.366 | 0.14% |
| 311 Broad-leaved forest | 1.050 | 0.11% |
| 312 Coniferous forest | 0.000 | 0.00% |
| 313 Mixed forest | 0.001 | 0.00% |
| 321 Natural grasslands | 1.707 | 0.18% |
| 323 Sclerophyllous vegetation | 0.633 | 0.07% |
| 324 Transitional woodland-shrub | 0.721 | 0.08% |
| 331 Beaches, dunes, sands | 2.512 | 0.26% |
| 333 Sparsely vegetated areas | 0.043 | 0.00% |
| 411 Inland marshes | 5.216 | 0.55% |
| 421 Salt marshes | 1.060 | 0.11% |
| 511 Watercourses | 22.194 | 2.34% |
| 512 Water bodies | 3.887 | 0.41% |
| 523 Sea and ocean | 0.012 | 0.00% |
| TOTAL | 949.52 | 100.00% |
| No. | Municipality | Affected Building Footprint Area (m2) | Number of Affected Building Footprints |
|---|---|---|---|
| 1 | M. of Palamas | 761,124.74 | 5541 |
| 2 | M. of Larissa | 621,797.46 | 2333 |
| 3 | M. of Kileler | 497,034.62 | 915 |
| 4 | M. of Farkadona | 375,235.72 | 2349 |
| 5 | M. of Trikala | 374,791.13 | 2085 |
| 6 | M. of Mouzaki | 228,248.44 | 1448 |
| 7 | M. of Karditsa | 95,687.62 | 565 |
| 8 | M. of Pyli | 92,671.39 | 57 |
| 9 | M. of Tyrnavos | 88,671.44 | 323 |
| 10 | M. of Sofades | 88,540.48 | 265 |
| 11 | M. of Volos | 78,301.26 | 78 |
| 12 | M. of Rigas Fereos | 70,617.37 | 173 |
| 13 | M. of Tempi | 51,108.65 | 236 |
| 14 | M. of Farsala | 46,639.60 | 161 |
| 15 | M. of Aghia | 20,965.91 | 137 |
| 16 | M. of Elassona | 4755.74 | 2 |
| 17 | M. of Domokos | 2512.53 | 33 |
| 18 | M. of Meteora | 600.29 | 6 |
| 19 | M. of Almyros | - | - |
| TOTAL | 3,499,304.40 | 16,707 |
| Linear Infrastructure | Affected Length (km) | Distribution (%) |
|---|---|---|
| Motorway | 30.155 | 6.71% |
| Primary | 49.566 | 11.04% |
| Secondary | 92.313 | 20.55% |
| Tertiary | 260.125 | 57.91% |
| Railway | 17.002 | 3.79% |
| Total | 449.161 | 100.00% |
| No. | Municipality | Motorway (Km) | Primary (Km) | Secondary (Km) | Tertiary (Km) | Railway (Km) | TOTAL (Km) |
|---|---|---|---|---|---|---|---|
| 1 | M. of Palamas | 10.73 | 0.65 | 45.92 | 64.86 | 0.70 | 122.86 |
| 2 | M. of Larissa | 7.03 | 10.80 | 1.46 | 36.79 | 5.90 | 61.98 |
| 3 | M. of Farkadona | - | 19.41 | 6.13 | 35.64 | - | 61.18 |
| 4 | M. of Kileler | 6.82 | 3.67 | 9.74 | 26.98 | 1.39 | 48.59 |
| 5 | M. of Trikala | 2.03 | 1.60 | 6.24 | 19.95 | 0.75 | 30.58 |
| 6 | M. of Sofades | 0.15 | 0.56 | 4.60 | 20.56 | 2.28 | 28.15 |
| 7 | M. of Tempi | 2.04 | 1.66 | 3.79 | 9.40 | 3.45 | 20.34 |
| 8 | M. of Mouzaki | 0.20 | 7.48 | 2.60 | 9.63 | 0.38 | 20.29 |
| 9 | M. of Karditsa | 1.05 | 2.50 | 0.91 | 11.70 | 0.44 | 16.61 |
| 10 | M. of Farsala | - | 0.18 | 1.83 | 11.34 | 1.09 | 14.45 |
| 11 | M. of Aghia | 0.08 | - | 1.76 | 7.73 | - | 9.58 |
| 12 | M. of Tyrnavos | - | 0.01 | 6.24 | 0.03 | - | 6.28 |
| 13 | M. of Domokos | - | 0.14 | - | 3.91 | 0.62 | 4.67 |
| 14 | M. of Rigas Fereos | 0.02 | 0.16 | 0.97 | 0.15 | - | 1.30 |
| 15 | M. of Volos | - | 0.72 | 0.13 | 0.31 | - | 1.15 |
| 16 | M. of Pyli | - | - | - | 0.97 | - | 0.97 |
| 17 | M. of Meteora | - | 0.03 | - | 0.15 | - | 0.18 |
| TOTAL | 30.16 | 49.57 | 92.31 | 260.12 | 17.00 | 449.16 |
| No. | Municipality | Number of Affected Bridges | Affected Bridges Distribution (%) |
|---|---|---|---|
| 1 | M. of Palamas | 23 | 16.20% |
| 2 | M. of Farkadona | 20 | 14.08% |
| 3 | M. of Larissa | 17 | 11.97% |
| 4 | M. of Tempi | 14 | 9.86% |
| 5 | M. of Trikala | 14 | 9.86% |
| 6 | M. of Kileler | 12 | 8.45% |
| 7 | M. of Sofades | 10 | 7.04% |
| 8 | M. of Mouzaki | 6 | 4.23% |
| 9 | M. of Karditsa | 5 | 3.52% |
| 10 | M. of Tyrnavos | 5 | 3.52% |
| 11 | M. of Farsala | 4 | 2.82% |
| 12 | M. of Aghia | 3 | 2.11% |
| 13 | M. of Domokos | 3 | 2.11% |
| 14 | M. of Meteora | 2 | 1.41% |
| 15 | M. of Pyli | 2 | 1.41% |
| 16 | M. of Volos | 2 | 1.41% |
| TOTAL | 142 | 100.00% |
| No. | Municipality | Affected Population | Affected Population Distribution (%) |
|---|---|---|---|
| 1 | M. of Larissa | 11,526 | 27.108% |
| 2 | M. of Palamas | 8475 | 19.931% |
| 3 | M. of Trikala | 5308 | 12.483% |
| 4 | M. of Farkadona | 3739 | 8.793% |
| 5 | M. of Karditsa | 2439 | 5.736% |
| 6 | M. of Kileler | 2310 | 5.432% |
| 7 | M. of Mouzaki | 2122 | 4.990% |
| 8 | M. of Volos | 1490 | 3.505% |
| 9 | M. of Sofades | 1266 | 2.977% |
| 10 | M. of Farsala | 822 | 1.934% |
| 11 | M. of Rigas Fereos | 813 | 1.912% |
| 12 | M. of Tyrnavos | 581 | 1.366% |
| 13 | M. of Aghia | 481 | 1.131% |
| 14 | M. of Tempi | 455 | 1.069% |
| 15 | M. of Pyli | 437 | 1.028% |
| 16 | M. of Domokos | 199 | 0.469% |
| 17 | M. of Meteora | 32 | 0.074% |
| 18 | M. of Elassona | 26 | 0.062% |
| 19 | M. of Almyros | 1 | 0.002% |
| 20 | TOTAL | 42,520 | 100.000% |
Disclaimer/Publisher’s Note: The statements, opinions and data contained in all publications are solely those of the individual author(s) and contributor(s) and not of MDPI and/or the editor(s). MDPI and/or the editor(s) disclaim responsibility for any injury to people or property resulting from any ideas, methods, instructions or products referred to in the content. |
© 2025 by the authors. Licensee MDPI, Basel, Switzerland. This article is an open access article distributed under the terms and conditions of the Creative Commons Attribution (CC BY) license (https://creativecommons.org/licenses/by/4.0/).
Share and Cite
Falaras, T.; Dosiou, A.; Tounta, S.; Diakakis, M.; Lekkas, E.; Parcharidis, I. Mapping of Flood Impacts Caused by the September 2023 Storm Daniel in Thessaly’s Plain (Greece) with the Use of Remote Sensing Satellite Data. Remote Sens. 2025, 17, 1750. https://doi.org/10.3390/rs17101750
Falaras T, Dosiou A, Tounta S, Diakakis M, Lekkas E, Parcharidis I. Mapping of Flood Impacts Caused by the September 2023 Storm Daniel in Thessaly’s Plain (Greece) with the Use of Remote Sensing Satellite Data. Remote Sensing. 2025; 17(10):1750. https://doi.org/10.3390/rs17101750
Chicago/Turabian StyleFalaras, Triantafyllos, Anna Dosiou, Stamatina Tounta, Michalis Diakakis, Efthymios Lekkas, and Issaak Parcharidis. 2025. "Mapping of Flood Impacts Caused by the September 2023 Storm Daniel in Thessaly’s Plain (Greece) with the Use of Remote Sensing Satellite Data" Remote Sensing 17, no. 10: 1750. https://doi.org/10.3390/rs17101750
APA StyleFalaras, T., Dosiou, A., Tounta, S., Diakakis, M., Lekkas, E., & Parcharidis, I. (2025). Mapping of Flood Impacts Caused by the September 2023 Storm Daniel in Thessaly’s Plain (Greece) with the Use of Remote Sensing Satellite Data. Remote Sensing, 17(10), 1750. https://doi.org/10.3390/rs17101750