Article

Spatiotemporal Analysis and Anomalous Trends of Asia AOD (2001–2024): Insights from a Deep Learning Fusion Model and EOF Decomposition

1
Key Laboratory of Smart Earth, Beijing 100097, China
2
Hubei Key Laboratory of Quantitative Remote Sensing of Land and Atmosphere, School of Remote Sensing and Information Engineering, Wuhan University, Wuhan 430079, China
3
Perception and Effectiveness Assessment for Carbon-Neutrality Efforts, Engineering Research Center of Ministry of Education, Institute for Carbon Neutrality, Wuhan University, Wuhan 430072, China
4
Electronic Information School, Wuhan University, Wuhan 430079, China
5
State Key Laboratory of Information Engineering in Surveying, Mapping and Remote Sensing, Wuhan University, Wuhan 430079, China
*
Author to whom correspondence should be addressed.
Remote Sens. 2025, 17(10), 1741; https://doi.org/10.3390/rs17101741
Submission received: 27 March 2025 / Revised: 27 April 2025 / Accepted: 8 May 2025 / Published: 16 May 2025

Abstract

:
Long-term investigations of Aerosol Optical Depth (AOD) across Asia are crucial for understanding its regional impacts on the global climate system. However, satellite-derived AOD datasets frequently suffer from missing values due to factors such as cloud cover, algorithmic limitations, and various atmospheric conditions. To overcome these challenges, this study employs the deep learning model TabNet, incorporating Digital Elevation Model (DEM) data and ERA5 meteorological variables, to fuse MERRA-2 AOD with MODIS MAIAC AOD observations. The resulting integration yields a high-resolution, seamless daily AOD dataset for Asia spanning the period from 2001 to 2024. The fused dataset demonstrates significant improvements over the original MERRA-2 AOD, with an increase in the coefficient of determination (R2) by 0.1065 and a reduction in root mean square error (RMSE) by 0.0369. Spatio-temporal analysis, conducted using Empirical Orthogonal Function (EOF) decomposition, reveals that AOD concentrations across Asia are strongly influenced by anthropogenic factors, including industrial activities, transportation emissions, and biomass burning. The results indicate a generally increasing trend in AOD from 2001 to 2014, followed by a declining trend from 2015 to 2024. Notably, EOF results show a marked rise in AOD levels in Mongolia after 2020, likely attributable to an uptick in dust storm activity. This research offers valuable insights into the spatiotemporal trends of aerosols across Asia, underscoring the need for sustained air quality measures to mitigate pollution and protect public health.

1. Introduction

Aerosol Optical Depth (AOD) is a key parameter for understanding the influence of atmospheric aerosols, which have significant implications for climate change [1], air quality [2], ecosystems [3], and human health [4]. Defined as the vertical integral of the extinction coefficient, AOD quantifies the attenuation of solar radiation caused by aerosols in the atmosphere [5]. Aerosols originate from both natural sources, such as volcanic eruptions, wildfires, sea spray, and dust storms [6,7], and anthropogenic activities, including fossil fuel combustion and biomass burning [8]. Satellite-based remote sensing has become an essential tool for large-scale AOD monitoring [9,10], offering critical data for long-term atmospheric and environmental studies. Among the available satellite-derived AOD products [11], the MODIS (Moderate Resolution Imaging Spectroradiometer) MAIAC (Multi-Angle Implementation of Atmospheric Correction) dataset is particularly noteworthy due to its high spatial resolution (1 km), daily temporal coverage, and availability since 2000 [12,13]. These attributes make it especially suitable for studying long-term aerosol trends across Asia. However, the MODIS MAIAC AOD product is often affected by data gaps caused by cloud cover, algorithmic limitations, and other atmospheric conditions [14,15]. These missing values present a significant obstacle for research requiring continuous and gap-free AOD datasets for accurate environmental assessments [16].
To address the limitations posed by data gaps in satellite-retrieved AOD, researchers have explored a variety of gap-filling methods [17,18,19,20]. Traditional approaches, such as geostatistical interpolation, have been widely utilized but often fall short in capturing the complex spatiotemporal variability of aerosol concentrations [21]. In recent years, machine learning (ML) and deep learning (DL) algorithms have shown considerable promise in enhancing the accuracy of AOD data reconstruction [22,23,24,25,26]. These advanced techniques can effectively learn intricate patterns from auxiliary datasets, including meteorological, topographic, and socio-economic variables, thereby improving the spatiotemporal completeness of AOD observations.
Since 2000, AOD levels across Asia have initially shown an upward trend, largely driven by rapid urbanization, industrial expansion, and increased vehicular emissions [27,28]. In more recent years, however, AOD concentrations have declined significantly, primarily due to the implementation of stringent environmental policies, particularly in China [29,30,31]. Understanding the distribution and dynamics of AOD over Asia is critical for advancing our knowledge of regional aerosol behavior and for informing mitigation strategies aimed at protecting public health and addressing climate change.
Empirical Orthogonal Function (EOF) analysis is a robust statistical method that decomposes spatiotemporal datasets into orthogonal spatial patterns and associated temporal coefficients, effectively filtering out noise while emphasizing dominant signals [32,33,34]. This technique is especially well suited for analyzing long-term datasets, as it enables the identification of key aerosol sources and processes, including transport and removal, and offers valuable insights into regional and temporal trends in aerosol concentrations across Asia.
In this study, the deep learning model TabNet is employed to generate a daily, seamless AOD dataset at a high spatial resolution of 0.01° × 0.01° for Asia from 2001 to 2024, by integrating MAIAC AOD, MERRA-2 reanalysis AOD, and various ancillary data including meteorological and topographic variables. TabNet is a neural network architecture designed specifically for tabular data, featuring a sequential attention mechanism that enables dynamic feature selection. This makes it particularly effective for capturing complex spatiotemporal relationships in heterogeneous environmental datasets. Its use allows for more accurate reconstruction of missing AOD values compared to traditional methods. The completed dataset is then analyzed using EOF analysis to reveal major spatiotemporal patterns and long-term trends of AOD in Asia. These results offer insights into aerosol variability and its environmental implications. Section 2 describes the datasets and methodology, Section 3 presents the results, and Section 4 and Section 5 cover the discussion and conclusions.

2. Materials and Methods

2.1. Study Region

Asia, the largest continent, is characterized by a diverse range of geographical features and climatic conditions (Figure 1). This complexity contributes to pronounced spatial variability in aerosol sources, composition, and distribution. Mountain ranges, deserts, and coastal regions all play a significant role in shaping aerosol dynamics across the continent. Moreover, Asia is among the most densely populated regions in the world, where anthropogenic activities, such as industrial emissions, transportation, and agricultural burning, substantially influence aerosol formation and evolution. In combination with natural sources like dust storms and wildfires [35,36], these factors make Asia a critical region for investigating aerosol behavior and assessing their impacts on climate change, air quality, and public health.

2.2. Datasets

2.2.1. Satellite AOD Product

MAIAC (Multi-Angle Implementation of Atmospheric Correction) AOD is derived from MODIS observations on the Terra and Aqua satellites and processed using the MAIAC algorithm. This algorithm enhances aerosol retrieval accuracy by correcting atmospheric interferences, such as cloud cover and surface reflectance, thereby improving the quality of retrieved AOD. The MAIAC AOD product provides high spatial resolution (1 km) and daily global coverage [37,38]. In contrast, MOD04/MYD04 AOD products utilize the traditional Dark Target and Deep Blue algorithms with a relatively coarse spatial resolution of 10 km, and generally exhibit limited performance over complex surfaces such as urban areas and mountainous regions. The MAIAC algorithm, employing a multi-angle, time-series analysis approach, enables improved accuracy over high-reflectance surfaces and cloud-prone regions, along with more stable data coverage. Figure 2a shows the observation frequency of MAIAC AOD across Asian land areas, while Figure 2b displays the mean AOD distribution across the region.

2.2.2. Atmospheric Reanalysis AOD

MERRA-2 (Modern-Era Retrospective analysis for Research and Applications, Version 2) provides long-term, high-quality AOD for atmospheric studies [39]. It provides global AOD at a relatively coarse spatial resolution (0.5° × 0.625°) with high hourly temporal resolution, spanning from 1979 to the present. MERRA-2 combines satellite observations with the deep learning model TabNet to generate seamless AOD dataset. In this study, MERRA-2 AOD serves as a critical variable for the AOD fusion model, enabling the generation of more accurate AOD in areas where MAIAC AOD is sparse.

2.2.3. Meteorological Fields

The ERA5 single level dataset is produced by the European Centre for Medium-Range Weather Forecasts (ECMWF) as part of the ERA5 reanalysis project [40]. It provides hourly atmospheric variables with a spatial resolution of 0.25° × 0.25°, spanning from 1950 to the present. Key parameters for AOD fusion will be used in this study, include boundary layer height (blh), total column water (tcw), relative humidity (rh), surface pressure (sp), total precipitation (tp), the 10 m u-component of wind (u10), the 10 m v-component of wind (v10), and 2 m temperature (t2m).

2.2.4. Additional Data

The SRTM DEM (Shuttle Radar Topography Mission Digital Elevation Model) is a global dataset that provides high-resolution topographic data. Created from radar data collected by the Space Shuttle Endeavour during NASA 2000 mission, it offers a 30-m resolution (1 arc-second) globally [41]. For this study, the SRTM DEM was resampled to a 1 km resolution using nearest-neighbor interpolation.
AERONET (AErosol RObotic NETwork) is a ground-based network that provides precise AOD measurements [42]. Using sun photometers, AERONET quantifies aerosol concentrations by measuring sunlight attenuation at multiple wavelengths. AERONET AOD is widely used as a reliable reference for validating satellite-derived AOD products. However, AERONET data at 550 nm are not directly available. To address this limitation, this study employed a quadratic polynomial interpolation method, utilizing AOD measurements at 440 nm, 500 nm, and 675 nm to obtain the AOD at 550 nm [43]. The interpolation formula is as follows.
ln τ λ = a 0 + a 1 ln λ + a 2 ( ln λ ) 2
where τ λ is the AERONET AOD at λ nm, and a 0 , a 1 , a 2 are unknown parameters which can be calculated by the AERONET AOD at 440 nm, 500 nm, and 675 nm.

2.2.5. Data Reprocessing

In this study, the Asia domain was segmented into an 11,000 × 17,500 grid, spanning from −25°S to 85°N and from 20°E to 165°W, with a spatial resolution of 0.01° per grid cell. Elevation, meteorological data, and reanalysis AOD were all resampled to this fine resolution using nearest-neighbor interpolation techniques. For validation purposes, we utilized AERONET AOD data within a 10 × 10 grid (0.1° × 0.1°) to calculate and compare average AOD values. Additionally, our research involved organizing and merging the hourly datasets, such as meteorological variables and MERRA-2 AOD, into daily aggregates. This was accomplished through a simple daily averaging method, computing the mean value of each variable across 24 h, based on UTC time. Furthermore, we calculated the annual mean values of each meteorological variable. These annual means replaced specific longitude and latitude details in our models to enhance the representation of spatial relationships among training samples [44].

2.3. The Framework of This Study

Briefly, this study integrates elevation, meteorological variables, and MERRA-2 reanalysis AOD as input features for the deep learning model TabNet, with MAIAC AOD serving as the target for training. Our goal is to combine MAIAC AOD and MERRA-2 AOD to produce a seamless daily AOD dataset for Asia covering the period from 2001 to 2024. Additionally, long-term AOD trends in Asia are analyzed using EOF analysis. The methodology is summarized in Figure 3, which outlines the framework of the study.

2.3.1. AOD Fusion Model

In this study, the AOD fusion model is designed to reconstruct missing values in the MAIAC AOD product, treating MAIAC AOD as the learning target. The model leverages MERRA-2 AOD, along with auxiliary inputs such as DEM and meteorological variables, to enhance reconstruction accuracy. By applying the TabNet algorithm, the model learns spatial-temporal patterns from available MAIAC AOD data and predicts AOD distribution across Asia, including regions where satellite retrievals are incomplete or unavailable. This approach enables the generation of a seamless daily AOD dataset and effectively mitigates edge discontinuities often seen in conventional gap-filling methods. The formulation of the AOD fusion model is as follows.
A O D s a t e l l i t e = f ( D E M , S p a t i a l m e t e , M E T E , A O D M E R R A 2 )
where AODSatellite represents the MAIAC AOD, DEM represents elevation data, Spatialmete is the mean values of each meteorological variable (represent spatial proximity), METE denotes meteorological variables, AODMERRA-2 refers to reanalysis MERRA-2 AOD, and f is the deep learning model TabNet.
TabNet is a deep learning model specifically designed for structured tabular data, combining the expressive power of neural networks with the interpretability typically associated with tree-based models such as LightGBM [45]. Its core innovation lies in the sequential attention mechanism, which dynamically selects the most relevant features at each decision step, enabling the model to effectively capture complex feature interactions, particularly valuable when dealing with high-dimensional, heterogeneous datasets. In this study, TabNet is employed to predict MAIAC AOD, using a diverse set of input features including temporal encodings (such as year, month, day, and day of year), topographic information (elevation), meteorological variables, and MERRA-2 AOD. These multi-source spatiotemporal features are integrated to build a robust predictive framework. The key model parameters are set as follows: n_d = n_a = 1024, n_steps = 100, gamma = 1.5, lambda_sparse = 1e-4, batch size = 4096, and learning rate = 0.0015, with the Adam optimizer and an early stopping strategy to prevent overfitting. During training, data from multiple regions and time periods are used to enhance model generalization. After training, model performance is evaluated against ground-based AERONET AOD observations to assess its accuracy and stability in AOD reconstruction tasks.

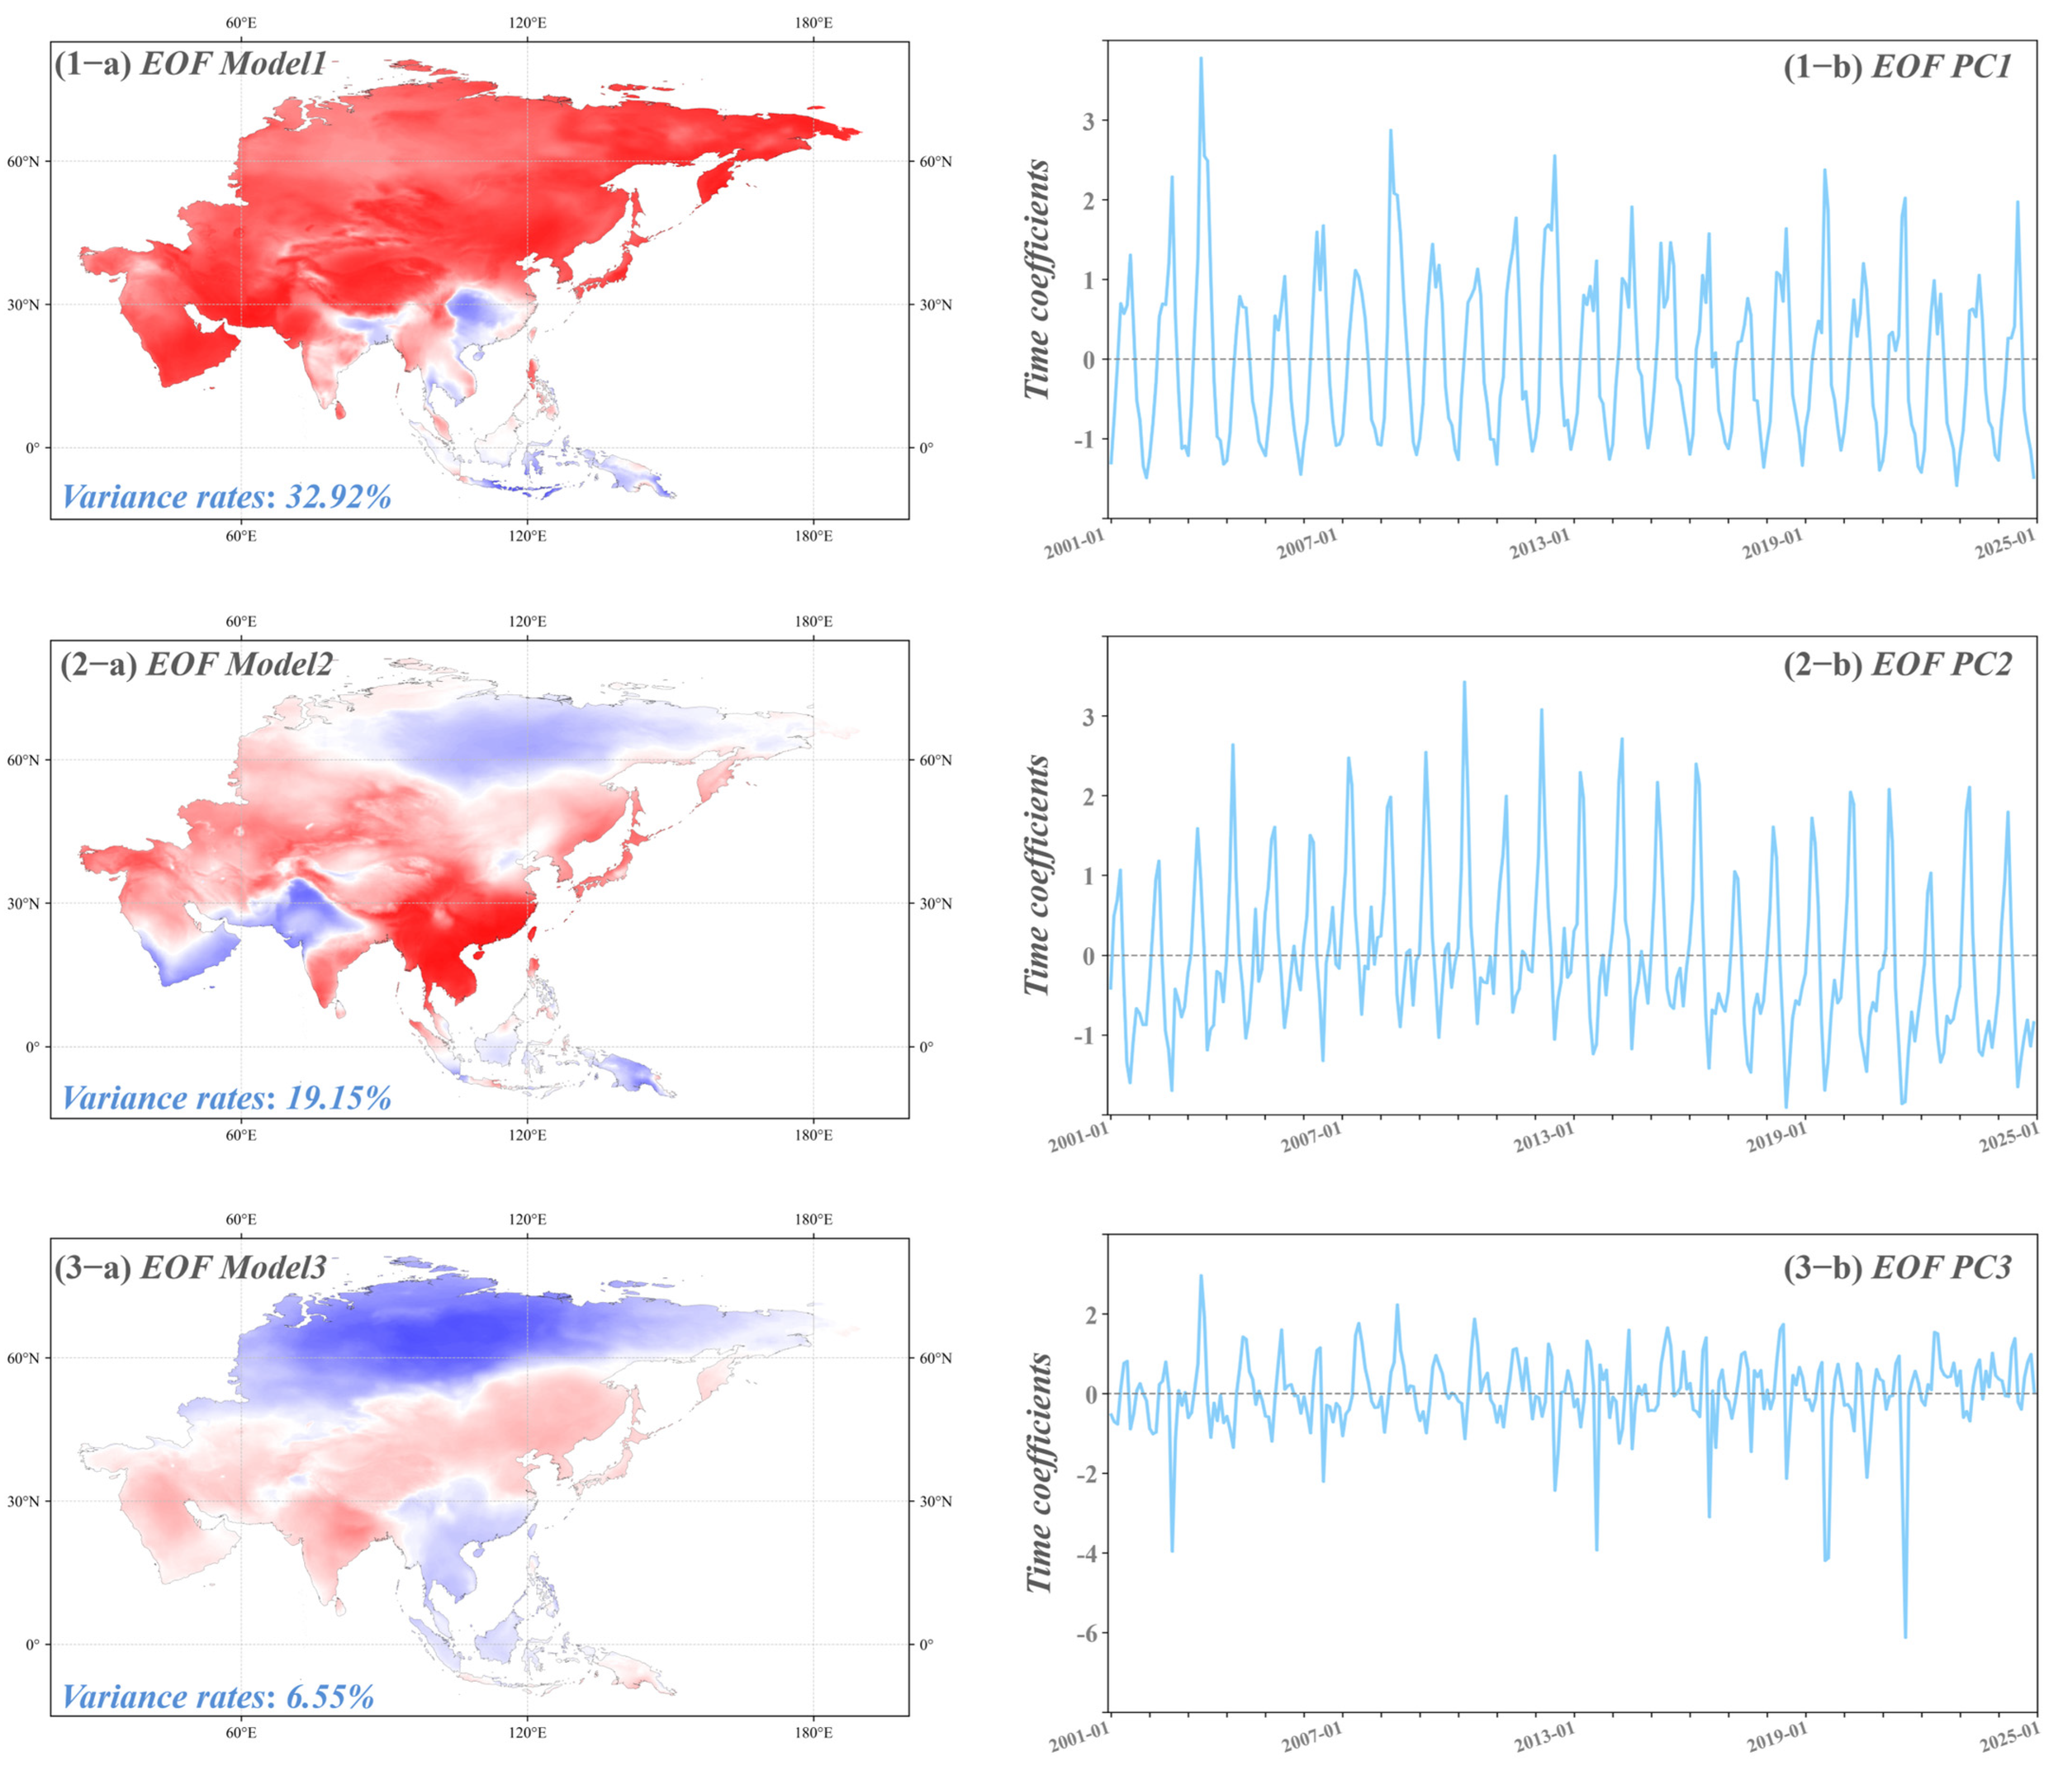
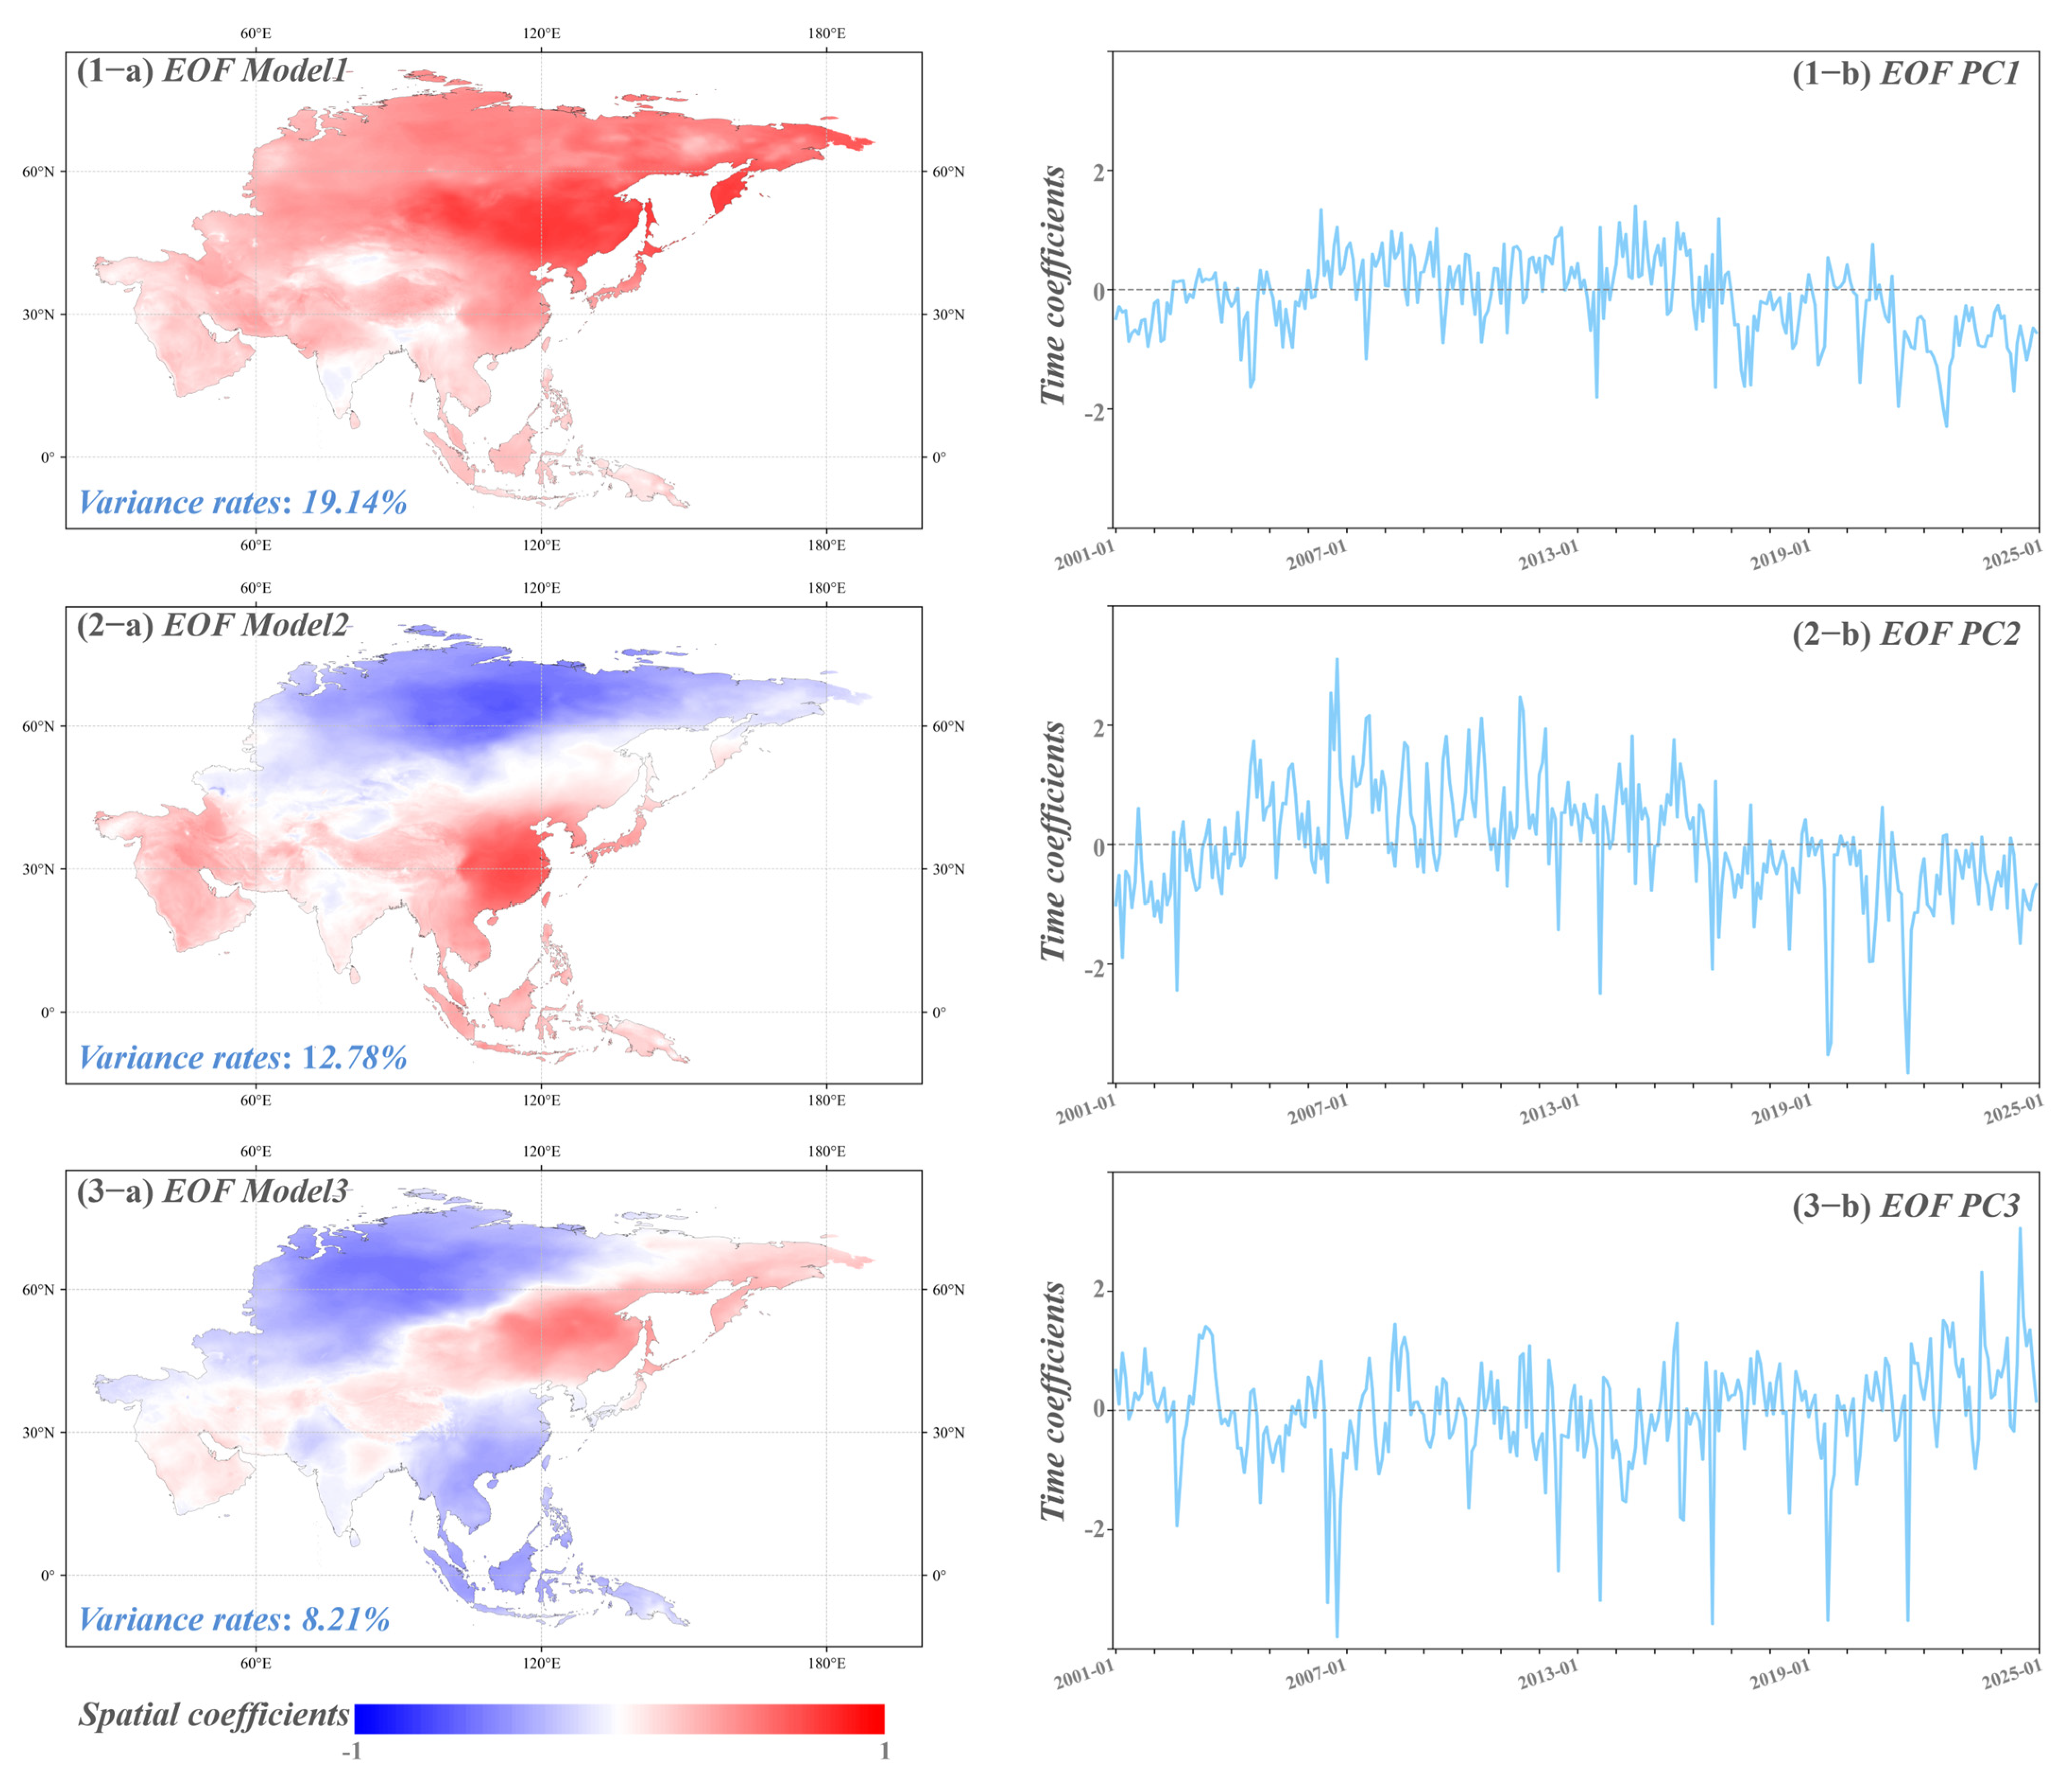
2.3.2. Empirical Orthogonal Function Analysis

Empirical Orthogonal Function (EOF) analysis is a widely utilized statistical method designed to uncover dominant patterns of variability in multivariate datasets, especially within geophysical and climatic contexts [46]. This technique decomposes a dataset into orthogonal spatial modes (EOFs) and their corresponding time series (principal components, PCs), facilitating the identification of the most significant modes of variability. EOF analysis is particularly adept at detecting spatial structures, such as climatic modes or atmospheric patterns, and elucidating their temporal evolution. In this study, EOF will be applied to explore the spatiotemporal patterns and long-term trends of Asia AOD. Utilizing the ‘eofs’ package (version 2.0.0) in Python 3.12.4, EOF decomposition is performed on the monthly mean AOD dataset for the region. The analysis is conducted in two phases: the first without detrending or removing the climatological mean to examine long-term variability, and the second with both detrending and the removal of the climatological mean to assess anomalous trends.

2.4. AOD Fusion Model Performance Evaluation

The AOD fusion model performance was quantitatively evaluated using the R2 (coefficient of determination) and RMSE (root mean square error) metrics.
R 2 = 1 i = 1 n ( x i y i ) 2 i = 1 n ( x i x ¯ ) 2
R M S E = 1 n i = 1 n ( x i y i ) 2
where n represents the total number of AERONET AOD valid observations, xi represents the ith record of AERONET AOD, yi represents the ith record of fusion AOD, and x ¯ represents the mean of the total valid AERONET AOD.

3. Results

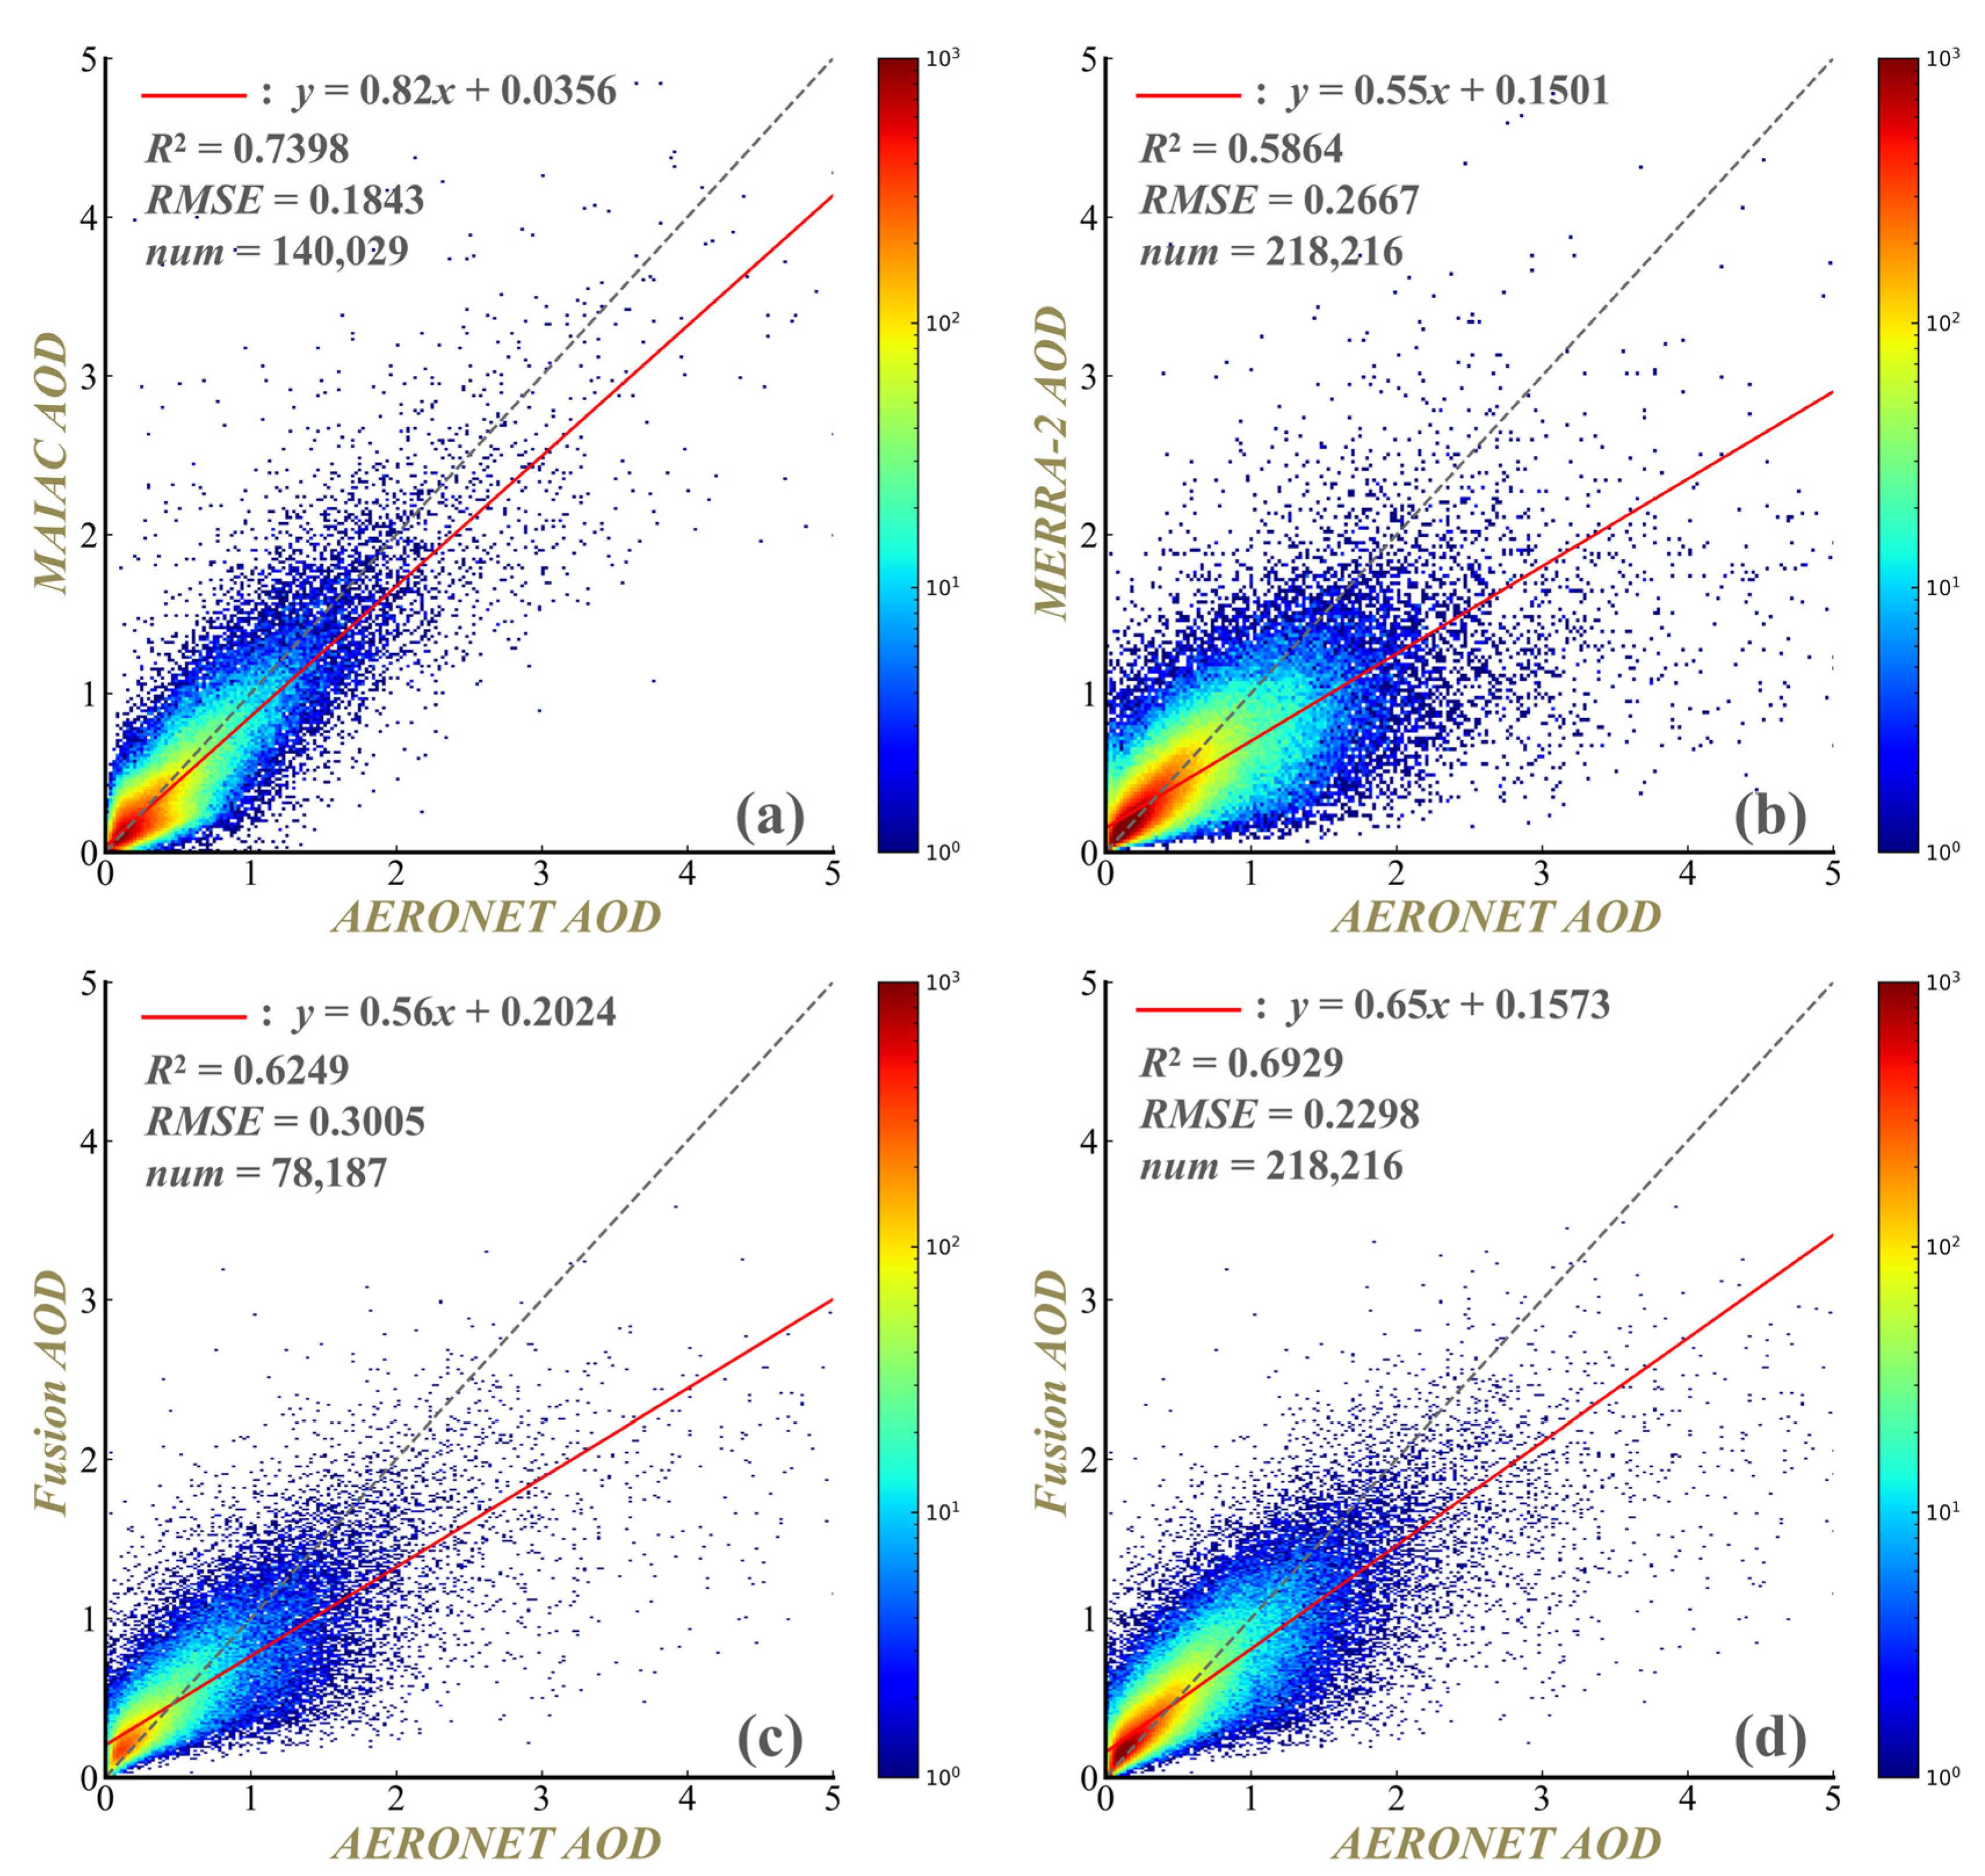
3.1. AOD Fusion Model Performance

By integrating satellite-derived MODIS MAIAC AOD and reanalysis MERRA-2 AOD, the AOD fusion model successfully generated a seamless daily AOD dataset for Asia spanning from 2001 to 2024. To evaluate the reliability of the fused dataset, its accuracy was validated against ground-based observations. For comparison, the accuracy of the original MAIAC AOD and MERRA-2 AOD datasets was also evaluated. As shown in Figure 4, MAIAC AOD achieves the highest accuracy (R2 = 0.7398, RMSE = 0.1843) but contains data gaps, whereas MERRA-2 AOD provides continuous coverage with lower accuracy (R2 = 0.5864, RMSE = 0.2667). The fusion approach significantly enhances model accuracy over the MERRA-2 AOD. Specifically, the AOD fusion model exhibits a notable increase in the R2 by 0.1065 and a decrease in RMSE by 0.0369. Furthermore, in areas lacking MAIAC AOD observations, the fusion model adeptly incorporates reanalysis AOD data, achieving improved accuracy with an R2 of 0.6249 and an RMSE of 0.3005. These accuracy improvements hold important implications for aerosol research and management in Asia. A more precise and spatially consistent AOD dataset enhances our ability to detect fine-scale pollution patterns, evaluate long-term trends, and better attribute aerosol loading to anthropogenic and natural sources. This is particularly valuable in under-monitored regions and during extreme pollution events, where traditional datasets often fail to capture local variability.

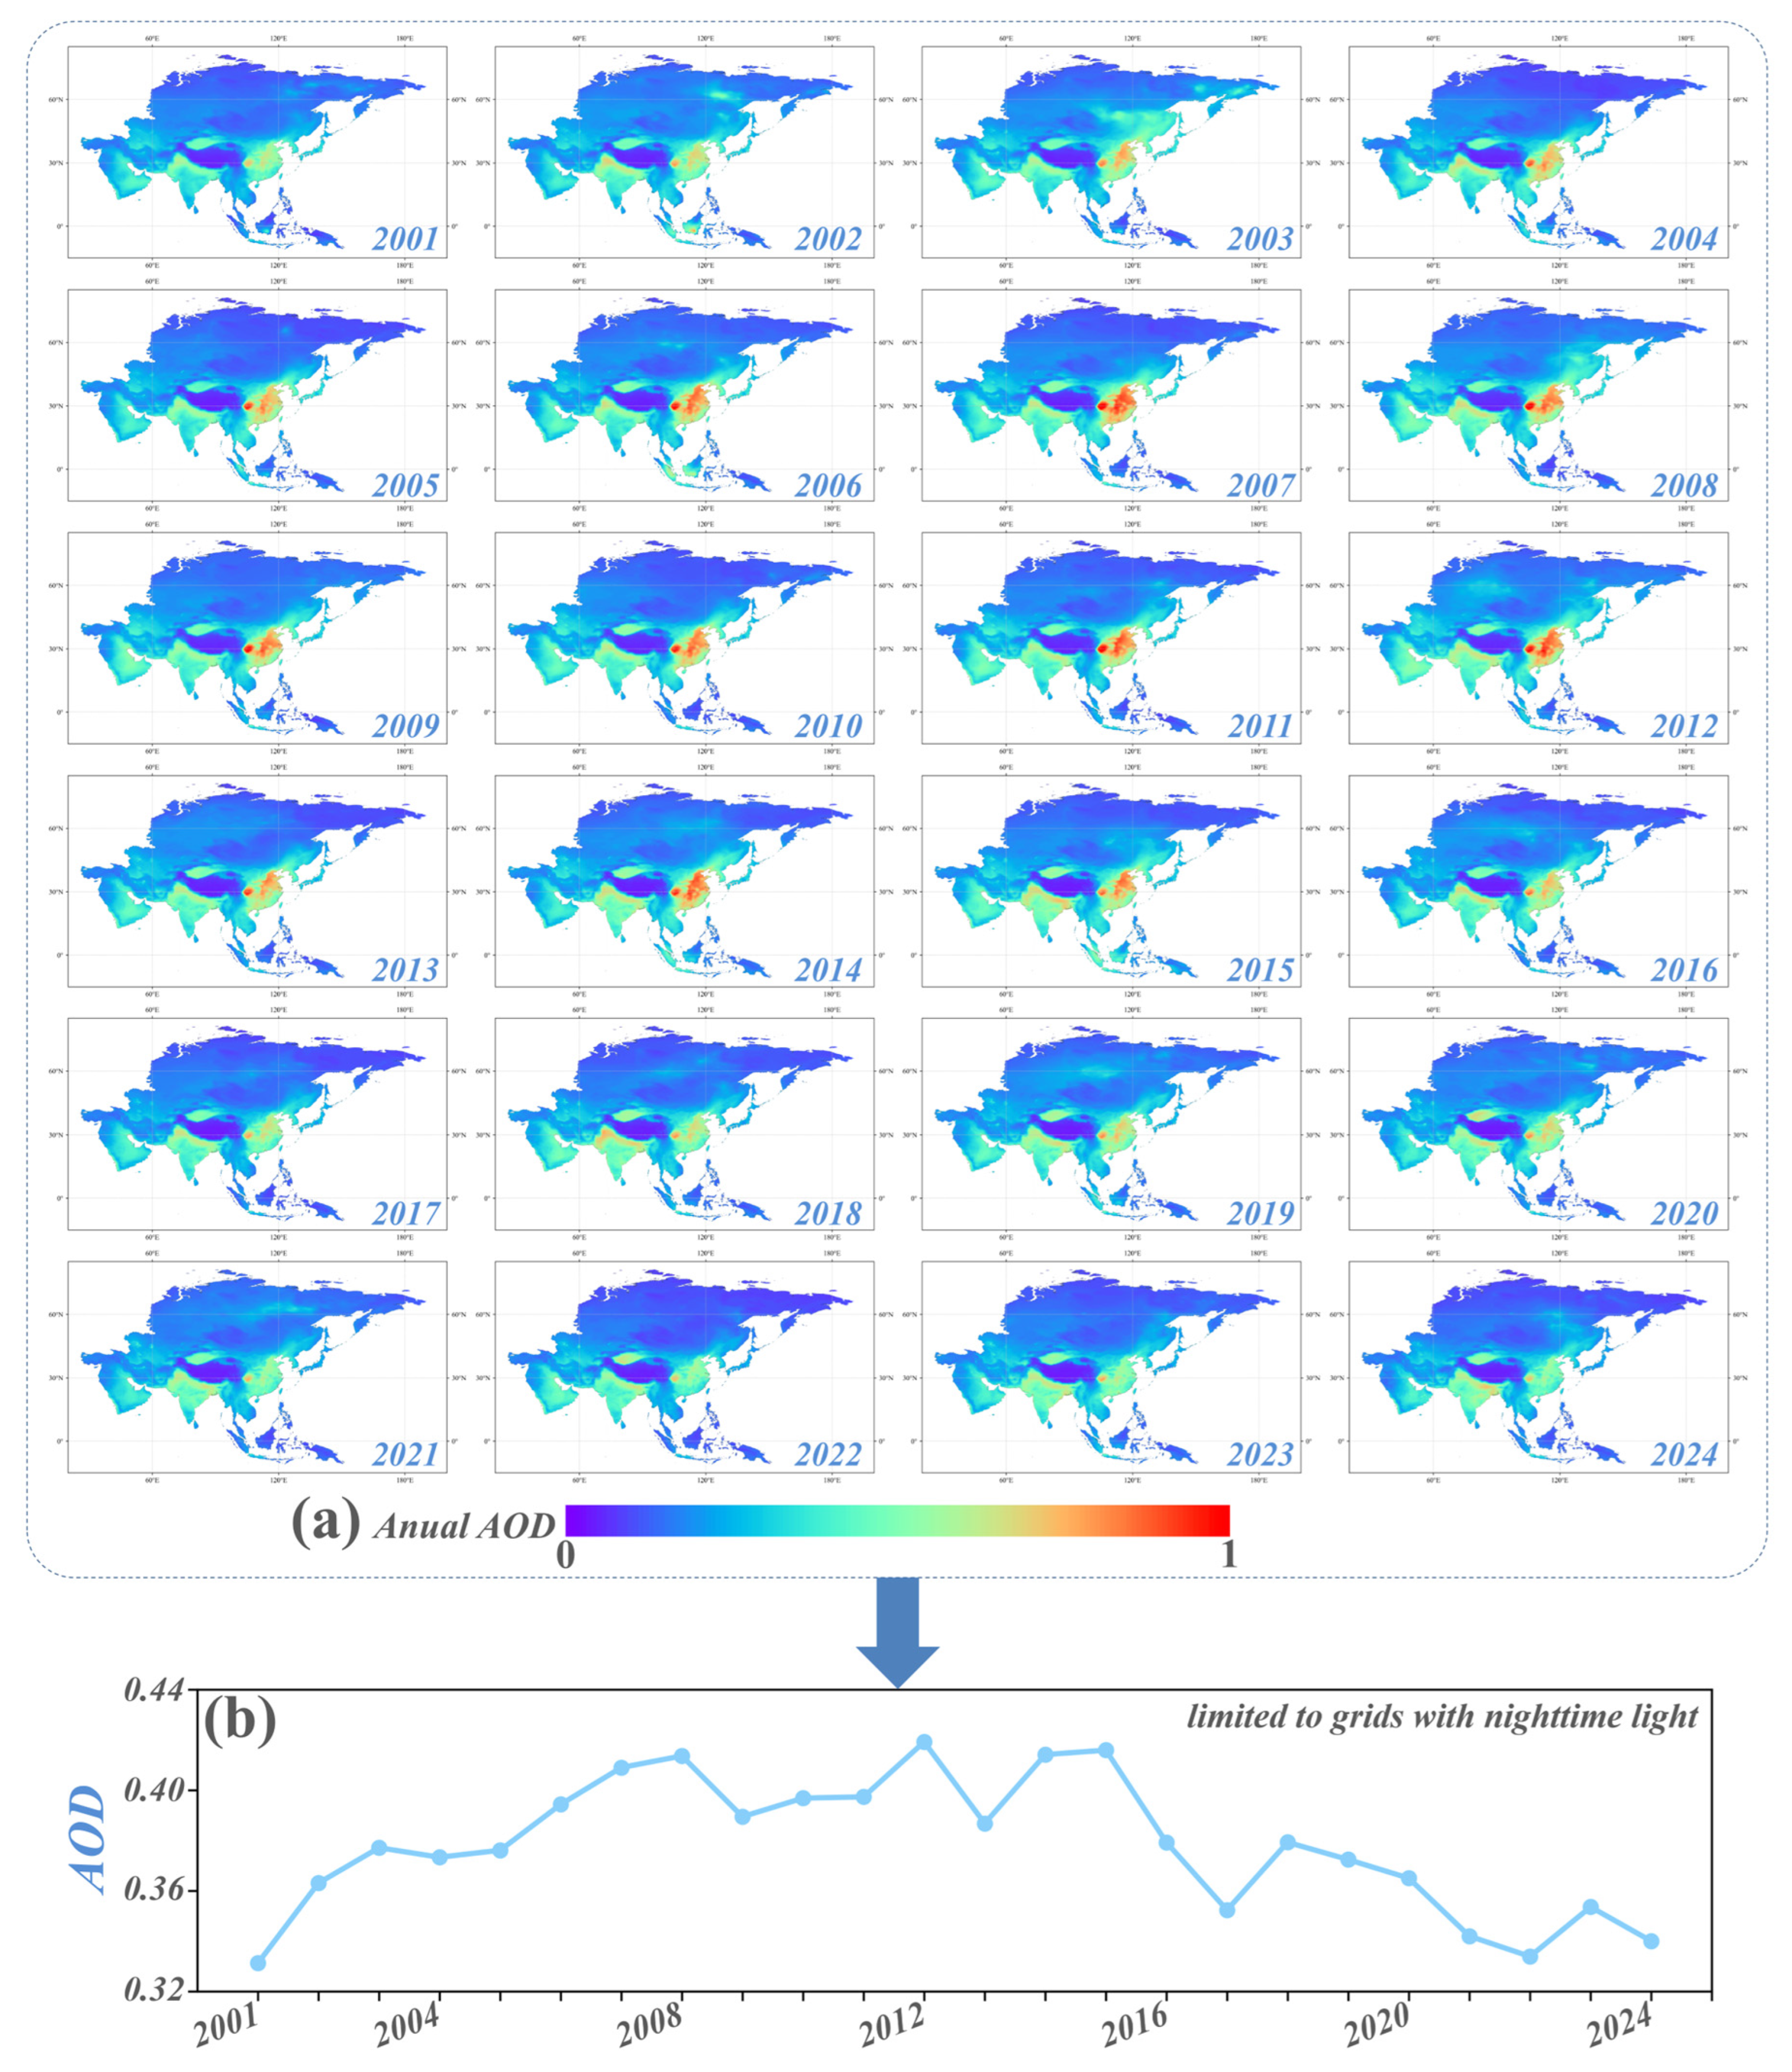
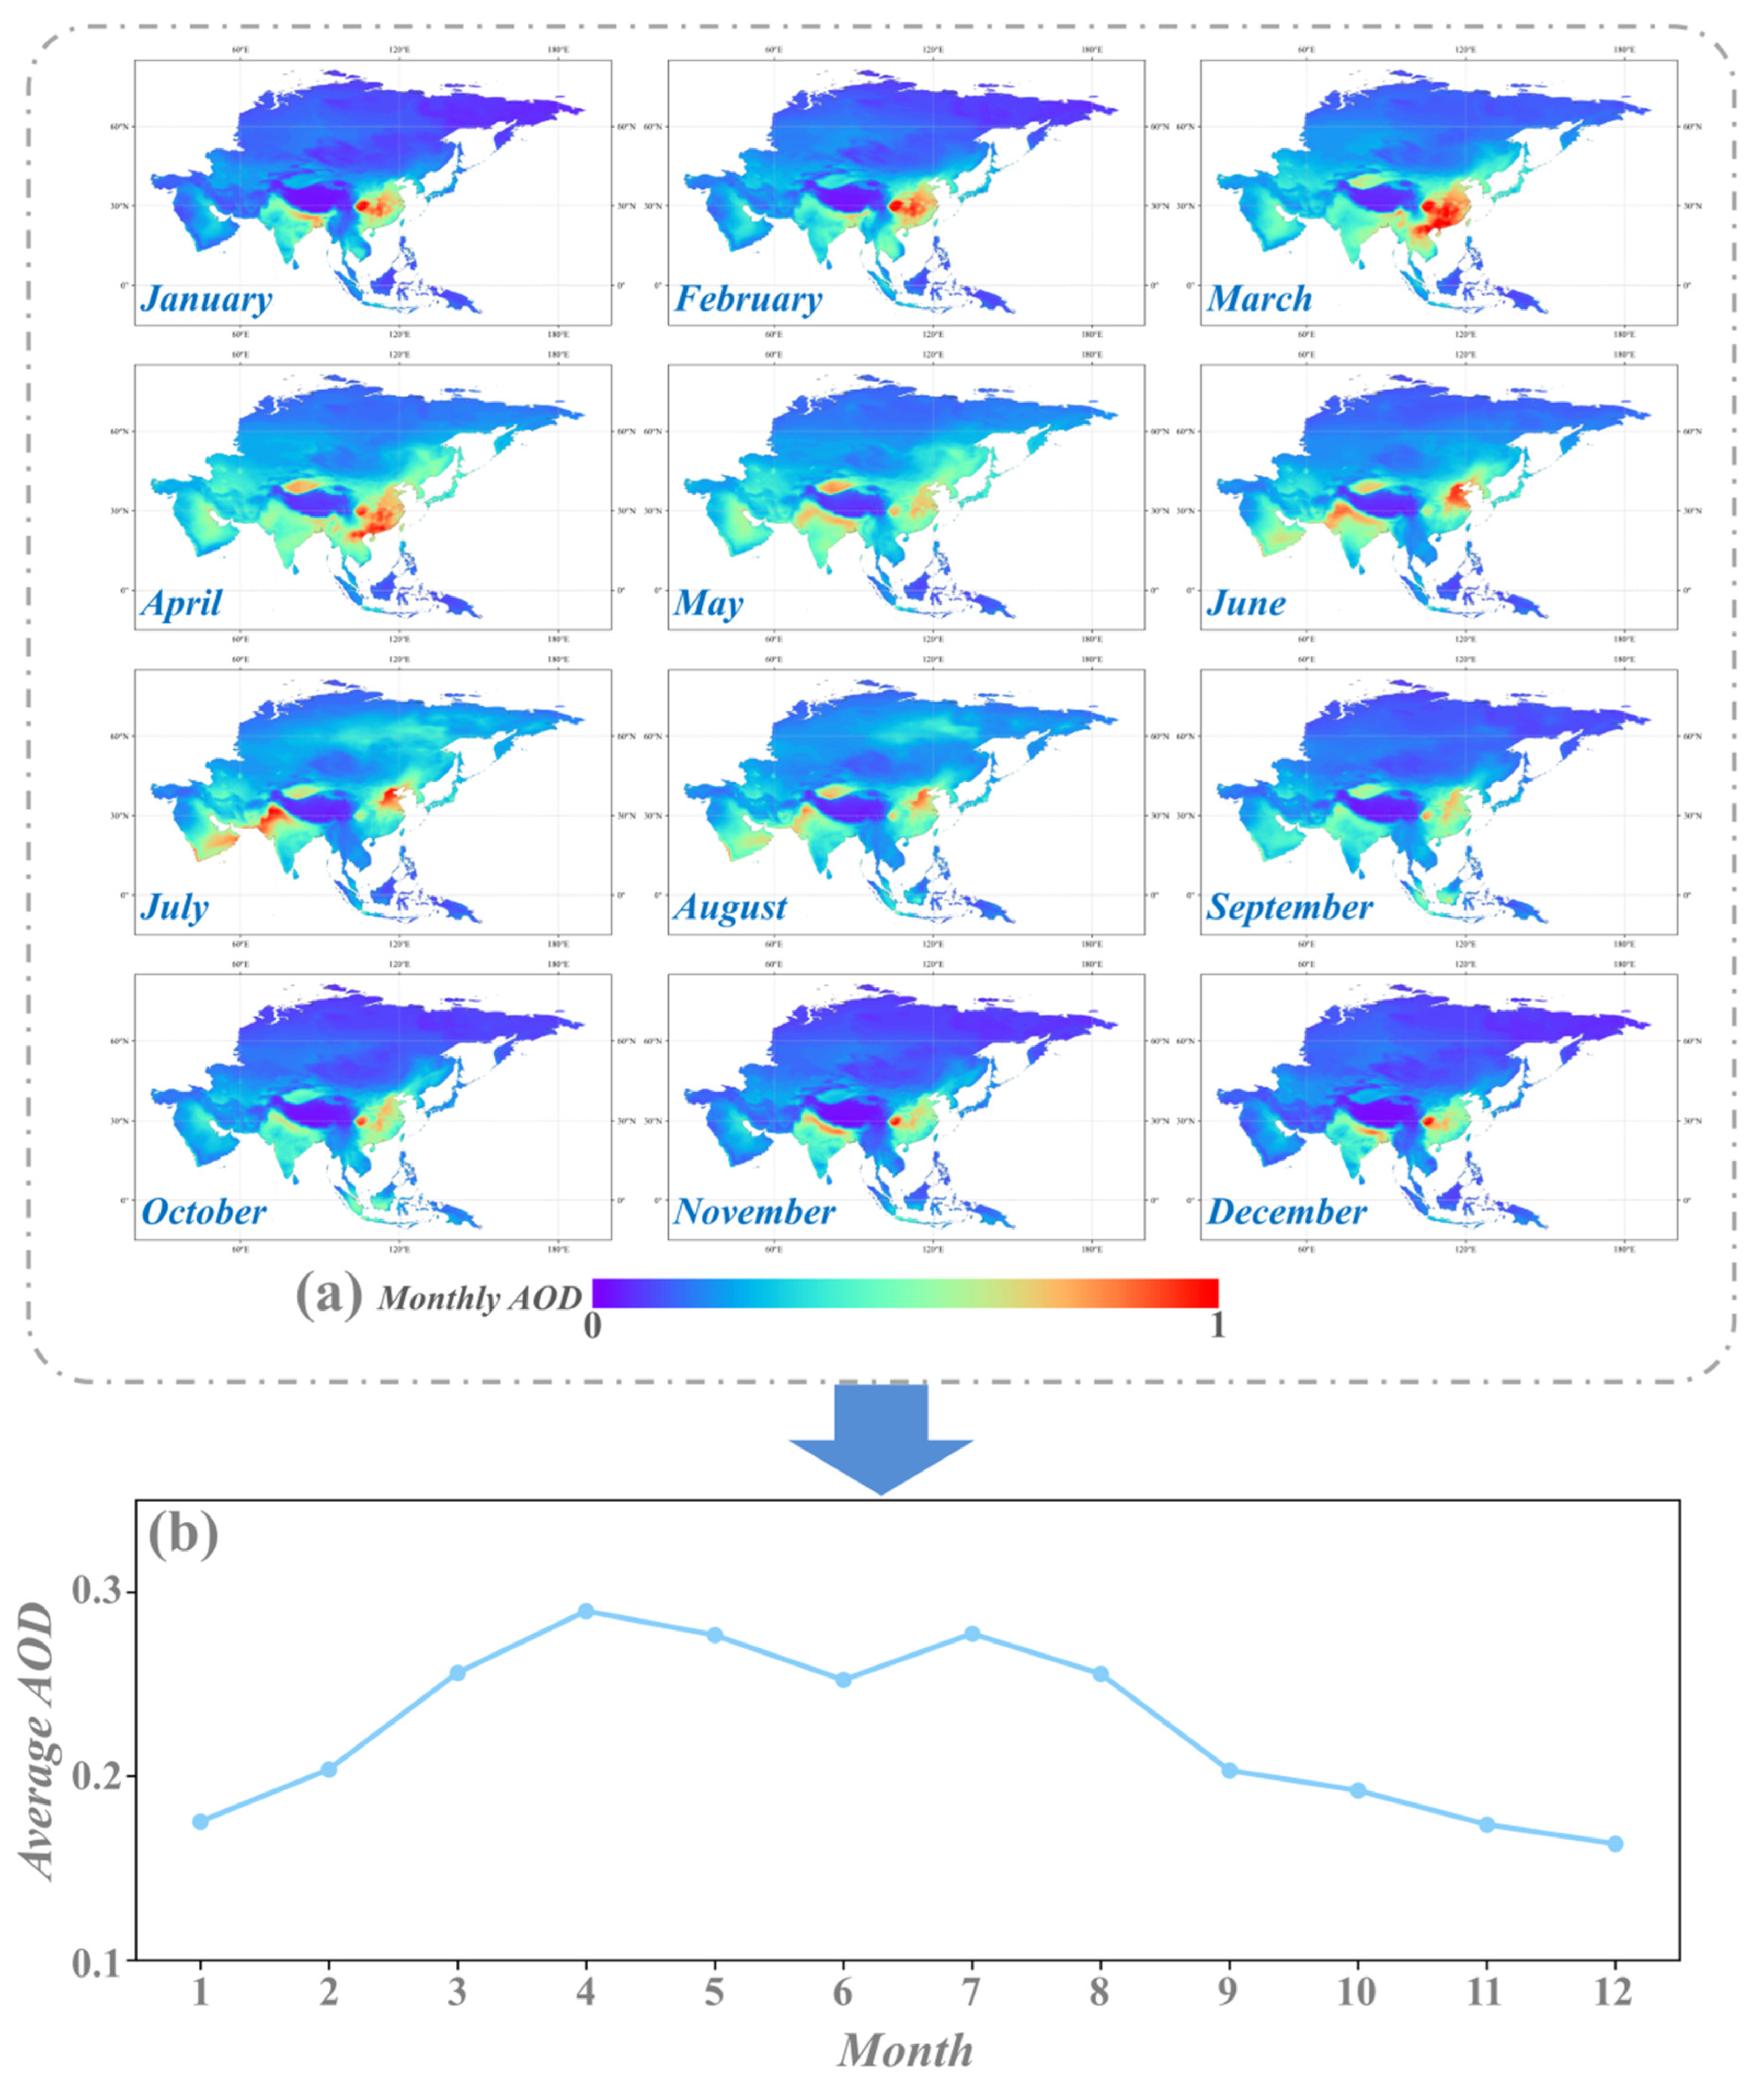
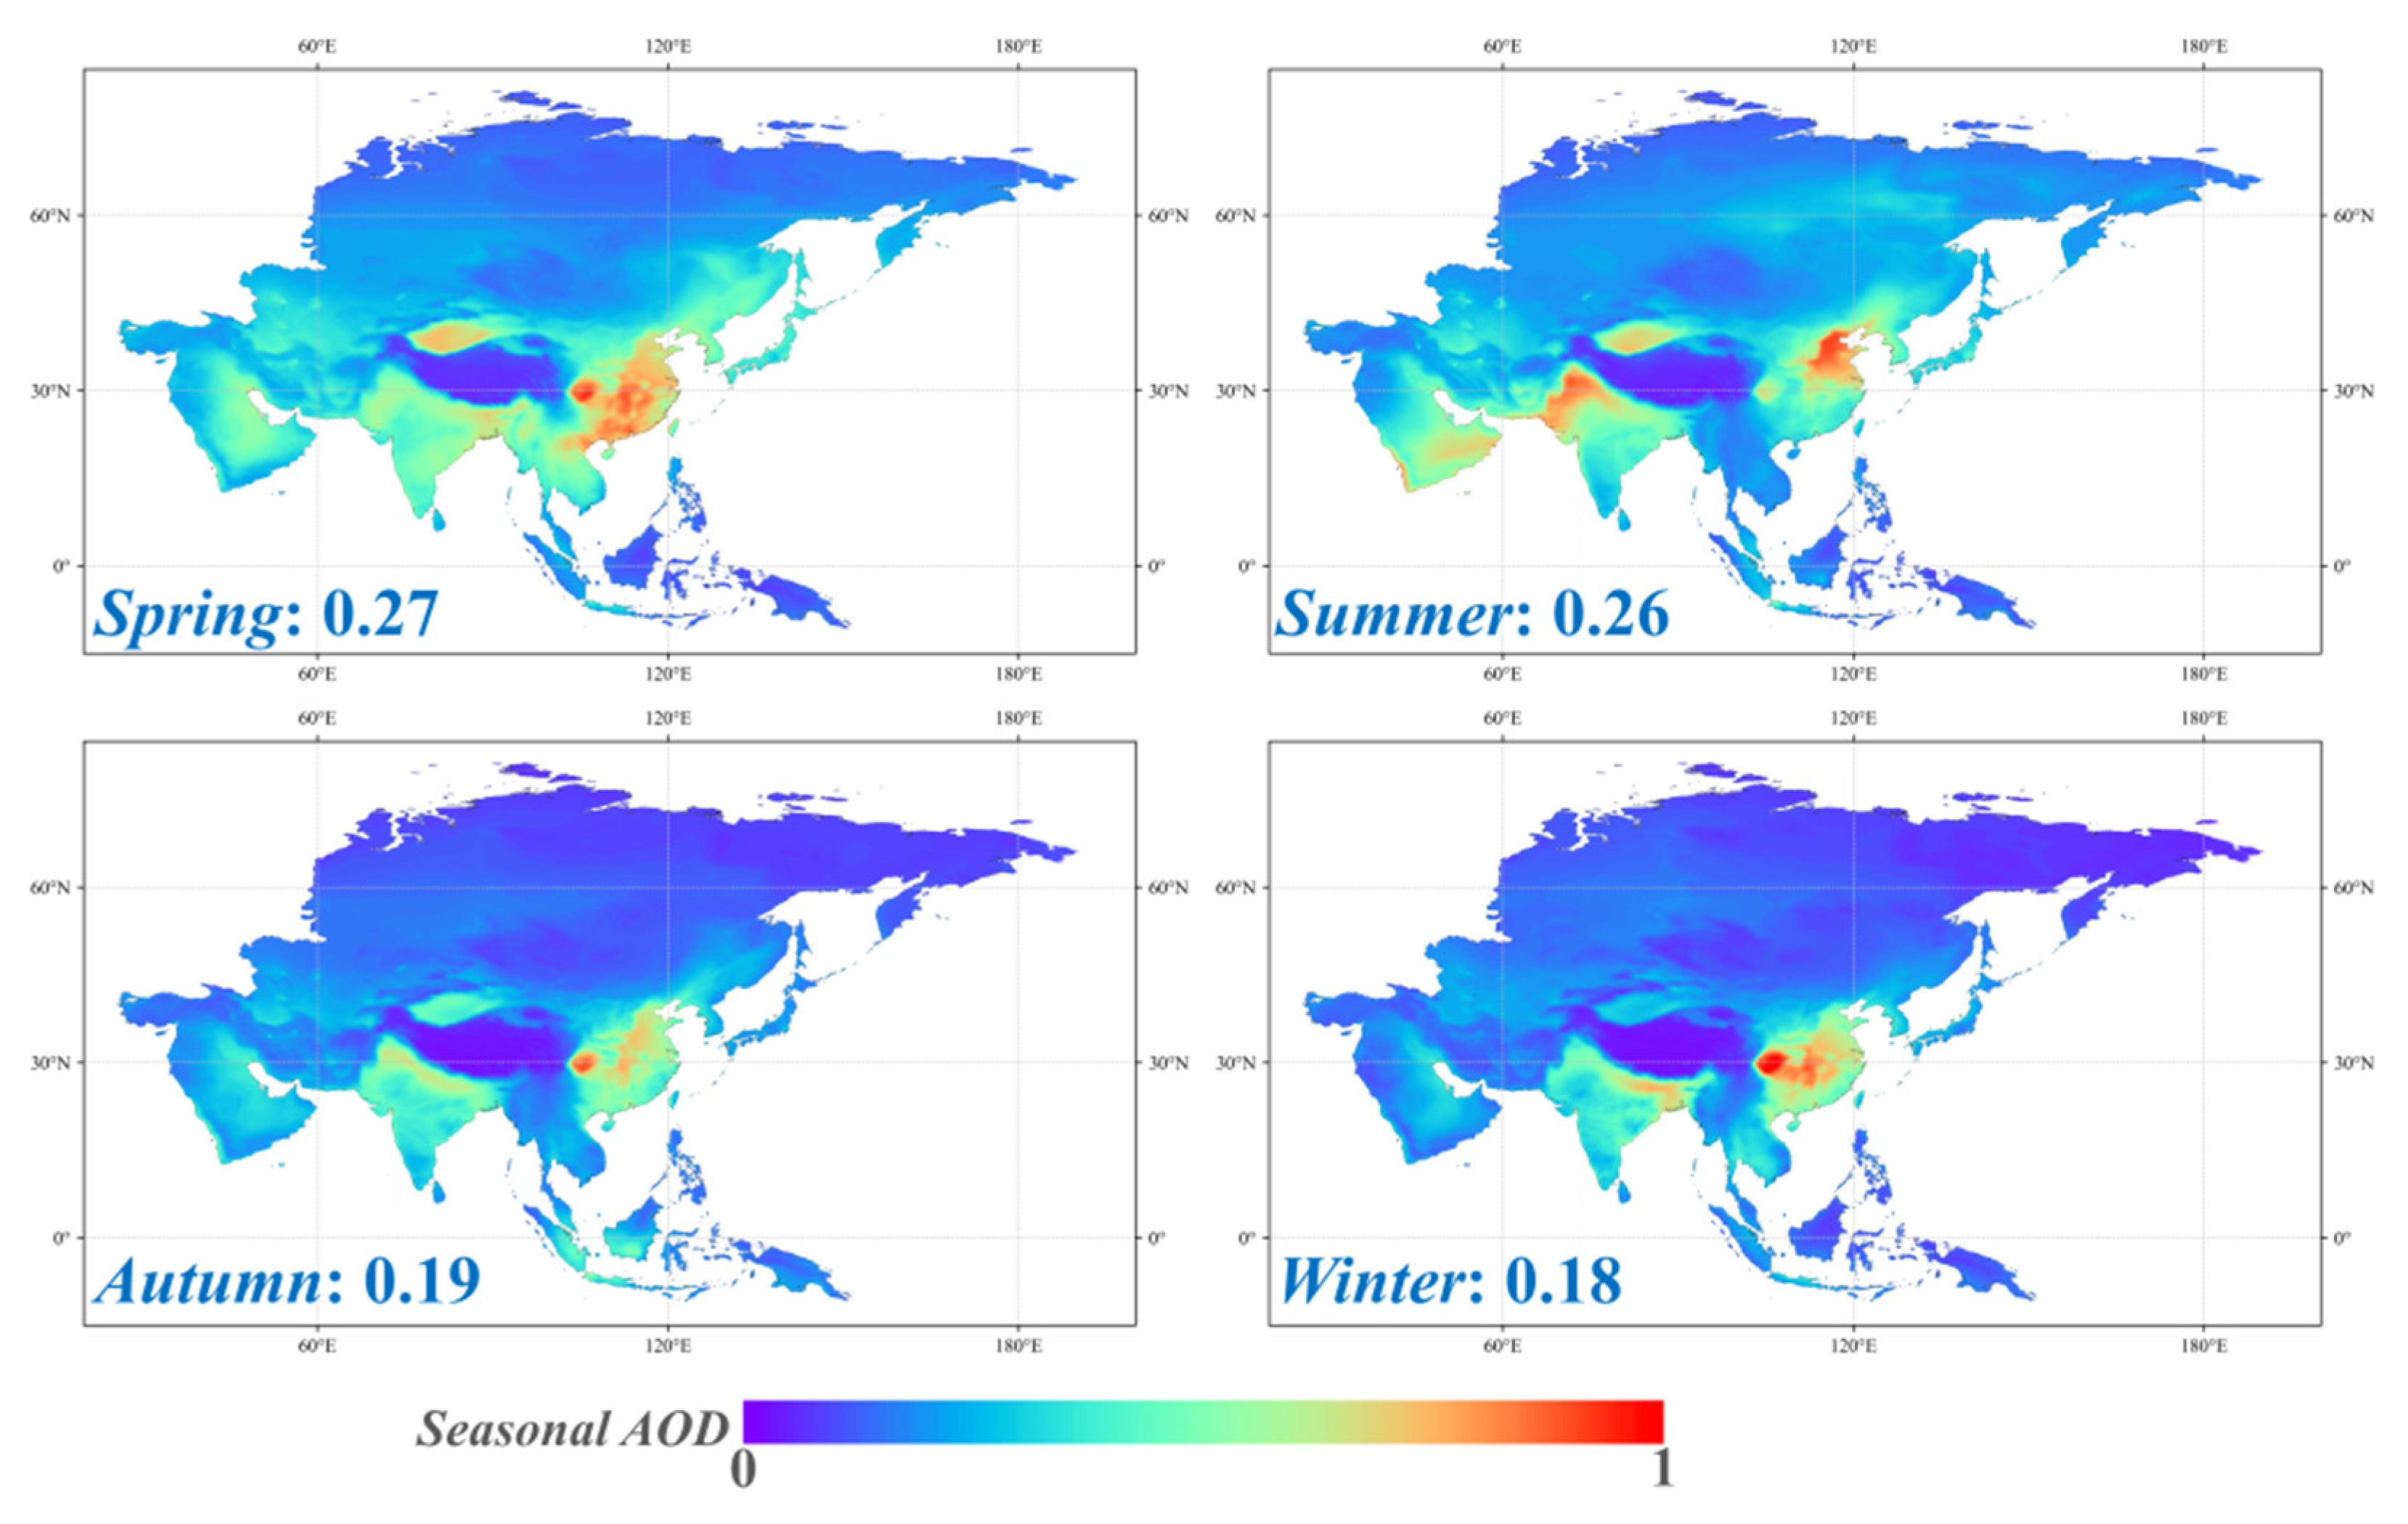
3.2. Spatiotemporal Distribution of Asia AOD

As shown in Figure 5, significant interannual variations in Asia AOD are evident from 2001 to 2024. From 2001 to 2014, there was a continuous increase in AOD levels across the continent, followed by a fluctuating decline from 2015 to 2024. The initial increase in AOD was primarily concentrated in East and South Asia, especially in regions like eastern China, India, and Bangladesh. This increase is closely linked to local human activities, including industrialization, transportation emissions, and biomass burning. In subsequent years, the decline in Asia AOD is mainly attributed to improved air pollution control policies, particularly the implementation of stringent emission standards and the adoption of clean energy technologies in China. However, AOD levels in certain regions, including Mongolia and West Asia, remained relatively stable throughout the study period, exhibiting no consistent trends. Additionally, regions of intense human activity, identified based on the persistent presence of nighttime lights in satellite data (as shown in Figure A1). These areas, typically corresponding to urban and industrial zones, are associated with higher and more variable aerosol concentrations.
Figure 6 displays the observed maximum AOD from 2001 to 2024 alongside the spatial differences in AOD for the year 2024. Areas highlighted in green indicate regions where the AOD in 2024 is below the historical peak. Notably, significant reductions in AOD have been observed in parts of East Asia, especially in eastern China. However, some regions in South Asia and Southeast Asia continue to exhibit relatively high AOD values. These spatial variations highlight the differing effectiveness of pollution control measures across various countries in Asia.
Figure 7 and Figure 8 reveal the monthly and seasonal AOD distribution patterns across Asia from 2001 to 2024, highlighting significant temporal variations in Asia aerosol concentrations. High AOD values are observed in East and South Asia during the winter months (December, January, and February), primarily due to increased heating activities and biomass burning, particularly in northern China and the Indian subcontinent. Conversely, AOD levels decrease during the summer months (June, July, and August), especially in regions with heavy monsoonal rains that help wash out aerosols from the atmosphere. Spring (March, April, May) and autumn (September, October, November) experience higher AOD values in East China and parts of South Asia, associated with agricultural burning and dust storms, while the summer monsoon significantly reduces aerosol concentrations. These seasonal patterns emphasize the complex interplay between natural and anthropogenic factors in shaping aerosol pollution in Asia.
Overall, the spatiotemporal characteristics of Asia AOD highlight complex interactions between human activities, industrialization, and seasonal weather patterns. Despite reductions in some areas due to air pollution mitigation, high concentrations persist in densely populated regions, emphasizing the need for enhanced pollution control and integrated sustainable development policies to improve air quality and public health.

4. Discussion

4.1. Long-Term Trends of Asia AOD

To deeply analyze the long-term spatio-temporal variations of Asia AOD, this study conducted EOF decomposition on the monthly mean AOD from 2001 to 2024, without removing the climate state, as shown in Figure 9. The first principal mode (Figure 9(1-a)) explains 32.92% of the total variance and presents a strong dipole pattern with higher AOD values in East Asia, particularly in northern China and parts of South Asia, while lower values are observed in Southeast Asia and its surrounding areas. The associated temporal coefficients exhibit distinct periodic fluctuations, likely reflecting long-term trends related to seasonal industrial emissions, traffic, and biomass burning activities. The second mode accounts for 19.15% of the variance (Figure 9(2-a)), with AOD anomalies concentrated in central and eastern China. Its temporal coefficients show clear cyclical variations, which may indicate the influence of regional industrialization, policy changes, or natural events such as dust storms. The third mode, accounting for 6.55% of the variance (Figure 9(3-a)), reveals complex spatial patterns of AOD in parts of East Asia. The large fluctuations in its temporal coefficients may reflect short-term, high-frequency changes in aerosol concentrations, associated with extreme weather events or sudden changes in human activities.

4.2. Anomalous Trends of Asia AOD

To analyze the anomalous trends of Asia AOD from 2001 to 2024, this study conducted a further EOF decomposition on the monthly mean AOD dataset, emphasizing anomalies by removing climatic states. The first principal mode (Figure 10(1-a)), accounting for 19.14% of the total variance, reveals a distinct dipole pattern with positive anomalies in East Asia, particularly in northern China, and negative anomalies in South Asia. The associated temporal coefficients exhibit significant fluctuations, reflecting large-scale aerosol trends driven by industrialization and regional pollution changes. These coefficients also show a trend of initial increase followed by a decrease, indicating an overall rise and then a decline in Asia’s AOD over the period. The second mode (Figure 10(2-a)) explains 12.78% of the variance and spatially, AOD anomalies are concentrated in central and northern China, with negative anomalies in South Asia. The periodic peaks and troughs in the temporal coefficients may be related to seasonal industrial activities or environmental changes such as dust storms, also displaying an initial increase followed by a decrease. The third mode (Figure 10(3-a)), accounting for 8.21% of the variance, shows complex and irregular spatial patterns across East and Southeast Asia. Its temporal coefficients, characterized by high-frequency fluctuations, likely represent short-term aerosol changes driven by extreme weather conditions or abrupt policy shifts, significantly impacting regional aerosol levels. Notably, the temporal coefficients of this mode exhibit an increasing trend after 2020, might associated with the rise in dust storm activities in regions like Mongolia.
Building upon the spatio-temporal patterns revealed through the EOF decomposition, several policy-relevant insights emerge. The dominant aerosol variability modes, especially those highlighting persistent and seasonal AOD peaks in northern and central China, emphasize the urgent need for region-specific emission reduction strategies. These should include enhanced industrial regulation, stricter vehicular emission controls, and the promotion of cleaner energy alternatives during high-emission seasons. Notably, the post-2020 increase in aerosol anomalies is closely associated with the intensification of dust storm activity in regions such as Mongolia. This trend has been attributed to multiple interrelated factors, including prolonged drought, accelerated desertification, vegetation degradation, and rapid land surface drying resulting from extreme temperature shifts [47,48,49]. In particular, Mongolia has experienced pronounced warming, exceeding the global average, and frequent climate extremes in recent years, which have contributed to the loosening of surface soils and increased wind erosion. The spring of 2021, for instance, saw one of the most severe transboundary dust storms in decades, with significant environmental and public health impacts across East Asia. These findings underscore the urgent need to establish early warning systems, improve regional dust event forecasting, and promote sustainable land management through international meteorological collaboration. The third EOF mode’s high-frequency fluctuations reflect the need for adaptive air quality management systems capable of responding rapidly to episodic pollution events triggered by extreme weather conditions or sudden shifts in human activity. Together, these results provide a scientific foundation for developing dynamic, spatially targeted aerosol mitigation strategies across Asia.
Additionally, the proposed AOD fusion model demonstrates strong computational efficiency and robust generalizability. Utilizing the deep learning framework TabNet on an NVIDIA RTX 4080 GPU with multithreading, the model is capable of reconstructing approximately one year of daily AOD data across Asia within a single day. This scalability makes the approach not only accurate but also highly suitable for long-term, large-scale environmental monitoring. The model generalizes effectively across both spatial and temporal domains, maintaining reasonable accuracy (R2 = 0.6249, RMSE = 0.3005) even in regions and periods with missing satellite observations. By fusing the high spatial resolution of MAIAC AOD with the continuous temporal coverage of MERRA-2, the approach successfully mitigates the individual limitations of each dataset. Despite its demonstrated strengths, the fusion model has several limitations. It is dependent on the availability and quality of input datasets, which may vary in spatial resolution, temporal consistency, and regional completeness. Additionally, while the model performs well across Asia, its generalizability to other geographic regions may be constrained by differences in climatic conditions and emission characteristics. Future work could explore the incorporation of additional high-resolution AOD datasets such as TROPOMI and Himawari-8, and the use of ensemble learning strategies to enhance predictive robustness. Extending the framework to other regions and integrating near-real-time monitoring data could further improve its operational utility. Moreover, adopting spatiotemporally adaptive deep learning architectures, such as attention-based or graph-based neural networks, may further boost the model’s capacity for fine-scale prediction and support real-time applications in environmental surveillance and public health management.

5. Conclusions

This study presents a novel deep learning-based approach to generate a high-resolution, seamless daily AOD dataset for Asia spanning 2001–2024. By integrating MERRA-2 and MODIS MAIAC AOD using the TabNet model, along with topographic and meteorological variables (DEM and ERA5), the fused dataset demonstrates improved accuracy compared to MERRA-2, with an increase in R2 by 0.1065 and a reduction in RMSE by 0.0369 against AERONET observations. Furthermore, EOF decomposition reveals key spatiotemporal AOD patterns strongly influenced by anthropogenic activities such as industrialization, transportation, and biomass burning. Notably, high aerosol loading is concentrated in East and South Asia, and while an overall declining trend has emerged since 2016, likely due to enhanced emission control policies, several regions continue to experience severe aerosol pollution. These findings underscore the value of combining deep learning fusion models with EOF-based analysis to advance our understanding of long-term aerosol dynamics. Moving forward, integrating real-time satellite and ground-based monitoring data with advanced modeling techniques, such as attention-based neural networks and spatiotemporal forecasting frameworks, holds promise for enhancing prediction accuracy and supporting more adaptive, data-driven air quality management strategies across Asia.

Author Contributions

Y.D. and J.D. conceived the paper and developed the algorithm; Y.D. wrote the manuscript and prepared the figures and tables; Y.D., W.N. and S.M. contributed to the data processing and analysis; S.L., J.Y. and J.D. supervised the preparation of the manuscript. All authors have read and agreed to the published version of the manuscript.

Funding

This research was funded by the Key Laboratory of Smart Earth (No. KF2023ZD03-03), and the Youth Project from the Hubei Research Center for Basic Disciplines of Earth Sciences (No. HRCES-202408).

Data Availability Statement

MAIAC AOD data for this study are available at (https://code.earthengine.google.com, accessed on 27 March 2025). MERRA2 AOD data for this study are available at (https://gmao.gsfc.nasa.gov/reanalysis/MERRA-2, accessed on 27 March 2025). AERONET AOD data for this study are available at (https://aeronet.gsfc.nasa.gov/, accessed on 27 March 2025). ERA5 data for this study are available at (http://cds.climate.copernicus.eu, accessed on 27 March 2025). SRTM DEM data for this study are available at (https://www.earthdata.nasa.gov, accessed on 27 March 2025).

Acknowledgments

The authors would like to thank the reviewers for their valuable advice.

Conflicts of Interest

The authors declare no conflicts of interest.

Abbreviations

The following abbreviations are used in this manuscript:
AODAerosol Optical Depth
EOFEmpirical Orthogonal Function
MODISModerate Resolution Imaging Spectroradiometer
MAIACMulti-Angle Implementation of Atmospheric Correction
MERRA-2Modern-Era Retrospective analysis for Research and Applications, Version 2
ECMWFEuropean Centre for Medium-Range Weather Forecasts
SRTMShuttle Radar Topography Mission
DEMDigital Elevation Model
AERONETAErosol RObotic NETwork
PCsprincipal components
R2coefficient of determination
RMSEroot mean square error

Appendix A

Figure A1. The spatial distribution of nighttime light (NTL) in 2023.
Remotesensing 17 01741 g0a1

References

  1. Li, X.; Zhang, C.; Li, W.; Anyah, R.O.; Jing, T. Exploring the Trend, Prediction and Driving Forces of Aerosols Using Satellite and Ground Data, and Implications for Climate Change Mitigation. J. Clean. Prod. 2019, 223, 238–251. [Google Scholar] [CrossRef]
  2. Yang, Z.; Zdanski, C.; Farkas, D.; Bang, J.; Harris, W. Evaluation of Aerosol Optical Depth (Aod) and Pm2.5 Associations for Air Quality Assessment. Remote Sens. Appl. Soc. Environ. 2020, 20, 100396. [Google Scholar] [CrossRef]
  3. Cirino, G.G.; Souza, R.A.F.; Adams, D.K.; Artaxo, P. The Effect of Atmospheric Aerosol Particles and Clouds on Net Ecosystem Exchange in the Amazon. Atmos. Chem. Phys. 2014, 14, 6523–6543. [Google Scholar] [CrossRef]
  4. Kim, D.; Kim, J.; Jeong, J.; Choi, M. Estimation of Health Benefits from Air Quality Improvement Using the Modis Aod Dataset in Seoul, Korea. Environ. Res. 2019, 173, 452–461. [Google Scholar] [CrossRef]
  5. Kaufman, Y.J. Aerosol Optical Thickness and Atmospheric Path Radiance. J. Geophys. Res. Atmos. 1993, 98, 2677–2692. [Google Scholar] [CrossRef]
  6. Kant, Y.; Ghosh, A.B.; Sharma, M.C.; Gupta, P.K.; Prasad, V.K.; Badarinath, K.V.S.; Mitra, A.P. Studies on Aerosol Optical Depth in Biomass Burning Areas Using Satellite and Ground-Based Observations. Infrared Phys. Technol. 2000, 41, 21–28. [Google Scholar] [CrossRef]
  7. Eck, T.F.; Holben, B.N.; Reid, J.S.; Dubovik, O.; Smirnov, A.; O’Neill, N.T.; Slutsker, I.; Kinne, S. Wavelength Dependence of the Optical Depth of Biomass Burning, Urban, and Desert Dust Aerosols. J. Geophys. Res. Atmos. 1999, 104, 31333–31349. [Google Scholar]
  8. Streets, D.G.; Yan, F.; Chin, M.; Diehl, T.; Mahowald, N.; Schultz, M.; Wild, M.; Wu, Y.; Yu, C. Anthropogenic and Natural Contributions to Regional Trends in Aerosol Optical Depth, 1980–2006. J. Geophys. Res. Atmos. 2009, 114, D00D18. [Google Scholar] [CrossRef]
  9. Wei, X.; Chang, N.-B.; Bai, K.; Gao, W. Satellite Remote Sensing of Aerosol Optical Depth: Advances, Challenges, and Perspectives. Crit. Rev. Environ. Sci. Technol. 2020, 50, 1640–1725. [Google Scholar] [CrossRef]
  10. Padimala, S.S.K.; Matli, C.S. A Comprehensive Review Delineates Advancements in Retrieving Particulate Matter Utilising Satellite Aerosol Optical Depth: Parameter Consideration, Data Processing, Models Development and Future Perspectives. Atmos. Res. 2024, 308, 107514. [Google Scholar] [CrossRef]
  11. Sogacheva, L.; Popp, T.; Sayer, A.M.; Dubovik, O.; Garay, M.J.; Heckel, A.; Hsu, N.C.; Jethva, H.; Kahn, R.A.; Kolmonen, P.; et al. Merging Regional and Global Aerosol Optical Depth Records from Major Available Satellite Products. Atmos. Chem. Phys. 2020, 20, 2031–2056. [Google Scholar] [CrossRef]
  12. Lyapustin, A.; Wang, Y.; Korkin, S.; Huang, D. Modis Collection 6 Maiac Algorithm. Atmos. Meas. Tech. 2018, 11, 5741–5765. [Google Scholar] [CrossRef]
  13. Qin, W.; Fang, H.; Wang, L.; Wei, J.; Zhang, M.; Su, X.; Bilal, M.; Liang, X. Modis High-Resolution Maiac Aerosol Product: Global Validation and Analysis. Atmos. Environ. 2021, 264, 118684. [Google Scholar] [CrossRef]
  14. Yang, J.; Hu, M. Filling the Missing Data Gaps of Daily Modis Aod Using Spatiotemporal Interpolation. Sci. Total Environ. 2018, 633, 677–683. [Google Scholar] [CrossRef]
  15. Zhang, T.; Zhou, Y.; Zhao, K.; Zhu, Z.; Asrar, G.R.; Zhao, X. Gap-Filling Modis Daily Aerosol Optical Depth Products by Developing a Spatiotemporal Fitting Algorithm. GIScience Remote Sens. 2022, 59, 762–781. [Google Scholar] [CrossRef]
  16. Katoch, V.; Kumar, A.; Imam, F.; Sarkar, D.; Knibbs, L.D.; Liu, Y.; Ganguly, D.; Dey, S. Addressing Biases in Ambient Pm2.5 Exposure and Associated Health Burden Estimates by Filling Satellite Aod Retrieval Gaps over India. Environ. Sci. Technol. 2023, 57, 19190–19201. [Google Scholar] [CrossRef] [PubMed]
  17. Kyunghwa, L.; Mijeong, K.; Myungje, C.; Jhoon, K.; Yunsoo, C.; Jaehoon, J.; Kyung-Jung, M.; Sojin, L. Fast and Operational Gap Filling in Satellite-Derived Aerosol Optical Depths Using Statistical Techniques. J. Appl. Remote Sens. 2022, 16, 044507. [Google Scholar]
  18. Singh, M.K.; Venkatachalam, P.; Gautam, R. Geostatistical Methods for Filling Gaps in Level-3 Monthly-Mean Aerosol Optical Depth Data from Multi-Angle Imaging Spectroradiometer. Aerosol Air Qual. Res. 2017, 17, 1963–1974. [Google Scholar] [CrossRef]
  19. Zhao, C.; Liu, Z.; Wang, Q.; Ban, J.; Chen, N.X.; Li, T. High-Resolution Daily Aod Estimated to Full Coverage Using the Random Forest Model Approach in the Beijing-Tianjin-Hebei Region. Atmos. Environ. 2019, 203, 70–78. [Google Scholar] [CrossRef]
  20. Li, X.; Liu, K.; Tian, J. Variability, Predictability, and Uncertainty in Global Aerosols Inferred from Gap-Filled Satellite Observations and an Econometric Modeling Approach. Remote Sens. Environ. 2021, 261, 112501. [Google Scholar] [CrossRef]
  21. Chen, Z.-Y.; Jin, J.-Q.; Zhang, R.; Zhang, T.-H.; Chen, J.-J.; Yang, J.; Ou, C.-Q.; Guo, Y. Comparison of Different Missing-Imputation Methods for Maiac (Multiangle Implementation of Atmospheric Correction) Aod in Estimating Daily Pm2.5 Levels. Remote Sens. 2020, 12, 3008. [Google Scholar] [CrossRef]
  22. Liang, T.; Liang, S.; Zou, L.; Sun, L.; Li, B.; Lin, H.; He, T.; Tian, F. Estimation of Aerosol Optical Depth at 30 M Resolution Using Landsat Imagery and Machine Learning. Remote Sens. 2022, 14, 1053. [Google Scholar] [CrossRef]
  23. Malarvizhi, A.S.; Pan, P. Multi-Source Data Fusion for Filling Gaps in Satellite Aerosol Optical Depth (Aod) Using Generative Models. In Proceedings of the 3rd ACM SIGSPATIAL International Workshop on Spatial Big Data and AI for Industrial Applications, Atlanta, GA, USA, 29 October–1 November 2024; Association for Computing Machinery: New York, NY, USA, 2024; pp. 28–38. [Google Scholar]
  24. Han, M.; Jia, S.; Zhang, C. Estimation of High-Resolution Pm2.5 Concentrations Based on Gap-Filling Aerosol Optical Depth Using Gradient Boosting Model. Air Qual. Atmos. Health 2022, 15, 619–631. [Google Scholar] [CrossRef]
  25. Li, L.; Franklin, M.; Girguis, M.; Lurmann, F.; Wu, J.; Pavlovic, N.; Breton, C.; Gilliland, F.; Habre, R. Spatiotemporal Imputation of Maiac Aod Using Deep Learning with Downscaling. Remote Sens. Environ. 2020, 237, 111584. [Google Scholar] [CrossRef]
  26. Liu, N.; Li, Y.; Zang, Z.; Hu, Y.; Fang, X.; Lolli, S. A Deep Learning-Based Imputation Method for Missing Gaps in Satellite Aerosol Products by Fusing Numerical Model Data. Atmos. Environ. 2024, 325, 120440. [Google Scholar] [CrossRef]
  27. Daniels, J.; Bailey, C.P.; Liang, L. Filling Cloud Gaps in Satellite Aod Retrievals Using an Lstm Cnn-Autoencoder Model. Presented at the IGARSS 2022–2022 IEEE International Geoscience and Remote Sensing Symposium, Kuala Lumpur, Malaysia, 17–22 July 2022. [Google Scholar]
  28. Liu, S.; Zhang, L. Deep Feature Gaussian Processes for Single-Scene Aerosol Optical Depth Reconstruction. IEEE Geosci. Remote Sens. Lett. 2024, 21, 5505705. [Google Scholar] [CrossRef]
  29. Wang, S.; Hao, J. Air Quality Management in China: Issues, Challenges, and Options. J. Environ. Sci. 2012, 24, 2–13. [Google Scholar] [CrossRef]
  30. Bi, S.; Hu, J.; Shao, L.; Feng, T.; Appolloni, A. Can Public Transportation Development Improve Urban Air Quality? Evidence from China. Urban Clim. 2024, 54, 101825. [Google Scholar] [CrossRef]
  31. Wen, Z.; Ma, X.; Xu, W.; Si, R.; Liu, L.; Ma, M.; Zhao, Y.; Tang, A.; Zhang, Y.; Wang, K.; et al. Combined Short-Term and Long-Term Emission Controls Improve Air Quality Sustainably in China. Nat. Commun. 2024, 15, 5169. [Google Scholar] [CrossRef]
  32. Liu, H.; Yu, Y.; Xia, D.; Zhao, S.; Ma, X.; Dong, L. Analysis of the Relationship between Dust Aerosol and Precipitation in Spring over East Asia Using Eof and Svd Methods. Sci. Total Environ. 2024, 908, 168437. [Google Scholar] [CrossRef]
  33. Shao, Z.; Wang, H.; Geng, Y.-F.; Diao, C.; Xu, Y.; Zheng, X.-T. East Asian Summer Monsoon Response to Anthropogenic Aerosols Redistribution: Contrasting 1950–1980 and 1980–2010 to Understand the Role of Non-Asian Forcing. Clim. Dyn. 2024, 62, 2187–2205. [Google Scholar] [CrossRef]
  34. Khoir, A.N.; Ooi, M.C.G.; Juneng, L.; Ramadhan, M.A.I.; Virgianto, R.H.; Tangang, F. Spatio-Temporal Analysis of Aerosol Optical Depth Using Rotated Empirical Orthogonal Function over the Maritime Continent from 2001 to 2020. Atmos. Environ. 2022, 290, 119356. [Google Scholar] [CrossRef]
  35. Irfan, H. Air Pollution and Cardiovascular Health in South Asia: A Comprehensive Review. Curr. Probl. Cardiol. 2024, 49, 102199. [Google Scholar] [CrossRef] [PubMed]
  36. Shindell, D.; Faluvegi, G.; Nagamoto, E.; Parsons, L.; Zhang, Y. Reductions in Premature Deaths from Heat and Particulate Matter Air Pollution in South Asia, China, and the United States under Decarbonization. Proc. Natl. Acad. Sci. USA 2024, 121, e2312832120. [Google Scholar] [CrossRef]
  37. Huang, G.; Su, X.; Wang, L.; Wang, Y.; Cao, M.; Wang, L.; Ma, X.; Zhao, Y.; Yang, L. Evaluation and Analysis of Long-Term Modis Maiac Aerosol Products in China. Sci. Total Environ. 2024, 948, 174983. [Google Scholar] [CrossRef]
  38. Ji, W.; Yang, L.; Tian, X.; Bilal, M.; Pei, X.; Zheng, Y.; Lu, X.; Cheng, X. Long-Term Validation and Error Analysis of Db and Maiac Aerosol Products over Bright Surface of China. Atmos. Res. 2024, 297, 107106. [Google Scholar] [CrossRef]
  39. Ansari, K.; Ramachandran, S. Optical and Physical Characteristics of Aerosols over Asia: Aeronet, Merra-2 and Cams. Atmos. Environ. 2024, 326, 120470. [Google Scholar] [CrossRef]
  40. Soci, C.; Hersbach, H.; Simmons, A.; Poli, P.; Bell, B.; Berrisford, P.; Horányi, A.; Muñoz-Sabater, J.; Nicolas, J.; Radu, R.; et al. The Era5 Global Reanalysis from 1940 to 2022. Q. J. R. Meteorol. Soc. 2024, 150, 4014–4048. [Google Scholar] [CrossRef]
  41. Yang, L.; Meng, X.; Zhang, X. Srtm Dem and Its Application Advances. Int. J. Remote Sens. 2011, 32, 3875–3896. [Google Scholar] [CrossRef]
  42. Andrews, E.; Ogren, J.A.; Kinne, S.; Samset, B. Comparison of Aod, Aaod and Column Single Scattering Albedo from Aeronet Retrievals and in Situ Profiling Measurements. Atmos. Chem. Phys. 2017, 17, 6041–6072. [Google Scholar] [CrossRef]
  43. Giles, D.M.; Holben, B.N.; Eck, T.F.; Sinyuk, A.; Smirnov, A.; Slutsker, I.; Dickerson, R.R.; Thompson, A.M.; Schafer, J.S. An Analysis of Aeronet Aerosol Absorption Properties and Classifications Representative of Aerosol Source Regions. J. Geophys. Res. Atmos. 2012, 117, D17203. [Google Scholar] [CrossRef]
  44. Ni, W.; Ding, Y.; Li, S.; Teng, M.; Yang, J. Estimation of Daily Seamless Pm2.5 Concentrations with Climate Feature in Hubei Province, China. Remote Sens. 2023, 15, 3822. [Google Scholar] [CrossRef]
  45. Arik, S.Ö.; Pfister, T. Tabnet: Attentive Interpretable Tabular Learning. Proc. AAAI Conf. Artif. Intell. 2021, 35, 6679–6687. [Google Scholar] [CrossRef]
  46. Dong, X.; Li, R.; Wang, Y.; Fu, Y.; Zhao, C. Potential Impacts of Sahara Dust Aerosol on Rainfall Vertical Structure over the Atlantic Ocean as Identified from Eof Analysis. J. Geophys. Res. Atmos. 2018, 123, 8850–8868. [Google Scholar] [CrossRef]
  47. Bao, C.; Yang, Y.; Bagan, H.; Wang, Q.; Te, T.; Uudus, B.; Yong, M.; Liao, T. Dust Intensity across Vegetation Types in Mongolia: Drivers and Trends. Remote Sens. 2025, 17, 410. [Google Scholar] [CrossRef]
  48. Borjigin, A.; Bueh, C.; Yong, M.; Purevjav, G.; Xie, Z. Cross-Border Sand and Dust Storms between Mongolia and Northern China in Spring and Their Driving Weather Systems. Remote Sens. 2024, 16, 2164. [Google Scholar] [CrossRef]
  49. Xue, Y.-B.; Zhang, X.-X.; Lei, J.-Q.; Li, S.-Y.; Liu, L.-Y.; Wang, Z.-F.; Tian, W.-J.; Tang, X.; Chen, X.-S. East Asian Dust Storm in March 2021: Perspective Views from Ground Observation, Satellite Measurement and Numerical Simulation. Atmos. Environ. 2025, 350, 121152. [Google Scholar] [CrossRef]
Figure 1. Distribution of AERONET sites (n = 295, dodger blue) across the Asia with underlying elevation data.
Remotesensing 17 01741 g001
Figure 2. (a) Frequency of MAIAC AOD observations across Asia from 2001 to 2024; (b) long-term average MAIAC AOD during 2001–2024.
Remotesensing 17 01741 g002
Figure 3. Graphical representation of the research framework for AOD fusion.
Remotesensing 17 01741 g003
Figure 4. Comparison of daily AERONET AOD (ground truth) with (a) MAIAC AOD, (b) MERRA-2 AOD, (c) fusion AOD in regions with missing MAIAC data, and (d) fusion AOD across all regions in Asia during 2001–2024.
Remotesensing 17 01741 g004
Figure 5. (a) Spatiotemporal distribution of annual fused AOD across Asia from 2001 to 2024; (b) AOD trends in regions with high anthropogenic activity over the same period.
Remotesensing 17 01741 g005
Figure 6. Difference between 2024 AOD and the historical maximum AOD across Asia during 2001–2024.
Remotesensing 17 01741 g006
Figure 7. (a) Spatial distribution of monthly mean fused AOD across Asia from 2001 to 2024; (b) AOD trends over the same period.
Remotesensing 17 01741 g007
Figure 8. Spatial distribution of seasonal mean fused AOD across Asia from 2001 to 2024.
Remotesensing 17 01741 g008
Figure 9. Spatial patterns (1-a3-a) and temporal coefficients (1-b3-b) of the first three EOF modes of Asia AOD without de-climatization.
Remotesensing 17 01741 g009
Figure 10. Spatial patterns (1-a3-a) and temporal coefficients (1-b3-b) of the first three EOF modes of Asia AOD after de-climatization.
Remotesensing 17 01741 g010
Disclaimer/Publisher’s Note: The statements, opinions and data contained in all publications are solely those of the individual author(s) and contributor(s) and not of MDPI and/or the editor(s). MDPI and/or the editor(s) disclaim responsibility for any injury to people or property resulting from any ideas, methods, instructions or products referred to in the content.

