Abstract
Synthetic aperture radar (SAR) is characterized by its all-weather monitoring capabilities and high-resolution imaging. It plays a crucial role in operations such as marine salvage and strategic deployments. However, existing vessel detection technologies face challenges such as occlusion and deformation of targets in multi-scale target detection and significant interference noise in complex scenarios like coastal areas and ports. To address these issues, this paper proposes an algorithm based on YOLOv8 for detecting ship targets in complex backgrounds using SAR images, named DFENet (Denoising and Feature Enhancement Network). First, we design a background suppression and target enhancement module (BSTEM), which aims to suppress noise interference in complex backgrounds. Second, we further propose a feature enhancement attention module (FEAM) to enhance the network’s ability to extract edge and contour features, as well as to improve its dynamic awareness of critical areas. Experiments conducted on public datasets demonstrate the effectiveness and superiority of DFENet. In particular, compared with the benchmark network, the detection accuracy of mAP75 on the SSDD and HRSID is improved by 2.3% and 2.9%, respectively. In summary, DFENet demonstrates excellent performance in scenarios with significant background interference or high demands for positioning accuracy, indicating strong potential for various applications.
1. Introduction
Synthetic aperture radar (SAR) imagery comprises high-resolution two-dimensional images obtained using radar imaging technology. Given its insensitivity to illumination conditions, SAR imagery can be acquired in almost any weather and at any time of day. Therefore, SAR technology is increasingly important across multiple fields, including military reconnaissance, border monitoring, geological surveys, and marine surveillance [1,2,3]. Vessels, as one of the key objects for marine monitoring, are of significant practical value for detection [4,5]. Currently, SAR technology for vessel detection is widely applied in various tasks, including maritime salvage, traffic management, strategic deployments, and military early-warning systems [6,7,8].
Vessel detection in SAR images faces some challenges: (1) The interference from sea clutter and the movement of vessels can lead to geometric distortions in SAR images, resulting in target blurriness and a loss of detail information. (2) In complex environments, such as ports and straits, vessels are susceptible to interference from surrounding structures, leading to instances of false detection and missed detection [9]. (3) Additionally, imbalanced dataset samples (small proportions of large ships) and multi-scale target detection in densely arranged scenes (mutual interference between large ship features and small ship features) negatively impact the overall detection accuracy.
Traditional ship detection methods rely heavily on handcrafted features, with the most common approach being the constant false alarm rate (CFAR) algorithm [10,11]. To address the issues of blurring in SAR images and the impact of sea clutter on detection accuracy, Leng et al. [12] proposed a novel kernel density estimation method that combines the intensity distribution and spatial distribution of SAR images for effective detection. However, in complex environments, the kernel density estimator can introduce computational errors, resulting in false alarms. Ai et al. [13] proposed an improved bilateral CFAR ship detection algorithm (IB-CFAR) for SAR images, which establishes an accurate statistical model of sea clutter in three stages to enhance detection rates. To address multi-target scenarios, Ai et al. [14] proposed a constant false alarm rate detector based on truncated clutter statistical characteristics (TCS-JCFAR) for pre-screening ship targets in multi-target environments. Moreover, the concept of the CFAR is widely applied in extracting local features for ship detection [15,16,17,18]. In this process, the decision threshold of the ship detector is controlled based on the expected false alarm rate and the Probability Density Function of the local background sea clutter. Although the CFAR detector can accurately identify ship targets in marine environments and adapt to different conditions, it is poorly adapted to the dynamic environment. In addition, in the case where multiple targets are close to each other, the CFAR algorithm may treat the interference between targets as background noise, resulting in missed detections or false alarms of adjacent targets.
Convolutional neural networks (CNNs) have seen widespread application in recent years due to their powerful end-to-end feature extraction capabilities, which seamlessly integrate detection, recognition, and classification tasks. This makes CNNs particularly effective in areas such as object detection [19,20,21,22], semantic segmentation [23,24,25], and natural language processing [26,27,28]. In the context of ship detection in SAR images based on deep learning, existing methods can be categorized into two-stage detection algorithms and one-stage detection algorithms. Representative two-stage algorithms include R-CNN [29], Faster R-CNN [30], SPP-Net [31], and Mask R-CNN [32], as well as the improved two-stage algorithms based on these models [33,34,35,36]. These algorithms initially generate region proposals that are likely to contain targets in the image, followed by the application of a CNN to recognize and classify these region proposals. While two-stage object detection algorithms can achieve high detection accuracy, their complex structure and two-phase processing can adversely affect the real-time performance of target detection. In contrast, one-stage detection algorithms are more commonly used in real-time application scenarios. One-stage detection algorithms eliminate the region proposal generation step, directly inputting the image into the CNN for target recognition and classification, thereby significantly enhancing the detection speed. Notable examples of one-stage algorithms include SSD [37], RetinaNet [38], FCOS [39], and the YOLO series [40,41,42].
For the problems existing in the one-stage algorithms, researchers have proposed a variety of improved methods [43,44,45,46]. In the field of SAR image target detection and recognition, several approaches have emerged to address challenges such as background interference and detection in complex scenes. To address the issue of degraded detection performance caused by the interaction between echoes from terrestrial structures and port-based vessels, Chen et al. [47] proposed an object detection network that integrates an attention mechanism and developed a loss function that incorporates the generalized intersection over union (GIoU) to reduce the network’s sensitivity to scale. To address the issues of noise interference and complex backgrounds, Wang et al. [48] embedded a soft threshold attention (STA) module into their network. Zhang et al. [49] proposed a quad-feature pyramid network (Quad-FPN) for detecting ships in synthetic aperture radar (SAR) images. Zhou et al. [50] proposed a side-lobe-aware network for small ship detection in SAR images, which enhances the extraction of ship hull information by reducing the influence of strong scattering points outside the hull. To enhance detection performance beyond mere modifications to network architectures, training techniques, and improvements in loss functions, Zhang et al. [51] proposed a novel deep learning network called HOG-ShipCLSNet, which integrates histogram of oriented gradients (HOG) features to better leverage the intrinsic characteristics of SAR data.
Although the above algorithms have improved the performance of ship detection in SAR images, there is still room for improvement in the ability to suppress background interference and in the positioning accuracy. In order to solve these problems, this paper proposes an SAR ship detection model, DFENet. Using the top-hat and bottom-hat transformation methods in mathematical morphology, we design a background suppression and target enhancement module (BSTEM) to suppress noise interference and the impact of local extrema in coastal and port areas. Additionally, based on the HOG algorithm, we design the FEAM to improve the accuracy of predicted bounding box localization and further enhance the ability to detect medium and large ships. Compared with the existing methods, we combine traditional computer vision methods with deep learning methods. The modules proposed in this paper not only simplify the model structure but also improve the accuracy of target detection and positioning. The main contributions of this paper are as follows:
- In order to suppress noise and enhance the contrast between the target and the background, we design the BSTEM. This module aims to mitigate the difficulties in detection and recognition caused by noise interference in complex scenes such as ports or nearshore areas in SAR images.
- In order to alleviate the issues of target blurriness and geometric distortion caused by ship movement, as well as insufficient feature learning for large ships caused by dataset sample imbalance, which hinders the effective improvement of detection accuracy for medium and large ships in practical scenarios, we further propose the FEAM. This module aims to enhance the detection capability of contours while improving focus on critical areas.
- We conduct ablation experiments on the benchmark datasets SSDD and HRSID, and we compare DFENet with other ship detection networks through both comparative and visualization analyses. The results demonstrate that DFENet significantly outperforms the other models, especially in terms of its denoising capability and detection accuracy for medium and large vessels.
2. Proposed Methods
In this section, we first provide an overview of DFENet. Then, we present a detailed description of the proposed background suppression and target enhancement module and the feature enhancement attention module.
2.1. Overall Architecture of DFENet
Complex backgrounds and multi-scale targets increase the difficulty of target detection, while YOLOv8 has an anchor-free mechanism and good adaptability to different target scales in SAR image target detection. Therefore, this paper selects YOLOv8 as the benchmark network of DFENet.
As illustrated in Figure 1, the structure of DFENet comprises three main components: the backbone, the neck, and the head. The input of DFENet receives a 640 × 640 × 3 SAR image, which has been pre-processed from a single channel to three channels. The network then outputs information such as target categories and their corresponding bounding boxes. The backbone architecture of DFENet is an improved CSPDarknet. This architecture introduces cross-layer connections to promote the interaction of feature information between different layers and enhance the expression ability of features. In order to suppress the noise such as sidelobe interference and sea clutter in the SAR image, the BSTEM is added to the backbone architecture. The BSTEM can enhance the contrast between the target and the background, so that the network can extract feature information more effectively. Then, the feature maps of different scales extracted by the backbone network are processed through the multi-scale feature fusion network to retain more detailed information and enhance the overall detection performance of the network. In order to alleviate the loss of target detail information in the deep network, the feature map output by the backbone network is spliced with the output features of the downsampling stage of multi-scale feature fusion after passing through the FEAM. The FEAM can enhance the dynamic attention ability of key areas and the detection ability of target contours, so as to improve the positioning accuracy of the network.
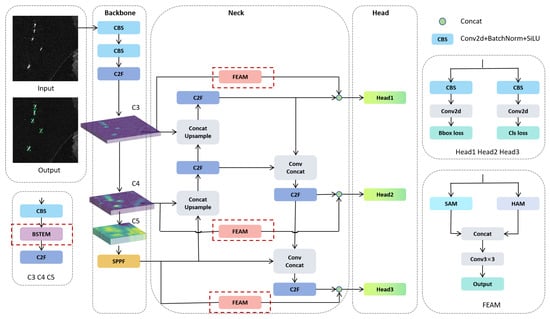
Figure 1.
The overall architecture of DFENet. DFENet consists of three parts: the backbone, neck, and head. Among them, C3, C4, and C5 all contain BSTEMs, and the output is their respective C2F. The backbone output is passed through the FEAM and then concatenated with the neck output via a skip connection.
2.2. Background Suppression and Target Enhancement Module
Modules with a simple structure and strong adaptability are needed. Based on this, we propose the BSTEM to effectively reduce interference and enhance target feature extraction.
As shown in Figure 2, the input feature map is F0, which is converted to F1 after a convolution operation. F1 is subtracted from F2 to obtain F3, and F4 is subtracted from F1 to obtain F5. The process is as follows:
where denotes a 3 × 3 convolution operation, followed by batch normalization (BN) and a nonlinear transformation of the ReLU activation function.
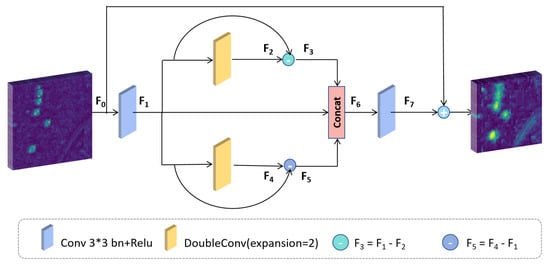
Figure 2.
The structure of the BSTEM. The BSTEM not only has a small number of parameters but also can highlight the details and noise and emphasize the contour features.
In the process of transforming F1 into F2 and F4, the expression ability of the model is improved through dimension expansion. This is followed by a dimensional compression step that filters out features with low discrimination power while maintaining the dimension of the feature channel. After differential processing of the feature map F1, F2 and F4 generate F3 and F5, respectively. This can enhance the contrast between the target and the background and help the model focus on the features of the ship target.
Finally, in order to enable the model to fuse information from multiple angles and optimize the ability to recognize ship targets, we concatenate F1, F3, and F5 along the feature dimension to obtain the feature map F6. In order to effectively extract key information and improve the stability of the module, we apply further convolution operations to F6, followed by a residual connection with the original input feature map F0 to produce the output feature map. The process is illustrated as follows:
where denotes concatenation along the feature dimension. The BSTEM not only has a simple structure but also can enhance the contrast between the target and the background, especially in complex or low-contrast SAR images. This enhancement contributes to more accurate subsequent feature extraction and object detection processes.
2.3. Feature Enhancement Attention Module
The feature pyramid network (FPN) [52] fuses information of different scales through horizontal connection and bottom-up feature transmission to adapt to detecting targets of different sizes. However, the FPN treats all input features equally, despite the fact that these features are at different resolutions and contribute to the output in varying degrees. To address this limitation, YOLOv8 employs a bidirectional feature pyramid network (BI-FPN) [53] structure. This structure introduces a feature weighting mechanism and employs repeated top-down and bottom-up operations to fully exploit the information across feature maps of different resolutions, enhancing the representation and flow of critical information. However, overly complex network structures can lead to the loss of feature information, particularly in ship detection based on SAR images. Such targets lack color and texture information and are susceptible to noise interference, resulting in poor detection performance by the algorithms.
Therefore, we introduce the feature enhancement attention module (FEAM) and integrate it into the BI-FPN architecture. The structure of this module is illustrated in Figure 3. Initially, the input feature map is processed through both the spatial attention module (SAM) [54] and the HOG attention module (HAM). The results are then concatenated along the feature channel dimension, and a convolution operation is performed to produce the output features.
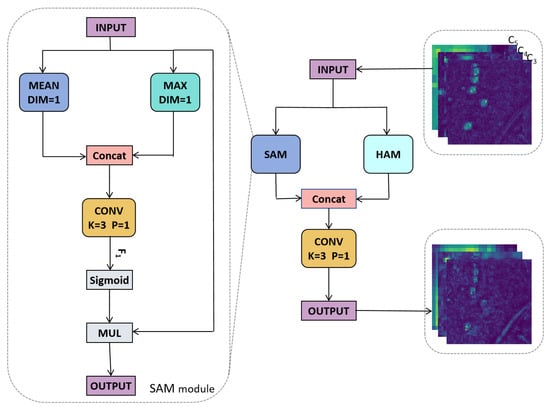
Figure 3.
Structure of FEAM. SAM can dynamically focus on key areas. HAM can highlight contour features.
This process can be represented by the following equation:
where S represents the SAM, H denotes the HAM, and refers to concatenation along the feature channel dimension. is a convolution operation with a kernel size of 3 × 3, and both the padding and stride are set to 1, aiming to maintain the consistency of the output feature channel dimensions with those of the input.
The SAM improves dynamic attention to the key areas. The HAM enhances the ability to detect contours. The combination of the two improves the contour detection ability and target positioning accuracy of the network.
2.3.1. Spatial Attention Module
The SAM reweights features from the spatial dimension through element-wise multiplication, dynamically adjusting the importance of different regions within the feature map. This mechanism effectively suppresses irrelevant background information while enhancing the focus on the target. The structure of the SAM is illustrated in Figure 3. The input feature map is first processed using both average pooling and max pooling, followed by concatenation along the feature channel dimension. Subsequently, a convolution operation is performed using a 3 × 3 kernel with a padding of 1, resulting in the feature F1. Afterward, the Sigmoid function is applied to activate F1, which is then multiplied element-wise with the initial input to produce an output feature that is consistent in terms of dimensions with the input. This process can be represented by the following equation:
where Fmean represents the average pooling operation applied to the feature map. Fmax denotes the max pooling operation. refers to the convolution operation with a kernel size of 3 × 3, and the Sigmoid function is employed for the activation operation. Through these steps, the SAM effectively extracts and emphasizes critical information from the input features, thereby enhancing the model’s ability to perceive the targets.
2.3.2. Hog Attention Module
The SAM enhances the model’s understanding of spatial relationships between objects and effectively focuses on key areas. However, it does not enhance the detailed features within those areas. To address this limitation, we propose the HAM to complement the SAM. The HAM improves the detection capabilities of shore and strait ships by enhancing edge information. Additionally, by enhancing the contour information, the HAM effectively suppresses background interference, enabling more accurate object detection in complex environments.
As illustrated in Figure 4, the HAM first performs mean and normalization operations on the input multi-dimensional feature map in the feature channel dimension to produce a single-channel feature map, F0. Subsequently, this single-channel feature map is traversed by the weight matrices W1 and W2 to obtain Gx and Gy, respectively. This process can be expressed using the following formulas:
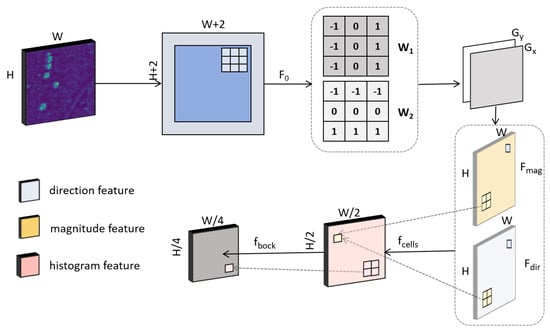
Figure 4.
Structure of HAM.
Matrix W1 represents the gradient extraction matrix in the horizontal direction. Matrix W2 represents the gradient extraction matrix in the vertical direction. Gx and Gy represent the horizontal and vertical feature maps, respectively.
The joint operation on the obtained Gx and Gy yields the following:
where ε = exp(−6) is a small value used to avoid numerical instability. fmag represents the magnitude feature map, while fdir denotes the directional feature map.
Subsequently, the image is divided into cells, with each cell consisting of 2 × 2 pixels. The feature information from the magnitude feature map fmag and the directional feature map fdir is then mapped into nine feature channels. During this mapping process, channels 1 through 9 completely cover the 360° angle. Each pixel’s corresponding feature channel is determined based on the angle from the pixel’s directional feature map, which then allows the projection of the pixel’s magnitude feature. The computation process for each cell is described as follows:
is a cell composed of 2 × 2 pixels, where represents the pixel index within cell . denotes the magnitude corresponding to the pixel in fmag. is the feature channel index associated with the angle value in fdir for that pixel. represents a unit sample function.
Finally, features are divided into multiple blocks, with each block consisting of 2 × 2 cells. Subsequently, the cells within each block are normalized and concatenated. The computation formula for a single block is as follows:
where B consists of 2× 2 cells, with representing the cell index within B. denotes the features of a single cell in the block. denotes the normalized feature corresponding to that cell. The function refers to the concatenation of the four cells within the block along the feature channel dimension. Ultimately, the normalized feature map has 36 dimensions, capturing gradient information from the image. This enhances the representation of edge contours and other important details within the image.
3. Experimental Results
In this section, we describe extensive experiments conducted to validate the effectiveness of the BSTEM and FEAM. The structure of this section is organized as follows: Section 3.1 presents the experimental setup; Section 3.2 outlines the evaluation metrics employed for model validation; Section 3.3 demonstrates the effectiveness of the two modules through ablation studies; Section 3.4 demonstrates the effectiveness of our model (DFENet) in offshore and nearshore scenarios; and Section 3.5 compares the performance of DFENet with seven different object detection methods.
3.1. Experimental Settings and Datasets
All experiments were conducted on an NVIDIA RTX 4090 GPU using the PyTorch2.3.1 framework. The Adam optimizer was employed to optimize the network model, and a cosine decay strategy was implemented to adjust the learning rate. The initial learning rate was set at 0.001, with a minimum threshold of 0.00001. Each batch comprised 16 images. Neither DFENet nor any of the comparative networks underwent pre-training.
Although the pre-training model can enhance performance in specific tasks by learning a wide range of general features, thereby improving the generalization ability of the model, the baseline network YOLOv8 pre-training model is usually large and has significant storage and loading costs. In addition, the pre-trained model is generally trained on large-scale generic datasets, which may cause some of the features it learns to be irrelevant to the target task. Therefore, DFENet chooses to train the model from scratch, allowing it to focus on task-specific details and deeply learn features that are highly relevant to the target task.
To evaluate the performance of DFENet, we conducted experiments on two ship detection datasets: SSDD [55] and HRSID [56]. These datasets encompass a variety of scenes, including coastal areas, ports, and open seas, and feature ships of different sizes, as well as diverse sea conditions. Therefore, these datasets provide a comprehensive foundation for assessing the network’s performance.
Table 1 and Figure 5 provide detailed information about the two datasets. Under the condition of input images with a resolution of 640*640 pixels, the sizes of small, medium, and large ships are defined as area < 322, 322 < area < 962, and area > 962, respectively. The SSDD consists of 1160 images, containing a total of 2540 ships. The pixel size of the images is predominantly 500*500, and the polarization mode is fully polarized. In this dataset, the proportions of small, medium, and large ships are 16.6%, 51.8%, and 31.6%, respectively. The HRSID is composed of 5604 images with a resolution of 800*800 pixels, containing 16,961 ships and including three polarization modes. The proportions of small, medium, and large ships in this dataset are 46.6%, 51%, and 2.4%, respectively, covering a variety of scenes such as ports, coastal areas, and nearshore regions. Compared to the SSDD, the HRSID offers higher precision and more detailed ship characteristics.

Table 1.
Detailed information on SSDD and HRSID.
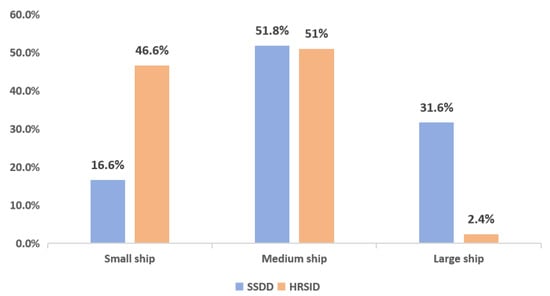
Figure 5.
Proportions of ships of different sizes.
In the SSDD and HRSID, the number of large ships is relatively low, while the quantity of small and medium-sized ships is significantly higher. This distribution characteristic provides a solid basis for evaluating the proposed network’s capability in detecting medium and large ships. Furthermore, the size of the original images in the SAR dataset was standardized to 640*640 pixels, and data augmentation techniques such as mosaic enhancement and random flipping were applied to effectively enhance the generalization ability of the model.
3.2. Experimental Evaluation Metrics
To comprehensively evaluate the performance of the BSTEM and FEAM, we employ the following assessment metrics: the mAP, mAP50, mAP75, APS, APM, and APL. Specifically, mAP refers to the mean average precision; mAP50 indicates the metric at an intersection over union (IoU) threshold of 0.5; mAP75 represents a stricter evaluation metric at an IoU of 0.75, requiring a higher degree of overlap between the predicted bounding boxes and the ground truth; APS, APM, and APL correspond to the mean average precision for area < 322, 322 < area < 962, and area > 962, respectively. The specific definitions of these metrics are as follows:
where TP (True Positive) refers to the number of correctly identified ships. FP (False Positive) denotes the number of incorrectly detected ships. FN (False Negative) represents the number of ships missed. refers to the precision–recall curve. We use the average precision () as the metric to evaluate the overall performance of the model.
3.3. Ablation Experiments
In this section, we evaluate the performance of the BSTEM and FEAM in DFENet on the SSDD and HRSID. Additionally, we analyze the detection performance through ablation experiments and visualizations. The effectiveness of the FEAM is verified by comparison with other attention modules.
In DFENet, we introduce the BSTEM and FEAM to enhance the contrast between the target and background, while improving the ability to localize targets in complex backgrounds. The experimental results on the SSDD are shown in Table 2. Compared to the baseline network, the addition of the BSTEM yielded gains of 0.1% and 0.7% in mAP50 and mAP75, respectively. When the FEAM was added, the gains were 0.2% for mAP50 and 0.1% for mAP75. When both modules were incorporated, the network achieved improvements of 0.3% and 2.3% in mAP50 and mAP75 compared to the baseline network.
Table 2.
Results of ablation experiments on SSDD. ‘√’ indicates that the corresponding module is added on the basis of the baseline network.
The experimental results on the HRSID are presented in Table 3. When the BSTEM was added, the network exhibited gains of 0.3% and 2.7% in mAP50 and mAP75, respectively. When the FEAM was added, the gains were 0.4% for mAP50 and 3.1% for mAP75. When both modules were added simultaneously, the network achieved gains of 0.3% and 2.9% in mAP50 and mAP75, respectively. Notably, on the SSDD, the proposed network improved the detection accuracy for medium and large vessels by 1.2% and 4.6%, respectively, compared to the baseline network. Similarly, on the HRSID, the proposed network enhanced the detection accuracy for medium and large vessels by 0.8% and 5.2%, respectively, compared to the baseline network. The quantitative analysis from the ablation experiments indicates that both the BSTEM and FEAM contribute to detection accuracy. Furthermore, the limited number of large-vessel samples in the datasets increases the difficulty of detecting medium and large vessels. The proposed network enhances the detection accuracy for these vessels, also alleviating the challenges posed by the uneven distribution of vessel sizes in the datasets.
Table 3.
Results of ablation experiments on HDSID. ‘√’ indicates that the corresponding module is added on the basis of the baseline network.
- (1)
- Visualization results for the BSTEM: By enhancing the contrast between the target and the background, the BSTEM enables the network to focus on more stable and meaningful image features, effectively reducing the impact of redundant features generated by clutter interference on target detection. Figure 6 illustrates the feature maps outputted by the backbone network, where (a) represents the annotation information of the input image, (b) represents the backbone feature map of the baseline network without the BSTEM, and (c) represents the backbone feature map of the DFENet model that includes the BSTEM. Images (1) and (2) were selected from the SSDD and HRSID, respectively. Among them, the visualization result for the feature map was obtained by taking the maximum value in the feature channel dimension. The visualized feature maps clearly demonstrate that the BSTEM effectively suppresses clutter interference from the ground in the detection of coastal vessels.
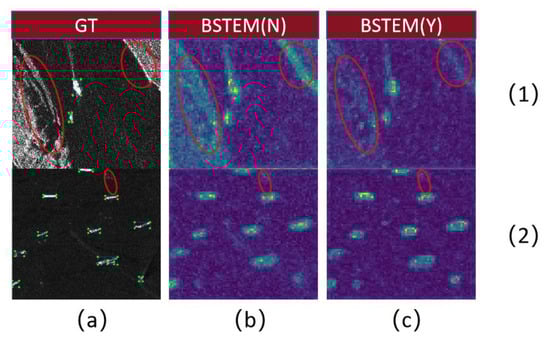 Figure 6. The backbone network output feature map. N means that the BSTEM was not included, and Y means that the BSTEM was included. (a) is the real prediction image; (b) is the output feature map without BSTEM module; (c) is the output feature map containing the BSTEM module; (1) Images from the SSDD dataset; (2) Images from the HRSID dataset.
 - (2)
- Visualization results for the FEAM: The FEAM consists of two parts: the HAM and the SAM. The SAM dynamically adjusts the attention distribution based on the input feature map, enabling the network to automatically focus on areas most likely to contain targets. The HAM effectively captures the edge information and contour features of the targets. Since the output of the backbone network contains more information, we concatenate the output features from the backbone network directly with the output from the neck through the FEAM. This approach effectively captures edge and contour information, enhancing the feature map’s focus on critical regions. As shown in Figure 7, the application of the FEAM significantly improves the network’s ability to focus on coastlines, while also enhancing its detection performance for the contours of medium and large vessels.
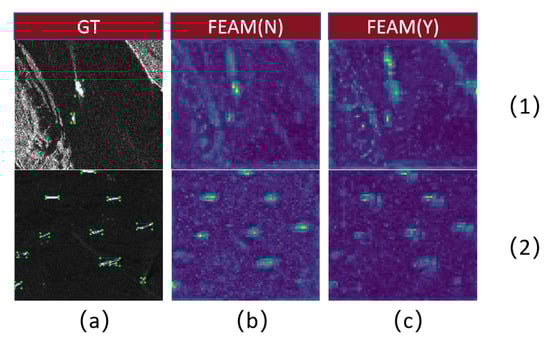 Figure 7. The neck output feature map. N means that the FEAM was not included, and Y means that the FEAM was included. (a) is the real prediction image; (b) is the output feature map without FEAM module; (c) is the output feature map containing the FEAM module; (1) Images from the SSDD dataset; (2) Images from the HRSID dataset.
In order to quantitatively evaluate the effectiveness of the FEAM, we compared it with other attention modules. Specifically, we replaced the FEAM with SA, SE, and CBAM modules and conducted experiments on the SSDD and HRSID. The experimental results, shown in Table 4, indicate that the network using the FEAM achieved the best performance in terms of the mAP, mAP50, and mAP75. Especially on the SSDD, DFENet with the FEAM achieved an mAP75 that was 1.3% higher than that of the second-best network (using the SA module). On the HRSID, DFENet with the FEAM also outperformed the second-best network (using the SE module) by 1.3% in terms of mAP75. These results demonstrate that the FEAM significantly improves detection performance and enhances localization accuracy in ship detection tasks compared to other attention modules.
Table 4.
A comparison of the results of different attention modules on the SSDD and HRSID.
To visually demonstrate the final detection results, Figure 8 presents the visualized outcomes. Images (1) and (2) were derived from the SSDD and HRSID, respectively, where (a) represents the original image, (b) shows the visualization results from the baseline network YOLOv8, and (c) illustrates the visualization results from DFENet. It is evident that the proposed network achieves a high level of accuracy in multi-object detection tasks.
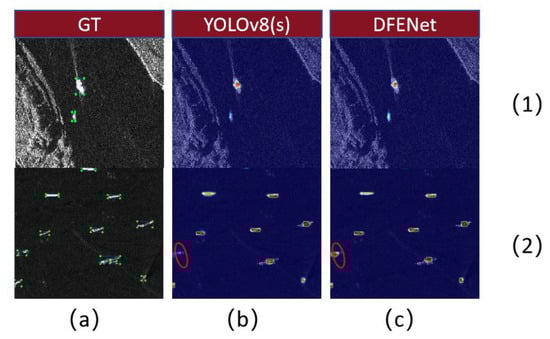
Figure 8.
A visualization results comparison. YOLOv8 (s) is the visualization result of the baseline network. DFENet is the visualization result of the proposed network. (a) is the real prediction image; (b) is the visual heat map of the baseline network YOLOV8. (c) is the visual heat map of the network DFENet. (1) Images from the SSDD dataset; (2) Images from the HRSID dataset.
3.4. Comparison of Inshore and Offshore
In this section, we divide the SSDD into nearshore and offshore scenes, and we perform both qualitative and quantitative comparisons between the proposed DFENet and the baseline network in these two scenarios.
The ship detection results for the offshore scene are presented in Table 5. The detection metrics of DFENet consistently outperform those of the baseline network, with notable improvements of 1.8% in mAP75 and 4.7% in APL. The visual comparison results for the offshore scene are shown in Figure 9. Due to the relatively open background in the offshore scene, both DFENet and the baseline networks are capable of detecting objects despite significant dynamic background interference. However, DFENet achieves superior confidence scores compared to the baseline network, indicating higher accuracy in object detection. Therefore, the proposed DFENet has higher accuracy in offshore scenarios.
Table 5.
Offshore ship detection results on SSDD.
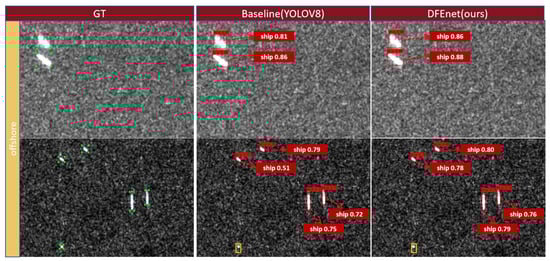
Figure 9.
Visualization results of ship detection for offshore datasets in SSDD. Red boxes are real boxes, yellow boxes are missed detections, and blue boxes are false alarms.
The detection results for the nearshore scene are shown in Table 6. DFENet slightly outperforms the baseline network in terms of mAP. However, the detection results for APS are 1.5% lower than those of the baseline network. This difference may be attributed to the small pixel size of small targets, which prevents the BSTEM from fully capturing their detailed features during the convolution process. On the other hand, DFENet achieves improvements of 1.3% and 9.9% over the baseline network in terms of APM and APL, respectively. The visual comparison results for the nearshore scene are shown in Figure 10. In the complex background of the nearshore scene, the baseline network suffers from missed detections for single targets. In densely arranged multi-target scenarios, DFENet exhibits a lower missed detection rate for tightly packed ships compared to the baseline network, and it also achieves superior confidence scores. Therefore, the proposed DFENet demonstrates high localization accuracy in complex nearshore scenes, particularly in handling small and densely arranged targets with greater robustness.
Table 6.
Inshore ship detection results on SSDD.
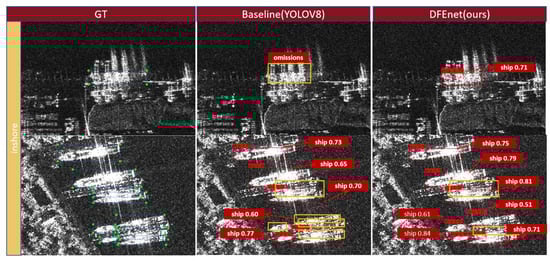
Figure 10.
Visualization results of ship detection for inshore datasets in SSDD. Red boxes are real boxes, yellow boxes are missed detections, and blue boxes are false alarms.
3.5. Comparison with Other Methods
In this section, we evaluate the performance of the proposed DFENet in comparison to several typical networks on two representative datasets, the SSDD and HRSID. The networks used for comparison include Faster R-CNN [30], SSD [37], RetinaNet [38], FCOS [39], EfficientDet [53], YOLOX [57], and the baseline network, YOLOv8 [58]. Table 7 presents the detection results of these methods on the SSDD. It is evident that the proposed method outperforms the other detection methods in terms of the mAP, mAP50, and mAP75 metrics. Specifically, in the mAP75 metric, DFENet achieves a 1.9% improvement over the next-best-performing network, FCOS, indicating that our model can achieve more accurate localization. Furthermore, in terms of the APM and APL metrics, DFENet demonstrates performance gains of 1.2% and 4.6%, respectively, compared to the next-best model, which can be attributed to the superior edge and contour extraction capabilities of our FEAM.
Table 7.
SAR ship detection results on the SSDD ship dataset.
The detection results on the HRSID are presented in Table 8. Although our mAP and mAP50 metrics are lower than those of the YOLOX network, our mAP75 metric surpasses that of YOLOX. This is mainly due to the fact that the YOLOX network performs well on easy-to-detect targets, but it performs poorly when IOU requirements are high, such as when targets are densely arranged or along the coast. In contrast, our proposed DFENet incorporates a BSTEM to reduce noise and utilizes an FEAM to enhance contour detection capabilities, enabling better target localization and bounding box prediction. However, we observe that the detection accuracy of DFENet for small ships (APS) is 44.6%, slightly lower than the 46.7% of YOLOX. This difference can be attributed to the smaller pixel size of small targets in images, which are more prone to interference from the background, leading to the BSTEM not fully capturing the details of small targets. While the detection accuracy of DFENet for small vessels is slightly lower than that of the YOLOX network, it demonstrates improvements of 1.2% and 10.3% in its detection accuracy for medium and large vessels, respectively. This indicates that our proposed method can significantly and effectively enhance detection performance for medium and large vessels in the case of insufficient numbers of medium and large ship samples for training.
Table 8.
SAR ship detection results on the HRSID ship dataset.
To facilitate a visual comparison of the detection results, we produced a visualization of the various methods, as illustrated in Figure 11. We selected images of different scenes such as ports, coastal areas, and open seas from the SSDD and HRSID and covered various ship sizes. In the visual test results, green boxes represent the ground-truth detection boxes, red boxes indicate the predicted boxes, blue boxes denote false positives, and yellow boxes indicate missed detections. The comparison results show that networks such as Faster R-CNN and SSD exhibit a significant number of missed detections when handling multiple and small targets. Additionally, in coastal or port scenes, these networks tend to mistakenly identify coastlines as vessels, resulting in false positives. In contrast, our proposed DFENet achieves more accurate localization and detection even in scenarios involving multiple target occlusions along coastlines or in port areas.
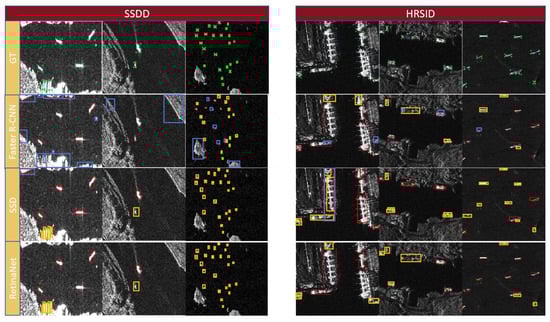
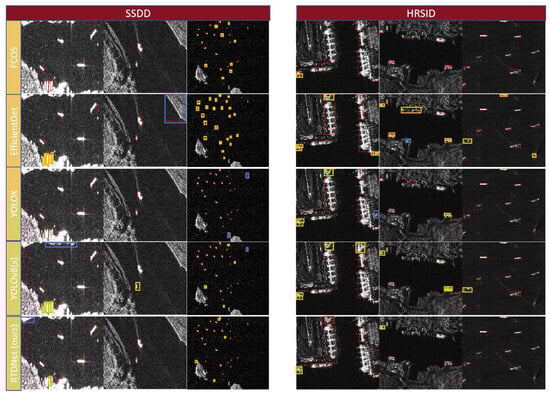
Figure 11.
Intuitive display of test results for different models. Red represents real box, yellow represents missed detection, and blue represents false detection.
However, as shown in Figure 11, there are still some limitations in the performance of DFENet on the SSDD, especially in offshore scenarios. When an island or other sea clutter is similar to ship targets, it is difficult for DFENet to effectively distinguish the small targets from the background interference signal, resulting in misclassification of the island or sea clutter as targets. In addition, in port scenes from the SSDD and HRSID, there are usually a large number of ships. These ships are small in spacing and similar in shape, which further increases the difficulty of detecting small ship targets and leads to a certain degree of false detection. These problems are consistent with our evaluation results, which indicate that the improvement in the mAP is not significant in certain scenarios. Although DFENet makes some progress in terms of overall performance, the suppression of background noise and the accuracy of target location still need to be further optimized in special scenarios with high density and small targets.
4. Discussion
This paper presents the DFENet model based on YOLOv8 for detecting SAR vessel targets in complex maritime environments. We designed the BSTEM to suppress background interference and enhance potential target features. We also designed the FEAM to effectively capture edge information and dynamically focus on critical regions, enhancing the localization accuracy of targets and predicted boxes.
We compared DFENet with other commonly used SAR target detection models and the baseline model. The results indicate that DFENet can further improve the accuracy of medium and large ship detection while maintaining the accuracy of small ship detection. For complex backgrounds such as coasts and ports, DFENet also shows superior performance.
However, the method we proposed also has certain limitations. In port environments, significant noise interference can lead to missed detections of densely packed small vessels. Additionally, when nearshore islands are similar in size to vessels, the system may generate false alarms. These challenges are common among most network models used for maritime detection in SAR imagery. To address these limitations, future research should further exploit the inherent features of SAR images to better handle challenging scenarios, thereby improving detection accuracy.
Author Contributions
Conceptualization, C.Y., C.L. and Y.Z.; Data curation, C.Y.; Formal analysis, C.Y.; Funding acquisition, Y.Z.; Investigation, C.Y.; Methodology, C.Y.; Project administration, Y.Z.; Resources, Y.Z.; Supervision, Y.Z.; Validation, C.Y.; Visualization, C.Y.; Writing—original draft, C.Y.; Writing—review and editing, C.Y. and C.L. All authors have read and agreed to the published version of the manuscript.
Funding
This research received no external funding.
Data Availability Statement
The raw data supporting the conclusions of this article will be made available by the authors on request. The original data presented in the study are openly available in github.
Conflicts of Interest
The authors declare that they have no known conflicts of interest.
References
- Silva-Llanca, L.; Ponce, C.V.; Araya, M.; Díaz, A.J. Optimization of an Organic Rankine Cycle Through a Control Strategy for Waste Heat Recovery. In Proceedings of the 17th IEEE Intersociety Conference on Thermal and Thermomechanical Phenomena in Electronic Systems (ITherm), San Diego, CA, USA, 29 May–1 June 2018; IEEE Press: Piscataway, NJ, USA, 2018; pp. 788–794. [Google Scholar]
- Chen, L.; Weng, T.; Xing, J.; Li, Z.; Yuan, Z.; Pan, Z.; Tan, S.; Luo, R. Employing deep learning for automatic river bridge detection from SAR images based on adaptively effective feature fusion. Int. J. Appl. Earth Obs. Geoinf. 2021, 102, 102425. [Google Scholar] [CrossRef]
- Zhang, F.; Meng, T.; Xiang, D.; Ma, F.; Sun, X.; Zhou, Y. Adversarial deception against SAR target recognition network. IEEE J. Sel. Top. Appl. Earth Obs. Remote Sens. 2022, 15, 4507–4520. [Google Scholar] [CrossRef]
- Zhu, X.; Tuia, D.; Mou, L.; Xia, G.; Zhang, L.; Xu, F. Deep learning in remote sensing: A comprehensive review and list of resources. IEEE Geosci. Remote Sens. Mag. 2017, 5, 8–36. [Google Scholar] [CrossRef]
- Li, X.; Liu, B.; Zheng, G.; Ren, Y.; Zhang, S.; Liu, Y.; Gao, L.; Liu, Y.; Zhang, B.; Wang, F. Deep-learning-based information mining from ocean remote-sensing imagery. Natl. Sci. Rev. 2020, 7, 1584–1605. [Google Scholar] [CrossRef]
- Di Martino, G.; Iodice, A.; Riccio, D.; Ruello, G. A novel approach for disaster monitoring: Fractal models and tools. IEEE Trans. Geosci. Remote Sens. 2007, 45, 1559–1570. [Google Scholar] [CrossRef]
- Meyer, F.; Hinz, S.; Laika, A.; Weihing, D.; Bamler, R. Performance analysis of the TerraSAR-X traffic monitoring concept. ISPRS J. Photogramm. Remote Sens. 2006, 61, 225–242. [Google Scholar] [CrossRef]
- Chaturvedi, S.K.; Yang, C.S.; Ouchi, K.; Shanmugam, P. Ship recognition by integration of SAR and AIS. J. Navig. 2012, 65, 323–337. [Google Scholar] [CrossRef]
- Wang, X.; Chen, C. Ship detection for complex background SAR images based on a multiscale variance weighted image entropy method. IEEE Geosci. Remote Sens. Lett. 2016, 14, 184–187. [Google Scholar] [CrossRef]
- Nitzberg, R. Constant-false-alarm-rate signal processors for several types of interference. IEEE Trans. Aerosp. Electron. Syst. 1972, AES-8, 27–34. [Google Scholar] [CrossRef]
- Migliaccio, M.; Nunziata, F.; Montuori, A.; Paes, R.L. Single-look complex COSMO-SkyMed SAR data to observe metallic targets at sea. IEEE J. Sel. Top. Appl. Earth Obs. Remote Sens. 2012, 5, 893–901. [Google Scholar] [CrossRef]
- Leng, X.; Ji, K.; Yang, K.; Zou, H. A bilateral CFAR algorithm for ship detection in SAR images. IEEE Geosci. Remote Sens. Lett. 2015, 12, 1536–1540. [Google Scholar] [CrossRef]
- Ai, J.; Cao, Z.; Mao, Y.; Wang, Z.; Wang, F.; Jin, J. An improved bilateral CFAR ship detection algorithm for SAR images in complex environments. Radar J. 2021, 10, 499–515. (In Chinese) [Google Scholar]
- Ai, J.; Tian, R.; Luo, Q.; Jin, J.; Tang, B. Multi-scale rotation-invariant Haar-like feature integrated CNN-based ship detection algorithm of multiple-target environment in SAR imagery. IEEE Trans. Geosci. Remote Sens. 2019, 57, 10070–10087. [Google Scholar] [CrossRef]
- Wang, X.; Zhu, D.; Li, G.; Zhang, X.; He, Y. Proposal-Copula-Based Fusion of Spaceborne and Airborne SAR Images for Ship Target Detection. Inf. Fusion 2022, 77, 247–260. [Google Scholar] [CrossRef]
- Liu, T.; Zhang, J.; Gao, G.; Yang, J.; Marino, A. CFAR ship detection in polarimetric synthetic aperture radar images based on whitening filter. IEEE Trans. Geosci. Remote Sens. 2019, 58, 58–81. [Google Scholar] [CrossRef]
- Yu, W.; Wang, Y.; Liu, H.; He, J. Superpixel-based CFAR target detection for high-resolution SAR images. IEEE Geosci. Remote Sens. Lett. 2016, 13, 730–734. [Google Scholar] [CrossRef]
- Kuang, C.; Wang, C.; Wen, B.; Hou, Y.; Lai, Y. An improved CA-CFAR method for ship target detection in strong clutter using UHF radar. IEEE Signal Process. Lett. 2020, 27, 1445–1449. [Google Scholar] [CrossRef]
- Zou, Z.; Chen, K.; Shi, Z.; Guo, Y.; Ye, J. Object detection in 20 years: A survey. Proc. IEEE 2023, 111, 257–276. [Google Scholar] [CrossRef]
- Tang, P.; Wang, X.; Bai, S.; Shen, W.; Bai, X.; Liu, W.; Yuille, A. PCL: Proposal Cluster Learning for Weakly Supervised Object Detection. IEEE Trans. Pattern Anal. Mach. Intell. 2020, 42, 172–191. [Google Scholar] [CrossRef]
- Zhou, Z.; Cui, Z.; Cao, Z.; Yang, J. Feature-transferable pyramid network for dense multi-scale object detection in SAR images. In Proceedings of the IGARSS 2022: 2022 IEEE International Geoscience and Remote Sensing Symposium, Kuala Lumpur, Malaysia, 17 July–22 July 2022; IEEE Press: Piscataway, NJ, USA, 2022; pp. 647–650. [Google Scholar]
- Baek, S.R.; Jang, J. A two-stage semi-supervised object detection method for SAR images with missing labels based on meta pseudo-labels. Expert Syst. Appl. 2024, 236, 121405. [Google Scholar] [CrossRef]
- Wang, W.; Zhou, T.; Porikli, F.; Crandall, D.; Gool, L.V. A survey on deep learning technique for video segmentation. IEEE Trans. Pattern Anal. Mach. Intell. 2022, 45, 7099–7122. [Google Scholar]
- Li, L.; Chen, J.; Su, X.; Han, H.; Fan, C. Deep learning network for indoor point cloud semantic segmentation with transferability. Autom. Constr. 2024, 168, 105806. [Google Scholar] [CrossRef]
- Wang, Q.; Mei, J.; Jiang, W.; Zhu, H. SHDM-NET: Heat map detail guidance with image matting for industrial weld semantic segmentation network. Eng. Appl. Artif. Intell. 2023, 126, 106946. [Google Scholar] [CrossRef]
- Minaee, S.; Kalchbrenner, N.; Cambria, E.; Nikzad, N.; Chenaghlu, M.; Gao, J. Deep learning–based text classification: A comprehensive review. ACM Comput. Surv. (CSUR) 2021, 54, 1–40. [Google Scholar] [CrossRef]
- Yauri-Lozano, E.; Castillo-Cara, M.; Orozco-Barbosa, L.; García-Castro, R. Generative Adversarial Networks for text-to-face synthesis & generation: A quantitative–qualitative analysis of Natural Language Processing encoders for Spanish. Inf. Process. Manag. 2024, 61, 103667. [Google Scholar]
- Giorgi, I.; Golosio, B.; Esposito, M.; Cangelosi, A.; Masala, G.L. Modeling multiple language learning in a developmental cognitive architecture. IEEE Trans. Cogn. Dev. Syst. 2020, 13, 922–933. [Google Scholar] [CrossRef]
- Girshick, R.; Donahue, J.; Darrell, T.; Malik, J. Rich feature hierarchies for accurate object detection and semantic segmentation. In Proceedings of the IEEE Conference on Computer Vision and Pattern Recognition (CVPR), Columbus, OH, USA, 23–28 June 2014; IEEE Press: Piscataway, NJ, USA, 2014; pp. 580–587. [Google Scholar]
- Ren, S.; He, K.; Girshick, R.; Sun, J. Faster R-CNN: Towards real-time object detection with region proposal networks. IEEE Trans. Pattern Anal. Mach. Intell. 2016, 39, 1137–1149. [Google Scholar] [CrossRef] [PubMed]
- He, K.; Zhang, X.; Ren, S.; Sun, J. Spatial pyramid pooling in deep convolutional networks for visual recognition. IEEE Trans. Pattern Anal. Mach. Intell. 2015, 37, 1904–1916. [Google Scholar] [CrossRef]
- Nie, X.; Duan, M.; Ding, H.; Hu, B.; Wong, E.K. Attention mask R-CNN for ship detection and segmentation from remote sensing images. IEEE Access 2020, 8, 9325–9334. [Google Scholar] [CrossRef]
- Lin, Z.; Ji, K.; Leng, X.; Kuang, G. Squeeze and excitation rank faster R-CNN for ship detection in SAR images. IEEE Geosci. Remote Sens. Lett. 2018, 16, 751–755. [Google Scholar] [CrossRef]
- Zeng, T.; Zhang, T.; Shao, Z.; Xu, X.; Zhang, W.; Shi, J.; Wei, S.; Zhang, X. CFAR-DP-FW: A CFAR-guided dual-polarization fusion framework for large-scene SAR ship detection. IEEE J. Sel. Top. Appl. Earth Obs. Remote Sens. 2024, 17, 7242–7259. [Google Scholar] [CrossRef]
- Li, L.; Yang, Z.; Jiao, L.; Liu, F.; Liu, X. High-resolution SAR change detection based on ROI and SPP net. IEEE Access 2019, 7, 177009–177022. [Google Scholar] [CrossRef]
- Chai, B.; Chen, L.; Shi, H.; He, C. Marine ship detection method for SAR image based on improved faster RCNN. In Proceedings of the 2021 SAR in Big Data Era (BIGSARDATA), Nanjing, China, 22–24 September 2021; IEEE Press: Piscataway, NJ, USA, 2021; pp. 1–4. [Google Scholar]
- Liu, W.; Anguelov, D.; Erhan, D.; Szegedy, C.; Reed, S.; Fu, C.Y.; Berg, A.C. SSD: Single Shot MultiBox Detector. In Proceedings of the Computer Vision–ECCV 2016: 14th European Conference, Amsterdam, The Netherlands, 11–14 October 2016; pp. 21–37. [Google Scholar]
- Lin, T. Focal Loss for Dense Object Detection. In Proceedings of the IEEE International Conference on Computer Vision (ICCV), Venice, Italy, 22–29 October 2017. [Google Scholar]
- Tian, Z.; Shen, C.; Chen, H.; He, T. FCOS: Fully Convolutional One-Stage Object Detection. In Proceedings of the 2019 IEEE/CVF International Conference on Computer Vision, Seoul, Republic of Korea, 27–28 October 2019. [Google Scholar]
- Redmon, J.; Divvala, S.; Girshick, R.; Farhadi, A. You Only Look Once: Unified, Real-Time Object Detection. In Proceedings of the 2016 IEEE Conference on Computer Vision and Pattern Recognition (CVPR), Las Vegas, NV, USA, 27–30 June 2016; IEEE Press: Piscataway, NJ, USA, 2016; pp. 779–788. [Google Scholar]
- Redmon, J.; Farhadi, A. YOLO9000: Better, Faster, Stronger. In Proceedings of the 2017 IEEE Conference on Computer Vision and Pattern Recognition (CVPR), Honolulu, HI, USA, 21–26 July 2017; IEEE Press: Piscataway, NJ, USA, 2017; pp. 6517–6525. [Google Scholar]
- Redmon, J. YOLOv3: An Incremental Improvement. arXiv 2018, arXiv:1804.02767. [Google Scholar]
- Yan, M.; Sun, J. A Dim-small Target Real-time Detection Method Based on Enhanced YOLO. In Proceedings of the 2022 IEEE International Conference on Electrical Engineering, Big Data and Algorithms (EEBDA), Changchun, China, 25–27 February 2022; IEEE Press: Piscataway, NJ, USA, 2022; pp. 567–571. [Google Scholar]
- Rai, M.C.; Giraldo, J.H.; Al-Saad, M.; Darweech, M.; Bouwmans, T. SemiSegSAR: A semi-supervised segmentation algorithm for ship SAR images. IEEE Geosci. Remote Sens. Lett. 2022, 19, 1–5. [Google Scholar]
- Zhao, W.; Syafrudin, M.; Fitriyani, N.L. CRAS-YOLO: A novel multi-category vessel detection and classification model based on YOLOv5s algorithm. IEEE Access 2023, 11, 11463–11478. [Google Scholar] [CrossRef]
- Zhao, T.; Feng, R.; Wang, L. SCENE-YOLO: A One-stage Remote Sensing Object Detection Network with Scene Supervision. IEEE Trans. Geosci. Remote Sens. 2025, 63, 1–15. [Google Scholar] [CrossRef]
- Chen, C.; He, C.; Hu, C.; Pei, H.; Jiao, L. A Deep Neural Network Based on an Attention Mechanism for SAR Ship Detection in Multiscale and Complex Scenarios. IEEE Access 2019, 7, 104848–104863. [Google Scholar] [CrossRef]
- Wang, R.; Shao, S.; An, M.; Li, J.; Wang, S.; Xu, X. Soft Thresholding Attention Network for Adaptive Feature Denoising in SAR Ship Detection. IEEE Access 2021, 9, 29090–29105. [Google Scholar] [CrossRef]
- Zhang, T.; Zhang, X.; Ke, X. Quad-FPN: A Novel Quad Feature Pyramid Network for SAR Ship Detection. Remote Sens. 2021, 13, 2771. [Google Scholar] [CrossRef]
- Zhou, Y.; Liu, H.; Ma, F.; Pan, Z.; Zhang, F. A Sidelobe-Aware Small Ship Detection Network for Synthetic Aperture Radar Imagery. IEEE Trans. Geosci. Remote Sens. 2023, 61, 5205516. [Google Scholar] [CrossRef]
- Zhang, T.; Zhang, X.; Ke, X.; Liu, C.; Xu, X.; Zhan, X.; Wang, C.; Ahmad, I.; Zhou, Y.; Pan, D.; et al. HOG-ShipCLSNet: A Novel Deep Learning Network with HOG Feature Fusion for SAR Ship Classification. IEEE Trans. Geosci. Remote Sens. 2021, 60, 5210322. [Google Scholar] [CrossRef]
- Lin, T.Y.; Dollár, P.; Girshick, R.; He, K.; Hariharan, B.; Belongie, S. Feature Pyramid Networks for Object Detection. In Proceedings of the IEEE Conference on Computer Vision and Pattern Recognition (CVPR), Honolulu, HI, USA, 21–26 July 2017; IEEE Press: Piscataway, NJ, USA, 2017; pp. 2117–2125. [Google Scholar]
- Tan, M.; Pang, R.; Le, Q.V. EfficientDet: Scalable and Efficient Object Detection. In Proceedings of the IEEE/CVF Conference on Computer Vision and Pattern Recognition (CVPR), Seattle, WA, USA, 13–19 June 2020; IEEE Press: Piscataway, NJ, USA, 2020; pp. 10781–10790. [Google Scholar]
- Zhao, Z.; Xia, C.; Xie, C.; Li, J. Complementary Trilateral Decoder for Fast and Accurate Salient Object Detection. In Proceedings of the 29th ACM International Conference on Multimedia, New York, NY, USA, 20–24 October 2021; ACM: New York, NY, USA, 2021; pp. 4967–4975. [Google Scholar]
- Zhang, T.; Zhang, X.; Li, J.; Xu, X.; Wang, B.; Zhan, X.; Xu, Y.; Ke, X.; Zeng, T.; Su, H.; et al. SAR Ship Detection Dataset (SSDD): Official Release and Comprehensive Data Analysis. Remote Sens. 2021, 13, 3690. [Google Scholar] [CrossRef]
- Wei, S.; Zeng, X.; Qu, Q.; Wang, M.; Su, H.; Shi, J. HRSID: A High-Resolution SAR Images Dataset for Ship Detection and Instance Segmentation. IEEE Access 2020, 8, 120234–120254. [Google Scholar] [CrossRef]
- Ge, Z. YOLOX: Exceeding YOLO Series in 2021. arXiv 2021, arXiv:2107.08430. [Google Scholar]
- Jocher, G.; Chaurasia, A.; Qiu, J. YOLO by Ultralytics [Internet]. 2023. Available online: https://github.com/ultralytics/ultralytics (accessed on 3 June 2024).
Disclaimer/Publisher’s Note: The statements, opinions and data contained in all publications are solely those of the individual author(s) and contributor(s) and not of MDPI and/or the editor(s). MDPI and/or the editor(s) disclaim responsibility for any injury to people or property resulting from any ideas, methods, instructions or products referred to in the content. |
© 2025 by the authors. Licensee MDPI, Basel, Switzerland. This article is an open access article distributed under the terms and conditions of the Creative Commons Attribution (CC BY) license (https://creativecommons.org/licenses/by/4.0/).