Article

Comprehensive Validation of MODIS-Derived Instantaneous Air Temperature and Daily Minimum Temperature at Nighttime

1
Beijing Satellite Navigation Center, Beijing 100085, China
2
State Key Laboratory of Spatial Datum, Xi’an 710054, China
3
State Key Laboratory of Climate System Prediction and Risk Management/Key Laboratory of Meteorological Disaster, Ministry of Education/Collaborative Innovation Center on Forecast and Evaluation of Meteorological Disasters, Nanjing University of Information Science and Technology, Nanjing 210044, China
4
State Key Laboratory of Resources & Environmental Information System, Institute of Geographic Sciences & Natural Resources Research, Chinese Academy of Sciences, Beijing 100101, China
5
Key Laboratory of Smart Earth, Xi’an 710077, China
*
Author to whom correspondence should be addressed.
Remote Sens. 2025, 17(10), 1732; https://doi.org/10.3390/rs17101732
Submission received: 9 April 2025 / Revised: 9 May 2025 / Accepted: 13 May 2025 / Published: 15 May 2025

Abstract

:
Nighttime near-surface air temperature is a critical input for ecological, hydrological, and meteorological models and the Moderate Resolution Imaging Spectroradiometer (MODIS)-derived instantaneous nighttime near-surface air temperature (Ta) and daily minimum temperatures (Tmin) can provide spatially continuous monitoring. The MOD07 Level-2 and MYD07 Level-2 atmospheric profile product provides air temperature at various altitude levels, facilitating a more direct estimation of Ta and Tmin. However, previous validations mainly focused on daytime, with a lack of validation for nighttime. Therefore, this study comprehensively evaluated the MOD07 Level-2 and MYD07 Level-2 derived Ta by 2168 hourly meteorological measurements over 5000 m altitude spanning in China. Furthermore, a detailed evaluation of their capability to estimate Tmin was also compared with MOD11 Level-2 and MYD11 Level-2 land surface temperature. Our results show that the highest available pressure method (HAP) estimated that, in instantaneous nighttime Ta, there was severe underestimation especially in high-altitude areas for both MOD07 (r = 0.95, Bias = −0.27 °C, and RMSE = 4.53 °C) and MYD07 data (r = 0.96, Bias = −0.17 °C, and RMSE = 3.73 °C). The adiabatic lapse rate (ALR) correction effectively reduced these errors, achieving optimal accuracy with MYD07 data (r = 0.97, Bias = −0.05 °C, and RMSE = 3.29 °C). However, the underestimation by the HAP method was still insufficient compared to Tmin estimation by land surface temperature (LST). The LST method offers improved accuracy (r = 0.98, Bias = −0.16 °C, RMSE = 2.89 °C). In general, MYD-based estimations consistently outperformed MOD-based estimations. However, seasonal and elevational variability was observed in all methods, with errors increasing notably in mountainous areas (RMSE rapidly increases to 5 °C and above when the altitude exceeds 2000 m). These findings can provide practical guidance for selecting appropriate inversion methods according to terrain and season and support the development of more accurate air temperature products for a range of climate- and environmental-related applications.

1. Introduction

Near-surface air temperature (Ta), typically measured at 2 m above the ground, is one of the most important meteorological variables associated with a wide range of applications, such as climate change, terrestrial hydrology, vegetation phenology, and environmental epidemiology [1,2]. Traditionally, meteorological stations provide Ta observations with high accuracy and temporal resolution, which is adequate for the above applications at the local scale. However, due to the lack of appropriate spatial coverage, such stations have a limited ability to capture the spatial variation of Ta in heterogeneous areas [3,4].
For these and other reasons, accurate and spatially distributed Ta information is urgently needed. Fortunately, satellite observations with wall-to-wall coverage offer great potential to meet this need [5]. Accordingly, continuous efforts have been made to retrieve Ta from various satellite observations over the last few decades. These remote sensing-based Ta retrieval approaches, which broadly classify these approaches into three types, including the temperature–vegetation index (TVX) method, the energy balance method, and the commonly used statistical method [6,7,8,9]. LST retrieved from thermal infrared remote sensing serves as the primary predictor for Ta across all three approaches due to its strong physical relationship with near-surface air temperature [5,10]. The TVX method is based on the negative correlation relationship between the LST and vegetation index (VI), and Ta is assumed to be in equilibrium with the LST of a fully vegetated canopy [11], and the energy balance method links them through surface flux calculations, the statistical method directly establishes LST-Ta regression models [7,12]. This universal reliance on LST has made MODIS data, with its global coverage and high temporal resolution, the most widely used source for Ta estimation.
Besides the LST product, MODIS also provides an atmospheric profile product, which has shown promising potential for estimating Ta independently from ancillary ground observations in recent studies [8,13,14,15]. Specifically, this product provides temperature profiles at 20 vertically distributed atmospheric pressure levels. The temperature at the highest available pressure level was adopted directly as the proxy for Ta at screen level height to estimate net radiation over large heterogeneous areas [16]. The same strategy was adopted to investigate the sensitivity of global terrestrial ecosystems to climate variability [17]. However, due to the difference between the highest available pressure and near-surface pressure in the MODIS atmospheric profile product, related studies have questioned the validity of this approach in areas with heterogeneous terrain [18,19]. Consequently, the interpolation technique developed based on the hydrostatic atmosphere assumption has become the most frequently used method to retrieve Ta from MODIS atmospheric profile product [20,21,22]. Famiglietti verified its application at the global scale based on measurements from 109 ground meteorological stations over a 14-year record [14]. The results confirm the validity of the MODIS atmospheric profile product for large scale Ta estimation, with R2 = 0.89, root-mean-square error (RMSE) = 3.47 °C, and bias = −0.19 °C.
In recent years, machine learning techniques (such as random forests, neural networks, etc.) have made remarkable progress in Ta in combination with remote sensing data [23,24,25,26]. These data-driven methods can effectively capture the complex nonlinear relationship between satellite observations and surface parameters, especially showing unique advantages when dealing with spatially continuously distributed temperature fields. However, such methods usually require a vast amount of training data covering different climate zones and terrain features, and there are obvious limitations in the accuracy of temperature inversion under the condition of attenuation of thermal infrared signals at night. In view of these constraints and considering the advantages of the physical mechanism model in terms of process interpretability and diurnal consistency, this study opts to adopt the traditional method for systematic evaluation.
Although both MODIS LST and atmospheric profile products have been widely adopted for Ta estimation in previous studies, these products are quite different in physical meanings, magnitude, retrieval algorithms, response to atmospheric conditions, and diurnal phase. A comprehensive comparison of their performance is essential for selecting the most suitable Ta proxy as well as developing Ta retrieval methods step forward. According to related studies, the performance of remote sensing-based Ta retrieval approaches varies greatly in a diurnal cycle [27,28,29]. As for LST product, Ta estimation during the nighttime is considered simpler due to the absence of the solar radiation effects on the thermal infrared signal [30,31,32]. By contrast, the complex interaction of the surface energy balance system during the daytime makes retrieving Ta from LST far from straightforward [33]. Consequently, previous LST-based studies are mostly focused on the daytime lapse rate between LST and Ta as well as its influencing factors. The same situation holds true for the MODIS atmospheric profile product. As we mentioned above, this product has been applied to daytime Ta estimation at global and continental scales [14,34,35]. However, to the best of our knowledge, its applicability to the nighttime Ta estimation has never been analyzed, not to mention its performance comparison with LST product.
Against this backdrop, although the estimation of Ta from MODIS products has been copiously studied, two questions have still not been comprehensively addressed. First, considering MODIS atmospheric profile product, current commonly used parameterization schemes are basically targeted at daytime Ta retrieval. Are they applicable to nighttime Ta estimation? Although many studies have focused on air temperature (Ta) retrieval using MODIS data, most of them concentrate on daytime conditions due to the relatively abundant solar radiation. However, nighttime Ta estimation presents unique challenges and has been comparatively understudied. Specifically, the thermal structure of the lower atmosphere at night is more stable and often influenced by surface inversion layers, which can weaken the correlation between land surface temperature (LST) and near-surface Ta. While some studies have suggested that MODIS LST performs reasonably well at night [34,36], few have systematically compared it with atmospheric profile products in this context. These gaps highlight the need for more targeted assessments of nighttime Ta retrieval performance, particularly under diverse climatic and topographic conditions. Second, previous studies suggest that the MODIS LST product is accurate enough to capture the spatial–temporal patterns of nighttime Ta, is the accuracy comparable to that achieved by the atmospheric profile product? Specifically, two MODIS sensors onboard Terra and Aqua satellites provide twice nighttime observations per day. To answer the two questions raised above, this study intends to present a comprehensive evaluation of two MODIS LST products and two atmospheric profile products for nighttime Ta estimation. Special focus is given to understanding how well nighttime Ta can be retrieved from MODIS products without the ancillary of ground-based observations. Mainland China is selected as our study area as it provides an ideal study area with its unique combination of five distinct climate types, dramatic elevation gradients exceeding 5000 m, and an extensive network of 2168 hourly meteorological stations. This exceptional environmental diversity enables a comprehensive evaluation of temperature retrieval algorithms across representative global conditions. The wide range of climatic and topographic conditions ensures that the findings have broad applicability to different geographical settings.

2. Study Area and Data

2.1. Study Area

The terrain landscape of Mainland China is complex where mountains, plateaus, and hills consist of nearly 70 percent of the land surface [37]. In geography, China is usually divided into three steps from east to west with 5000 m altitudes (Figure 1). In addition, it covers an area of about 9.6 million square kilometers, spanning 62 degrees in longitude and nearly 50 degrees in latitude. The tremendous span of latitude, longitude, and altitude form its diverse climate, ranging from tropical to subarctic from the far south to the far north and alpine climate in the Tibetan Plateau [38,39]. Mainland China can be divided into nine major agricultural regions according to climatic conditions and topography (Figure 1). It consists of the Northeast China Plain (NEP), the Northern arid and semiarid (NAS) region, the Huang–Huai–Hai (HHH) Plain, the Loess Plateau (LP), the Qinghai Tibet Plateau (TP), the Middle-lower Yangtze Plain (YRML), the Sichuan Basin and surrounding regions (SB), the Yunnan–Guizhou Plateau (YGP), and Southern China (SC). The adoption of agricultural regionalization in this study is scientifically justified because these divisions inherently reflect the complex interactions between climatic conditions and topographic features that directly influence air temperature patterns. As these agricultural zones were originally delineated based on long-term climatic characteristics and geographic factors, they naturally capture the key determinants of Ta variability.

2.2. Satellite Data

The MODIS LST products of MOD11_L2 and MYD11_L2 and atmospheric profile products of MOD07_L2 and MYD07_L2, were processed from 2013 to 2017 for nighttime overpasses. The standard ‘MOD’ and ‘MYD’ indicate Terra and Aqua, respectively. Both MODIS LST products and atmospheric profile products are in 5 min temporal increments of satellite acquisition, which can ensure the consistency in extraction time at meteorological stations [40]. The MODIS LST was retrieved in a pixel size of ±1 km based on a refined generalized split-window algorithm, and the mean LST error is less than 1 K. The atmospheric temperature profile data were retrieved at 20 discrete pressure levels a pixel size of 5 km based on clear-sky synthetic regression retrieval algorithm, and the mean retrieval error was ~1 K–~2 K at 700 hPa–1000 hPa [41,42]. To address spatial mismatching during validation, each station’s location was matched to the nearest MODIS pixel by transforming satellite swath data from sinusoidal projection to geographic coordinates using GDAL 3.4.3 and Python 3.11.5. The original pixel value at the station’s exact location was directly extracted without interpolation or resampling, in order to avoid introducing additional spatial errors.

2.3. Meteorological Observations

For validation purposes, 2168 hourly meteorological stations from 2013 to 2017 were involved, which was provided by the National Meteorological Information Center, China Meteorological Administration (NMIC/CMA). These meteorological stations are distributed across Mainland China with an elevation span of over 5000 m (Figure 1). The high-density ground meteorological measurement networks provided a critical opportunity for the validation of instantaneous Ta and Tmin estimated from satellite data, as well as the analysis of influencing factors.

3. Methodology

In this study, our objective was to comprehensively evaluate the instantaneous nighttime Ta estimation and the Tmin estimation based on two MODIS LST products (MOD11_L2 and MYD11_L2) and two atmospheric profile products (MOD07_L2 and MYD07_L2). The MODIS products used in this study were developed by the National Aeronautics and Space Administration (NASA), United States, and can be accessed from the NASA LAADS DAAC portal (https://ladsweb.modaps.eosdis.nasa.gov/search/, accessed on 12 May 2025). Consequently, depending on the satellite data involved, the retrieval methods can be broadly divided into two categories, including extraction from land surface temperature and reconstruction of atmospheric profile. The following are the methods for inversion and accuracy calculation.

3.1. Reconstruction of Atmospheric Profile

MOD07_L2 and MYD07_L2 temperature profiles were retrieved at 20 discrete pressure levels (5, 10, 20, 30, 50, 70, 100, 150, 200, 250, 300, 400, 500, 620,700, 780, 850, 920, 950, and 1000 hPa). In theory, the temperature at the highest available pressure level (hereafter, named HAP) can be used as a direct substitute for Ta [16,17]. The HAP method generally underestimated instantaneous Ta in the daytime and, therefore, its applicability for Tmin estimates was also assessed. The mathematical formulas of Ta and Tmin can be written as follows:
T a , H A P = T a H 1
T m i n , H A P = T a H 1
where Ta,HAP and Tmin,HAP represent instantaneous near-surface air temperature and daily minimum near-surface air temperature by HAP method, respectively. T a H 1 means the atmosphere temperature at the highest available pressure.
The ALR method, grounded in the hydrostatic atmospheric assumption of the troposphere, offers distinct advantages over alternative approaches such as the Hypsometric Equation (HE) [43]. While both methods interpolate using data from two adjacent pressure layers, ALR’s incorporation of adiabatic process constraints avoids the systematic biases characteristic of HE in complex terrains. Previous studies found that that HE requires discarding 7.2% of observations as outliers, while the ALR method was shown to reduce deviations by 0.5–1.2 K above 2500 m elevation [14,34]. The adiabatic lapse rate can be obtained from the air temperatures at the two highest available pressures:
A L R = T a H 2 T a H 1 Δ H = ρ g T a H 2 T a H 1 P H 2 P H 1
where ∆H is the difference in height of the two pressure levels, ρ means the density of the air, g means the gravitational acceleration, PH2 and PH1 represent two pressure levels, and T a H 2 is analogous with T a H 1 , but for the air temperature at PH2.
Further, the ALR can be applied to surface pressure level (PS) as the following:
T a , A L R = T a H 1 + A L R ρ g P S P H 1 = T a H 1 + T a H 2 T a H 1 p H 2 P H 1 × P S P H 1
where Ta,ALR represents instantaneous near-surface air temperature retrieved based on the ALR method.

3.2. Extraction from Land Surface Temperature

At the local scale, in the Qaidam region of China, MODIS LST product aboard on Terra can provide a good estimate of daily near-surface minimum temperature [33]. In addition to Terra LST product, this study also focusses on Aqua LST product crossing the entirety of mainland China. The mathematical formulas of Tmin retrieval can be written as follows:
T m i n , L S T = T s
where Tmin,LST represents daily minimum near-surface air temperature obtained from MODIS LST product (Ts).

3.3. Validation and Comparison Framework

The surface temperatures extracted by the three methods will be matched with the temperature of the station on that day according to the date, and the observed values of the station will be taken as the true values and compared with the estimated values. Among them, the closest observation of gauges with overpass time of MODIS was matched and the maximum time difference was restricted within 1 h for the instantaneous MODIS-derived Ta. Three statistical metrics, the correlation coefficient (r), the relative bias (B), and the root mean square error (RMSE), are adopted to assess quantitatively the retrieval accuracy and the model performance was comprehensively measured from the perspectives of trend consistency, systematic deviation and error scale, respectively. These indicators have been widely applied in the model validation work in fields such as remote sensing, atmosphere, and hydrology.
The three formulas for assessing quantitatively are as follows:
r = i = 1 n x i x y i y i = 1 n x i x 2 i = 1 n y i y 2
B i a s = 1 n i = 1 m y i g ^ k
R M S E = 1 n i = 1 n y i y ^ i 2
where the r assesses the linear relationship. Bias indicates the average deviation between estimated and observed values and RMSE measures the overall error magnitude.

4. Results

4.1. Overall Performance of Instantaneous Ta and Tmin Estimation

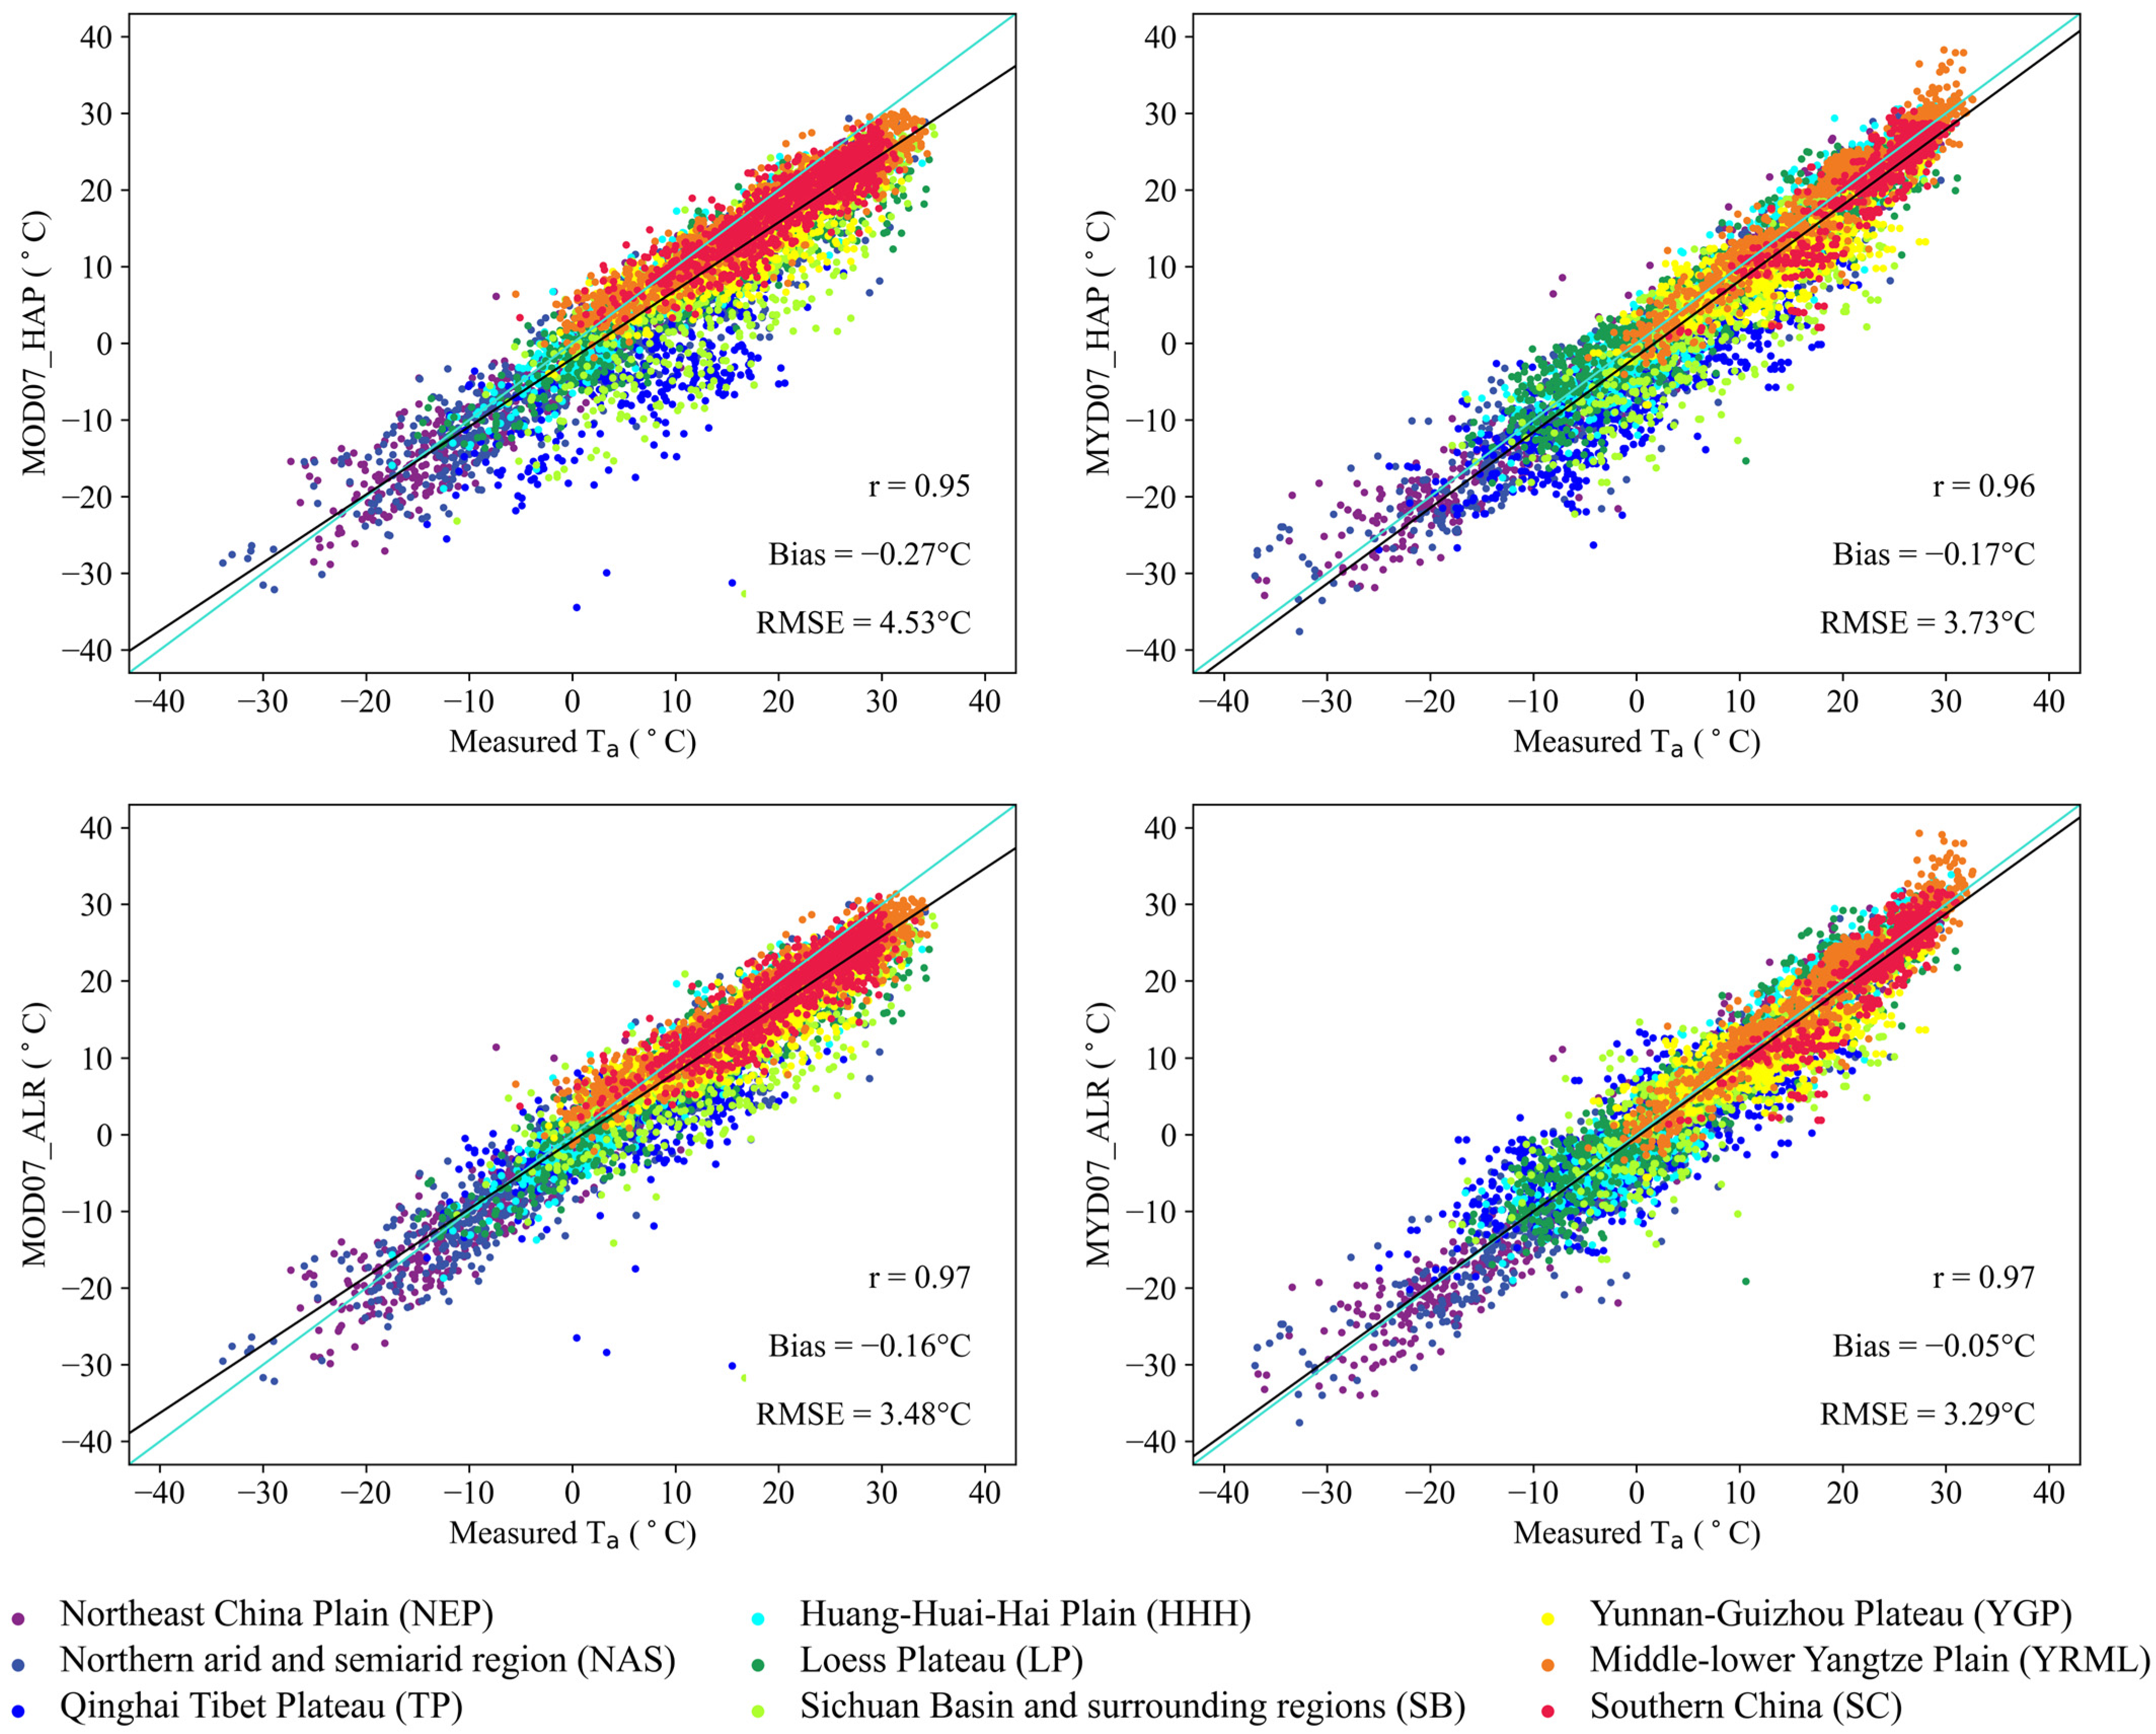
Figure 2 illustrates the overall accuracy of instantaneous nighttime Ta retrievals obtained by the HAP and ALR methods. The results indicated that the HAP method exhibited relatively low accuracy, showing a significant underestimation. The estimation based on MOD07 data showed a performance with r = 0.95, Bias = −0.27 °C, and RMSE = 4.53 °C. In contrast, the estimation using MYD07 data demonstrated an improved accuracy, with r = 0.96, Bias = −0.17 °C, and RMSE = 3.73 °C. The ALR method mitigated this underestimation through hydrostatic interpolation, achieving an accuracy of r = 0.97, Bias = −0.16 °C, RMSE = 3.48 °C when using MOD07 data. The ALR method demonstrated even higher accuracy using MYD07 data, with r = 0.97, Bias = −0.05 °C, and RMSE = 3.29 °C. These results indicate that the ALR method combined with MYD07 data provides the most reliable estimation of instantaneous nighttime Ta across the studied regions. The comparison revealed that regions with lower accuracy were mainly concentrated at the TP and the NAS. At the TP, the HAP method exhibited a clear underestimation when using both MOD07 and MYD07 data, with scattered points deviating below the 1:1 diagonal line and a large number of anomalies. This underestimation is particularly evident in high-elevation or arid regions like the TP and NAS, where atmospheric vertical structures are complex. In contrast, regions such as SC, YRML, and HHH showed less systematic bias, suggesting more stable retrieval conditions there. In contrast, the NAS exhibited smaller errors compared to at the TP. The ALR method performed better in both regions by mitigating the underestimation. The accuracy at the NEP, SB, YGP, and LP also showed relatively large errors. The accuracy retrieved from the HAP method based on MYD07 data was significantly higher than that based on MOD07 data in the above three regions. The ALR method further improved the corresponding performance. Both the HAP and ALR methods achieved good performances in the SC, YRML, and HHH regions. Notably, the ALR method with MYD07 data produced a better performance.
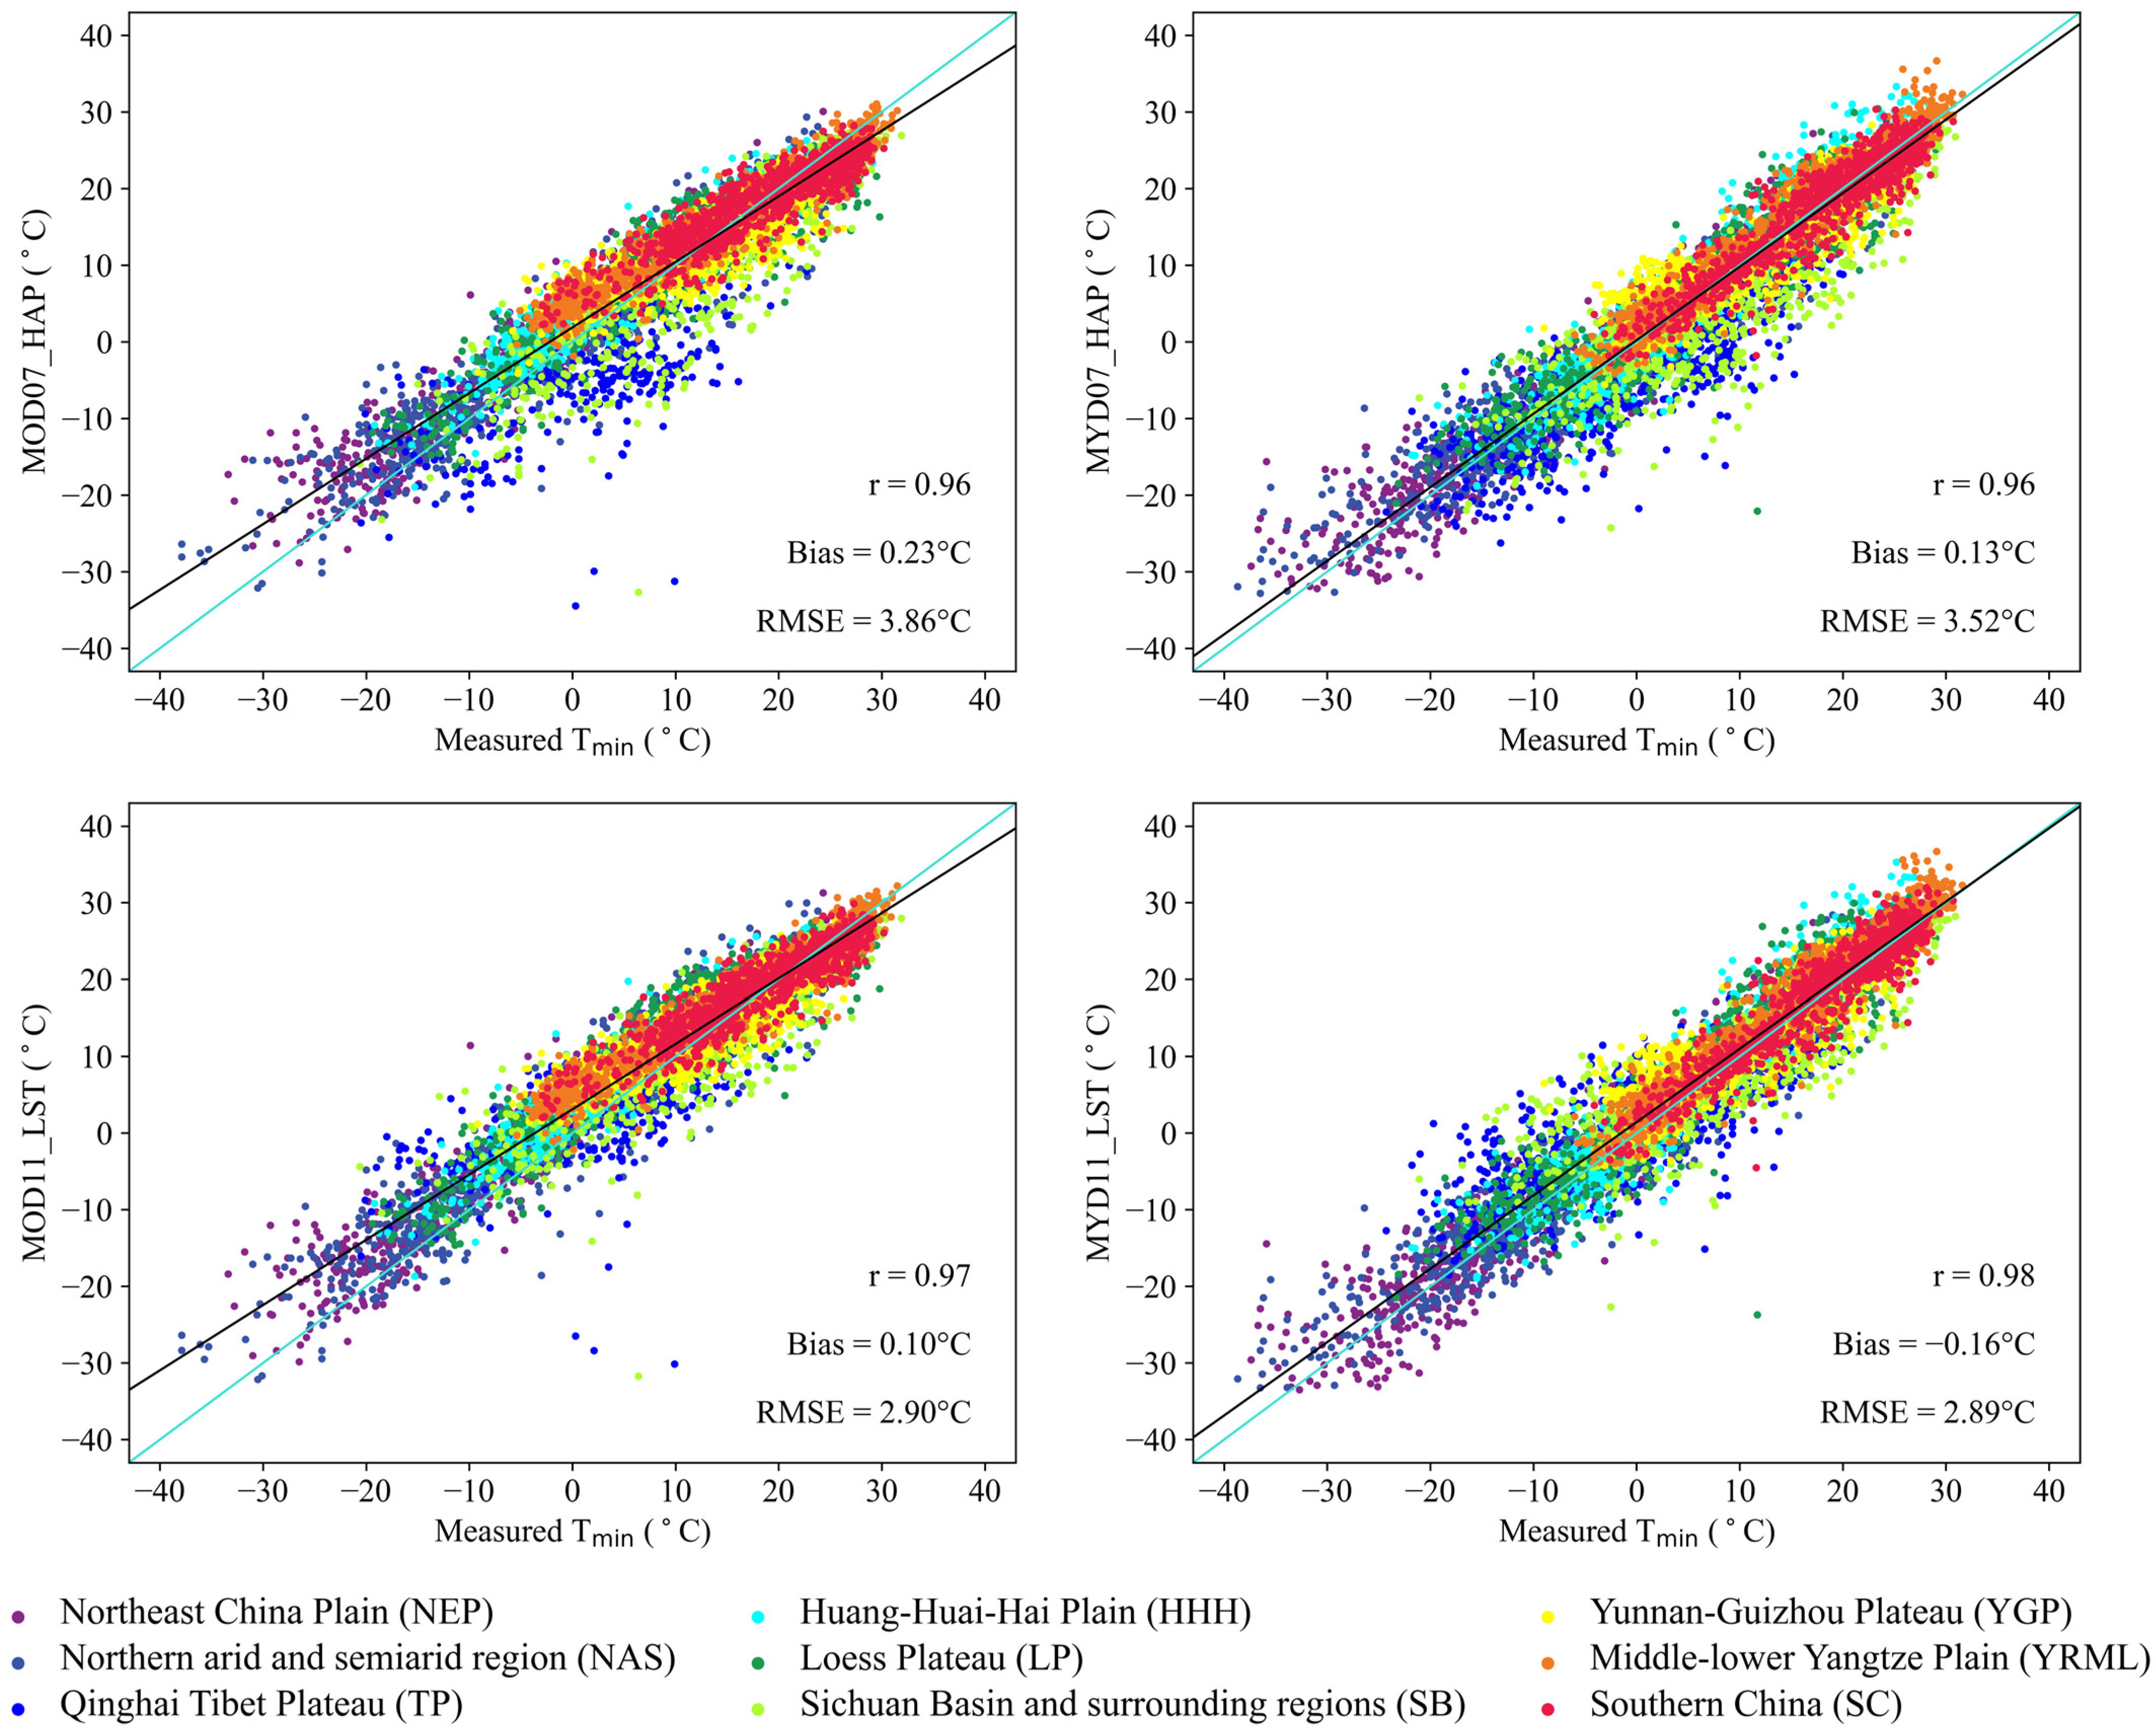
Since the HAP method was observed to underestimate the instantaneous Ta, it was assumed that using the HAP method to estimate the Tmin would yield closer results to the actual values. Figure 3 illustrates the overall accuracy of Tmin retrievals obtained by the HAP and LST methods. It was shown that the accuracy of the HAP method was lower than that of the LST method. The estimation based on MOD07 and MYD07 data, respectively, showed the performance with r = 0.96, Bias = 0.23 °C, and RMSE = 3.86 °C and r = 0.96, Bias = 0.13 °C, and RMSE = 3.52 °C. In contrast, the LST method showed overall lower error. The estimation accuracy based on MOD11 and MYD11 data was with respective results of r = 0.97, Bias = 0.10 °C, and RMSE = 2.90 °C and r = 0.98, Bias = −0.16 °C, and RMSE = 2.89 °C. The lower accuracies for all methods and input data were still concentrated at the TP and the NAS region. The accuracy in the NEP, SB, YGP, and LP regions showed smaller errors compared to the two regions mentioned above. In the regions of the SC, YRML, and HHH, the HAP and LST methods performed the best. The results indicated a consistent trend that the accuracy based on MYD07 data was higher than that based on MOD07 data no matter for the HAP or the LST method. Overall, while the HAP method tended to slightly overestimate Tmin, especially in flat and humid regions, the LST method showed reduced bias and better spatial consistency, making it more suitable for Tmin estimation in diverse agricultural zones.

4.2. Spatial Distribution of Errors

Figure 4 illustrates the spatial distribution of accuracy for instantaneous nighttime Ta retrievals obtained using the HAP and ALR methods based on MOD07 and MYD07 data. Overall, the estimation accuracy using MYD07 data was superior to that of MOD07 data using the same method. Furthermore, the ALR method outperformed the HAP method when utilizing the same data source. Both methods and data inputs exhibited similar error patterns, showing a decline in accuracy from the flat eastern regions to the towering Tibetan Plateau. Notably, in the high-altitude western regions, the HAP method led to significant underestimation regardless of using MOD07 or MYD07 data. This underestimation was effectively corrected through the ALR method. For example, after the ALR correction based on MYD07 data, the performance on the TP shifted from underestimation of HAP to overestimation. At the NEP, YGP, SC, and LP region, the HAP method still displayed marked underestimation when using MOD07 data. In contrast, utilizing MYD07 data resulted in significant improvements, particularly in the SB region. In lower altitude areas such as the SC, YRML, and HHH, the accuracy was relatively high. The corrective impact of the ALR on the HAP method decreased in these regions. Despite this, the retrieval accuracy based on MYD07 data remained consistently higher than that of MOD07 data.
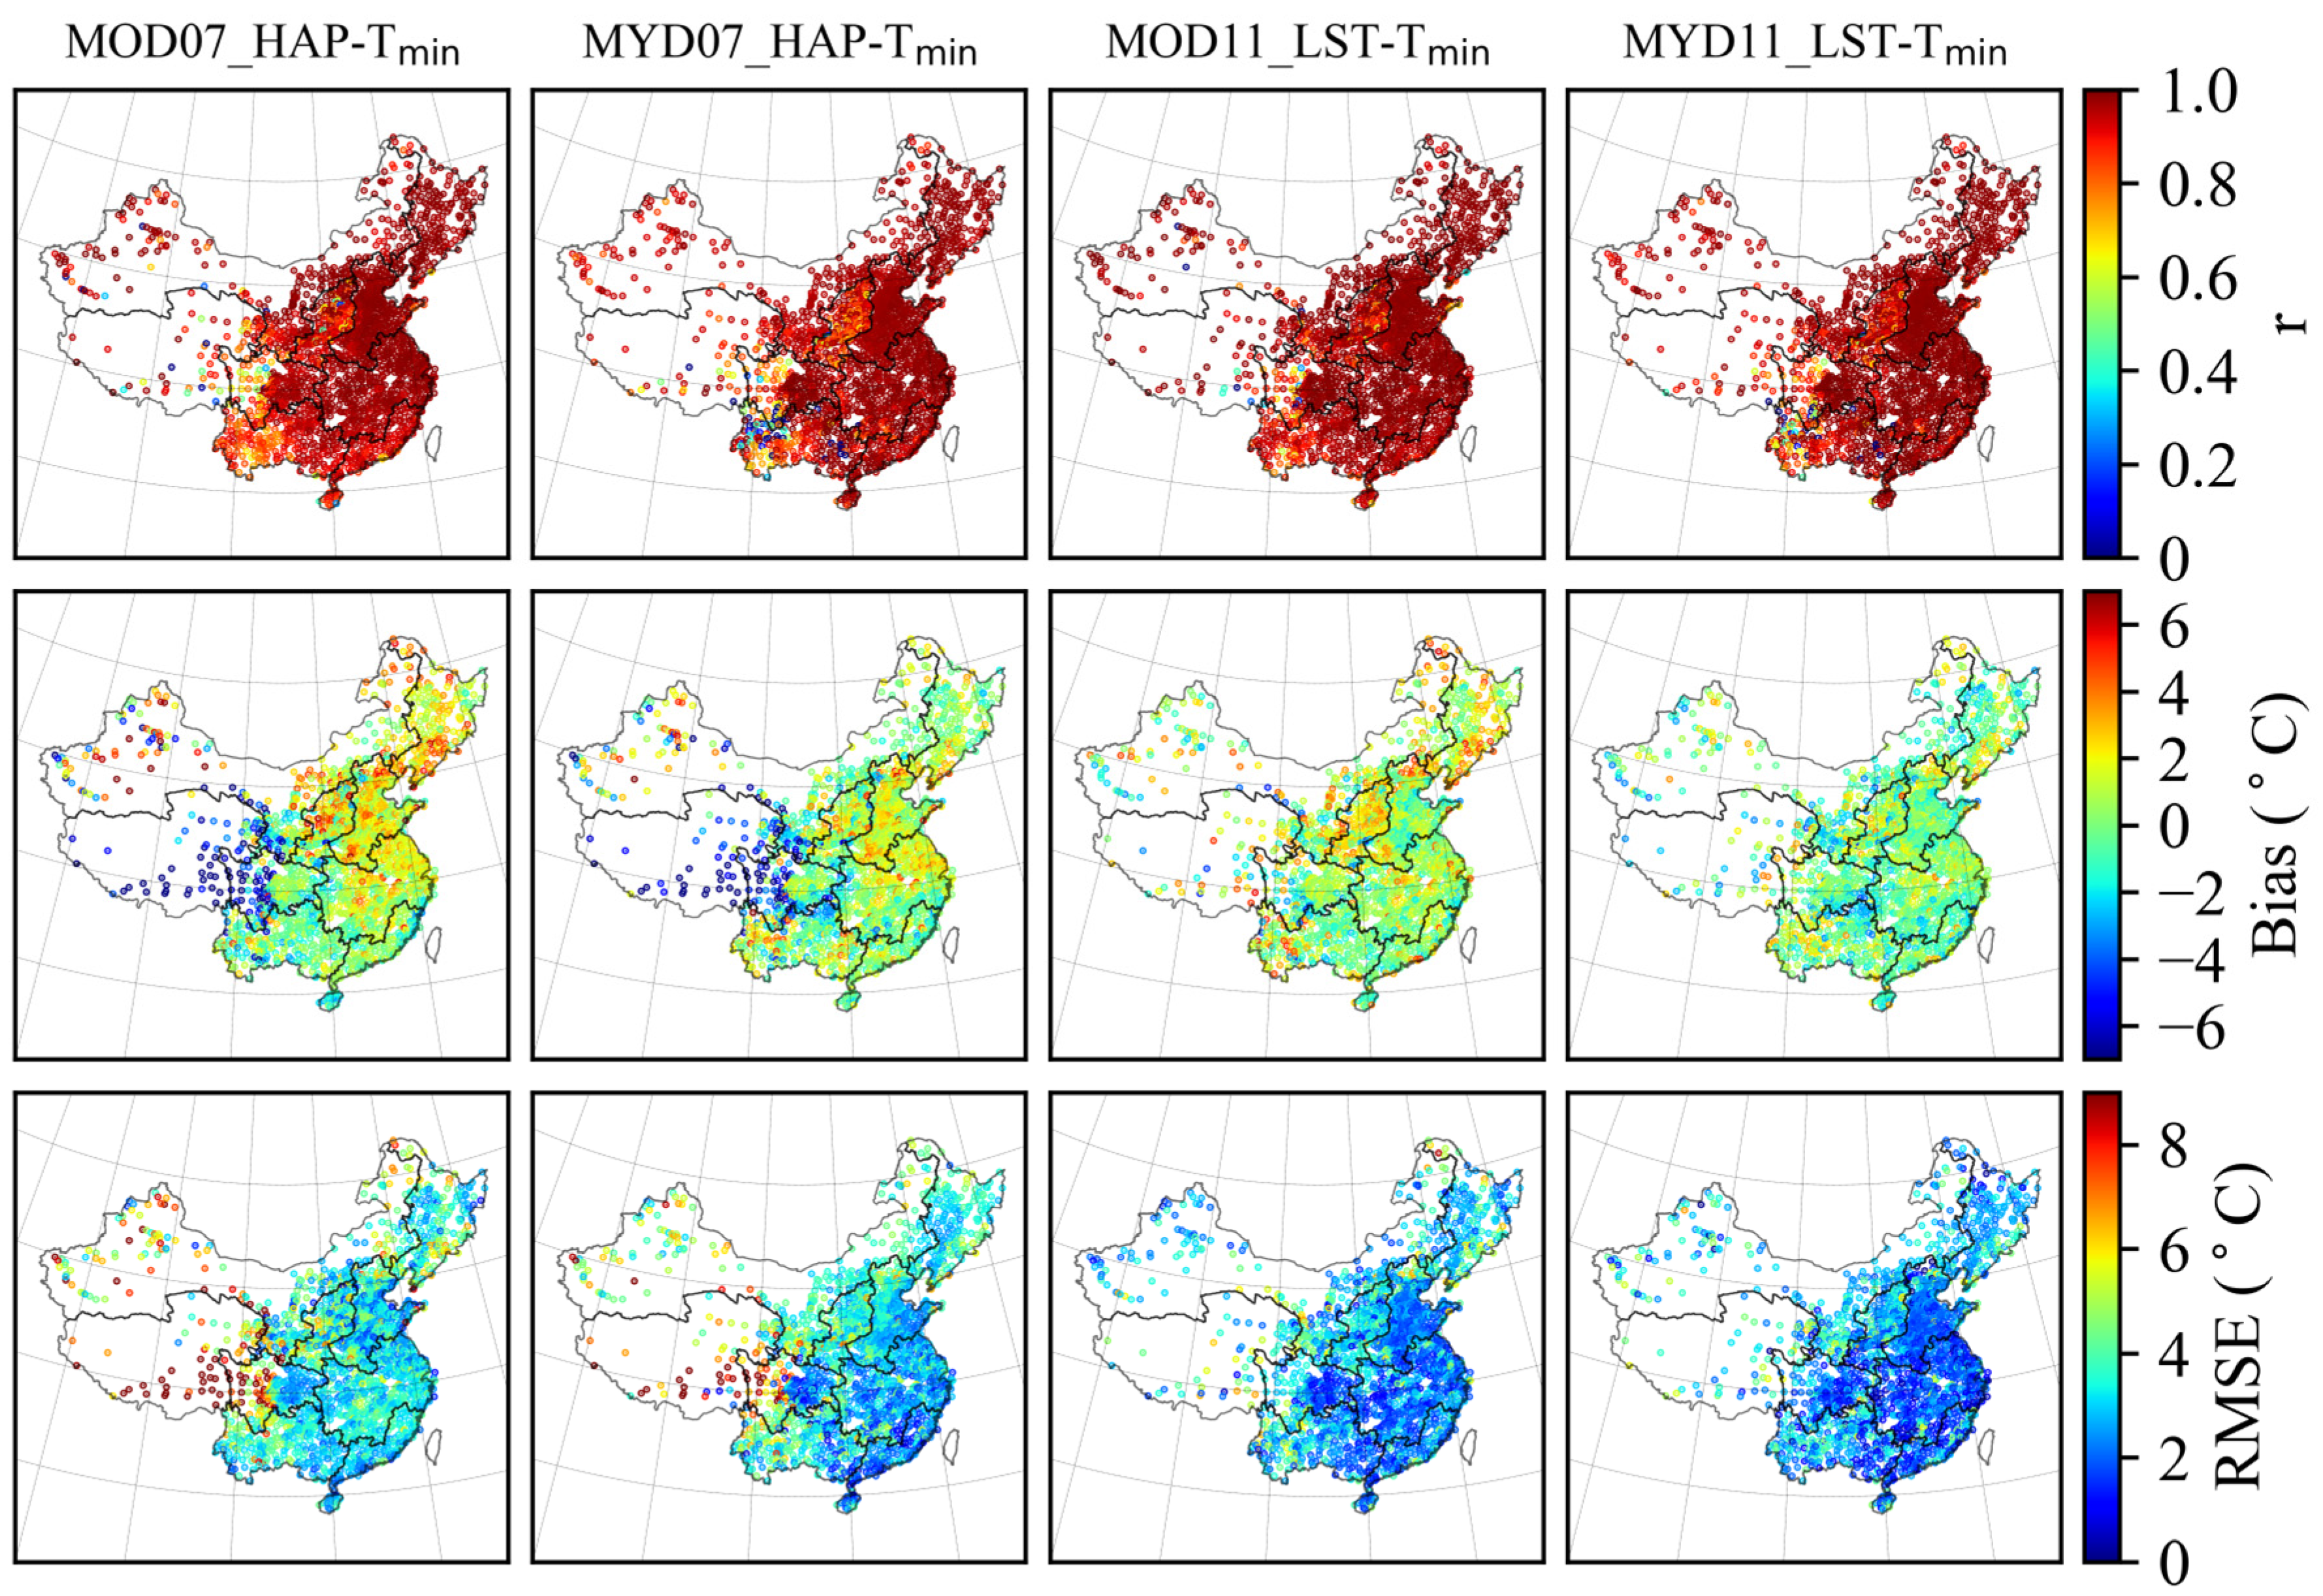
Figure 5 illustrates the spatial distribution of the accuracy of Tmin retrievals obtained by the HAP and LST methods. Overall, the LST method outperformed the HAP method across all regions, with MYD11 data providing better accuracy than MOD11 data. The LST method showed more consistent performance, especially in high-altitude regions. In the TP and NAS regions, the HAP method exhibited significant underestimation when using whether MOD07 data or MYD07 data, which was corrected using the LST method. In the NEP and LP, the HAP method tended to overestimate Tmin, while in the SB and YGP, it underestimated. The MYD07 data alleviated the overestimation in the NEP and LP. In contrast, the LST method performed well across these areas, with only slight overestimation. Notably, when MYD11 data were used, the overestimation was mitigated, leading to the best overall performance. In the lower elevation areas, such as the SC, the YRML, and the HHH, both methods performed well. However, the HAP method still exhibited some overestimation, while the LST method provided more accurate estimates. Furthermore, MYD11 data consistently yielded higher accuracy than MOD11 data in these regions.

4.3. Seasonal Analysis of Errors

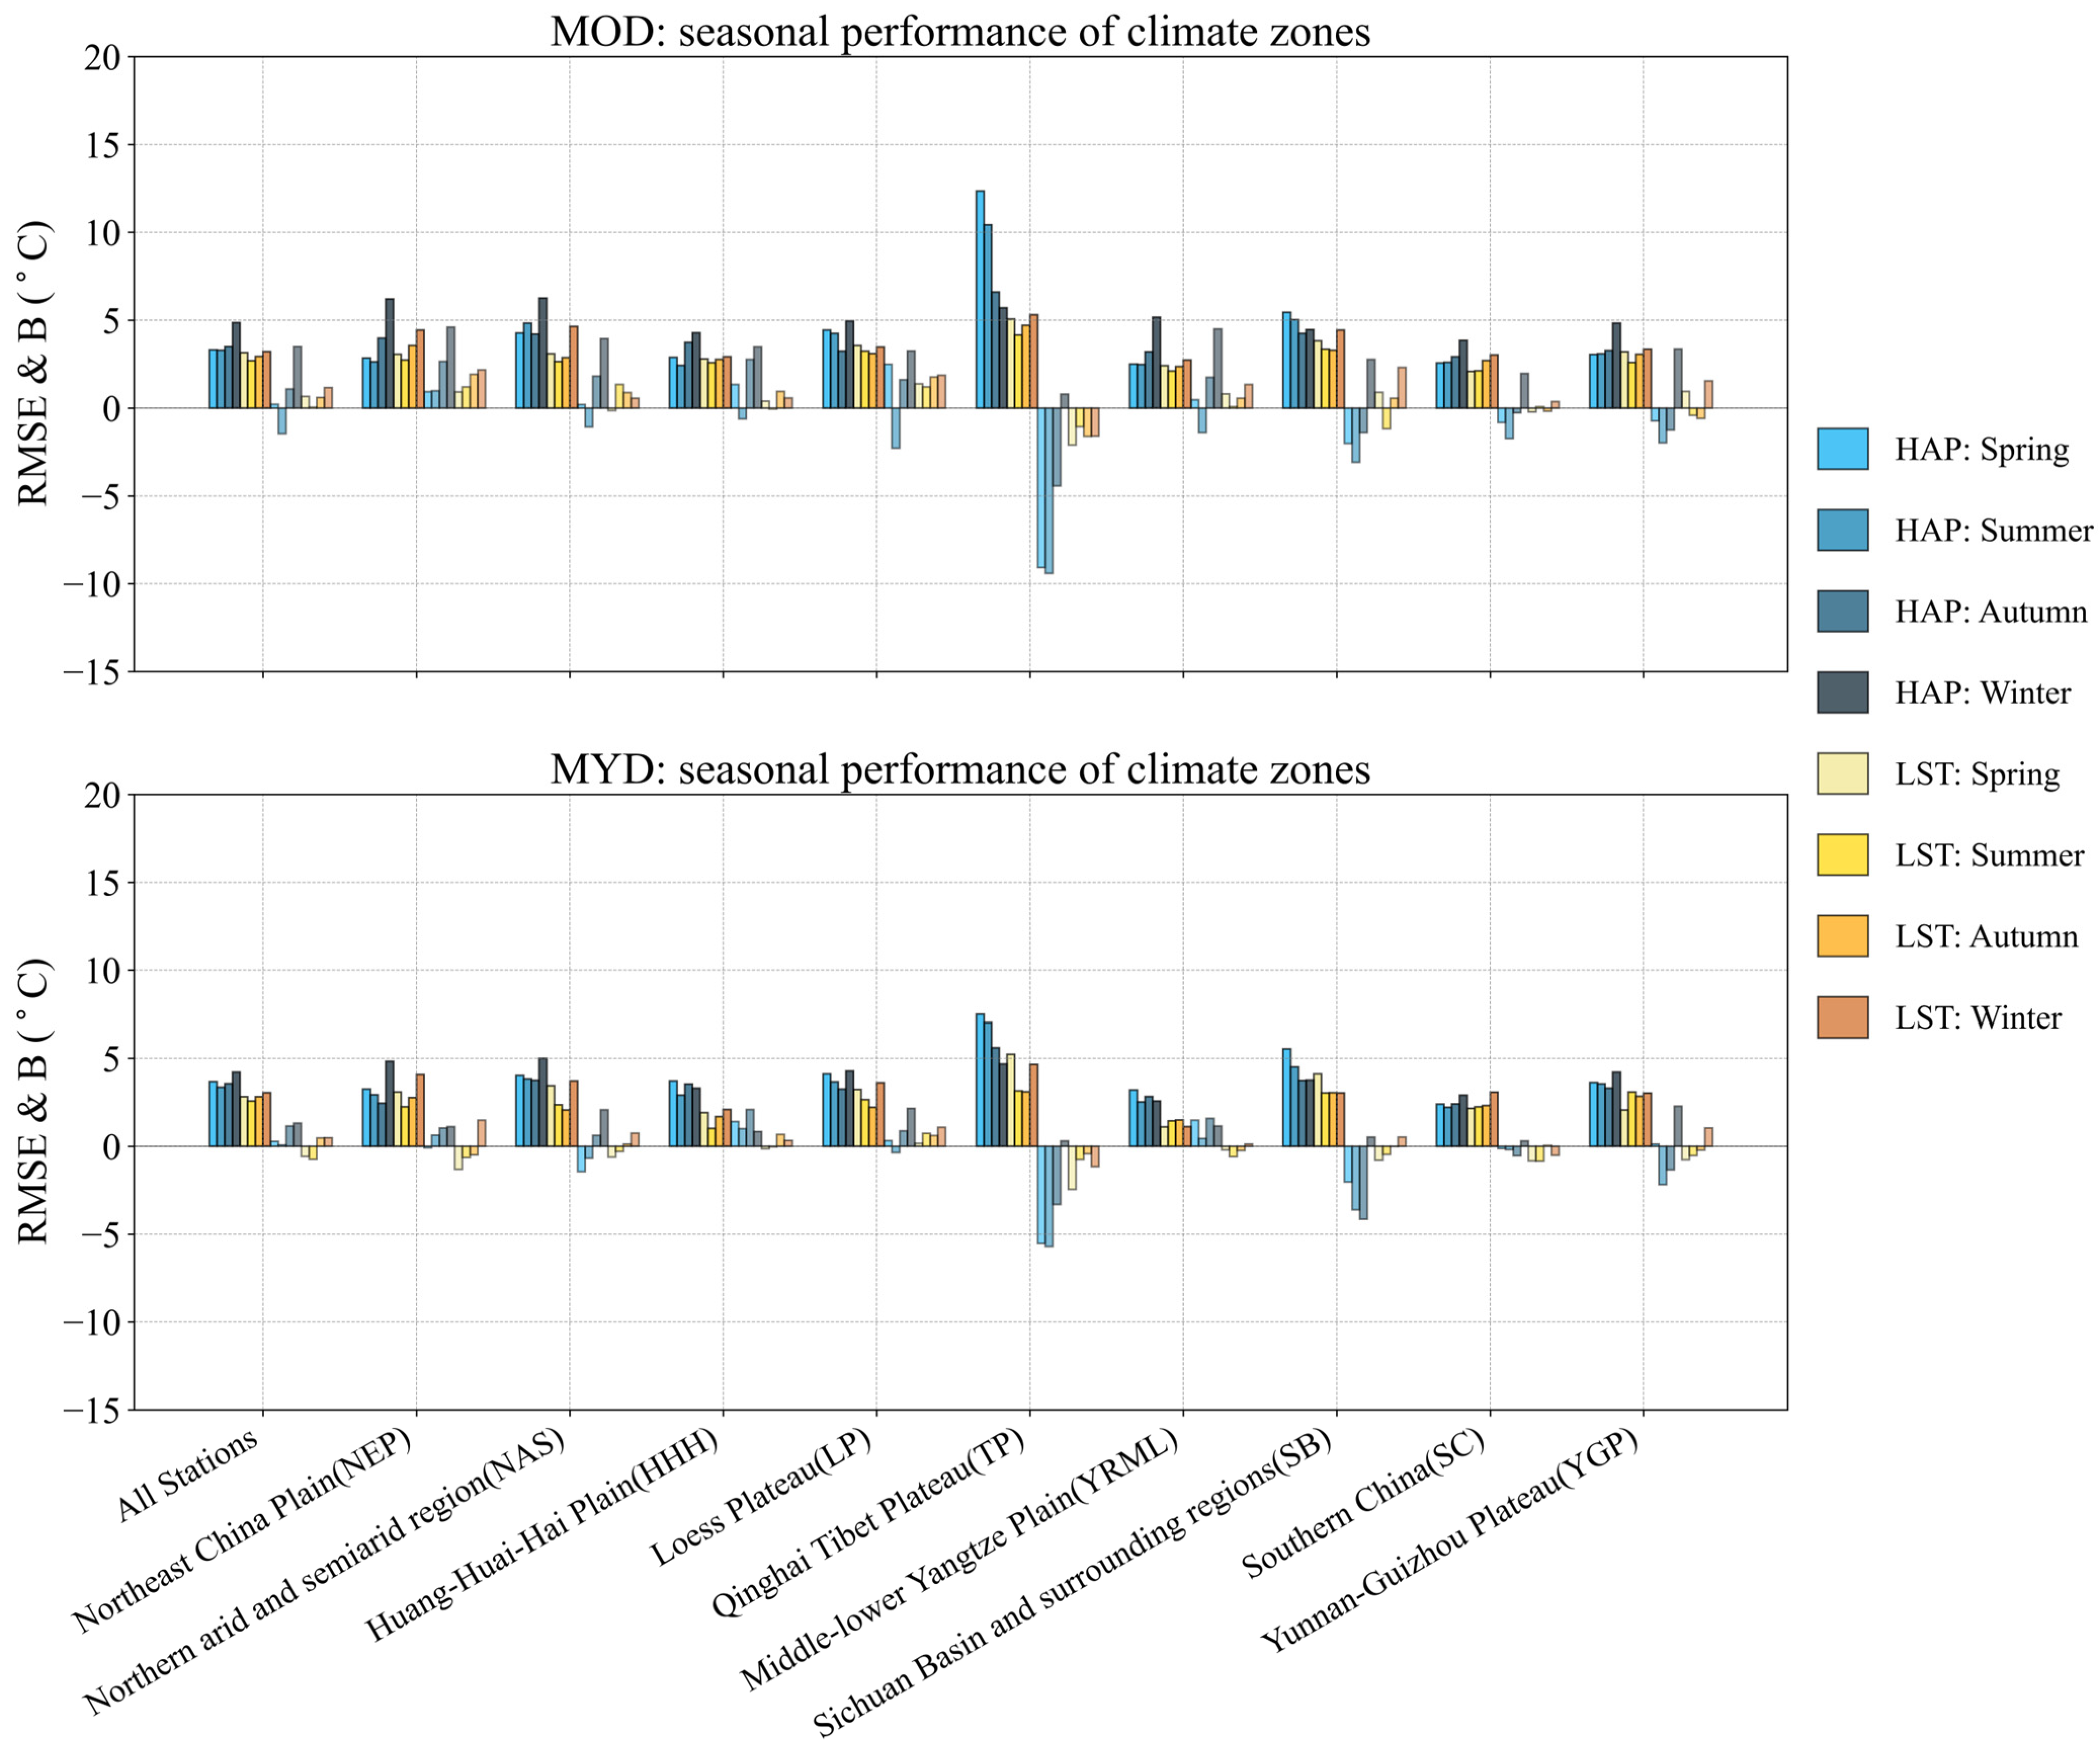
Figure 6 shows the seasonal performance of instantaneous Ta retrievals using the HAP and ALR methods based on MOD07 and MYD07 data. Under the MOD07 data. The retrieval errors were highest in summer with large RMSE values and significant underestimation and the accuracy was improved markedly in winter with considerably reduced underestimation. The ALR method consistently outperformed the HAP method across all seasons, substantially mitigating the issue of underestimation. The TP exhibited the most pronounced seasonal variation, where the HAP method produced substantial errors in spring accompanied by severe underestimation. Although the ALR method significantly improved accuracy and alleviated underestimation, errors in TP remained relatively large compared to other regions. The SB share a similar seasonal pattern but generally exhibited smaller error magnitudes overall. In the NAS, LP, YGP, HHH, SC, and YRML, a “high in summer, low in winter” pattern was generally followed for both the HAP and ALR methods. In contrast, the NEP demonstrated an opposite seasonal trend, with lower errors in summer. When utilizing MYD07 data, the larger errors occurred in spring and winter, with the ALR method outperforming the HAP method. While the seasonal error patterns were similar to those observed with MOD07 data, the overall accuracy improved across all regions, and seasonal discrepancies were reduced. The TP exhibited the most significant accuracy enhancement, particularly in spring, with a marked reduction in RMSE. The SB region continued to display similar error trends. Summer errors in NAS, LP, YGP, HHH, SC, and the YRML were also notably reduced, with the ALR method further enhancing stability, especially in YRML where bias values approached 0 °C. The NEP region maintained its winter-high, summer-low error pattern, although the magnitude of bias decreased.
Figure 7 shows the seasonal variations in the accuracy of Tmin retrievals using the HAP and LST methods. Using MOD data, errors were higher during winter compared to other seasons, exhibiting a clear overestimation. The LST method consistently outperformed the HAP method, maintaining stable accuracy throughout the year with relatively small biases. In the TP, the HAP method exhibited particularly pronounced errors in spring, characterized by substantial underestimation, whereas the LST method markedly improved accuracy with the RMSE from over 10 °C to within 5 °C. A similar seasonal error pattern was observed in the SB. However, regions such as the NEP, NAS, YGP, YRML, HHH, SC, and LP experienced the highest errors during winter, with substantial overestimation biases compared to other seasons. This pattern was notably alleviated by applying the LST method. When using MYD data, accuracy improved across all regions, although winter remained the lowest accuracy and kept the similar tendency with MOD data. The LST method demonstrated superior performance in this case as well.

4.4. Altitude Dependence of Errors

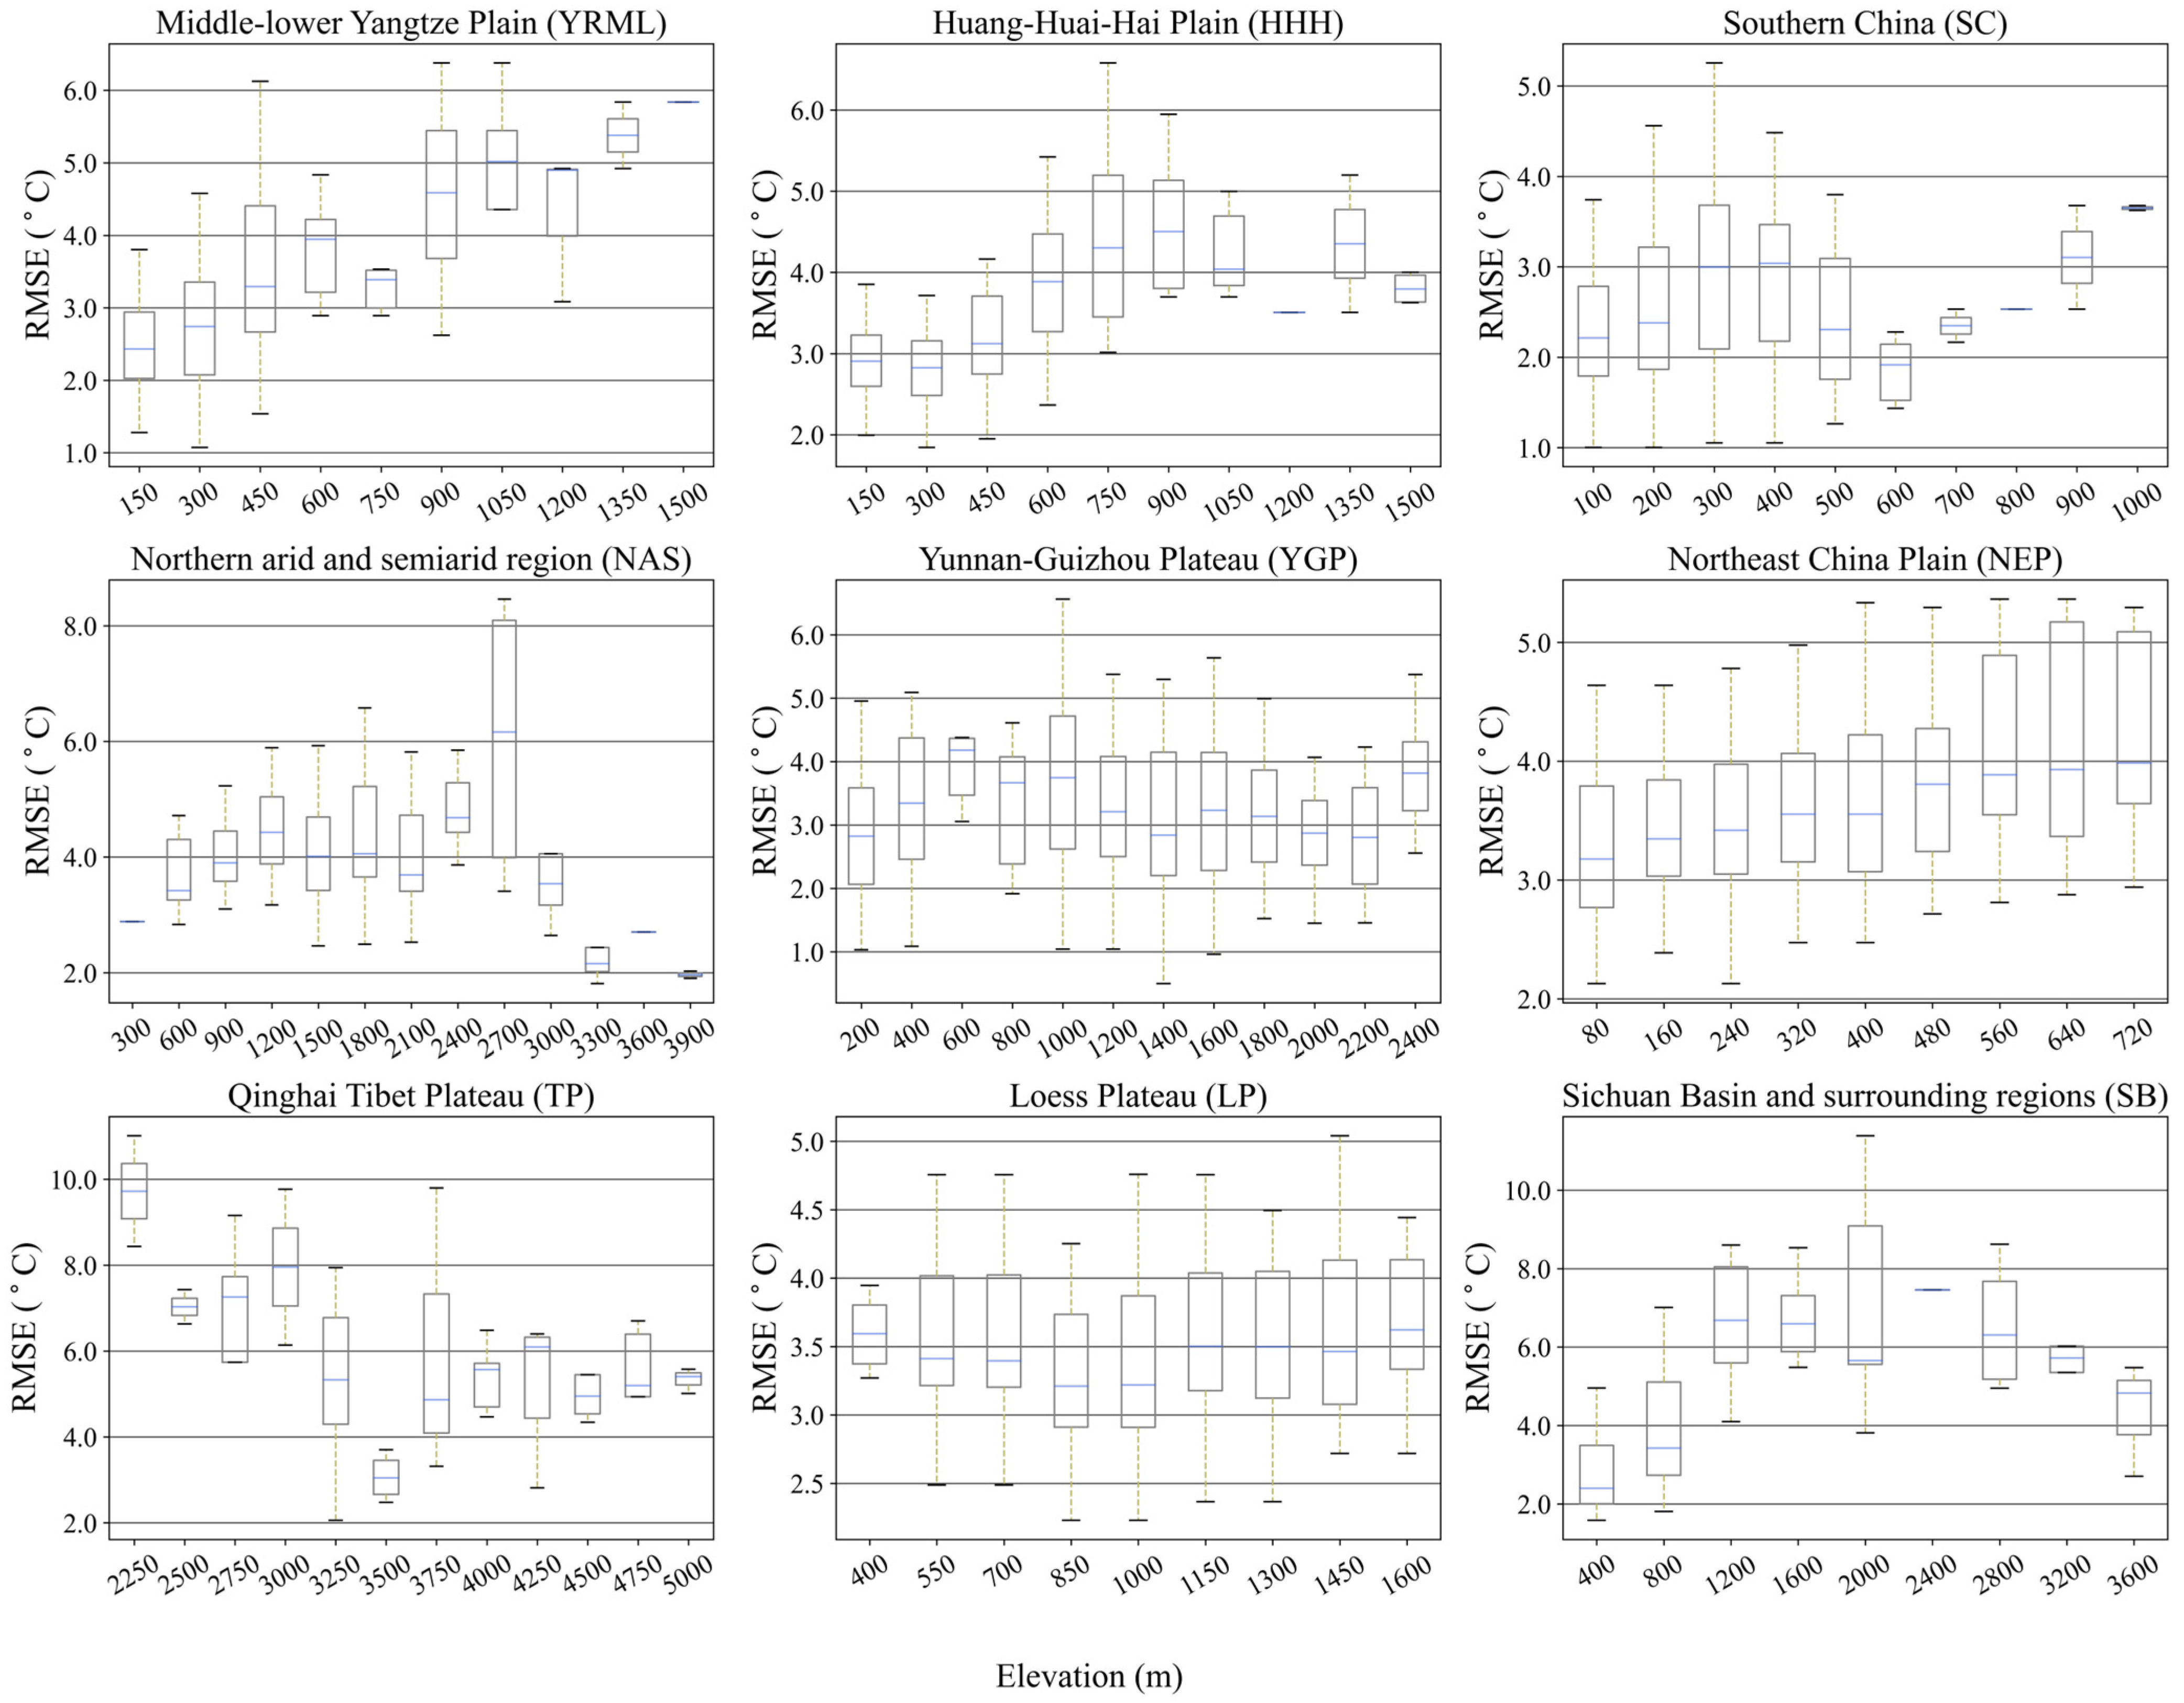
The previous sections have demonstrated that the instantaneous nighttime Ta retrieved using the ALR method and MYD07 data and Tmin retrieved using LST method and MYD11 data can achieve a better accuracy than that of using MOD data. Therefore, we only analyzed their variations with altitude gradients in this section. Figure 8 illustrates the RMSE distribution of instantaneous nighttime Ta estimated by the ALR method using MYD07 data along altitude gradients at nine agricultural areas. The TP and NAS exhibited the highest RMSE values, with median RMSE values exceeding 5 °C at elevations above 2000 m and some outliers surpassing 8 °C. In these regions, the dispersion of errors became more pronounced as elevation increased. In contrast, the SB exhibited a different pattern, with RMSE values increasing sharply between 800 m and 2000 m and peaking at a median of around 3.5 °C. The LP and YGP showed moderate RMSE levels with values ranging between 3 °C and 5 °C, and exhibited minimal influence with increasing elevation. Lower-altitude regions such as the SC, HHH, YRML, and NEP, demonstrated relatively low RMSE values. Although RMSE tended to increase slightly with elevation in these regions, median RMSE values generally remained below 3 °C and were tightly clustered between 2 °C and 4 °C.
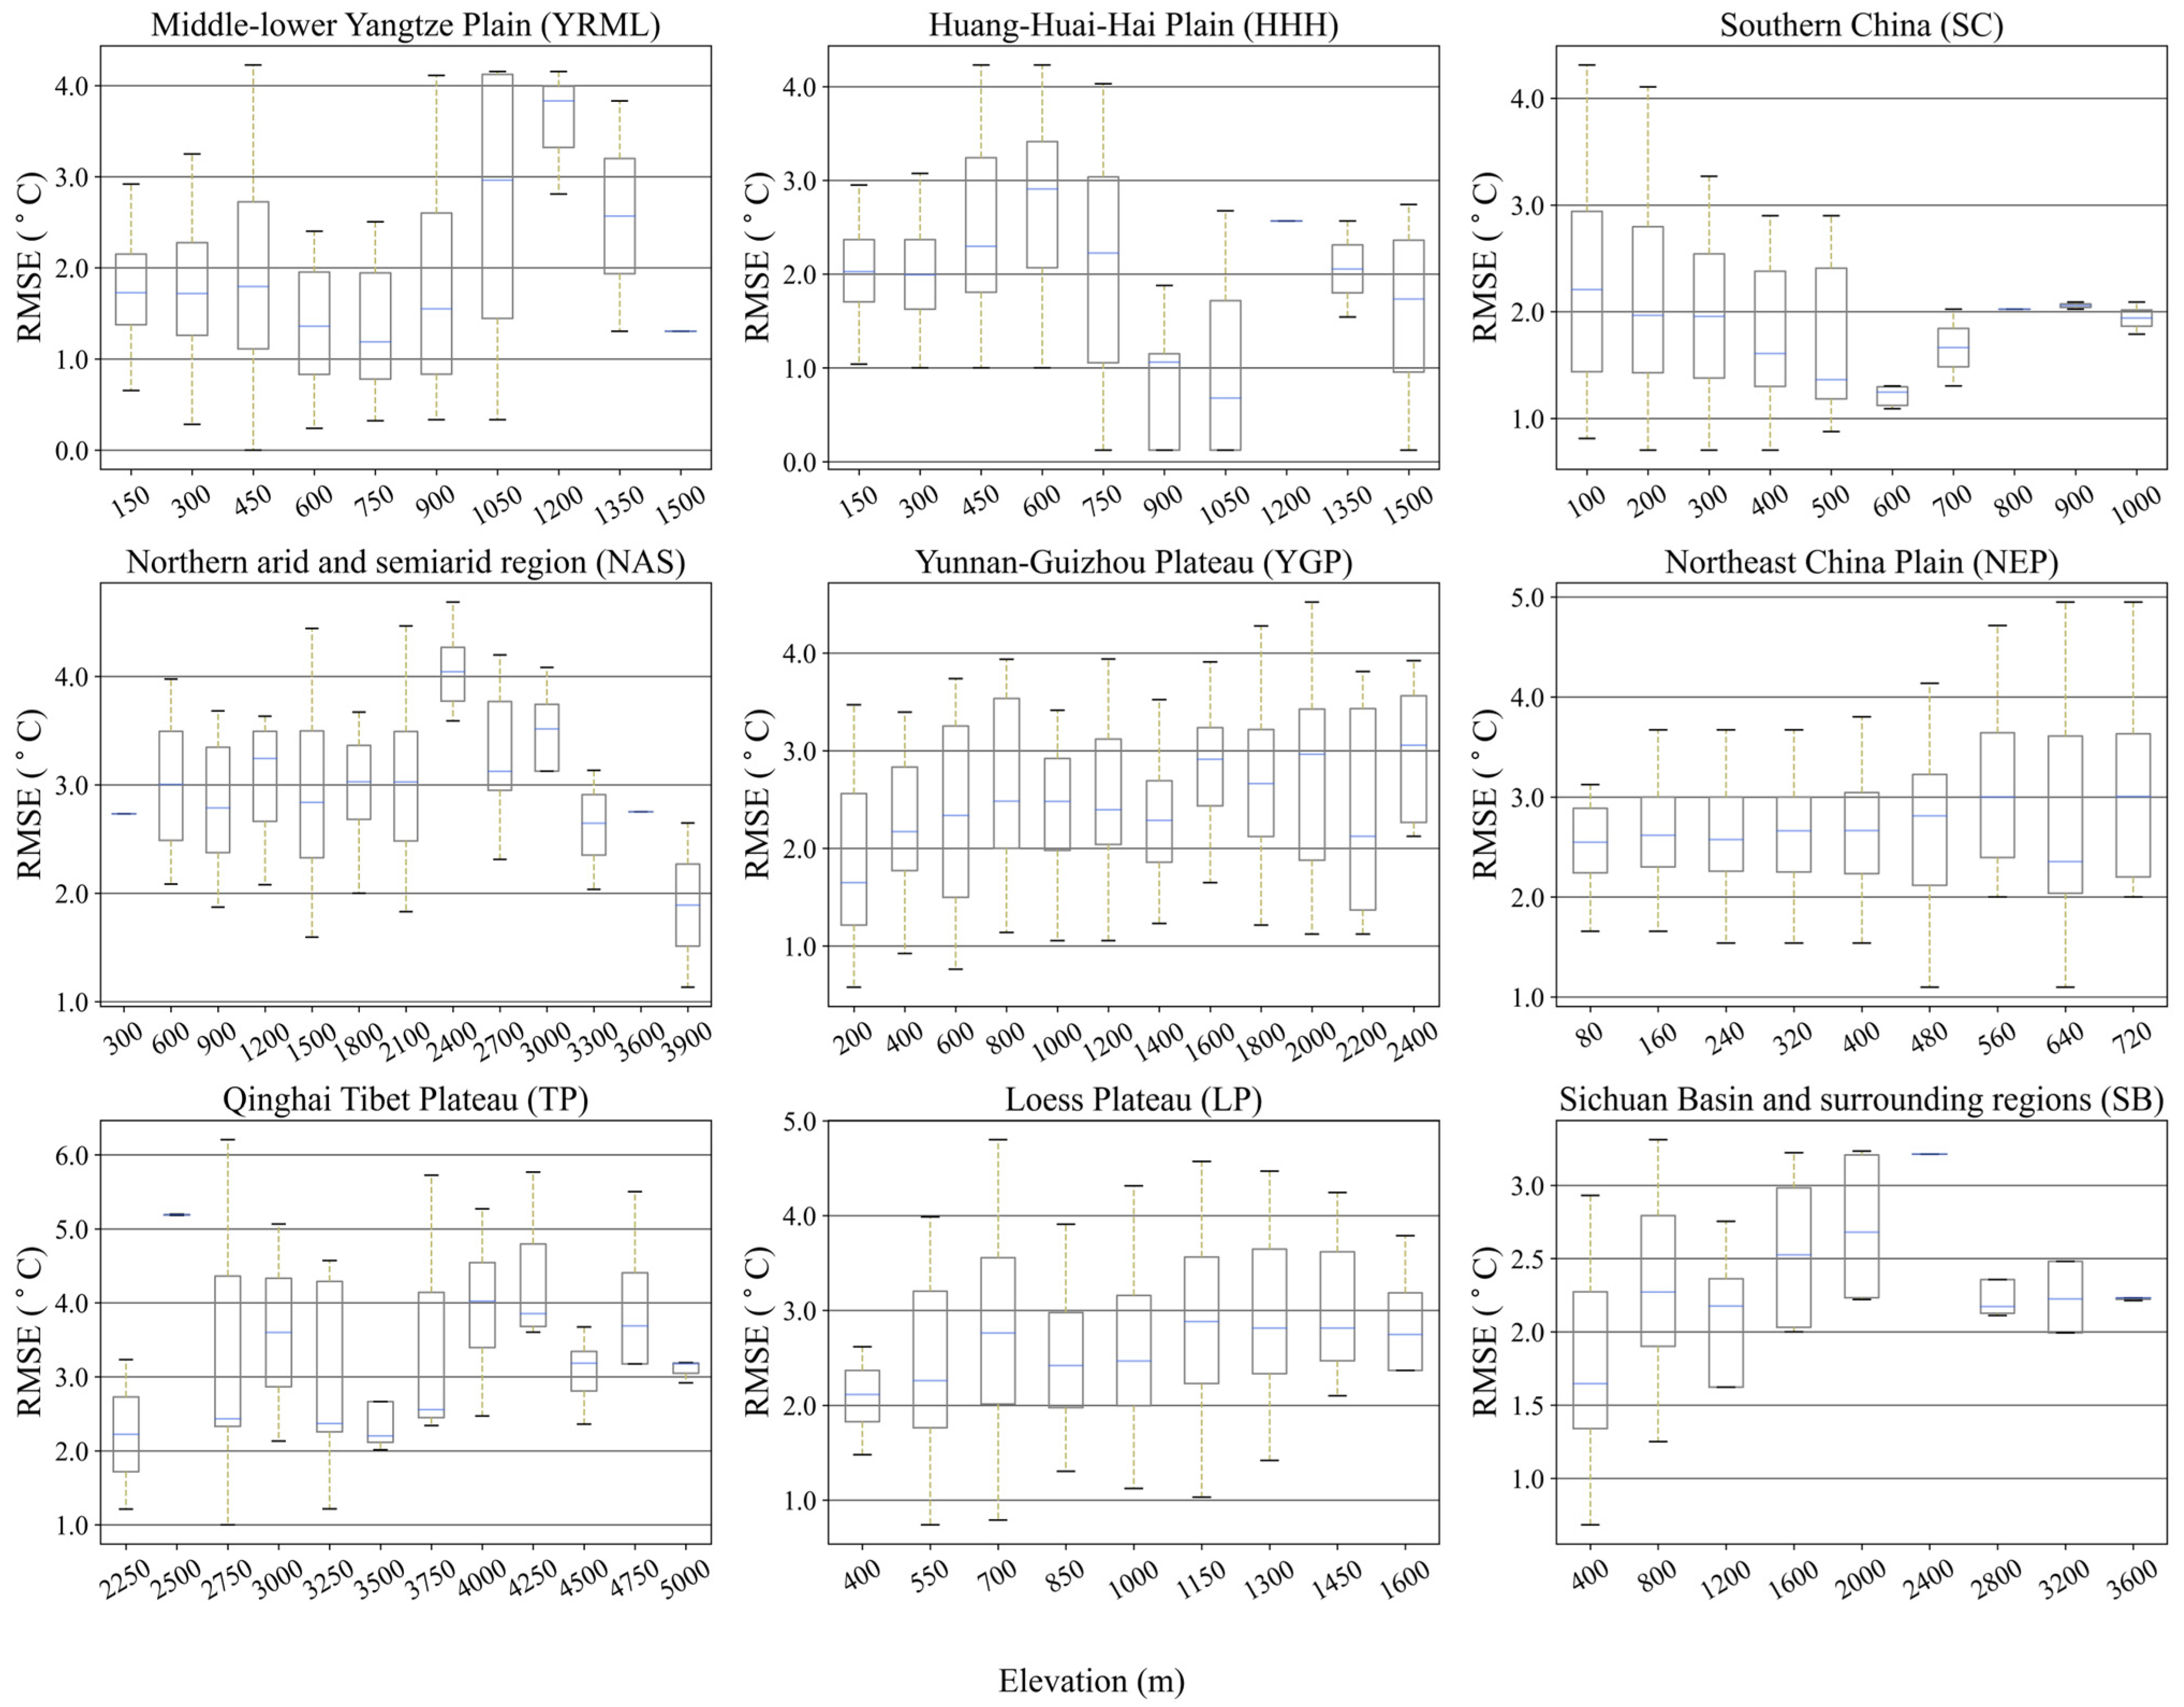
Figure 9 illustrates the RMSE distribution of nighttime minmum Tmin estimated using the LST method with MYD11 data along altitude gradients at nine agricultural areas. The TP and NAS exhibited the highest RMSE values, frequently exceeding 5 °C at higher elevations, and with outliers extending beyond 8 °C. The wider interquartile range in these regions highlighted greater variability in estimation accuracy, consistent with the results observed for instantaneous nighttime Ta. In the LP and the YGP, the RMSE remained relatively moderate across different elevation ranges, generally fluctuating between 2 °C and 4 °C. In the SB, the RMSE increased rapidly with elevation, surpassing 3 °C and reaching a peak at around 2000 m. Conversely, lower-altitude regions such as the YRML, the HHH, and the SC maintained relatively the stable RMSE distributions, characterized by lower medians below 3 °C and narrower interquartile ranges. This reflected better and more consistent estimation performance, similar to the trends observed for instantaneous nighttime Ta.

5. Discussion

5.1. Comparison of Data Applicability

In this study, we found that land surface temperature (LST) data provide more accurate Tmin estimation compared to MODIS atmospheric profile data, especially in high-altitude and topographically complex regions. This may be because LST can be directly retrieved through surface reflectance observed by remote sensing, whereas atmospheric profile data rely on complex atmospheric assumptions. MODIS atmospheric profile data combined satellite measurements with model projections, relying on several atmospheric parameters like water vapor, cloud cover, and radiation intensity [44,45,46]. This model-dependent approach was more susceptible to systematic errors in high-altitude and complex areas due to intricate radiative transfer conditions, potentially leading to biased temperature estimates [47]. Previous studies have also highlighted the advantages of LST data in mapping fine-scale temperature patterns in heterogeneous terrains and urban environments [27,48]. Furthermore, the higher spatial resolution of LST products (1 km) enables more precise detection of local temperature variations, whereas the coarser resolution of MODIS atmospheric profile data (5 km) limits its effectiveness in capturing such variability. It is important to note that the input datasets used in this study, including MOD07_L2, MYD07_L2, MOD11_L2, and MYD11_L2, carry inherent uncertainties due to factors such as cloud contamination, retrieval algorithm limitations, and spatial mismatches with ground observations. the atmospheric profile products may exhibit increased retrieval errors under high humidity or complex terrain conditions, and LST retrievals can be affected by emissivity assumptions and surface heterogeneity. These uncertainties may propagate into the final Ta and Tmin estimates, especially in regions with extreme topographic or atmospheric variability. By comparing the accuracy of temperature estimation using two different datasets, we found that the accuracy based on MYD data was consistently higher than that based on MOD data when the same method was applied [49]. The reason might be that temperature fluctuations are still more pronounced at transit time of MOD than that of MYD [50]. The transit time of the Terra satellite coincides with the diurnal transition stage on the surface. At this time, the soil–vegetation system is in a non-steady-state heat exchange process, resulting in an increase in the temperature heterogeneity within the pixels. The stable atmospheric boundary layer makes the vertical stratification of water vapor obvious, increasing the uncertainty of atmospheric correction. In contrast, the observations of the Aqua satellite benefit from fully developed turbulent mixing, and the surface temperature field tends to be balanced [49,51]. Additionally, the high-altitude characteristics of study areas such as the Qinghai–Tibet Plateau may amplify the above effect—the morning inversion phenomenon is more significant in the thin atmosphere, further exacerbating the bias of the Terra data [52].

5.2. Temperature Estimation Error Analysis

In this study, we found that the error in temperature estimation increased significantly at high altitudes, such as the Tibetan Plateau, which is consistent with previous research. Recent studies have highlighted that the complex atmospheric radiative transfer and the vertical temperature gradient posed significant challenges [34]. While this pattern is consistent with previous research [52], the underlying mechanisms deserve further elaboration. At high altitudes, the atmosphere is thinner, which can lead to deviations in the radiative transfer assumptions embedded in satellite retrieval algorithms. The complex topography also introduces rapid changes in elevation over short horizontal distances, affecting land surface emissivity and causing spatial heterogeneity in temperature fields. Additionally, we observed that the accuracy of nighttime temperature estimation was generally higher than that of daytime estimation. This result aligned with existing research attributing the more complex energy exchange of solar radiation in the daytime increased the error [53]. This finding underscored the significant impact of solar radiation on temperature estimation. Wang et al. [54] pointed out that cloudy or foggy conditions significantly reduce the accuracy of surface temperature data. Additionally, humidity played a crucial role in temperature estimation accuracy. Lin et al. [55] found that in the mountainous regions of Southwest China, complex topography resulted in diverse thermal regimes and variations in humidity further exacerbated this complexity. Yang et al. [56] also indicated that increased humidity amplified surface energy exchange, significantly altering the relationship between land surface temperature and air temperature. To sum up, the temperature estimation error is mainly affected by factors such as terrain, radiation conditions, and atmospheric humidity. Among them, high altitude, daytime solar radiation, cloudy and foggy weather, and high humidity environment are the key factors for the increase in errors. These emphasize the crucial role of environmental factors in the accuracy of temperature estimation.

5.3. Future Prospects

It is worth noting that the main errors occurred in high-altitude and complex terrain areas due to terrain-induced interference for remote sensing data. Future advances in remote sensing technology and multi-source data fusion might address these limitations. Incorporating topographic factors with deep learning algorithms could better account for varying terrains and climatic conditions. Hengl et al. (2004) [57] demonstrated the potential of including topographic and climatic factors in temperature prediction through a regression kriging framework, while Qin et al. (2001) [58] showcased the effectiveness of the single-window algorithm using multi-source remote sensing data. Future research should also leverage high-resolution remote sensing data combined with topographic and climatic elements to improve temperature estimation in challenging environments.

6. Conclusions

The instantaneous nighttime near-surface air temperature (Ta) and daily minimum temperatures (Tmin) retrieval from the MODIS product provide regular and consistent observations across extensive areas, effectively complementing the sparse and irregular distribution of meteorological stations globally. MODIS atmospheric profile data products can directly provide air temperatures at various altitude levels, making nighttime Ta and Tmin more straightforward. However, previous validations primarily focused on the daytime, with a lack of validation for the nighttime. Our research shows that using air temperature the highest available pressure level as a proxy resulted in significant underestimation especially in high-altitude areas. Even after correction using adiabatic lapse rate, this underestimation persisted. Due to this significant underestimation, we further compared its ability to estimate Tmin by using MODIS land surface temperature and found continued substantial underestimation from MODIS atmospheric profile data products in high-altitude regions. This implied that atmospheric profile data products might have systematic errors when retrieving nighttime Ta and Tmin in high-altitude regions. In contrast, in plain areas, these methods show a relative prior applicability. In addition, MYD-based retrievals consistently outperformed MOD-based estimation for both Ta and Tmin retrieval. Future research should explore the integration of deep learning approaches and multi-source data fusion, such as the combination of MODIS products with in situ datasets, to develop dynamic correction frameworks with enhanced spatiotemporal adaptability, thereby further improving inversion accuracy under variable environmental conditions.

Author Contributions

W.Z. (Wenjie Zhang) and Y.L. designed this study. W.Z. (Wenjie Zhang) and J.Z. conducted the analysis and wrote the manuscript. W.Z. (Wenbin Zhu), Y.K. and B.W. put forward improvement advise. W.Z. (Wenjie Zhang), Y.L. and J.Z. interpreted the results and revised the manuscript. All authors have read and agreed to the published version of the manuscript.

Funding

This research is supported by the Open fund project for the Key Laboratory of Smart Earth (KF2023ZD02-3), the state Key Laboratory of Geo-Information Engineering (No. SKLGIE2023-Z-4-1) and the National Natural Science Foundation of China under grant no. 42201053.

Data Availability Statement

The dataset utilized to substantiate the findings of this study can be obtained from the authors upon request.

Acknowledgments

We thank the anonymous reviewers for their comments and suggestions that improved this paper.

Conflicts of Interest

The authors declare no conflicts of interest.

References

  1. Joy, A.; Satheesan, K.; Paul, A. High-resolution maximum air temperature estimation over India from MODIS data using machine learning. Remote Sens. Appl. Soc. Environ. 2025, 37, 101463. [Google Scholar] [CrossRef]
  2. Jia, A.; Liang, S.; Wang, D. Generating a 2-km, all-sky, hourly land surface temperature product from Advanced Baseline Imager data. Remote Sens. Environ. 2022, 278, 113105. [Google Scholar] [CrossRef]
  3. Fu, P.; Weng, Q. Variability in annual temperature cycle in the urban areas of the United States as revealed by MODIS imagery. ISPRS J. Photogramm. Remote Sens. 2018, 146, 65–73. [Google Scholar] [CrossRef]
  4. Wang, Q.; Tang, Y.; Tong, X.; Atkinson, P.M. Filling gaps in cloudy Landsat LST product by spatial-temporal fusion of multi-scale data. Remote Sens. Environ. 2024, 306, 114142. [Google Scholar] [CrossRef]
  5. Yao, R.; Wang, L.; Huang, X.; Li, L.; Sun, J.; Wu, X.; Jiang, W. Developing a temporally accurate air temperature dataset for Mainland China. Sci. Total. Environ. 2020, 706, 136037. [Google Scholar] [CrossRef]
  6. Zakšek, K.; Schroedter-Homscheidt, M. Parameterization of air temperature in high temporal and spatial resolution from a combination of the SEVIRI and MODIS instruments. ISPRS J. Photogramm. Remote Sens. 2009, 64, 414–421. [Google Scholar] [CrossRef]
  7. Lin, S.; Moore, N.J.; Messina, J.P.; DeVisser, M.H.; Wu, J. Evaluation of estimating daily maximum and minimum air temperature with MODIS data in east Africa. Int. J. Appl. Earth Obs. Geoinf. 2012, 18, 128–140. [Google Scholar] [CrossRef]
  8. Zhu, W.; Lű, A.; Jia, S.; Yan, J.; Mahmood, R. Retrievals of all-weather daytime air temperature from MODIS products. Remote Sens. Environ. 2017, 189, 152–163. [Google Scholar] [CrossRef]
  9. Yoo, C.; Im, J.; Park, S.; Quackenbush, L.J. Estimation of daily maximum and minimum air temperatures in urban landscapes using MODIS time series satellite data. ISPRS J. Photogramm. Remote Sens. 2018, 137, 149–162. [Google Scholar] [CrossRef]
  10. Shen, H.; Jiang, Y.; Li, T.; Cheng, Q.; Zeng, C.; Zhang, L. Deep learning-based air temperature mapping by fusing remote sensing, station, simulation and socioeconomic data. Remote Sens. Environ. 2020, 240, 111692. [Google Scholar] [CrossRef]
  11. Stisen, S.; Sandholt, I.; Nørgaard, A.; Fensholt, R.; Eklundh, L. Estimation of diurnal air temperature using MSG SEVIRI data in West Africa. Remote Sens. Environ. 2007, 110, 262–274. [Google Scholar] [CrossRef]
  12. Janatian, N.; Sadeghi, M.; Sanaeinejad, S.H.; Bakhshian, E.; Farid, A.; Hasheminia, S.M.; Ghazanfari, S. A statistical framework for estimating air temperature using MODIS land surface temperature data. Int. J. Climatol. 2017, 37, 1181–1194. [Google Scholar] [CrossRef]
  13. Coll, C.; Caselles, V.; Valor, E.; Niclòs, R. Comparison between different sources of atmospheric profiles for land surface temperature retrieval from single channel thermal infrared data. Remote Sens. Environ. 2012, 117, 199–210. [Google Scholar] [CrossRef]
  14. Famiglietti, C.A.; Fisher, J.B.; Halverson, G.; Borbas, E.E. Global Validation of MODIS Near-Surface Air and Dew Point Temperatures. Geophys. Res. Lett. 2018, 45, 7772–7780. [Google Scholar] [CrossRef]
  15. Leng, P.; Liao, Q.; Gao, M.; Duan, S.; Li, Z.; Zhang, X.; Shang, G. A Full Satellite-Driven Method for the Retrieval of Clear-Sky Evapotranspiration. Earth Space Sci. 2019, 6, 2251–2262. [Google Scholar] [CrossRef]
  16. Bisht, G.; Venturini, V.; Islam, S.; Jiang, L. Estimation of the net radiation using MODIS (Moderate Resolution Imaging Spectroradiometer) data for clear sky days. Remote Sens. Environ. 2005, 97, 52–67. [Google Scholar] [CrossRef]
  17. Seddon, A.W.R.; Macias-Fauria, M.; Long, P.R.; Benz, D.; Willis, K.J. Sensitivity of global terrestrial ecosystems to climate variability. Nature 2016, 531, 229–232. [Google Scholar] [CrossRef]
  18. Tang, B.; Li, Z.-L. Estimation of instantaneous net surface longwave radiation from MODIS cloud-free data. Remote Sens. Environ. 2008, 112, 3482–3492. [Google Scholar] [CrossRef]
  19. Hu, L.; Brunsell, N.A. A new perspective to assess the urban heat island through remotely sensed atmospheric profiles. Remote Sens. Environ. 2015, 158, 393–406. [Google Scholar] [CrossRef]
  20. Kim, J.; Hogue, T.S. Evaluation of a MODIS-Based Potential Evapotranspiration Product at the Point Scale. J. Hydrometeorol. 2008, 9, 444–460. [Google Scholar] [CrossRef]
  21. Bisht, G.; Bras, R.L. Estimation of net radiation from the MODIS data under all sky conditions: Southern Great Plains case study. Remote Sens. Environ. 2010, 114, 1522–1534. [Google Scholar] [CrossRef]
  22. Sobrino, J.A.; Jiménez-Muñoz, J.C.; Mattar, C.; Sòria, G. Evaluation of Terra/MODIS atmospheric profiles product (MOD07) over the Iberian Peninsula: A comparison with radiosonde stations. Int. J. Digit. Earth 2015, 8, 771–783. [Google Scholar] [CrossRef]
  23. Wang, Q.; Wang, X.; Zhou, Y.; Liu, D.; Wang, H. The dominant factors and influence of urban characteristics on land surface temperature using random forest algorithm. Sustain. Cities Soc. 2022, 79, 103722. [Google Scholar] [CrossRef]
  24. Hrisko, J.; Ramamurthy, P.; Yu, Y.; Yu, P.; Melecio-Vázquez, D. Urban air temperature model using GOES-16 LST and a diurnal regressive neural network algorithm. Remote Sens. Environ. 2020, 237, 111495. [Google Scholar] [CrossRef]
  25. Ullah, S.; Qiao, X.; Abbas, M. Addressing the impact of land use land cover changes on land surface temperature using machine learning algorithms. Sci. Rep. 2024, 14, 18746. [Google Scholar] [CrossRef]
  26. Xu, Z.; Yi, Z.; Wang, Y.; Wang, D.; Zhang, L.; Huo, H. Estimating near-surface air temperature in urban functional zones in China using spatial-temporal attention. Build. Environ. 2025, 276, 112860. [Google Scholar] [CrossRef]
  27. Benali, A.; Carvalho, A.C.; Nunes, J.P.; Carvalhais, N.; Santos, A. Estimating air surface temperature in Portugal using MODIS LST data. Remote Sens. Environ. 2012, 124, 108–121. [Google Scholar] [CrossRef]
  28. Shamir, E.; Georgakakos, K.P. MODIS Land Surface Temperature as an index of surface air temperature for operational snowpack estimation. Remote Sens. Environ. 2014, 152, 83–98. [Google Scholar] [CrossRef]
  29. Jin, Z.; Ma, Y.; Chu, L.; Liu, Y.; Dubrow, R.; Chen, K. Predicting spatiotemporally-resolved mean air temperature over Sweden from satellite data using an ensemble model. Environ. Res. 2022, 204, 111960. [Google Scholar] [CrossRef]
  30. Vancutsem, C.; Ceccato, P.; Dinku, T.; Connor, S.J. Evaluation of MODIS land surface temperature data to estimate air temperature in different ecosystems over Africa. Remote Sens. Environ. 2010, 114, 449–465. [Google Scholar] [CrossRef]
  31. Kloog, I.; Nordio, F.; Coull, B.A.; Schwartz, J. Predicting spatiotemporal mean air temperature using MODIS satellite surface temperature measurements across the Northeastern USA. Remote Sens. Environ. 2014, 150, 132–139. [Google Scholar] [CrossRef]
  32. Zhang, Z.; Du, Q. Merging framework for estimating daily surface air temperature by integrating observations from multiple polar-orbiting satellites. Sci. Total Environ. 2022, 812, 152538. [Google Scholar] [CrossRef]
  33. Zhu, W.; Lű, A.; Jia, S. Estimation of daily maximum and minimum air temperature using MODIS land surface temperature products. Remote Sens. Environ. 2013, 130, 62–73. [Google Scholar] [CrossRef]
  34. Zhang, W.; Zhang, B.; Zhu, W.; Tang, X.; Li, F.; Liu, X.; Yu, Q. Comprehensive assessment of MODIS-derived near-surface air temperature using wide elevation-spanned measurements in China. Sci. Total Environ. 2021, 800, 149535. [Google Scholar] [CrossRef]
  35. Zhong, H.; Zhou, J.; Tang, W.; Zhou, G.; Wang, Z.; Wang, W. Estimation of near-surface air temperature lapse rate based on MODIS data over the Tibetan Plateau. IEEE J. Sel. Top. Appl. Earth Obs. Remote Sens. 2023, 16, 4767–4777. [Google Scholar] [CrossRef]
  36. Labbi, A. Estimation of daytime near-surface air temperature from satellite data. Remote Sens. Appl. Soc. Environ. 2020, 18, 100305. [Google Scholar] [CrossRef]
  37. Zhang, D.; Xie, X.; Zhou, C. Spatial influence of exposure to green spaces on the climate comfort of urban habitats in China. Urb. Clim. 2023, 51, 101657. [Google Scholar] [CrossRef]
  38. Xing, J.; Wang, M.; Zhang, Z.; Gao, W.; Liu, X. Asymmetry in the intensity and frequency of extreme high temperature during daytime and nighttime in China in the summer 2022. Sci. Total Environ. 2025, 976, 179332. [Google Scholar] [CrossRef]
  39. Luo, M.; Ning, G.; Xu, F.; Wang, S.; Liu, Z.; Yang, Y. Observed heatwave changes in arid northwest China: Physical mechanism and long-term trend. Atmos. Res. 2020, 242, 105009. [Google Scholar] [CrossRef]
  40. Gomis-Cebolla, J.; Jimenez, J.C.; Sobrino, J.A. LST retrieval algorithm adapted to the Amazon evergreen forests using MODIS data. Remote Sens. Environ. 2018, 204, 401–411. [Google Scholar] [CrossRef]
  41. Kim, K.Y.; Haagenson, R.; Kansara, P.; Rajaram, H.; Lakshmi, V. Augmenting daily MODIS LST with AIRS surface temperature retrievals to estimate ground temperature and permafrost extent in High Mountain Asia. Remote Sens. Environ. 2024, 305, 114075. [Google Scholar] [CrossRef]
  42. Román, M.O.; Justice, C.; Paynter, I.; Boucher, P.B.; Devadiga, S.; Endsley, A.; Erb, A.; Friedl, M.; Gao, H.; Giglio, L.; et al. Continuity between NASA MODIS Collection 6.1 and VIIRS Collection 2 land products. Remote Sens. Environ. 2024, 302, 113963. [Google Scholar] [CrossRef]
  43. Zhu, W.; Cao, M. Modification and validation of a new method to improve the accuracy of MODIS-derived dew point temperature over mainland China. Int. J. Digit. Earth 2023, 16, 3513–3535. [Google Scholar] [CrossRef]
  44. Recondo, C.; Corbea-Pérez, A.; Peón, J.; Pendás, E.; Ramos, M.; Calleja, J.F.; de Pablo, M.Á.; Fernández, S.; Corrales, J.A. Empirical models for estimating air temperature using MODIS land surface temperature (and spatiotemporal variables) in the Hurd Peninsula of Livingston Island, Antarctica, between 2000 and 2016. Remote Sens. 2022, 14, 3206. [Google Scholar] [CrossRef]
  45. Rhee, J.; Im, J. Estimating High Spatial Resolution Air Temperature for Regions with Limited in situ Data Using MODIS Products. Remote Sens. 2014, 6, 7360–7378. [Google Scholar] [CrossRef]
  46. Zhao, B.; Sun, Z.; Wang, M.; Du, J.; Song, K. Tracking global large lake surface temperature variation from space using MODIS land surface temperature product. Ecol. Inform. 2025, 89, 103184. [Google Scholar] [CrossRef]
  47. Mildrexler, D.J.; Zhao, M.; Running, S.W. A global comparison between station air temperatures and MODIS land surface temperatures reveals the cooling role of forests. J. Geophys. Res. 2011, 116, G03025. [Google Scholar] [CrossRef]
  48. Guo, H.; Zhu, W.; Xiao, C.; Zhao, C.; Chen, L. High-precision estimation of pan-Arctic soil surface temperature from MODIS LST by incorporating multiple environment factors and monthly-based modeling. Int. J. Appl. Earth Obs. Geoinf. 2024, 133, 104114. [Google Scholar] [CrossRef]
  49. Yu, W.; Ma, M.; Yang, H.; Tan, J.; Li, X. Supplement of the radiance-based method to validate satellite-derived land surface temperature products over heterogeneous land surfaces. Remote Sens. Environ. 2019, 230, 111188. [Google Scholar] [CrossRef]
  50. Mostovoy, G.V.; King, R.L.; Reddy, K.R.; Kakani, V.G.; Filippova, M.G. Statistical Estimation of Daily Maximum and Minimum Air Temperatures from MODIS LST Data over the State of Mississippi. GISci. Remote Sens. 2006, 43, 78–110. [Google Scholar] [CrossRef]
  51. Wan, Z. New refinements and validation of the Collection-6 MODIS land-surface temperature/emissivity product. Remote Sens. Environ. 2014, 140, 36–45. [Google Scholar] [CrossRef]
  52. Zhang, W.; Zhang, B.; Zhao, F.; Tang, X.; Gao, A.; Li, W.; Lan, X.; Tang, J. Influence of orographic effects on diurnal temperature differences in the near-surface vertical atmosphere over the Tibetan Plateau. Geogr. Res. 2023, 42, 713–727. [Google Scholar] [CrossRef]
  53. Wang, S.; Zhou, J.; Lei, T.; Wu, H.; Zhang, X.; Ma, J.; Zhong, H. Estimating Land Surface Temperature from Satellite Passive Microwave Observations with the Traditional Neural Network, Deep Belief Network, and Convolutional Neural Network. Remote Sens. 2020, 12, 2691. [Google Scholar] [CrossRef]
  54. Wang, Y.; Liu, J.; Zhu, W. Estimation of Instantaneous Air Temperature under All-Weather Conditions Based on MODIS Products in North and Southwest China. Remote Sens. 2023, 15, 2701. [Google Scholar] [CrossRef]
  55. Lin, X.; Zhang, W.; Huang, Y.; Sun, W.; Han, P.; Yu, L.; Sun, F. Empirical Estimation of Near-Surface Air Temperature in China from MODIS LST Data by Considering Physiographic Features. Remote Sens. 2016, 8, 629. [Google Scholar] [CrossRef]
  56. Yang, Y.; Cai, W.; Yang, J. Evaluation of MODIS Land Surface Temperature Data to Estimate Near-Surface Air Temperature in Northeast China. Remote Sens. 2017, 9, 410. [Google Scholar] [CrossRef]
  57. Hengl, T.; Heuvelink, G.B.M.; Stein, A. A generic framework for spatial prediction of soil variables based on regression-kriging. Geoderma 2004, 120, 75–93. [Google Scholar] [CrossRef]
  58. Qin, Z.; Karnieli, A.; Berliner, P. A mono-window algorithm for retrieving land surface temperature from Landsat TM data and its application to the Israel-Egypt border region. Int. J. Remote Sens. 2001, 22, 3719–3746. [Google Scholar] [CrossRef]
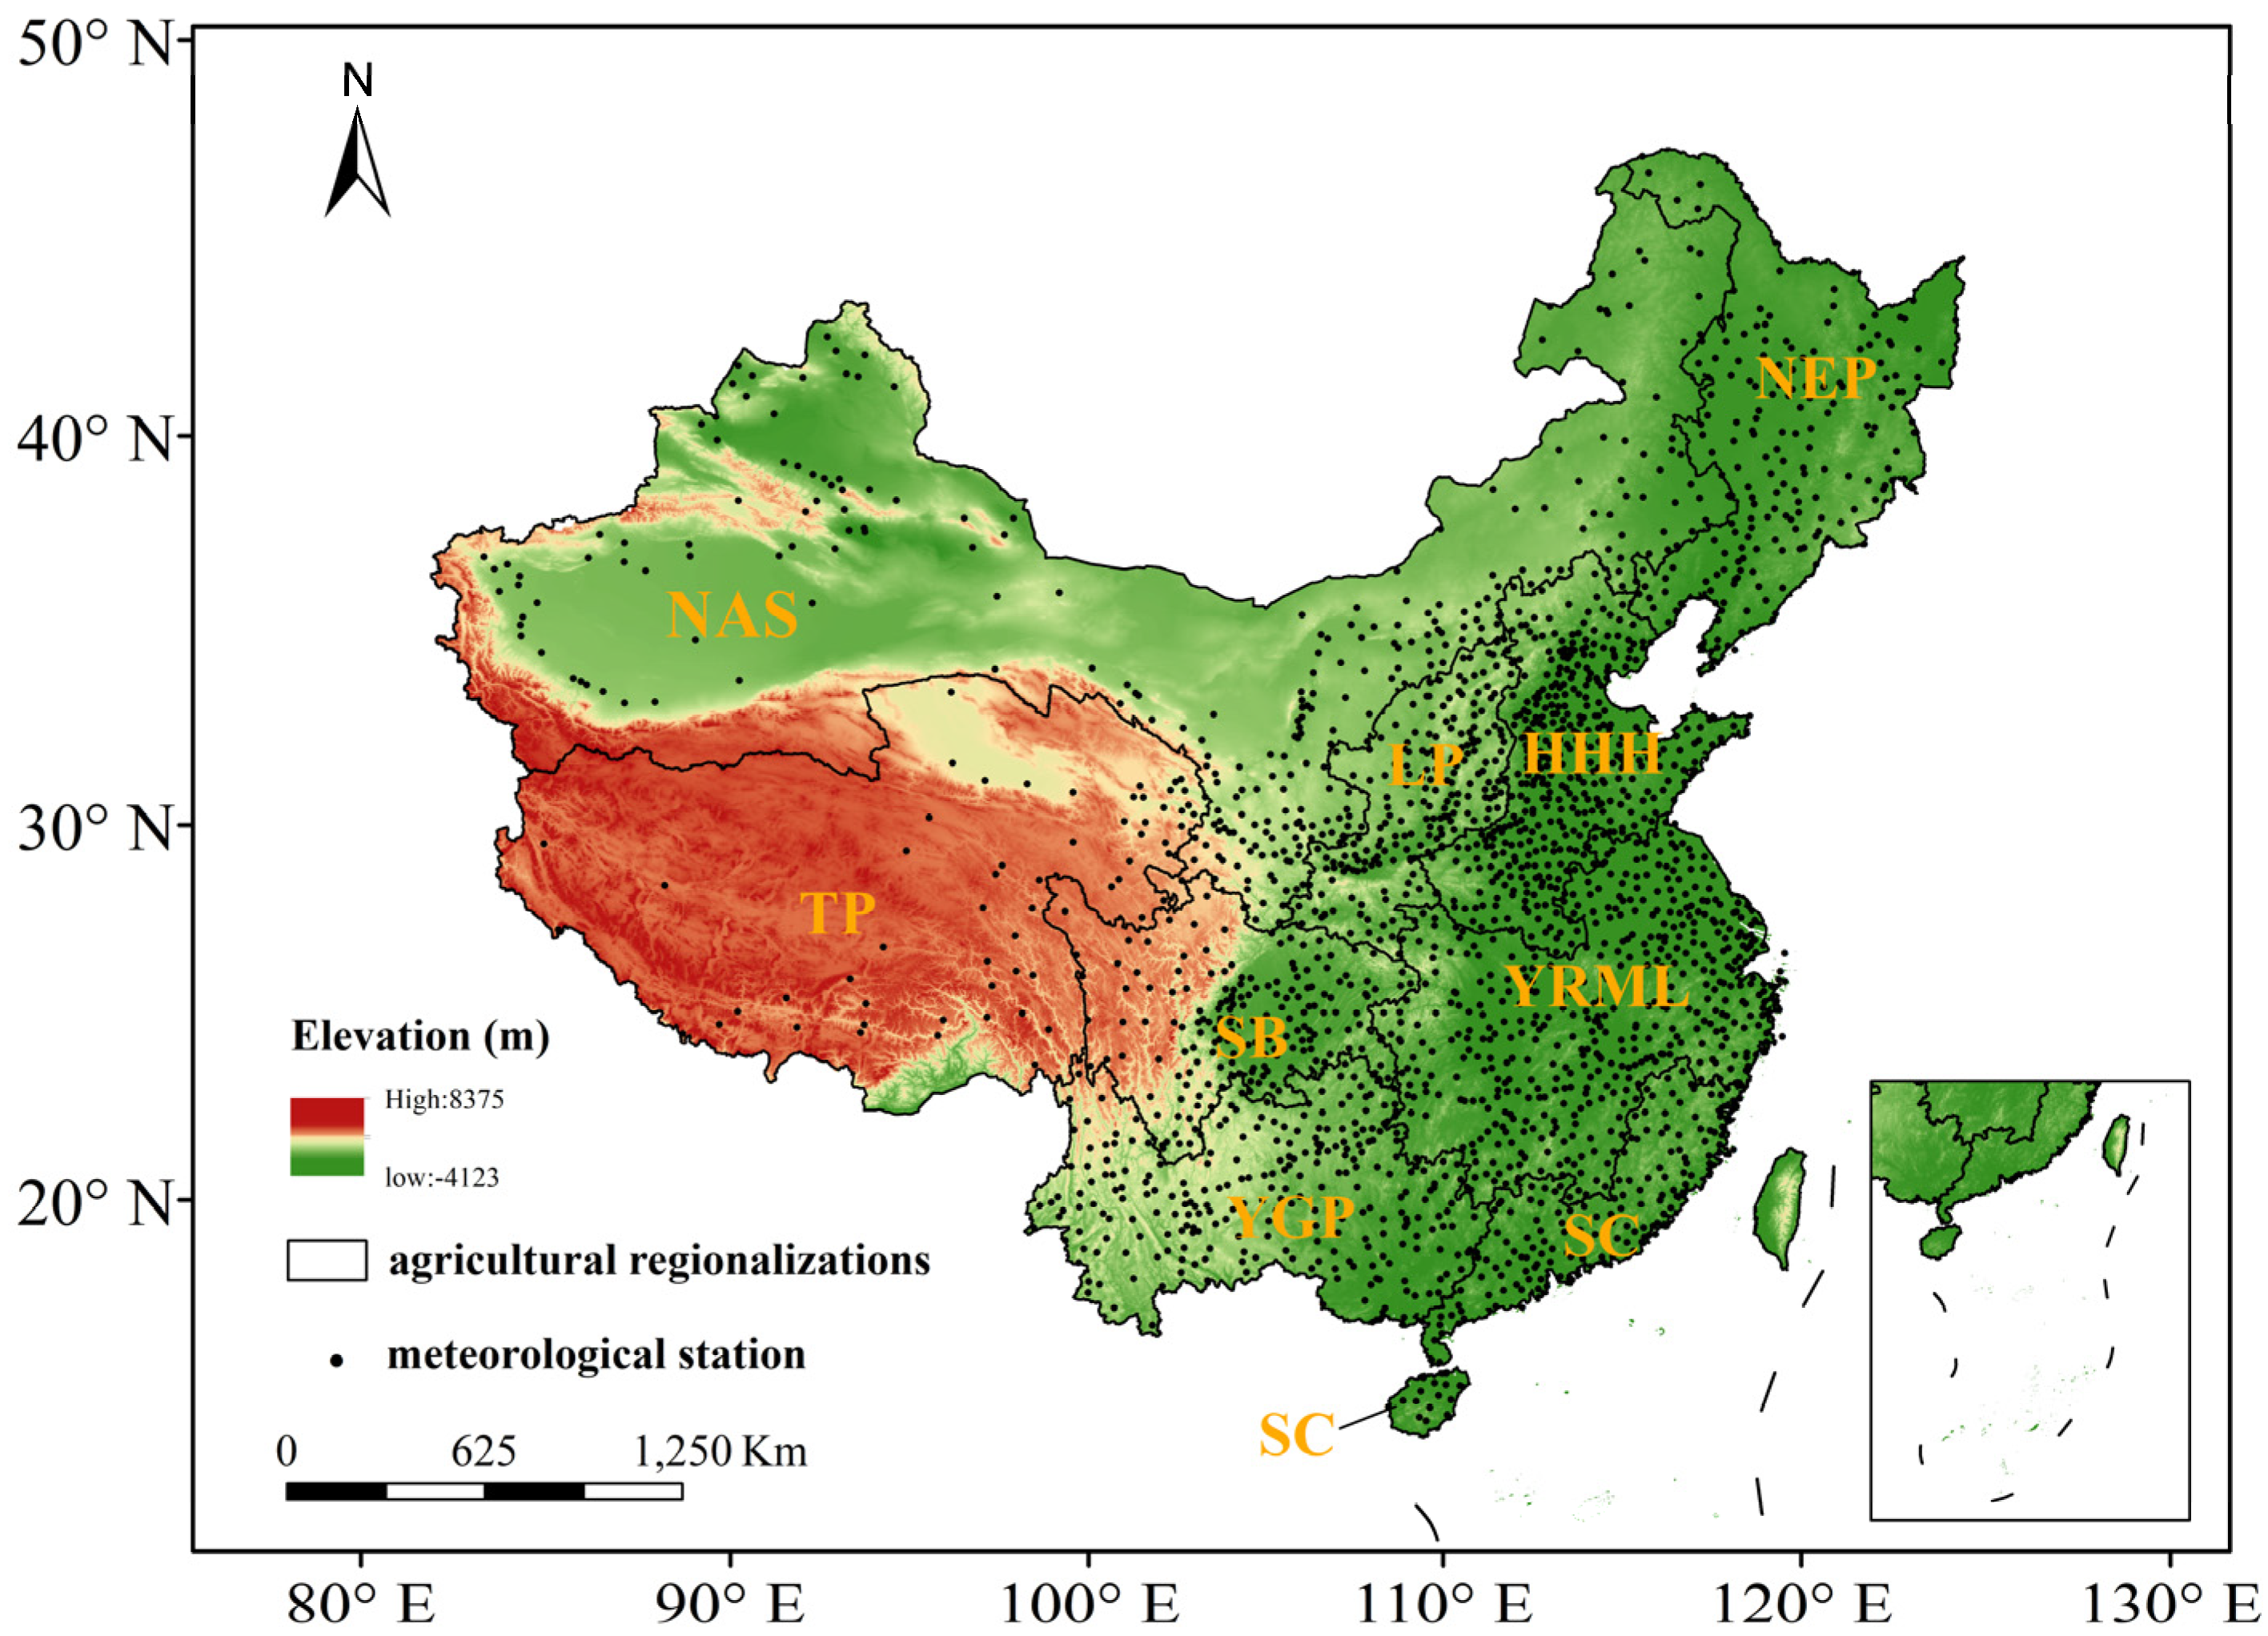
Figure 1. Distribution of 2168 hourly weather stations and elevation map of China.
Remotesensing 17 01732 g001
Figure 2. Assessment of instantaneous nighttime Ta estimated by the HAP and the ALR methods compared with station measurements at nine agricultural zones. For clarity, 1000 data points were randomly selected from each region.
Remotesensing 17 01732 g002
Figure 3. Assessment of nighttime Tmin estimated by the HAP and the LST methods compared with station measurements at nine agricultural zones. For clarity, 1000 data points were randomly selected from each region.
Remotesensing 17 01732 g003
Figure 4. Spatial distribution of the performance of instantaneous nighttime Ta estimated using the HAP and ALR methods using 2168 hourly meteorological stations.
Remotesensing 17 01732 g004
Figure 5. Spatial distribution of the performance of nighttime minimum Tmin estimated by the HAP method and LST method using 2168 hourly meteorological stations.
Remotesensing 17 01732 g005
Figure 6. Seasonal performance of instantaneous nighttime near-surface air temperature at nine agricultural areas based on MOD and MYD datasets using the HAP and ALR methods.
Remotesensing 17 01732 g006
Figure 7. Seasonal performance of daily minimum air temperature at nine agricultural areas based on MOD and MYD datasets using the HAP and LST methods.
Remotesensing 17 01732 g007
Figure 8. The RMSE distribution of instantaneous nighttime Ta estimated by the ALR method using MYD07 data along altitude gradients at nine agricultural areas.
Remotesensing 17 01732 g008
Figure 9. The RMSE distribution of Tmin estimated using the LST method with MYD11 data along altitude gradients at nine agricultural areas.
Remotesensing 17 01732 g009
Disclaimer/Publisher’s Note: The statements, opinions and data contained in all publications are solely those of the individual author(s) and contributor(s) and not of MDPI and/or the editor(s). MDPI and/or the editor(s) disclaim responsibility for any injury to people or property resulting from any ideas, methods, instructions or products referred to in the content.