
Daytime Surface Urban Heat Island Variation in Response to Future Urban Expansion: An Assessment of Different Climate Regimes


Abstract
1. Introduction
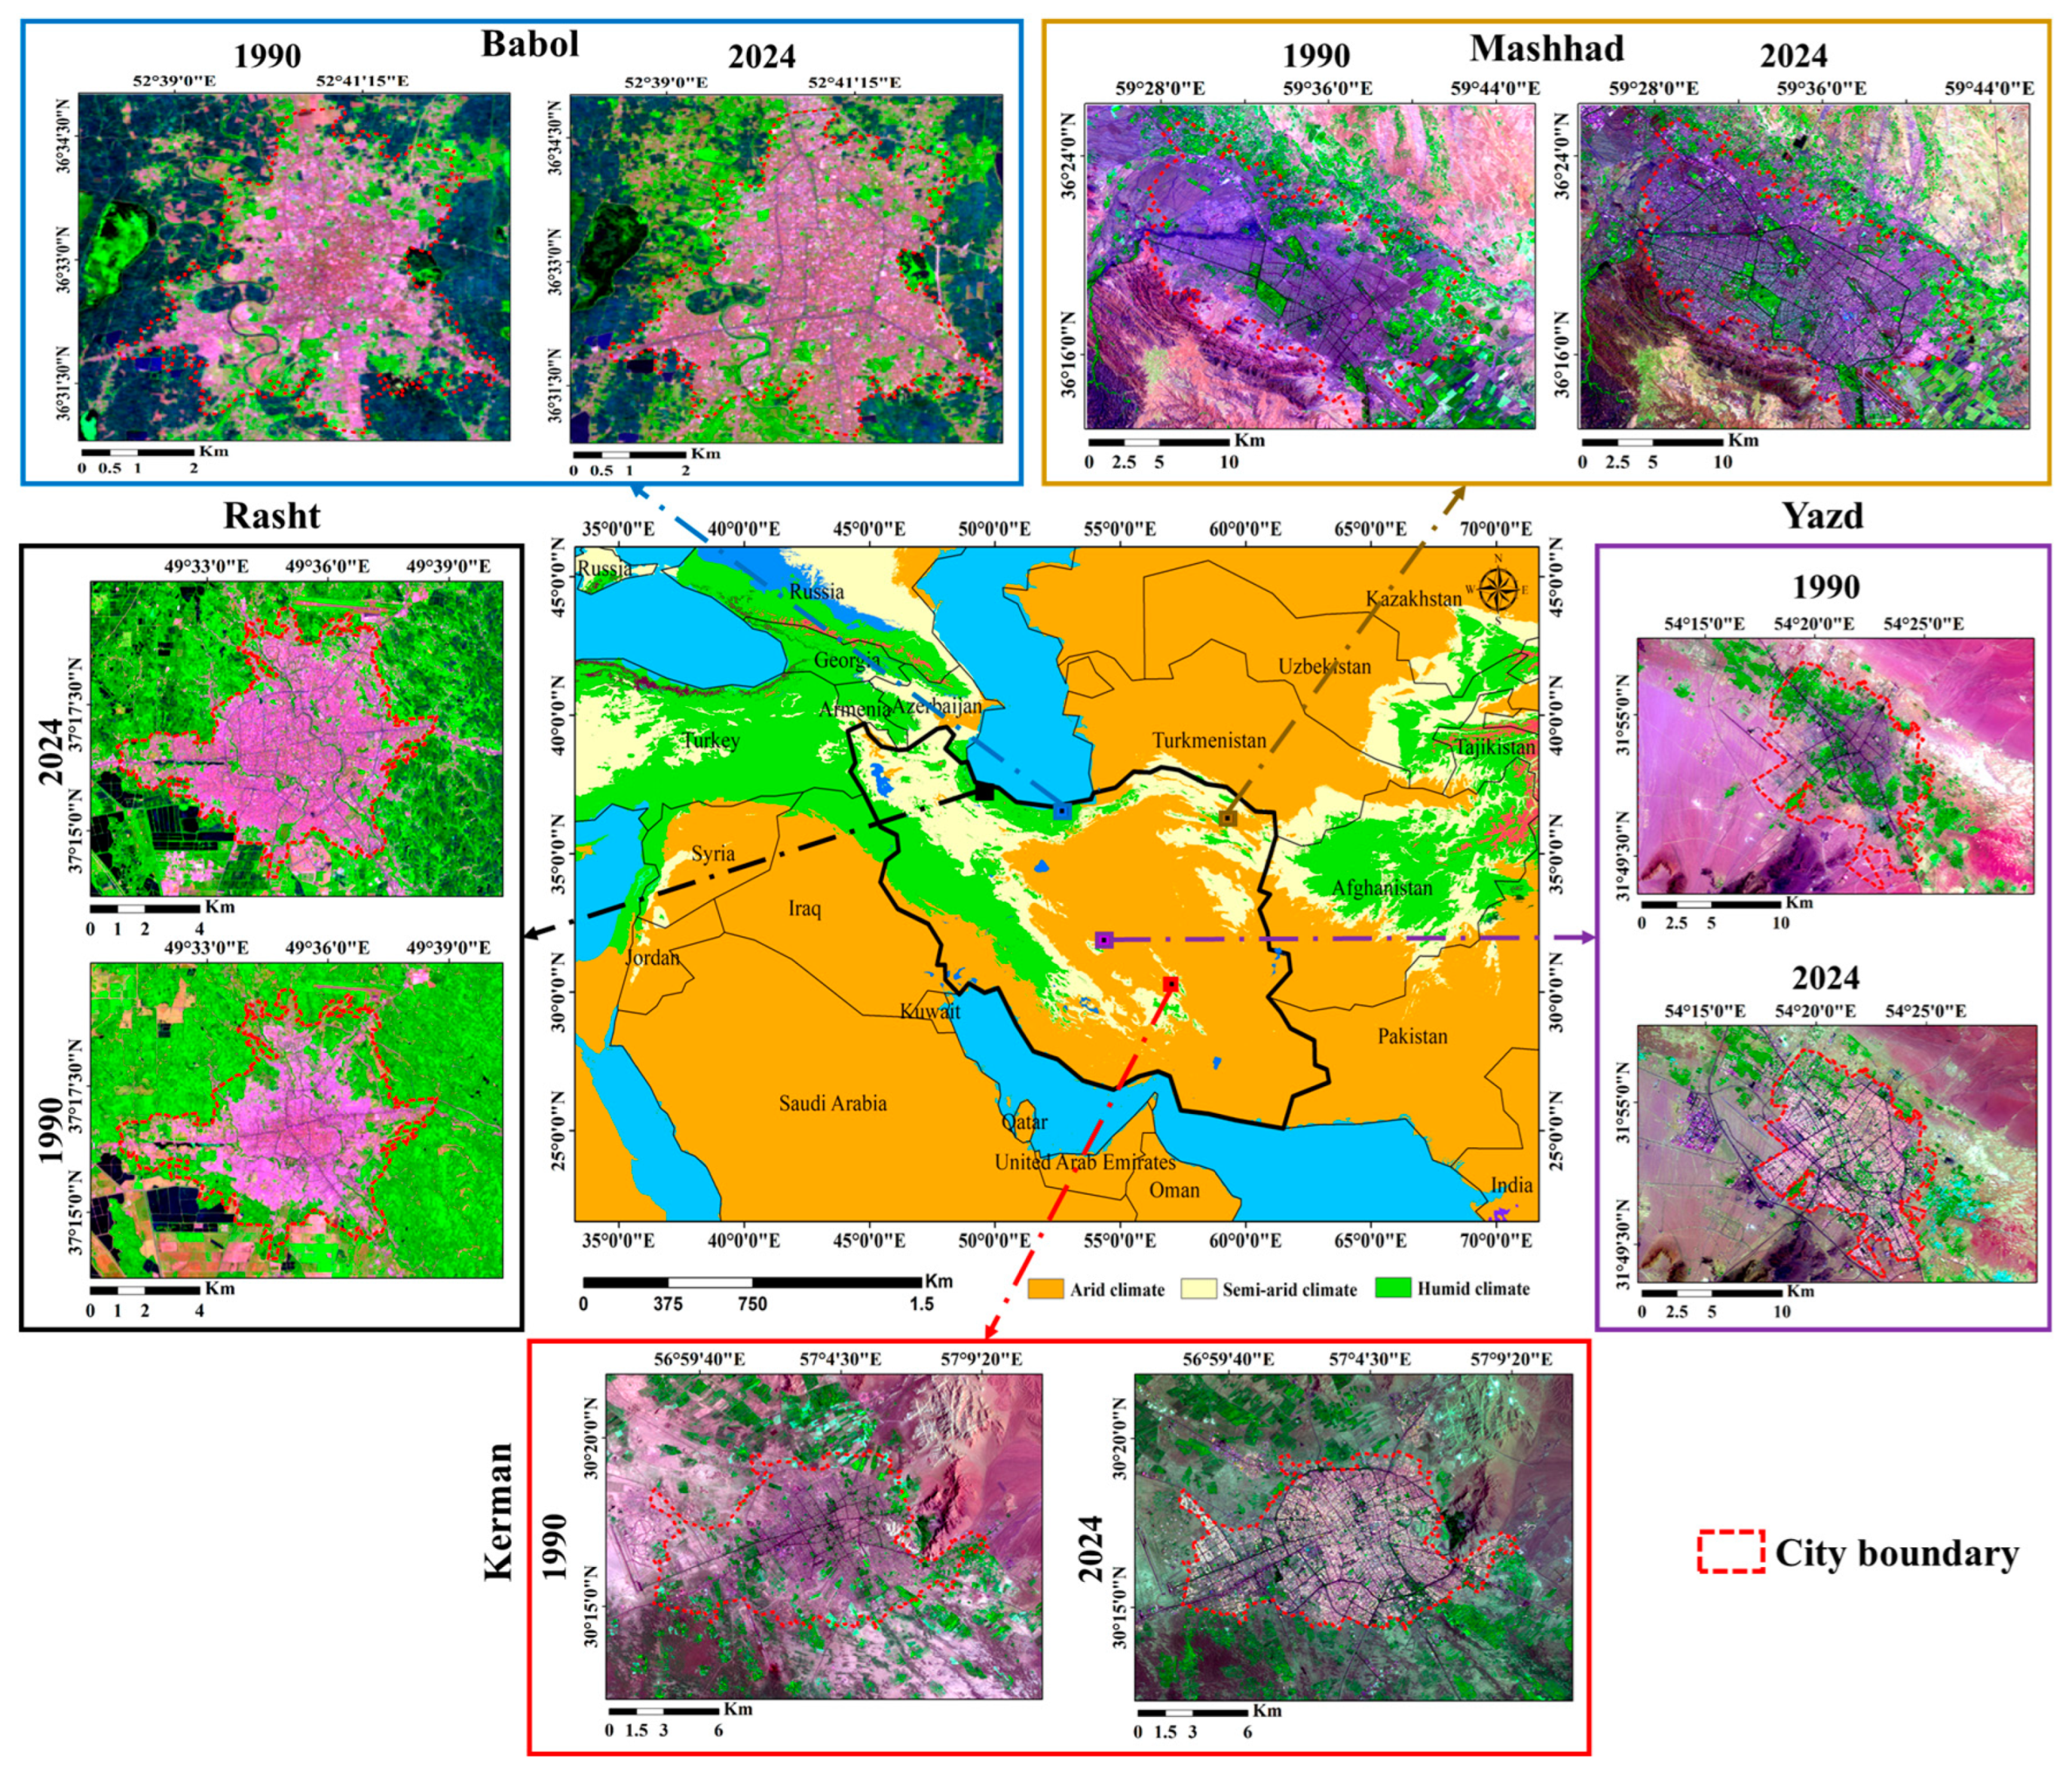
2. Study Area
- -
- Mashhad: Located in the northeast of Iran at a latitude of 36°17′ and longitude of 59°35′, Mashhad has a moderate, semi-cold, and dry climate. The city’s average annual temperature is approximately 17.1 °C, and the annual rainfall is around 300 mm. The city is situated at an elevation of 970 m above sea level.
- -
- Rasht: Situated in northern Iran at a latitude of 37°16′ and longitude of 49°36′, Rasht has a moderate, humid, Caspian climate. The average annual temperature is around 16 °C, with an annual rainfall of approximately 1500 mm. Rasht lies at an elevation of about 10 m above sea level.
- -
- Yazd: Positioned at a latitude of 31°25′ and longitude of 54°24′, Yazd experiences a hot, dry, and desert climate. The average annual temperature is about 19.2 °C, with an annual rainfall around 120 mm. Yazd is located at an elevation of 1240 m above sea level.
- -
- Kerman: Located in southeastern Iran at a latitude of 30°18′ and longitude of 56°56′, Kerman has a hot, dry climate. The average annual temperature is around 18.8 °C, with an annual rainfall of about 200 mm. Kerman is situated at an elevation of 1750 m above sea level.
- -
- Babol: Situated in northern Iran at a latitude of 36°33′ and longitude of 52°43′, Babol has a humid, Caspian climate. The average annual temperature is approximately 15.9 °C, and the annual rainfall is around 1500 mm. Babol lies at an elevation of about 30 m above sea level.
3. Data and Methods
3.1. Data
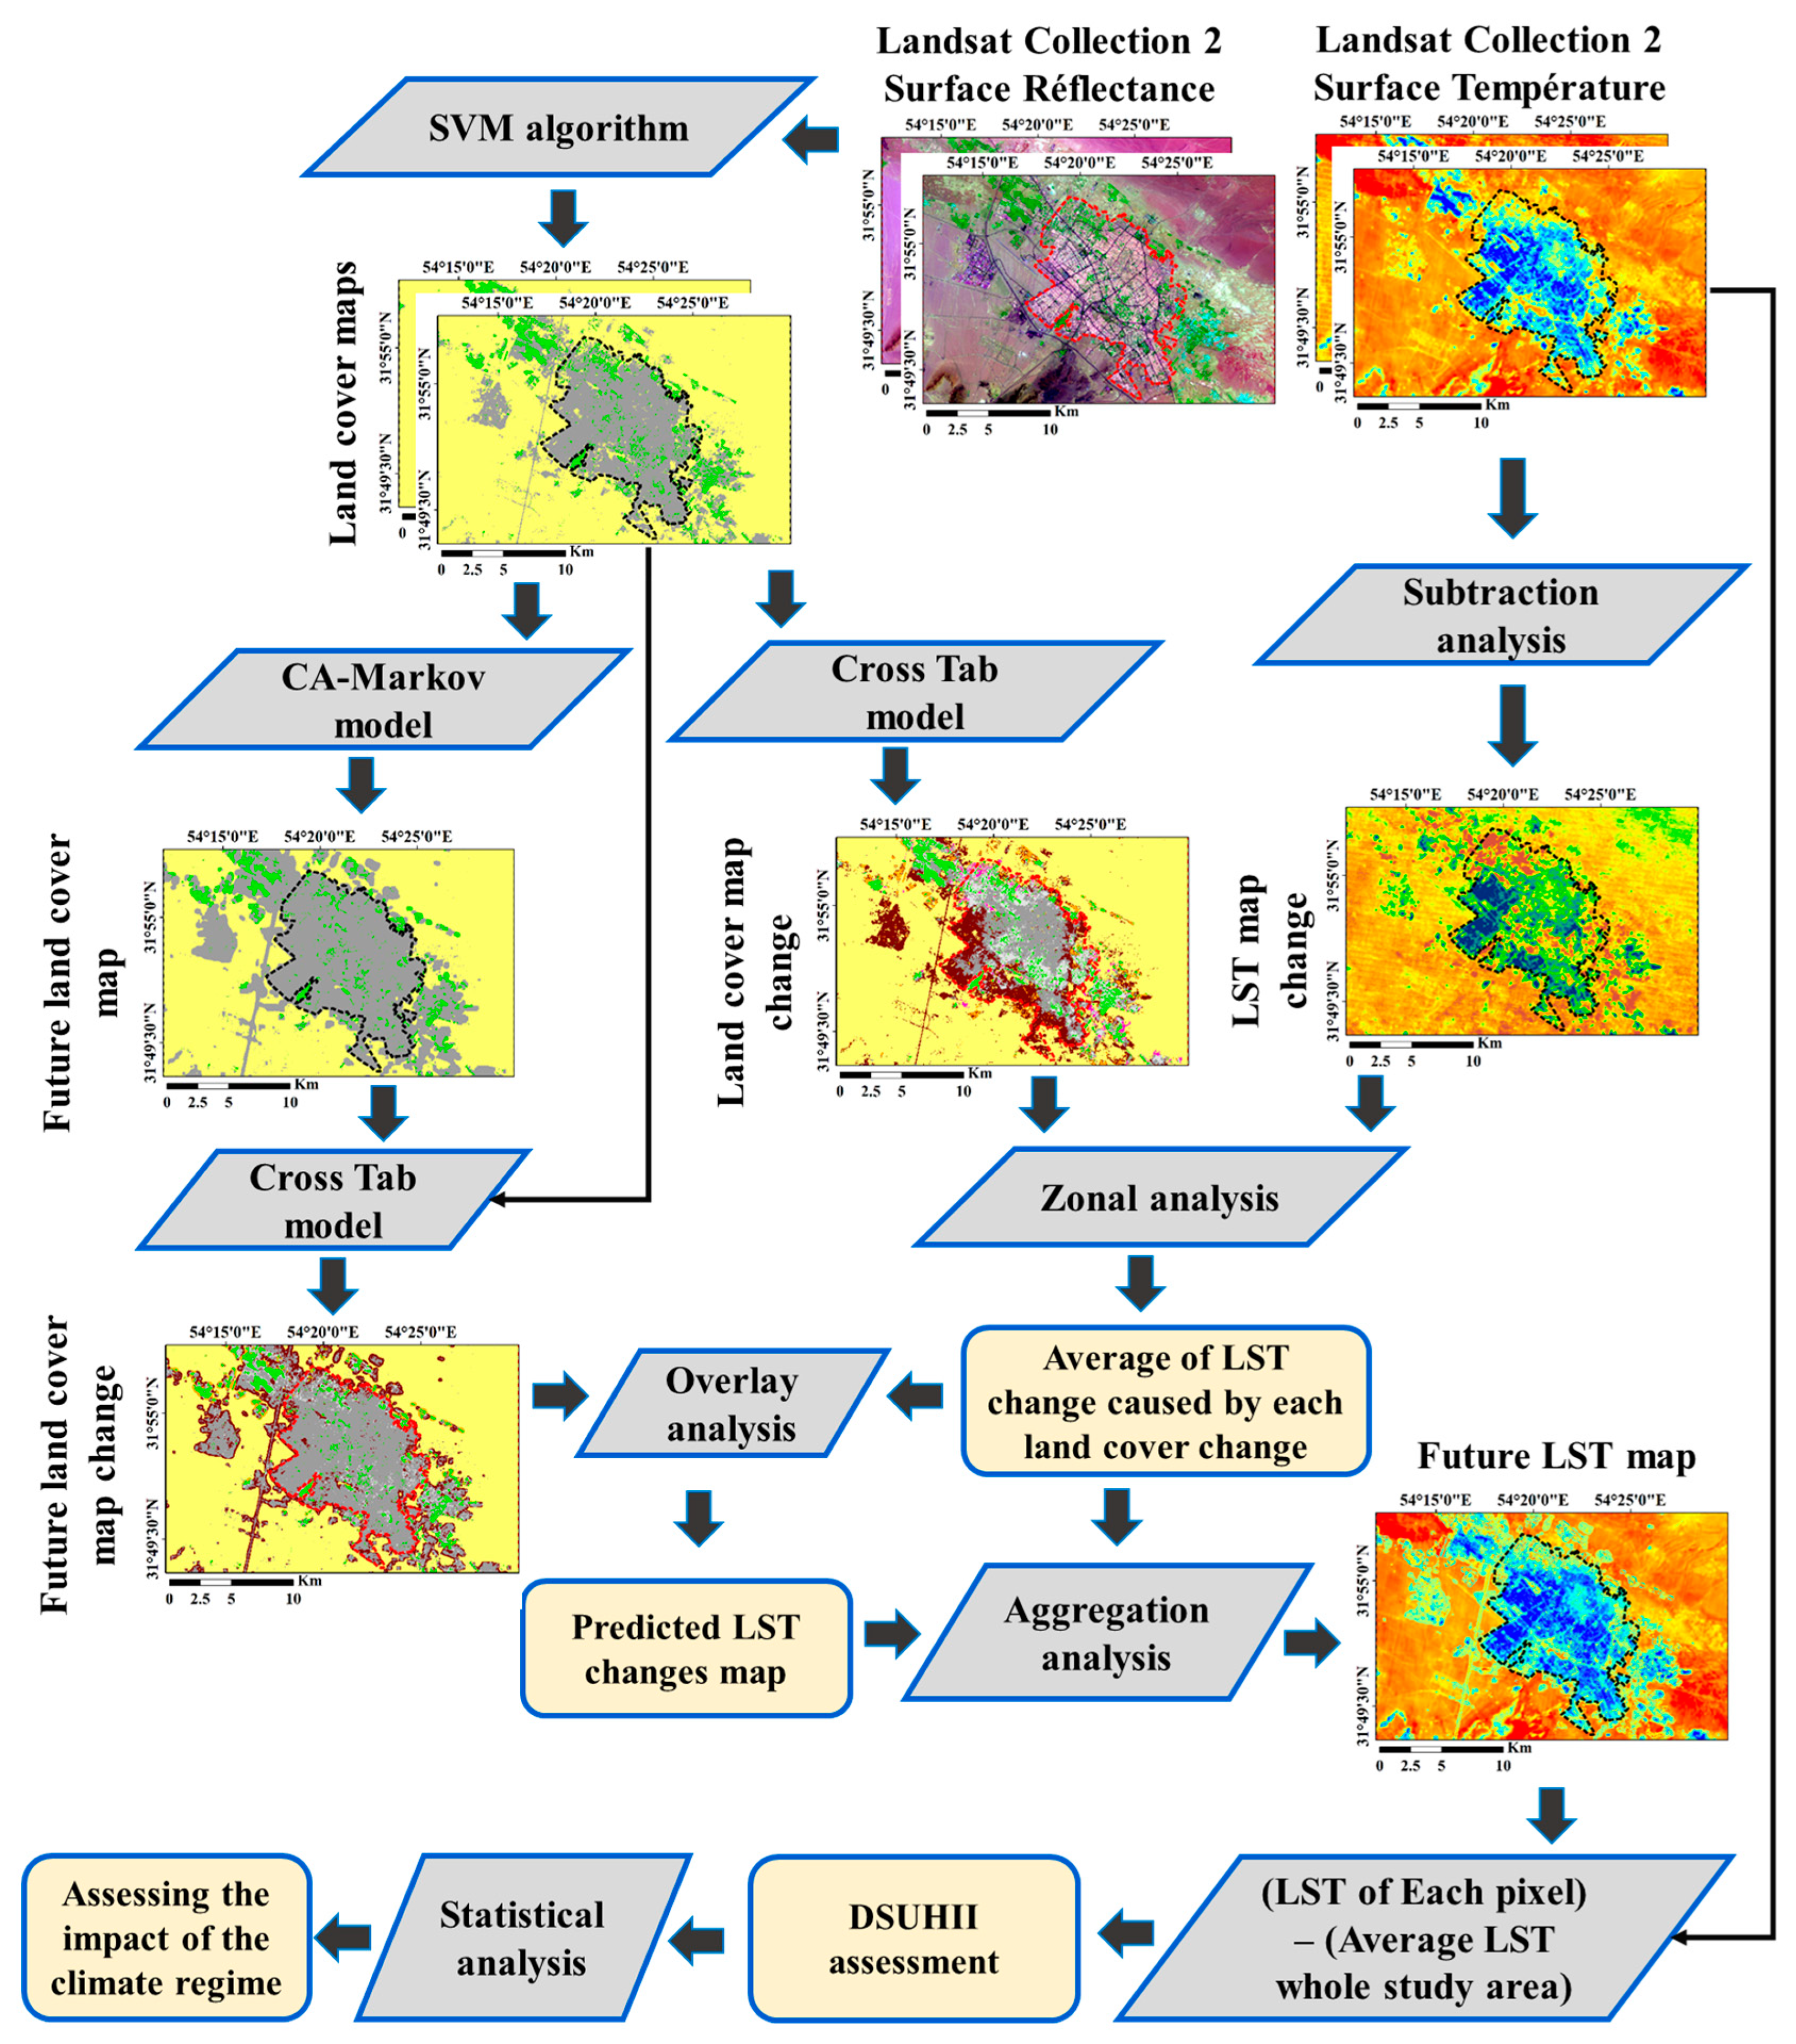
3.2. Methods
3.2.1. Land-Cover Mapping
3.2.2. Land-Cover Prediction
3.2.3. LST Prediction
3.2.4. LST Classes and DSUHII Changes
4. Results
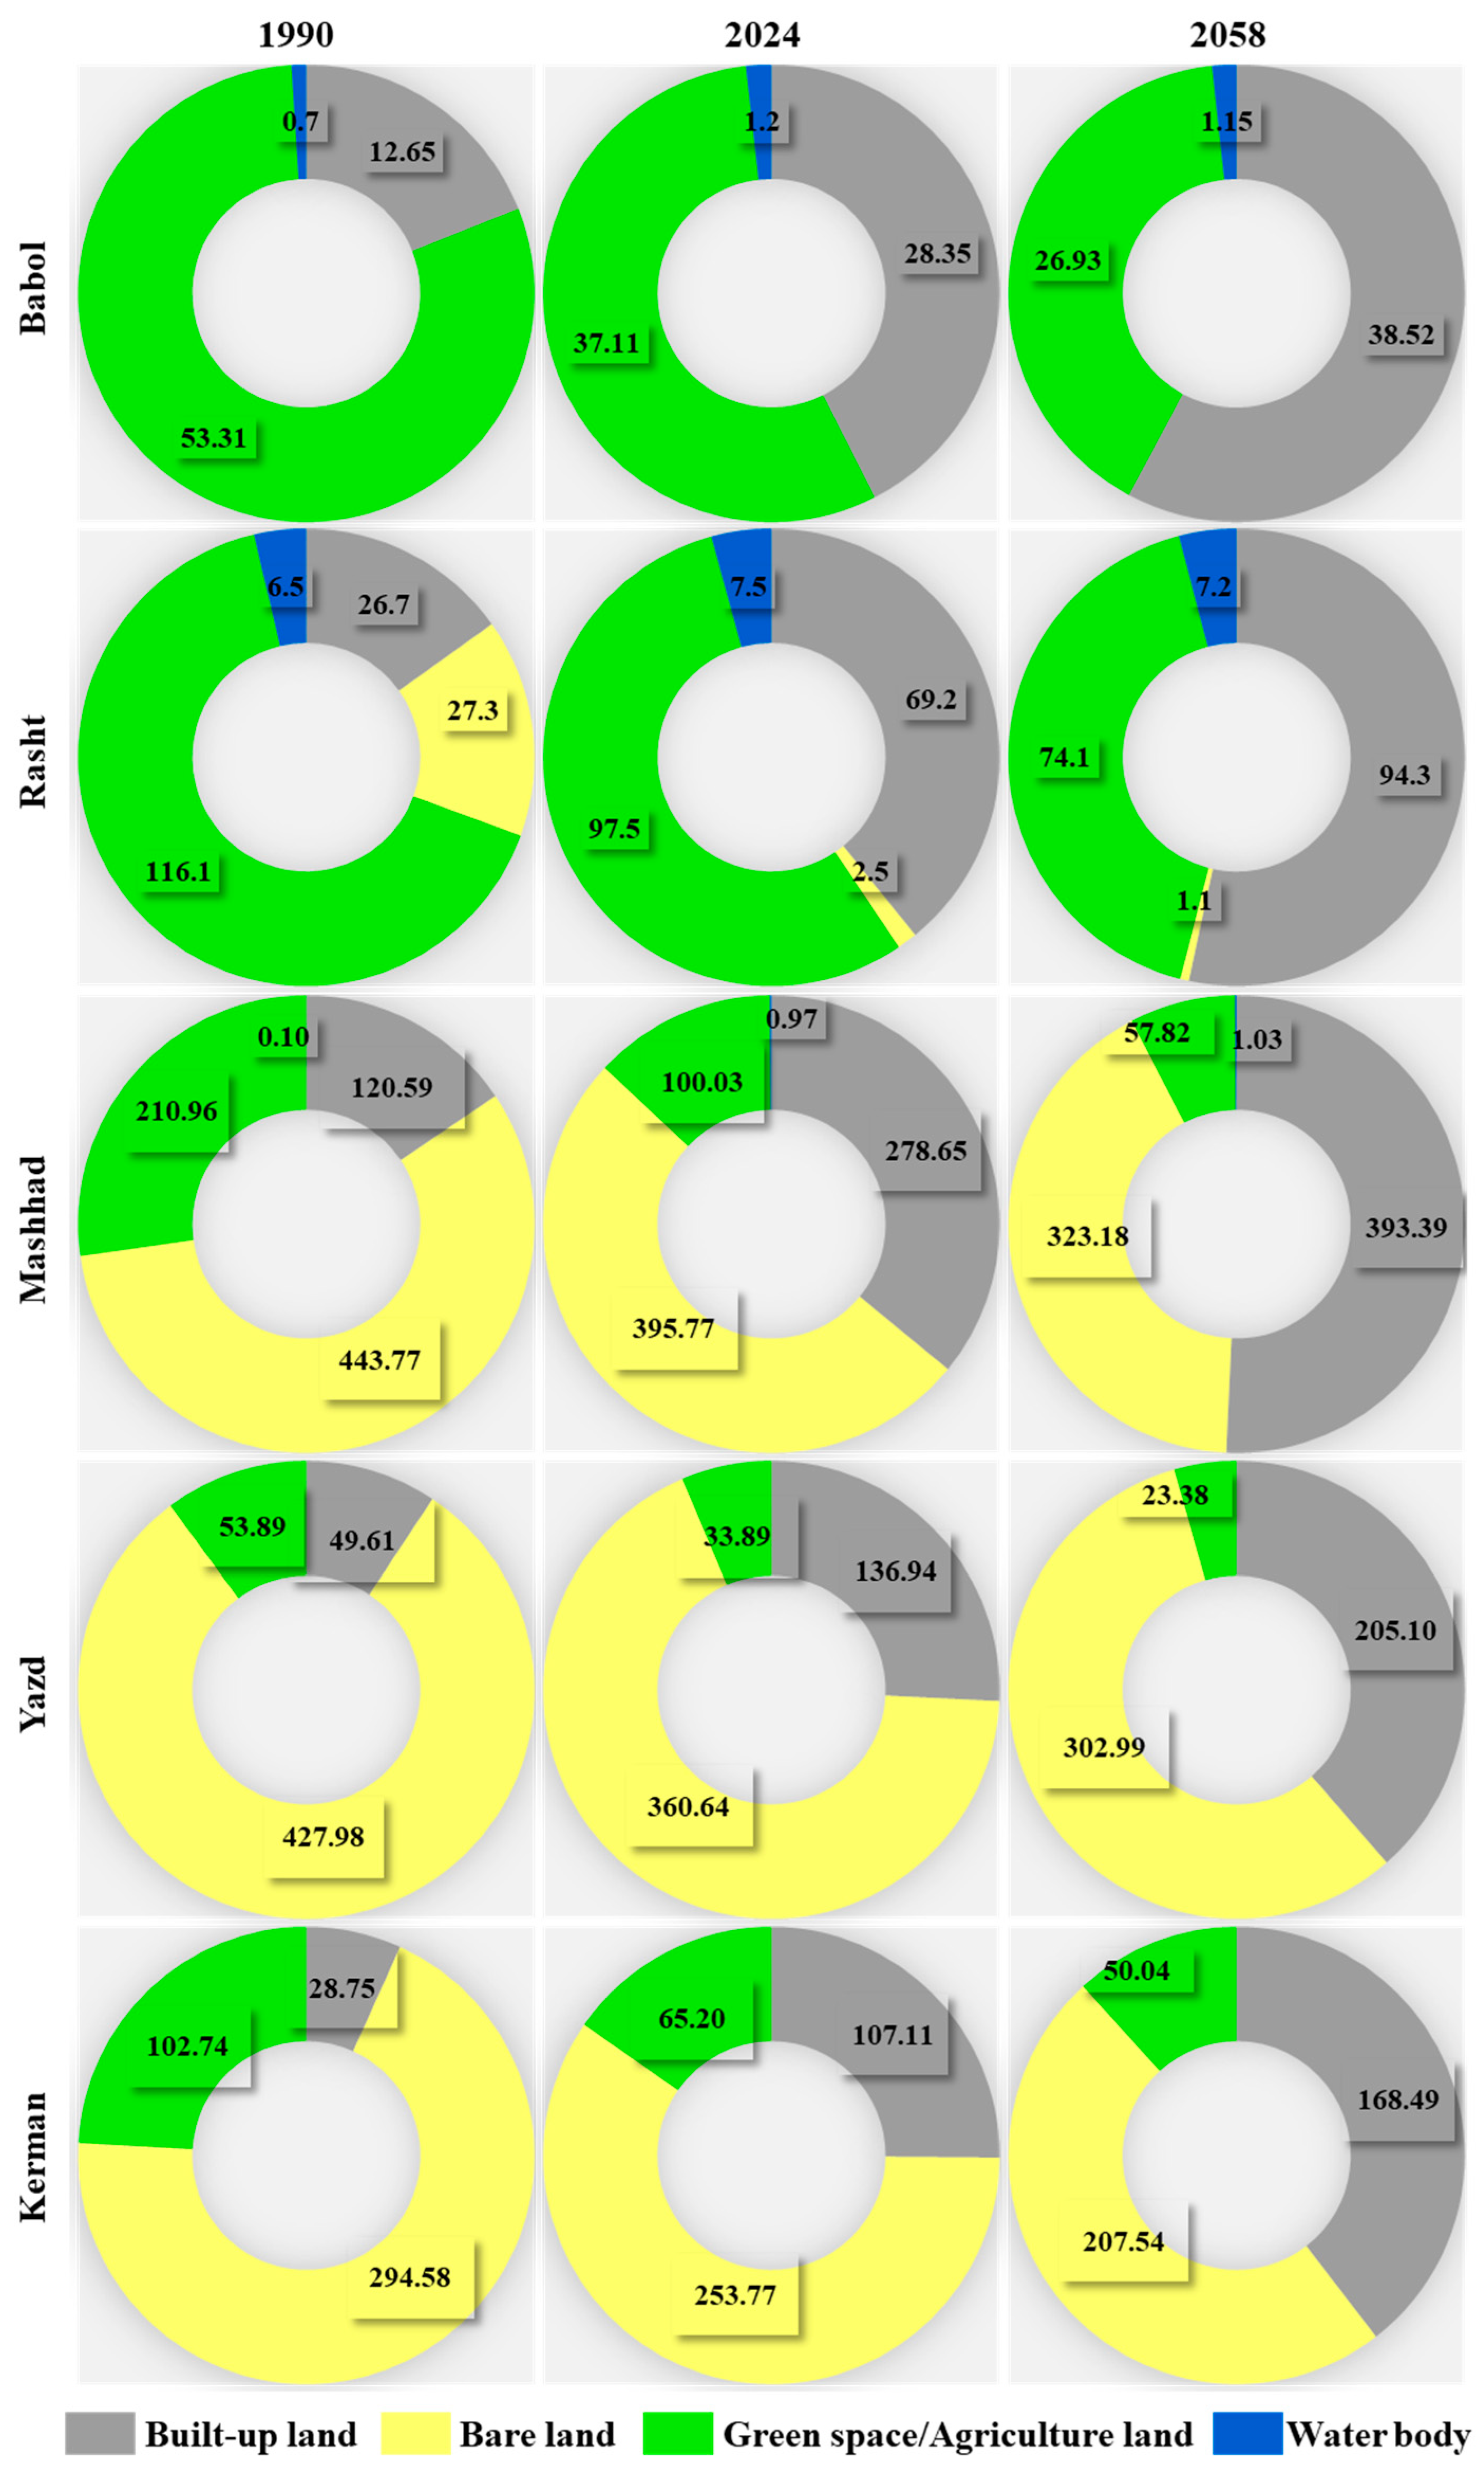
4.1. Land-Cover Maps
4.2. Land-Cover Changes
4.3. LST Maps
4.4. LST Changes
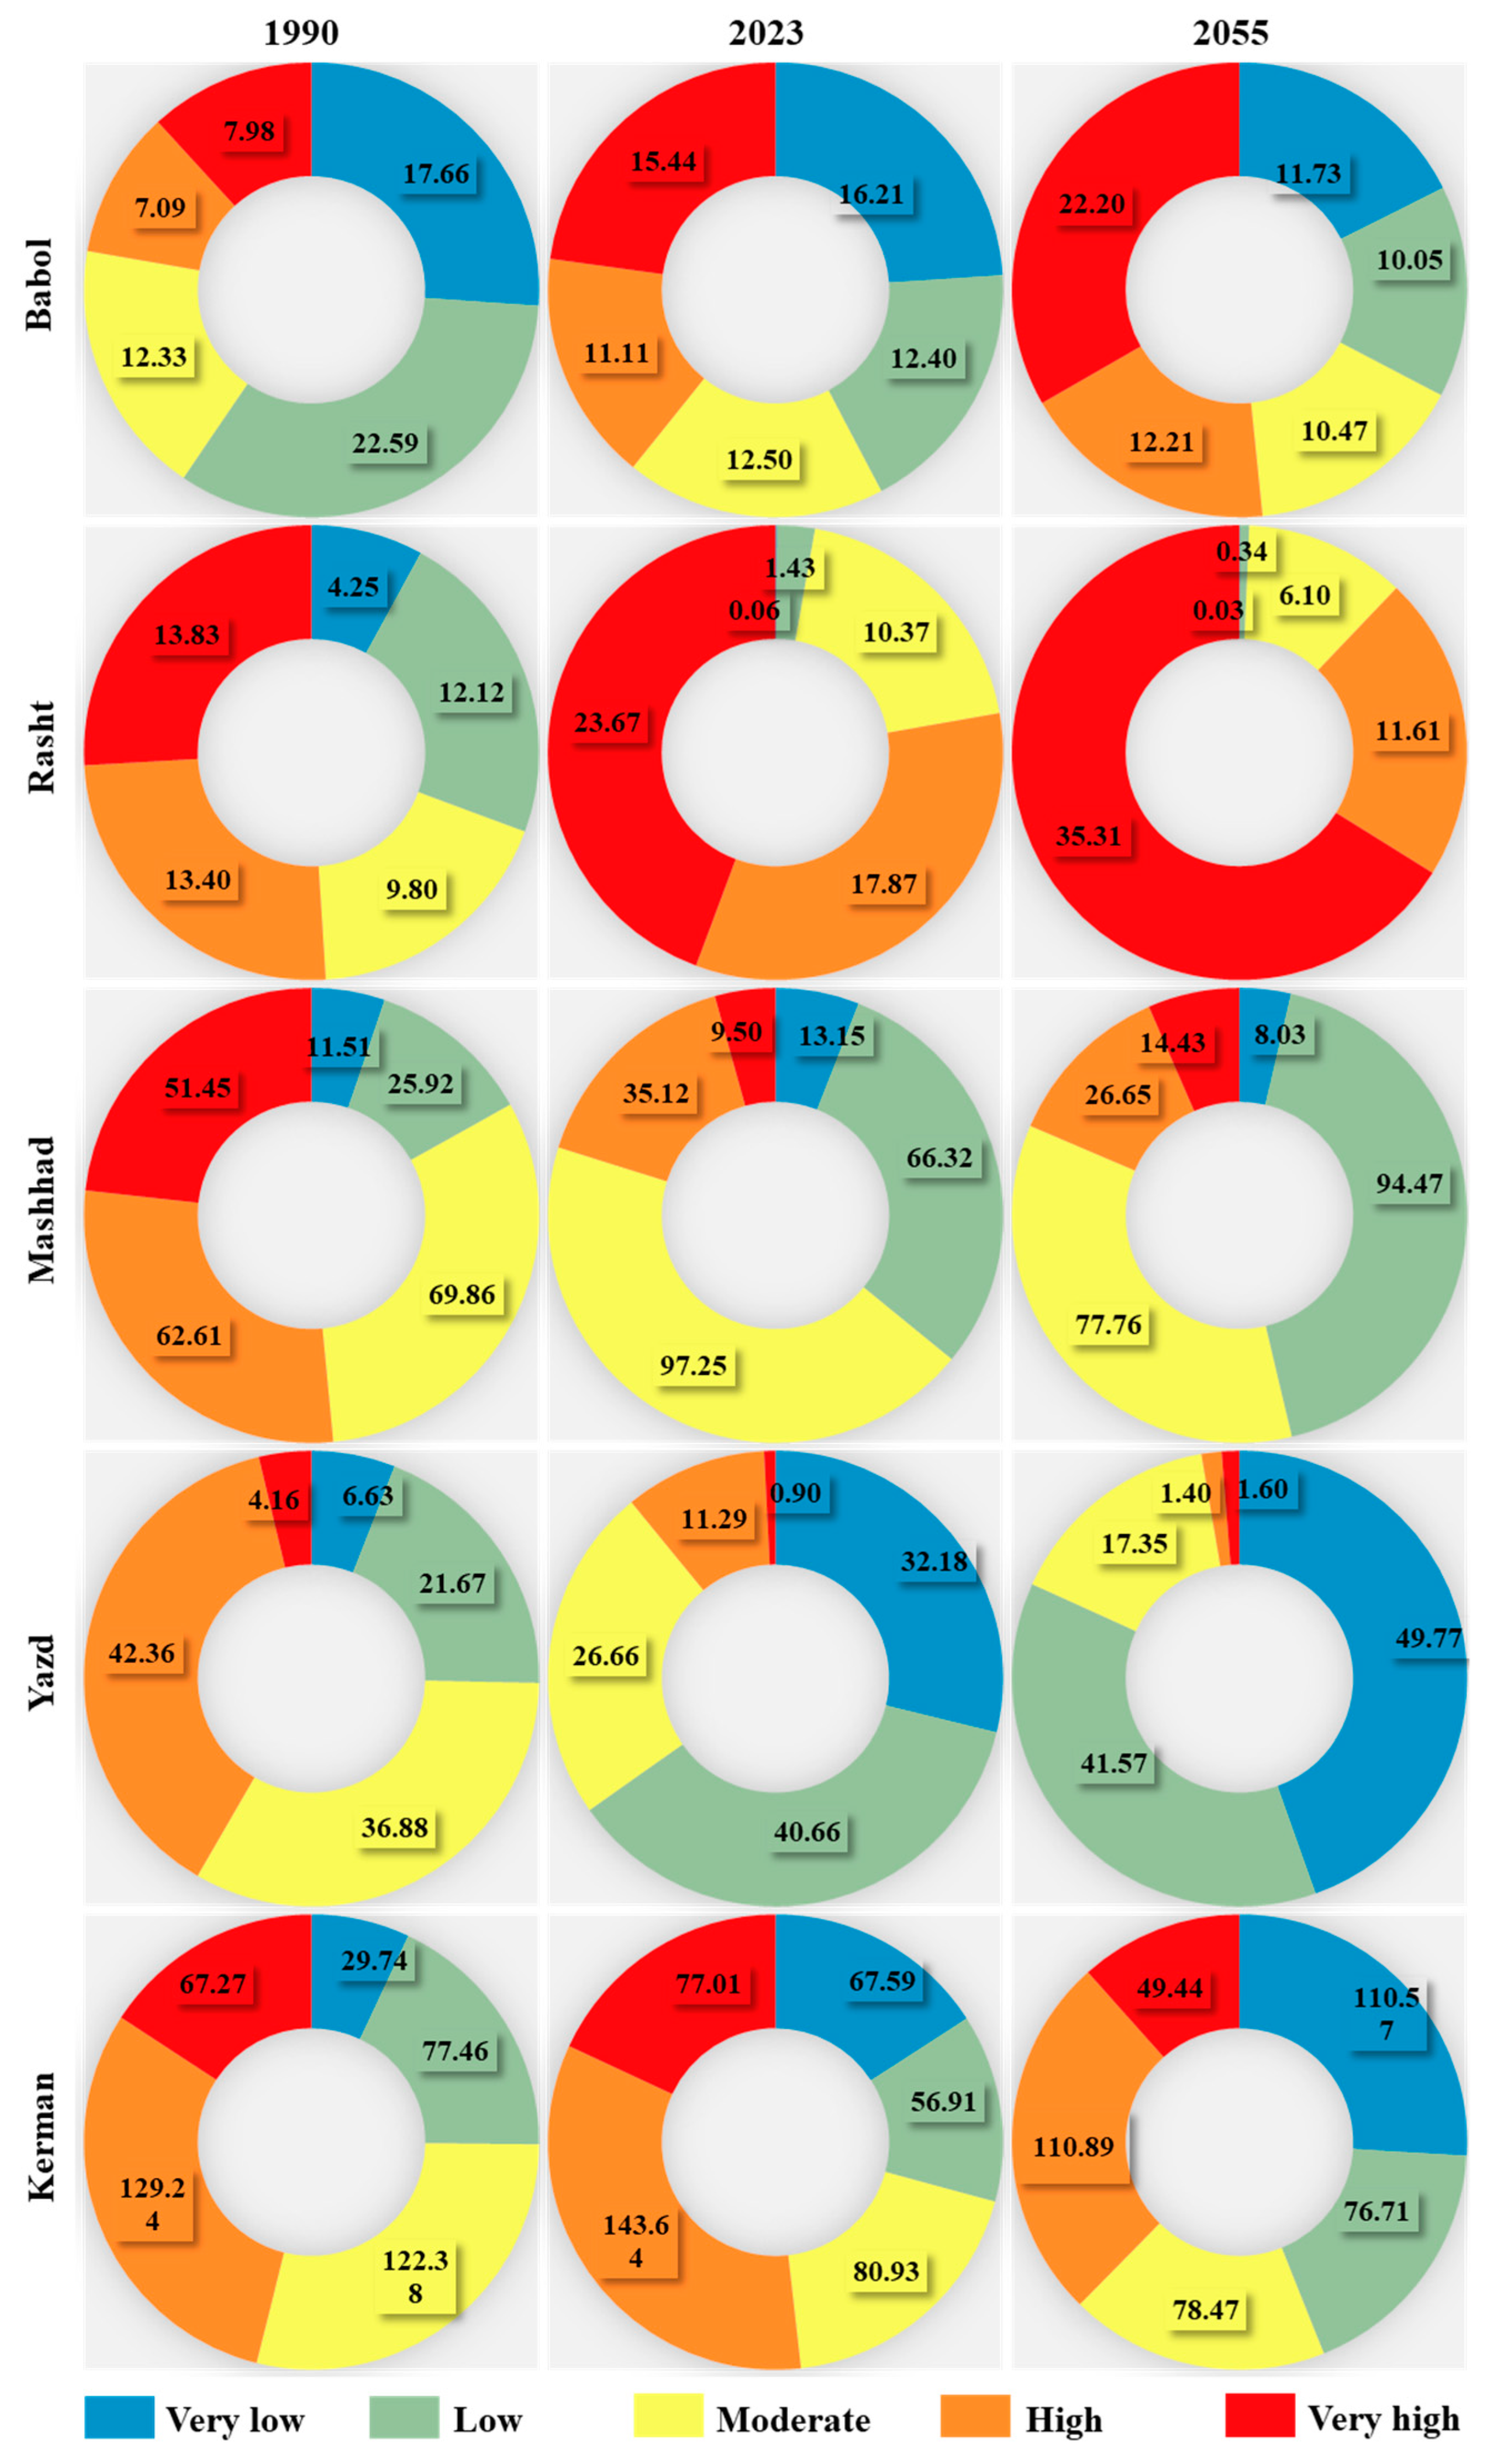
4.5. LST Classification Maps
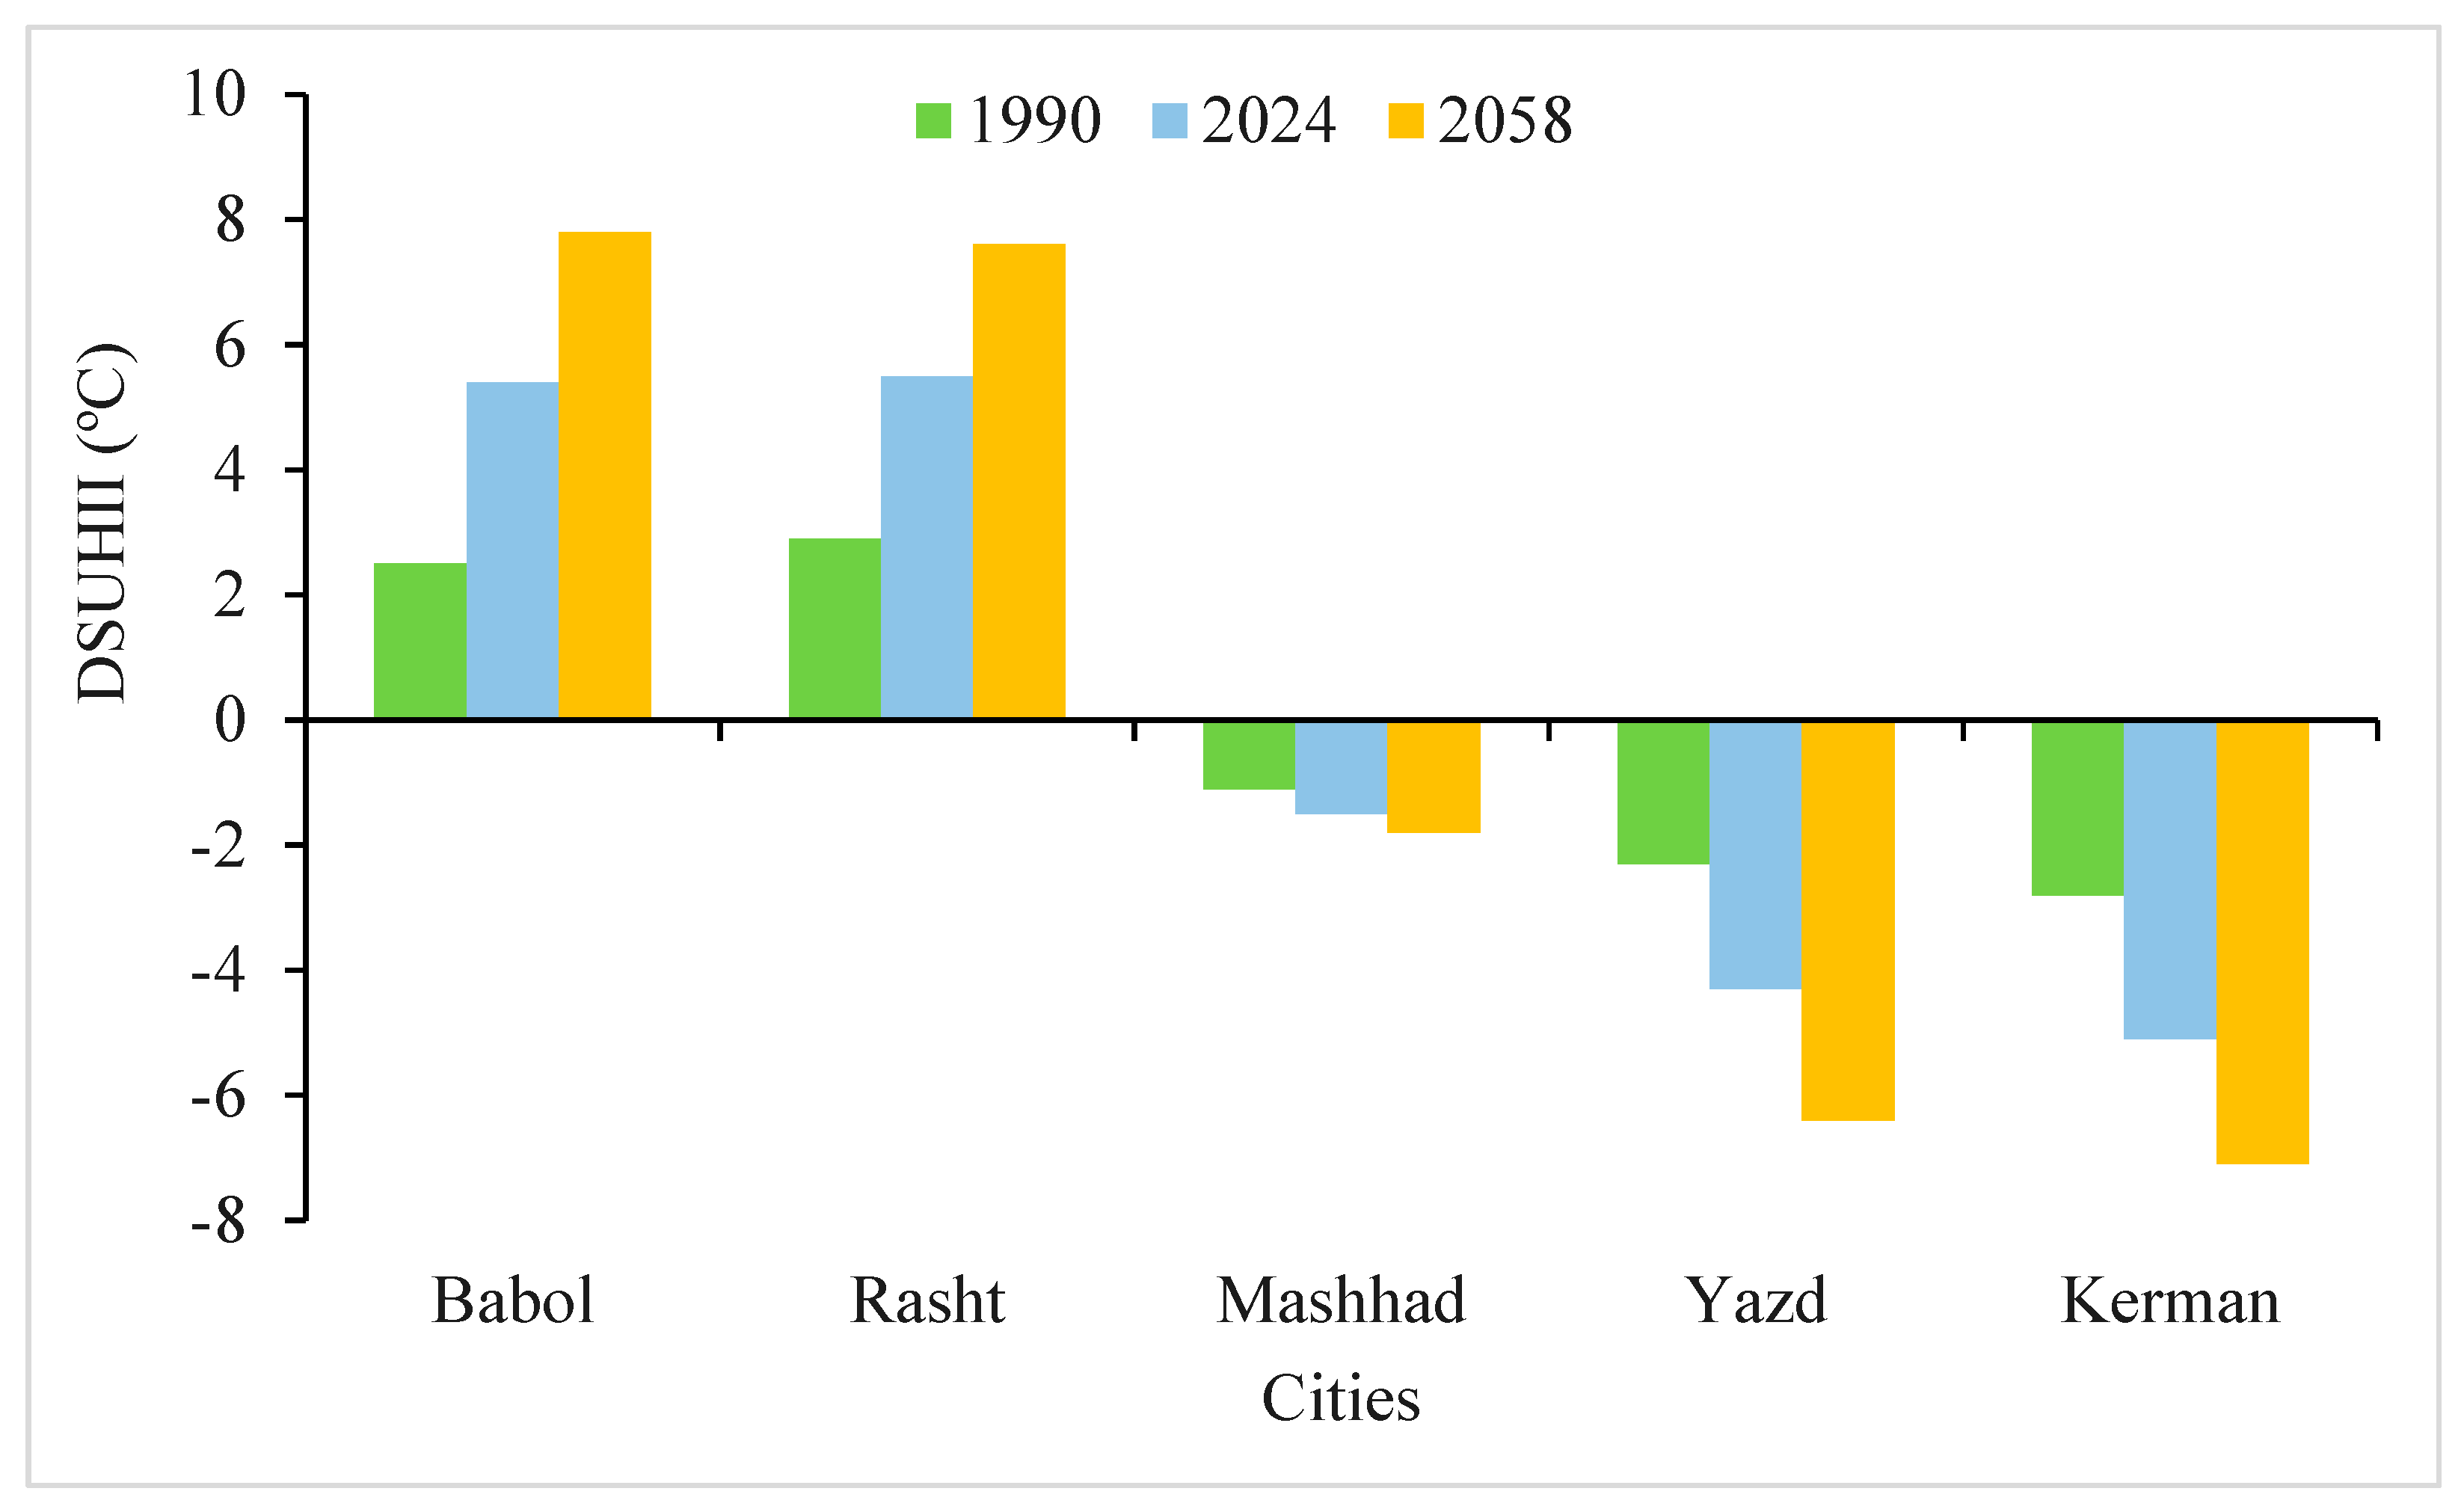
4.6. DSUHII Analysis
5. Discussions
Limitations and Future Recommendations
6. Conclusions
Author Contributions
Funding
Data Availability Statement
Conflicts of Interest
References
- Priya, A.K.; Muruganandam, M.; Rajamanickam, S.; Sivarethinamohan, S.; Gaddam, M.K.R.; Velusamy, P.; Gomathi, R.; Ravindiran, G.; Gurugubelli, T.R.; Muniasamy, S.K. Impact of climate change and anthropogenic activities on aquatic ecosystem–A review. Environ. Res. 2023, 238, 117233. [Google Scholar]
- Abbass, K.; Qasim, M.Z.; Song, H.; Murshed, M.; Mahmood, H.; Younis, I. A review of the global climate change impacts, adaptation, and sustainable mitigation measures. Environ. Sci. Pollut. Res. 2022, 29, 42539–42559. [Google Scholar] [CrossRef] [PubMed]
- Bartholy, J.; Pongrácz, R. A brief review of health-related issues occurring in urban areas related to global warming of 1.5 °C. Curr. Opin. Environ. Sustain. 2018, 30, 123–132. [Google Scholar] [CrossRef]
- Nayak, H.; Yadav, S.P.; Yadav, D.K. Contribution of Natural and Anthropogenic Activities in Greenhouse Gases Emission. Food Sci. Rep. 2020, 1, 50–53. [Google Scholar]
- Moser-Reischl, A.; Rahman, M.A.; Pauleit, S.; Pretzsch, H.; Rötzer, T. Growth patterns and effects of urban micro-climate on two physiologically contrasting urban tree species. Landsc. Urban Plan. 2019, 183, 88–99. [Google Scholar] [CrossRef]
- Kamal, A.; Abidi, S.M.H.; Mahfouz, A.; Kadam, S.; Rahman, A.; Hassan, I.G.; Wang, L.L. Impact of urban morphology on urban microclimate and building energy loads. Energy Build. 2021, 253, 111499. [Google Scholar] [CrossRef]
- Guo, L.; Guo, X.; Li, B.; Wang, E. The impact of block morphology on urban microclimates: A case study of three cities in cold regions of China. Urban Clim. 2024, 57, 102098. [Google Scholar] [CrossRef]
- Wang, R.; Lu, T.; He, B.; Wang, F.; Huang, Q.; Qian, Z.; Min, J.; Li, Y. Seasonal urban surface thermal environment analysis based on local climate zones: A case study of Chongqing. Sci. Total Environ. 2024, 954, 176577. [Google Scholar] [CrossRef]
- Hurduc, A.; Ermida, S.L.; Trigo, I.F.; DaCamara, C.C. Importance of temporal dimension and rural land cover when computing surface urban Heat Island intensity. Urban Clim. 2024, 56, 102013. [Google Scholar] [CrossRef]
- Fernandes, R.; Nascimento, V.; Freitas, M.; Ometto, J. Local climate zones to Identify Surface Urban Heat Islands: A systematic review. Remote Sens. 2023, 15, 884. [Google Scholar] [CrossRef]
- Zhou, D.; Xiao, J.; Bonafoni, S.; Berger, C.; Deilami, K.; Zhou, Y.; Frolking, S.; Yao, R.; Qiao, Z.; Sobrino, J.A. Satellite remote sensing of surface urban heat islands: Progress, challenges, and perspectives. Remote Sens. 2019, 11, 48. [Google Scholar] [CrossRef]
- Sobrino, J.A.; Oltra-Carrió, R.; Sòria, G.; Jiménez-Muñoz, J.C.; Franch, B.; Hidalgo, V.; Mattar, C.; Julien, Y.; Cuenca, J.; Romaguera, M. Evaluation of the surface urban heat island effect in the city of Madrid by thermal remote sensing. Int. J. Remote Sens. 2012, 34, 3177–3192. [Google Scholar] [CrossRef]
- Derdouri, A.; Wang, R.; Murayama, Y.; Osaragi, T. Understanding the links between LULC changes and SUHI in cities: Insights from two-decadal studies (2001–2020). Remote Sens. 2021, 13, 3654. [Google Scholar] [CrossRef]
- Zhao, C.; Jensen, J.; Weng, Q.; Weaver, R. A geographically weighted regression analysis of the underlying factors related to the surface urban heat island phenomenon. Remote Sens. 2018, 10, 1428. [Google Scholar] [CrossRef]
- Guo, F.; Sun, J.; Hu, D. Surface energy balance-based surface urban heat island decomposition at high resolution. Remote Sens. Environ. 2024, 315, 114447. [Google Scholar] [CrossRef]
- Estoque, R.C.; Murayama, Y. Monitoring surface urban heat island formation in a tropical mountain city using Landsat data (1987–2015). ISPRS J. Photogramm. Remote Sens. 2017, 133, 18–29. [Google Scholar] [CrossRef]
- Tian, P.; Li, J.; Cao, L.; Pu, R.; Wang, Z.; Zhang, H.; Chen, H.; Gong, H. Assessing spatiotemporal characteristics of urban heat islands from the perspective of an urban expansion and green infrastructure. Sustain. Cities Soc. 2021, 74, 103208. [Google Scholar] [CrossRef]
- Martin, P.; Baudouin, Y.; Gachon, P. An alternative method to characterize the surface urban heat island. Int. J. Biometeorol. 2015, 59, 849–861. [Google Scholar] [CrossRef]
- Li, K.; Chen, Y.; Wang, M.; Gong, A. Spatial-temporal variations of surface urban heat island intensity induced by different definitions of rural extents in China. Sci. Total Environ. 2019, 669, 229–247. [Google Scholar] [CrossRef]
- Piracha, A.; Chaudhary, M.T. Urban air pollution, urban heat island and human health: A review of the literature. Sustainability 2022, 14, 9234. [Google Scholar] [CrossRef]
- Liao, W.; Liu, X.; Wang, D.; Sheng, Y. The impact of energy consumption on the surface urban heat island in China’s 32 major cities. Remote Sens. 2017, 9, 250. [Google Scholar] [CrossRef]
- Cichowicz, R.; Bochenek, A.D. Assessing the effects of urban heat islands and air pollution on human quality of life. Anthropocene 2024, 46, 100433. [Google Scholar] [CrossRef]
- Firozjaei, M.K.; Kiavarz, M.; Alavipanah, S.K.; Lakes, T.; Qureshi, S. Monitoring and forecasting heat island intensity through multi-temporal image analysis and cellular automata-Markov chain modelling: A case of Babol city, Iran. Ecol. Indic. 2018, 91, 155–170. [Google Scholar] [CrossRef]
- Kiavarz, M.; Hosseinbeigi, S.B.; Mijani, N.; Shahsavary, M.S.; Firozjaei, M.K. Predicting spatial and temporal changes in surface urban heat islands using multi-temporal satellite imagery: A case study of Tehran metropolis. Urban Clim. 2022, 45, 101258. [Google Scholar] [CrossRef]
- Ramzan, M.; Saqib, Z.A.; Hussain, E.; Khan, J.A.; Nazir, A.; Dasti, M.Y.S.; Ali, S.; Niazi, N.K. Remote sensing-based prediction of temporal changes in land surface temperature and land use-land cover (LULC) in urban environments. Land 2022, 11, 1610. [Google Scholar] [CrossRef]
- Tian, L.; Tao, Y.; Li, M.; Qian, C.; Li, T.; Wu, Y.; Ren, F. Prediction of land surface temperature considering future land use change effects under climate change scenarios in Nanjing City, China. Remote Sens. 2023, 15, 2914. [Google Scholar] [CrossRef]
- Li, S.; Yang, X.; Cui, P.; Sun, Y.; Song, B. Machine-learning-algorithm-based prediction of land use/land cover and land surface temperature changes to characterize the surface urban heat island phenomena over harbin, China. Land 2024, 13, 1164. [Google Scholar] [CrossRef]
- Bokaie, M.; Shamsipour, A.; Khatibi, P.; Hosseini, A. Seasonal monitoring of urban heat island using multi-temporal Landsat and MODIS images in Tehran. Int. J. Urban Sci. 2019, 23, 269–285. [Google Scholar] [CrossRef]
- Mushore, T.D.; Odindi, J.; Dube, T.; Mutanga, O. Prediction of future urban surface temperatures using medium resolution satellite data in Harare metropolitan city, Zimbabwe. Build. Environ. 2017, 122, 397–410. [Google Scholar] [CrossRef]
- Nurwanda, A.; Honjo, T. The prediction of city expansion and land surface temperature in Bogor City, Indonesia. Sustain. Cities Soc. 2020, 52, 101772. [Google Scholar] [CrossRef]
- Li, Q.; Zheng, H. Prediction of summer daytime land surface temperature in urban environments based on machine learning. Sustain. Cities Soc. 2023, 97, 104732. [Google Scholar] [CrossRef]
- Deilami, K.; Kamruzzaman, M. Modelling the urban heat island effect of smart growth policy scenarios in Brisbane. Land Use Policy 2017, 64, 38–55. [Google Scholar] [CrossRef]
- Rahman, M.T.; Aldosary, A.S.; Mortoja, M. Modeling future land cover changes and their effects on the land surface temperatures in the Saudi Arabian eastern coastal city of Dammam. Land 2017, 6, 36. [Google Scholar] [CrossRef]
- Ahmed, B.; Kamruzzaman, M.; Zhu, X.; Rahman, M.; Choi, K. Simulating land cover changes and their impacts on land surface temperature in Dhaka, Bangladesh. Remote Sens. 2013, 5, 5969–5998. [Google Scholar] [CrossRef]
- Wang, R.; Hou, H.; Murayama, Y.; Derdouri, A. Spatiotemporal analysis of land use/cover patterns and their relationship with land surface temperature in Nanjing, China. Remote Sens. 2020, 12, 440. [Google Scholar] [CrossRef]
- Shorabeh, S.N.; Hamzeh, S.; Shahraki, S.Z.; Firozjaei, M.K.; Arsanjani, J.J. Modelling the intensity of surface urban heat island and predicting the emerging patterns: Landsat multi-temporal images and Tehran as case study. Int. J. Remote Sens. 2020, 41, 7400–7426. [Google Scholar] [CrossRef]
- Kafy, A.-A.; Saha, M.; Faisal, A.-A.; Rahaman, Z.A.; Rahman, M.T.; Liu, D.; Fattah, M.A.; Al Rakib, A.; AlDousari, A.E.; Rahaman, S.N.; et al. Predicting the impacts of land use/land cover changes on seasonal urban thermal characteristics using machine learning algorithms. Build. Environ. 2022, 217, 109066. [Google Scholar] [CrossRef]
- Mondal, B.; Das, D.N.; Bhatta, B. Integrating cellular automata and Markov techniques to generate urban development potential surface: A study on Kolkata agglomeration. Geocarto Int. 2017, 32, 401–419. [Google Scholar] [CrossRef]
- Hu, Z.; Lo, C.P. Modeling urban growth in Atlanta using logistic regression. Comput. Environ. Urban Syst. 2007, 31, 667–688. [Google Scholar] [CrossRef]
- Sesnie, S.E.; Gessler, P.E.; Finegan, B.; Thessler, S. Integrating Landsat TM and SRTM-DEM derived variables with decision trees for habitat classification and change detection in complex neotropical environments. Remote Sens. Environ. 2008, 112, 2145–2159. [Google Scholar] [CrossRef]
- Bununu, Y.A. Integration of Markov chain analysis and similarity-weighted instance-based machine learning algorithm (SimWeight) to simulate urban expansion. Int. J. Urban Sci. 2017, 21, 217–237. [Google Scholar] [CrossRef]
- Liu, Y. Modelling sustainable urban growth in a rapidly urbanising region using a fuzzy-constrained cellular automata approach. Int. J. Geogr. Inf. Sci. 2012, 26, 151–167. [Google Scholar] [CrossRef]
- Ke, X.; Qi, L.; Zeng, C. A partitioned and asynchronous cellular automata model for urban growth simulation. Int. J. Geogr. Inf. Sci. 2016, 30, 637–659. [Google Scholar] [CrossRef]
- Parsa, V.A.; Yavari, A.; Nejadi, A. Spatio-temporal analysis of land use/land cover pattern changes in Arasbaran Biosphere Reserve: Iran. Model. Earth Syst. Environ. 2016, 2, 1–13. [Google Scholar] [CrossRef]
- Li, X.; Yeh, A.G.-O. Neural-network-based cellular automata for simulating multiple land use changes using GIS. Int. J. Geogr. Inf. Sci. 2002, 16, 323–343. [Google Scholar] [CrossRef]
- Verburg, P.H.; Overmars, K.P. Combining top-down and bottom-up dynamics in land use modeling: Exploring the future of abandoned farmlands in Europe with the Dyna-CLUE model. Landsc. Ecol. 2009, 24, 1167–1181. [Google Scholar] [CrossRef]
- Pijanowski, B.; Alexandridis, K.; Müller, D. Modelling urbanization patterns in two diverse regions of the world. J. Land Use Sci. 2006, 1, 83–108. [Google Scholar] [CrossRef]
- Dietzel, C.; Clarke, K.C. Toward optimal calibration of the SLEUTH land use change model. Trans. GIS 2007, 11, 29–45. [Google Scholar] [CrossRef]
- Liu, X.; Liang, X.; Li, X.; Xu, X.; Ou, J.; Chen, Y.; Li, S.; Wang, S.; Pei, F. A future land use simulation model (FLUS) for simulating multiple land use scenarios by coupling human and natural effects. Landsc. Urban Plan. 2017, 168, 94–116. [Google Scholar] [CrossRef]
- Xu, L.; Liu, X.; Tong, D.; Liu, Z.; Yin, L.; Zheng, W. Forecasting urban land use change based on cellular automata and the PLUS model. Land 2022, 11, 652. [Google Scholar] [CrossRef]
- Fogang, L.F.; Tiomo, I.F.; Kamga, B.Y.; Kpoumie, H.M.; Nkondjoua, A.D.T.; Nguetsop, V.F.; Zapfack, L. Predicting land use/land cover changes in the Santchou Wildlife Reserve (Santchou, West-Cameroon) using a CA-Markov model. Trees For. People 2023, 14, 100438. [Google Scholar] [CrossRef]
- Wu, H.; Li, Z.; Clarke, K.C.; Shi, W.; Fang, L.; Lin, A.; Zhou, J. Examining the sensitivity of spatial scale in cellular automata Markov chain simulation of land use change. Int. J. Geogr. Inf. Sci. 2019, 33, 1040–1061. [Google Scholar] [CrossRef]
- Pontius, G.R.; Malanson, J. Comparison of the structure and accuracy of two land change models. Int. J. Geogr. Inf. Sci. 2005, 19, 243–265. [Google Scholar] [CrossRef]
- Yang, X.; Zheng, X.-Q.; Lv, L.-N. A spatiotemporal model of land use change based on ant colony optimization, Markov chain and cellular automata. Ecol. Model. 2012, 233, 11–19. [Google Scholar] [CrossRef]
- Firozjaei, M.K.; Sedighi, A.; Argany, M.; Jelokhani-Niaraki, M.; Arsanjani, J.J. A geographical direction-based approach for capturing the local variation of urban expansion in the application of CA-Markov model. Cities 2019, 93, 120–135. [Google Scholar] [CrossRef]
- Firozjaei, M.K.; Sedighi, A.; Jelokhani-Niaraki, M. An urban growth simulation model based on integration of local weights and decision risk values. Trans. GIS 2020, 24, 1695–1721. [Google Scholar] [CrossRef]
- Fu, X.; Wang, X.; Yang, Y.J. Deriving suitability factors for CA-Markov land use simulation model based on local historical data. J. Environ. Manag. 2018, 206, 10–19. [Google Scholar] [CrossRef]
- Firozjaei, M.K.; Mijani, N.; Fathololoumi, S.; Arsanjani, J.J. Forecasting Spatiotemporal Dynamics of Daytime Surface Urban Cool Islands in Response to Urbanization in Drylands: Case Study of Kerman and Zahedan Cities, Iran. Remote Sens. 2024, 16, 4416. [Google Scholar] [CrossRef]
- Mijani, N.; Firozjaei, M.K.; Mijani, M.; Khodabakhshi, A.; Qureshi, S.; Arsanjani, J.J.; Alavipanah, S.K. Exploring the effect of COVID-19 pandemic lockdowns on urban cooling: A tale of three cities. Adv. Space Res. 2023, 71, 1017–1033. [Google Scholar] [CrossRef]
- Dialesandro, J.M.; Wheeler, S.M.; Abunnasr, Y. Urban heat island behaviors in dryland regions. Environ. Res. Commun. 2019, 1, 081005. [Google Scholar] [CrossRef]
- Zhao, L.; Lee, X.; Smith, R.B.; Oleson, K. Strong contributions of local background climate to urban heat islands. Nature 2014, 511, 216–219. [Google Scholar] [CrossRef] [PubMed]
- Ezimand, K.; Aghighi, H.; Ashourloo, D.; Shakiba, A. The analysis of the spatio-temporal changes and prediction of built-up lands and urban heat islands using multi-temporal satellite imagery. Sustain. Cities Soc. 2024, 103, 105231. [Google Scholar] [CrossRef]
- Weng, Q.; Firozjaei, M.K.; Sedighi, A.; Kiavarz, M.; Alavipanah, S.K. Statistical analysis of surface urban heat island intensity variations: A case study of Babol city, Iran. GIScience Remote Sens. 2019, 56, 576–604. [Google Scholar] [CrossRef]
- Masoodian, S.A.; Montazeri, M. Quantifying of surface urban cool island in arid environments case study: Isfahan metropolis. Landsc. Ecol. Eng. 2021, 17, 147–156. [Google Scholar] [CrossRef]
- Rasul, A.; Balzter, H.; Smith, C. Spatial variation of the daytime Surface Urban Cool Island during the dry season in Erbil, Iraqi Kurdistan, from Landsat 8. Urban Clim. 2015, 14, 176–186. [Google Scholar] [CrossRef]
- Lazzarini, M.; Marpu, P.R.; Ghedira, H. Temperature-land cover interactions: The inversion of urban heat island phenomenon in desert city areas. Remote Sens. Environ. 2013, 130, 136–152. [Google Scholar] [CrossRef]
- Govind, N.R.; Ramesh, H. The impact of spatiotemporal patterns of land use land cover and land surface temperature on an urban cool island: A case study of Bengaluru. Environ. Monit. Assess. 2019, 191, 1–20. [Google Scholar] [CrossRef]
- Kirschner, V.; Macků, K.; Moravec, D.; Maňas, J. Measuring the relationships between various urban green spaces and local climate zones. Sci. Rep. 2023, 13, 9799. [Google Scholar] [CrossRef]
- Visvanathan, G.; Patil, K.; Suryawanshi, Y.; Meshram, V.; Jadhav, S. Mitigating urban heat island and enhancing indoor thermal comfort using terrace garden. Sci. Rep. 2024, 14, 9697. [Google Scholar] [CrossRef]
- Ahmed, N.M.; Altamura, P.; Giampaoletti, M.; Hemeida, F.A.; Mohamed, A.F.A. Optimizing human thermal comfort and mitigating the urban heat island effect on public open spaces in Rome, Italy through sustainable design strategies. Sci. Rep. 2024, 14, 19931. [Google Scholar] [CrossRef]


Disclaimer/Publisher’s Note: The statements, opinions and data contained in all publications are solely those of the individual author(s) and contributor(s) and not of MDPI and/or the editor(s). MDPI and/or the editor(s) disclaim responsibility for any injury to people or property resulting from any ideas, methods, instructions or products referred to in the content. |
© 2025 by the authors. Licensee MDPI, Basel, Switzerland. This article is an open access article distributed under the terms and conditions of the Creative Commons Attribution (CC BY) license (https://creativecommons.org/licenses/by/4.0/).
Share and Cite
Karimi Firozjaei, M.; Mahmoodi, H.; Jokar Arsanjani, J. Daytime Surface Urban Heat Island Variation in Response to Future Urban Expansion: An Assessment of Different Climate Regimes. Remote Sens. 2025, 17, 1730. https://doi.org/10.3390/rs17101730
Karimi Firozjaei M, Mahmoodi H, Jokar Arsanjani J. Daytime Surface Urban Heat Island Variation in Response to Future Urban Expansion: An Assessment of Different Climate Regimes. Remote Sensing. 2025; 17(10):1730. https://doi.org/10.3390/rs17101730
Chicago/Turabian StyleKarimi Firozjaei, Mohammad, Hamide Mahmoodi, and Jamal Jokar Arsanjani. 2025. "Daytime Surface Urban Heat Island Variation in Response to Future Urban Expansion: An Assessment of Different Climate Regimes" Remote Sensing 17, no. 10: 1730. https://doi.org/10.3390/rs17101730
APA StyleKarimi Firozjaei, M., Mahmoodi, H., & Jokar Arsanjani, J. (2025). Daytime Surface Urban Heat Island Variation in Response to Future Urban Expansion: An Assessment of Different Climate Regimes. Remote Sensing, 17(10), 1730. https://doi.org/10.3390/rs17101730