1. Introduction
On average, there are more than 8 million lightning events occurring each day, with over 2000 locations experiencing thunderstorms at any given moment around the globe. For a long time, lightning has posed significant threats to ecological resources and human safety [
1,
2,
3]. Current mainstream lightning detection systems, such as the ZEUS Lightning Detection Network, the National Lightning Detection Network in the United States, the Lightning Mapping Array, and France’s Very High Frequency Narrowband Interferometric Lightning Detection System, are all passive lightning detection systems. The unavoidable errors inherent in these systems adversely affect the accuracy of lightning location [
4].
Moreover, there is a lack of studies utilizing active lightning radar for lightning detection and location, both domestically and internationally [
5]. Therefore, leveraging the echo data generated by lightning radar and employing a new algorithm that integrates active and passive methods for lightning localization and imaging is of significant importance.
Lightning radar is a highly effective tool for locating lightning and studying the structural characteristics of lightning plasma channels [
6]. Compared to the previously widely used methods of Time Difference of Arrival (TDOA) and magnetic orientation, the primary advantage of using lightning radar is its ability to significantly mitigate the impact of precipitation masking effect on location accuracy [
7]. Additionally, the use of lightning radar avoids the limitations present in the former methods, such as synchronization issues, multipath effects, and signal attenuation, as well as the limitations [
8] of the latter, including low signal resolution and susceptibility to complex terrain. Furthermore, the capability to record lightning echoes is a notable advantage of lightning radar. This research focuses on analyzing the characteristics of lightning echoes to achieve localization of lightning radiation sources and imaging of lightning channels.
Since the 1970s, extensive research has been conducted on the echo characteristics of lightning radar operating at various wavelengths. For instance, Proctor et al. [
9] were among the first to develop lightning radars with wavelengths of 5.5, 50, and 111 cm. Mazur et al. [
10] inferred the characteristics of lightning channels based on observations from a vertically oriented 10 cm Doppler radar. Subsequently, Dawson et al. [
11] reviewed previous results from lightning radar echo studies and calculated the radar cross-section of lightning channels based on earlier research on meteor trajectories. However, these studies have primarily focused on the radar echo characteristics of lightning channels, with insufficient research on the three-dimensional imaging of lightning channels.
Currently, the common methods for lightning radar localization include active localization and passive localization [
4]. The former is based on the reflection of electromagnetic waves from lightning plasma channels to locate the radiation source of the lightning. However, this method suffers from a limitation in the number of location points, which hinders improvements in location accuracy. In contrast, the latter method relies on the passive electromagnetic radiation generated during lightning events for localization, though it lacks distance information.
In light of the unique characteristics of active and passive localization algorithms, this study employs an active and passive integrated localization algorithm. The core idea of this algorithm is to fully utilize the distance information from the localization points of active lightning echo signals to perform distance matching with passive signals which is generated by the leader tip breakdown. This localization algorithm achieves high accuracy while generating a large and dense set of localization points. Additionally, the use of the Density-Based Spatial Clustering of Applications with Noise (DBSCAN) clustering algorithm effectively eliminates noise points [
12] (i.e., radiation sources that do not contribute to the lightning channel structure), facilitating a clear imaging of the lightning channel structure. The application of this localization algorithm is significant for studying the variations in the three-dimensional structure of the lightning channel during lightning events.
2. Method
2.1. Experimental Equipment
The hardware used in this experiment is the Leshan very-high-frequency radar [
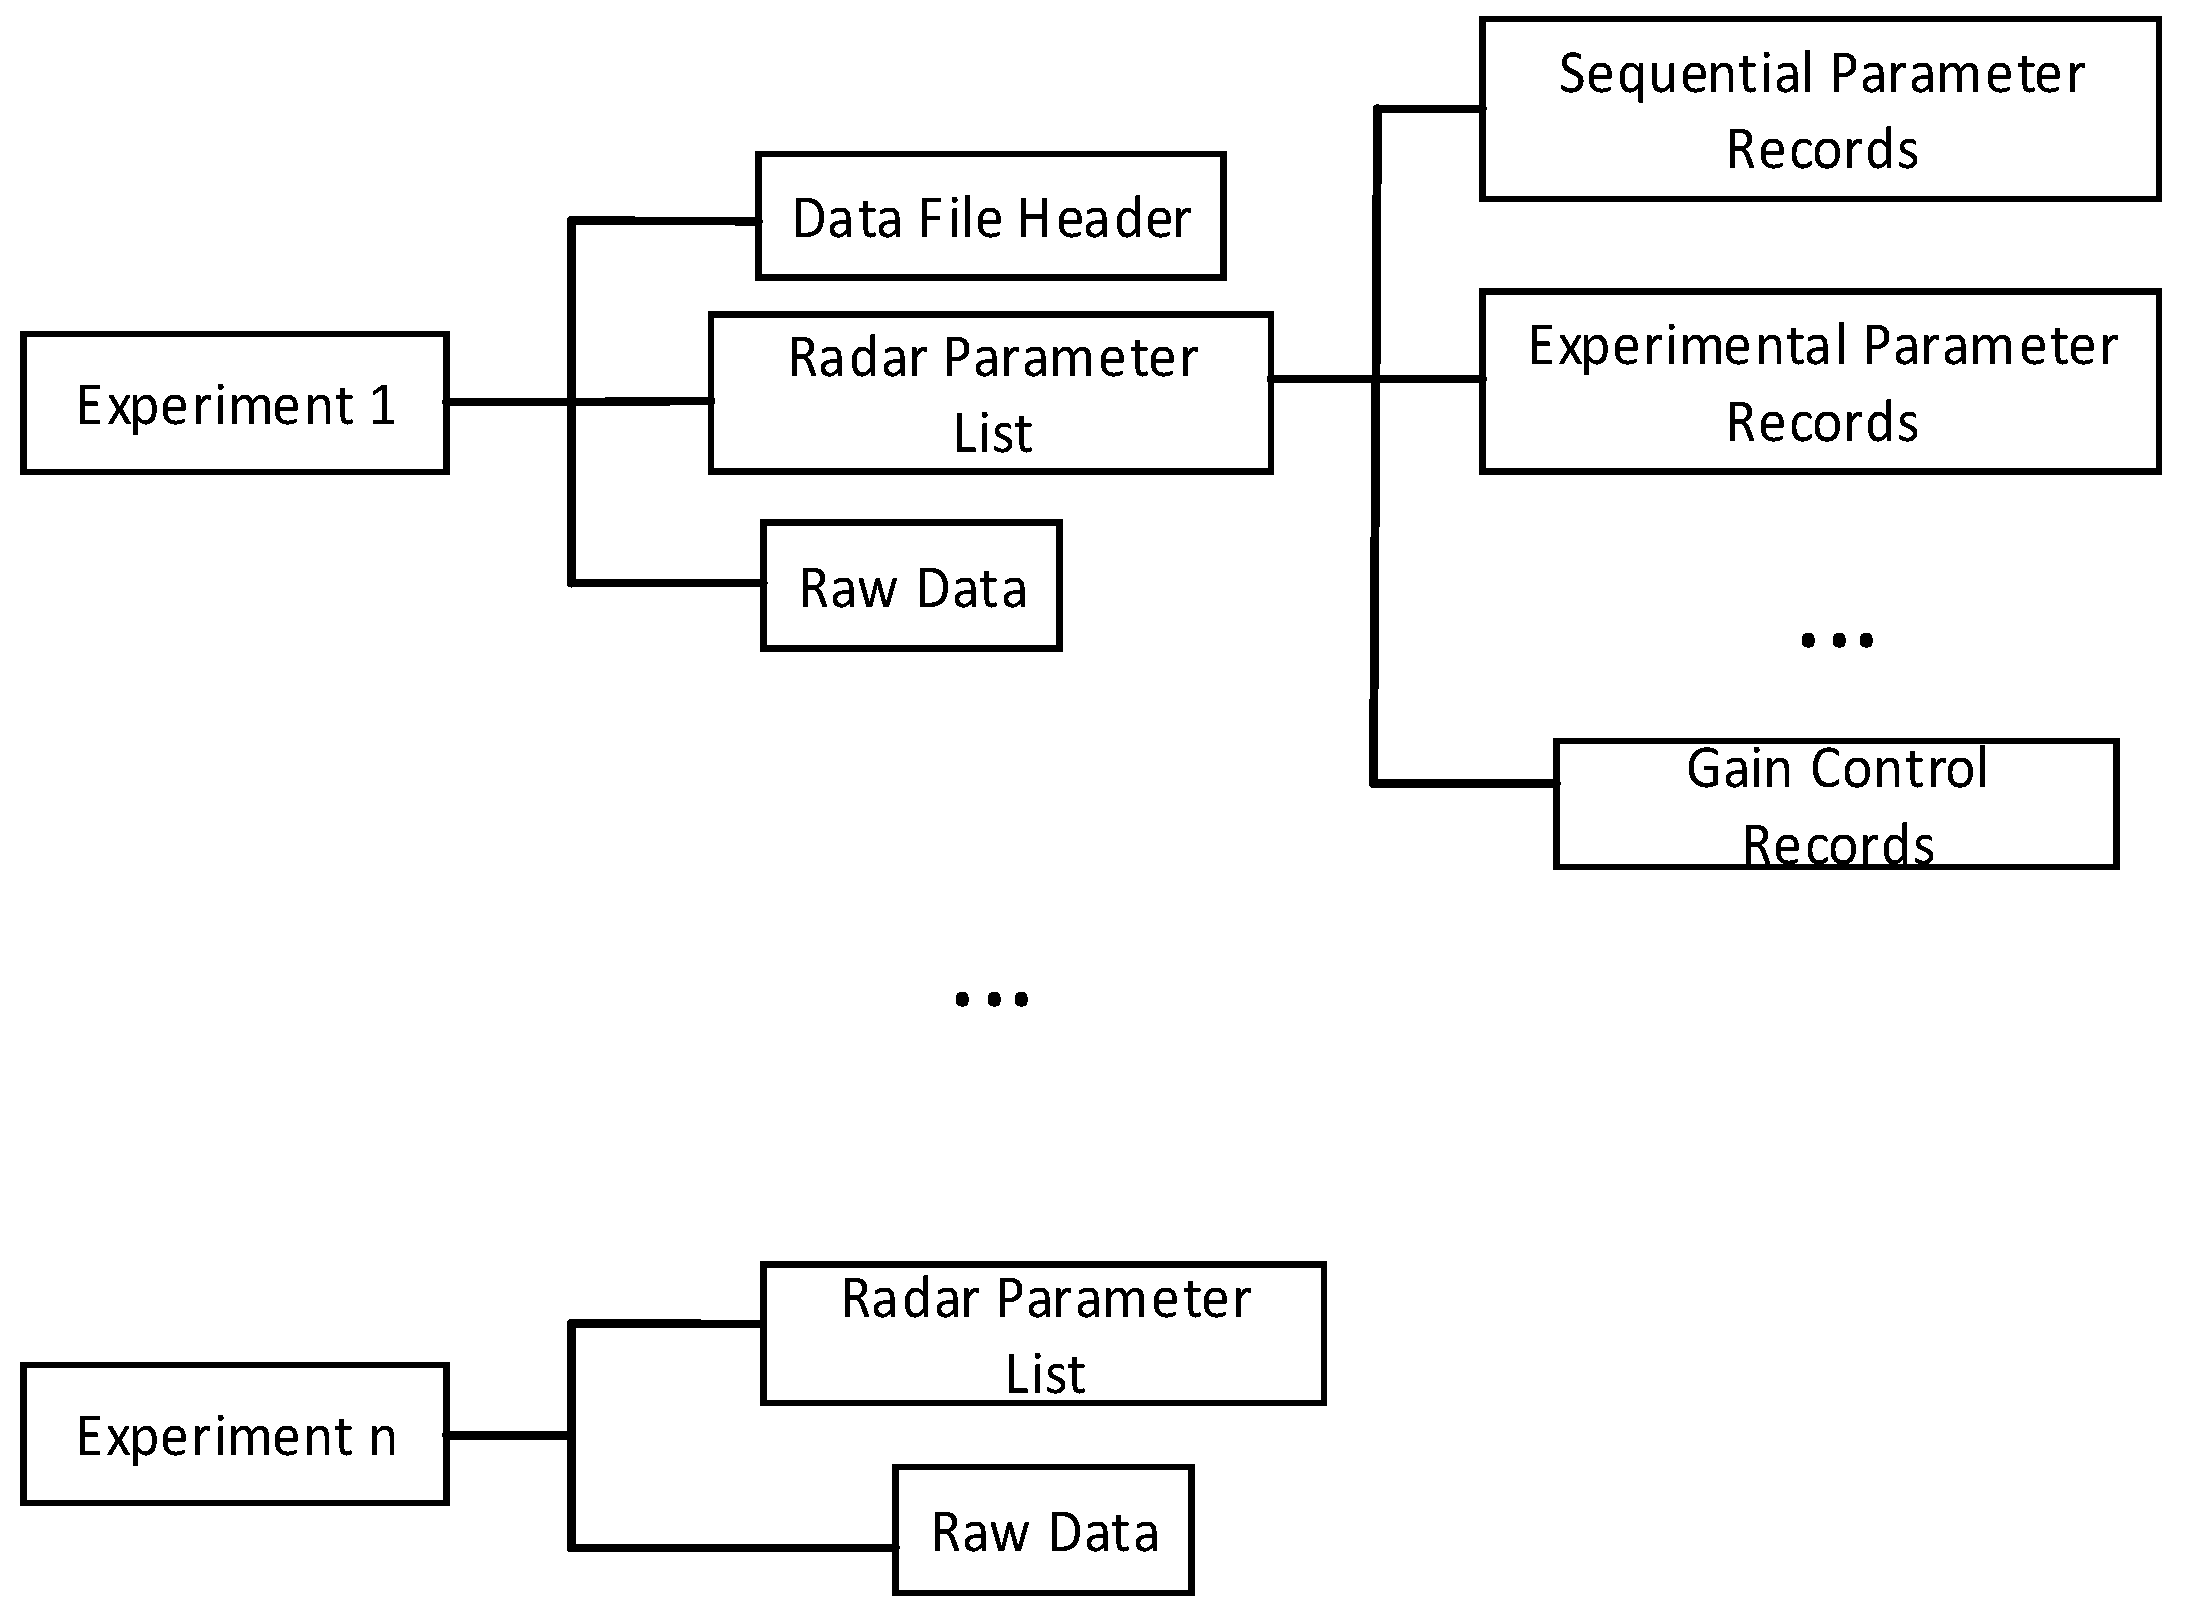
13]. The radar is equipped with five antennas, which correspond to five receiving channels, and each channel provides both I (in-phase) and Q (quadrature) data. The data is recorded in order of distance gates, starting with the lowest range gate. Data from channel 1’s I and Q is recorded first, followed by channel 2’s I and Q data, and so on. According to the radar user manual, each segment of I and Q data contains 6020 data points. The raw data generated by this radar during operation has a unique data structure. After consulting the radar manual, it can be determined that the storage format of the raw data is generally as shown in
Figure 1.
The data analyzed in this paper is derived from the raw In-phase and Quadrature (I/Q) data stored in its “.raw” files [
14]. A complete raw data file begins with a header, followed by the main content consisting of n experimental records (where n is the number of experimental records indicated in the header). Each experimental record includes a radar parameter list and the raw data. The radar parameter list is composed of various parameter records, including sequential parameter records, experimental parameter records, location parameter records, data acquisition parameter records, transmit pulse records, beam scanning records, gain control records, and so on. Different data blocks are distinguished by specific magic numbers. For example, the data file header starts with a 4-byte 32-bit integer “0x1200xxxx,” where “xxxx” represents the version number. Different radar parameter records also have distinct magic numbers; for instance, the magic number for location parameter records is “0x1203xxxx,” while the magic number for gain control records is “0x1204xxxx.” By identifying the different magic number markers and recognizing the various data partitions, one can refer to the corresponding sections of the radar manual to understand the storage format and type of data within each partition.
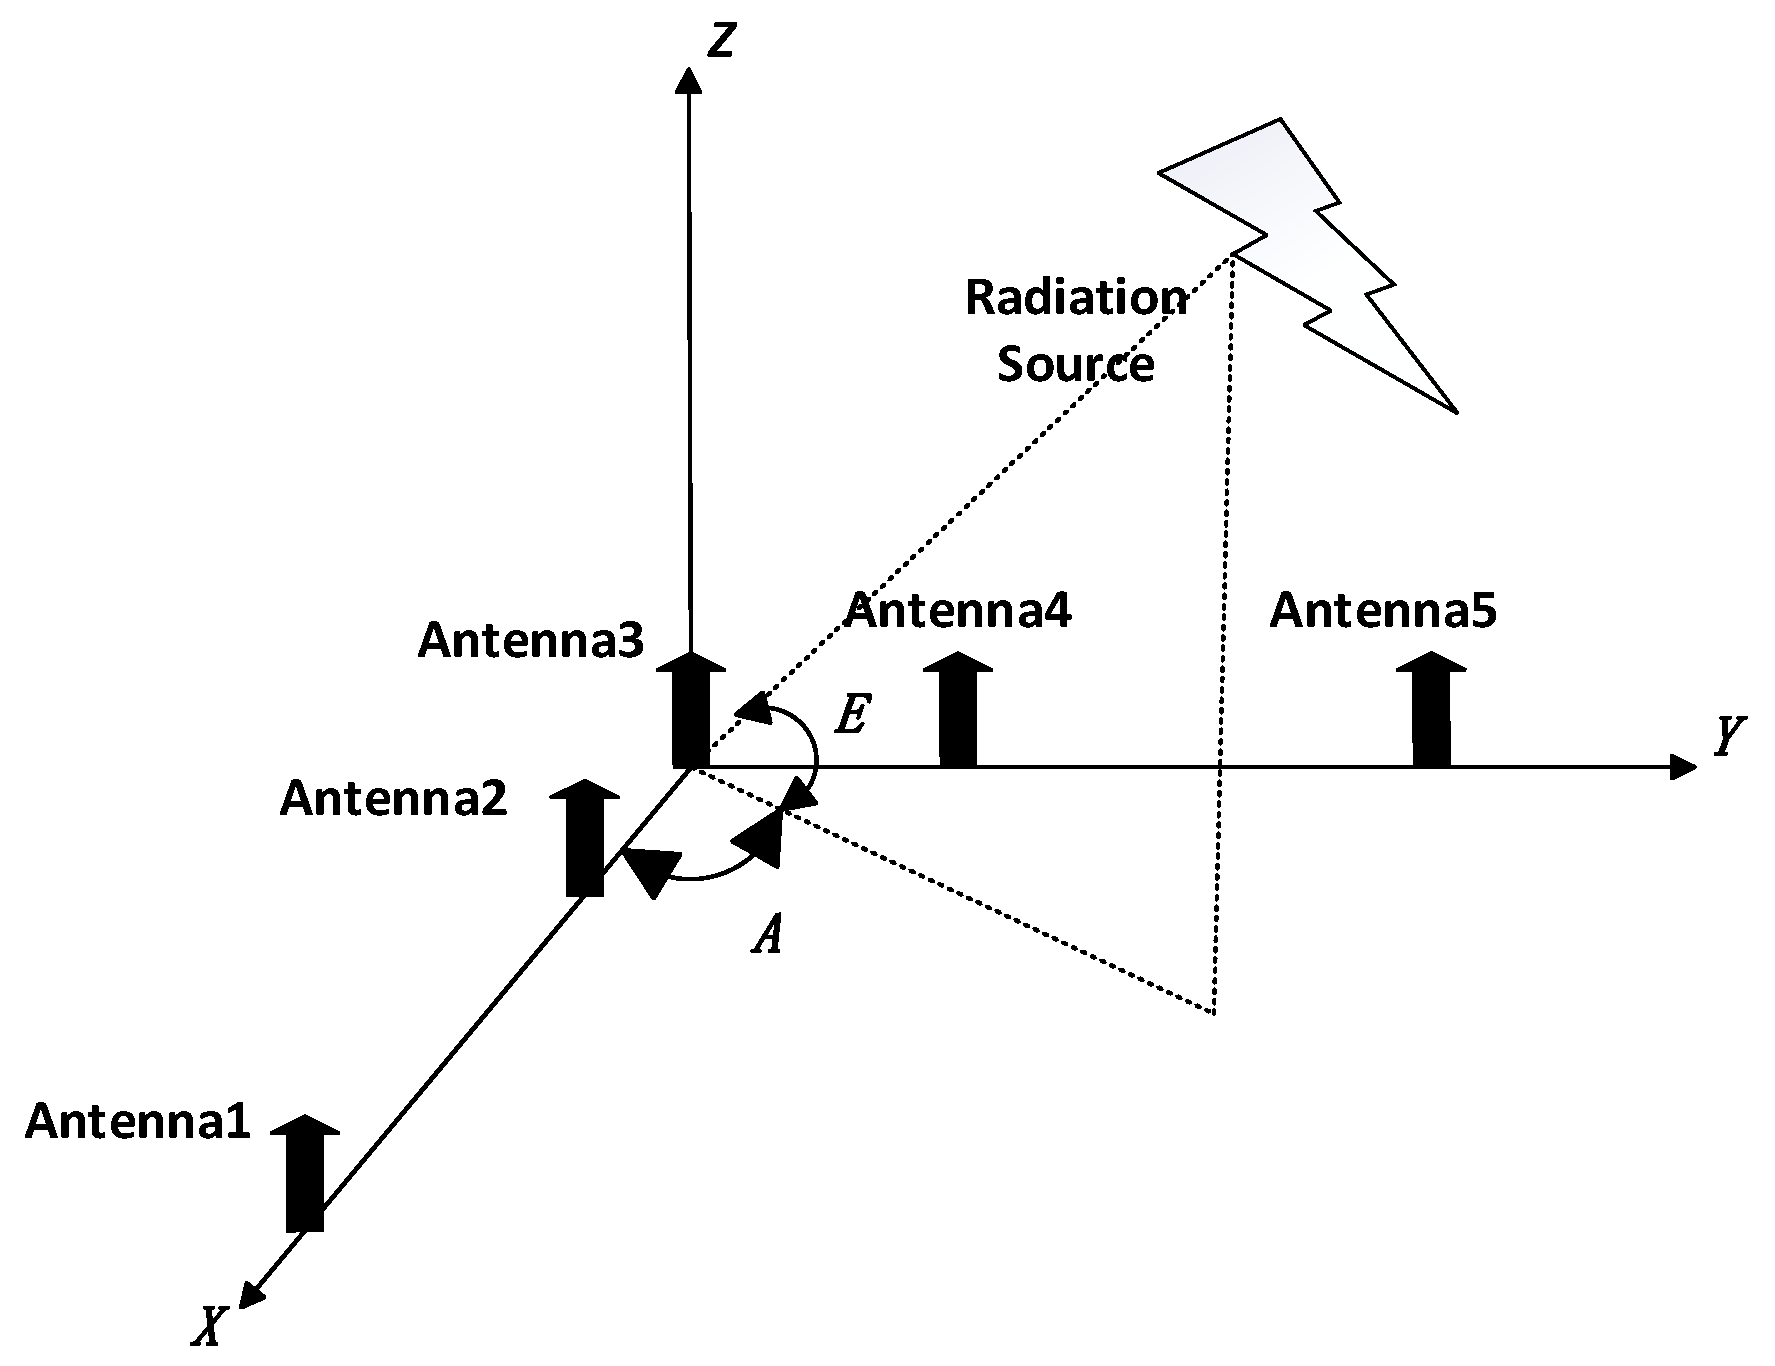
Here is some information about the antenna array of the radar: it consists of one transmitting antenna and five receiving antennas, configured in an “L” shaped array as shown in
Figure 2 [
13].
In this “L” shaped array, Antenna 1, Antenna 2, and Antenna 3 share one baseline, while Antenna 3, Antenna 4, and Antenna 5 share another baseline, which are arranged perpendicularly to each other. The distance between Antenna 1 and Antenna 2, as well as between Antenna 4 and Antenna 5, is 4.5 times the wavelength, while the distance between Antenna 2 and Antenna 3, and between Antenna 3 and Antenna 4, is 2.5 times the wavelength. The advantage of this layout [
14] is that it allows for relatively accurate measurement of the phase differences. The specific phase ambiguity resolution algorithm is referenced from the work of Sang et al. [
15].
The radar has five antennas corresponding to five receiving channels, with each channel providing In-phase and Quadrature data. Following the order of radar range gates from lowest to highest, the process begins by recording the lowest range gate, starting with the In-phase and Quadrature data from Channel 1, then proceeding to Channel 2, and so on. In this experiment, the Leshan radar system collected complex samples with a dynamic range of 14 bits at 313 positions within a distance range of 1.2 km to 32.4 km. The raw I/Q signal data from the radar’s five receiving channels was saved in “.raw” files, with the filenames corresponding to the time of lightning occurrence, for further signal processing.
Detailed radar hardware parameters are listed in
Table 1 [
13].
2.2. Removal of Ground Wave and Aircraft Echoes
In this experiment, the VHF radar continuously receives echo signals from specific echo layers that persist for an extended period. These signals do not meet the filtering criteria for lightning echoes described later in the paper. Therefore, we chose to exclude echo signals below 3 km from consideration in subsequent lightning localization efforts.
Additionally, the VHF lightning radar is subject to interference from electromagnetic signals generated by aircraft flying through clouds [
16]. To address this issue, we excluded signals that are within the same echo layer, have an intensity greater than 15 dB, and last longer than 0.5 s. This effectively reduces the interference caused by signals from aircraft during cloud penetration on lightning localization [
17,
18].
2.3. Identification of Active Lightning Echoes
By analyzing the entire process of lightning occurrence, it can be understood that the echo signal consists of two components [
17,
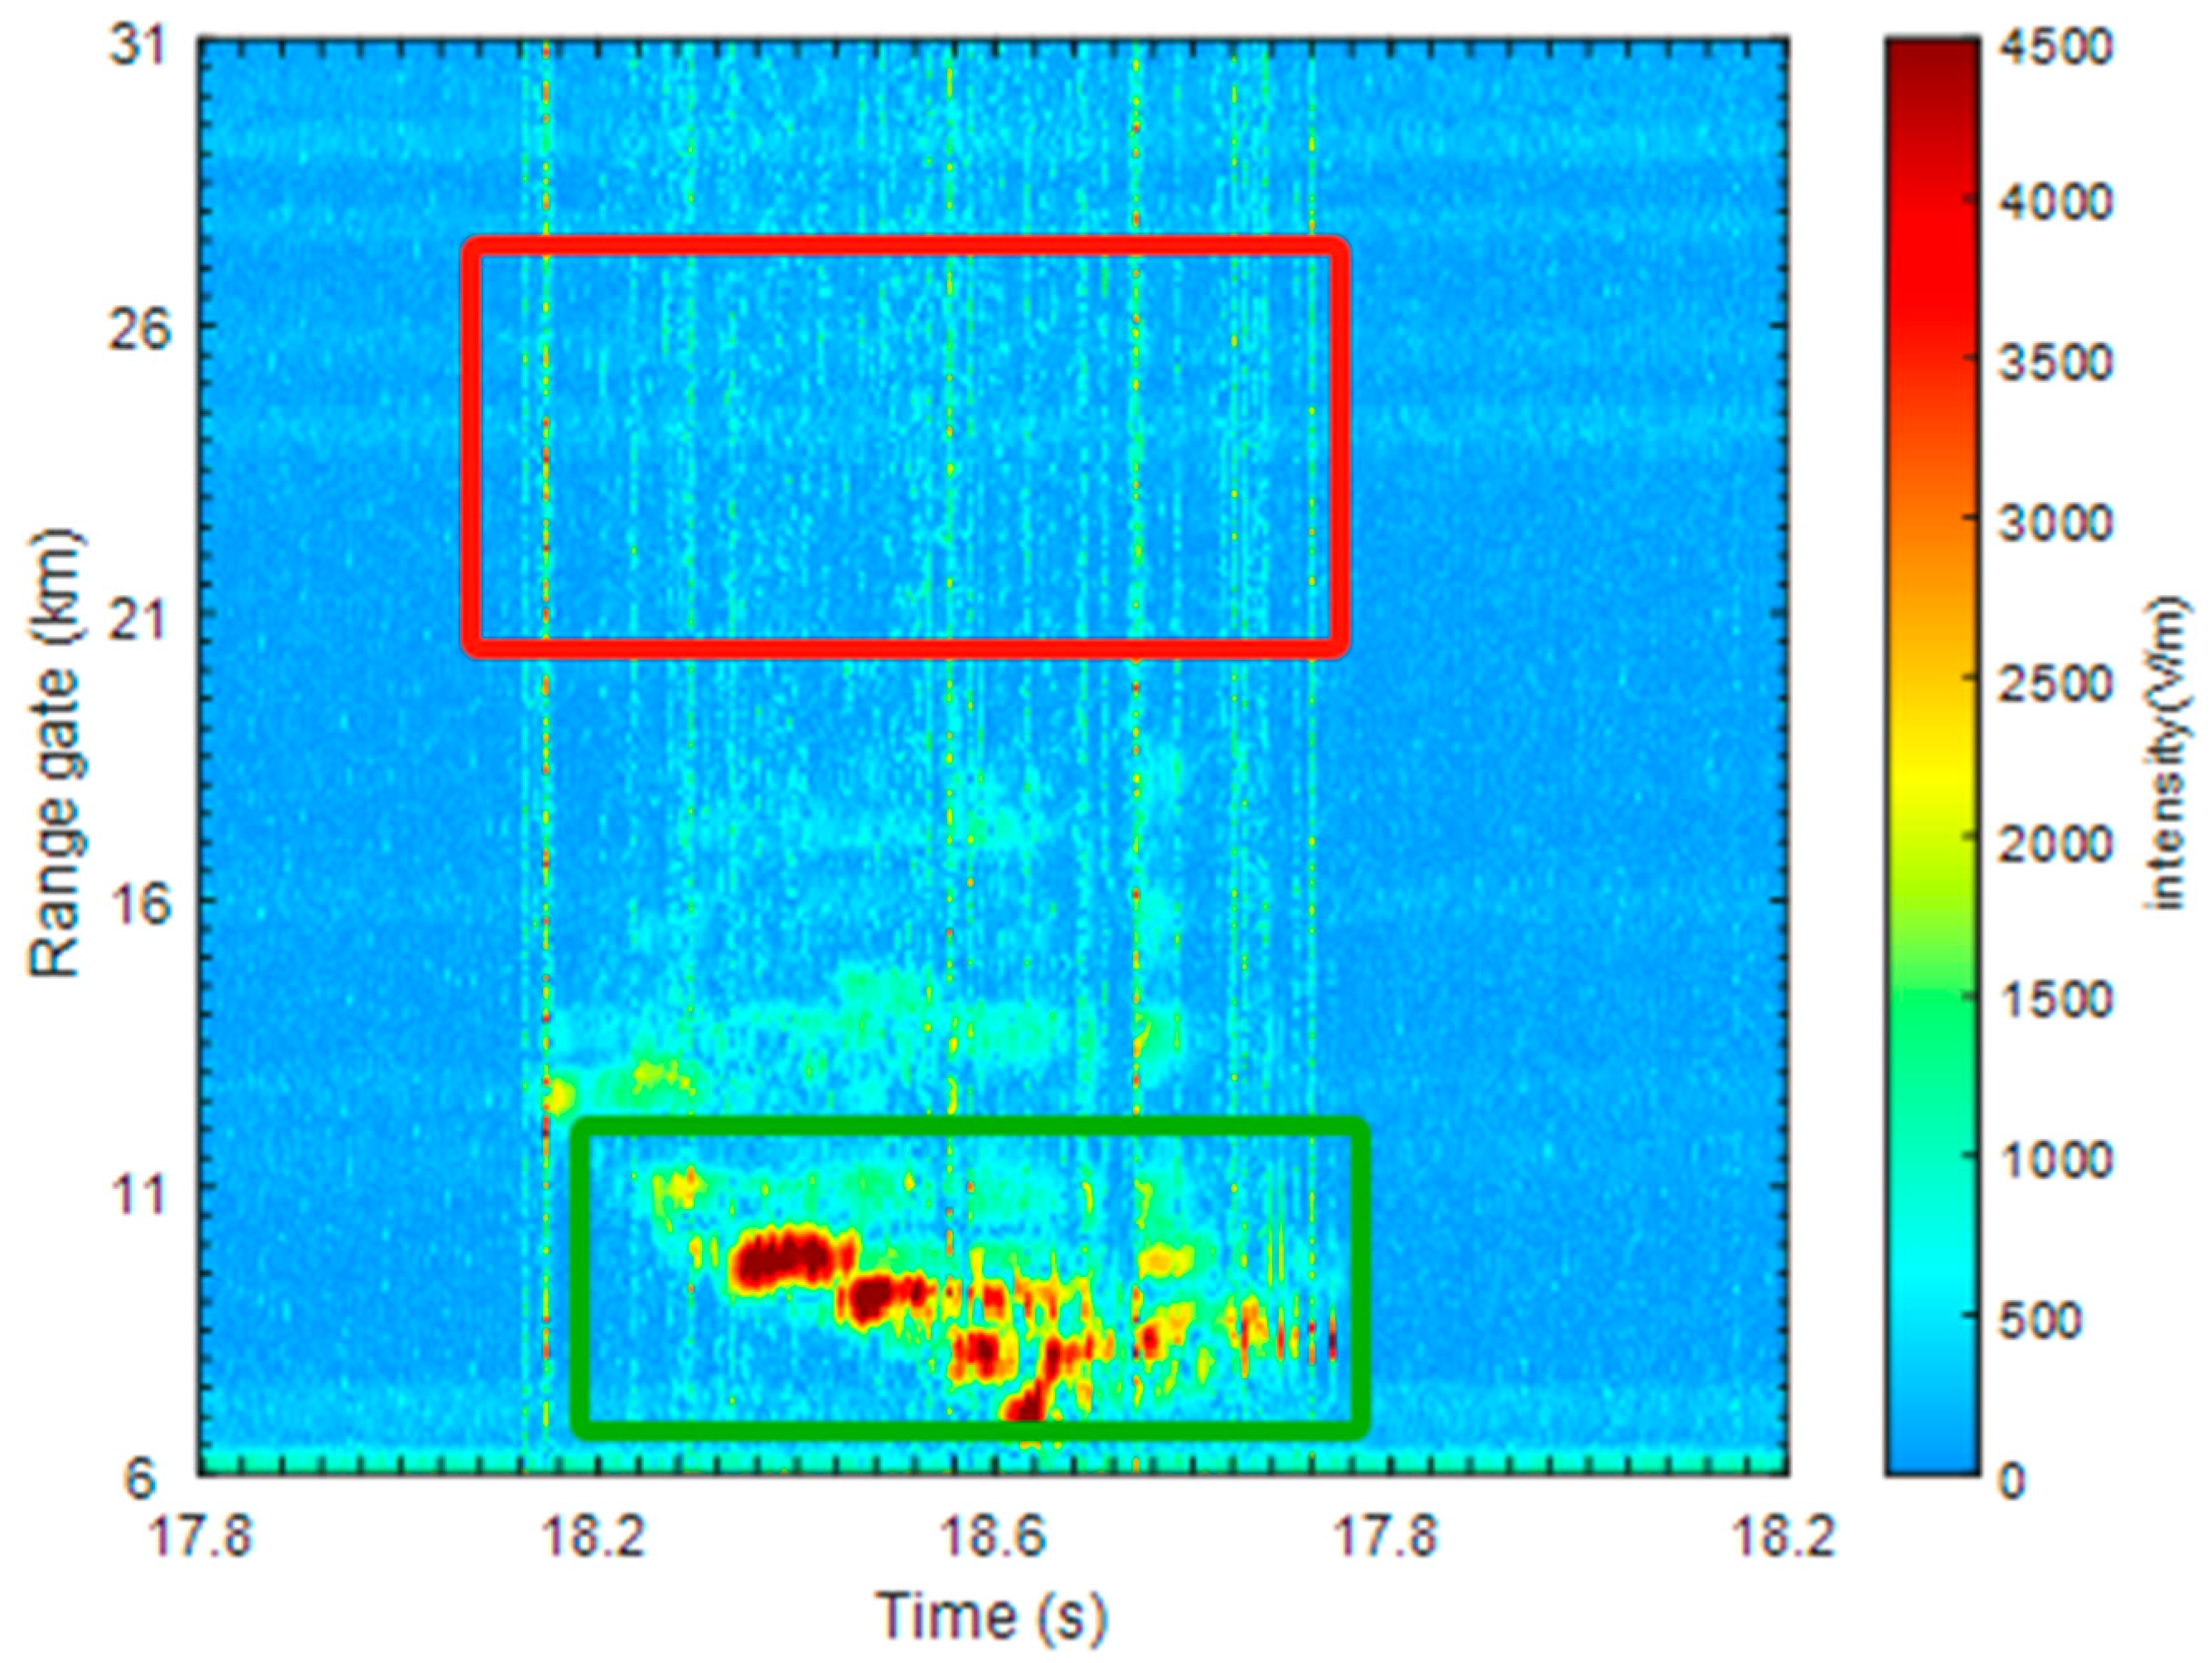
18]: one is the passive signal generated by leader tip breakdown, and the other is the active signal backscattered by the lightning plasma channel. The characteristics of the passive signal are represented in the range–time–intensity (RTI) diagram as a pulse cluster that spans all distance gates and lasts for several milliseconds [
7], as shown in the red box in
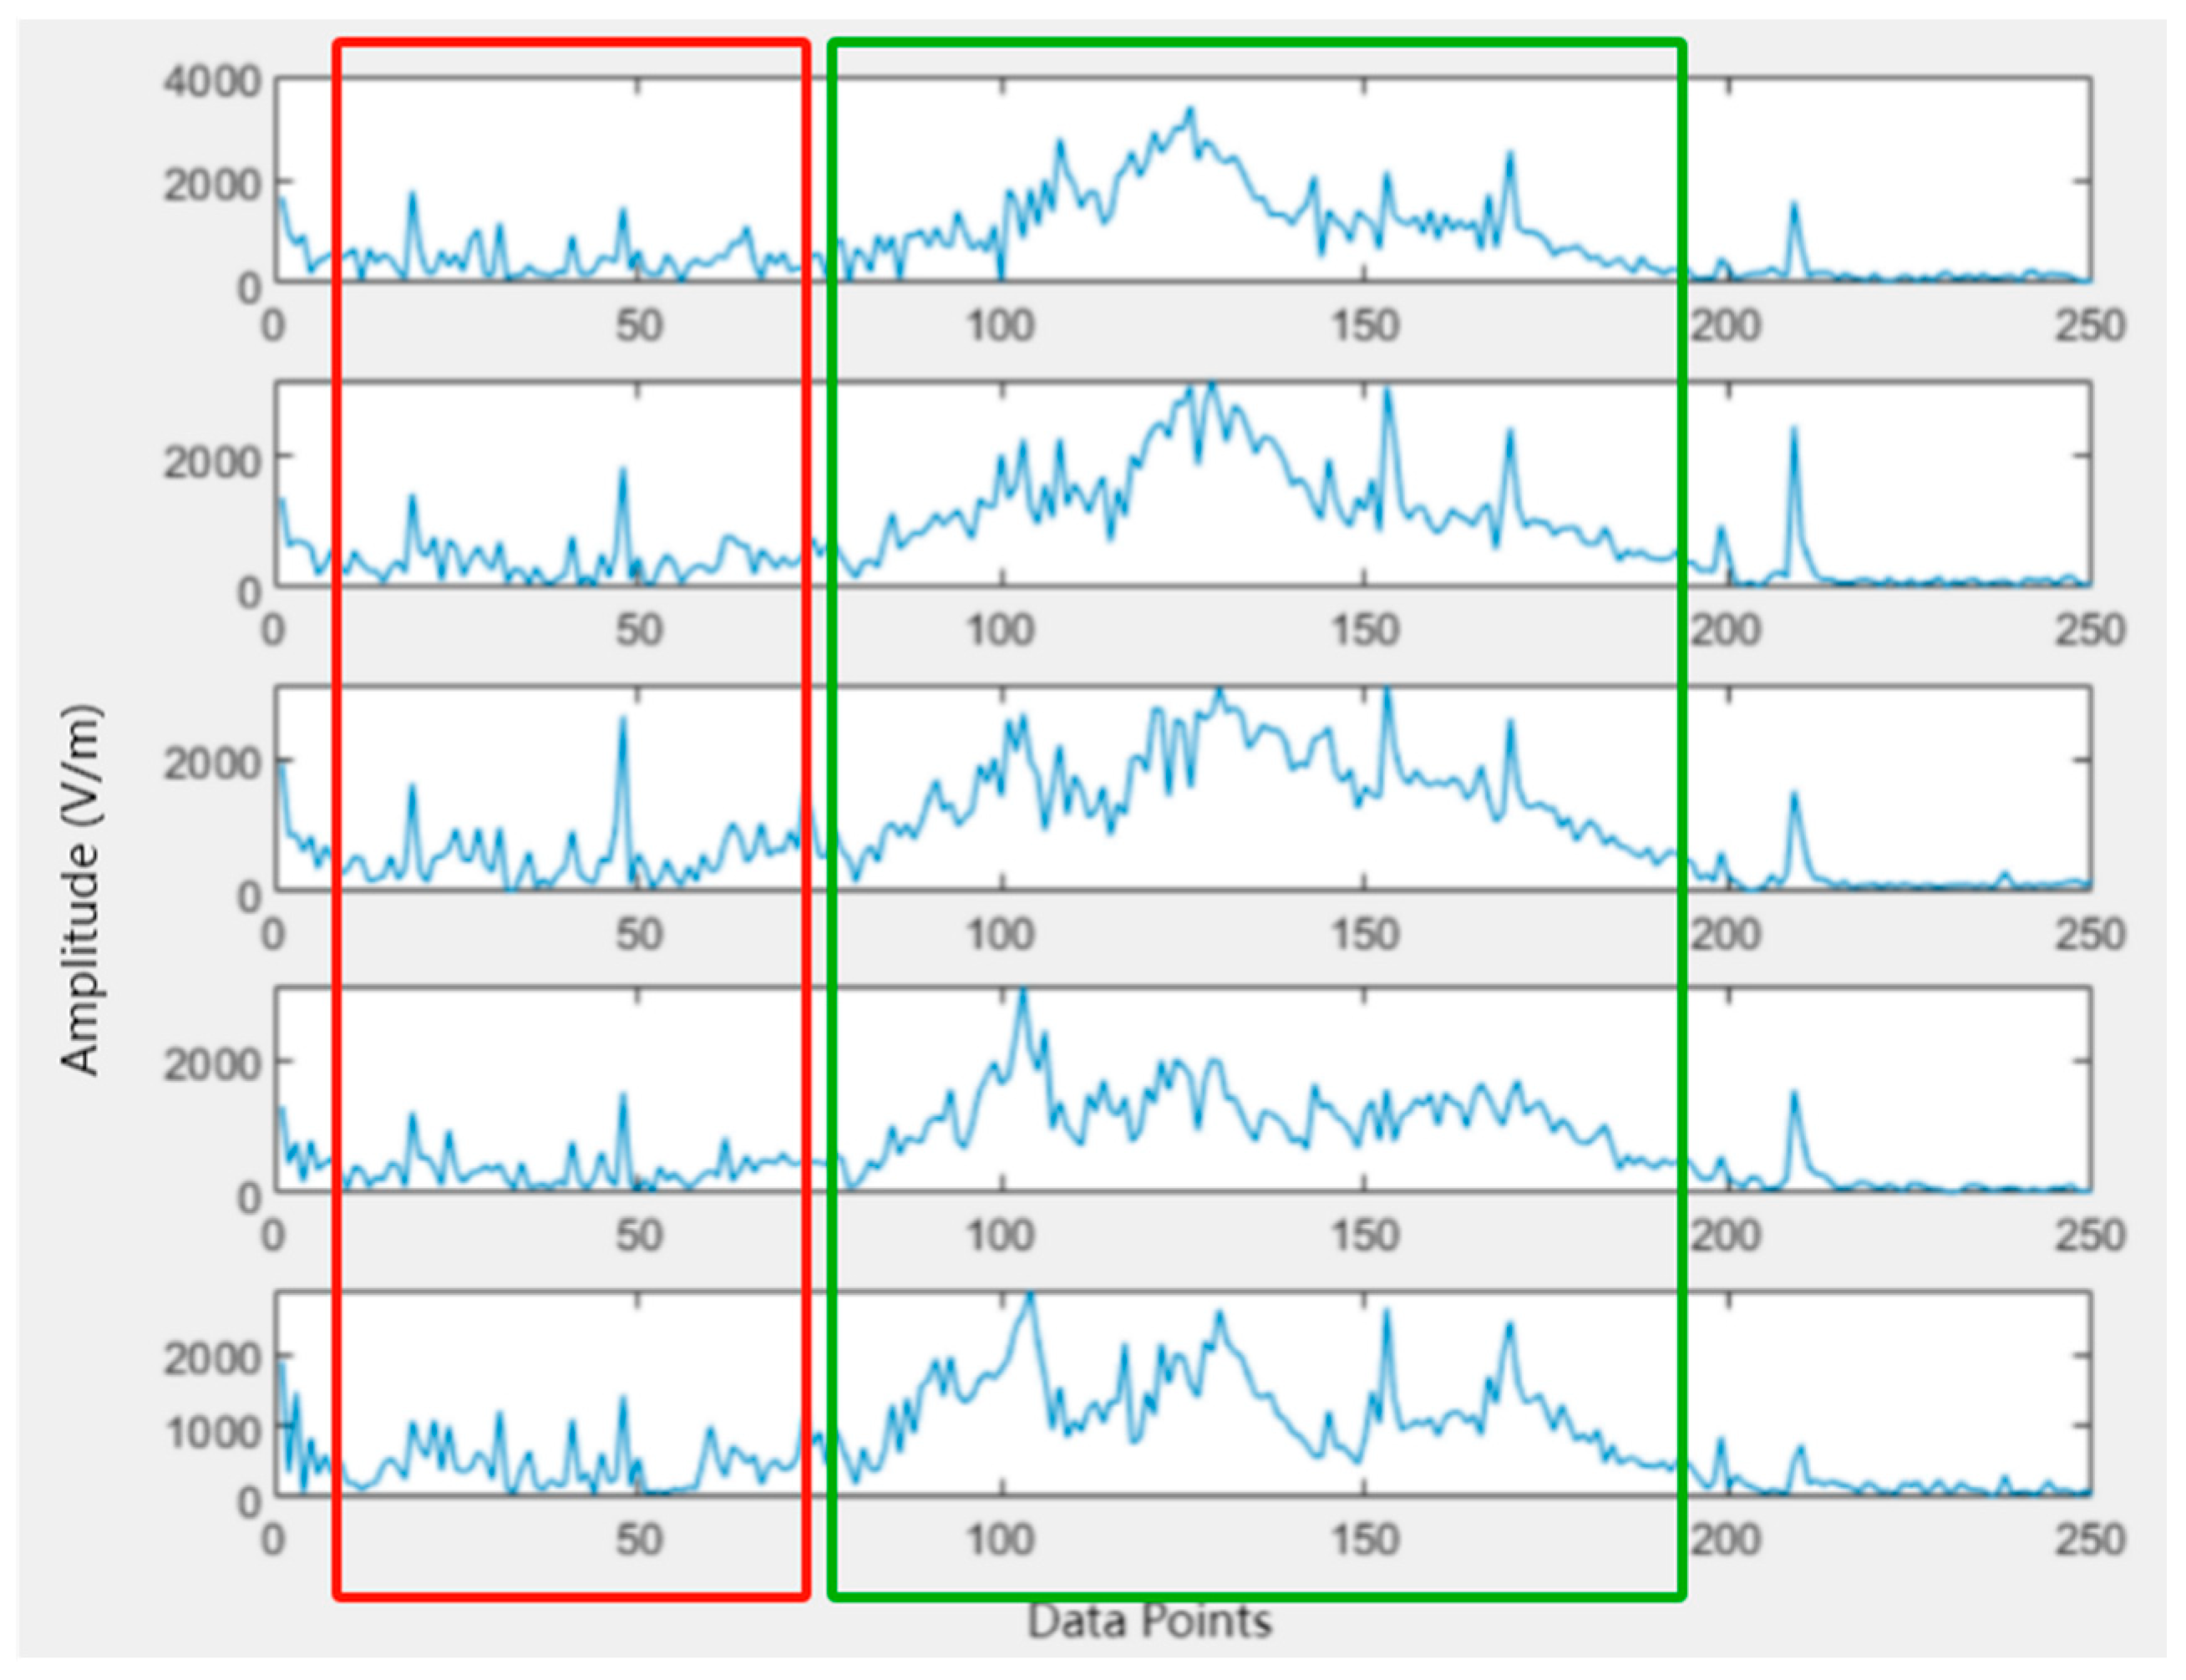
Figure 3. In the RTI diagram, this appears as a “bright line” running across all distance gates. Specifically, for a distance gate on the RTI diagram, the received pulse waveform resembles the signal within the red box in
Figure 4.
For the radar signals backscattered by the plasma channel, which correspond to the active lightning echo signals, the two-dimensional RTI diagram reveals several contiguous areas of red or yellow (with the color corresponding to the intensity of the echoes). This is illustrated by the signal shown in the green box in
Figure 3. When considering a specific distance gate on the RTI diagram, the characteristic of the active lightning echo signal is that the signal amplitude rapidly rises above the background noise and persists for several hundred milliseconds, as shown in the signal within the green box in
Figure 4.
The specific steps to determine the moment of passive signal occurrence are as follows: First, a five-point moving average [
14] is applied to the I/Q signals. Next, the background noise intensity on the RTI diagram is statistically analyzed to establish a threshold for passive signals. This threshold is set as the mean of the Gaussian distribution of the noise plus three times the standard deviation. For the echo intensity matrix corresponding to the RTI diagram of radar echoes, if the average value of a particular column exceeds the previously established threshold, then the corresponding time for that column will be considered the start of the passive signal. Conversely, if the average value remains below this threshold for 30 consecutive time series (approximately 0.08 s), it will be regarded as the end of the passive signal [
17,
18]. Once the occurrence time of the passive signal is determined, we assess whether there are radar signals backscattered by the plasma channel to identify if a lightning event has taken place.
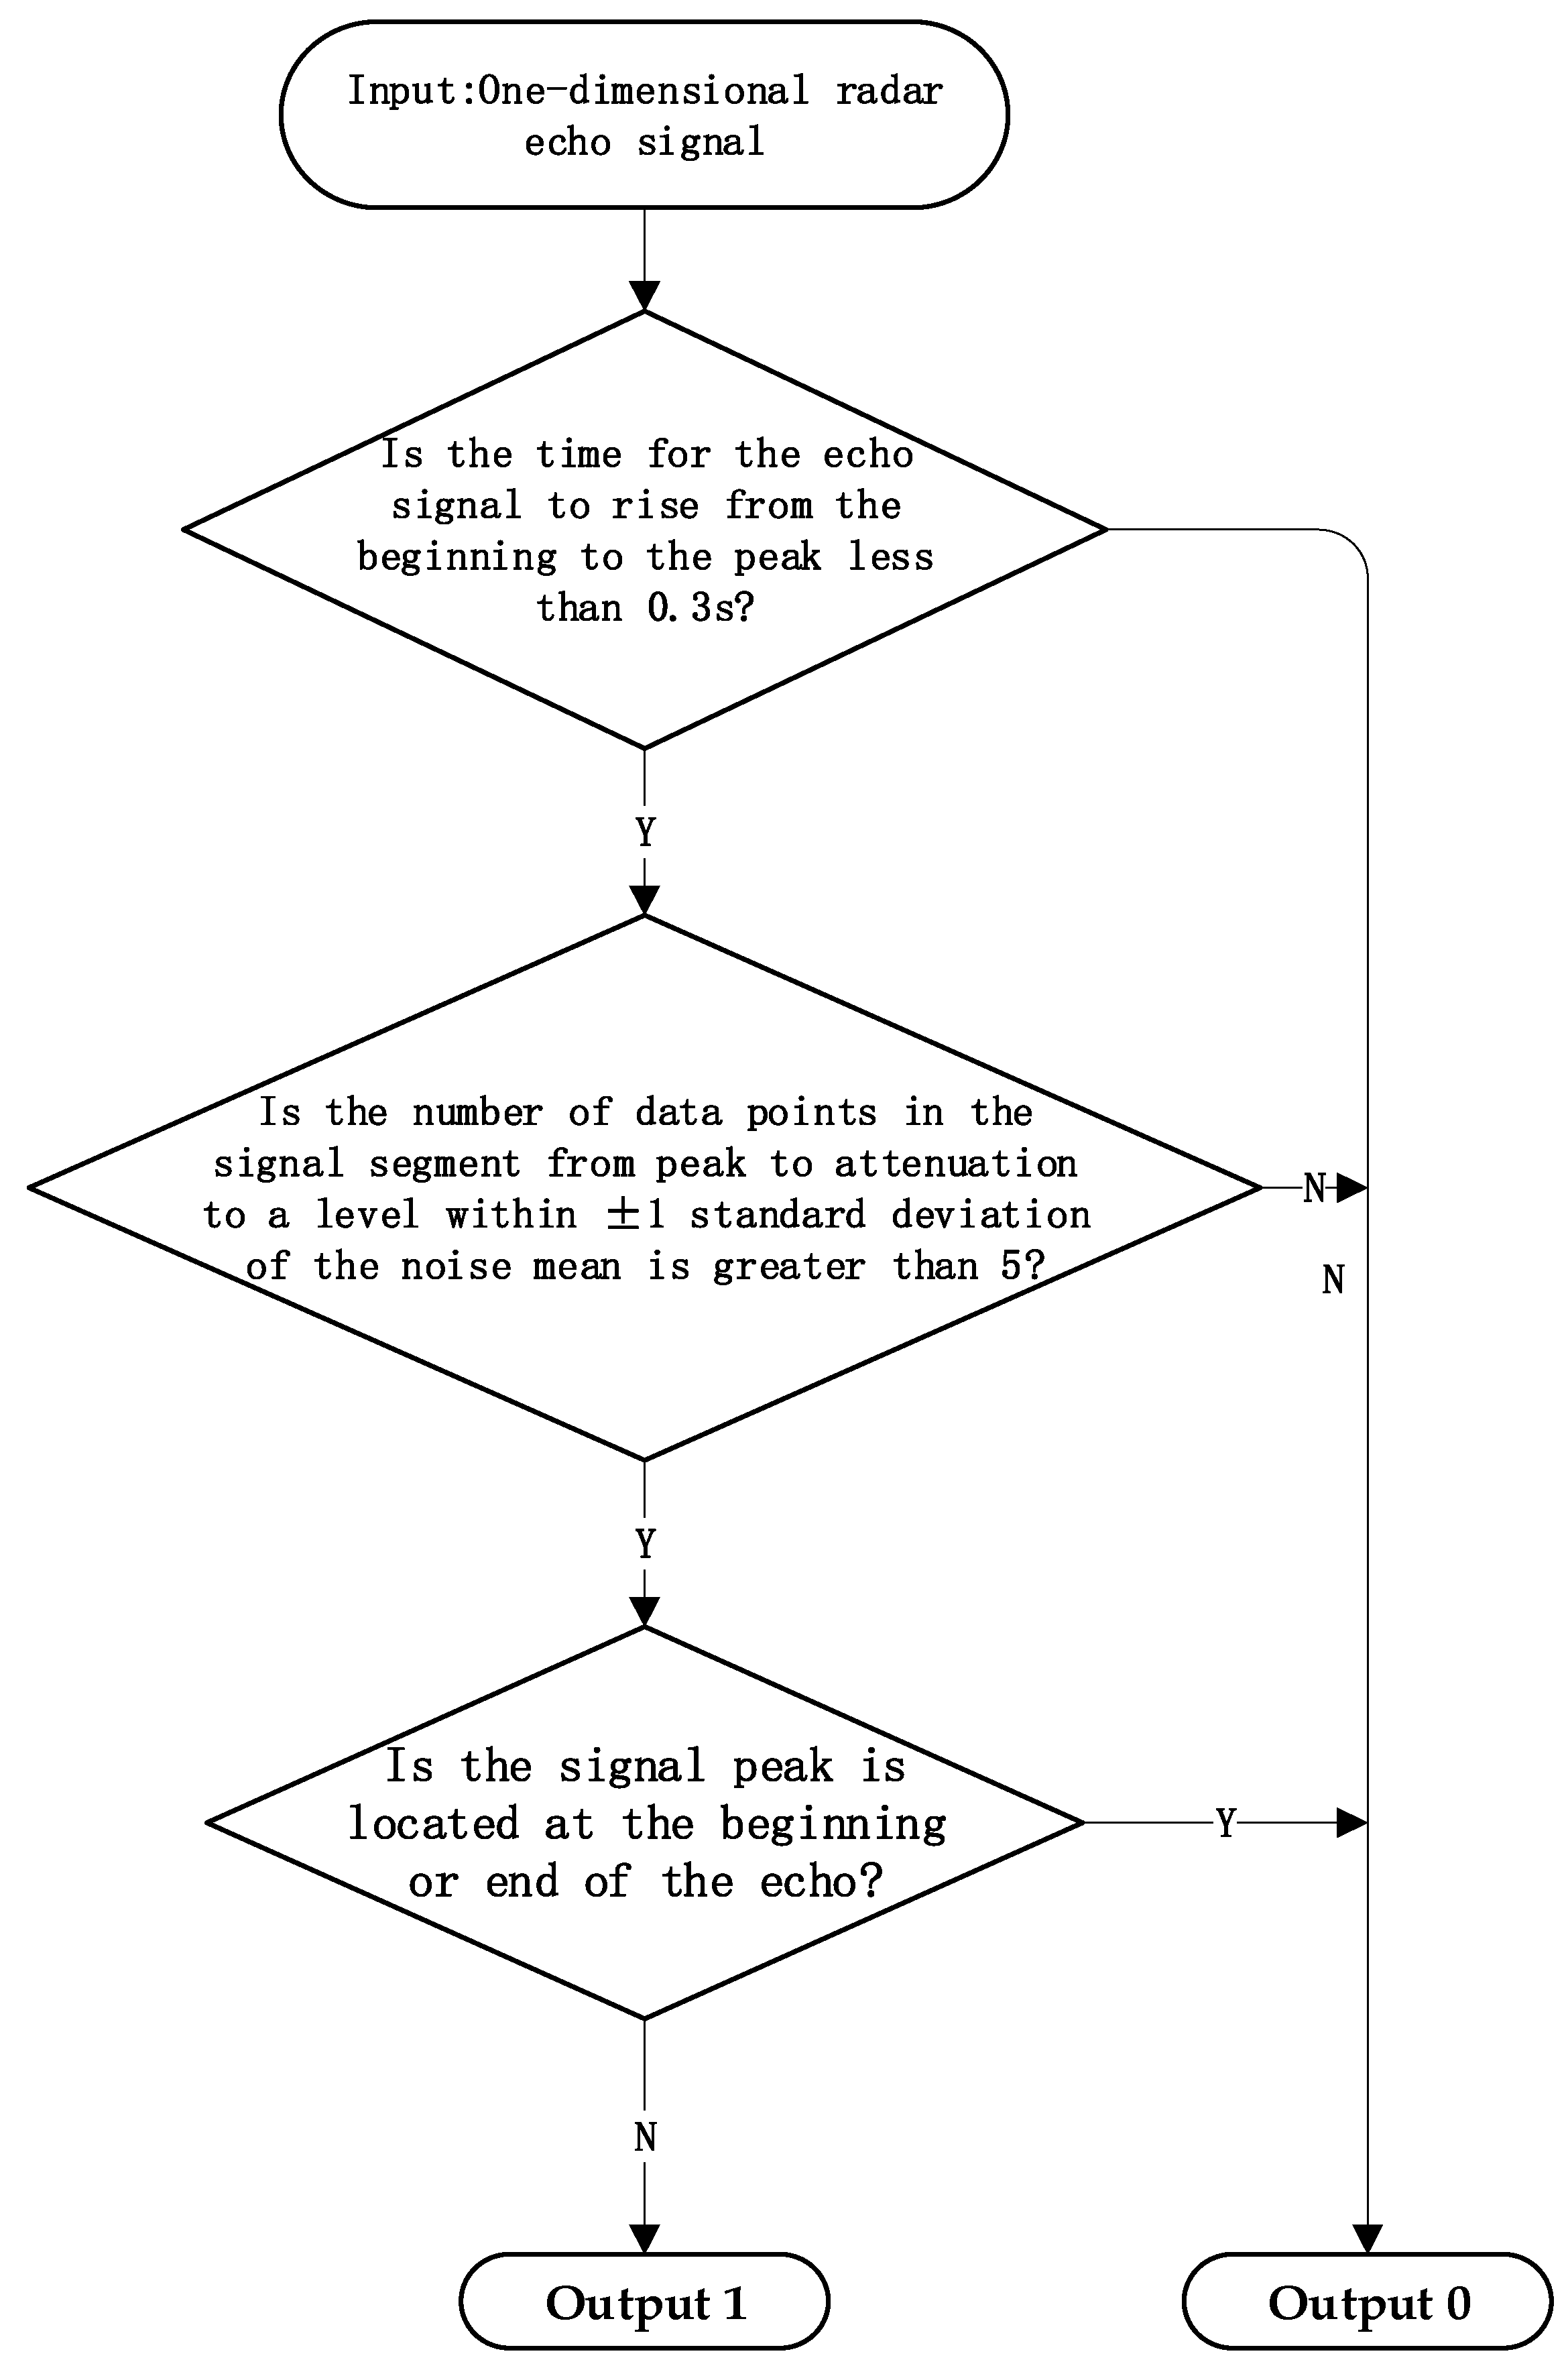
For each channel at every distance gate, starting from the suspected time of lightning occurrence, a time-domain signal lasting one second undergoes a screening process as outlined in
Figure 5 to determine if it can be deemed a valid lightning signal for subsequent localization efforts.
If only the echo data from the five channels corresponding to a specific distance gate pass the screening, but the echoes received from these five channels lack sufficient similarity, it cannot be classified as a valid lightning echo. In this experiment, a cosine similarity method is employed to measure signal similarity. A segment of the echo is considered a genuine lightning echo and is retained for future localization purposes only if the angles between the signals from the other four antennas and the central antenna’s signal are all less than 30 degrees.
2.4. Identification of Passive Signals
To achieve active and passive integrated localization of lightning radiation sources, it is essential to extract passive signals that do not contain active lightning signals. This extraction will allow for the subsequent localization processes to be applied effectively.
As mentioned earlier, passive signals span the entire range of distance gates, while active lightning echo signals are present only within a limited number of distance gates. Therefore, to extract pure passive signals, it is essential to first define the range of distance gates. Based on extensive observations, it has been determined that there are no active radar echo signals beyond the 160th distance gate on the RTI map (corresponding to 16 km). Consequently, for the RTI map slice of lightning echoes lasting for 1 s from the moment of the lightning strike, we first calculate the average along the vertical axis for regions where the vertical coordinate exceeds 800. Columns with an average value greater than the previously mentioned threshold for passive signals are considered suitable for subsequent localization. This signal will be saved separately from the active lightning echo signals for later localization use.
2.5. Principle of the Phase Interference Method
Figure 2 illustrates a simplified geometric structure of an interference antenna array with orthogonal baselines. In this experiment, the phase differences of the incident electromagnetic waves between adjacent antenna elements are used to determine the azimuth and zenith angles of the incoming waves.
As shown in
Figure 2, A represents the azimuth angle of the incoming wave, while E denotes its zenith angle. Based on the geometric relationship between the antenna array and the radiation source, Equations (1) and (2) can be derived [
9].
In Equations (1) and (2),
(i,j = 1, 2, 3, 4, 5) represents the true phase difference between Antenna j and Antenna i, as shown in
Figure 1; λ denotes the wavelength of the antenna; and d is the distance between the two adjacent antennas. To determine the position of the lightning radiation source, it is also necessary to know the distance from the radiation source to the central antenna. In this experiment, the number of range gates obtained from the received radar echo signals is used to calculate this distance [
17,
18]. According to the research conducted by Zeng Ziyi [
18], when the radar’s range resolution is 150 m, the accuracy of the final positioning results can be ensured. In this experiment, the range for each distance gate of the Leshan very-high-frequency radar is 100 m, meaning that the radar’s range resolution in this experiment is less than 150 m. Therefore, the ranging error remains within an acceptable range. Thus, by combining the azimuth of the radiation source derived from Equations (1) and (2) and the distance obtained from the radar’s range gates, the spatial location of the lightning radiation source can be determined.
However, the interferometric measurement method has an inherent limitation known as the phase ambiguity problem [
14]. This study employs the method of rotating phase differences, marking phase lines, and rounding phase differences proposed by Sang et al. [
15] to determine the true angle of arrival (AOA). The effectiveness of this method has been validated through simulation experiments conducted in a MATLAB (R2022a) environment. The entire verification process can be roughly described as follows: According to the aforementioned de-ambiguation algorithm, we designed a MATLAB function called “realPhaseDiff.” The inputs include the wavelength, the measured phase values, and the distance between adjacent antennas, while the output is the resolved true phase difference. In this experiment, we first established a simulation system in the MATLAB environment that resembles the Leshan very-high-frequency antenna array. For different directions of incoming waves (with pre-set angles of arrival in the MATLAB environment), we compared the output values of the “realPhaseDiff” function with the predetermined angles of arrival to verify the effectiveness of the algorithm. The validation showed that the root mean square error of the angles of arrival is approximately 0.09°, confirming the algorithm’s effectiveness.
2.6. Phase Difference Calculation
After saving the valid active lightning echo signals and passive lightning echo signals, the next step is to begin the localization of the lightning radiation source. As mentioned earlier, the key to determining the direction of the lightning radiation source lies in identifying the phase differences between the antenna channels, ensuring that these phase differences are the true values without any phase ambiguity.
In this experiment, we first calculate the ambiguous phase differences [
11] of each antenna relative to the central antenna using the cross-correlation function. We then apply the previously mentioned de-ambiguous algorithm proposed by Sang et al. [
15] to obtain the true phase differences. Given that this algorithm is designed to suppress noise, it can effectively enhance localization accuracy. The steps are as follows:
Let
and
be the IQ signal sequences received by the i-th and j-th antennas, respectively. Theoretically, the phase difference
between the two antennas can be calculated using Equations (3) and (4) [
12].
Here, mlag represents the maximum lag in the cross-correlation operation, and in this experiment, we set mlag = 3. Thus, the initial phase difference is obtained from the argument of the central element of the complex sequence resulting from the cross-correlation of and with a maximum lag of 3.
To improve accuracy and further mitigate the effects of noise, the argument of the sequence C is subjected to linear fitting [
12]. It is assumed that the intercept of the fitted line provides a relatively accurate value for the phase difference.
The above discussion outlines the localization principle for active lightning echo signals. To achieve integrated localization of both active and passive signals, it is also necessary to localize the passive signals.
The localization of passive signals is also based on the cross-correlation algorithm; however, unlike the previously described localization algorithm for active lightning echo signals, the cross-correlation sequence for passive signals is selected along the fast time dimension (i.e., the vertical axis of the RTI diagram), while the cross-correlation sequence for active lightning echo signals is selected along the slow time dimension.
2.7. Active and Passive Integrated Positioning Algorithm
As mentioned earlier, a purely active lightning localization algorithm has the drawback of producing a limited number of localization points. This limitation can hinder a clear representation of the structure of the lightning plasma channel, preventing the experiment from achieving its intended objectives.
To address this issue, this study adopts an integrated localization algorithm that combines both active and passive methods. Traditional integrated localization algorithms involve using active localization algorithms and passive localization algorithms separately on the same target, analyzing the interrelationship between the results from both algorithms to obtain more accurate outcomes. However, in this experiment, the lack of distance information from the passive signals makes it impossible to follow the conventional approach for integrated localization. Therefore, this experiment chooses to leverage the distance information derived from the active localization algorithm to perform distance matching for the passive signals. This approach not only provides distance information for the passive signals but also significantly increases the number and density of localization points. This can effectively mitigate the issues of having too few localization points, low density, and reduced accuracy caused by the absence of distance information, while also laying the groundwork for subsequent imaging of the lightning plasma channel.
The steps for distance matching are as follows: After applying the aforementioned localization methods to obtain the three-dimensional positions of all active lightning echo signals, along with the zenith and azimuth angles of the passive signals, we first define the distance from all passive signal points to the central antenna as 1 km. Next, we treat the coordinates of all active and passive localization points as vectors. For each vector corresponding to a passive signal, we calculate the angle between it and every vector of the active signals. The distance of the active signal localization point that has the smallest angle with the passive signal vector is then defined as the corresponding distance for that passive signal localization point.
This distance matching algorithm, while intuitive and less complex, has a drawback: when the aforementioned “smallest angle” exceeds a certain range, the final location results may contain redundant points. Although subsequent denoising measures based on clustering algorithms can effectively reduce their number, the quality of lightning imaging is still inevitably affected when the number of location points is excessively large. Addressing this limitation of the algorithm will be a key focus of future research.
3. Result
On 11 August 2020, the Leshan very-high-frequency radar successfully generated a set of RTI images containing lightning echoes. Utilizing the previously mentioned lightning identification program, we determined that the time of the lightning strike was 11 August 2020, at 21:30:17. The correctness of this timestamp was preliminarily validated using localization data from the very-low-frequency radar at the Institute of Electrical Engineering, Chinese Academy of Sciences (IEECAS). This paper will subsequently use the lightning event that occurred at this time to evaluate the effectiveness of the aforementioned active and passive integrated lightning localization algorithm.
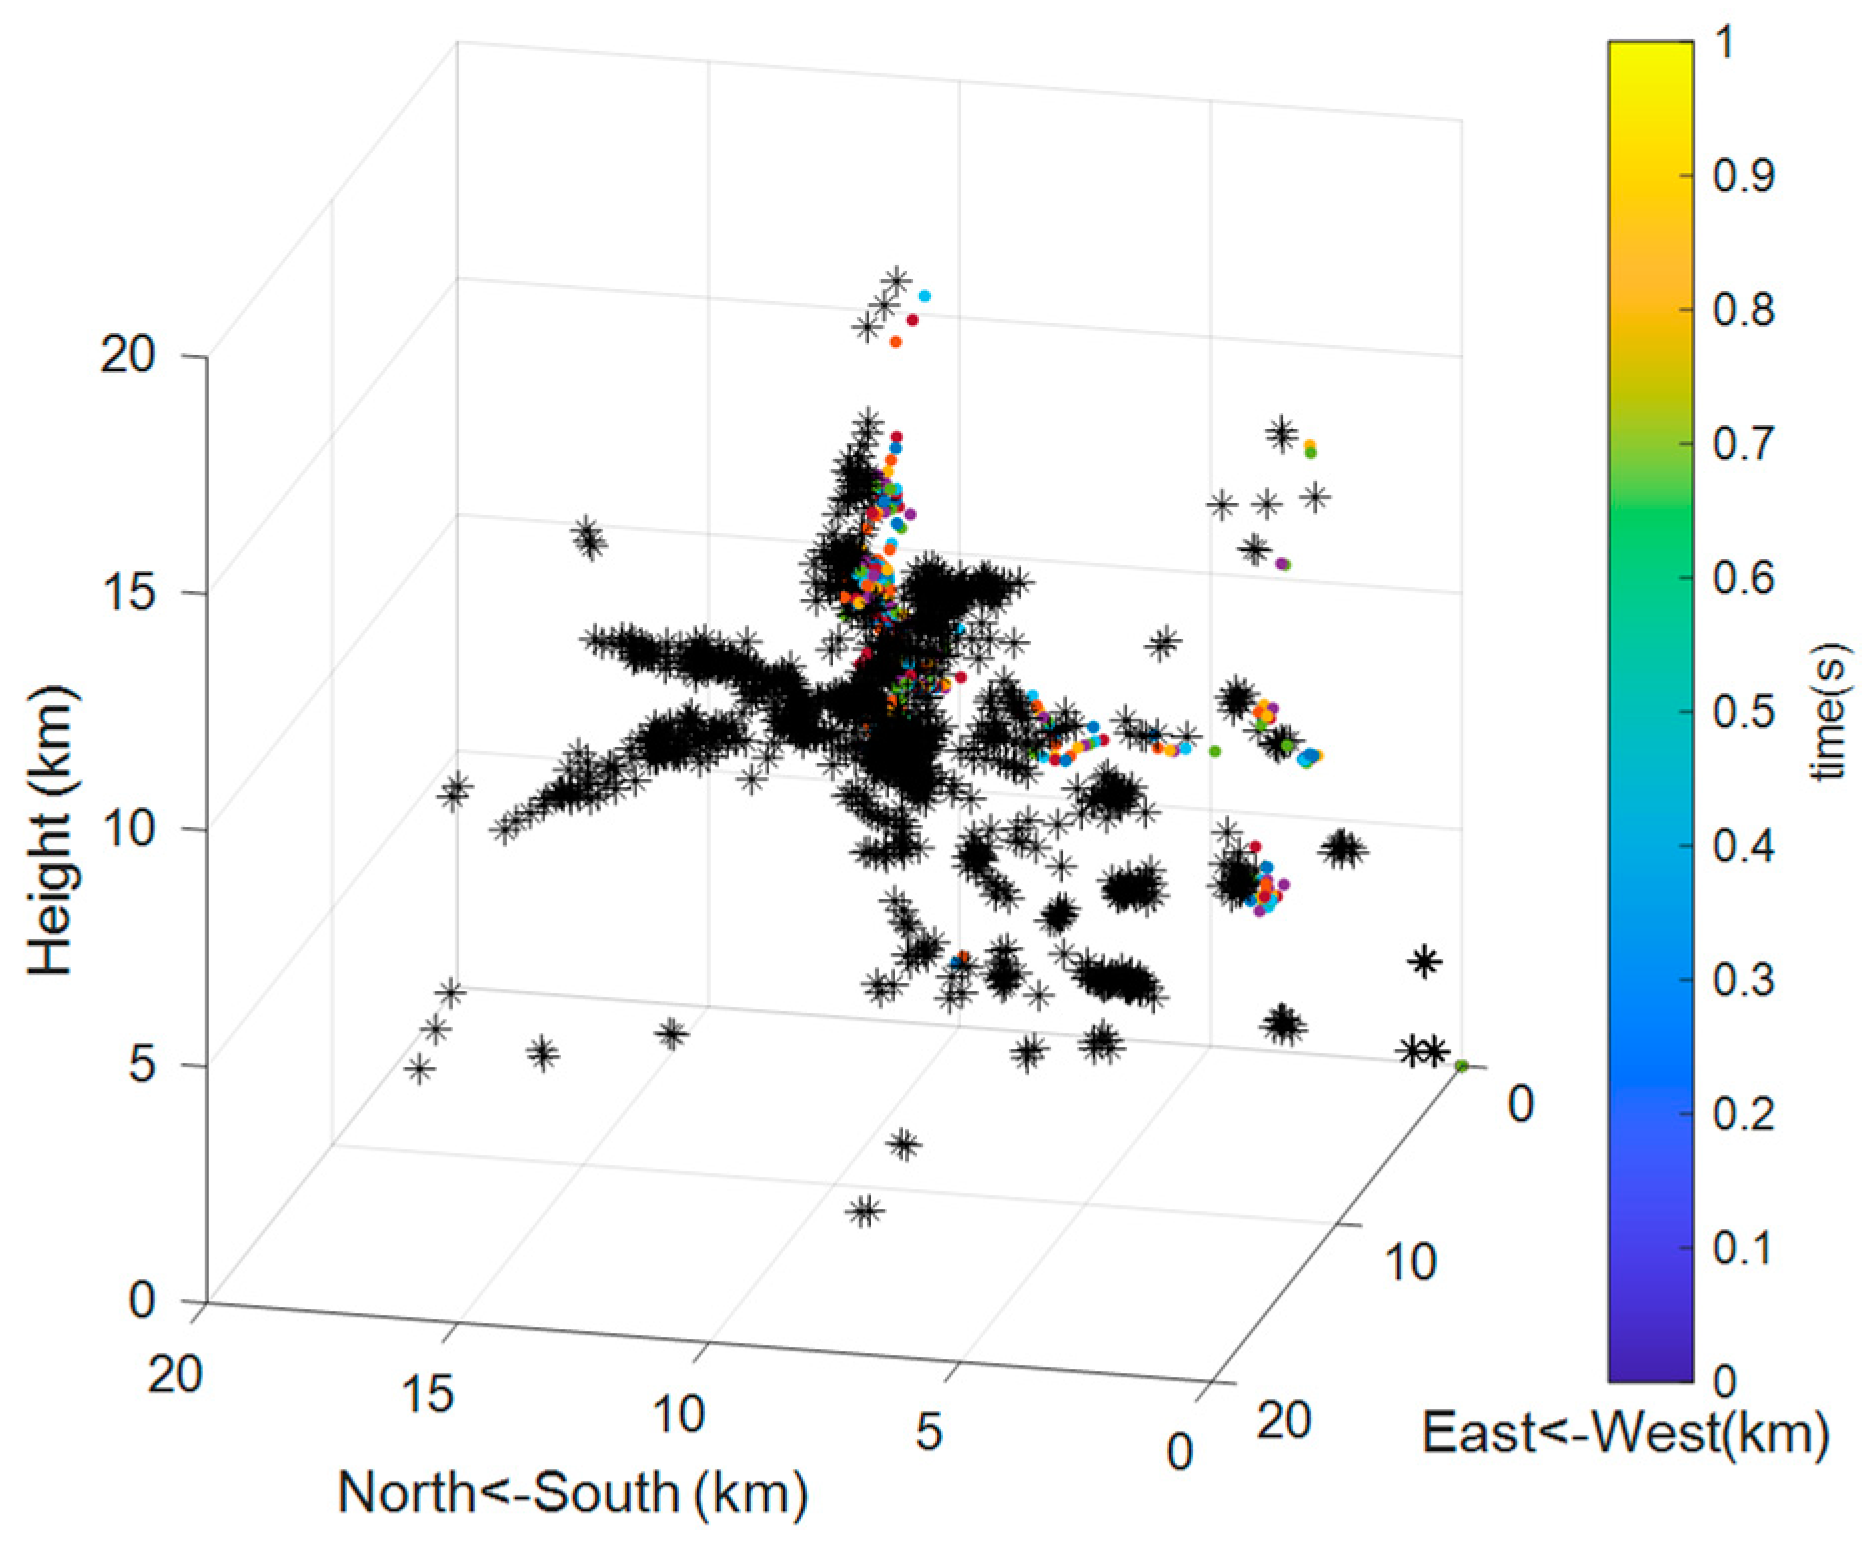
The localization results for this lightning event obtained using the active and passive integrated localization algorithm are shown in
Figure 6.
As shown in
Figure 6, directly applying the aforementioned active and passive integrated algorithm results in a chaotic distribution of localization points. This confusion arises because effective measures were not taken to exclude redundant localization points generated by passive signals and noise. The excessive number of localization points from passive signals obscures the true lightning channel, preventing the experiment from achieving its intended objectives.
To address this issue, this experiment decided to use a clustering algorithm to eliminate redundant localization points from passive signals and noise, allowing for a clearer representation of the three-dimensional structure of the lightning channel.
During a lightning event, the lightning radiation source often manifests as clusters of grouped formations in the areas of most vigorous convection within the thunderstorm cloud. This results in the observed lightning data being predominantly represented as a collection of densely clustered localization points [
19]. This observation serves as the fundamental basis for utilizing a clustering algorithm. Currently, commonly used clustering algorithms include the K-means clustering algorithm and the DBSCAN clustering algorithm. In
Section 3.1 and
Section 3.2, these two clustering algorithms will be introduced respectively.
3.1. K-Means Clustering Algorithm
The K-means clustering algorithm is an iterative clustering analysis method. The process begins by predefining the number of clusters, K. Then, K objects are randomly selected as the initial cluster centers. Next, the algorithm calculates the distance between each object and each of the cluster centers, assigning each object to the nearest cluster center. The cluster centers and the objects assigned to them represent a cluster. After each assignment of a sample, the cluster centers are recalculated based on the existing objects within each cluster. This process continues to repeat until a specified termination condition is met.
The advantage of K-means clustering algorithm is its low time complexity [
19], simple principles, ease of implementation, and fast convergence. However, a significant drawback of K-means is the difficulty in determining the value of K, which can greatly affect the final clustering results. Additionally, the K-means algorithm implicitly assumes that clusters are convex. In contrast, the branched structure of lightning plasma channels is often very complex, making it difficult for the K-means clustering algorithm to yield satisfactory results in such cases.
Figure 7 shows the K-means clustering results under the condition of setting K = 10, where points that are more than 1 km away from the cluster centers are considered noise points. As seen in
Figure 7, some localization points that should belong to the radiation sources are misidentified as noise points (indicated by the black stars in
Figure 7). This misclassification can severely impact the three-dimensional imaging of the lightning plasma channel. Therefore, this experiment will not use this clustering algorithm.
3.2. DBSCAN Clustering Algorithm
DBSCAN is a representative density-based clustering algorithm. Unlike partitioning and hierarchical clustering methods, it defines clusters as the largest sets of points that are density-connected. This allows it to identify clusters in regions with sufficiently high density and discover arbitrarily shaped clusters in the presence of noise within spatial databases. The DBSCAN clustering algorithm requires two parameters: the scanning radius (eps) and the minimum number of points (minPts). Starting with an arbitrary unvisited point, the algorithm identifies all nearby points within a distance of eps (including eps). If the number of nearby points is greater than or equal to minPts, the current point and its nearby points form a cluster, and the starting point is marked as visited. The algorithm then recursively processes all unvisited points in the cluster in the same manner to expand the cluster. If the number of nearby points is less than minPts, the point is temporarily marked as a noise point. Once the cluster is sufficiently expanded, meaning all points within it have been marked as visited, the algorithm proceeds to process any remaining unvisited points using the same approach.
In this experiment, collections of localization points with high density will be regarded as genuine lightning channels, while more dispersed localization points will be considered isolated noise. This approach aligns well with the density-based clustering concept of the DBSCAN algorithm. Additionally, the DBSCAN algorithm can identify clusters of arbitrary shapes, which is advantageous for revealing the complex structures of lightning channels. Therefore, this experiment has chosen to apply this algorithm. The next section will provide a detailed description of the data processing procedure using this method and how the clustering algorithm will be utilized to image the lightning channels.
3.3. Removal of the Noise Points and the Imaging of Lightning Channel
As mentioned earlier, this experiment will utilize the DBSCAN clustering algorithm to process the obtained lightning localization points in order to achieve the study’s objectives. However, due to the confusion caused by directly applying the K-means clustering algorithm, this study adopts the following measures: First, the DBSCAN algorithm will be applied separately to the localization points of passive signals for clustering analysis, and the cluster centers for each group will be calculated. For the two parameters of the DBSCAN algorithm—r (defined as the threshold of distance) and M (defined as the threshold for the number of core points)—this experiment references the research of scholars such as Shi Zheng and Wu Zimin [
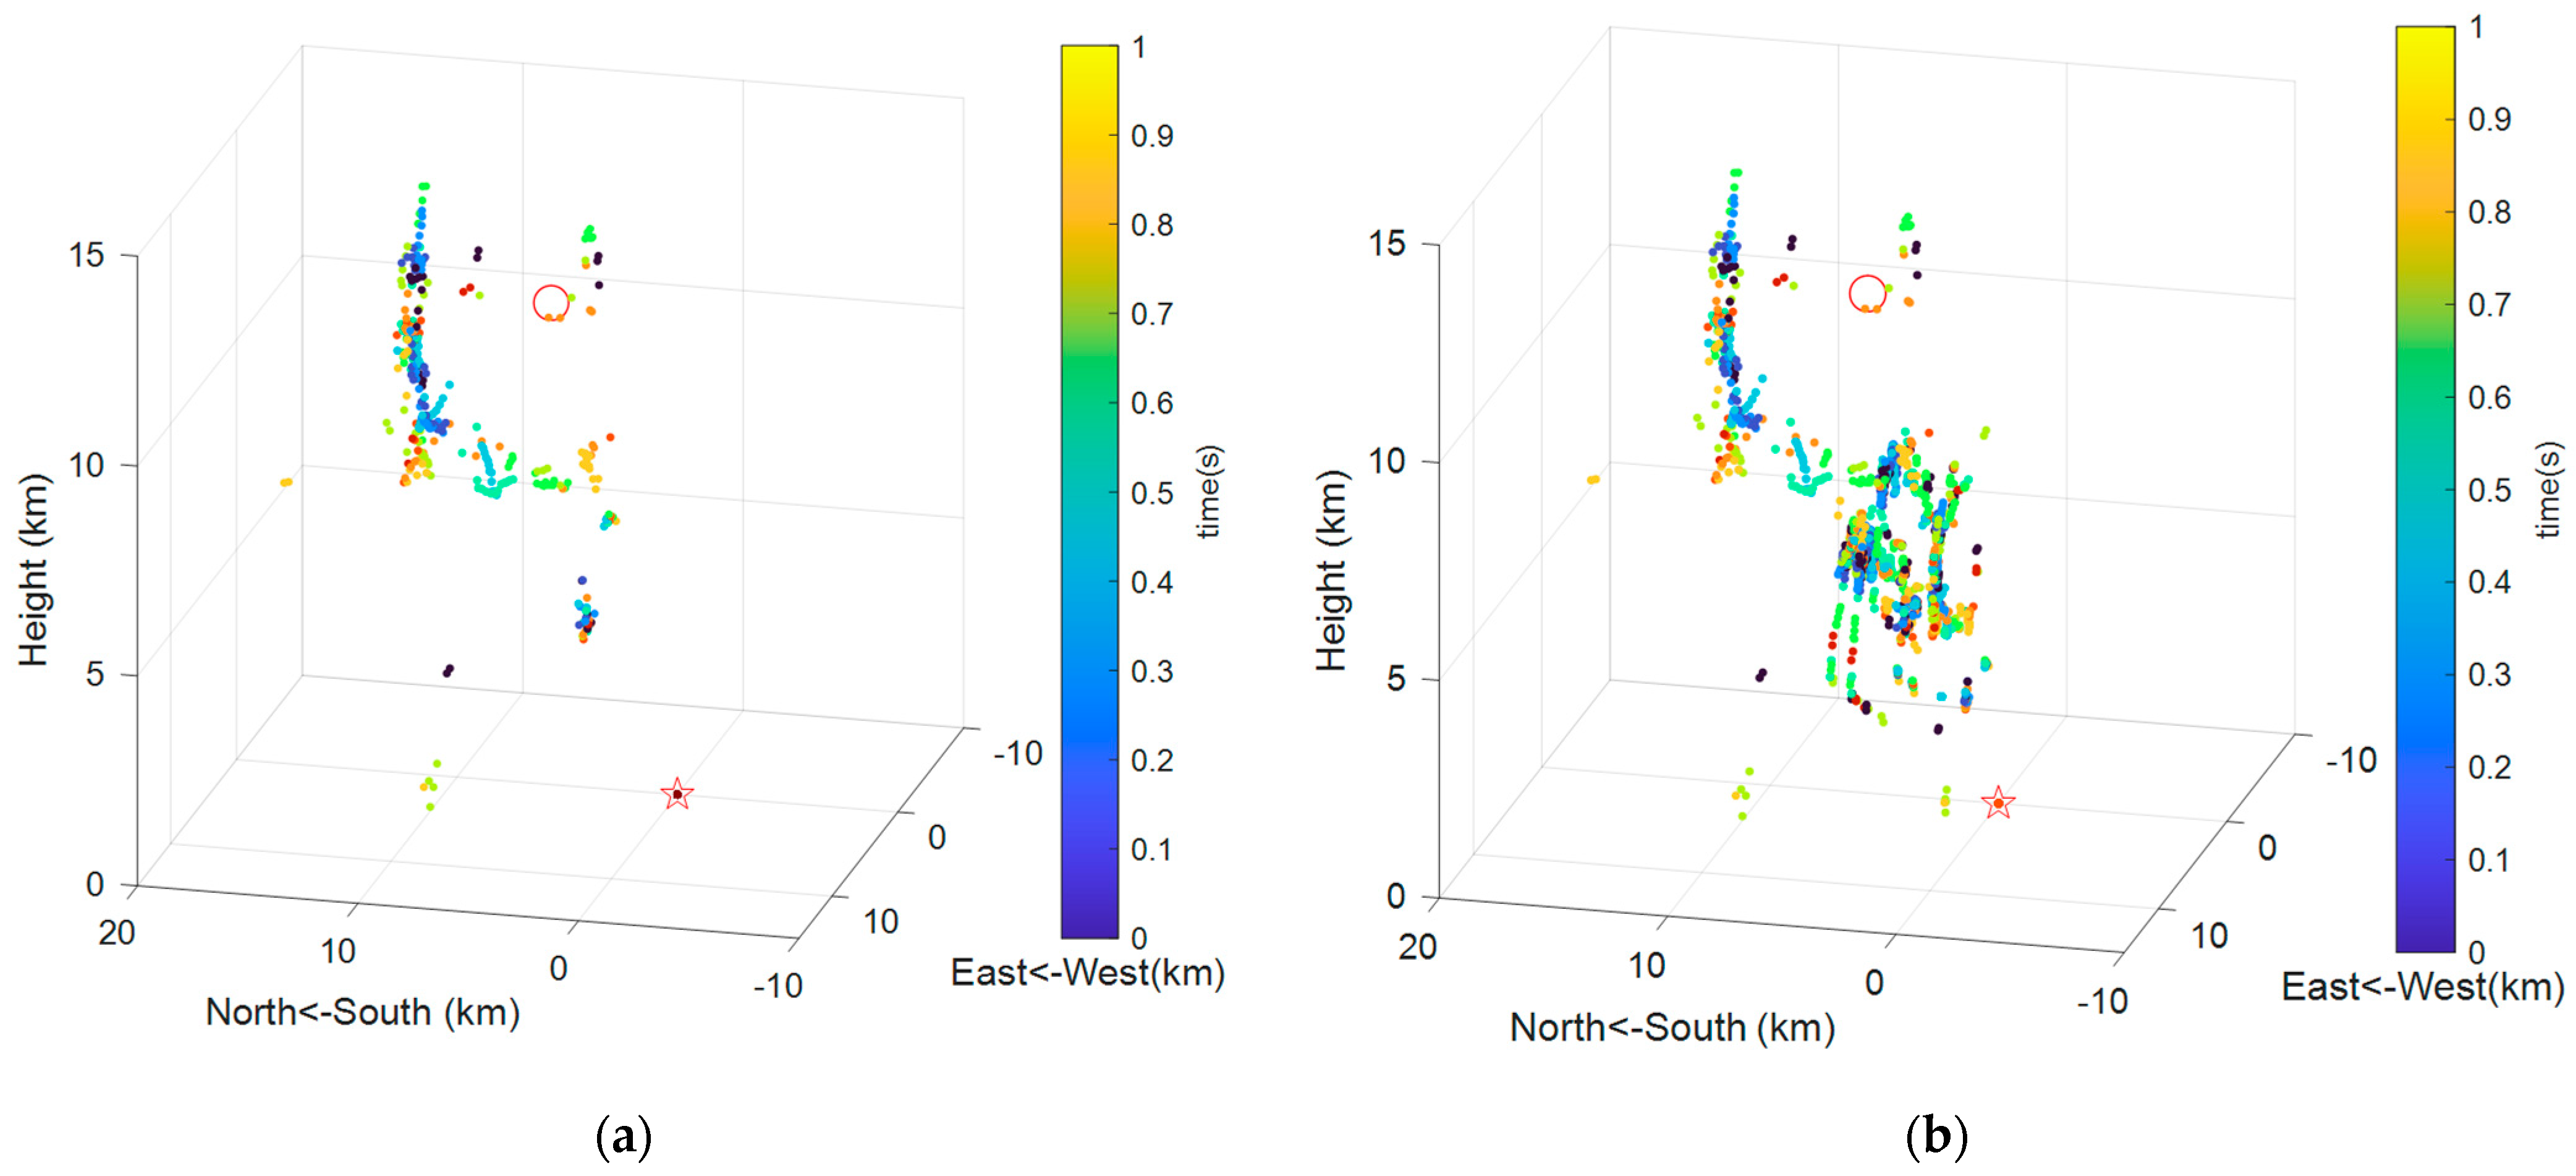
19]. The value of M is set to 5. The threshold of distance r will be determined using the k-distance function. In this experiment, each radiation source has three coordinates, so k is set to 3 + 1 = 4. For each point, the algorithm will calculate which k points are closest to it, sort these k distances in descending order, and construct the k-distance function. The optimal value of r corresponds to the y-coordinate of the inflection point of the k-distance function. Next, we will conduct another clustering analysis on the localization points generated from the active lightning echo signals and calculate the centroid of each cluster. We will identify which passive signal cluster centroid is closest to each active signal cluster centroid, retaining only the closest passive signal cluster and excluding the others. Finally, we will perform a unified DBSCAN clustering analysis on all localization points from both active and passive signals. The threshold of distance r will again be determined using the k-distance function, set to 0.9, while the threshold for the number of core points remains at 5. This process yields the final integrated localization results for both active and passive signals, as shown in
Figure 8b.
As shown in
Figure 8, the new active and passive integrated localization algorithm, combined with the DBSCAN algorithm, can relatively clearly depict the structure of the lightning channel. In
Figure 8, the red star represents the location of the Leshan very-high-frequency radar station, while the red circle indicates the location results of lightning radiation sources provided by the very-low-frequency radar system from the Institute of Electrical Engineering, Chinese Academy of Sciences (IEECAS).
Figure 8 reveals the finer spatial structure of the lightning channel. In
Figure 8, the labels on the x-y plane are replaced with West < −East and South < −North, while the
z-axis label is replaced with “Height”. Due to the inherent limitations of the VLF radar system, its location results are represented as a single point in
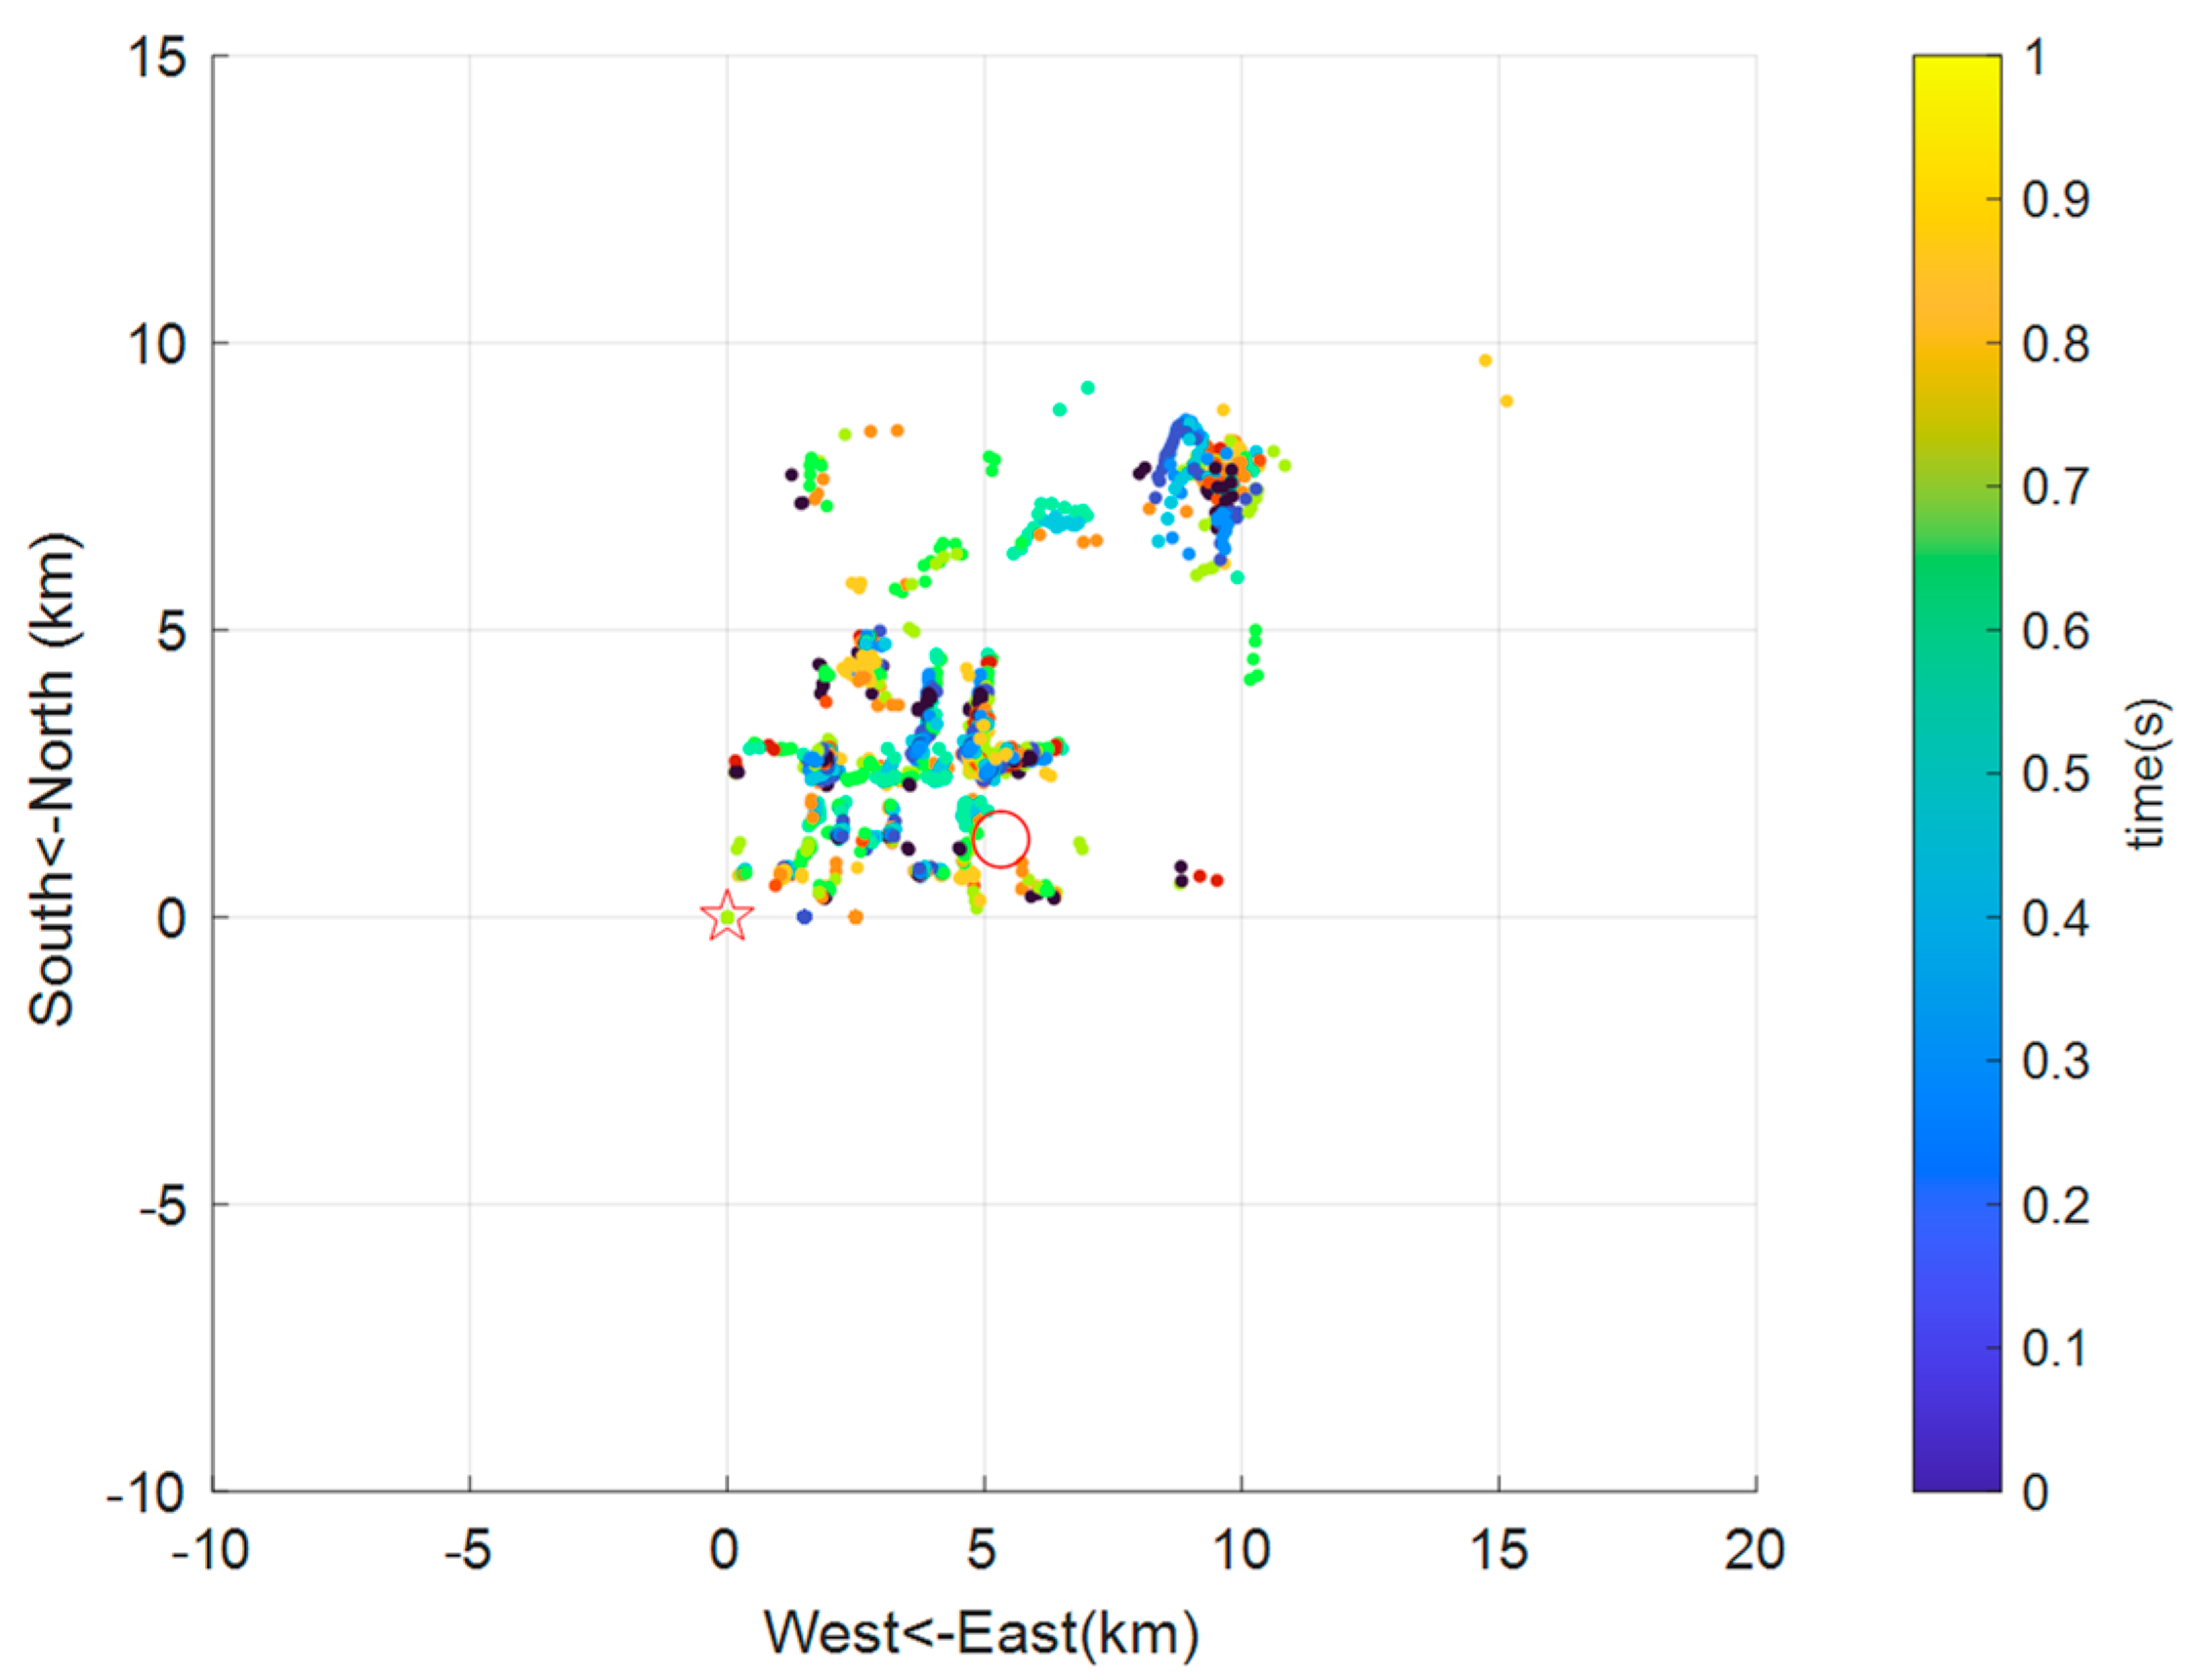
Figure 8, which does not capture the intricate structure of the lightning plasma channel. For convenience, this paper provides a three-dimensional location result projected from a top-down view in
Figure 8b, as shown in
Figure 9. As illustrated in
Figure 9, the location results from the VLF radar are relatively close to those obtained from the Leshan very-high-frequency radar when projected onto the x-y plane; however,
Figure 8b indicates that there is a noticeable difference in height between the two location results. This deviation between the two results is reasonable, as VLF lightning location is performed using multiple remote stations, which may lead to potential locating errors.
In the clustering algorithm used in this paper, the most critical evaluation metric is the distribution of silhouette coefficients [
20,
21,
22,
23,
24]. The silhouette coefficient measures how similar an object is to its own cluster compared to other clusters. It ranges from −1 to 1, where a value close to 1 indicates that the point is well-clustered, a value near 0 suggests that the point is on or very close to the decision boundary between two neighboring clusters, and a negative value indicates that the point may have been assigned to the wrong cluster. MATLAB provides a built-in function to compute the silhouette coefficient for clustering results. The function is called “silhouette”, and in this experiment, we use this function to calculate the silhouette coefficient. In the DBSCAN algorithm used in this experiment, only 0.58% of the silhouette coefficients are less than 0, while 91.75% have a value of 1, indicating that 91.75% of the localization points were perfectly assigned to a single cluster. Only 5.8‰ of the localization points were incorrectly assigned to other clusters. This metric demonstrates that the performance of the localization algorithm is quite effective.
4. Discussion
The results of this study indicate that the active and passive integrated lightning localization technology can provide a clear representation of the lightning plasma channel structure, facilitating more detailed future research on the variations in lightning channel structures. One significant advancement of this research compared to previous studies is that, unlike traditional integrated localization methods, this approach overcomes the limitations of passive localization algorithms, which lack distance information, thereby greatly increasing the number and density of localization points. Additionally, during the subsequent processing of localization data, the DBSCAN algorithm plays a crucial role in distinguishing whether the localization points are true lightning radiation sources or noise points.
However, there are still two areas for improvement in the lightning localization algorithm involved in this experiment. First, as the frequency of extreme weather events increases and the complexity of the electromagnetic environment grows, there is a rising demand for enhanced interference resistance in lightning localization algorithms. Improving the adaptability of lightning localization imaging algorithms in complex weather and electromagnetic environments remains an area for further research. Additionally, this algorithm has only been implemented on a host computer. However, as current lightning detection equipment gradually shifts towards automation, miniaturization, and intelligence, it is essential to explore whether this algorithm can be utilized on embedded platforms such as ARM, DSP, and FPGA, as well as how to simplify and implement it on these platforms in future research.
Overall, the algorithm proposed in this paper is suitable for large-scale applications in lightning location and imaging. Moreover, the principles and methods discussed herein are also applicable to the localization of aircraft traversing cloud layers. Although our current research focuses primarily on Asia, the application of this algorithm will greatly expand as we continue to improve it and explore other regions.
5. Conclusions
The study presented in this paper has successfully demonstrated the effectiveness of an active and passive integrated lightning localization and imaging technology based on very-high-frequency (VHF) radar. By leveraging both active and passive lightning echo signals, we have been able to significantly enhance the accuracy and density of localization points compared to traditional methods. The unique integration of these two techniques not only overcomes the limitations of individual active or passive localization algorithms but also provides a comprehensive view of the lightning plasma channel structure.
The experimental results show that the proposed algorithm can accurately locate lightning radiation sources and generate high-resolution three-dimensional images of lightning channels. The application of the Density-Based Spatial Clustering of Applications with Noise (DBSCAN) clustering algorithm further improved the imaging clarity by effectively eliminating noise points unrelated to the lightning source. The silhouette coefficient analysis confirms the high performance of the localization algorithm, with over 91% of the localization points being perfectly assigned to a single cluster.
This research not only advances the field of lightning detection and localization but also has important implications for understanding the dynamics and structure of lightning plasma channels. The methods and principles discussed in this paper have the potential for large-scale applications in lightning monitoring systems and can be further extended to other related fields such as aircraft tracking in complex weather conditions.
However, there are still areas for improvement. First, although our upcoming work will involve comparing the performance of the lightning localization and imaging algorithms used in this study with that of some well-tested lightning detection and imaging systems, this paper focuses on improving the performance of the algorithms previously used on the same hardware system. This is a limitation of our research. Moreover, as extreme weather events become more frequent and the electromagnetic environment becomes more complex, there is a need to further enhance the interference resistance of the lightning localization algorithms. Additionally, future research should explore the feasibility of implementing this algorithm on embedded platforms to meet the growing demand for automated, miniaturized, and intelligent lightning detection equipment. Overall, the active and passive integrated lightning localization and imaging technology proposed in this paper represents a significant step forward in the field and paves the way for future advancements.
Author Contributions
Conceptualization, C.Z.; methodology, Y.T.; investigation, Y.T. and X.Z.; data curation, Y.T. and M.L.; writing—original draft preparation, Y.T.; writing—review and editing, Y.T., M.L., X.Z. and C.Z. All authors have read and agreed to the published version of the manuscript.
Funding
This study was supported by the National Natural Science Foundation of China. Grant Number: 42230104.
Data Availability Statement
The data used in this paper are available upon request from the corresponding author.
Conflicts of Interest
The authors declare no conflicts of interest.
Abbreviations
The following abbreviations are used in this manuscript:
| VHF | Very high frequency |
| DBSCAN | Density-Based Spatial Clustering of Applications with Noise |
| TDOA | Time Difference of Arrival |
| I/Q | In-phase and Quadrature |
| RTI | Range–time–intensity |
| AOA | Angle of arrival |
| IEECAS | Institute of Electrical Engineering, Chinese Academy of Sciences |
References
- Wu, J.J.; Chen, M. Characteristics of Lightning Activity in Southern China. Sci. Technol. Ind. 2023, 23, 254–262. [Google Scholar] [CrossRef]
- Zhao, C.H.; Zhang, Y.J. Using Polarimetric Radar Observations to Characterize First Echoes of Thunderstorms and Nonthunderstorms: A Comparative Study. J. Geophys. Res. Atmos. 2022, 127, e2022JD036671. [Google Scholar] [CrossRef]
- Zhi, S.L. Characteristics of Lightning Activity in Southeast China and Its Relation to the Atmospheric Background. J. Trop. Meteorol. 2024, 30, 76–88. [Google Scholar] [CrossRef]
- Zhang, Y.J.; Zhang, Y. Advances in Lightning Monitoring and Location Technology Research in China. Remote Sens. 2024, 14, 1293. [Google Scholar] [CrossRef]
- Du, S.J. Accelerate the Time-Reversal Computing of Lightning Location Using GPU and Phase-Difference Filter. IEEE Trans. Electromagn. Compat. 2023, 65, 496–506. [Google Scholar] [CrossRef]
- Chen, H.F. A Low Computational Cost Lightning Mapping Algorithm with a Nonuniform L-Shaped Array: Principle and Verification. IEEE Trans. Geosci. Remote Sens. 2022, 60, 4106410. [Google Scholar] [CrossRef]
- Yin, W.J.; Jin, W.Z. Lightning Detection and Imaging Based on VHF Radar Interferometry. Remote Sens. 2021, 13, 2065. [Google Scholar] [CrossRef]
- Hamidreza, K. Machine Learning-Based Lightning Localization Algorithm Using Lightning-Induced Voltages on Transmission Lines. IEEE Trans. Electromagn. Compat. 2020, 13, 2515–2519. [Google Scholar] [CrossRef]
- Dong, W.S. The Broadband Radio Interferometer for Lightning Observation and the Development and Structure of Lightning Discharges. Master’s Thesis, Cold and Arid Regions Environmental and Engineering Research Institute, Lanzhou, China, 2000. [Google Scholar]
- Mazur, V.; Doviak, R. Radar Cross Section of a Lightning Element Modeled As a Plasma Cylinder. Radio Sci. 1983, 18, 381–390. [Google Scholar] [CrossRef]
- Dawson, G. Radar as a Diagnostic Tool for Lightning. J. Geophys. Res. 1972, 77, 4518–4528. [Google Scholar] [CrossRef]
- Bo, Z.S. Adaptive DBSCAN and XGBoost Based Study on Lightning Proximity Prediction. Master’s Thesis, Taiyuan University of Science and Technology, Shanxi, China, 2024. [Google Scholar]
- Qian, M.Y. Design and Implementation of Meteor Radar Receiver and Data Processing System. Master’s Thesis, Wuhan University, Wuhan, China, 2019. [Google Scholar]
- Yin, W.J. The Study on Phase Interferometry in Meteor Radar System. Master’s Thesis, Wuhan University, Wuhan, China, 2020. [Google Scholar]
- Sang, V.D. Optimized Algorithm for Solving Phase Interferometer Ambiguity. In Proceedings of the 2016 17th International Radar Symposium (IRS), Krakow, Poland, 10–12 May 2016. [Google Scholar] [CrossRef]
- Zhang, Y.J. Experimental Analysis of Electromagnetic Noises from Airplane Flying in Clouds. Chin. J. Geophys. 2004, 47, 887–891. [Google Scholar] [CrossRef]
- Han, J. Study on the Correlation Between Cloud-to-Ground Lightning and Ground Electric Field Observed by Coherent Scatter Radar. Master’s Thesis, Taiwan Central University, Taoyuan, China, 2013. [Google Scholar]
- Zeng, Z.Y. Localization of Lightning and Error Simulation: Analysis and Research of Radar Interferometry and Time Difference Methods. Master’s Thesis, Taiwan Central University, Taoyuan, China, 2013. [Google Scholar]
- Shi, Z.; Wu, Z.M. Comparative Research on Thunderstorms Identification Based on Three Clustering Methods. Torrential Rain Disasters 2023, 42, 334–345. [Google Scholar] [CrossRef]
- Yang, X.M. Improvement Research and Application of DBSCAN Clustering Algorithm. Master’s Thesis, Dalian Jiaotong University, Dalian, China, 2023. [Google Scholar]
- Yan, W.H.; Huang, X.Y. Introduction of 3D Structure Detection Technology of Thunderstorm Cell Based on Improved DBSCAN Clustering Algorithm. J. Trop. Meteorol. 2020, 36, 542–551. [Google Scholar] [CrossRef]
- Wibisono, S.; Anwar, M.T.; Supriyanto, A.; Amin, I.H.A. Multivariate Weather Anomaly Detection Using DBSCAN Clustering Algorithm. J. Phys. Conf. Ser. 2021, 1869, 012077. [Google Scholar] [CrossRef]
- Wu, G.Q. HY-DBSCAN: A Hybrid Parallel DBSCAN Clustering Algorithm Scalable on Distributed-Memory Computers. J. Parallel Distrib. Comput. 2022, 168, 57–69. [Google Scholar] [CrossRef]
- Huang, J.; Guan, Y.N. Research on Outlier Data Processing Based on Improved DBSCAN Algorithm. Softw. Guide 2020, 19, 219–223. [Google Scholar]
| Disclaimer/Publisher’s Note: The statements, opinions and data contained in all publications are solely those of the individual author(s) and contributor(s) and not of MDPI and/or the editor(s). MDPI and/or the editor(s) disclaim responsibility for any injury to people or property resulting from any ideas, methods, instructions or products referred to in the content. |
© 2025 by the authors. Licensee MDPI, Basel, Switzerland. This article is an open access article distributed under the terms and conditions of the Creative Commons Attribution (CC BY) license (https://creativecommons.org/licenses/by/4.0/).


