Abstract
The impact of urbanization on the spatial distribution of extreme precipitation has become a major topic in the field of urban hydrology. This study used an urban canopy model (UCM) coupled with a Weather Research and Forecasting model (WRF) to analyze two extreme precipitation events experienced by the Pearl River Delta on 12–13 June (monsoon rainstorm) and 16–17 September (typhoon rainstorm) in 2018. The results showed that both experiments, considering UCM and not considering UCM, can effectively simulate the spatial distribution of two precipitation events in Pearl River Delta urban agglomeration. The root mean square errors of simulation and observation data of the two precipitation events by the UCM scheme were 14.6 mm and 16.7 mm, respectively, indicating relatively high simulation accuracy. The simulated precipitation amounts for the two rainfall events were increased by 2.3 mm and 3.0 mm, respectively. The simulation results of the two precipitation events showed that compared to agricultural land, urban and built-up land have experienced temperature increases of approximately 0.7 °C and 1 °C, respectively. The air-specific humidity of the two precipitation events increased by approximately 0.5 g/kg and 1.2 g/kg, respectively. These differences between UCM and NON simulations confirm that the increase in near-surface air humidity and temperature significantly enhances the intensity of extreme precipitation in the Pearl River Delta urban agglomeration.
1. Introduction
Urban extreme precipitation is one of the most direct and significant disasters in people’s daily lives, among many extreme weather phenomena [1,2]. Against the backdrop of global urbanization, extreme precipitation occurs frequently in cities, and the impact mechanisms behind it involve complex interactions between surface processes and the atmospheric environment [3,4,5]. The urban heat island, land use changes, and local weather changes caused by anthropogenic activities have altered the meteorological conditions in urban areas [6,7]. These factors directly affect the occurrence and evolution of extreme precipitation. These changes are not only reflected in temporal and spatial distribution of precipitation, but also in the imbalance of precipitation intensity and frequency [8]. The urban extreme precipitation not only poses a serious threat to urban infrastructure, but also has a significant impact on residents’ lives and socioeconomic activities [9]. Therefore, an in-depth study of the mechanisms and patterns of extreme urban precipitation can help to understand the complexity of urban hydrological processes and holds significant research value for urban planning and management [10,11].
At present, researchers mainly study urban extreme precipitation through observation data and numerical simulation [12]. In terms of observational data, various data sources, such as satellite remote sensing [13], ground observation stations, and automatic meteorological stations, provide abundant information for the research. Golroudbary [14] conducted a systematic study of extreme precipitation data from 231 rainfall stations in the Netherlands from 1985 to 2014, and found that changes in both air temperature and atmospheric circulation patterns significantly affect the intensity of extreme precipitation. Song [15] conducted an in-depth analysis using precipitation observations of 45 rainfall stations in Beijing from 1960 to 2012, and found that the spatial distribution of extreme precipitation in the Beijing area exhibits a distinct pattern of higher values in the east and lower values in the west, with localized high-value centers influenced by both topography and urbanization. Over the past five decades, this region has shown significant decreasing trends in the frequency of extreme precipitation events, precipitation amounts, and their contribution rates to total precipitation. In terms of numerical simulation, researchers have widely used advanced numerical models to simulate urban extreme precipitation events [16], such as COSMO-CLM [17], WRF [18], and MM5 [19]. These models have made significant progress in solving the complexity and inhomogeneity of urban scale meteorology, and have provided reliable technical support for deeply understanding the mechanism of urban precipitation. Marianna [20] used COSMO-CLM to simulate precipitation in typical areas of Italy, and found that although the model achieved good results in mountain precipitation, there were still some shortcomings in urban precipitation simulation, especially in coastal and plain areas; Abhishek [21] evaluated the summer climate simulation performance of WRF model in Ottawa urban area, and found that multi-layer urban canopy model (UCM) parameterization scheme and a high-resolution land cover data set can enhance the precision of wind speed [22], humidity, and precipitation simulation.
Although previous studies have revealed the spatiotemporal distribution patterns of urban extreme precipitation [23], there is still a lack of in-depth understanding and quantitative analysis regarding how urbanization affects extreme precipitation by altering surface characteristics and thermal conditions, especially in the specific region of the Pearl River Delta urban agglomeration. Numerical simulation can provide continuous and high-resolution spatial distribution information, which is important for understanding the characteristics of urban micro-scale precipitation [24]. In urban environments, the distribution of precipitation often exhibits spatial heterogeneity due to the complexity of buildings, roads, and other man-made structures [25]. Numerical models can simulate these subtle spatial variations, while traditional precipitation observation stations have difficulty capturing this complexity due to the limitations of station distribution [26,27]. From the perspective of meteorology, mesoscale meteorological simulation coupled with UCM and quantitative analysis of urban layout and morphology are still relatively novel research approaches [28]. Existing research often fails to fully consider the complexity of the urban canopy model when simulating the impact of urbanization on extreme precipitation, which may lead to uncertainties in simulation results. In addition, numerical simulation can delve into the effects of varying degrees of urban development on rainfall, which is important for understanding the feedback mechanism of urban climate on precipitation patterns.
As the most dynamic economic region in southern China, the Pearl River Delta urban agglomeration (PRDUA) is particularly vulnerable to typhoons due to its coastal location [13]. The climate in this area is characterized by heavy summer rains, while low topography and rapid urbanization lead to the decline of drainage capacity [29]. Due to the concentration of population and economic activities, the relative shortage of infrastructure construction and the increase in extreme weather events caused by climate change, the region is particularly affected by extreme precipitation disasters [30]. This study plans to set the slow urbanization stage as farmland and the rapid urbanization stage as built-up land to use a UCM coupled with Weather Research and Forecasting model (WRF) to explore the spatial characteristics of the extreme precipitation in PRDUA under the background of different urbanization periods and its potential impact on the urban hydrological processes. This study not only focuses on how urbanization influences the geographic patterning of intense rainfall events, but also delves into the mechanisms by which various factors, such as underlying surface changes, temperature, and air-specific humidity during urbanization, affect precipitation, offering new ideas and perspectives for future studies.
2. Methodology
2.1. Study Area
The research area of this study (Figure 1a) is located in Guangdong Province, the largest economic province in China. Figure 1b selects Landsat 8 satellite data provided by geospatial data cloud as the data source, which is a remote sensing data source widely used for global environmental monitoring, and the pixel resolution of the selected data reaches 70.45 m [31]. As shown by the orange area in Figure 1c, the PRDUA is situated in the south-central part of Guangdong Province, China, spanning latitudes from 21°31′N to 23°10′N and longitudes from 112°45′E to 113°50′E. The terrain is dominated by hills and plains. The terrain inclines from northwest to southeast, forming a deltaic landscape with dense river networks. The PRDUA represents a quintessential urbanization cluster not only in China but also globally. Its urbanization process has developed rapidly in the past decades. Although it occupies less than one-third of the land area of Guangdong Province, it gathers 70% of the province’s population and 85% of GDP, and it has a strong manufacturing base and an active market economy. It is an important manufacturing base and foreign trade export center in the world. Therefore, the PRDUA is selected as the city and the other areas of Guangdong Province as the suburb, in order to examine the patterns of change in precipitation over time and across different locations.
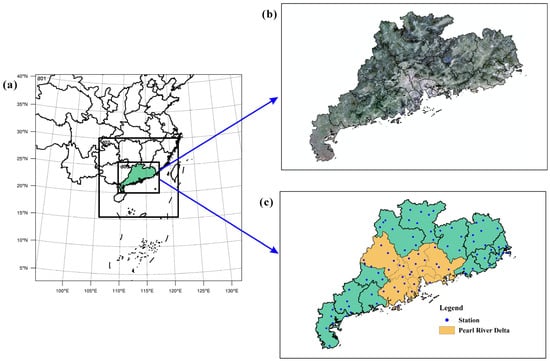
Figure 1.
Location of study area and distribution of observation stations. (a) Geographical setting of the study area and schematic diagram of the three nested levels (d01, d02, d03); (b) remote sensing image of study area; (c) boundary of the PRDUA (orange area) and the geographic layout of the national meteorological observations (bule dot).
The PRDUA is characterized by a classic subtropical monsoon climate [32], featuring clear seasonal divisions and plentiful precipitation. Annual rainfall in the region typically ranges from 1500 to 2000 mm, predominantly occurring during the summer months. Influenced by monsoons and tropical cyclones, the region experiences distinct wet and dry periods, with the wet phase typically spanning May through September, and the dry phase extending from October to April. Due to the high level of urbanization, high population density, and developed industry and transportation in this area, the urban hydrological cycle is influenced by a variety of elements, including shifts in land utilization and the phenomenon of the urban heat island. The recurrent extreme precipitation events in urban settings present significant strain on urban water management infrastructure and flood mitigation strategies [27,33]. Consequently, a thorough investigation into how urbanization influences the geographic patterns of heavy rainfall in this region will provide insights into the mechanisms by which urbanization elements influence the genesis of heavy rainfall incidents in densely urbanized zones [34,35].
2.2. Data Sources
In the operation of the WRF model, the global information provided by the National Center for Environmental Prediction was selected as the data related to the initial and boundary conditions. These data have a horizontal spatial resolution of 0.25° × 0.25° and a temporal resolution of every 6 h. Topographic data were derived from the underlying surface data provided by MODIS_30s on the WRF official website. The predominant categories of land use encompass agricultural fields, woodlands, and urbanized areas, with certain regions featuring grasslands and wetlands as well (Figure 2a). The observation data of precipitation, temperature and absolute humidity obtained from the hourly observation data set of “The China Meteorological Data Service Center”. The locations of these national meteorological observation stations are marked with blue dots in Figure 1c. The selection and source of these data have been carefully considered to ensure accurate and reliable initial and boundary conditions in the simulations.
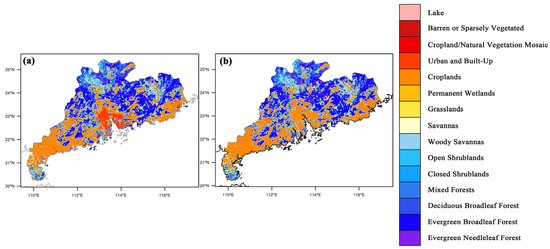
Figure 2.
Land use categories (a) including urban and built-up land (UCM) and (b) replacing urban and built-up land with cropland (NON).
To explore the geographical patterns of rainfall deeply as recorded, the Kriging interpolation method, commonly used in geostatistics, was used to interpolate the data from 86 meteorological observation stations across Guangdong Province (Figure 1c). Based on spatial autocorrelation, the Kriging interpolation can automatically identify and utilize the spatial distribution characteristics of the sampling points, effectively reducing the errors caused by the uneven distribution of the sampling points [36].
2.3. Model Settings
The WRF model serves as a computational model for weather forecasting, which adopts complex physical and dynamic processes [37]. It can not only effectively simulate the meteorological process at the city scale, but also considers the terrain, land use, buildings and other urban surface characteristics. It can capture the influence of urban microclimate and local topography on weather systems. In this study, the current latest version of WRF V4.5 [38] was selected for the numerical simulation of extreme precipitation in Pearl River Delta urban agglomeration.
In view of the fact that the PRDUA is located along the coast, the terrain of the underlying surface exhibits intricate characteristics and displays considerable variation across different locations [39]. To obtain higher resolution precipitation simulation results, it is essential to establish a finer grid [40]. For this reason, the WRF simulation experiment utilized a three-tiered nested grid configuration, as depicted in Figure 1a. The horizontal grid spacing of the nested areas d01, d02, and d03 was set to 27 km, 9 km, and 3 km, respectively. The corresponding grid numbers were 160 × 160, 184 × 184, and 286 × 214, respectively. The central co-ordinates of the simulation domain were established at 22°57′N, 113°23′E. The Lambert co-ordinate projection is employed to project from geographical to cartesian co-ordinates [41]. The vertical direction used the terrain-following mass co-ordinates, and the vertical stratification was set to 34 layers. The integration time step of the model was set to 108 s, that is 4 times the d01 grid spacing. A smaller step size setting can ensure stable operation of the model. The temporal resolution for the simulation outputs was set to every 1 h. To ensure the initial boundary field better reflects the actual precipitation situation, the week before each simulation is considered as the model adaptation adjustment time [42].
In performing the simulation analysis of the regional climate model WRF, considering that there might be significant differences in the application effects of different parameterization schemes in specific regions, several widely used parameterization schemes were first tested. This procedure was designed to assess the suitability of the parameterization schemes for physical processes within the model across different geographical settings. Meanwhile, based on the literature research, the physical process parameterization schemes for the PRDUA were adapted and optimized, and the parameterization scheme combination with the best performance was selected. Specifically, the microphysical process adopted the WSM 6-class scheme [28], the long-wave radiation process adopted the Rapid Radiative Transfer Model scheme [43], the short-wave radiation process adopted the Dudhia scheme [44], the land surface process adopted the Noah land surface scheme [45], the planetary boundary layer adopted the Yonsei University scheme [46], and the urban canopy simulation adopted the UCM scheme. The cumulus parameterization scheme for domain d01 used the Kain–Fritsch scheme, while d02 and d03 did not invoke the cumulus convection parameterization scheme [47]. With these carefully selected and adjusted parameterization schemes, the model’s simulation precision in PRDUA was improved.
2.4. Experimental Design
To study the effect of urbanization on extreme precipitation in PRDUA, the model set up two groups of simulated experiments. The first group was the urban experiment: the urban canopy model was considered, which was denoted as UCM. The UCM provided a detailed account of various urban characteristics, including building heights, population density, architectural forms, construction materials, street dimensions and orientations, as well as the presence of green spaces. The second group was the non-urban experiment: the surface type of urban and built-up land was replaced with farmland, which was denoted as NON. The replaced land use type of the PRDUA is shown in Figure 2b. Precipitation patterns in urban locales are shaped not just by urban development, but also by the influence of geographical features and alterations in the regional climate [48]. In order to accurately assess the effects of urbanization on intense rainfall events, the numerical simulation incorporated consistent topographical data sets and meteorological records, thereby ensuring that the impact of additional environmental elements was efficiently mitigated. Table 1 lists the input parameters required for the UCM scheme simulation. These parameters were configured through the URBPARM.TBL file to enable the UCM and define the urban area. The UCM parameter configurations were based on research by Wang et al. [49] and data from the “China part of global city and building feature data set” [26], with other parameters adhering to the UCM model’s standard settings.

Table 1.
Key parameters of the UCM used in WRF simulation.
By consulting the Climate Monitoring Bulletin of the Guangdong–Hong Kong–Macao Greater Bay Area, an analysis of the spatiotemporal distribution of precipitation in the PRDUA in recent years was conducted. It was found that there was more precipitation in 2018, with a mean annual precipitation totaling 2072.8 mm. This was 7% more than normal. Moreover, there were more rainstorms, extreme precipitation, and strong typhoons in 2018. In Chinese meteorological services, precipitation events with daily rainfall exceeding 50 mm are generally considered the threshold for an extreme precipitation event. Therefore, two different types of typical extreme precipitation events from 2018 were selected for numerical simulation. One event occurred from 12 to 13 June, categorized as a monsoon rainstorm primarily influenced by the southwest monsoon. The rainfall event lasted from 17:00 on 12 June to 11:00 on 13 June. This precipitation event was intense, with many meteorological stations recording more than 50 mm of maximum hourly rainfall, and the rainfall was widely distributed, affecting most areas of the PRDUA. In terms of weather patterns, as the southwest monsoon strengthened, warm and moist air currents were continuously transported to the area, where they encountered the cold air masses from the north. This interaction led to intense convective activity and the occurrence of heavy rainfall over periods of 5 min to 3 h. The other extreme precipitation event occurred from 16 to 17 September and was a typhoon rainstorm. This rainfall event lasted from 12:00 on September 16 to 15:00 on September 17. “Mangkhut” was the strongest typhoon to make landfall in China in 2018, bringing destructive winds and record-breaking storm surges to the Greater Bay Area. Typically, wind conditions of level 10 and above are referred to as extreme wind conditions. Strong winds ranging from level 10 (24.5–28.4 m/s) to level 13 (37.0–41.4 m/s) occurred in the Pearl River Delta urban agglomeration, and the coastal winds above level 12 (32.7–36.9 m/s) lasted for more than 16 h. According to meteorological records, typhoon “Mangkhut” brought heavy to torrential rain, with extremely heavy rain in some areas, leading to a significant increase in daily precipitation. Some areas may have had daily precipitation exceeding 250 mm, or even higher, indicating a large accumulation of rainwater. At the same time, the destructive storm surge that came with it caused the coastal water level to exceed historical records, “Mangkhut” brought about a storm surge of approximately 3 m to the Pearl River Delta area. The highest water level of 3.28 m appeared at the Zhongda Station, which is situated in the central urban district of Guangzhou, exceeding the historically highest water level by 0.47 m. The reason for selecting the monsoon rainstorm on 12–13 June and the typhoon rainstorm on 16–17 September 2018 for simulation is that both of these precipitation events are extreme weather phenomena, not only with significant rainfall but also representative in precipitation types, effectively showcasing the influence of urbanization on various forms of intense precipitation. At the same time, the abundant and reliable meteorological observation data from 2018 ensured the accuracy of the simulation. The findings of this research hold substantial importance for understanding the precipitation mechanisms under the background of urbanization and guiding urban planning, water resource management, as well as disaster prevention and mitigation strategies. Therefore, these two extreme precipitation events were chosen to be representative. For the different types of extreme precipitation, the influence of urbanization on extreme precipitation intensity was conducted.
3. Results and Analysis
3.1. Monsoon Rainstorm Simulation
Figure 3 shows the observation and simulation of the monsoon rainstorm from 12 to 13 June 2018, with 5 to 11 June used for model spin-up and 12 to 13 as the period for analysis. The simulation outcomes depicted the geographical distribution of precipitation accumulated over a 48 h period, incorporating a temporal dimension. Moreover, the inclusion of a temporal aspect was primarily to assess the influence of extreme precipitation events before and after urbanization, so the characteristics of hourly precipitation series are not discussed in depth in this study. The spatial distribution of rainfall was obtained by the Kriging interpolation analysis (Figure 3a). The results showed that the precipitation along the coastal area of the PRDUA was the most concentrated in the simulation period (12–13 June). The accumulated precipitation in two days generally exceeded 80 mm, and the precipitation recorded at Shangchuandao station was the highest, reaching 198.7 mm. In the PRDUA area, the average precipitation of all meteorological stations was 77.4 mm, markedly surpassing the levels observed in other parts of Guangdong Province.
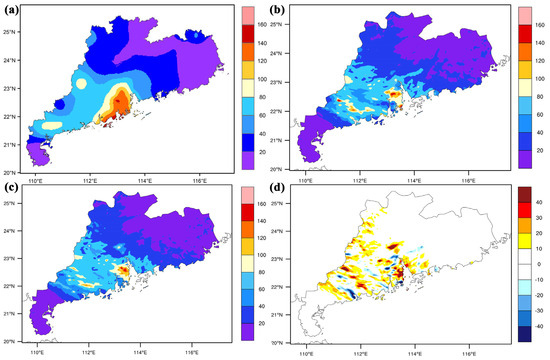
Figure 3.
Cumulative precipitation (mm) during 48 h on 12–13 June 2018. (a) Observation data, (b) results from the NON simulation, (c) results from the UCM simulation, and (d) the discrepancies between the UCM and NON simulations.
Figure 3b and Figure 3c show the spatial distributions of accumulated precipitation for the NON and UCM schemes in the simulation period of 48 h, respectively. Through the analysis of two sets of experiments and observation data (Figure 3a), it can be observed that the two schemes effectively reproduced the precipitation intensity and distribution area of the PRDUA, indicating that the WRF model can be used to simulate urban extreme precipitation. The difference in precipitation between the two experiments was mainly in the coastal areas of the PRDUA (Figure 3d). The UCM scheme simulated the heavy precipitation center more accurately by introducing the physical processes of the urban canopy, and its coverage was slightly wider than that of the NON scheme. In addition, the simulation accuracy of the UCM scheme was slightly higher in the northeastern region of Guangdong Province with lower precipitation. In terms of the spatial accuracy of the simulation results, the UCM scheme estimated the average precipitation in the PRDUA to be 72.6 mm. The relative error between simulated and observed data was −6.2%, and the root mean square error (RMSE) was 14.6 mm. The average precipitation simulated by NON scheme was 70.3 mm. The relative error with the actual observed data was −9.2%, and the RMSE was 18.2 mm. In the overall assessment, the UCM scheme performed better in simulating the spatial distribution traits of extreme precipitation in the PRDUA, and it was in high agreement with the observation data from the region’s meteorological stations.
According to the analysis, the urbanization process had significantly contributed to the precipitation pattern. On one side, there is an augmentation in the roughness of the underlying surface and the resistance to air flow. During the urbanization process, the dense construction of buildings and roads significantly increases the roughness of the ground surface. The enhanced surface roughness leads to higher friction against air movement, which in turn reduces wind velocities. At the same time, the layout of urban building clusters may also change wind directions, causing some areas to become stagnant zones for airflow, increasing the residence time of cloud clusters, and thereby enhancing the possibility of precipitation. These effects are particularly evident in the coastal areas of the PRDUA, as shown in Figure 3, where the UCM scheme simulates a broader coverage and higher intensity of precipitation centers. In addition to the construction of buildings and roads, the urbanization process is also accompanied by a large number of activities such as artificial irrigation, industrial water use, and domestic water use. These human activities not only directly increase the water vapor content in the surface and atmosphere but also indirectly enhance the water vapor cycle through evaporation. Especially in coastal areas such as the Pearl River Delta, the humid climatic conditions make the water vapor cycle more active, further promoting the occurrence of extreme precipitation. Additionally, the urban heat island also has a positive impact on the precipitation process. Urban areas, with a large number of buildings, roads, and anthropogenic heat sources, have higher ground temperatures than suburban areas. This high-temperature environment accelerates the transpiration of vegetation and the evaporation of water, providing abundant water vapor conditions for precipitation. At the same time, the high temperatures also promote the exchange of moisture between the terrestrial surface and the atmosphere, further enhancing the precipitation process.
Figure 4 shows the difference in average temperature and specific humidity at 2 m above ground level between the UCM and NON schemes throughout the simulation period. Figure 4a reveals that the UCM scheme predicted temperatures around 0.7 °C higher than the NON scheme in the coastal area of the PRDUA under different land use patterns. This difference shows that the physical processes in the urban canopy had a significant impact on the surface temperature, accelerating the vertical movement of water vapor, which in turn stimulated the increase in convective rainfall. At the same time, the increasing temperature also enhanced the atmosphere’s water retention capacity, potentially leading to a higher incidence of intense rainfall events.
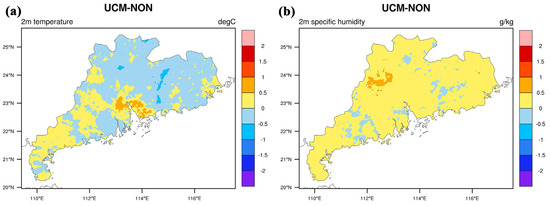
Figure 4.
(a,b) Analysis of the disparities in simulated between 2 m air temperature and specific humidity of UCM and NON schemes on 12–13 June 2018.
Figure 4b indicates that the UCM scheme’s simulation of air-specific humidity was approximately 0.5 g/kg greater than that of the NON scheme. This suggests that urbanization has contributed to an increase in ground-level air humidity in the coastal regions of the PRDUA. Due to the high air humidity in this area, higher temperatures in the city promoted water vapor exchange between the land and the atmosphere, resulting in higher absolute humidity in the urbanized area than that before urbanization. At the same time, the high population density in the PRDUA has led to a substantial increase in water dissipation from human consumption activities, which has improved the ground-level-specific humidity in the region to a certain extent. In a comprehensive analysis, urbanization produced a significant increase in temperature and air humidity in the PRDUA, and the urbanization effect was particularly obvious here.
3.2. Typhoon Rainstorm Simulation
In order to assess the model’s effectiveness and the influence of urbanization on various extreme precipitation scenarios, this research conducted a numerical simulation analysis of the rainstorm event triggered by the typhoon on 16–17 September 2018. The period from 9 to 15 September served as the model’s spin-up phase, with the subsequent two days designated as the period for analysis. We used the parameter settings from June 12th to 13th to analyze the precipitation event (Figure 5) and compared the results with the actual observation data (Figure 5a). In the PRDUA area, the average precipitation recorded at all meteorological stations reached 146.7 mm, which obviously exceeded other areas in Guangdong Province. Figure 5b and Figure 5c show the spatial distribution of the 48 h cumulative precipitation during the simulation period for the NON and UCM schemes, respectively. The analysis results were similar to those from the previous numerical simulation of monsoon rainstorm. The UCM scheme (Figure 5c) showed higher accuracy in simulating the distribution of rain bands. Compared with the NON scheme (Figure 5b), the simulation result of the UCM scheme was closer to the actually observed rain band distribution (Figure 5d), suggesting that taking into account the physical processes in the urban canopy was helpful for obtaining simulation results closer to the actually observed value. Specifically, the RMSE between the UCM scheme and the observed value was 16.7 mm in the Pearl River Delta urban agglomeration, and the RMSE between the NON scheme and the observed value was 19.8 mm. In summary, the UCM scheme can effectively simulate the impact of urbanization on extreme precipitation.
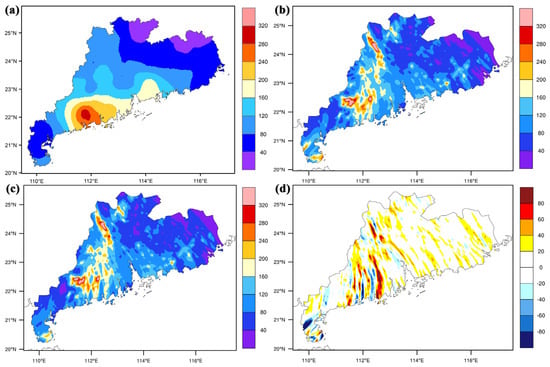
Figure 5.
Accumulated precipitation (mm) during 48 h on 16–17 September 2018. (a) Observation results, (b) results from the NON simulation, (c) results from the UCM simulation, (d) the discrepancies between the UCM and NON simulations.
Figure 6 compares and analyzes the average 2 m temperature and 2 m specific humidity difference simulated by UCM and NON schemes from September 16th to 17th. In this comparison, the temperature and specific humidity simulated by UCM were higher than those simulated by NON. Specifically, the simulated temperature in urban areas was about 1 °C higher than that in cropland, and the specific humidity was about 1.2 g/kg greater. This difference is reflected in the temperature distribution in Figure 6a and the specific humidity distribution in Figure 6b. Further observation of Figure 6 shows that the urban surface area experienced the most significant increases in temperature and specific humidity. This shows that urbanization has contributed to a rise in near-surface temperatures and humidity within the PRDUA to a certain extent. This aligns with the findings detailed in Section 3.2 and further confirms the accuracy of the mechanism revealed in this study. The model can effectively replicate the effects of urbanization on extreme precipitation events, offering a solid scientific foundation for the investigation of how urbanization influences urban hydrology and climate.
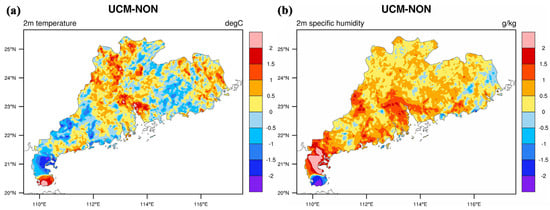
Figure 6.
(a,b) Analysis of the disparities in simulated between 2 m air temperature and specific humidity of UCM and NON scheme on 16–17 September 2018.
3.3. Model Verification
Figure 7 shows the hourly average precipitation observation records from of national meteorological stations distributed in Guangdong Province during 12–13 June and 16–17 September, as well as the hourly variation of the results from the two simulation experiments. The two simulation schemes can relatively accurately simulate the changes in precipitation with time in two extreme rainfall events. The error between the UCM scheme and the observation value of the national meteorological station was smaller than that between the NON scheme and the observation value of the national meteorological station. Therefore, considering urbanization factors (UCM scheme) is more suitable for simulating the effects of urbanization on extreme rainfall events.

Figure 7.
A comparison of hourly average precipitation (OBS) and simulation (UCM/NON) results at the national meteorological observation stations in the PRDUA on (a) 12–13 June 2018 and (b) 16–17 September 2018.
To verify the accuracy of the conclusion that urbanization has enhanced the precipitation in the PRDUA, the period from 1960 to 1969 (1960s) was selected as the period of slow urbanization, and the period from 2010 to 2019 (2010s) was selected as the period of rapid urbanization. The delineation between the slow and rapid urbanization phases was anchored around the commencement of China’s reform and opening up in 1978, marking the onset of an accelerated urbanization era in the country. Therefore, to select typical and continuous 10 years, this research ultimately designated the decades of 1960–1969 and 2010–2019 as the epochs of slow and rapid urbanization, respectively. Based on the different urbanization stages, this study analyzed the precipitation observation data of urban and suburban areas by using all national meteorological stations (86 in total) distributed in Guangdong Province. Among them, there are 29 stations in the PRDUA (cities) and 57 stations in the rest of Guangdong Province (suburbs). To eliminate the effect of the sudden change in precipitation in a particular year, the selection was based on the 10-year average precipitation data for each phase.
Figure 8a shows a comparative analysis of the annual average precipitation recorded in urban and suburban regions across various stages of urbanization. The annual average precipitation in the PRDUA was 1590.17 mm in 1960s, which was significantly lower than that in other areas of Guangdong Province (1683.25 mm). Urban precipitation is 93.08 mm less than suburban precipitation. During the 2010s, the mean annual rainfall in the PRDUA amounted to 1855.9 mm, surpassing the levels recorded in the surrounding regions, which stood at 1814.24 mm. Against the backdrop of rapid urbanization, the urban precipitation has changed from lower than that in suburbs to higher than that in the suburbs, indicating that the urbanization process has increased the urban precipitation. In addition, the annual average precipitation in both urban and suburban areas also increased significantly in 2010s compared to 1960s, by 265.82 mm and 130.99 mm, respectively. Although the division of urban and suburban areas was made, the suburban areas were also undergoing urbanization, but the development rate was lower than that of urban areas. Therefore, the precipitation in the suburban areas also increased, but the increase rate was lower than that in urban areas. To verify the enhancement effect of urbanization on precipitation, this study analyzed the changes in days when the daily precipitation exceeded 2 mm in the Pearl River Delta region from 1960 to 2019. The average annual number of precipitation days from 1960 to 1969 was 97, and the average annual number of precipitation days from 2010 to 2019 was 99. There was no significant difference between them. The results show that the frequency of weather-scale precipitation events did not increase systematically during the study period. This supports the conclusion that urbanization has enhanced the precipitation efficiency. Figure 8b shows the average increase in urban and suburban precipitation in different seasons in the 2010s compared with that in the 1960s. It can be seen that the urban precipitation has increased to some extent in different seasons, with the maximum increase in urban precipitation in spring being 156.48 mm and the minimum increase in precipitation in summer being 26.47 mm.
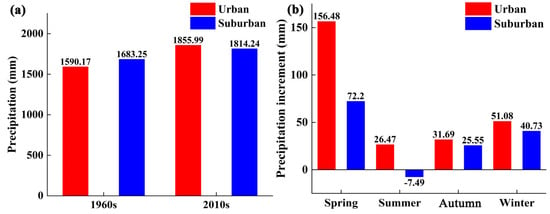
Figure 8.
Comparison of (a) observed annual average precipitation in urban and suburban areas in different urbanization periods and (b) the difference in observed precipitation in different seasons between the 2010s and the 1960s.
Based on meteorological station observations, this study also compared the annual average temperature (Figure 9) and absolute humidity (Figure 10) of urban and suburban areas across various stages of urbanization. As shown in Figure 9a, the annual average temperatures in urban and suburban areas in the 1960s were 21.69 °C and 21.44 °C, respectively. The average annual temperatures in urban and suburban areas in the 2010s were 22.6 °C and 22.21 °C, respectively. The increase in urban temperature (0.91 °C) was higher than that in suburban temperature (0.77 °C). The higher temperature probably promoted land–air water vapor exchange, which played a contributing role in the formation of precipitation. The winter temperature increased the most. The average winter temperature in urban and suburban areas increased by 1.13 °C and 0.91 °C, respectively (Figure 9b).
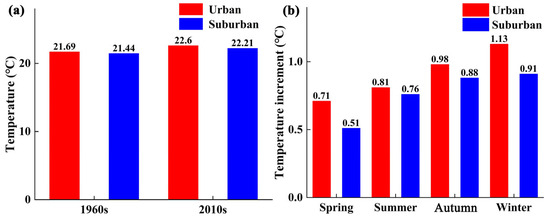
Figure 9.
Comparison of (a) annual average temperature between urban and suburban areas in different urbanization periods and (b) temperature increase in different seasons.
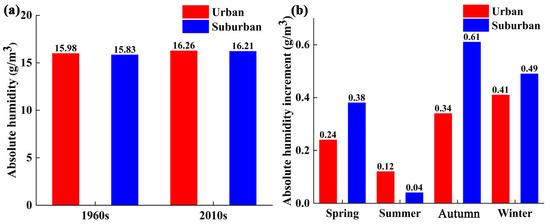
Figure 10.
Comparison of (a) observed annual average absolute humidity between urban and suburban areas in different urbanization periods and (b) observed absolute humidity increase in different seasons.
Figure 10a shows the comparison of the observed annual average absolute humidity in urban and suburban areas at different stages of urbanization. It is evident that the annual average absolute humidity in urban areas increased by 0.28 g/m3 during the 2010s as opposed to the 1960s. The higher temperature in urban areas promoted the evaporation of water vapor, making the absolute humidity slightly higher compared to suburban regions. This contributed to the supply of water vapor necessary for the urban precipitation convection system. The rise in absolute humidity in urban areas during the winter months was marginally more pronounced than in the other seasons, as depicted in Figure 10b. The temperature and humidity in the city were higher than those in the suburbs, which promoted the urban precipitation to a certain extent. The above data analysis verified the accuracy of the conclusion and mechanism analysis that urbanization enhanced precipitation in the PRDUA from the perspective of meteorological observation.
4. Discussion
To verify the validity of the conclusion of this study, previous research results are referenced to support its conclusion. Li [50] studied the influence of urbanization on heavy precipitation and weak precipitation in the PRDUA. This research indicates that heavy precipitation events occur with greater frequency in the urban regions of the PRDUA as opposed to the surrounding non-urban areas. Urbanization leads to a decrease in precipitation frequency, an increase in precipitation intensity, and the enhancement of precipitation events in the afternoon. Urbanization has enhanced precipitation intensity in this area; Liu [51] examined the effects of urbanization on rainfall patterns by scrutinizing data on precipitation and shifts in land use, discovering that urbanization tends to amplify rainfall, particularly in urban cores and the regions downwind of cities. There was a notable escalation in both the intensity and frequency of short-duration heavy rainfall incidents. Li [52] studied the influence of urban expansion on summer precipitation in the southern coastal areas of China, and found that urbanization indirectly affected the precipitation process by changing the surface characteristics and thermal conditions. Urban sensible heat serves as an energy source, enhancing precipitation intensity; Mou [53] observed that extreme precipitation records from the Shanghai Meteorological Station have exhibited an increasing trend over the past five decades, with the rate of increase for extreme precipitation markedly surpassing that of average rainfall. These provide further support for the results of this study.
By simulating the extreme precipitation events in the PRDUA against the backdrop of urbanization, the evolution pattern of the urban hydrological environment could be better predicted. These results provided a scientific basis for urban climate adaptation strategy, water resource management and meteorological disaster prevention. Although the UCM model improved the simulation accuracy, there are still errors present. Factors such as anthropogenic heat emission and climate change during the urbanization process may also affect the precipitation system. Future studies can further explore more refined model development, more comprehensive observational data collection, and more in-depth study of uncertain factors (land use change, urban heat island effect, increase in urban roughness, urban drainage systems, socio-economic factors, population size and industrial development) in the urbanization process. Thereby promoting more abundant and in-depth achievements in the field of urban hydrology.
5. Conclusions
The urban canopy model coupled with the Weather Research and Forecasting model (WRF) was used to simulate the monsoon rainstorm and typhoon rainstorm events in Pearl River Delta urban agglomeration in 2018. The control experiments regarding land use types were carried out, and the spatial distribution and determinants of extreme precipitation was performed combined with the data of observation stations. The principal findings of the research were as follows:
- (1)
- In the process of simulating the two rainstorm events, both schemes with and without the urban canopy model showed good simulation results. The introduction of urban canopy model has markedly enhanced the precision of simulating the spatial distribution of heavy rainfall in the Pearl River Delta urban agglomeration, especially in the simulation of the high and low value zones of heavy rainfall. Compared to the simulation results with farmland as the underlying surface, the simulation results were obviously improved.
- (2)
- In the process of urbanization, alterations in the underlying surface and the high intensity of human activities, air temperature, and humidity near the ground have been improved. The temperature during the two precipitation events increased by approximately 0.7 °C and 1 °C, respectively. The air-specific humidity of the two precipitation events increased by approximately 0.5 g/kg and 1.2 g/kg, respectively. The increase in temperature and water vapor content has contributed positively to the initiation and progression of precipitation, thereby amplifying the impact of urbanization on the occurrence of extreme precipitation events.
Author Contributions
Methodology, Z.L. and S.Z.; formal analysis, L.Z.; conceptualization, J.L.; writing—original draft, Z.L.; writing—review and editing, J.L. and S.Z.; funding acquisition, Z.L. and J.L.; investigation, L.Z.; software Z.L., Y.G. and X.W.; supervision, W.S.; data curation, Z.L., Y.G., and L.D. All authors have read and agreed to the published version of the manuscript.
Funding
This study was supported Chinese National Key Research and Development Program (2022YFE0205200 and 2022YFC3090600), State Key Laboratory of Simulation and Regulation of Water Cycle in River Basin, China Institute of Water Resources and Hydropower Research (IWHR-SKL-KF202411), and the Fundamental Research Funds for the Central Universities (2023MS068).
Data Availability Statement
The National Center for Environmental Prediction provides meteorological data related to initial and boundary conditions for the study area (https://rda.ucar.edu/datasets/ds083.2/, accessed on 14 January 2024). The WRF official website provides topographical data required for climate models (https://www2.mmm.ucar.edu/wrf/users/download/get_sources_wps_geog.html, accessed on 14 January 2024). The China Meteorological Data Service Center provides hourly observational data of precipitation, temperature, and absolute humidity (http://data.cma.cn/site/index.html, accessed on 14 January 2021).
Conflicts of Interest
All authors have no conflicts of interest.
References
- Darshan, R. Linking downstream river water quality to urbanization signatures in subtropical climate. Sci. Total Environ. 2023, 870, 161902. [Google Scholar] [CrossRef]
- Li, C.; Liu, M.; Hu, Y.; Wang, H.; Zhou, R.; Wu, W.; Wang, Y. Spatial distribution patterns and potential exposure risks of urban floods in Chinese megacities. J. Hydrol. 2022, 610, 127838. [Google Scholar] [CrossRef]
- Yang, M.; Xue, L.; Liu, Y.; Wang, W.; Han, Q.; Liu, S.; Fu, R. Runoff response to multiple land-use changes and climate perturbations. Hydrol. Process. 2024, 38, e15072. [Google Scholar] [CrossRef]
- Zhang, X.; Xiao, Y.; Wang, K.; Wang, T. A study on the spatial and temporal evolution of multi-year extreme precipitation in the Huaihe River Basin. Theor. Appl. Climatol. 2023, 152, 397–405. [Google Scholar] [CrossRef]
- Cheng, S.; Li, S.; Qi, F. Research on the construction method of heat island network resistance surface based on county perspective. Atmosphere 2023, 14, 1740. [Google Scholar] [CrossRef]
- Tian, L.; Li, Y.; Lu, J.; Wang, J. Review on urban heat island in China: Methods, its impact on buildings energy demand and mitigation strategies. Sustainability 2021, 13, 762. [Google Scholar] [CrossRef]
- Luo, Z.; Liu, J.; Zhang, Y.; Zhou, J.; Shao, W.; Yu, Y.; Jia, R. Seasonal variation of dry and wet islands in Beijing considering urban artificial water dissipation. Npj Clim. Atmos. Sci. 2021, 4, 58. [Google Scholar] [CrossRef]
- Zhang, Y.; Li, R.; Wang, K. Climatology and changes in internal intensity distributions of global precipitation systems over 2001–2020 based on IMERG. J. Hydrol. 2023, 620, 129386. [Google Scholar] [CrossRef]
- Menon, G. We need to talk about water. Nature 2023, 624, S25. [Google Scholar] [CrossRef]
- Aaron, S.; Doerthe, T.; Christian, M.; Chris, S. Enhancing urban runoff modelling using water stable isotopes and ages in complex catchments. Hydrol. Process. 2023, 37, e14814. [Google Scholar] [CrossRef]
- Wiechman, A.; Vicario, S.; Anderies, J.; Garcia, M.; Azizi, K.; Hornberger, G. Institutional dynamics impact the response of urban socio-hydrologic systems to supply challenges. Water Resour. Res. 2024, 60, e2023WR035565. [Google Scholar] [CrossRef]
- Hu, C.; Tam, C.; Li, X.; Huang, K.; Ren, C.; Fung, K.; Wang, Z. Mega-city development impact on hourly extreme rainfall over the South China Greater Bay Area under near-future climate warming. Urban Clim. 2023, 48, 101389. [Google Scholar] [CrossRef]
- Shen, W.; Jin, Y.; Cong, P.; Li, G. Water environment response of urban water networks in the Pearl River Delta (China) under the influence of typhoon rain events. Water Supply 2023, 23, 4840–4854. [Google Scholar] [CrossRef]
- Golroudbary, V.; Zeng, Y.; Mannaerts, C.; Su, Z. Response of Extreme Precipitation to Urbanization over The Netherlands. J. Appl. Meteorol. Clim. 2019, 58, 645–661. [Google Scholar] [CrossRef]
- Song, X.; Zhang, J.; Kong, F.; Wang, G.; He, M.; Zhu, K. Spatio-temporal variation characteristics of precipitation extremes in Beijing. Adv. Water Sci. 2017, 28, 161–173. [Google Scholar] [CrossRef]
- Chen, X.; Leung, L.; Sun, N. Weather systems connecting modes of climate variability to regional hydroclimate extremes. Geophys. Res. Lett. 2023, 50, e2023GL105530. [Google Scholar] [CrossRef]
- Hu, X.; Huang, B.; Cherubini, F. Impacts of dealized land cover changes on climate extremes in Europe. Ecol. Indic. 2019, 104, 626–635. [Google Scholar] [CrossRef]
- Rahimian, M.; Siadatmousavi, S.; Saeedi, M. The influence of Urmia Lake desiccation on an extreme snowfall event. Atmos. Res. 2024, 303, 107327. [Google Scholar] [CrossRef]
- Kong, J.; Zhao, Y.; Strebel, D.; Gao, K.; Carmeliet, J.; Lei, C. Understanding the impact of heatwave on urban heat in greater sydney: Temporal surface energy budget change with land types. Sci. Total Environ. 2023, 903, 166374. [Google Scholar] [CrossRef]
- Marianna, A.; Mario, R.; Alfredo, R.; Paola, M. Investigation on potential and limitations of ERA5 Reanalysis downscaled on Italy by a convection-permitting model. Clim. Dyn. 2023, 61, 4319–4342. [Google Scholar] [CrossRef]
- Abhishek, G.; Michael, L.; Marianne, A. Effects of using different urban parametrization schemes and land-cover datasets on the accuracy of WRF model over the city of Ottawa. Urban Clim. 2021, 35, 100737. [Google Scholar] [CrossRef]
- Zhang, Y.; Cao, S.; Zhao, L.; Cao, J. A case application of WRF-UCM models to the simulation of urban wind speed profiles in a typhoon. J. Wind. Eng. Ind. Aerodyn. 2022, 220, 104874. [Google Scholar] [CrossRef]
- Cao, X.; Qi, Y.; Ni, G. Significant impacts of rainfall redistribution through the roof of buildings on urban hydrology. J. Hydrometeorol. 2021, 22, 1007–1023. [Google Scholar] [CrossRef]
- Zhou, D.; Li, D.; Sun, G.; Zhang, L.; Liu, Y.; Hao, L. Contrasting effects of urbanization and agriculture on surface temperature in eastern China. J. Geophys. Res.-Atmos. 2016, 121, 9597–9606. [Google Scholar] [CrossRef]
- Zhang, Y.; Liang, K.; Liu, C. Time distribution pattern and spatial heterogeneity of hourly scale event-based extreme precipitation in China. J. Hydrol. 2023, 622, 129712. [Google Scholar] [CrossRef]
- Luo, Z.; Liu, J.; Zhang, S.; Shao, W.; Zhou, J.; Zhang, L. Impact of urbanization factors considering artificial water dissipation on extreme precipitation: A numerical simulation of rainfall in Shanghai. Q. J. R. Meteorol. Soc. 2023, 149, 2320–2332. [Google Scholar] [CrossRef]
- Zhao, L.; Zhang, T.; Li, J.; Zhang, L.; Feng, P. Numerical simulation study of urban hydrological effects under low impact development with a physical experimental basis. J. Hydrol. 2023, 618, 129191. [Google Scholar] [CrossRef]
- Luo, Z.; Liu, J.; Shao, W.; Zhou, J.; Jia, R. Distribution of dry and wet islands in the Pearl River Delta urban agglomeration using numerical simulations. Atmos. Res. 2022, 273, 106170. [Google Scholar] [CrossRef]
- Ranasinghe, R.; Wu, C.; Conallin, J.; Duong, T.; Anthony, E. Disentangling the relative impacts of climate change and human activities on fluvial sediment supply to the coast by the world’s large rivers: Pearl River Basin, China. Sci. Rep. 2019, 9, 9236. [Google Scholar] [CrossRef]
- Huang, G.; Chen, Y.; Yao, Z. Spatial and temporal evolution characteristics of extreme rainfall in the Pearl River Delta under high urbanization. Adv. Water Sci. 2021, 32, 161–170. [Google Scholar] [CrossRef]
- Sekertekin, A.; Abdikan, S.; Marangoz, A.M. The acquisition of impervious surface area from LANDSAT 8 satellite sensor data using urban indices: A comparative analysis. Environ. Monit. Assess. 2018, 190, 381. [Google Scholar] [CrossRef] [PubMed]
- Fasullo, J.; Trenberth, K. A less cloudy future: The role of subtropical subsidence in climate sensitivity. Science 2012, 338, 792–794. [Google Scholar] [CrossRef]
- Deng, Z.; Wang, Z.; Wu, X.; Lai, C.; Liu, W. Effect difference of climate change and urbanization on extreme precipitation over the Guangdong-Hong Kong-Macao Greater Bay Area. Adv. Meteorol. 2023, 282, 106514. [Google Scholar] [CrossRef]
- Wang, H.; Jia, Y. Theory and study methodology of dualistic water cycle in river basins under changing conditions. J. Hydrol. Eng. 2016, 47, 1219–1226. [Google Scholar] [CrossRef]
- Xu, Z.; Chen, T. Basic theory for urban water management and sponge city-review on urban hydrology. J. Hydrol. Eng. 2019, 50, 53–61. [Google Scholar] [CrossRef]
- Jia, R.; Wu, J.; Zhang, Y.; Luo, Z. Site prioritization and performance assessment of groundwater monitoring network by using information-based methodology. Environ. Res. 2022, 212, 113181. [Google Scholar] [CrossRef]
- Zhu, D.; Zhou, X.; Cheng, W. Water effects on urban heat islands in summer using WRF-UCM with gridded urban canopy parameters—A case study of Wuhan. Build. Environ. 2022, 225, 109528. [Google Scholar] [CrossRef]
- Shi, R.; Chen, J.; He, Y.; Song, W.; Li, D.; Shu, Y.; Wang, D. Evaluation of the performance of the latest WRF model (V4.5) in simulating surface elements and its sensitivity to the diurnal SST cycle in the South China Sea. Clim. Dyn. 2024, 62, 1567–1584. [Google Scholar] [CrossRef]
- Zhou, J.; Liu, J.; Yan, D.; Wang, H.; Wang, Z.; Shao, W.; Luan, Y. Dissipation of water in urban area, mechanism and modelling with the consideration of anthropogenic impacts: A Case Study in Xiamen. J. Hydrol. 2019, 570, 356–365. [Google Scholar] [CrossRef]
- Li, X.; Koh, T.; Panda, J.; Norford, L. Impact of urbanization patterns on the local climate of a tropical city, Singapore: An ensemble study. J. Geophys. Res.-Atmos. 2016, 121, 4386–4403. [Google Scholar] [CrossRef]
- Zhang, W.; Villarini, G.; Vecchi, G.A.; Smith, J.A. Urbanization exacerbated the rainfall and flooding caused by hurricane Harvey in Houston. Nature 2018, 563, 384. [Google Scholar] [CrossRef]
- Jerez, S.; López-Romero, M.; Turco, M.; Lorente-Plazas, R.; Gómez-Navarro, J.; Jiménez-Guerrero, P.; Montávez, J. On the Spin-Up Period in WRF Simulations Over Europe: Trade-Offs Between Length and Seasonality. J. Adv. Model. Earth Syst. 2020, 12, e2019MS001945. [Google Scholar] [CrossRef]
- Mlawer, E.; Taubman, S.; Brown, P.; Iacono, M.; Clough, S. Radiative transfer for inhomogeneous atmosphere: RRTM. J. Geophys. Res.-Atmos. 1997, 102, 16663–16682. [Google Scholar] [CrossRef]
- Khamees, A.; Sayad, T.; Morsy, M.; Rahoma, U. Evaluation of three radiation schemes of the WRF-Solar model for global surface solar radiation forecast: A case study in Egypt. Adv. Space Res. 2024, 73, 2880–2891. [Google Scholar] [CrossRef]
- Achugbu, I.; Dudhia, J.; Olufayo, A.; Balogun, I.; Adefisan, E.; Gbode, I. Assessment of WRF land surface model performance over West Africa. Adv. Meteorol. 2020, 2020, 6205308. [Google Scholar] [CrossRef]
- Hong, S.; Noh, Y.; Dudhia, J. A new vertical diffusion package with an explicit treatment of entrainment processes. Mon. Weather. Rev. 2006, 134, 2318–2341. [Google Scholar] [CrossRef]
- Kain, J. The Kain-Fritsch convective parameterization: An update. J. Appl. Meteorol. Clim. 2004, 43, 170–181. [Google Scholar] [CrossRef]
- Ding, Y.; Liang, P.; Liu, Y.; Zhang, Y. Multiscale Variability of Meiyu and Its Prediction: A New Review. J. Geophys. Res.-Atmos. 2020, 125, e2019JD031496. [Google Scholar] [CrossRef]
- Wang, Z.; Bou-Zeid, E.; Smith, J. A coupled energy transport and hydrological model for urban canopies evaluated using a wireless sensor network. Q. J. R. Meteorol. Soc. 2013, 139, 1643–1657. [Google Scholar] [CrossRef]
- Li, W.; Chen, S.; Chen, G.; Sha, W.; Luo, C.; Feng, Y.; Wen, Z.; Wang, B. Urbanization signatures in strong versus weak precipitation over the Pearl River Delta metropolitan regions of China. Environ. Res. Lett. 2011, 6, 034020. [Google Scholar] [CrossRef][Green Version]
- Liu, B.; Chen, S.; Tan, X.; Chen, X. Response of precipitation to extensive urbanization over the Pearl River Delta metropolitan region. Environ. Earth Sci. 2021, 80, 9. [Google Scholar] [CrossRef]
- Li, Z.; Chan, J.C.L.; Zhao, K.; Chen, X. Impacts of urban expansion on the diurnal variations of summer monsoon precipitation over the south China coast. J. Geophys. Res.-Atmos. 2021, 126, e2021JD035318. [Google Scholar] [CrossRef]
- Mou, Y.; Gao, X.; Yang, Z.; Xu, T.; Feng, J. Variation characteristics and the impact of urbanization of extreme precipitation in Shanghai. Sci. Rep. 2022, 12, 17618. [Google Scholar] [CrossRef] [PubMed]
Disclaimer/Publisher’s Note: The statements, opinions and data contained in all publications are solely those of the individual author(s) and contributor(s) and not of MDPI and/or the editor(s). MDPI and/or the editor(s) disclaim responsibility for any injury to people or property resulting from any ideas, methods, instructions or products referred to in the content. |
© 2025 by the authors. Licensee MDPI, Basel, Switzerland. This article is an open access article distributed under the terms and conditions of the Creative Commons Attribution (CC BY) license (https://creativecommons.org/licenses/by/4.0/).