Article

A Dehazing Method for UAV Remote Sensing Based on Global and Local Feature Collaboration

by
Chenyang Li
,
Suiping Zhou
*,
Ting Wu
,
Jiaqi Shi
and
Feng Guo
School of Aerospace Science and Technology, Xidian University, Xi’an 710126, China
*
Author to whom correspondence should be addressed.
Remote Sens. 2025, 17(10), 1688; https://doi.org/10.3390/rs17101688
Submission received: 5 March 2025 / Revised: 27 April 2025 / Accepted: 9 May 2025 / Published: 11 May 2025

Abstract

:
Non-homogeneous haze in UAV-based remote sensing images severely deteriorates image quality, introducing significant challenges for downstream interpretation and analysis tasks. To tackle this issue, we propose UAVD-Net, a novel dehazing framework specifically designed to enhance UAV remote sensing imagery affected by spatially varying haze. UAVD-Net integrates both global and local feature extraction mechanisms to effectively remove non-uniform haze across different spatial regions. A Transformer-based Multi-layer Global Information Capturing (MGIC) module is introduced to progressively capture and integrate global contextual features across multiple layers, enabling the model to perceive and adapt to spatial variations in haze distribution. This design significantly enhances the network’s ability to model large-scale structures and correct non-homogeneous haze across the image. In parallel, a local information extraction sub-network equipped with an Adaptive Local Information Enhancement (ALIE) module is used to refine texture and edge details. Additionally, a Cross-channel Feature Fusion (CFF) module is incorporated in the decoder stage to effectively merge global and local features through a channel-wise attention mechanism, generating dehazed outputs that are both structurally coherent and visually natural. Extensive experiments on synthetic and real-world datasets demonstrate that UAVD-Net consistently outperforms existing state-of-the-art dehazing methods.

1. Introduction

Images captured under adverse weather conditions, such as haze, are significantly degraded due to the presence of atmospheric scattering, which leads to color distortion, reduced saturation, and loss of fine texture details. These degradations pose substantial challenges to the performance of high-level computer vision tasks, including image classification, semantic segmentation, object detection, and target tracking, as the quality of the input imagery is a critical factor. Consequently, image dehazing has emerged as a vital pre-processing step in computer vision pipelines.
Existing dehazing techniques can be broadly categorized into three groups: image enhancement-based methods, methods grounded in physical models and prior knowledge, and deep learning-based approaches [1,2].
Image enhancement-based methods aim to improve image quality by reducing haze effects and enhancing contrast, without explicitly modeling the imaging process. Representative methods include Retinex-based enhancement [3], histogram equalization [4], and wavelet transform techniques [5]. Although these methods are computationally efficient, they typically fail to address the underlying causes of haze formation, often resulting in dehazed images that lack visual naturalness and robustness under varying haze conditions.
Physical model-based dehazing approaches utilize prior knowledge or constraints derived from the atmospheric scattering model (ASM) [6,7] to estimate scene transmission and atmospheric light. A seminal work in this domain is the dark channel prior (DCP) introduced by He et al. [8], which estimates transmission maps using the dark channel assumption. Zhu et al. [9] proposed the color attenuation prior (CAP), which exploits statistical correlations among brightness, saturation, and haze concentration. Meng et al. [10] introduced the boundary constraint and contextual regularization (BCCR) method to refine transmission estimation. Despite their effectiveness, these methods often suffer from limitations such as inaccurate parameter estimation and limited generalizability due to reliance on hand-crafted priors.
In contrast, deep learning-based dehazing methods leverage large-scale datasets to learn data-driven mappings from hazy to clear images. Cai et al. [11] proposed DehazeNet, a CNN-based model for estimating transmission maps. Li et al. [12] designed AOD-Net by integrating transmittance and atmospheric light into a unified variable to simplify the estimation process. Subsequent models, such as GCANet [13], FFANet [14], and FD-GAN [15], introduced innovations in context aggregation, attention mechanisms, and frequency-domain priors. More recently, AECR-Net [16] employed contrastive learning for feature regularization, while gUNet [17] introduced residual gating into the U-Net architecture. C2PNet [18] incorporated a dual-branch design and contrastive curriculum learning. DeHamer [19] addressed modality inconsistency between CNNs and Transformers via a modulation matrix and 3D positional encoding. Finally, DehazeFormer [20] fused the Swin Transformer [21] and U-Net [22] architectures with improvements in normalization, activation, and spatial feature aggregation. Despite these advances, most methods exhibit limited effectiveness when dealing with non-homogeneous haze, a common characteristic in real-world scenarios, especially in UAV imagery.
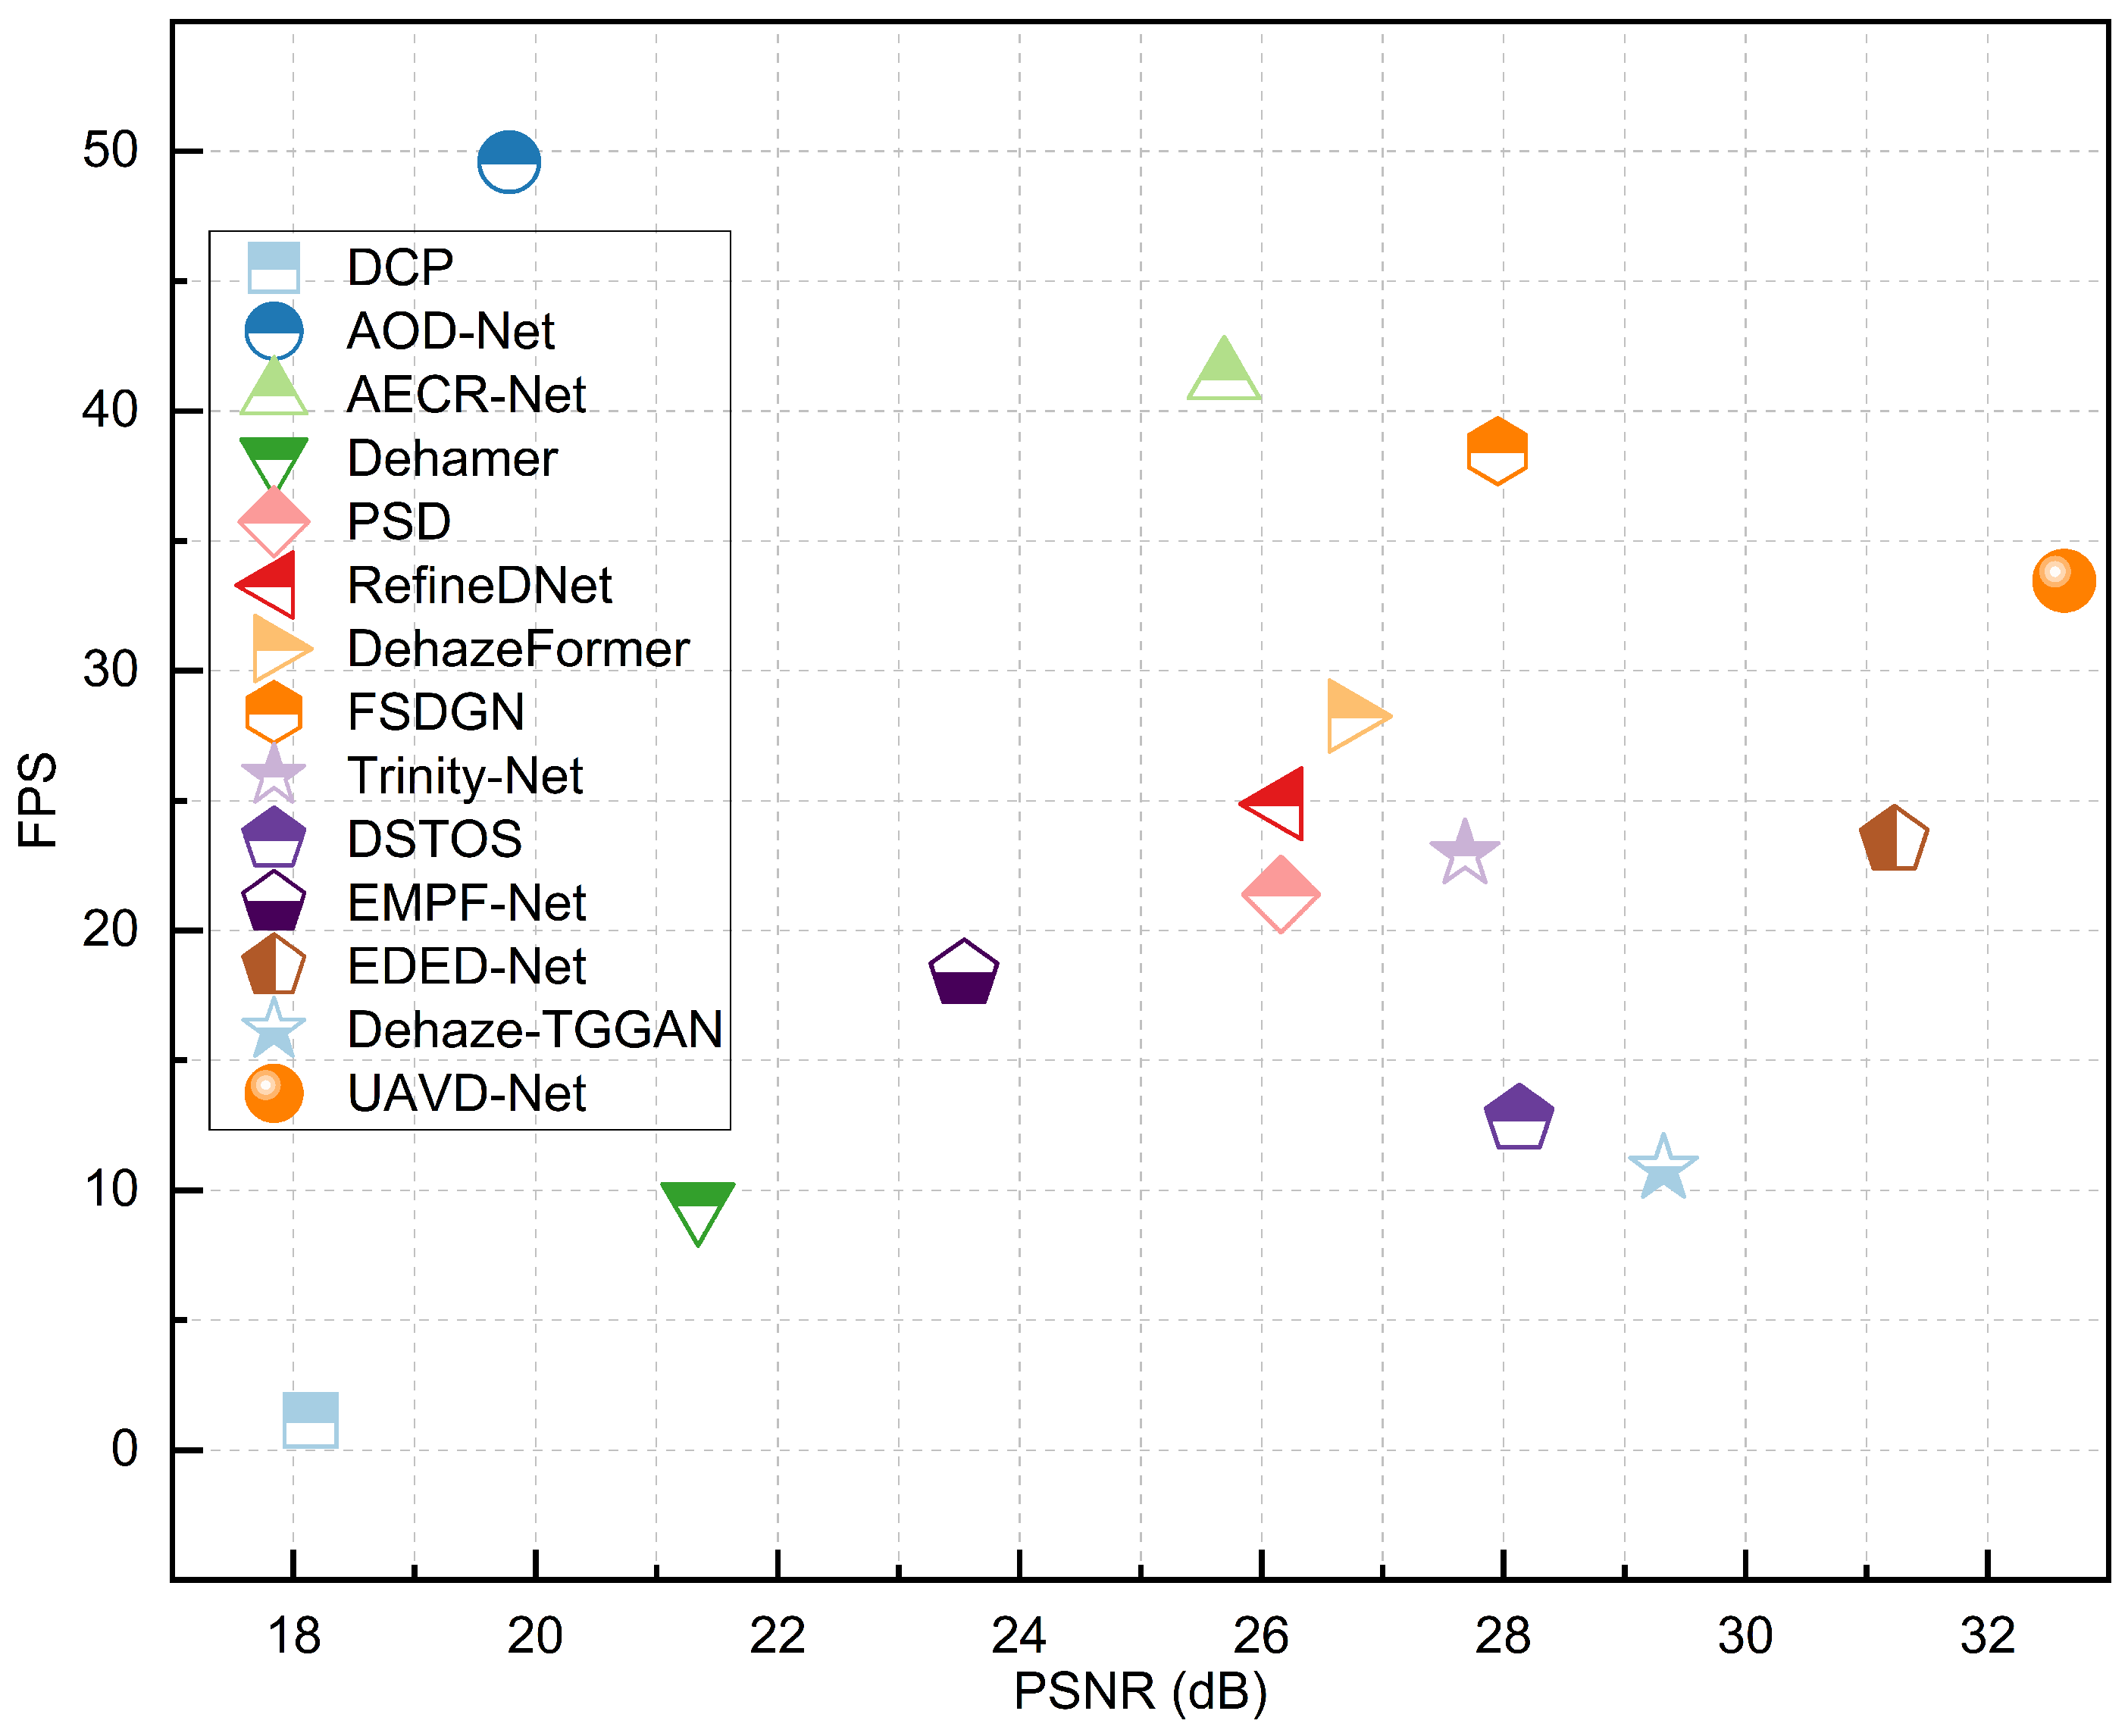
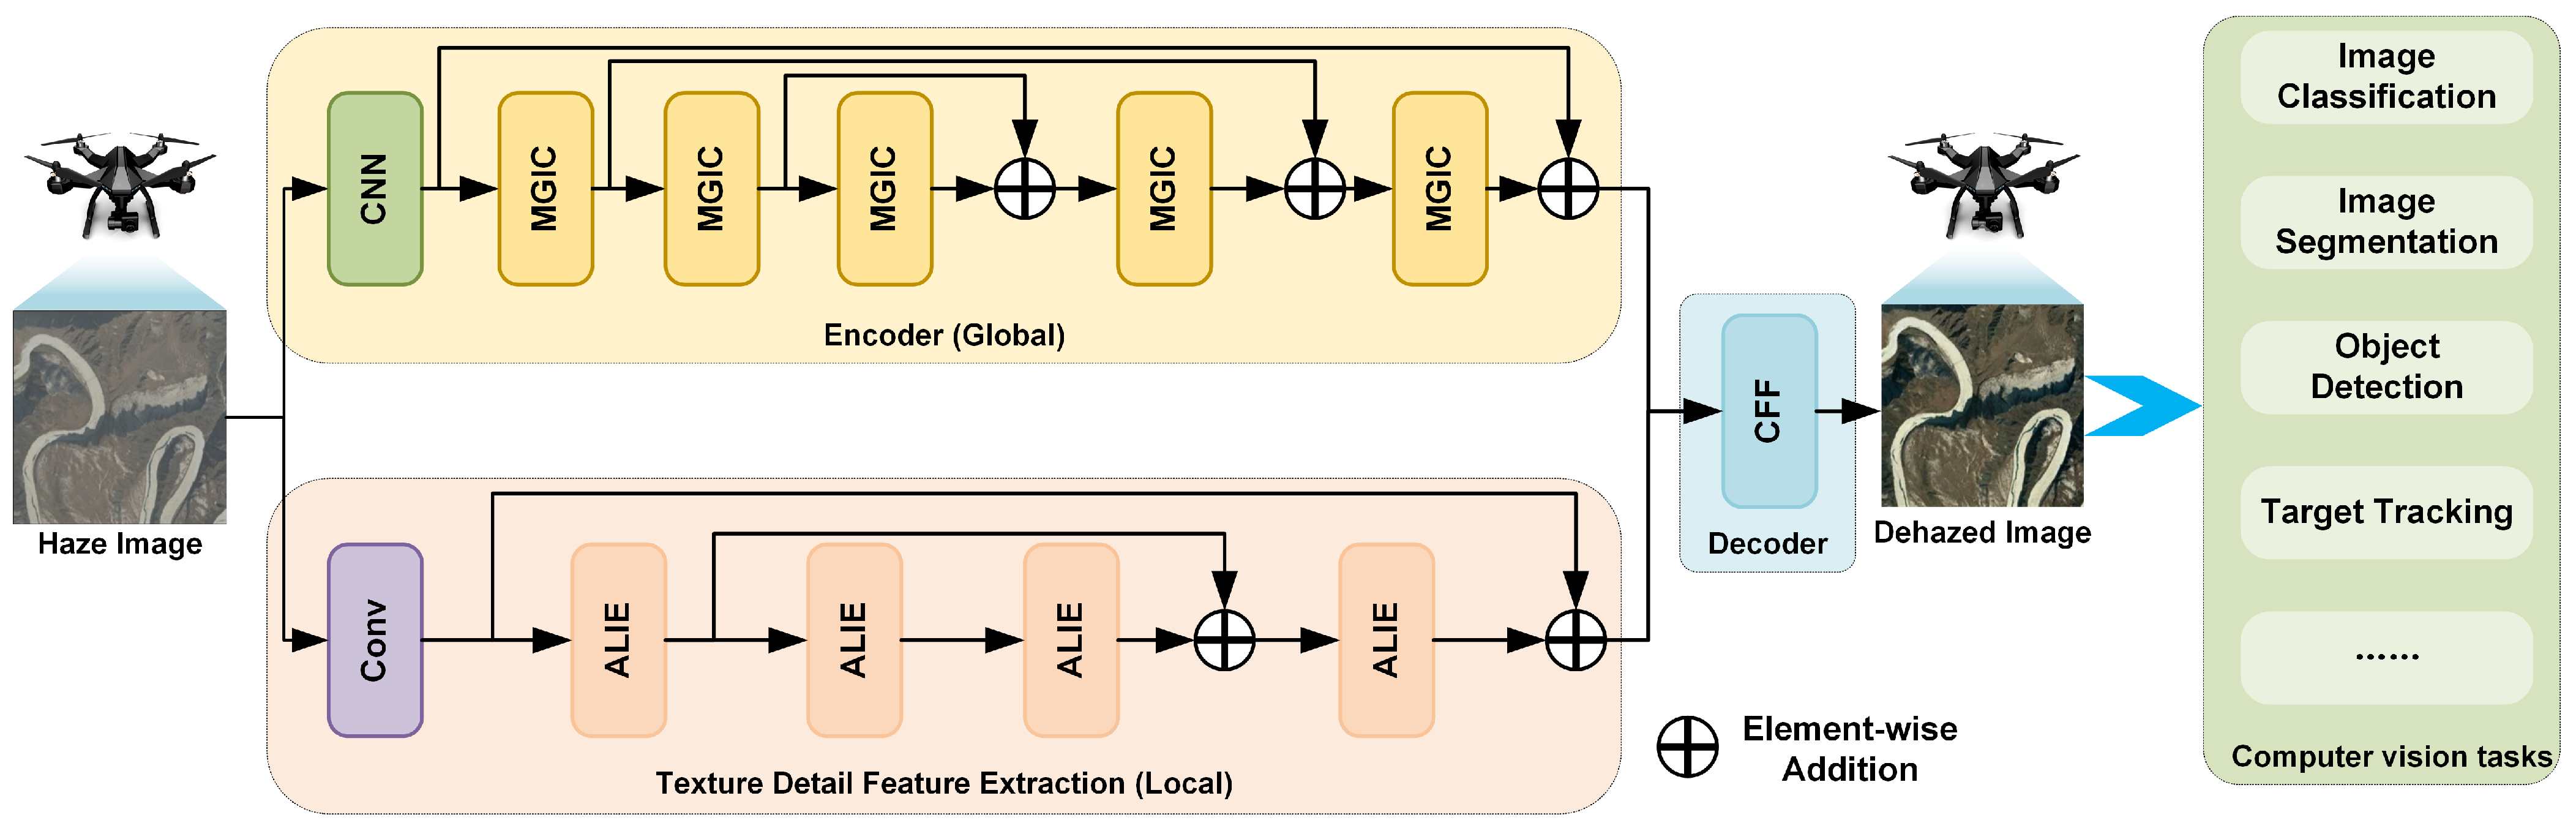
To address these challenges, we propose a novel dehazing method for UAV remote sensing images based on the collaborative integration of global and local features. Unlike methods that rely on the atmospheric scattering model, our approach learns the direct mapping from hazy to haze-free images using deep neural networks. It effectively mitigates issues such as residual local haze and incomplete haze removal, while exhibiting strong capabilities in restoring fine details and color fidelity in both synthetic and real-world datasets. A comparative overview of the performance of our method against state-of-the-art techniques is illustrated in Figure 1. In terms of dehazing accuracy, the proposed method, UAVD-Net, achieves the highest PSNR, demonstrating its superior performance in image restoration. Furthermore, UAVD-Net ranks fourth in efficiency, indicating that it not only delivers high-precision dehazing results but also maintains competitive computational efficiency. These results collectively validate the method’s effectiveness in achieving a favorable balance between accuracy and efficiency.
The specific contributions of this work are as follows:
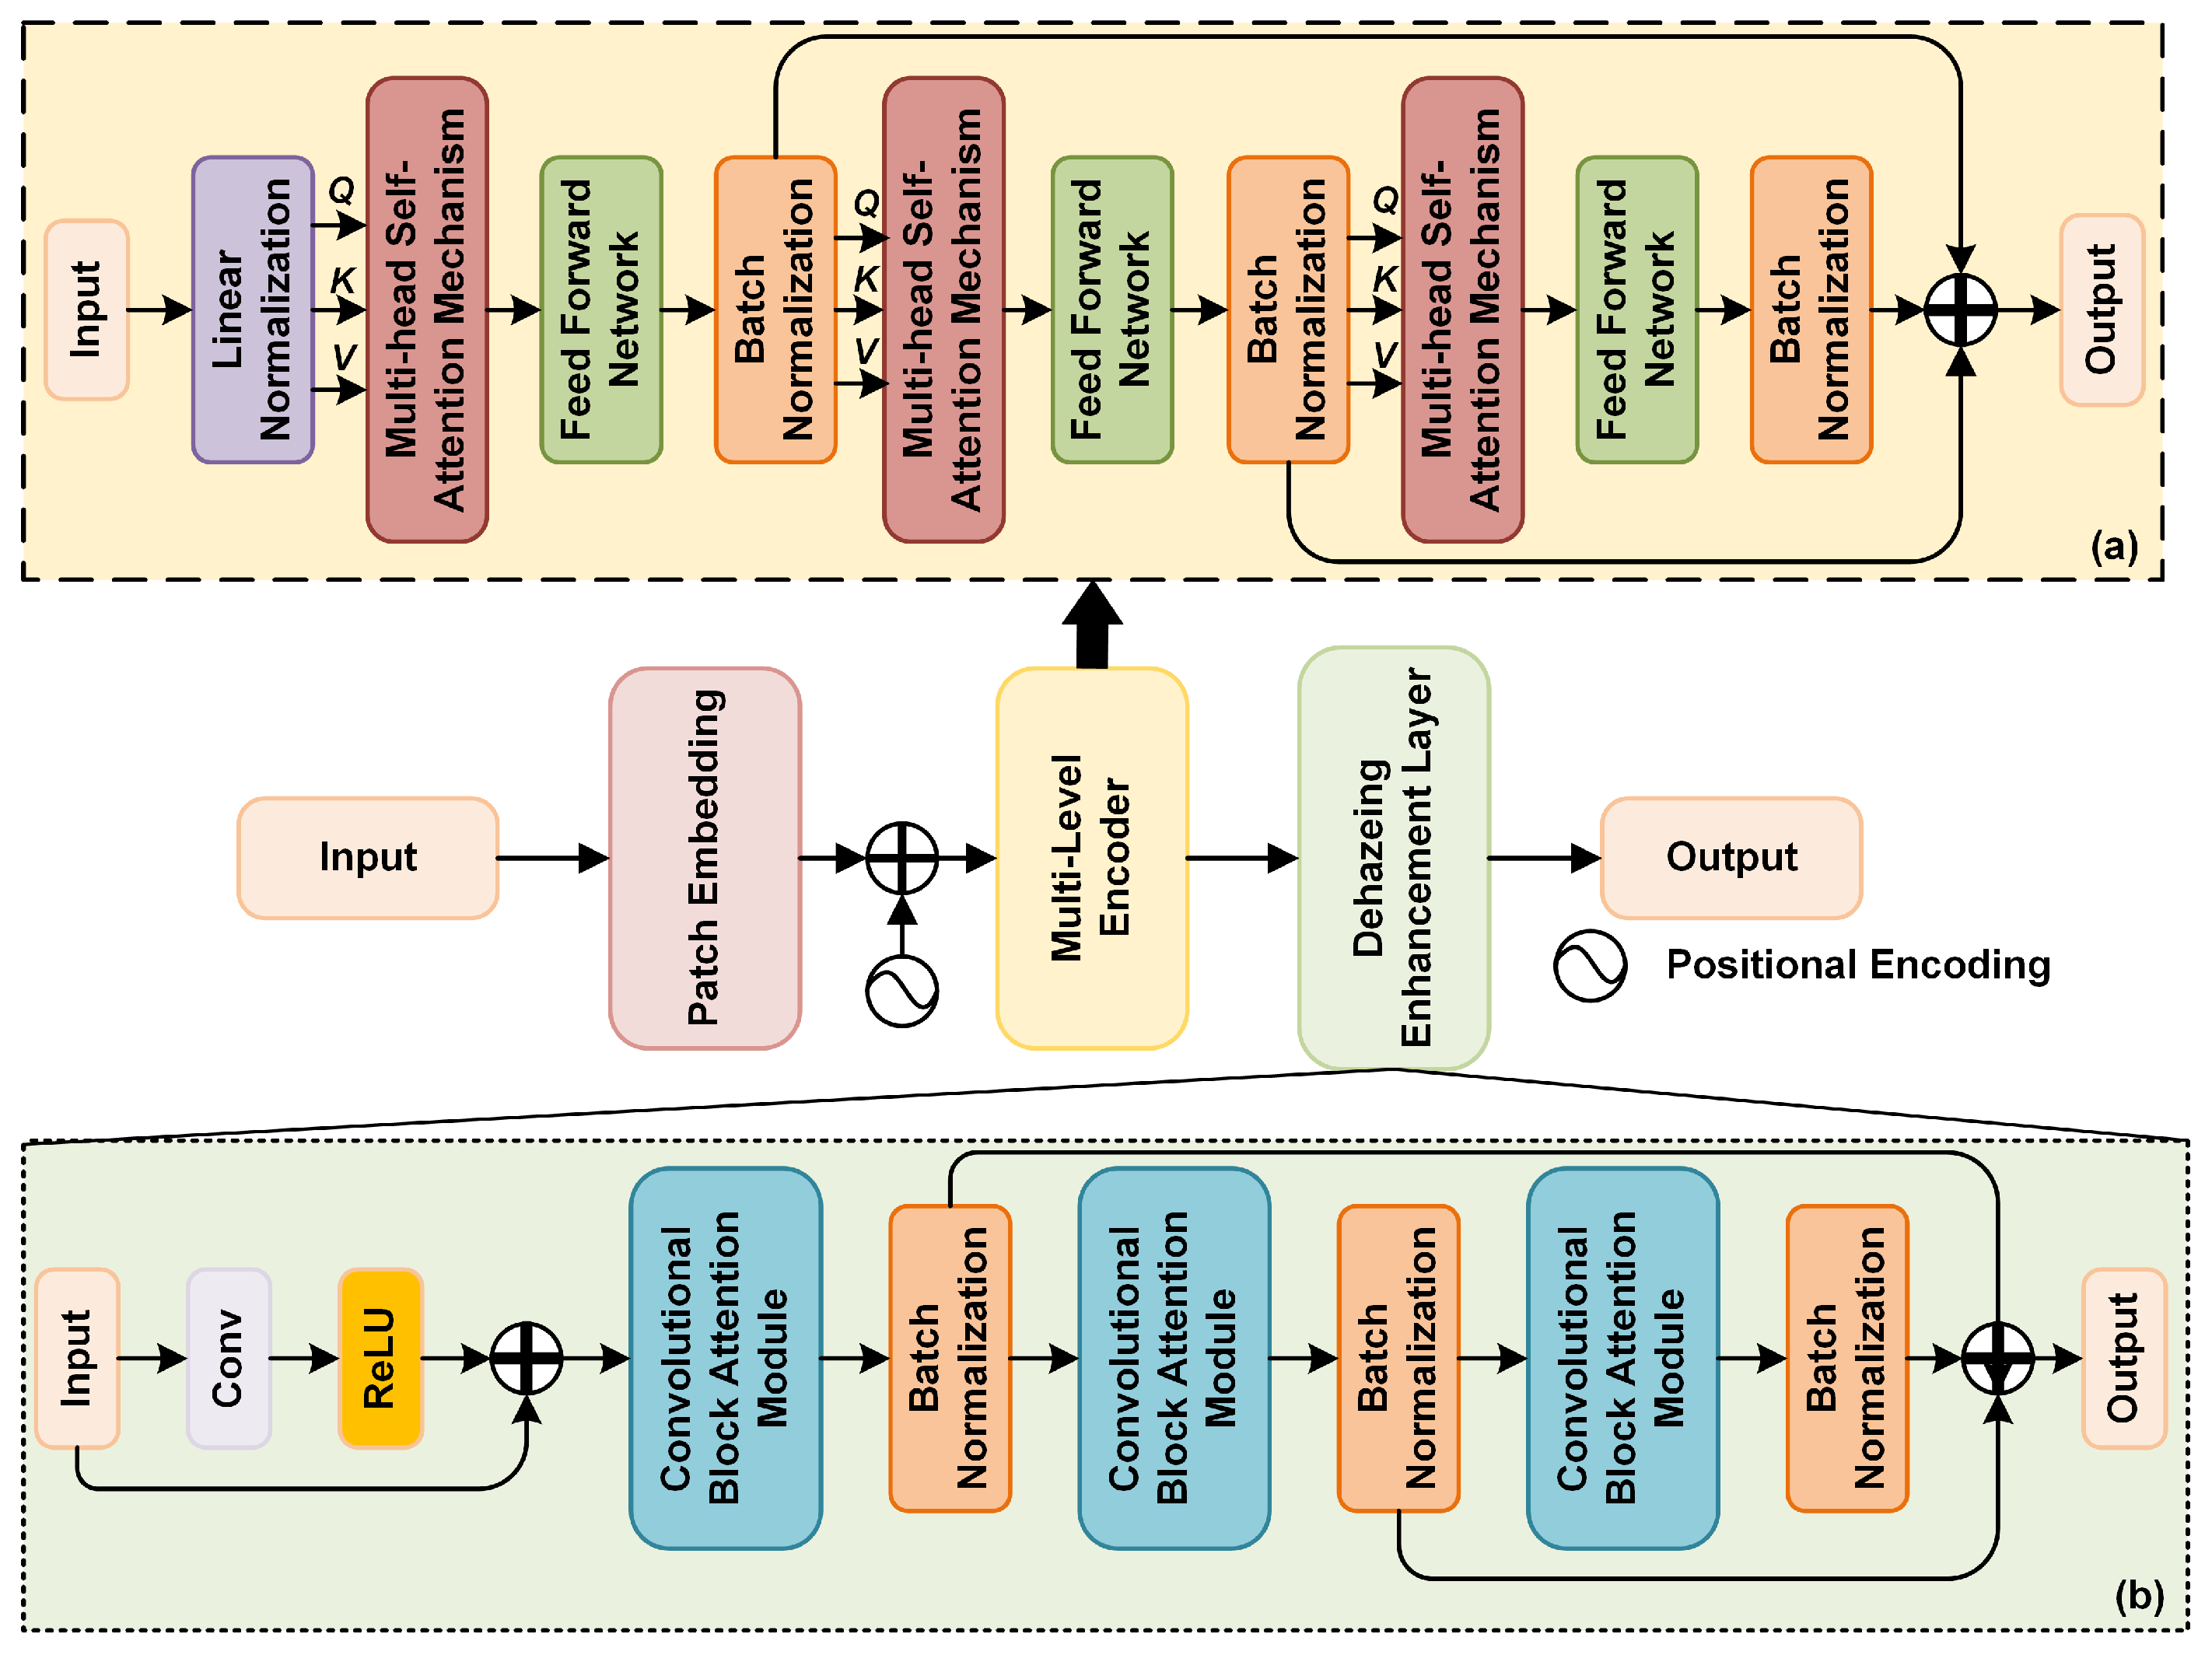
  • We propose a multi-layer global information capturing module (MGIC) that extracts and fuses global feature layer-by-layer to enhance the model’s capacity to understand complex scenes and improve dehazing accuracy.
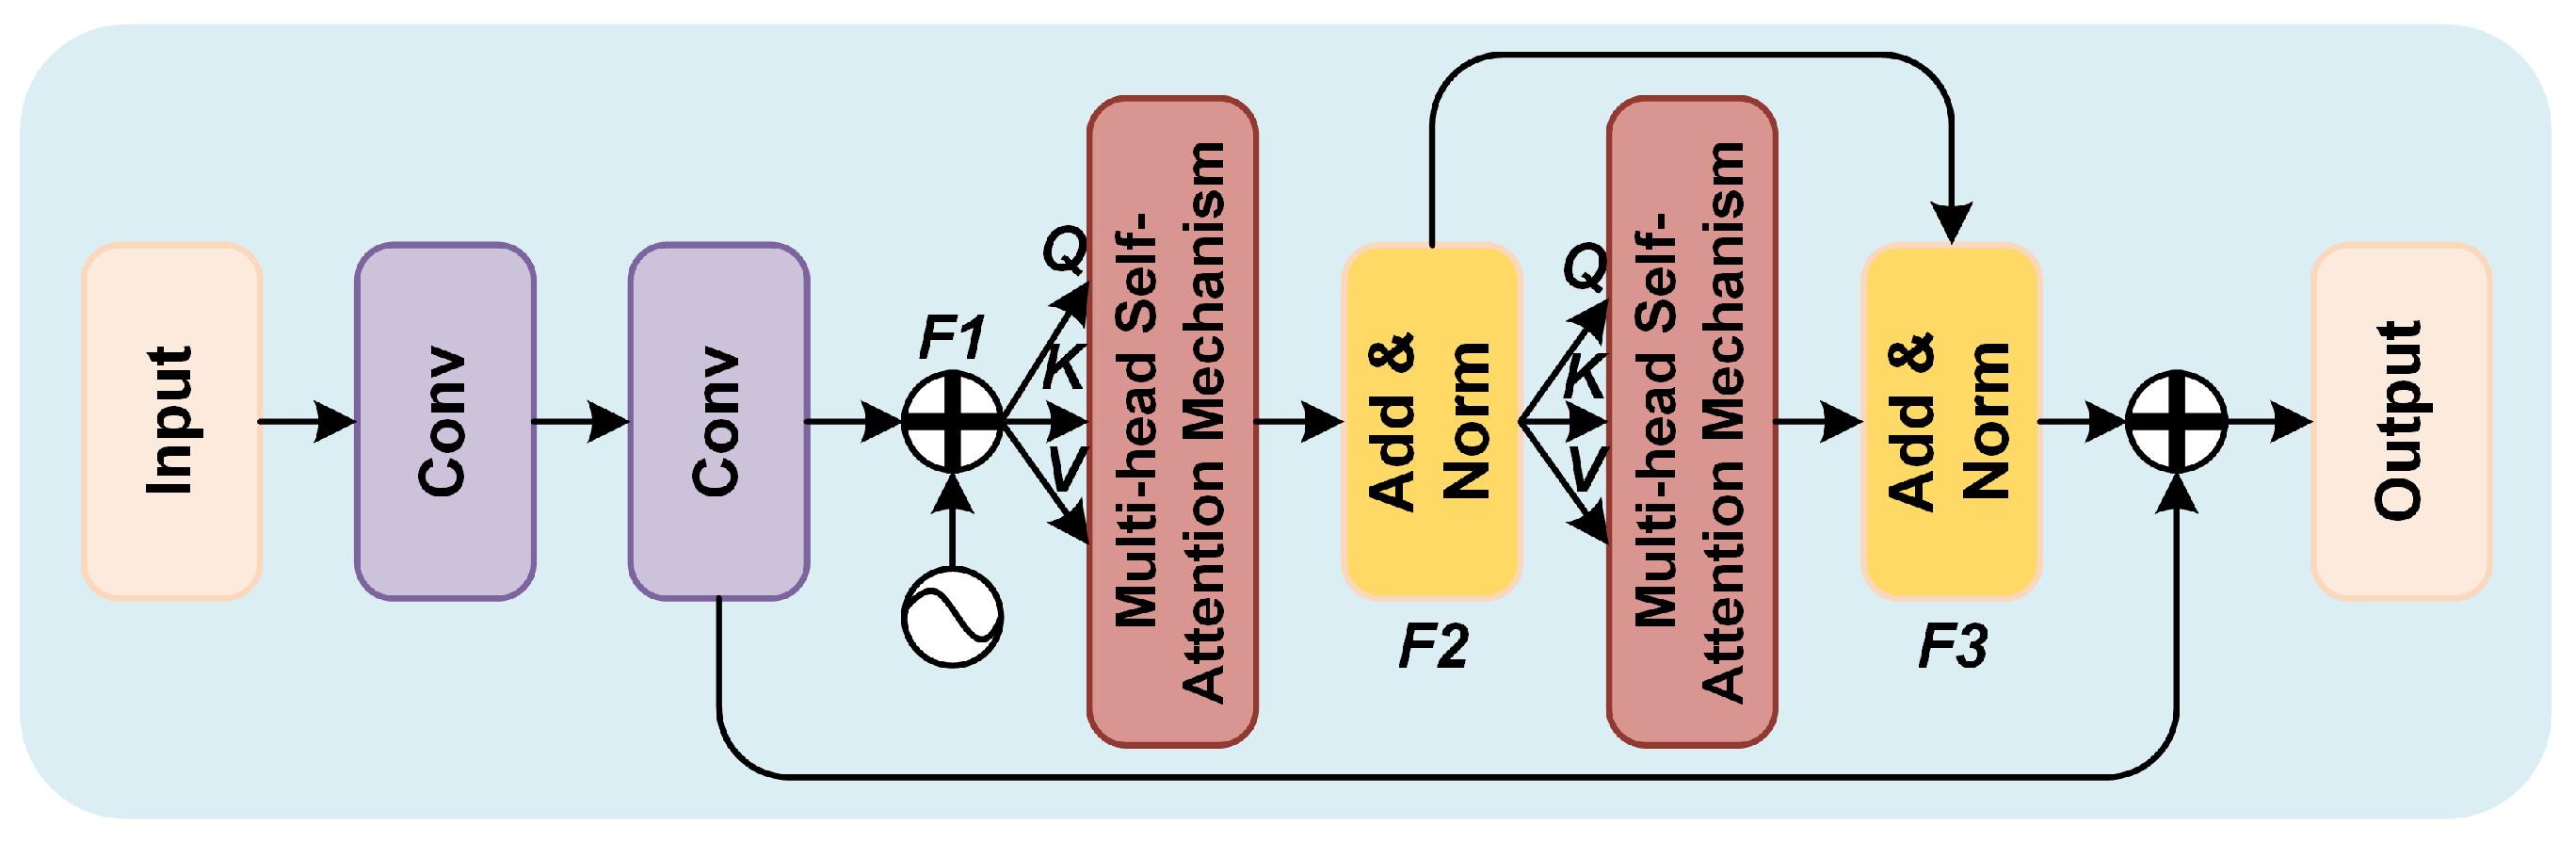
  • We propose an adaptive local information enhancement module (ALIE) that effectively acquires and enhances texture detail information in the image and improve dehazing accuracy.
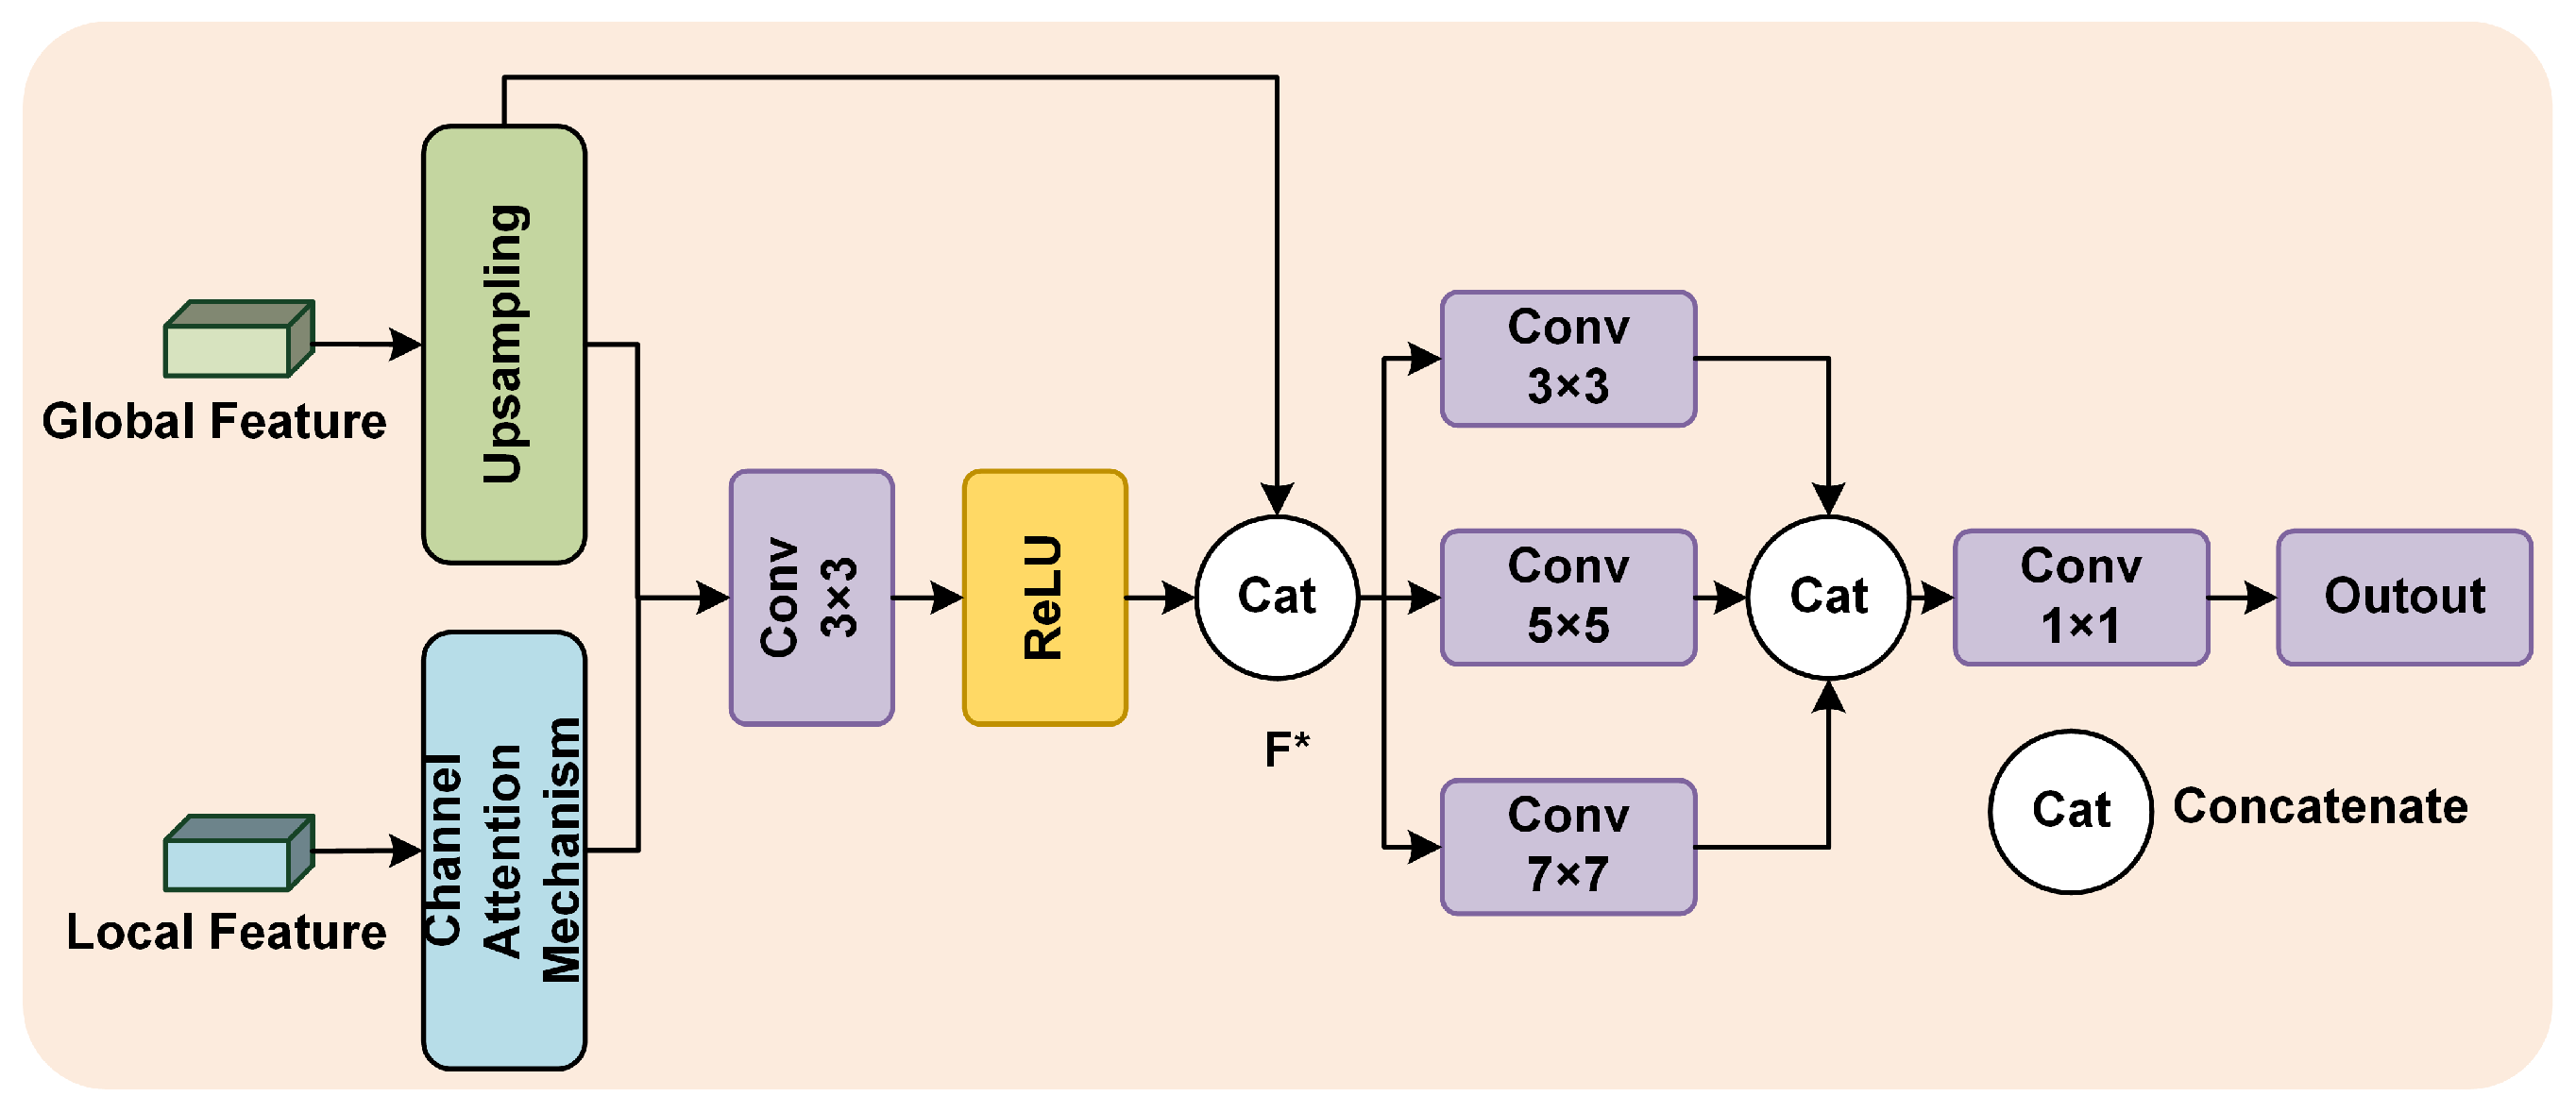
  • We propose a cross-channel feature fusion module (CFF) that fuses global and local information through a cross-channel mechanism to preserve the overall structure of the image and enhance local detail clarity, resulting in natural and clear dehazed images.
  • Our proposed UAVD-Net is an end-to-end network that does not require post-processing. Extensive experiments on the UAV [23], RICE-I [24], RS-Haze [20], SateHaze1k [25], and HyperDehazing [26] datasets consistently demonstrate its superior performance and robustness across various dehazing scenarios.
The structure of the subsequent sections of this paper is outlined as follows: Section 2 provides an overview of pertinent prior research. Section 3 elaborates on the methodology proposed for image dehazing. Section 4 showcases and scrutinizes the experimental outcomes. A discussion of the balance between accuracy and real-time performance is given in Section 5. Concluding the paper, Section 6 presents the final thoughts and reflections.

2. Related Works

2.1. Single-Image Dehazing Methods

In 1977, Howard [6] precisely delineated the origins of hazy imagery by introducing an atmospheric scattering model based on light attenuation and ambient illumination principles. Building on these ideas, numerous researchers have developed image dehazing methods using various models and prior knowledge, which have significantly enhanced dehazing performance [27,28,29,30,31]. Although these methods can produce images with improved visibility, they may introduce artifacts in areas that do not meet the prior assumptions.
Recent advancements in computer software and hardware have led to the emergence of learning-based image dehazing methods. These techniques optimize network parameters by designing specialized architectures and using pairs of hazy and clear images to achieve superior dehazing results. Some models based on convolutional neural networks (CNNs) estimate parameters in the atmospheric scattering model in an end-to-end manner to recover haze-free images [32]. However, most CNN-based methods primarily focus on learning the mapping between hazy and haze-free images while relying on a loss function to obtain haze-free outputs. Sun et al. [33] introduce a novel approach for haze removal in remote sensing imagery, termed the Spatial-Frequency Residual-Guided Dynamic Perceptual Network (SFRDP-Net). This method leverages two key modules—BRCM and FREA—which collaboratively exploit the complementary characteristics of spatial and frequency domains. By guiding the adaptive fusion of spatial and frequency features, these modules enhance the network’s feature representation capacity, ultimately leading to improved haze removal performance. Zhang et al. [34] propose a dual-task collaborative framework that integrates dehazing and depth estimation via mutual interaction and difference perception mechanisms, enabling each task to enhance the other. A cyclegan-based unsupervised defogging method is proposed in [35], which improves the effectiveness of defogging and the recovery of high-frequency details by means of a multi-branch decoding module and a high-frequency component enhancement module. Despite their success, these methods often struggle to utilize global information effectively, resulting in suboptimal haze removal, particularly for images with non-homogeneous haze. The irregular distribution and varying concentration of haze frequently prevent these methods from completely eliminating its influence in images.

2.2. Transformer in Image Dehazing

Recently, Transformer has demonstrated significant potential in artificial intelligence applications. Initially applied to natural language processing (NLP) [36], Transformer achieved remarkable results. Building on this success, researchers extended Transformer to computer vision tasks, leading to Vision Transformer (ViT) [37], which has made strides in object detection [38] and image deblurring [39]. A key feature of Transformer is its attention mechanism, which enhances the model’s ability to identify relationships between inputs and integrate information across the sequence. The self-attention process combines spatial elements into a unified representation.
Self-Atten ( Q , K , V ) = Softmax QK T d k V
where Q , K , and V denote the query, key, and value, respectively, and d k represents the dimension of K. Equation (1) describes the core computation for determining the attention score of an individual image token. While the single-head self-attention layer focuses on one specific element, the multi-head self-attention (MHSA) mechanism [40] enhances the model’s ability to concurrently capture and process multiple relational dynamics within the dataset. The operational details of MHSA are outlined below:
MHSA ( Q , K , V ) = Concat ( head 1 , , head h ) W O
head h = Self-Atten ( QW h Q , KW h K , VW h V )
where Q , K , and V represent the concatenated query, key, and value vectors from all attention heads, respectively. W O denotes the output projection matrix, while W h Q , W h K , and W h V are the projection matrices for the query, key, and value vectors for each head, respectively.
In recent years, Transformers have been increasingly applied to the field of image dehazing. Notable works include: Dong et al. [41], who proposed a two-branch neural network that integrates a Transformer with residual attention mechanisms specifically for dehazing single remote sensing images. Song et al. [20] introduced DehazeFormer, an image dehazing method based on the Swin Transformer. This approach enhances several aspects including normalization layers, activation functions, and spatial information aggregation to improve dehazing performance. Yang et al. [42] developed the multiscale Transformer fusion dehazing network (MSTFDN), which includes three key modules: the multiscale Transformer fusion module (MSTFM), the feature enhancement module (FEM), and the colour restoration module (CRM). This network aims not only to dehaze images but also to correct image colors. Dong et al. [43] proposed DehazeDCT, a novel non-homogeneous dehazing method that combines a deformable convolutional transformer-like architecture and a lightweight Retinex-inspired module to enhance visibility, color fidelity, and structural details. Wang et al. [44] proposed SelfPromer, a depth-consistency Self-Prompt Transformer that leverages the depth differences between hazy and clear images to guide haze removal via a prompt embedding and attention mechanism within a VQGAN-based architecture. Despite these advancements in improving image details, challenges remain, particularly in effectively dehazing areas with high haze concentration.

3. Method

To address the challenges posed by varying light intensities and non-homogeneous haze in UAV remote sensing images, we propose UAVD-Net, a novel method designed to improve UAV remote sensing image dehazing through global and local information collaboration. UAVD-Net effectively learns both global structural information and local texture details to enhance dehazing accuracy. As shown in Figure 2, the UAVD-Net architecture integrates a U-shaped encoder featuring both a convolutional neural network and a Transformer-based multi-layer global information-capturing (MGIC) module, which iteratively extracts and merges global features for enhanced scene understanding and dehazing accuracy. To preserve fine texture details, a local information extraction sub-network with an adaptive local information enhancement (ALIE) module is employed. The decoder further refines the output through a cross-channel feature fusion (CFF) module, which blends global and local details, ensuring that the dehazed images retain both structural integrity and clarity in local features. This comprehensive approach results in more natural and detailed dehazed images.

3.1. MGIC

In high-altitude UAV remote sensing images, global features often suffer from blurring due to lighting variations and non-homogeneous haze. To address this, the multi-layer global information-capturing (MGIC) module uses a multi-layer Transformer encoder to sequentially extract and refine global features from the images. The MGIC module’s structure, as illustrated in Figure 3, enables the capture of various levels of global contextual information. This progressive fusion of global features across layers enhances the network’s ability to understand and restore complex scenes, improving both detail recovery and structural accuracy during dehazing. Let F m denote the input feature and F c represent the output feature. The MGIC module can be mathematically expressed as Equation (4).
F c = D E L ( M L E ( P E + P E b ( F m ) ) )
where D E L ( · ) , M L E ( · ) , P E ( · ), and P E b ( · ) represent the dehazing enhancement layer, multi-level encoder, positional encoding, and patch embedding, respectively.
The Multi-Level Encoder (MLE), illustrated in Figure 3a, is specifically designed to address the spatial heterogeneity of haze present in UAV remote sensing imagery. To effectively cope with non-uniform haze distribution, MLE adopts a hierarchical feature extraction strategy by integrating the Convolutional Block Attention Module (CBAM) [45]. This design allows MLE to adaptively extract and enhance features at multiple semantic levels, tailoring the dehazing process to the local haze characteristics of each image region. Through progressive refinement across layers, MLE enhances both the structural fidelity and visual consistency of the output, resulting in haze removal that is context-aware and detail-preserving.
The Dehazing Enhancement Layer (DEL), shown in Figure 3b, operates as a complementary module to MLE, focusing on further refinement of local features. DEL employs multiple multi-head self-attention mechanisms to capture long-range dependencies and emphasize critical regions affected by residual haze. By selectively enhancing features across spatial locations, DEL refines the outputs generated by MLE, effectively addressing subtle haze artifacts while preserving smooth transitions and fine-grained textures. Importantly, DEL takes the output of MLE as its input, forming a sequential dehazing pipeline where MLE provides structurally aware feature representations and DEL performs adaptive enhancement. This tightly coupled framework ensures robust dehazing performance across both coarse and fine scales.

3.2. ALIE

To address the blurring of details and contrast reduction caused by haze, an adaptive local information enhancement (ALIE) module is introduced. As shown in Figure 4, the ALIE module is designed to enhance local features within the image, focusing on areas affected by haze-induced blurring and artifacts. By adaptively amplifying fine textures and structural details that are typically obscured by haze, the ALIE module improves image quality, retaining sharpness and clarity in both fine details and overall structure.
The module works by selectively enhancing contrast in localized regions of the image, which sharpens edges and textures, making the dehazed result clearer, more visually natural, and realistic. Unlike global methods that may overlook subtle local details, the ALIE module tailors its enhancement based on the specific characteristics of the image, ensuring better preservation of local information across varying scenes and complex backgrounds. We denote the input feature as F and the output feature as F ALIE . Specifically, the input feature F is first processed by two convolutional operations to extract local structural information and then element-wise added with positional encoding to obtain an intermediate feature representation F 1 . Subsequently, F 1 is fed into a multi-head self-attention mechanism to capture long-range dependencies, followed by a residual connection and layer normalization (Add & Norm) to produce the feature F 2 . Building upon this, another multi-head self-attention mechanism is applied to F 2 , and the output is again subjected to a residual connection with the original F 2 , followed by normalization, resulting in a deeper feature representation F 3 . Finally, the original input feature F , after undergoing two additional convolutional operations, is fused with F 3 through element-wise addition to generate the enhanced feature representation F A L I E , which serves as the input for subsequent modules. The formulation for ALIE is given in Equation (5).
F ALIE = F 3 + C o n v ( C o n v ( F ) )
F 3 = A & N ( M H S A ( F 2 ) Q , K , V , F 2 )
F 2 = A & N ( M H S A ( F 1 ) Q , K , V )
F 1 = C o n v ( C o n v ( F ) ) + P E
where A & N , and P E represent the Add & Norm operation, and positional encoding, respectively.

3.3. CFF

The structure of the CFF module is shown in Figure 5. It is based on Section 3.1 and Section 3.2, where we extracted global feature F G and local feature F L from a hazy image. The CFF module is designed to integrate global and local features, preserving the image’s overall structure while enhancing detail reproduction. By upsampling global features and combining them with local ones, the CFF module reduces excessive smoothing, maintaining clarity and realism in the dehazed image. This method ensures that essential details and contrast are preserved, and the image retains a clear sense of depth. Additionally, the CFF module utilizes a channel attention mechanism to fine-tune feature weights based on their importance. This dynamic adjustment helps the network capture crucial dehazing information more effectively, while filtering out noise and interference. This is particularly useful for handling complex backgrounds and varying lighting conditions, improving the overall quality and accuracy of the dehazing process. Let the output be F C F F .
F C F F = C o n v 1 × 1 ( C a t ( C o n v 3 × 3 ( F ) , C o n v 5 × 5 ( F ) , C o n v 7 × 7 ( F ) ) )
F = C a t R e L U C o n v 3 × 3 U p s a m p l i n g ( F G ) , C A M ( F L ) , U p s a m p l i n g ( F G )
where C a t ( · ) , and C A M ( · ) represent the concatenate operation, and channel attention mechanism, respectively. F is an intermediate feature representation that fuses global and local features.

3.4. Hybrid Loss Function

In the image dehazing task, the loss function is crucial as it guides the model in optimizing its parameters throughout the training process. By minimizing the difference between the predicted and actual outcomes, the loss function helps the model learn to improve the dehazing effect. This process ensures that the model progressively enhances its ability to produce clearer, haze-free images by continually refining its predictions to closely match the ground truth.
The structural similarity index (SSIM) is a metric designed to evaluate an image’s brightness, contrast, and structural attributes. By incorporating SSIM loss into the dehazing process, the algorithm ensures that the dehazed image maintains structural and textural fidelity to the original clear image. The SSIM loss is formulated in Equation (11). To further enhance visual fidelity, the perceptual loss is employed, which ensures that the dehazed image closely approximates the perceptual quality of a genuine clear image. This is accomplished by quantifying perceptual differences between images in the feature space of a pre-trained convolutional neural network, such as VGG19. The perceptual loss is detailed in Equation (12). Adversarial losses are divided into two types: generator losses and discriminator losses. In the remote sensing image dehazing task, the generator is responsible for producing the dehazed image, while the discriminator differentiates between the original clear image (i.e., the real image) and the dehazed image generated by the generator. The adversarial loss is derived from the adversarial training between the discriminator and generator within the GAN framework. The adversarial loss associated with the generator is typically expressed as shown in Equation (13).
L SSIM = 1 S S I M ( I dehazed , I ground   truth )
L perceptual = l 1 N l ϕ l ( I dehazed ) ϕ l ( I ground   truth ) 2 2
L adv = log ( D ( I dehazed ) )
where I dehazed represents the dehazed image, I ground   truth represents the ground truth image, N l is the total number of elements in the l t h layer of the feature map, ϕ l ( · ) denotes the features extracted at the l t h layer of the extracted features, · 2 2 denotes the mean square error (MSE), and D ( I dehazed ) represents the discriminator’s predicted probability for the generated image I dehazed .
In this paper, we introduce a hybrid loss function, as defined in Equation (14), which combines multiple loss components. This integrated method not only preserves the structural integrity of the image but also significantly enhances its visual quality. The resulting dehazed images are sharper and offer improved visualization, especially in scenes with complex backgrounds. Additionally, by incorporating a physical prior model, our proposed method is better equipped to understand and mitigate the adverse effects of haze, leading to more effective scene interpretation.
L ours = λ SSIM L SSIM + λ perceptual L perceptual + λ adv L adv
where λ SSIM , λ perceptual , and λ adv are weighting factors for each loss. After extensive experimentation, this paper concludes that λ SSIM = 0.3 , λ perceptual = 0.6 , and λ adv = 0.1 . It is applicable to most UAV image dehazing scenarios.
Figure 6 illustrates a comparison of the dehazing results achieved using different loss functions, highlighting the impact of each approach on image clarity and quality. It can be observed that using the structural similarity loss function often introduces noise into the dehazed image. When employing the perceptual loss function, the dehazed image may experience contrast distortion. Additionally, the adversarial loss function can lead to blurring or artifacts. In contrast, the hybrid loss function proposed in this paper generates a more natural dehazed image, maintaining stable contrast and providing a visual effect that more accurately represents the real scene.
In this paper, we introduce UAVD-Net, with the detailed training process outlined in Algorithm 1.
Algorithm 1 UAVD-Net Training Process
Input: 
Haze image dataset D haze and corresponding clear image dataset D clear , haze image X , clear image Y , batch-size b, hyperparameter ξ , encoder E ( · ) , texture detail feature extraction T ( · ) , decoder C F F ( · ) .
Output: 
Dehazed image Z .
  1:
while Not convergence, do
  2:
   Randomly sample pairs ( x i ) i = 1 b and ( y i ) i = 1 b from the paired hazed datasets D haze and D clear ;
  3:
    Extract global feature F g l o b a l ( x ) from the encoder E ( · ) :
     F g l o b a l ( x ) E ( x ) ;
  4:
  Extract local feature F l o c a l ( x ) from the texture detail feature extraction branch T ( · ) :
    F l o c a l ( x ) T ( x ) ;
  5:
   Fusion of global and local feature according to Equation (9) yields the dehazed image Z :
     Z C F F ( F g l o b a l ( x ) , F l o c a l ( x ) )
  6:
    Updating the loss of the UAVD-Net by the Equation (14).
  7:
end while

4. Experimental and Results Analysis

To comprehensively validate the effectiveness of our proposed method, we carried out a comprehensive series of experiments. First, we provide a detailed description of the key elements of the experiments, including the datasets used, the evaluation metrics, the state-of-the-art methods for comparison, and the specific experimental parameters. We conducted ablation experiments to dissect each sub-module of the proposed method, demonstrating their individual contributions to overall performance. Additionally, we performed a comparative analysis of our method against existing state-of-the-art methods, both qualitatively and quantitatively. To further validate the feasibility of our method in real-world applications, we conducted computational complexity comparisons using the NVIDIA Jetson Xavier NX, an edge computing platform, to assess its performance in meeting the computational requirements of a UAV platform. Finally, we carried out object detection experiments in hazy weather conditions to verify that the proposed method can sustain efficient object detection performance under adverse environmental conditions.

4.1. Datasets and Evaluation Metrics

4.1.1. Datasets

In this paper, we test and evaluate the performance of our method using both real and synthetic datasets. The real-world datasets include UAV [23] and RICE-I [24], while the synthetic datasets consist of RS-Haze [20], SateHaze1k [25], and HyperDehazing [26]. The UAV dataset is a real-world benchmark comprising 150 remote sensing hazy images captured by unmanned aerial vehicles. The RICE-I dataset contains 500 pairs of images, each pair consisting of one image with clouds and one without, with a resolution of 512 × 512 pixels. The RS-Haze dataset comprises 54,000 image pairs, with 51,300 pairs designated for training and the remaining 2700 pairs for testing. This dataset features remote sensing images with relatively monotonous scenes but highly inhomogeneous haze. The SateHaze1k dataset includes 1200 pairs of synthetic aperture radar (SAR) and visible spectral remote sensing images, each with varying levels of haze, alongside corresponding ground truth images. The dataset is categorized into three degrees of haze—thin, medium, and dense—with each category containing 400 image pairs.

4.1.2. Evaluation Metrics

To evaluate the quality of dehazed images, we employ several key metrics, including the structural similarity index (SSIM) [46], peak signal-to-noise ratio (PSNR) [47], and learned perceptual image patch similarity (LPIPS) [48]. SSIM is a perceptual metric that assesses image quality by measuring the similarity between the dehazed image and the original image in terms of luminance, contrast, and structure. A higher SSIM value indicates that the dehazed image retains more structural and visual similarities to the original, enhancing its perceptual accuracy. PSNR is another critical metric that quantifies the ratio between the maximum possible signal power and the power of corrupting noise that affects its fidelity. In the context of image dehazing, a higher PSNR value signifies that the dehazed image exhibits less distortion and noise, closely resembling the real image. Additionally, LPIPS is a deep learning-based metric that evaluates perceptual similarity by comparing the high-level feature representations of two images. Unlike traditional pixel-wise comparisons, LPIPS considers the perceived visual quality, with a lower LPIPS score indicating that the dehazed image is perceptually closer to the original, capturing finer details and textures. Collectively, higher SSIM and PSNR values, along with a lower LPIPS score, demonstrate that the dehazed image is more similar to the real, haze-free image, indicating superior dehazing performance. The determination of SSIM is given in Equation (15) and of PSNR is given in Equation (16).
SSIM ( x , y ) = ( 2 μ x μ y + C 1 ) ( 2 σ x y + C 2 ) ( μ x 2 + μ y 2 + C 1 ) ( σ x 2 + σ y 2 + C 2 )
PSNR = 10 · log 10 M A X I 2 M S E
M S E = 1 m × n i = 1 m j = 1 n ( x y ) 2
where x and y represent the two images to be compared; μ x and μ y denote the means of the two images, respectively; μ x 2 and μ y 2 are the variances of the two images, respectively; and C 1 and C 2 are constants introduced to prevent division by zero. M A X I is the maximum possible pixel value in the image and M S E is the mean square error. m × n denotes the image resolution.

4.2. State-of-the-Art Methods

To thoroughly evaluate the dehazing performance of the algorithms proposed in this paper, we conducted a comprehensive comparison with a diverse set of state-of-the-art methods. We carefully selected a variety of dehazing algorithms, including DCP (PAMI’2010) [8], AOD-Net (ICCV’2017) [12], AECR-Net (CVPR’2021) [16], Dehamer (CVPR’2022) [19], PSD (CVPR’2021) [49], RefineDNet (TIP’2021) [50], DehazeFormer (TIP’2023) [20], FSDGN (ECCV’2022) [51], Trinity-Net (TGRS’2023) [52], DSTOS (GRSL’2023) [23], EMPF-Net (TGRS’2023) [53], EDED-Net (RS’2024) [54], and Dehaze-TGGAN (TGRS’2024) [55]. These algorithms were chosen to represent a wide range of methodologies, allowing us to critically analyze and benchmark the effectiveness of our proposed method against a broad array of existing solutions. This comparison not only highlights the strengths and potential advantages of our algorithm but also provides valuable insights into their relative performance across various scenarios and challenging conditions.

4.3. Experimental Implementation

During the training process, the input images are uniformly cropped to a resolution of 512 × 512 pixels. To balance computational efficiency with accurate gradient estimation, the model is optimized using the Adam optimizer, with a batch size of 16. The initial learning rate is set to 1 × 10 4 , and training is conducted over 100 epochs. To prevent overfitting and enhance model performance, the learning rate is halved every 25 epochs. This study employs the PyTorch 0.12.0 deep learning framework for model training, with all experiments performed on an NVIDIA RTX 4090 GPU (24GB).

4.4. Ablation Study

An ablation study is conducted to assess the importance of different components or features in the model. To verify the effectiveness of the proposed module and loss function, we perform ablation experiments on the real-world UAV dataset and the synthesis RS-Haze dataset. The experimental results are presented in Table 1.

4.4.1. MGIC

When the MGIC module is integrated into the baseline network, the UAV dataset shows an improvement in SSIM and PSNR by 0.0841 and 4.87 dB, respectively, while LPIPS decreases by 0.1461. Similarly, on the RS-Haze dataset, SSIM and PSNR improve by 0.0999 and 4.98 dB, with LPIPS decreasing by 0.1667. This improvement is attributed to the MGIC module’s ability to enhance image quality post-dehazing by combining multiple layers of the Transformer encoder, skip connections, and low-frequency information. This combination helps to preserve and refine both global and local information in the image.

4.4.2. ALIE

The integration of the ALIE module with MGIC demonstrates significant improvements in image quality metrics across both real and synthetic datasets. Experimental results on the UAV real-world dataset and the RS-Haze synthetic dataset reveal notable increases in SSIM and PSNR, alongside decreases in LPIPS. Specifically, on the UAV dataset, SSIM, PSNR, and LPIPS values reached 0.8759, 27.14, and 0.2194, respectively. On the RS-Haze dataset, these values were 0.9169, 28.41, and 0.1930, respectively. These findings indicate that the ALIE module effectively captures high-frequency information and efficiently extracts local fine features, thereby enhancing detail preservation and overall dehazing performance.

4.4.3. CFF

Combining the CFF module with both the MGIC and ALIE modules results in substantial improvements across all three metrics on both datasets. The CFF module replaces the conventional concatenation-based feature fusion with a cross-channel attention mechanism, which dynamically adjusts the weight allocation between channels. This approach ensures that low-frequency and high-frequency information are effectively complemented during fusion, leading to dehazed images that exhibit both global clarity and rich detail retention.

4.4.4. L ours

We employed a hybrid loss function that integrates structural similarity index (SSIM) loss, perceptual loss, and adversarial loss. Utilizing this combined loss function, we achieved an SSIM of 0.9351, a PSNR of 32.63 dB, and an LPIPS of 0.1734 on the UAV dataset, and an SSIM of 0.9411, a PSNR of 33.53 dB, and an LPIPS of 0.1575 on the RS-Haze dataset. These results demonstrate that the proposed hybrid loss function significantly enhances the network’s performance in dehazing tasks. By effectively integrating structural similarity, perceptual quality, and adversarial aspects, the hybrid loss function markedly improves the visual quality and detail retention of the dehazed images.

4.5. Quantitative Experiments

In order to comprehensively verify the effectiveness of the proposed method in the image dehazing task, we conducted extensive comparison experiments on both real and synthetic datasets to ensure the applicability and robustness of the methods across multiple scenarios. The experimental results are shown in Table 2 and Table 3.

4.5.1. Real-World Datasets

As shown in Table 2, we conducted quantitative experiments on the real-world datasets UAV and RICE-I to comprehensively evaluate the image dehazing performance of each method. The experimental results indicate that DCP has the weakest performance across all three metrics—SSIM, PSNR, and LPIPS—on both datasets. In contrast, AECR-Net surpasses AOD-Net, Dehamer, and PSD but still falls short of RefineDNet, DehazeFormer, and DSTOS. However, EMPF-Net outperforms these methods in all three metrics, achieving a PSNR of 23.54 dB, SSIM of 0.8439, and LPIPS of 0.3123, representing the best results among them. Additionally, Dehaze-TGGAN and EDED-Net exhibit strong competitiveness, securing the third and second best results, respectively. Most notably, our proposed UAVD-Net achieves optimal results on both the UAV and RICE-I datasets. Specifically, UAVD-Net records PSNR, SSIM, and LPIPS values of 32.63 dB, 0.9351, and 0.1734 on the UAV dataset, and 32.05 dB, 0.9309, and 0.1828 on the RICE-I dataset, respectively. These results are significantly superior to those of the other methods, which fully demonstrates the excellent performance and robustness of our proposed method across various scenarios, showcasing its strong dehazing capabilities.

4.5.2. Synthetic Datasets

As shown in Table 3, to thoroughly assess the dehazing capabilities of various methods, we conducted quantitative evaluations on two synthetic datasets: RS-Haze and StateHaze1K. The comparison spans three key metrics—PSNR, SSIM, and LPIPS—offering a comprehensive performance profile. Among the evaluated methods, DCP consistently ranks at the bottom across all metrics and datasets. AECR-Net delivers noticeable improvements over AOD-Net, Dehamer, and PSD, yet it is still outperformed by more advanced approaches such as RefineDNet, DehazeFormer, and DSTOS. EMPF-Net emerges as a strong contender, surpassing these methods with scores of 25.84 dB in PSNR, 0.8874 in SSIM, and 0.2288 in LPIPS. Dehaze-TGGAN and EDED-Net also demonstrate competitive results, securing third and second places, respectively. Most significantly, our proposed UAVD-Net achieves the highest performance across all benchmarks. On the RS-Haze dataset, it records a PSNR of 33.53 dB, an SSIM of 0.9411, and a notably low LPIPS of 0.1575. On StateHaze1K, it further improves to 34.23 dB in PSNR, 0.9593 in SSIM, and 0.1465 in LPIPS. These scores not only outperform all other methods by a substantial margin but also highlight the robustness and superior generalization ability of UAVD-Net under complex synthetic hazy conditions.
To evaluate its robustness and generality, we conducted dehazing experiments on the hyperspectral dataset: HyperDehazing, and the experimental results are shown in Table 4. As this dataset is a synthetic dataset, its dehazing effect is better than that of the real dataset. Specifically. UAVD-Net achieves the best performance across all three evaluation metrics, with a PSNR of 37.83, SSIM of 0.9672, and LPIPS of 0.1376, ranking first among all compared methods. These results demonstrate its significant advantage in image quality restoration. Following closely, EDED-Net also exhibits strong performance, achieving a PSNR of 36.91 and an LPIPS of 0.1791, indicating its competitiveness particularly in terms of structural and perceptual consistency. Dehaze-TGGAN obtains the second-highest SSIM value of 0.9349, though it performs slightly worse in PSNR and LPIPS compared to the top-ranking methods. In contrast, traditional approaches such as DCP and earlier deep networks like AOD-Net exhibit notably lower performance, suggesting that recent advances in network architecture and training strategies have led to substantial improvements in dehazing capability under complex scenarios. Overall, UAVD-Net demonstrates superior performance across multiple key metrics, confirming its effectiveness and robustness in single image dehazing tasks.

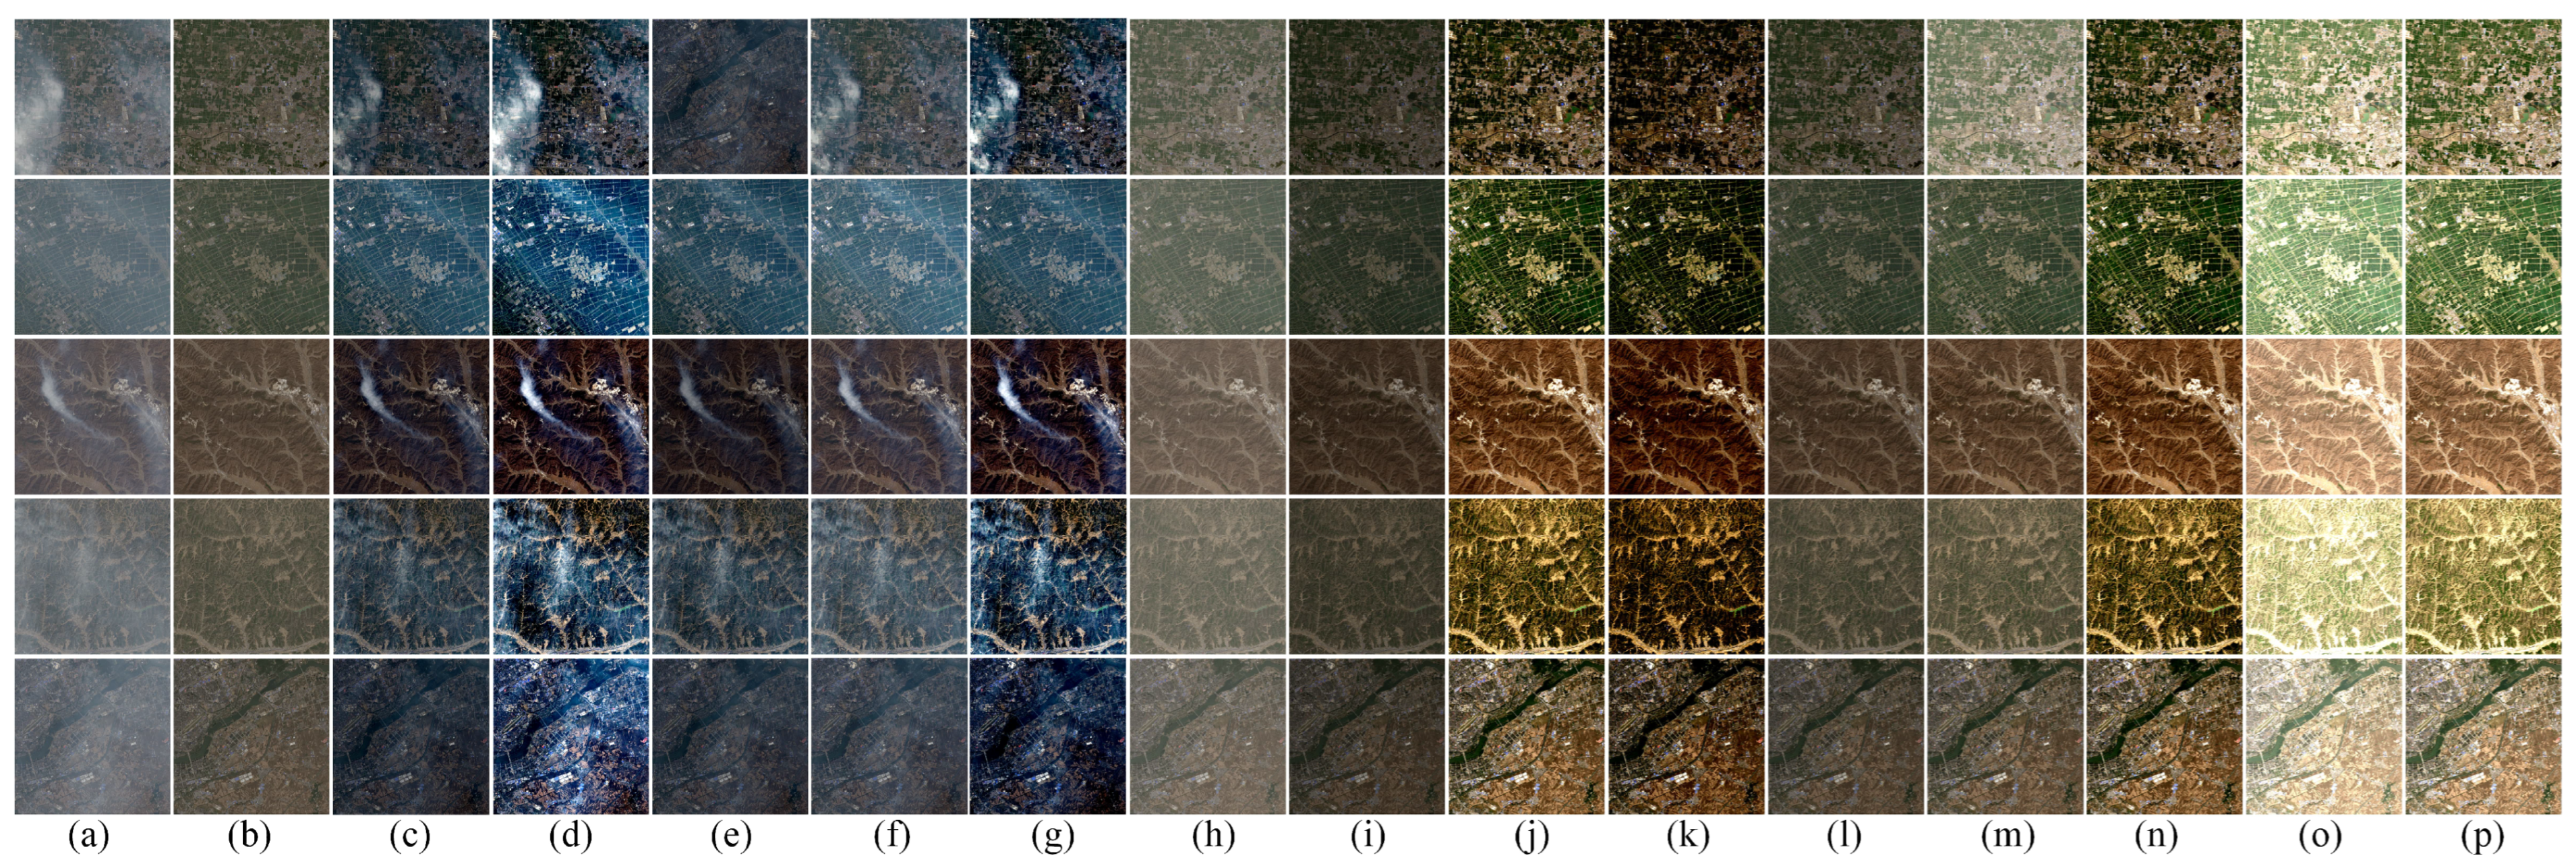
4.6. Qualitative Experiments

The primary goal of image dehazing is to enhance image clarity and visibility. To intuitively demonstrate the effectiveness of various dehazing algorithms, we conduct visualization experiments on both real-world and synthetic datasets, with the results presented in Figure 7, Figure 8, Figure 9 and Figure 10.
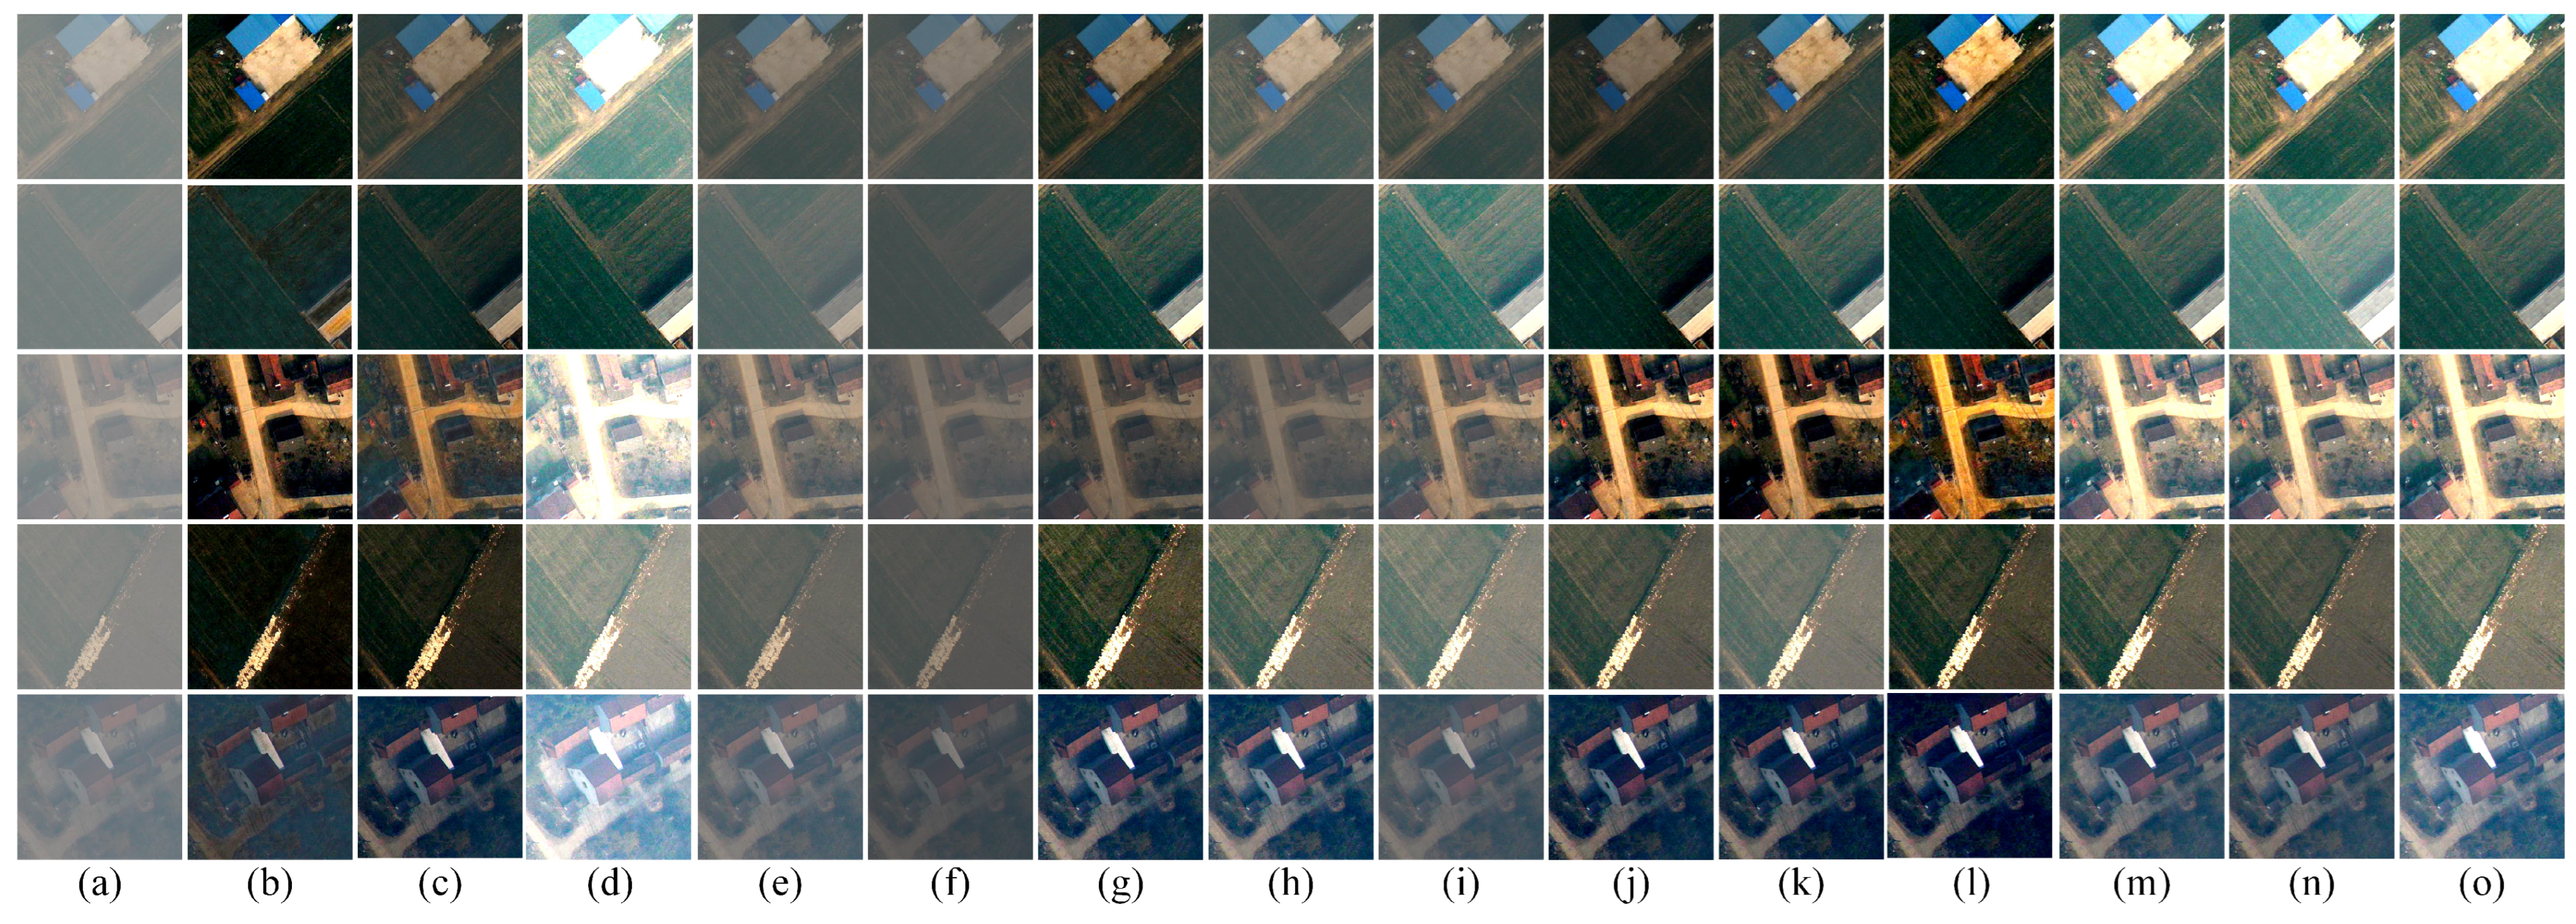
For the real-world datasets UAV and RICE-I (Figure 7 and Figure 8), notable differences in dehazing performance are observed across methods. The DCP algorithm produces darker images with severe highlight distortions. AOD-Net and DehazeFormer leave noticeable residual haze, particularly in the UAV dataset, while RefineDNet, AOD-Net, and EMPF-Net introduce visual artifacts. In contrast, our proposed method achieves a more balanced restoration, effectively removing haze while preserving natural color tones, resulting in more visually pleasing and realistic images.
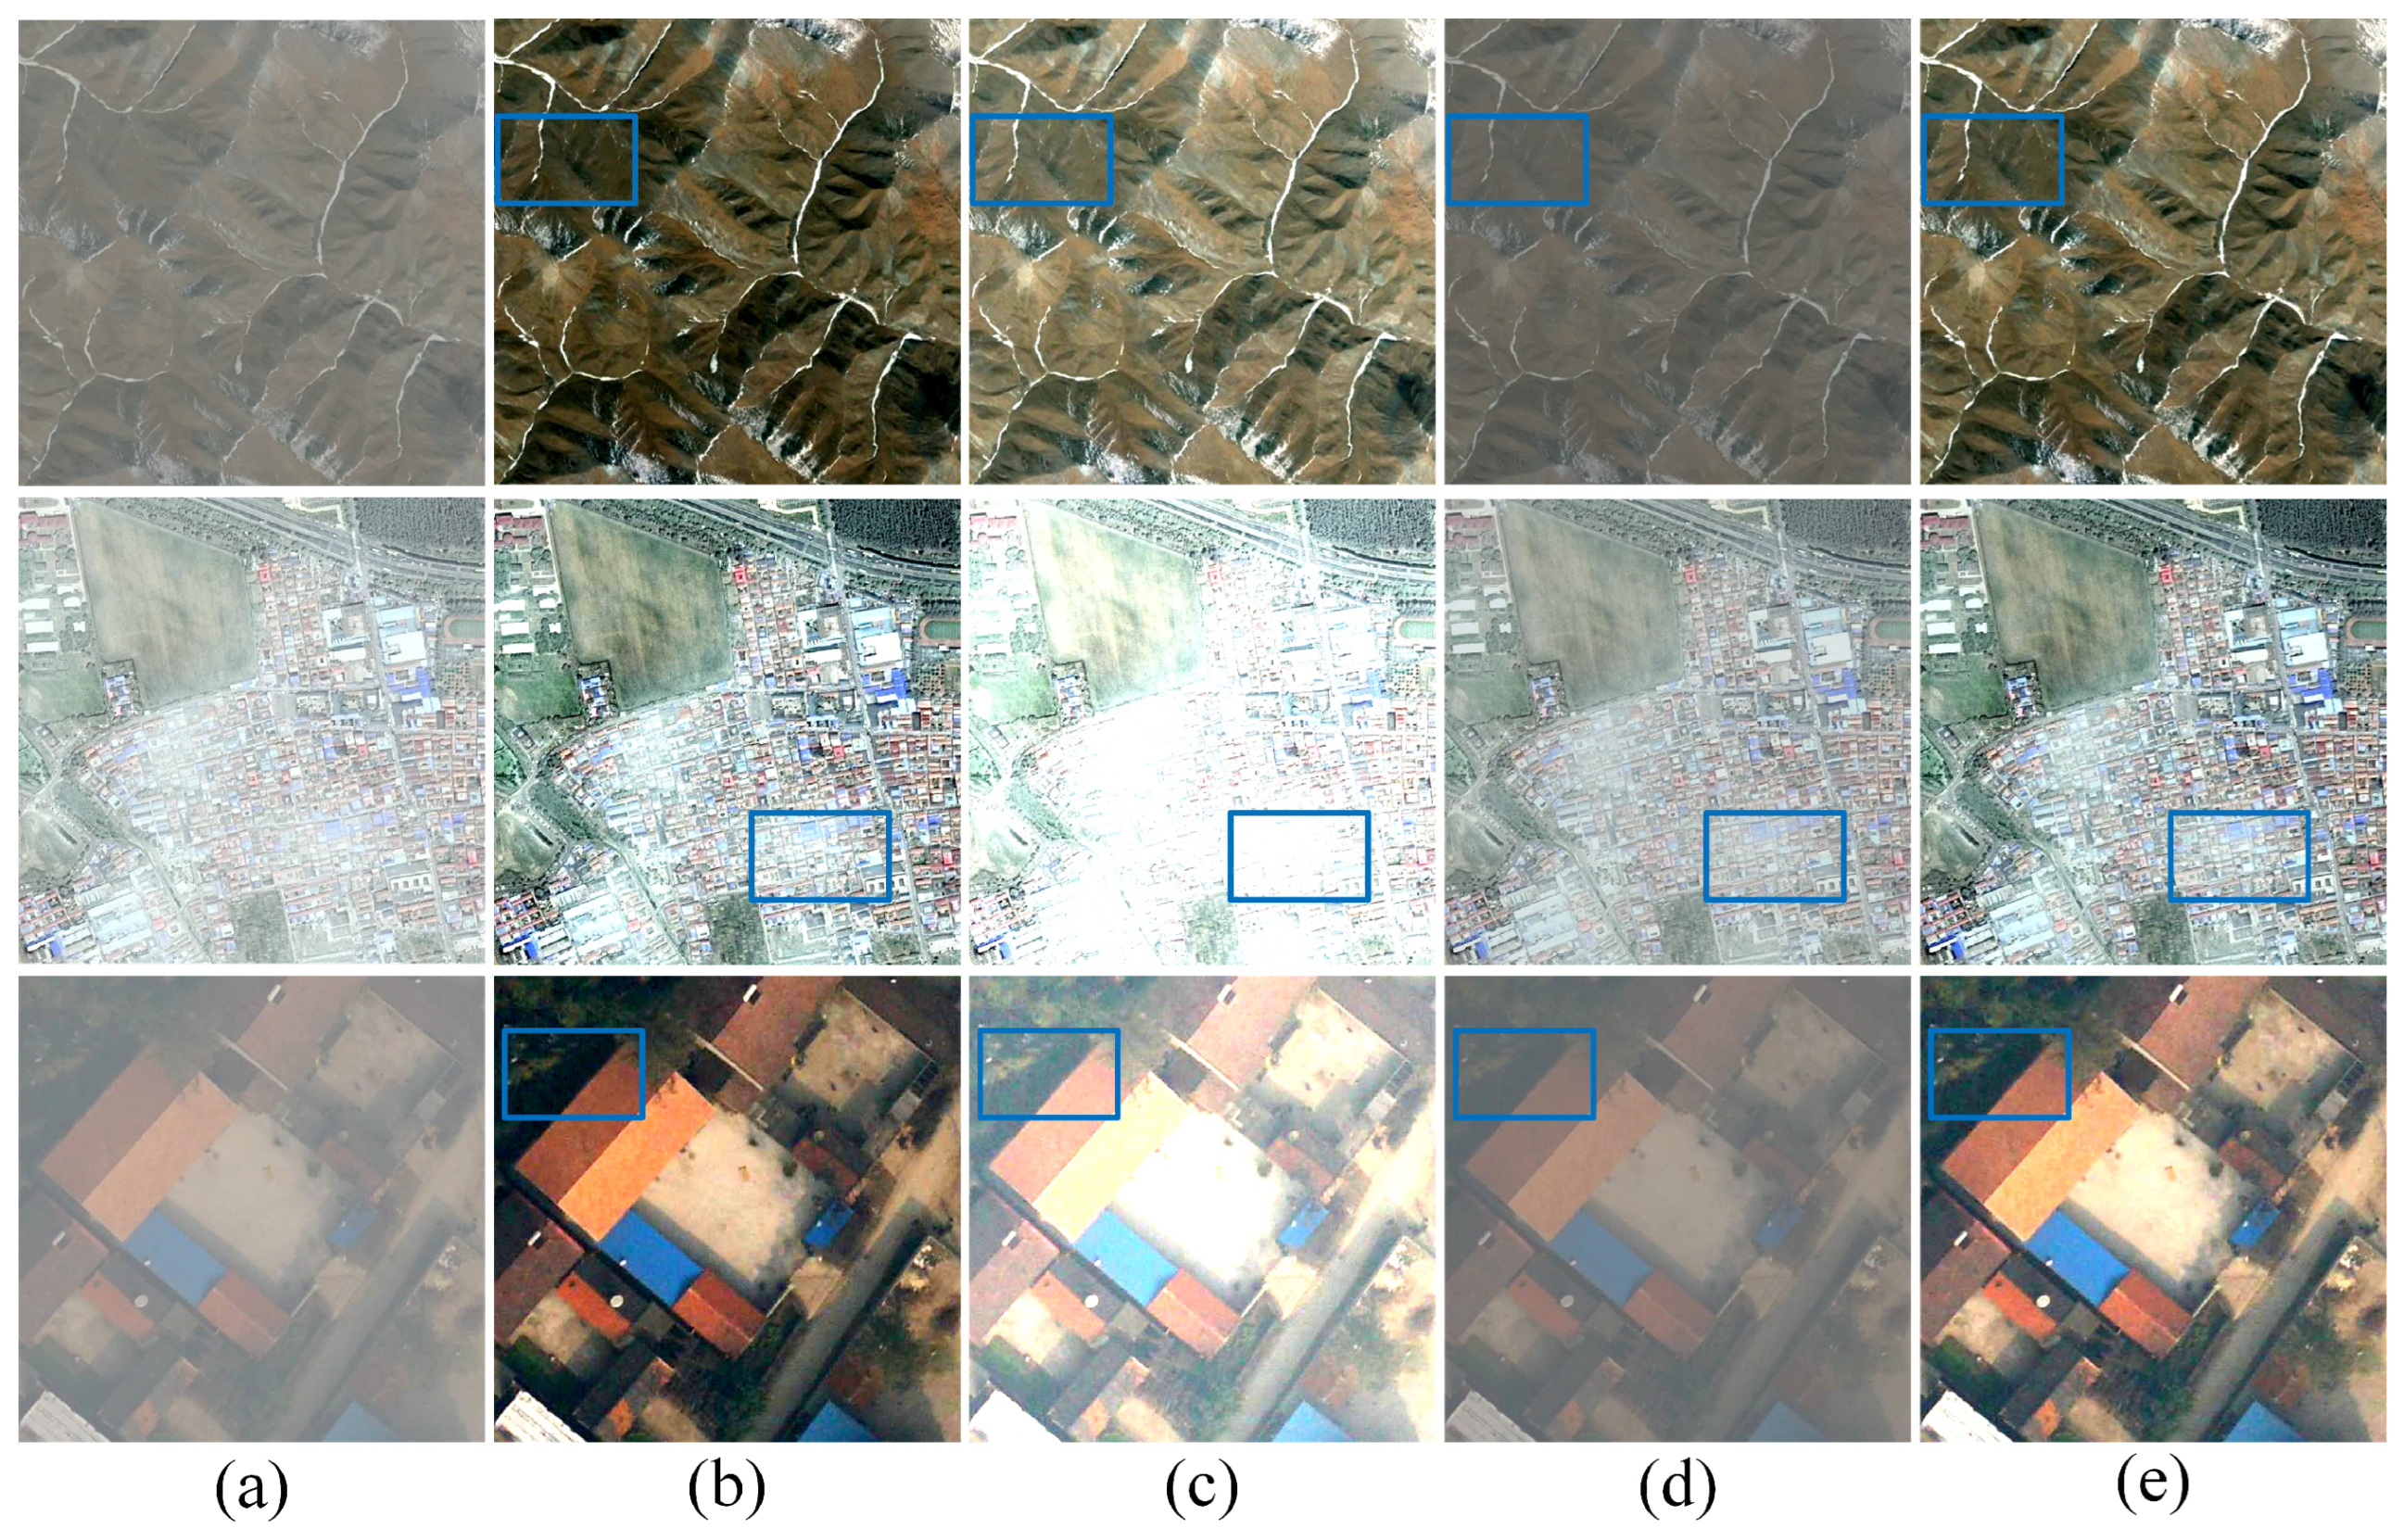
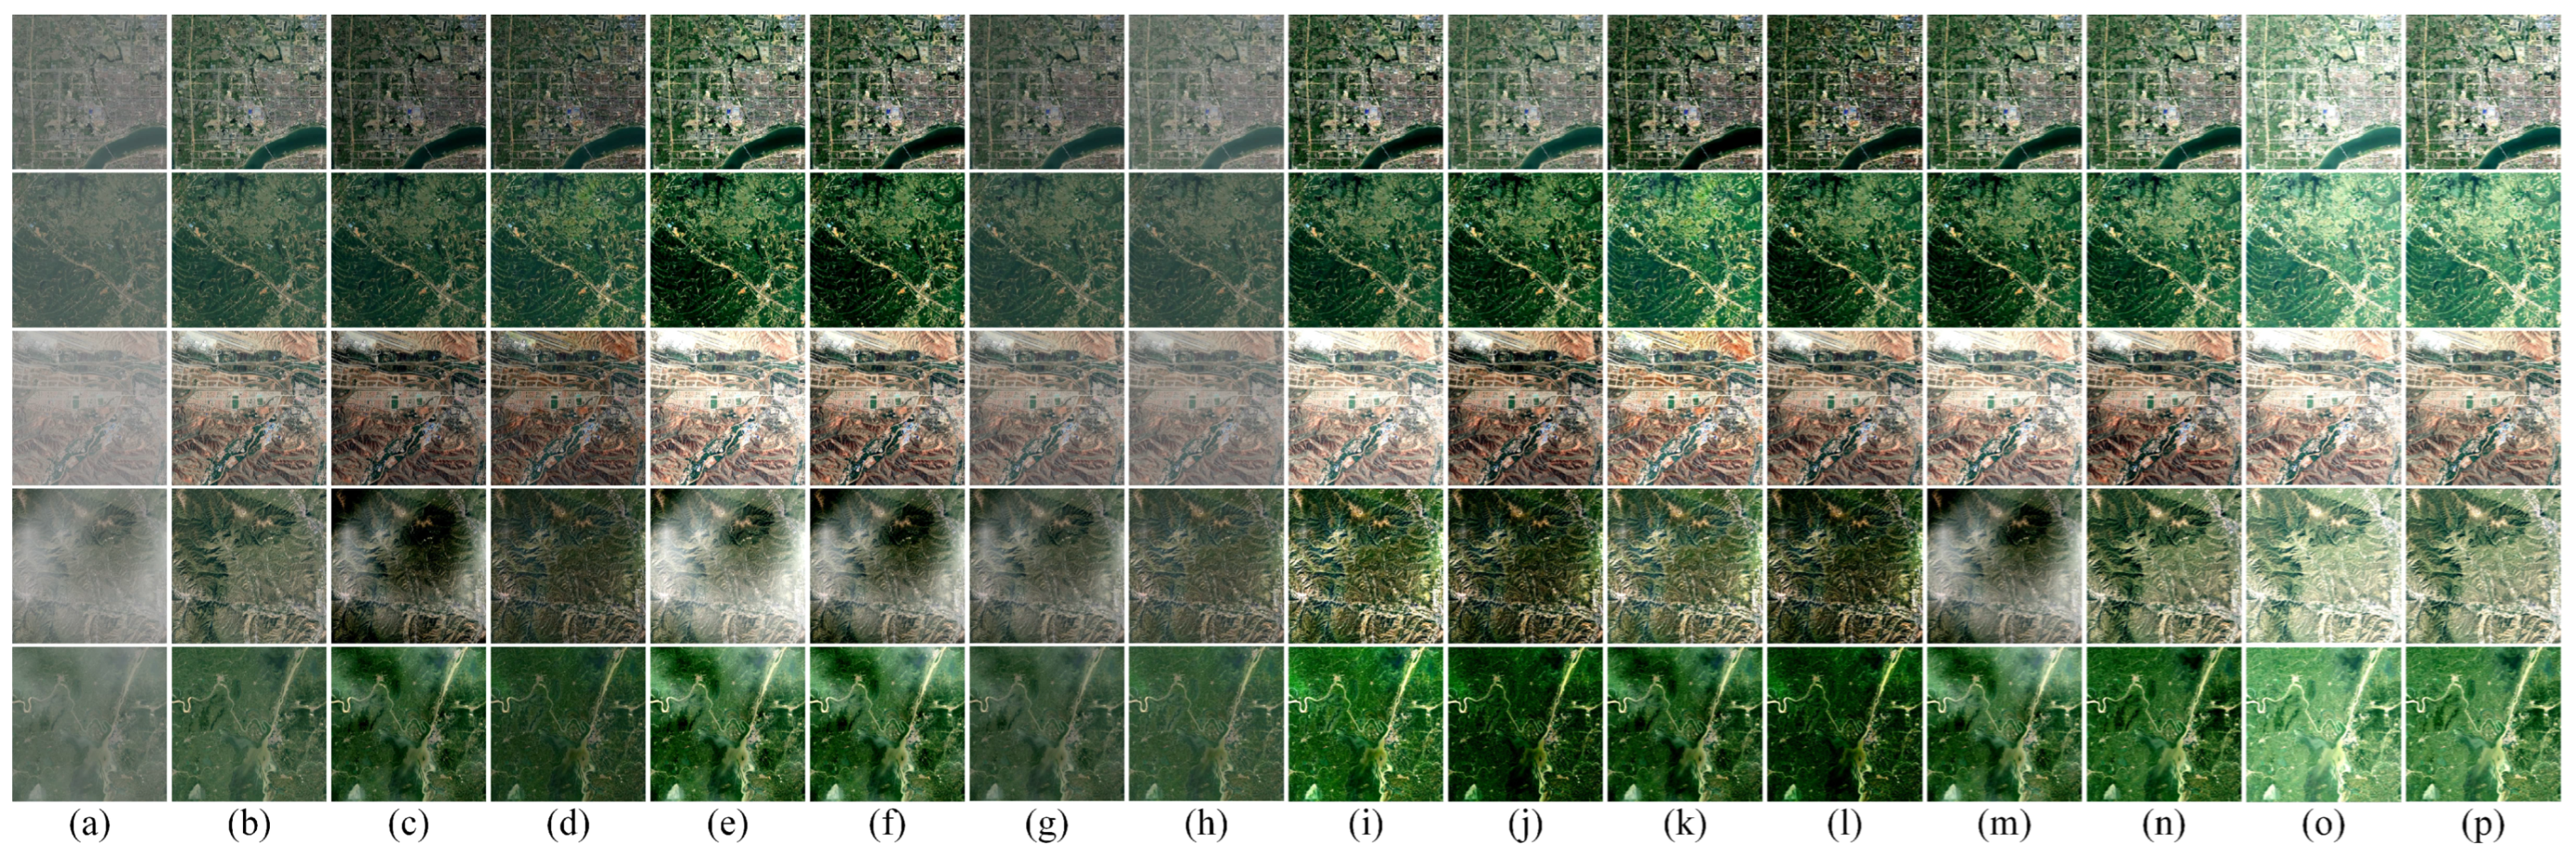
For the synthetic datasets RS-Haze and SateHaze1k (Figure 9 and Figure 10), the DCP algorithm again results in overly dark images with substantial haze retention. While EDED-Net reduces some haze, it introduces noticeable color artifacts, leading to uneven visual quality. The PSD algorithm struggles with haze removal in township scenes and introduces unrealistic colors in river and mountain scenes. Dehaze-TGGAN, although enhancing certain details, leads to over-restoration and suboptimal results. In comparison, our method demonstrates superior detail recovery, effectively preserving color and contrast, and generating dehazed images that more closely resemble the original scene, thus providing a more natural and authentic visual experience.

4.7. Complexity Experiment

Complexity is also a crucial factor in evaluating algorithm performance. To evaluate the complexity of our proposed method and the comparison method, we conducted experiments on the UAV and RICE-I datasets. The metrics used include the number of parameters and FPS (Frames Per Second). The number of parameters represents the total count of tunable parameters in a model, with a higher count indicating the model’s capability to fit more complex data patterns. FPS measures the number of image frames processed per second, reflecting the real-time processing capability of the system; a higher FPS value indicates better responsiveness and accuracy. The results of the complexity experiments are presented in Table 5 and Figure 11.
The complexity experiments were conducted on a NVIDIA Jetson Xavier NX edge computing device, processing images of size 512 × 512. As shown in Table 5 and Figure 11, AOD-Net has the smallest number of parameters and the highest FPS, with values of 49.59 and 48.12 for the two datasets. AECR-Net shows the second-best performance, with 2.61M parameters and FPS values of 41.28 and 40.56. In contrast, Dehamer, with its more complex architecture, has the largest number of parameters (67M) and the lowest FPS, with results of 9.45 and 9.12. The method proposed in this paper achieves the fourth-best FPS, with values of 33.46 and 32.91, but has a higher number of parameters compared to AOD-Net, AECR-Net, and FSDGN. This indicates that our method provides a balance between accuracy and complexity, effectively meeting the real-time requirements of UAV computing platforms.

4.8. Experiment of Object Detection

Object detection in hazy weather is a prominent focus of current research. To test the object detection performance of the proposed method after dehazing, we used the haze synthesis method in [20] to add haze to the UAV object detection datasets VisDrone 2019 [56] and AU-AIR [57]. After dehazing the remote sensing images, we tested the object detection performance using Yolov5s [58]. Object detection performance was evaluated using three metrics: precision (P), recall (R), and mean average precision (mAP). The results of the object detection experiments are presented in Table 6.
As shown in Table 6, the object detection accuracy of DCP+Yolov5s is the lowest on the VisionDrone 2019 dataset, with the P-value, R-value, and mAP recorded at 63.94%, 45.40%, and 46.73%, respectively. This result suggests that while the DCP algorithm is capable of image dehazing, the quality of the processed images is insufficient, thereby negatively impacting object detection. In contrast, RefineDNet+Yolov5s achieves the highest detection accuracy on the same dataset, indicating that RefineDNet’s dehazing process produces superior image quality compared to other methods, significantly enhancing target detection performance. Notably, our proposed UAVD-Net method shows a substantial improvement in object detection accuracy, with the P-value, R-value, and mAP reaching 80.23%, 71.71%, and 71.45%, respectively. This result strongly supports the effectiveness of the UAVD-Net dehazing algorithm in improving image clarity and enhancing object features, further validating its superiority in complex environments. These findings demonstrate that UAVD-Net not only effectively enhances visual image quality but also significantly boosts object detection accuracy, underscoring its potential and advantages in practical applications.
As shown in Table 6, FSDGN+Yolov5s records the lowest object detection accuracy on the AU-AIR dataset, with the P-value, R-value, and mAP at 75.27%, 60.46%, and 61.63%, respectively, suggesting that the FSDGN algorithm’s dehazing performance is insufficient, thereby impacting detection accuracy. In contrast, EDED-Net+Yolov5s achieves the highest detection accuracy, demonstrating superior image quality post-dehazing and significantly enhancing detection performance. Notably, our proposed UAVD-Net method shows a marked improvement in object detection accuracy, with the P-value, R-value, and mAP reaching 82.29%, 73.05%, and 73.46%, respectively. These results indicate that the UAVD-Net algorithm excels not only in enhancing image clarity and object features but also in significantly improving object detection accuracy, underscoring its superiority and potential for practical application in complex environments.

5. Discussion

Although the proposed model demonstrates superior dehazing performance compared to existing lightweight networks, it inevitably incurs a moderate computational overhead due to the incorporation of hierarchical Transformer blocks and multi-scale feature fusion. Specifically, the model comprises 16.3 million parameters and achieves a processing speed of 33.46 FPS on a single NVIDIA 2080Ti GPU, outperforming many current Transformer-based approaches in terms of efficiency. Nevertheless, it remains comparatively heavier than ultra-lightweight models such as AOD-Net (0.3M parameters, 49.59 FPS) and AECR-Net (2.61M parameters, 41.28 FPS).
This trade-off underscores a key design principle: prioritizing restoration quality while ensuring real-time inference capability on general-purpose GPUs. The proposed model is particularly well suited for applications demanding high visual fidelity, such as autonomous driving and UAV-based surveillance in adverse weather conditions. However, for deployment on resource-constrained edge devices, further model optimization is essential. In future work, we intend to investigate techniques such as network pruning, quantization, and knowledge distillation to develop a more lightweight variant of the model. Moreover, we are exploring dynamic inference strategies that adjust computational load based on haze severity, thereby enabling adaptable deployment across diverse hardware platforms. This balance between performance and complexity lays a solid foundation for both the model’s current applicability and its future scalability.

6. Conclusions

The UAVD-Net significantly enhances UAV remote sensing image dehazing by effectively merging global and local information, resulting in superior detail recovery and overall image quality. Utilizing a convolutional neural network in conjunction with a Transformer-based multi-layer global information-capturing (MGIC) module, the method efficiently extracts and integrates global features, thereby improving the model’s understanding of complex scenes. Simultaneously, the adaptive local information enhancement (ALIE) module within the local information extraction sub-network preserves texture details, further enhancing the dehazed images. The cross-channel feature fusion (CFF) module in the decoder facilitates seamless integration of global and local information, generating more natural and clearer dehazed images. Experimental results demonstrate that this method outperforms existing techniques in addressing the challenge of non-homogeneous haze, showcasing strong potential for practical application.
Future work will focus on further improving dehazing performance and exploring optimization strategies under diverse environmental conditions.

Author Contributions

Conceptualization, C.L. and S.Z.; methodology, C.L.; software, T.W.; validation, C.L. and S.Z.; formal analysis, S.Z.; investigation, J.S.; resources, F.G.; data curation, C.L.; writing—original draft preparation, C.L.; writing—review and editing, S.Z.; visualization, S.Z.; supervision, J.S.; project administration, S.Z.; funding acquisition, S.Z. All authors have read and agreed to the published version of the manuscript.

Funding

This research was funded by the One Hundred Person Project of the Shaanxi, grant number 10253180002.

Data Availability Statement

The raw data supporting the conclusions of this article will be made available by the authors on request.

Conflicts of Interest

The authors declare no conflicts of interest.

References

  1. Li, G.; Li, J.; Chen, G.; Wang, Z.; Jin, S.; Ding, C.; Zhang, W. Delving deeper into image dehazing: A survey. IEEE Access 2023, 11, 131759–131774. [Google Scholar] [CrossRef]
  2. Wang, P.; Zhu, H.; Huang, H.; Zhang, H.; Wang, N. Tms-gan: A twofold multi-scale generative adversarial network for single image dehazing. IEEE Trans. Circuits Syst. Video Technol. 2022, 32, 2760–2772. [Google Scholar] [CrossRef]
  3. Wang, J.; Lu, K.; Xue, J.; He, N.; Shao, L. Single image dehazing based on the physical model and msrcr algorithm. IEEE Trans. Circuits Syst. Video Technol. 2018, 28, 2190–2199. [Google Scholar] [CrossRef]
  4. Thanh, D.N.; Hue, N.M.; Prasath, V.S. Single image dehazing based on adaptive histogram equalization and linearization of gamma correction. In Proceedings of the 2019 25th Asia-Pacific Conference on Communications (APCC), Ho Chi Minh City, Vietnam, 6–8 November 2019; IEEE: New York, NY, USA, 2019; pp. 36–40. [Google Scholar]
  5. Rong, Z.; Jun, W.L. Improved wavelet transform algorithm for single image dehazing. Optik 2014, 125, 3064–3066. [Google Scholar] [CrossRef]
  6. Howard, J.N. Scattering phenomena: Optics of the atmosphere. Science 1977, 196, 1084–1085. [Google Scholar] [CrossRef] [PubMed]
  7. Liu, Y.; Yin, H.; Chong, A.; Wan, J. Reference-based image dehazing with internal and external contrastive learning. IEEE Trans. Circuits Syst. Video Technol. 2024, 34, 6092–6104. [Google Scholar] [CrossRef]
  8. He, K.; Sun, J.; Tang, X. Single image haze removal using dark channel prior. IEEE Trans. Pattern Anal. Mach. 2010, 33, 2341–2353. [Google Scholar]
  9. Zhu, Q.; Mai, J.; Shao, L. A fast single image haze removal algorithm using color attenuation prior. IEEE Trans. Image Process. 2015, 24, 3522–3533. [Google Scholar]
  10. Meng, G.; Wang, Y.; Duan, J.; Xiang, S.; Pan, C. Efficient image dehazing with boundary constraint and contextual regularization. In Proceedings of the IEEE International Conference on Computer Vision, Sydney, Australia, 1–8 December 2013; pp. 617–624. [Google Scholar]
  11. Cai, B.; Xu, X.; Jia, K.; Qing, C.; Tao, D. Dehazenet: An end-to-end system for single image haze removal. IEEE Trans. Image Processing 2016, 25, 5187–5198. [Google Scholar] [CrossRef]
  12. Li, B.; Peng, X.; Wang, Z.; Xu, J.; Feng, D. Aod-net: All-in-one dehazing network. In Proceedings of the IEEE International Conference on Computer Vision, Venice, Italy, 22–29 October 2017; pp. 4770–4778. [Google Scholar]
  13. Chen, D.; He, M.; Fan, Q.; Liao, J.; Zhang, L.; Hou, D.; Yuan, L.; Hua, G. Gated context aggregation network for image dehazing and deraining. In Proceedings of the 2019 IEEE Winter Conference on Applications of Computer Vision (WACV), Waikoloa Village, HI, USA, 7–11 January 2019; IEEE: New York, NY, USA, 2019; pp. 1375–1383. [Google Scholar]
  14. Qin, X.; Wang, Z.; Bai, Y.; Xie, X.; Jia, H. Ffa-net: Feature fusion attention network for single image dehazing. In Proceedings of the AAAI Conference on Artificial Intelligence, New York, NY, USA, 9–11 February 2020; Volume 34, pp. 11908–11915. [Google Scholar]
  15. Dong, Y.; Liu, Y.; Zhang, H.; Chen, S.; Qiao, Y. Fd-gan: Generative adversarial networks with fusion-discriminator for single image dehazing. In Proceedings of the AAAI Conference on Artificial Intelligence, New York, NY, USA, 9–11 February 2020; Volume 34, pp. 10729–10736. [Google Scholar]
  16. Wu, H.; Qu, Y.; Lin, S.; Zhou, J.; Qiao, R.; Zhang, Z.; Xie, Y.; Ma, L. Contrastive learning for compact single image dehazing. In Proceedings of the IEEE/CVF Conference on Computer Vision and Pattern Recognition, Nashville, TN, USA, 20–25 June 2021; pp. 10551–10560. [Google Scholar]
  17. Song, Y.; Zhou, Y.; Qian, H.; Du, X. Rethinking performance gains in image dehazing networks. arXiv 2022, arXiv:2209.11448. [Google Scholar]
  18. Zheng, Y.; Zhan, J.; He, S.; Dong, J.; Du, Y. Curricular contrastive regularization for physics-aware single image dehazing. In Proceedings of the IEEE/CVF Conference on Computer Vision and Pattern Recognition, Vancouver, BC, Canada, 17–24 June 2023; pp. 5785–5794. [Google Scholar]
  19. Guo, C.-L.; Yan, Q.; Anwar, S.; Cong, R.; Ren, W.; Li, C. Image dehazing transformer with transmission-aware 3d position embedding. In Proceedings of the IEEE/CVF Conference on Computer Vision and Pattern Recognition, New Orleans, LA, USA, 18–24 June 2022; pp. 5812–5820. [Google Scholar]
  20. Song, Y.; He, Z.; Qian, H.; Du, X. Vision transformers for single image dehazing. IEEE Trans. Image Process. 2023, 32, 1927–1941. [Google Scholar] [CrossRef] [PubMed]
  21. Liu, Z.; Lin, Y.; Cao, Y.; Hu, H.; Wei, Y.; Zhang, Z.; Lin, S.; Guo, B. Swin transformer: Hierarchical vision transformer using shifted windows. In Proceedings of the IEEE/CVF International Conference on Computer Vision, Montreal, BC, Canada, 11–17 October 2021; pp. 10012–10022. [Google Scholar]
  22. Ronneberger, O.; Fischer, P.; Brox, T. U-net: Convolutional networks for biomedical image segmentation. In Proceedings of the Medical Image Computing and Computer-Assisted Intervention–MICCAI 2015: 18th International Conference, Munich, Germany, 5–9 October 2015; Proceedings, Part III 18. Springer: Berlin/Heidelberg, Germany, 2015; pp. 234–241. [Google Scholar]
  23. Zheng, R.; Zhang, L. Uav image haze removal based on saliency- guided parallel learning mechanism. IEEE Geosci. Remote Sens. Lett. 2023, 20, 6001105. [Google Scholar] [CrossRef]
  24. Lin, D.; Xu, G.; Wang, X.; Wang, Y.; Sun, X.; Fu, K. A remote sensing image dataset for cloud removal. arXiv 2019, arXiv:1901.00600. [Google Scholar]
  25. Huang, B.; Li, Z.; Yang, C.; Sun, F.; Song, Y. Single satellite optical imagery dehazing using sar image prior based on conditional generative adversarial networks. In Proceedings of the 2020 IEEE Winter Conference on Applications of Computer Vision (WACV), Snowmass Village, CO, USA, 1–5 March 2020; pp. 1795–1802. [Google Scholar]
  26. Hang, F.; Ling, Z.; Sun, G.; Ren, J.; Zhang, A.; Zhang, L.; Jia, X. HyperDehazing: A hyperspectral image dehazing benchmark dataset and a deep learning model for haze removal. Isprs J. Photogramm. Remote Sens. 2024, 218, 663–677. [Google Scholar]
  27. Kim, J.-H.; Sim, J.-Y.; Kim, C.-S. Single image dehazing based on contrast enhancement. In Proceedings of the 2011 IEEE International Conference on Acoustics, Speech and Signal Processing (ICASSP), Prague, Czech Republic, 22–27 May 2011; pp. 1273–1276. [Google Scholar]
  28. Long, J.; Shi, Z.; Tang, W.; Zhang, C. Single remote sensing image dehazing. IEEE Geosci. Remote Sens. Lett. 2014, 11, 59–63. [Google Scholar] [CrossRef]
  29. Wang, A.; Wang, W.; Liu, J.; Gu, N. Aipnet: Image-to-image single image dehazing with atmospheric illumination prior. IEEE Trans. Image Process. 2019, 28, 381–393. [Google Scholar] [CrossRef] [PubMed]
  30. Zhang, X.-S.; Yu, Y.-B.; Yang, K.-F.; Li, Y.-J. A fish retina-inspired single image dehazing method. IEEE Trans. Circuits Syst. Video Technol. 2022, 32, 1875–1888. [Google Scholar] [CrossRef]
  31. Zhang, Y.; Wang, P.; Fan, Q.; Bao, F.; Yao, X.; Zhang, C. Single image numerical iterative dehazing method based on local physical features. IEEE Trans. Circuits Syst. Video Technol. 2020, 30, 3544–3557. [Google Scholar] [CrossRef]
  32. Song, X.; Zhou, D.; Li, W.; Ding, H.; Dai, Y.; Zhang, L. Wsamf-net: Wavelet spatial attention-based multistream feedback network for single image dehazing. IEEE Trans. Circuits Syst. Video Technol. 2023, 33, 575–588. [Google Scholar] [CrossRef]
  33. Sun, H.; Yao, Z.; Du, B.; Han, J.; Ren, D.; Tong, L. Spatial–Frequency Residual-Guided Dynamic Perceptual Network for Remote Sensing Image Haze Removal. IEEE Trans. Geosci. Remote Sens. 2025, 63, 1–16. [Google Scholar] [CrossRef]
  34. Zhang, Y.; Zhou, S.; Li, H. Depth Information Assisted Collaborative Mutual Promotion Network for Single Image Dehazing. In Proceedings of the 2024 IEEE/CVF Conference on Computer Vision and Pattern Recognition (CVPR), Seattle, WA, USA, 16–22 June 2024; pp. 12846–12855. [Google Scholar]
  35. Sun, H.; Luo, Z.; Ren, D.; Du, B.; Chang, L.; Wan, J. Unsupervised multi-branch network with high-frequency enhancement for image dehazing. Pattern Recognit. 2024, 156, 110763. [Google Scholar] [CrossRef]
  36. Hong, Y.; Wu, Q.; Qi, Y.; Rodriguez-Opazo, C.; Gould, S. Vln bert: A recurrent vision-and-language bert for navigation. In Proceedings of the IEEE/CVF Conference on Computer Vision and Pattern Recognition, Nashville, TN, USA, 20–25 June 2021; pp. 1643–1653. [Google Scholar]
  37. Dosovitskiy, A.; Beyer, L.; Kolesnikov, A.; Weissenborn, D.; Zhai, X.; Unterthiner, T.; Dehghani, M.; Minderer, M.; Heigold, G.; Gelly, S.; et al. An image is worth 16x16 words: Transformers for image recognition at scale. arXiv 2020, arXiv:2010.11929. [Google Scholar]
  38. Dai, L.; Liu, H.; Tang, H.; Wu, Z.; Song, P. Ao2-detr: Arbitrary-oriented object detection transformer. IEEE Trans. Circuits Syst. Video Technol. 2023, 33, 2342–2356. [Google Scholar] [CrossRef]
  39. Cao, M.; Fan, Y.; Zhang, Y.; Wang, J.; Yang, Y. Vdtr: Video deblurring with transformer. IEEE Trans. Circuits Syst. Video Technol. 2023, 33, 160–171. [Google Scholar] [CrossRef]
  40. Subakan, C.; Ravanelli, M.; Cornell, S.; Bronzi, M.; Zhong, J. Attention is all you need in speech separation. In Proceedings of the ICASSP 2021—2021 IEEE International Conference on Acoustics, Speech and Signal Processing (ICASSP), Toronto, ON, Canada, 6–11 June 2021; pp. 21–25. [Google Scholar]
  41. Dong, P.; Wang, B. Transra: Transformer and residual attention fusion for single remote sensing image dehazing. Multidimens. Syst. Signal Process. 2022, 33, 1119–1138. [Google Scholar] [CrossRef]
  42. Yang, Y.; Zhang, H.; Wu, X.; Liang, X. Mstfdn: Multi-scale transformer fusion dehazing network. Appl. Intell. 2023, 53, 5951–5962. [Google Scholar] [CrossRef]
  43. Dong, W.; Zhou, H.; Wang, R.; Liu, X.; Zhai, G.; Chen, A.J. DehazeDCT: Towards Effective Non-Homogeneous Dehazing via Deformable Convolutional Transformer. In Proceedings of the 2024 IEEE/CVF Conference on Computer Vision and Pattern Recognition Workshops (CVPRW), Seattle, WA, USA, 17–18 June 2024; pp. 6405–6414. [Google Scholar]
  44. Wang, C.; Pan, J.; Lin, W.; Dong, J.; Wang, W.; Wu, X. Selfpromer: Self-prompt dehazing transformers with depth-consistency. In Proceedings of the AAAI Conference on Artificial Intelligence, Vancouver, BC, Canada, 20–27 February 2024; Volume 38, pp. 5327–5335. [Google Scholar]
  45. Woo, S.; Park, J.; Lee, J.; Kweon, I. CBAM: Convolutional Block Attention Module; Springer: Berlin/Heidelberg, Germany, 2018; pp. 3–19. [Google Scholar]
  46. Wang, Z.; Bovik, A.; Sheikh, H.; Simoncelli, E. Image quality assessment: From error visibility to structural similarity. IEEE Trans. Image Process. 2004, 13, 600–612. [Google Scholar] [CrossRef]
  47. Korhonen, J.; You, J. Peak signal-to-noise ratio revisited: Is simple beautiful? In Proceedings of the 2012 Fourth International Workshop on Quality of Multimedia Experience, Melbourne, Australia, 5–7 July 2012; pp. 37–38. [Google Scholar]
  48. Zhang, R.; Isola, P.; Efros, A.A.; Shechtman, E.; Wang, O. The unreasonable effectiveness of deep features as a perceptual metric. In Proceedings of the 2018 IEEE/CVF Conference on Computer Vision and Pattern Recognition, Salt Lake City, UT, USA, 18–23 June 2018; pp. 586–595. [Google Scholar]
  49. Chen, Z.; Wang, Y.; Yang, Y.; Liu, D. Psd: Principled synthetic-to-real dehazing guided by physical priors. In Proceedings of the IEEE/CVF Conference on Computer Vision and Pattern Recognition, Nashville, TN, USA, 20–25 June 2021; pp. 7180–7189. [Google Scholar]
  50. Zhao, S.; Zhang, L.; Shen, Y.; Zhou, Y. Refinednet: A weakly supervised refinement framework for single image dehazing. IEEE Trans. Image Process. 2021, 30, 3391–3404. [Google Scholar] [CrossRef]
  51. Yu, H.; Zheng, N.; Zhou, M.; Huang, J.; Xiao, Z.; Zhao, F. Frequency and spatial dual guidance for image dehazing. In Proceedings of the European Conference on Computer Vision, Tel Aviv, Israel, 23–27 October 2022; pp. 181–198. [Google Scholar]
  52. Chi, K.; Yuan, Y.; Wang, Q. Trinity-net: Gradient-guided swin transformer-based remote sensing image dehazing and beyond. IEEE Trans. Geosci. Remote Sens. 2023, 61, 1–14. [Google Scholar] [CrossRef]
  53. Wen, Y.; Gao, T.; Zhang, J.; Li, Z.; Chen, T. Encoder-free multiaxis physics-aware fusion network for remote sensing image dehazing. IEEE Trans. Geosci. Remote Sens. 2023, 61, 1–15. [Google Scholar] [CrossRef]
  54. Dong, W.; Wang, C.; Sun, H.; Teng, Y.; Liu, H.; Zhang, Y.; Zhang, K.; Li, X.; Xu, X. End-to-end detail-enhanced dehazing network for remote sensing images. Remote Sens. 2024, 16, 225. [Google Scholar] [CrossRef]
  55. Zheng, Y.; Su, J.; Zhang, S.; Tao, M.; Wang, L. Dehaze-tggan: Transformer-guide generative adversarial networks with spatial-spectrum attention for unpaired remote sensing dehazing. IEEE Trans. Geosci. Remote Sens. 2024, 62, 5634320. [Google Scholar] [CrossRef]
  56. Du, D.; Zhu, P.; Wen, L.; Bian, X.; Ling, H.; Hu, Q.; Zheng, J.; Peng, T.; Wang, X.; Zhang, Y.; et al. Visdrone-sot2019: The vision meets drone single object tracking challenge results. In Proceedings of the 2019 IEEE/CVF International Conference on Computer Vision Workshop (ICCVW), Seoul, Republic of Korea, 27–28 October 2019; pp. 199–212. [Google Scholar]
  57. Bozcan, I.; Kayacan, E. Au-air: A multi-modal unmanned aerial vehicle dataset for low altitude traffic surveillance. In Proceedings of the 2020 IEEE International Conference on Robotics and Automation (ICRA), Paris, France, 31 May–31 August 2020; pp. 8504–8510. [Google Scholar]
  58. Jocher, G. Ultralytics Yolov5. 2020. Available online: https://github.com/ultralytics/yolov5 (accessed on 3 June 2020).
Figure 1. The dehazing performance of our method is compared with state-of-the-art methods using the UAV datasets. The horizontal axis denotes the peak signal-to-noise ratio (PSNR), where an elevated value signifies superior performance in terms of image quality preservation; the vertical axis indicates the frames per second (FPS), with a higher value suggesting enhanced real-time processing capability.
Remotesensing 17 01688 g001
Figure 2. The architecture of the proposed UAVD-Net comprises three main components: encoder, decoder, and texture detail feature extraction. It integrates MGIC (multi-level global information-capturing module), ALIE (adaptive local information enhancement module), and CFF (cross-channel feature fusion module).
Remotesensing 17 01688 g002
Figure 3. Structure of the MGIC. (a) Structure of the Multi-Level Encoder; (b) Structure of the Dehazing Enhancement Layer.
Remotesensing 17 01688 g003
Figure 4. Structure of the ALIE.
Remotesensing 17 01688 g004
Figure 5. Structure of the CFF.
Remotesensing 17 01688 g005
Figure 6. Comparison of dehazing performance with different loss functions. (a) Haze image; (b) L SSIM ; (c) L perceptual ; (d) L adv ; (e) L ours .
Remotesensing 17 01688 g006
Figure 7. Visualization of the dehazing results on the UAV dataset. (a) Haze image; (b) DCP [8]; (c) AOD-Net [12]; (d) AECR-Net [16]; (e) Dehamer [19]; (f) PSD [49]; (g) RefineDNet [50]; (h) DehazeFormer [20]; (i) FSDGN [51]; (j) Trinity-Net [52]; (k) DSTOS [23]; (l) EMPF-Net [53]; (m) EDED-Net [54]; (n) Dehaze-TGGAN [55]; (o) UAVD-Net.
Remotesensing 17 01688 g007
Figure 8. Visualization of the dehazing results on the RICE-I dataset. (a) Haze image; (b) Ground Truth; (c) DCP [8]; (d) AOD-Net [12]; (e) AECR-Net [16]; (f) Dehamer [19]; (g) PSD [49]; (h) RefineDNet [50]; (i) DehazeFormer [20]; (j) FSDGN [51]; (k) Trinity-Net [52]; (l) DSTOS [23]; (m) EMPF-Net [53]; (n) EDED-Net [54]; (o) Dehaze-TGGAN [55]; (p) UAVD-Net.
Remotesensing 17 01688 g008
Figure 9. Visualization of the dehazing results on the RS-Haze dataset. (a) Haze image; (b) Ground truth; (c) DCP [8]; (d) AOD-Net [12]; (e) AECR-Net [16]; (f) Dehamer [19]; (g) PSD [49]; (h) RefineDNet [50]; (i) DehazeFormer [20]; (j) FSDGN [51]; (k) Trinity-Net [52]; (l) DSTOS [23]; (m) EMPF-Net [53]; (n) EDED-Net [54]; (o) Dehaze-TGGAN [55]; (p) UAVD-Net.
Remotesensing 17 01688 g009
Figure 10. Visualization of the dehazing results on the SateHaze1k dataset. (a) Haze image; (b) Ground truth; (c) DCP [8]; (d) AOD-Net [12]; (e) AECR-Net [16]; (f) Dehamer [19]; (g) PSD [49]; (h) RefineDNet [50]; (i) DehazeFormer [20]; (j) FSDGN [51]; (k) Trinity-Net [52]; (l) DSTOS [23]; (m) EMPF-Net [53]; (n) EDED-Net [54]; (o) Dehaze-TGGAN [55]; (p) UAVD-Net.
Remotesensing 17 01688 g010
Figure 11. Visualization results of complexity experiments. (a) Stacked histogram of FPS for all methods; (b) Radar graph of the number of parameters for all methods.
Remotesensing 17 01688 g011
Table 1. Ablation experiment on UAV and RS-Haze datesets. The best performance on each dataset is displayed in Red. ↑ Means that larger values are better, and ↓ means that smaller values are better.
BaselineMGICALIECFF L ours UAVRS-Haze
SSIMPSNRLPIPSSSIMPSNRLPIPS
0.751218.590.43870.784519.210.3983
0.835323.460.29260.884424.190.2316
0.875927.140.21940.916928.410.1930
0.904830.560.19740.925531.190.1724
0.935132.630.17340.941133.530.1575
Table 2. Quantitative experiments on real-world datasets. The best three performances on each dataset are displayed in Red, Cyan, and Purple. ↑ Means that larger values are better, and ↓ means that smaller values are better.
MethodsUAVRICE-I
PSNRSSIMLPIPSPSNRSSIMLPIPS
DCP [8]18.140.74360.491118.090.71050.4870
AOD-Net [12]19.780.79020.413019.650.79640.4254
AECR-Net [16]25.690.85550.296825.140.84220.3186
Dehamer [19]21.340.82930.352120.960.80350.3795
PSD [49]19.120.75920.454219.030.74800.4445
RefineDNet [50]26.160.86790.299725.930.85430.3001
DehazeFormer [20]26.730.88100.274626.230.87770.2944
FSDGN [51]27.950.90270.253727.290.89600.2532
Trinity-Net [52]27.680.89560.250427.320.86590.2778
DSTOS [23]28.130.90450.235628.090.89640.2412
EMPF-Net [53]23.540.84390.312323.330.84010.3321
EDED-Net [54]31.230.91890.204130.880.90460.2079
Dehaze-TGGAN [55]29.320.90760.226129.050.89770.2407
UAVD-Net32.630.93510.173432.050.93090.1828
Table 3. Quantitative experiments on synthetic datasets. The best three performances on each dataset are displayed in Red, Cyan, and Purple. ↑ Means that larger values are better, and ↓ means that smaller values are better.
MethodsRS-HazeSateHaze1k
PSNRSSIMLPIPSPSNRSSIMLPIPS
DCP [8]18.990.75150.483319.120.76230.4784
AOD-Net [12]20.230.79310.438020.340.80210.4288
AECR-Net [16]24.190.84750.306825.090.84480.3207
Dehamer [19]22.310.83250.342421.510.82960.3769
PSD [49]19.990.77190.413720.840.76790.4162
RefineDNet [50]27.430.88430.278927.760.86260.2974
DehazeFormer [20]27.550.89610.271028.010.87840.2863
FSDGN [51]28.490.90920.253329.120.89810.2596
Trinity-Net [52]28.240.89560.245828.770.88710.2583
DSTOS [23]29.390.90260.213030.040.91200.2142
EMPF-Net [53]25.840.88740.228826.080.89170.2364
EDED-Net [54]32.630.93600.189233.740.93040.1612
Dehaze-TGGAN [55]30.250.92180.198531.970.92400.1726
UAVD-Net33.530.94110.157534.230.95930.1465
Table 4. Quantitative experiments on HyperDehazing datasets. The best three performances on each dataset are displayed in Red, Cyan, and Purple. ↑ Means that larger values are better, and ↓ means that smaller values are better.
MethodsPSNR ↑SSIM ↑LPIPS ↓
DCP [8]20.130.81230.4447
AOD-Net [12]23.470.84150.4365
AECR-Net [16]24.810.88360.3519
Dehamer [19]24.140.87730.3809
PSD [49]21.290.85420.4124
RefineDNet [50]28.890.91930.2882
DehazeFormer [20]28.690.92180.2788
FSDGN [51]29.150.91240.2777
Trinity-Net [52]29.080.89820.2461
DSTOS [23]31.840.91630.2206
EMPF-Net [53]26.360.89460.2237
EDED-Net [54]36.910.94530.1791
Dehaze-TGGAN [55]35.140.93490.1834
UAVD-Net37.830.96720.1376
Table 5. Results of complexity experiment (600 × 400). The best three performances on each dataset are displayed in Red, Cyan, and Purple. ↑ Means that larger values are better, and ↓ means that smaller values are better.
MethodsParams ↓FPS ↑
UAVRICE-I
DCP [8]1.131.05
AOD-Net [12]0.3M49.5948.12
AECR-Net [16]2.61M41.2840.56
Dehamer [19]67M9.459.12
PSD [49]29.8M21.3921.11
RefineDNet [50]21.3M24.8824.39
DehazeFormer [20]17.5M28.2527.93
FSDGN [51]12M38.4638.29
Trinity-Net [52]28M22.9322.49
DSTOS [23]50M12.7312.64
EMPF-Net [53]33M18.3217.99
EDED-Net [54]25M23.4723.13
Dehaze-TGGAN [55]62M10.8310.54
UAVD-Net16.3M33.4632.91
Table 6. Results of object detection experiment (%). The best three performances on each dataset are displayed in Red, Cyan, and Purple. ★ Represents Yolov5s. ↑ Means that larger values are better, and ↓ means that smaller values are better.
MethodsVisDrone 2019AU-AIR
PRmAPPRmAP
DCP [8] + ★63.9445.4046.7666.6647.7547.97
AOD-Net [12] + ★67.1451.3550.9267.5751.4150.96
AECR-Net [16] + ★71.0553.4855.1572.1255.7258.54
Dehamer [19] + ★68.1852.6752.6968.6263.0153.58
PSD [49] + ★67.0951.1249.8866.9950.8950.36
RefineDNet [50] + ★72.1255.5456.4473.1756.4857.01
DehazeFormer [20] + ★73.7557.6268.5374.1358.7658.97
FSDGN [51] + ★75.0159.4060.7175.2760.4661.63
Trinity-Net [52] + ★75.7060.7760.9076.0861.7162.54
DSTOS [23] + ★77.2163.3864.0677.8164.0264.82
EMPF-Net [53] + ★74.1159.2360.9775.3761.3161.85
EDED-Net [54] + ★79.4568.6369.1080.3869.6770.42
Dehaze-TGGAN [55] + ★78.9967.8668.6979.8068.9170.10
UAVD-Net + ★80.2371.7171.4582.2973.0573.46
Disclaimer/Publisher’s Note: The statements, opinions and data contained in all publications are solely those of the individual author(s) and contributor(s) and not of MDPI and/or the editor(s). MDPI and/or the editor(s) disclaim responsibility for any injury to people or property resulting from any ideas, methods, instructions or products referred to in the content.

