Article

Volcanic Activity Classification Through Semi-Supervised Learning Applied to Satellite Radiance Time Series

Istituto Nazionale di Geofisica e Vulcanologia, Piazza Roma 2, 95125 Catania, Italy
*
Author to whom correspondence should be addressed.
Remote Sens. 2025, 17(10), 1679; https://doi.org/10.3390/rs17101679 (registering DOI)
Submission received: 26 March 2025 / Revised: 28 April 2025 / Accepted: 8 May 2025 / Published: 10 May 2025
(This article belongs to the Special Issue Satellite Monitoring of Volcanoes in Near-Real Time)

Abstract

:
Satellite imagery provides a rich source of information that serves as a comprehensive and synoptic tool for the continuous monitoring of active volcanoes, including those in remote and inaccessible areas. The huge influx of such data requires the development of automated systems for efficient processing and interpretation. Early warning systems, designed to process satellite imagery to identify signs of impending eruptions and monitor eruptive activity in near real-time, are essential for hazard assessment and risk mitigation. Here, we propose a machine learning approach for the automatic classification of pixels in SEVIRI images to detect and characterize the eruptive activity of a volcano. In particular, we exploit a semi-supervised GAN (SGAN) model that retrieves the presence of thermal anomalies, volcanic ash plumes, and meteorological clouds in each SEVIRI pixel, allowing time series plots to be obtained showing the evolution of volcanic activity. The SGAN model was trained and tested using the huge amount of data available on Mount Etna (Italy). Then, it was applied to other volcanoes, specifically, Stromboli (Italy), Tajogaite (Spain), and Nyiragongo (Democratic Republic of the Congo), to assess the model’s ability to generalize. The validation of the model was performed through a visual comparison between the classification results and the corresponding SEVIRI images. Moreover, we evaluate the model performance by calculating three different metrics, namely the precision (correctness of positive predictions), the recall (ability to find all the positive instances), and the F1-score (general model’s accuracy), finding an average accuracy of 0.9. Our approach can be extended to other geostationary satellite data and applied worldwide to characterize volcanic activity, allowing the monitoring of even remote volcanoes that are difficult to reach from the ground.

1. Introduction

The accurate interpretation of pre-eruptive and eruptive signals describing volcanic dynamics poses a substantial challenge within Earth Sciences due to the complex nature of volcanic systems. Achieving this target is crucial for a careful assessment of the volcanic hazard and the implementation of effective risk mitigation strategies [1]. Volcano monitoring for eruption forecasting usually involves tracking seismic activity, ground deformation, gas emissions, and temperature changes [2]. These observations help identify early signs of an impending eruption, enabling timely warnings and the implementation of preventive measures to protect communities and infrastructures [3].
Recent advances in satellite technology have revolutionized volcano monitoring capabilities [4], providing synoptic, real-time observations of several volcano-related signals, e.g., ground deformation, gas emissions, and thermal anomalies. Indeed, satellite remote sensing techniques, like interferometric synthetic aperture radar (InSAR) and multi-spectral imaging, allow scientists to detect subtle modifications in a volcano’s surface and temperature, which may indicate a change in the state of activity, possibly leading to an eruption [5,6].
While satellite observations are particularly valuable for observing well-monitored as well as remote or inaccessible volcanoes, the vast amount and heterogeneity of these data require automated and rapid approaches to accurately identify and characterize the various signals crucial for the effectiveness of any operational volcano monitoring system [7]. That is why the combination of Earth observation (EO) satellite data and artificial intelligence (AI) techniques has recently emerged as an interesting solution for observing and predicting changes in the state of a volcano, to deepen the understanding of volcanic phenomena and improve the associated risk-management strategies [8].
AI techniques have proven to be a rapidly growing trend in data analysis, particularly for handling large datasets [9]. Advanced AI technologies, such as machine learning (ML) and deep learning (DL), offer significant potential to enhance data management efficiency [10]. Both ML and DL involve algorithms that learn from structured and unstructured data, where representative features are carefully selected and extracted during the input feature design phase [11,12]. The integration of ML and DL with traditional volcanic monitoring techniques enhances the accuracy of signal classification and may improve the timeliness of eruption warnings [13]. ML and DL, particularly through neural networks, are essential for analyzing complex data, and their effectiveness in identifying volcanic features from both in situ and satellite observations has already been demonstrated [14,15,16,17,18,19,20]. Their application to satellite data have significantly advanced the monitoring of volcanic activity across various data types, including deformation data to detect subtle ground displacements in volcanic areas [21], volcanic cloud data to classify ash clouds and estimate volcanic particle mass [22,23], and thermal data to identify and characterize thermal anomalies [24].
ML algorithms are mainly divided into two categories, unsupervised and supervised. Unsupervised algorithms operate on unlabeled datasets without requiring a preliminary training phase. This makes it possible to analyze large volumes of data without the constraint of labeling [25], but they do not always succeed in finding solutions to complex classification problems, characterized by noisy data that do not allow the true relationships between variables to be identified [26]. On the other hand, supervised ML algorithms require a training phase on labeled datasets, where each input is associated with a known output. This approach offers significant advantages, including high performance and clear interpretation of results. However, it also presents some limitations, such as the need for a large volume of labeled data, the collection of which can be costly and labor intensive. Furthermore, the intrinsic complexity of volcanic phenomena increases the risk of labeling errors, further compromising the reliability of the models [27].
One of the biggest problems with supervised learning in the case of volcanic eruptions is the small amount of training data, due to the relatively small number of recent eruptions (e.g., observed with the latest EO capabilities), especially in comparison to the countless phenomena that can be observed. In this scenario, semi-supervised learning, a branch of ML that combines supervised and unsupervised learning for classification tasks, offers a promising solution. These algorithms use a small amount of labeled data alongside a large set of unlabeled data. This approach not only optimizes the use of available information but also reduces the time and costs associated with labeling, while simultaneously decreasing the risk of errors [28].
In this study, we propose a novel classification algorithm for assessing volcanic activity by leveraging spinning enhanced visible infrared imager (SEVIRI) satellite imagery combined with semi-supervised machine learning techniques. Specifically, we utilize a semi-supervised generative adversarial network (SGAN) model [29] to classify the SEVIRI pixels in a determined volcanic area and the whole scene, as a result of the overall evaluation of individual pixel classification. In the following, we describe the data used, the methodology developed, and some applications in different volcanoes, specifically, Etna, Stromboli, Tajogaite, and Nyiragongo.

2. Materials and Methods

2.1. Dataset

The spinning enhanced visible and infrared imager (SEVIRI) sensor aboard the geostationary satellite MSG (Meteosat Second Generation) acquires data every 15 (full disk) to 5 min (RSS rapid scanning service, ⅓ of the disk) in 11 channels at a spatial resolution of 3 km at the nadir (see Table 1 for details on the spectral channels), plus one panchromatic HRV channel at a resolution of 1 km at the nadir.
Each SEVIRI channel is designed to detect specific atmospheric and terrestrial phenomena [30]. For example, the IR3.9 μm channel in the middle infrared (MIR) is particularly sensitive to thermal radiation emitted by the Earth surface and clouds, and is used to detect thermal anomalies, such as fires and volcanic eruptions. The IR8.7 μm channel plays an important role in detecting atmospheric dust and in distinguishing low clouds, particularly for identifying aerosols like desert dust or volcanic ash; this channel is also useful for monitoring arid surfaces. The IR10.8 μm channel in the thermal infrared (TIR) is often considered one of the primary tools for analyzing temperature and thermal emission, used in applications ranging from cloud analysis to the evaluation of surface temperatures. The IR12.0 μm channel, while having similar functions, allows for a better distinction between high and low clouds, by exploiting the different emissive properties of clouds in these wavelengths. However, in the case of large, high-temperature events, such as wildfires and volcanic eruptions, SEVIRI’s IR3.9 and IR10.8 channels can saturate. For the IR3.9 channel, the saturation brightness temperature is 335 K, with a saturation radiance value of approximately 3.6 mW   m 2   sr 1 ( cm 1 ) 1 . For the IR10.8 channel, the saturation brightness temperature is also 335 K, with a saturation radiance value of approximately 124.5 mW   m 2   sr 1 ( cm 1 ) 1 [31].
In addition to individual spectral channels, the combination of band differences has also been considered to further improve the detection of specific phenomena. The difference between IR12.0 and IR10.8 μm allows atmospheric dust to be detected, such as sandstorms or volcanic ash, as dust has different emission properties at wavelengths of 10.8 and 12.0 μm. This difference is particularly useful for identifying aerosols that may escape detection by a single channel and for distinguishing high clouds from low clouds, enhancing the vertical analysis of atmospheric conditions. Another significant difference is between IR10.8 and IR8.7 μm, used to distinguish between ice clouds and water clouds, as ice crystals and water droplets emit radiation differently in these wavelengths. This also allows the detection of high, thin clouds like cirrus, which are often difficult to identify with other bands.
Despite the relatively low spatial resolution of the data provided by the SEVIRI instrument [32], its exceptional temporal resolution represents a significant advantage in observing transient volcanic phenomena. It allows for near real-time monitoring of volcanic events, such as plume dynamics, which can vary rapidly and require frequent observation to fully understand their development patterns [33]. Furthermore, SEVIRI is capable of detecting the formation of lava fields associated with lava fountains, providing crucial information on how these events manifest and interact with the surrounding environment [34,35,36]. This capability makes SEVIRI a unique tool for monitoring and assessing volcanic hazard.
Preprocessing steps include the calibration and wavelength normalization of the different bands in order to standardize the values, making them comparable across different channels [37]. We built the dataset to be ingested by the ML including the channels at 3 km spatial resolution and the channel differences ‘IR12.0-IR10.8’ and ‘IR10.8-IR8.7’, providing a total of 13 columns (the first 11 SEVIRI channels plus the two differences mentioned) that were then normalized between 0 and 1.

2.2. Case Studies

We applied our model to four active volcanoes imaged within the SEVIRI disk: Etna (Italy), Stromboli (Italy), Tajogaite (La Palma, Spain), and Nyiragongo (DRC) (Figure 1).
Mount Etna is one of the most active volcanoes in the world and serves as a natural laboratory for studying volcanic dynamics. Its persistent activity, characterized by degassing and explosive eruptions at the summit craters—Voragine (VOR), Bocca Nuova (BN), South-East Crater (SEC), and North-East Crater (NEC)—along with frequent lateral eruptions [38], makes Etna an ideal case for analysis using satellite remote sensing techniques and AI. In particular, we can identify three main types of eruptive activity: (i) short-lasting paroxysmal eruptions, characterized by explosive activity with lava fountaining, lava overflows from the summit craters, and the formation of several km high ash-columns; (ii) sub-terminal eruptions, where lava flows are emitted at vents located at the base of summit craters, with no or modest explosive activity at summit craters and emission of volcanic ash; (iii) flank eruptions, characterized by emission of lava flows from eruptive fissures along the flank of the volcanic edifice, representing the most hazardous event for the population living nearby the volcano. The inter-eruptive periods are mainly characterized by degassing at the summit craters, with occasional ash emissions or weak explosions at summit craters that may precede a major phase of eruptive activity among those described above. We analyzed Etna’s eruptive activity from 2005 to 2008 and February 2021, a period marked by effusive and explosive events from the SEC, and the lateral eruptions of 2004–2005 and 2008–2009 [39,40].
Stromboli, located in the Tyrrhenian Sea off the northern coast of Sicily, is another very active volcano and is renowned for its nearly continuous eruptive activity. The eruptions at Stromboli are classified as “Strombolian” eruptions, which are characterized by the intermittent ejection of lava and volcanic gas, resulting in explosive bursts that send glowing fragments of lava into the air [41]. Here, we analyzed Stromboli’s paroxysmal event which occurred on 3 July 2019, and which generated two pyroclastic density currents that advanced for about 1 km across the sea beyond the coastline. The eruptive column rose for about 4 km above the summit and was accompanied by an intense fall of scoriae and pumice, mostly around the village of Ginostra in the southwestern sector of the volcano [42].
Tajogaite is the most recent cone formed on Cumbre Vieja, an important volcanic ridge located on the island of La Palma in the Canary Islands. The eruption of Tajogaite began on 19 September 2021, and lasted for 85 days, until 13 December. This event was the longest and most destructive ever recorded on the island, characterized by Strombolian explosions, lava fountains, emission of lava flows, and occasional phreatic explosions [43]. The eruption destroyed more than 2800 buildings and covered nearly 1000 hectares of agricultural land with lava and ash [44]. Cumbre Vieja, known for its complex geological history and significant eruptive activity, has experienced past explosive and effusive eruptions, with lava flows reaching the sea, as occurred in 1712, 1949, and 1971 [45].
Nyiragongo is an active stratovolcano located in the Virunga Mountains of the DRC, near the town of Goma and the Rwandan border. Known for its highly fluid lava and frequent eruptions, Nyiragongo is one of the most dangerous volcanoes in the world, with documented eruptive activity dating back to the 19th century. The most significant eruptions occurred in 1977, 1982, and most notably in 2002 [46,47]. Here, we analyzed the eruption of 22 May 2021, during which Nyiragongo erupted due to the opening of eruptive fissures on the volcano’s flanks, with the lava flowing towards the city of Goma, located about 20 km further south. Although the lava moved at a speed of around 1 km per hour, allowing people to evacuate, it destroyed and/or damaged more than 1000 households in the northern outskirts of the city. The eruption ended on 23 May, with the lava flow stopping a few hundred meters from the international airport [48].

2.3. General Architecture of an SGAN Model

In order to classify various volcanic states based on SEVIRI observations, we employed an algorithm of semi-supervised learning called semi-supervised generative adversarial network (SGAN).
Semi-supervised learning addresses the problem where a classification model is required, but there are few labeled examples and many unlabeled examples. The model learns from the small set of labeled examples and leverages the larger set of unlabeled examples to generalize to the classification of new examples in the future.
In the generative adversarial network (GAN), two neural networks (a generator and a discriminator) compete in a zero-sum game, where one network’s gain is the other network’s loss. The generator is tasked with creating new data that mimic the statistical characteristics of the original training set. The discriminator, on the other hand, attempts to distinguish between real data (from the dataset) and generated data. In this process, the discriminator learns to identify the distinctive features of the real data. The discriminator can then be used via transfer learning as a starting point when developing a classifier for the same dataset, allowing the supervised prediction task to benefit from the unsupervised training of the GAN [49].
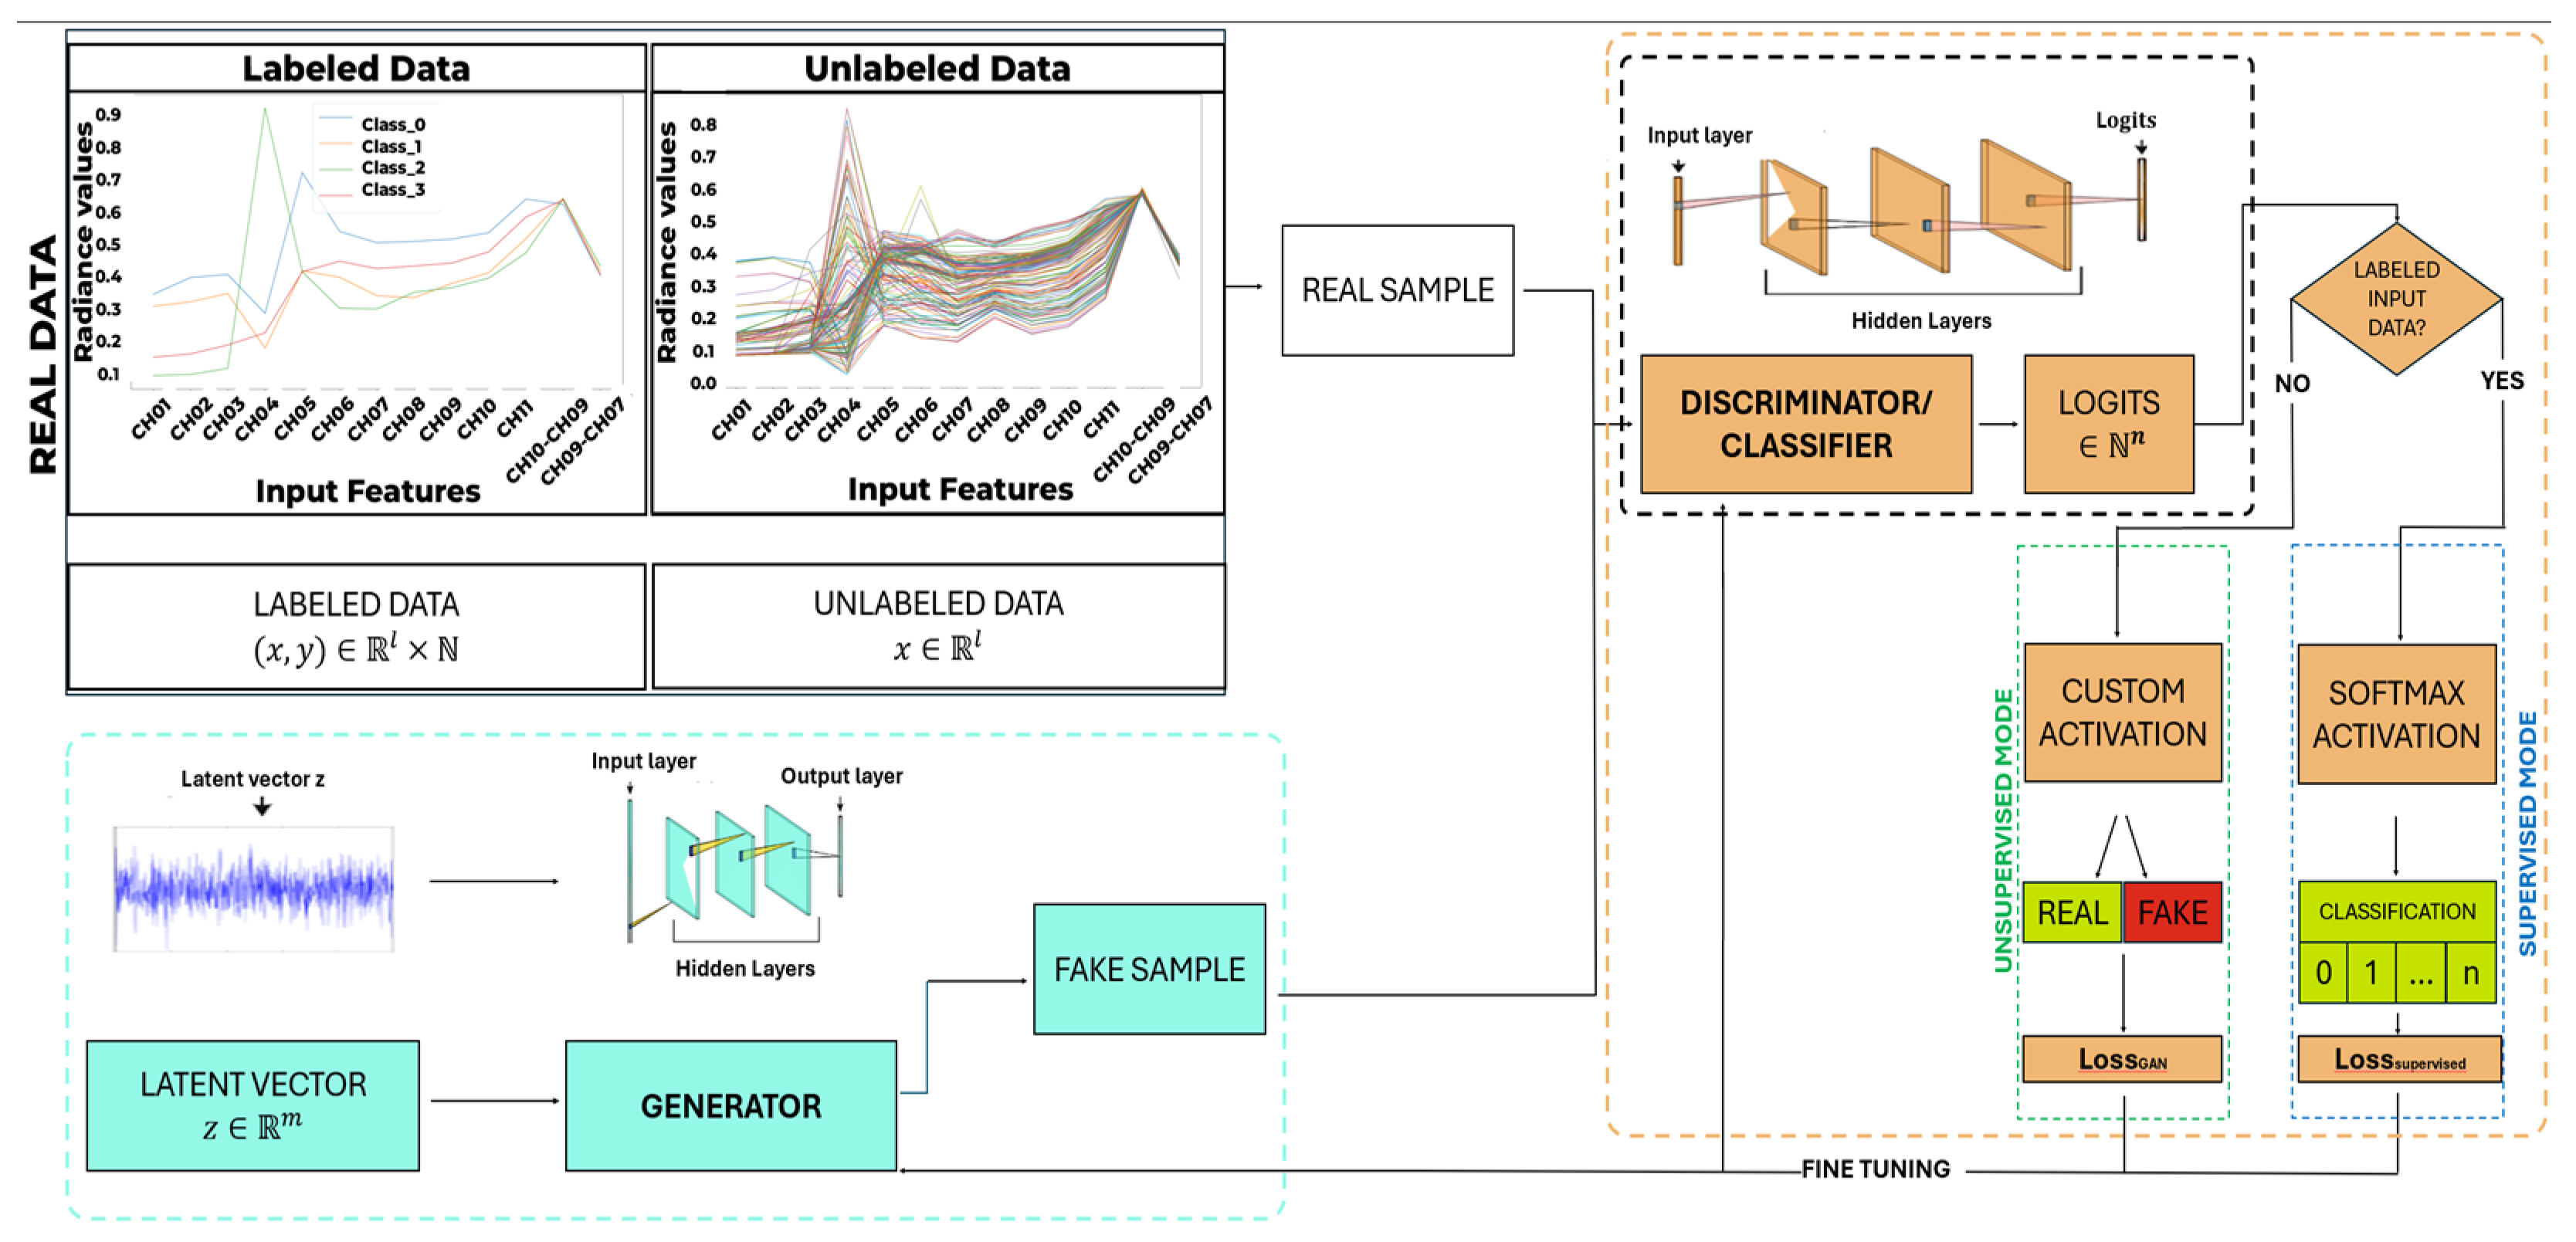
In the context of an SGAN, the generator is tasked with creating synthetic data from random noise (‘fake’ data), aiming to make it as similar as possible to the real data in the dataset. The generator is built starting from the input layer, which receives a vector (latent vector) from the latent space, abstract “space” from which the generator extracts data to create new images or samples. To this end, different hidden layers can be added in order to model the shape of the latent vector to produce a vector in the same shape as the real data. Finally, an output layer produces a vector in the same shape as the real vectors (Figure 2).
Although the generator’s primary role remains to ‘fool’ the discriminator, in this variant, its impact goes further. In fact, the discriminator not only distinguishes between real and fake data but also functions as a supervised classifier. This means that as the generator produces increasingly realistic data, it forces the discriminator to learn deeper and more generalizable features in order to distinguish real classes from the additional ‘fake’ class. The generator thus acts as a kind of regularizer; it creates synthetic examples that challenge the classifier, pushing it to improve its classification ability even when only a small amount of labeled data is available.
The discriminator receives two possible inputs: real data (labeled and unlabeled) and fake data, then outputs a logits vector x with the unnormalised predictions, i.e., membership of one of the possible classes. For each input, if the labeling is determined, a softmax function is applied to the resulting logit vector and standard classification is performed, i.e., the network is trained using the supervised-loss function sparse categorical cross-entropy to maximize classification accuracy (supervised mode Figure 2). Otherwise, if the input data are unlabeled, a custom activation function is applied to the logits vector to perform real/fake discrimination (unsupervised mode in Figure 2).
The custom activation function D ( x ) is defined as follows:
D ( x ) = Z ( x ) Z ( x ) + 1
where
Z ( x ) = i = 1 n e x i , with x i representing the components of the logit vector and n the number of the possible classes.
The custom activation function returns a scalar value representing the probability that the input data are real, without the need to use a sigmoid function or to add an artificial ‘Fake’ class. The model is therefore trained using a binary loss function binary cross-entropy, where real data should be recognized as true (real data, label 1), and generated data should be recognized as false (fake data, label 0).
The outputs from both unsupervised and supervised modes, i.e., the values of the loss functions, are used in the generator and discriminator to update the weights of the two neural networks. It is worth noting that although the number of layers and nodes of the generator and discriminator must be specifically determined on a case-by-case basis, as far as the discriminator is concerned, the SGAN model uses weight sharing allowing a single neural network (discriminator/classifier) to perform the two distinct tasks of supervised classification and unsupervised discrimination.

2.4. The SGAN Model for the Assessment of the Volcanic Activity

The general architecture of an SGAN model has been adapted to classify SEVIRI pixels in order to characterize the eruptive activity of a volcano.
Thanks to the extensive dataset available for Mt Etna, the SGAN model was trained and tested using data about eruptions produced from January 2005 to June 2008 and February 2021. Indeed, during these periods, the volcano experienced two long-lasting effusive eruptions (the end of the 2004–2005 and the beginning of the 2008–2009 flank eruptions), seven lava fountains (six in 2007 and the one of 10 May 2008), and two sub-terminal eruptions (on 14–24 July 2006 and from 4 September to 15 December 2006). We also added February 2021 to account for one of the most explosive periods of volcanic activity, characterized by eight lava fountains, with large quantities of ash emitted. We also considered inter-eruptive periods, which can possibly be used to detect precursors and transitions between the states of volcano activity.
We analyzed ~200 SEVIRI images, performing manual pixel labeling into four classes:
  • ‘clear sky’ (class 0) for pixels that show no cloudy prototype signature and no hot spot presence;
  • ‘cloud-contaminated’ (class 1) for pixels that are affected by the cloudy signature;
  • ‘thermal anomaly’ (class 2) for pixels that are identified as hot spot;
  • ‘ash-contaminated’ (class 3) for pixels characterized by the presence of volcanic ash.
This process allowed us to construct a training set and a test set, providing the model with a solid foundation to learn the distinctive characteristics of each class. The training dataset consists of 40,000 elements, divided into a labeled dataset (160 elements divided into 40 per class) and an unlabeled dataset (39,840 elements). The labeled dataset contains 40 features per class, balancing the number of examples for each class. The test set, on the other hand, consists of 401 labeled elements, including 127 for the class 0 (clear sky), 158 for the class 1 (cloud-contaminated), 60 for the class 2 (thermal anomaly), and 56 for the class 3 (ash-contaminated).
The input to the model consists of Real Data, composed of both labeled and unlabeled samples, represented by 13-dimensional vectors (the first 11 SEVIRI channels, plus the difference between channels IR12.0 and IR10.8, and the difference between channels IR10.8 and IR8.7), which are fed into the Discriminator/Classifier. Labeled data are assigned to one of the four predefined classes (clear sky, cloud-contaminated, thermal anomaly, and ash-contaminated), while unlabeled data serve to improve the model’s capacity to discern real from generated samples, ultimately refining the generator’s ability to produce realistic data.
The Generator includes an input layer that receives a vector sampled from a latent space, i.e., the latent vector, whose size we set to 100. For the hidden layers, we chose three layers, consisting of 1D transposed convolutional neural networks with 128, 64, and 32 neurons, respectively. The output layer has the same dimensions as the real feature vectors (dimension 13), ensuring consistency with the input data format.
The Discriminator/Classifier includes an input layer that accepts either real or generated data (13-dimensional vectors). For the hidden layers, we chose three layers, consisting of 1D convolutional neural networks with 32, 64, and 128, respectively. The output layer provides 4-dimensional vectors (logits vectors), corresponding to the defined classes 0, 1, 2, and 3. When the discriminator processes labeled real data, it performs a standard classification task, assigning the input to one of the four volcanic activity classes. In contrast, when processing unlabeled data, the discriminator distinguishes between real and fake data.
Once the training and testing were completed, the model was applied to predict classes on new data related to the volcanoes Etna, Stromboli, Tajogaite, and Nyiragongo, considering the case studies introduced in Section 2.2. Specifically, we examined approximately 4500 SEVIRI images for Etna, 60 images for Stromboli, 80 images for Tajogaite, and 70 images for Nyiragongo. Using these new data, we performed a classification of the SEVIRI scenes (5 × 5 pixel grids centered on the summit area of each analyzed volcano, Figure 3), monitoring the temporal variations in the percentages of pixels labeled as ‘cloud-contaminated’, ‘thermal anomaly’, and ‘ash-contaminated’. The goal of this analysis was to monitor the emergence and evolution of the eruptions through the timely detection of thermal anomalies and ash emissions, thereby contributing to the improvement in monitoring strategies and response to volcanic events.

2.5. Performance Evaluation and Validation

In order to determine the effectiveness of our SGAN model, we evaluated its performance using three different metrics, which measure the accuracy of positive predictions (Precision), the model’s ability to find all the positive instances (Recall), and the general model’s accuracy as the harmonic mean of precision and recall (F1-score):
P r e c i s i o n = T r u e   P o s i t i v e T r u e   P o s i t i v e + F a l s e   P o s i t i v e
R e c a l l = T r u e   P o s i t i v e T r u e   P o s i t i v e + F a l s e   N e g a t i v e
F 1 - s c o r e = 2 × P r e c i s i o n × R e c a l l P r e c i s i o n + R e c a l l
where True Positive is the number of samples correctly predicted as “positive”; False Positive is the number of samples wrongly predicted as “positive”; and False Negative is the number of samples wrongly predicted as “negative”.
Since we are performing a multi-class classification, these metrics are used to calculate the arithmetic mean for each class (equally treated), obtaining the macro precision, macro recall, and macro F1-score. If i is the class and N is the total number of classes, they are estimated as follows:
M a c r o   P r e c i s i o n = 1 N i = 1 N P r e c i s i o n i
M a c r o   R e c a l l = 1 N i = 1 N R e c a l l i
M a c r o   F 1 - S c o r e = 1 N i = 1 N F 1 - S c o r e i
A high macro precision indicates that when the model predicts a class, it is generally correct. Conversely, a low macro precision means the model tends to make many false positive classifications, i.e., it predicts a label that is incorrect. A high macro recall indicates that the model successfully identifies a large portion of the true examples for that class. On the other hand, a low macro recall means that many examples of that class are missed (false negatives), and the model fails to recognize them. The macro F1-score is particularly useful when dealing with imbalanced data or when one class is more challenging to detect than another. A high macro F1-score indicates that the model is well-balanced in its precision and recall abilities, while a low macro F1-score suggests that the model struggles to balance these two aspects (for instance, it may be very precise but fail to detect enough instances of a class, or vice versa).
The macro precision, macro recall, and macro F1-score are evaluated on a multi-class confusion matrix, where the columns represent the true labels, and the rows represent the predicted distribution by the classifier. Thus, our multi-class confusion matrix is 4 × 4, estimated using information from the Etna volcano, for which labeled data are available.
For the other volcanoes, a qualitative validation was performed through a visual comparison between the plot of classified pixels and the SEVIRI images, using both the RGB composites (RED = IR12.0 − IR10.8, GREEN = IR10.8 − IR8.7, BLUE = IR10.8) and the individual channel IR3.9. This allowed us to measure how well the semi-supervised classifier was performing, together with its capability to detect prompt and significant variations in the data.

3. Results

In the following, we report the classification obtained with our SGAN model for different eruptive events in the four study areas. These events were chosen to assess the model’s ability to generalize from Etna’s behavior and detect and classify volcanic activity under different eruptive conditions. The temporal variation in the percentages of pixels classified as ‘thermal anomaly’ (linked to intense effusive activity), ‘ash-contaminated’ (indicating a more explosive activity), and cloud-contaminated (that can partially or totally obscure the eruptive activity) in the SEVIRI scenes are reported for each case study, together with three distinct SEVIRI scenes. The last section includes the confusion matrix and the results of the performance evaluation.

3.1. Etna

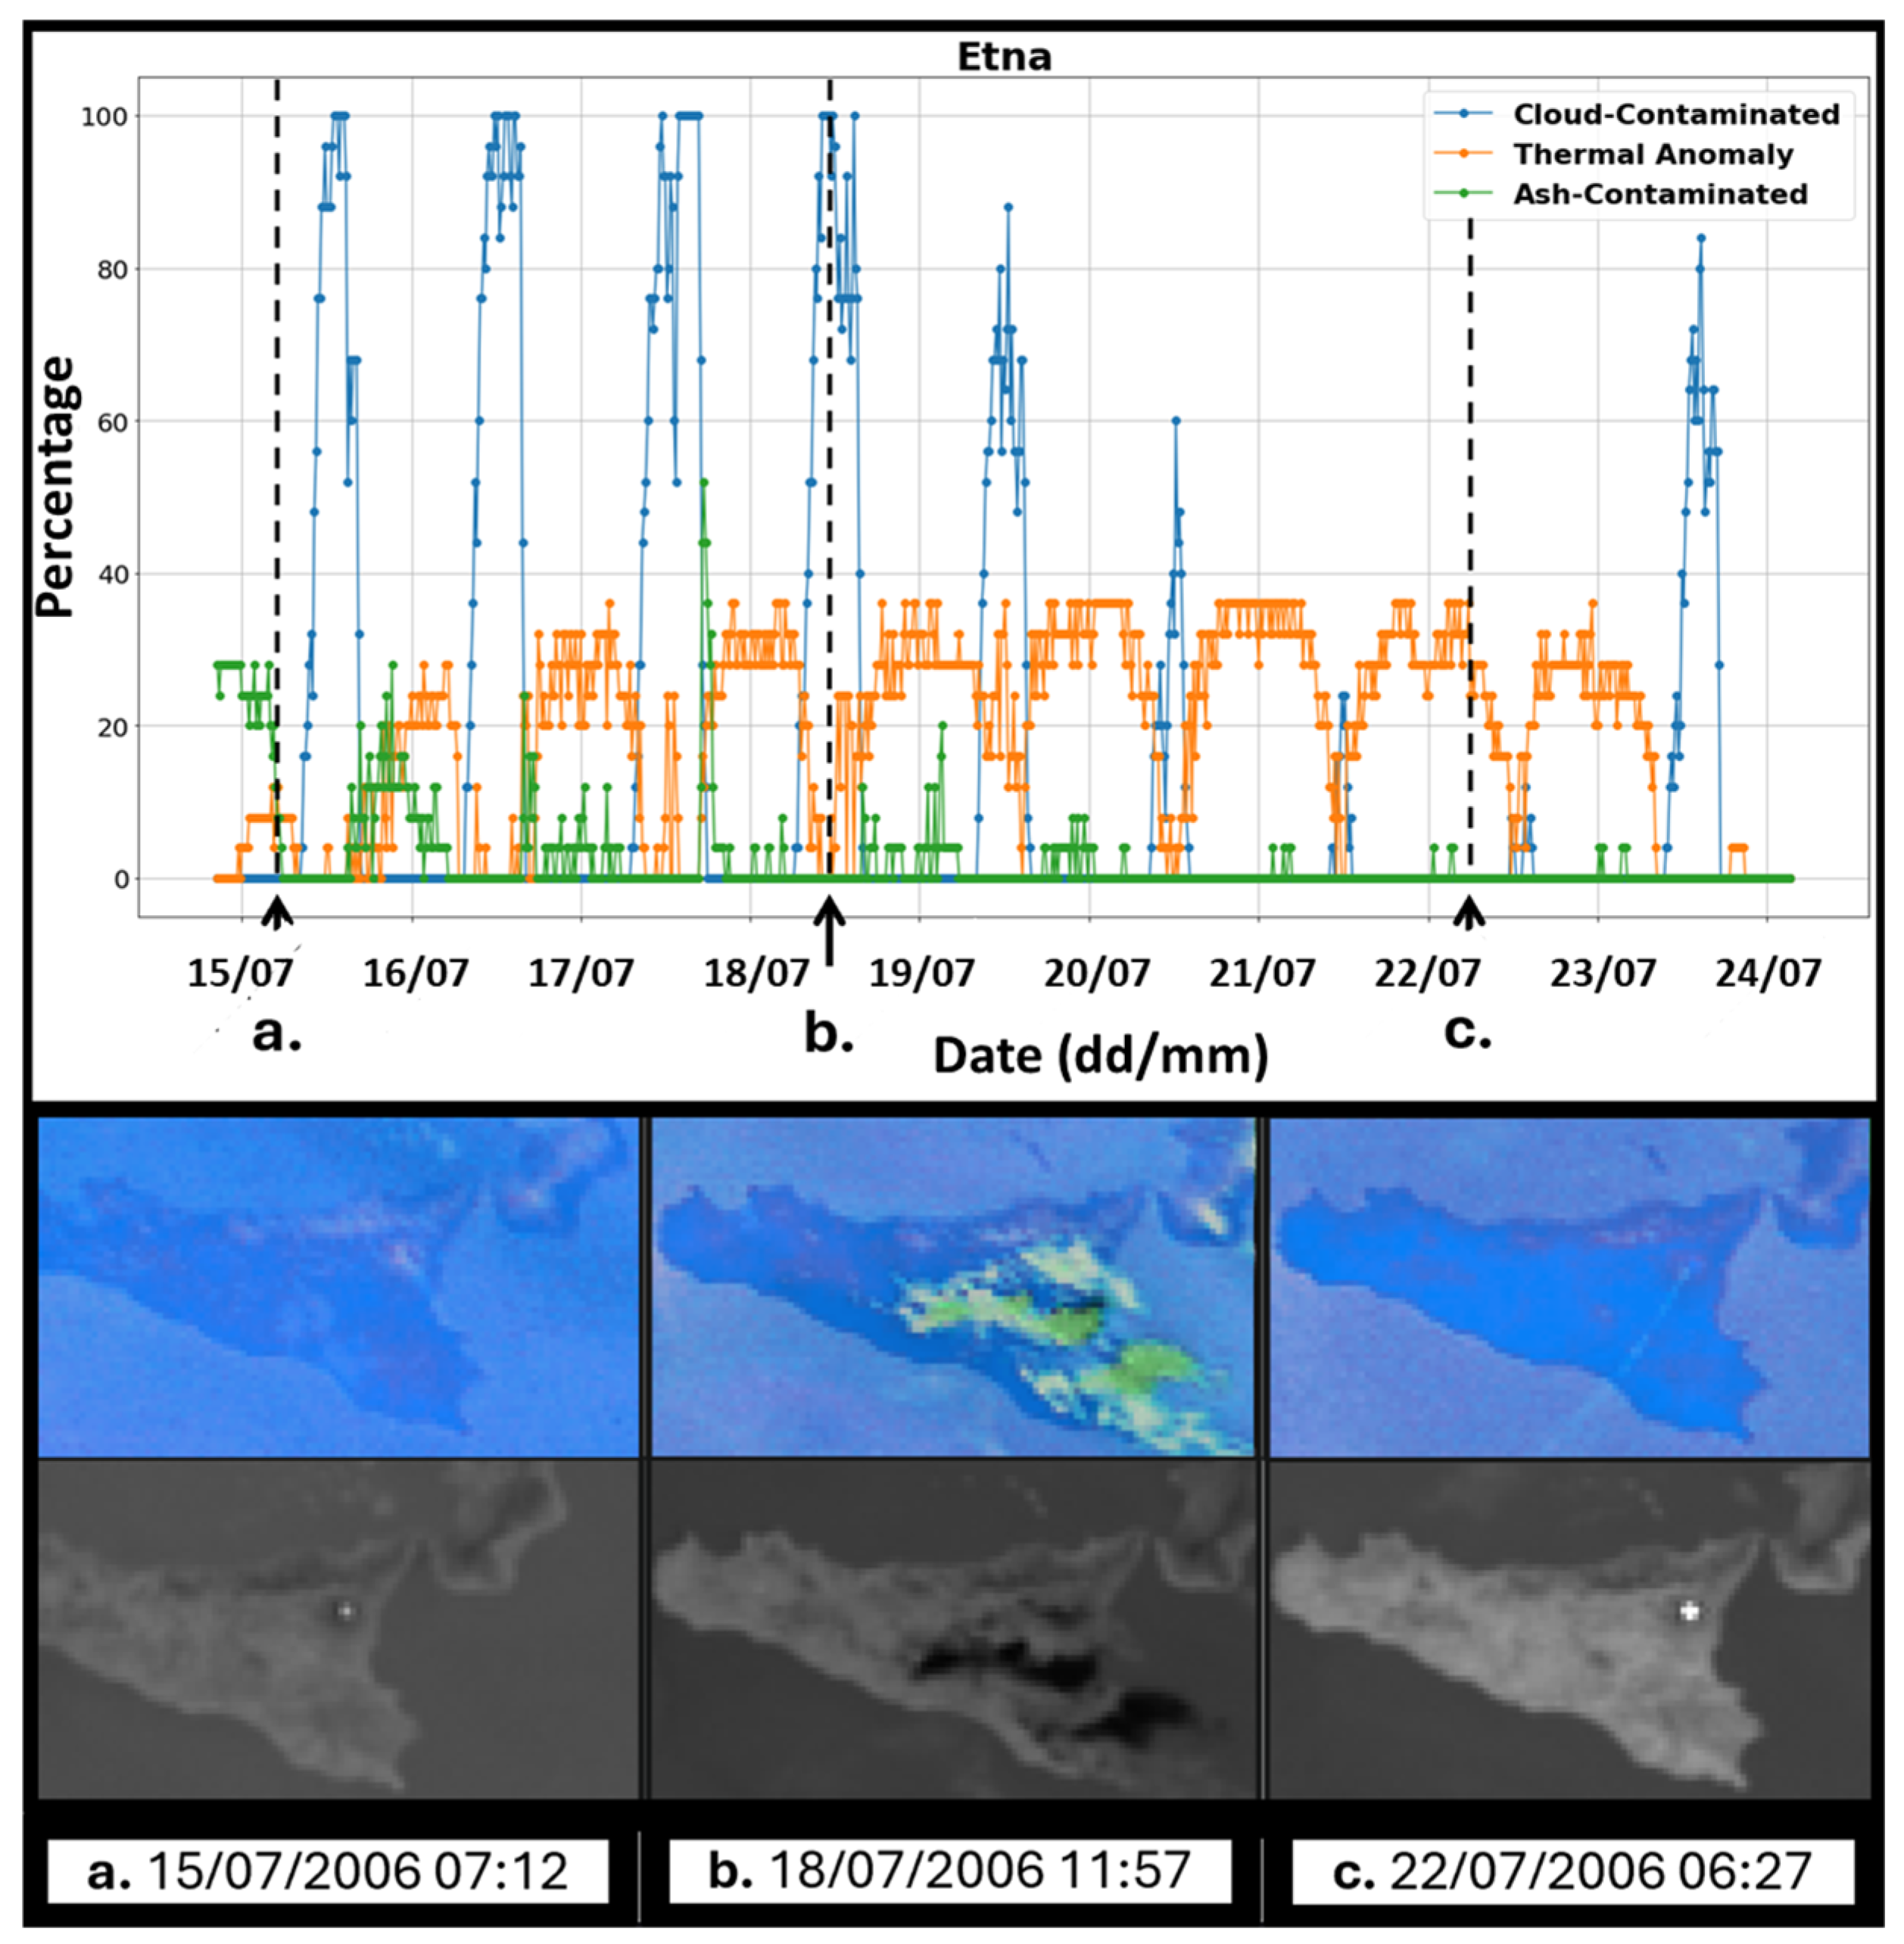
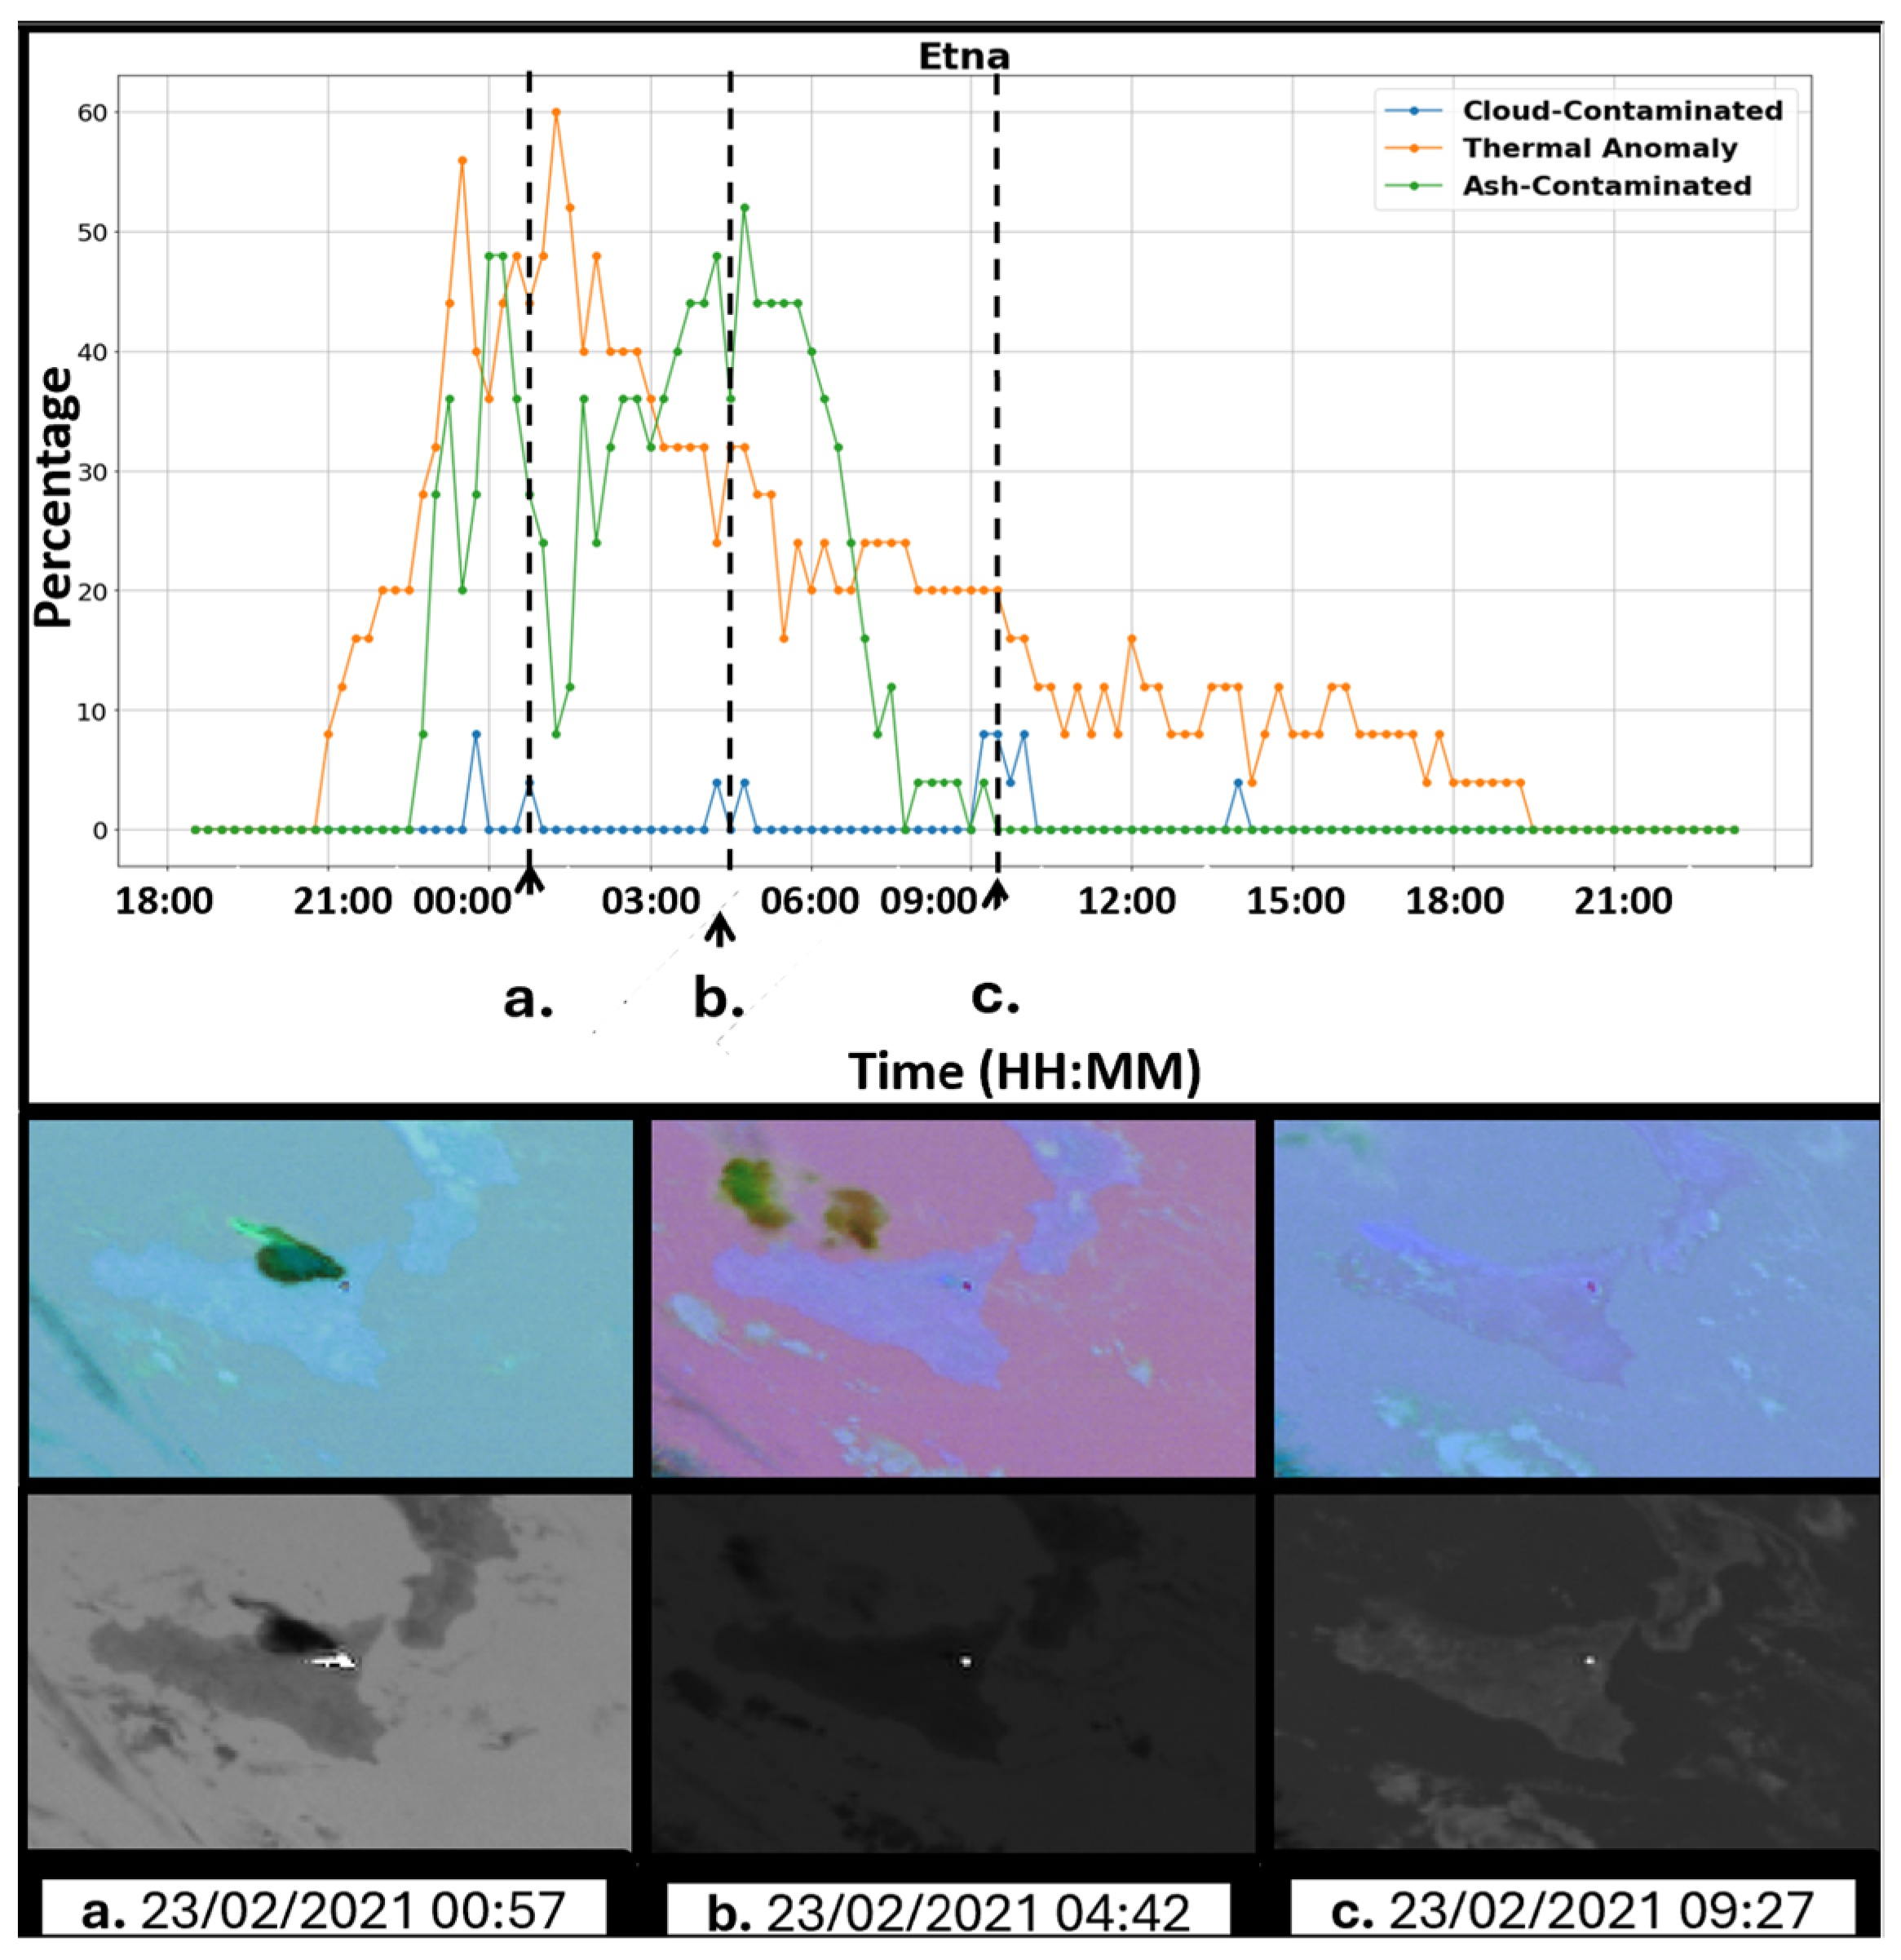
For Mount Etna, our SGAN model was able to correctly classify the status of the volcano, detecting the three different types of eruptions that have characterized the analyzed time window. This includes all the possible scenarios that individual pixels in SEVIRI satellite images can assume, highlighting, e.g., the July 2006 sub-terminal eruption (Figure 4), the beginning of the 2008–2009 flank eruption (Figure 5, Figure 6 and Figure 7), and the lava fountain of 22–23 February 2021 (Figure 8).

3.1.1. The July 2006 Subterminal Eruption

In 2006, the classifier detected a trend in the thermal anomaly due to the lava flow field being emplaced from 14 to 24 July, and the ash and meteorological cloud cover that partially covered the SEVIRI scenes (Figure 4). In particular, we found an initial increase in the thermal activity (orange line) related to the expansion of the lava flow. Moreover, those images characterized by minimum values of thermal anomalies are also accompanied by thick meteorological cloud cover (blue line), which prevent clear views of the eruptive activity, especially during the afternoon. A modest ash coverage was also mainly observed in the first five days of the eruption.

3.1.2. The 2008–2009 Flank Eruption

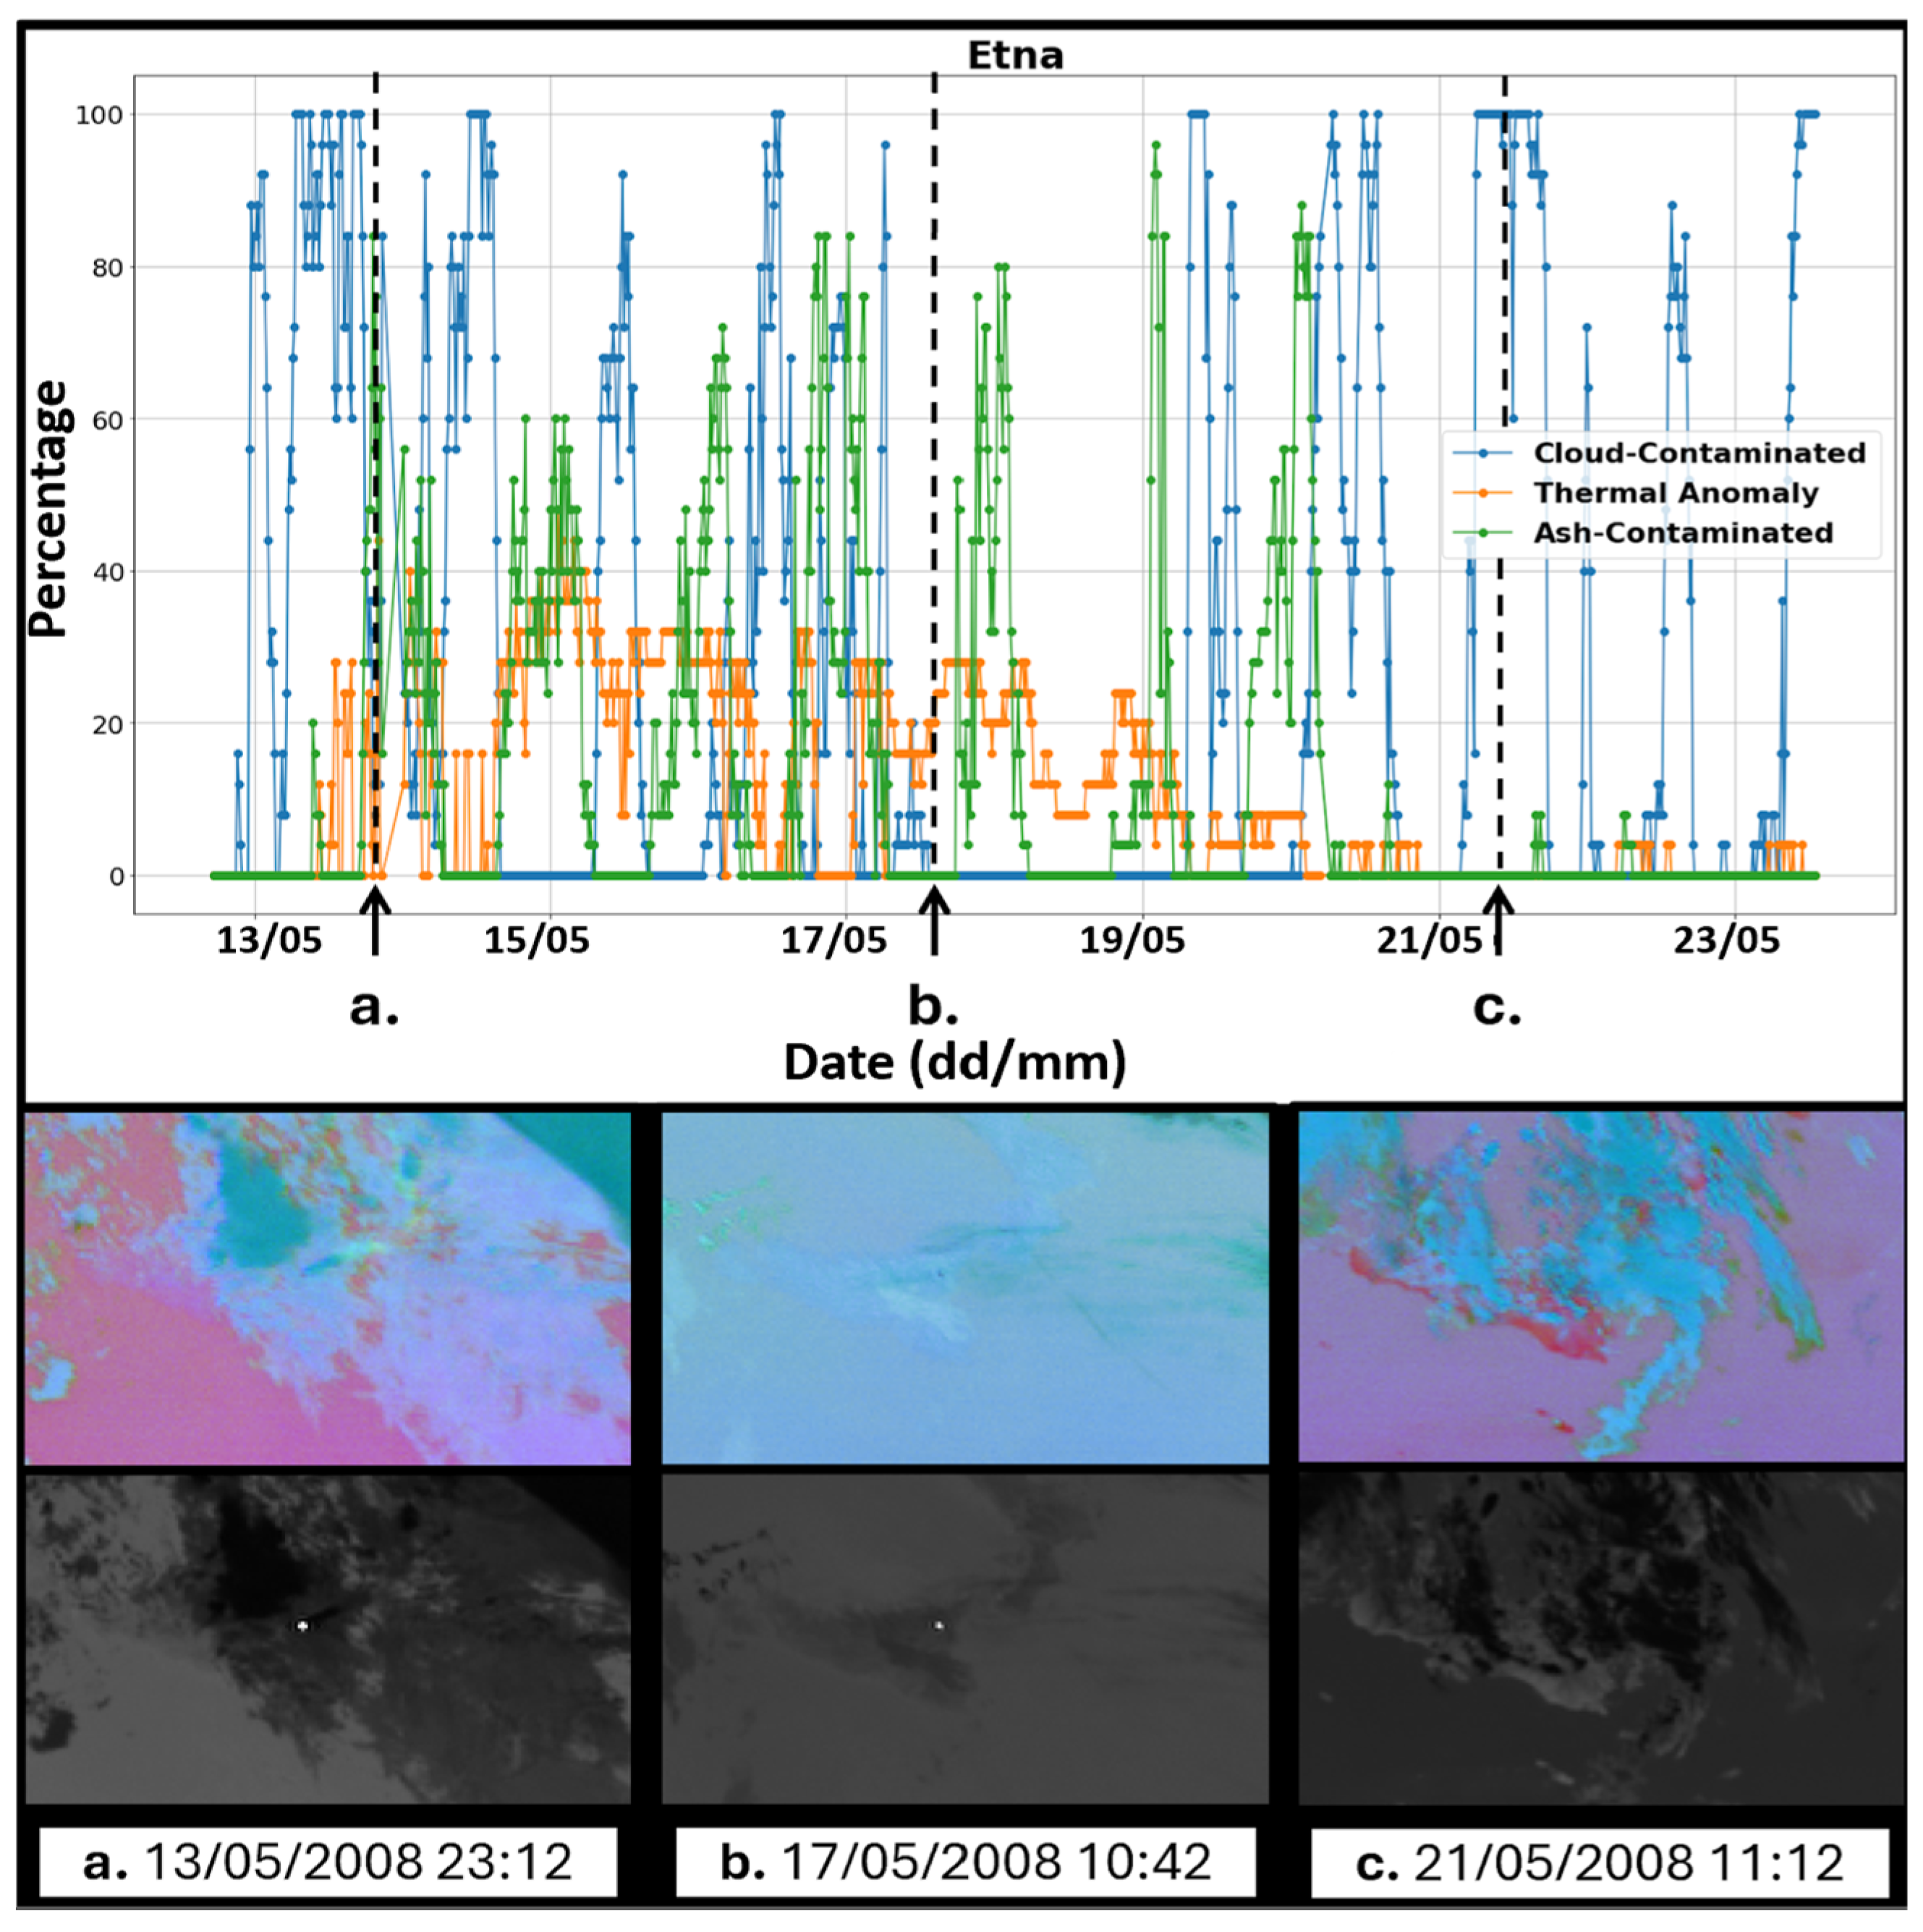
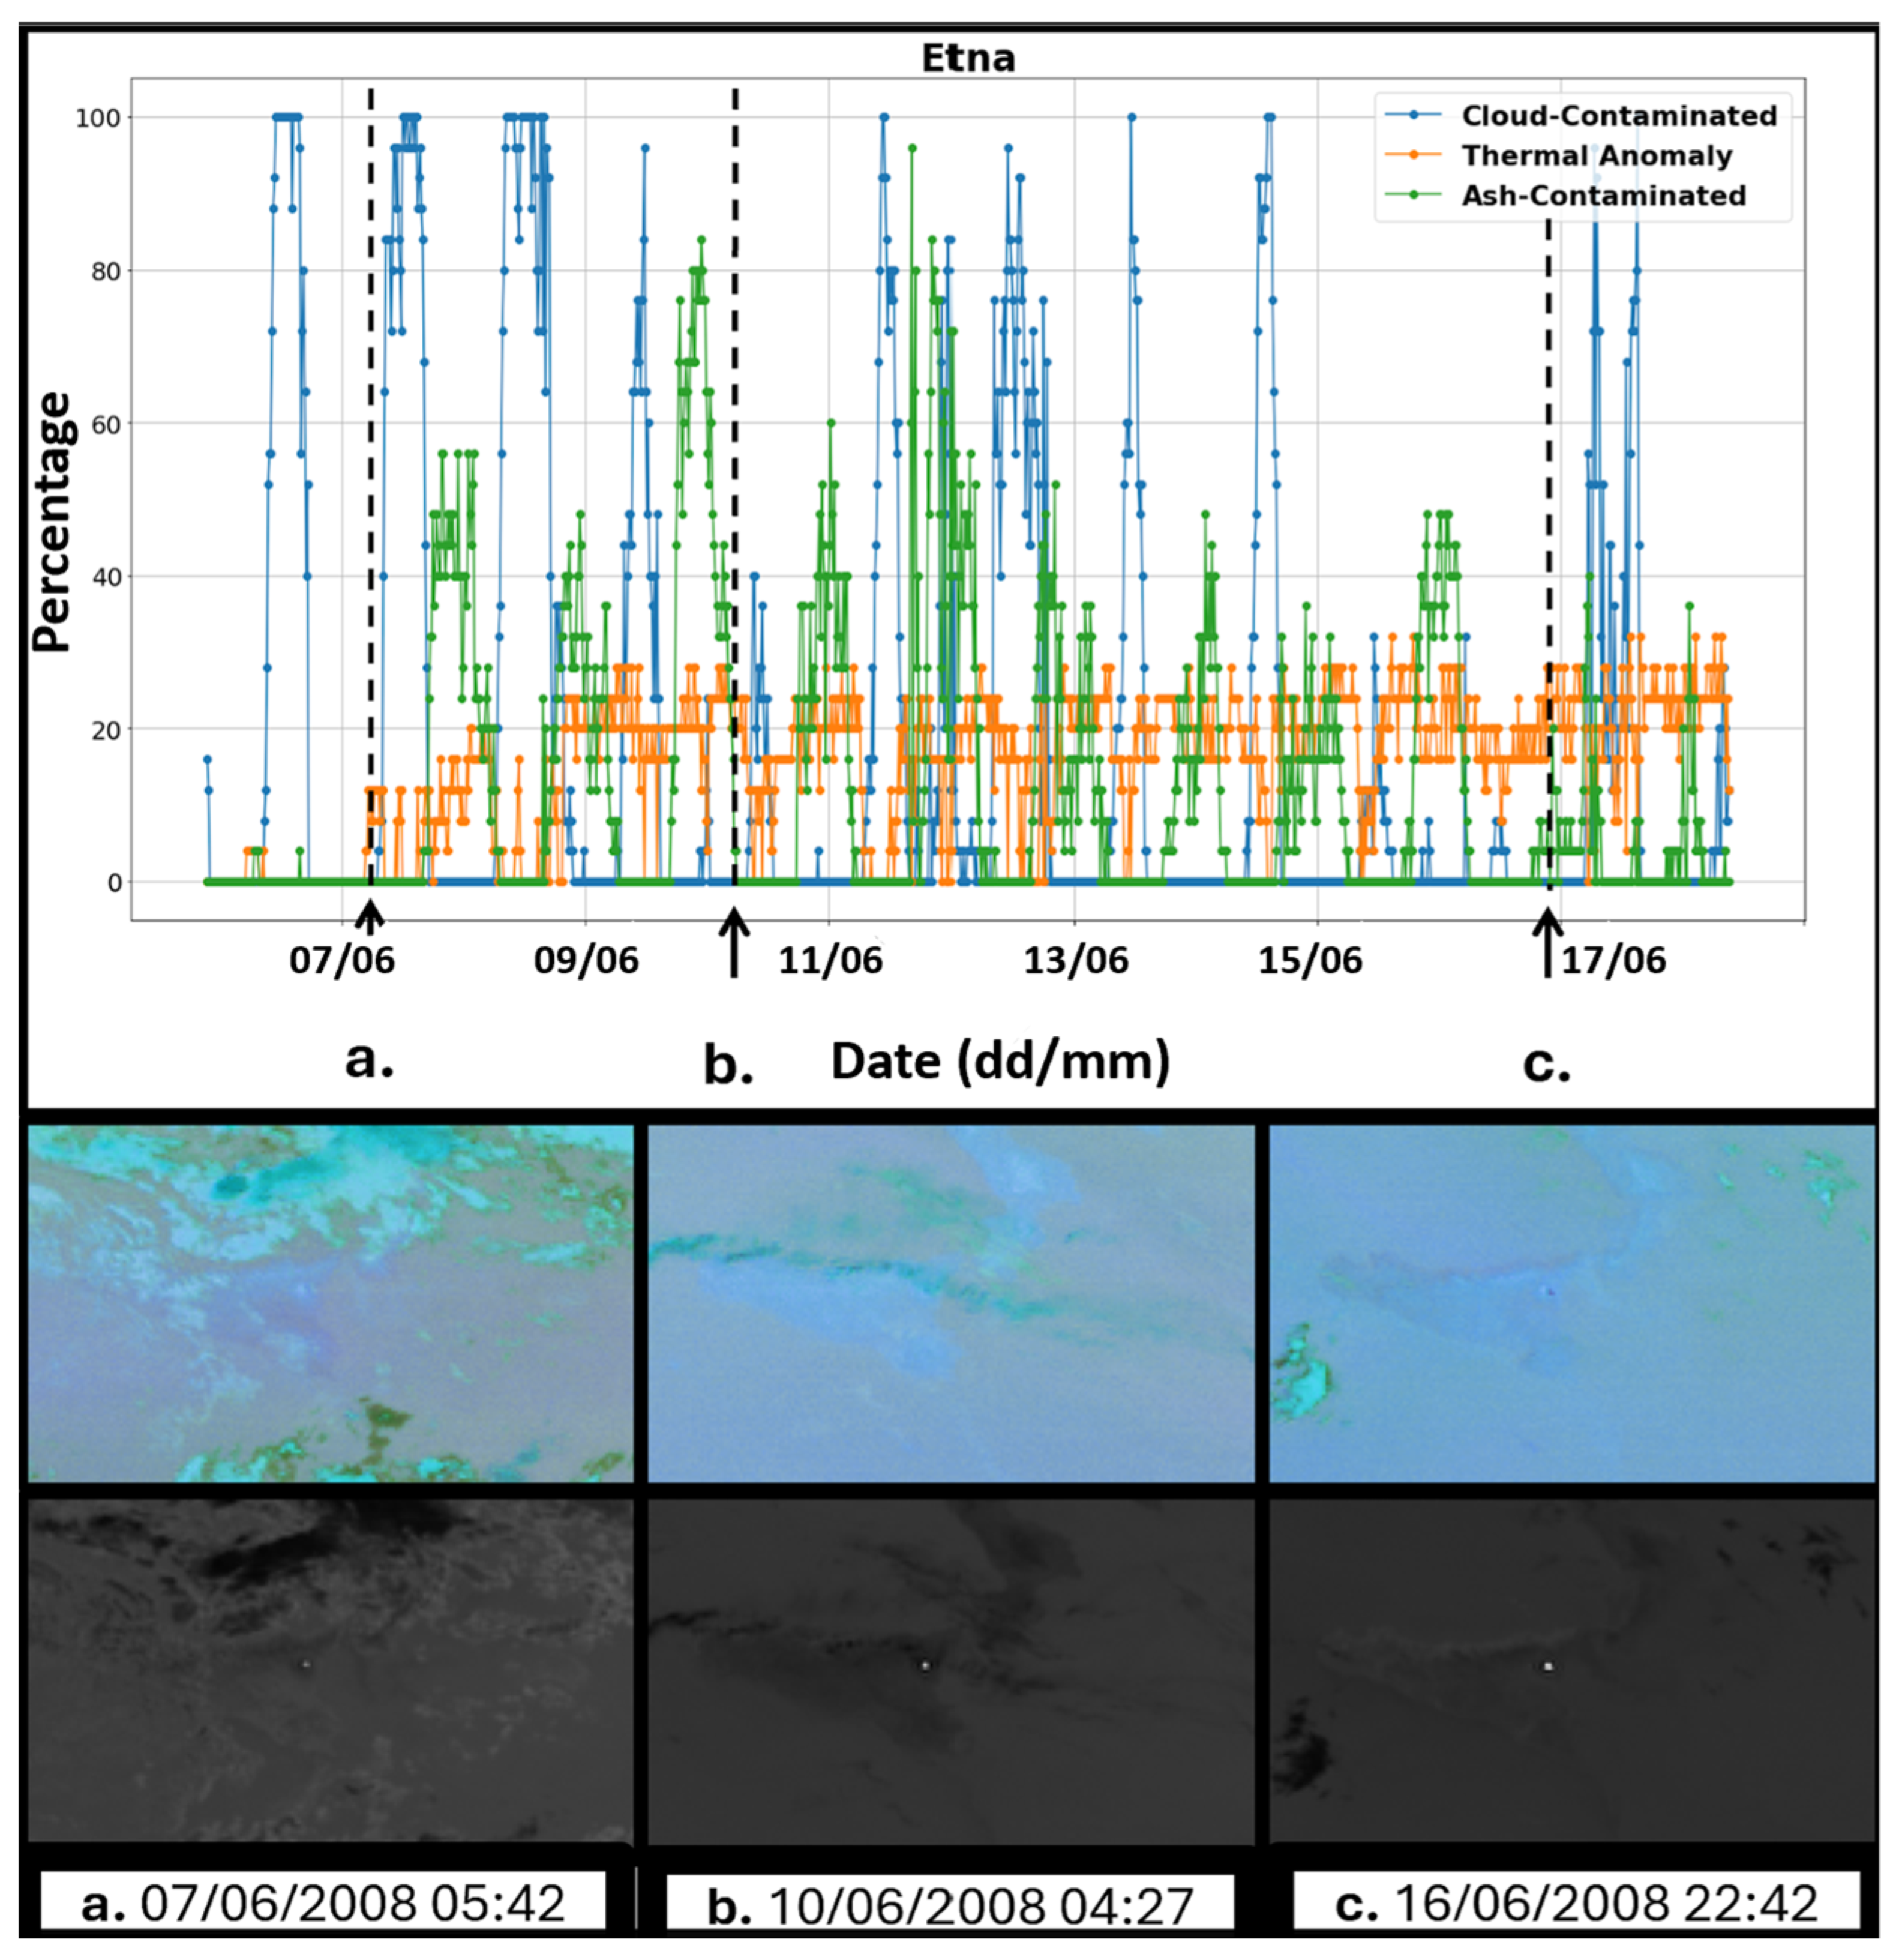
For the 2008–2009 flank eruption, we detected the thermal activity and cloud coverage from 13 May 2008 to 19 June, covering the first month of the eruptive activity. The model was able to reveal the trend in the thermal anomaly, as well as the continuous presence of ash and meteorological clouds, which partially or totally obscured it, preventing its observation from space (Figure 5, Figure 6 and Figure 7). In particular, we identified an initial increase in the volcanic activity (orange line), associated with the early effusive phase, during which an expansion of the lava flow and high presence of ash (green line) was observed (Figure 5). This was followed by a lower intensity volcanic activity, with low percentages of pixels classified as ‘thermal anomaly’ and ‘ash-contaminated’ (Figure 6). Finally, at the end of the considered time window (from 8 to 19 June), we observed a rising phase of the thermal anomaly, attributed to the intensification in both the effusive and explosive activity, which also led to increased ash emission (Figure 7).

3.1.3. The February 2021 Lava Fountain

Finally, we analyzed the lava fountain that started in the evening of 22 February 2021, around 21:00 GMT, which was characterized by a lava fountain, the emission of an ash cloud, and different lava flows from the south-east crater (Figure 8). This event was monitored in detail from SEVIRI thanks to the almost complete absence of meteorological clouds (blue line). We found a bell-shaped trend in the thermal activity, with the peak around midnight, during the maximum intensity of the lava fountain. Thermally anomalous pixels were detected until the afternoon of 23 February (orange line), due to the cooling of two different lava flows that emplaced towards the south-east and south-west with respect to the SEC. This event also produced an eruptive column (green line) that rose several kilometers above the summit of Etna and dispersed in a northwesterly direction.

3.2. Stromboli

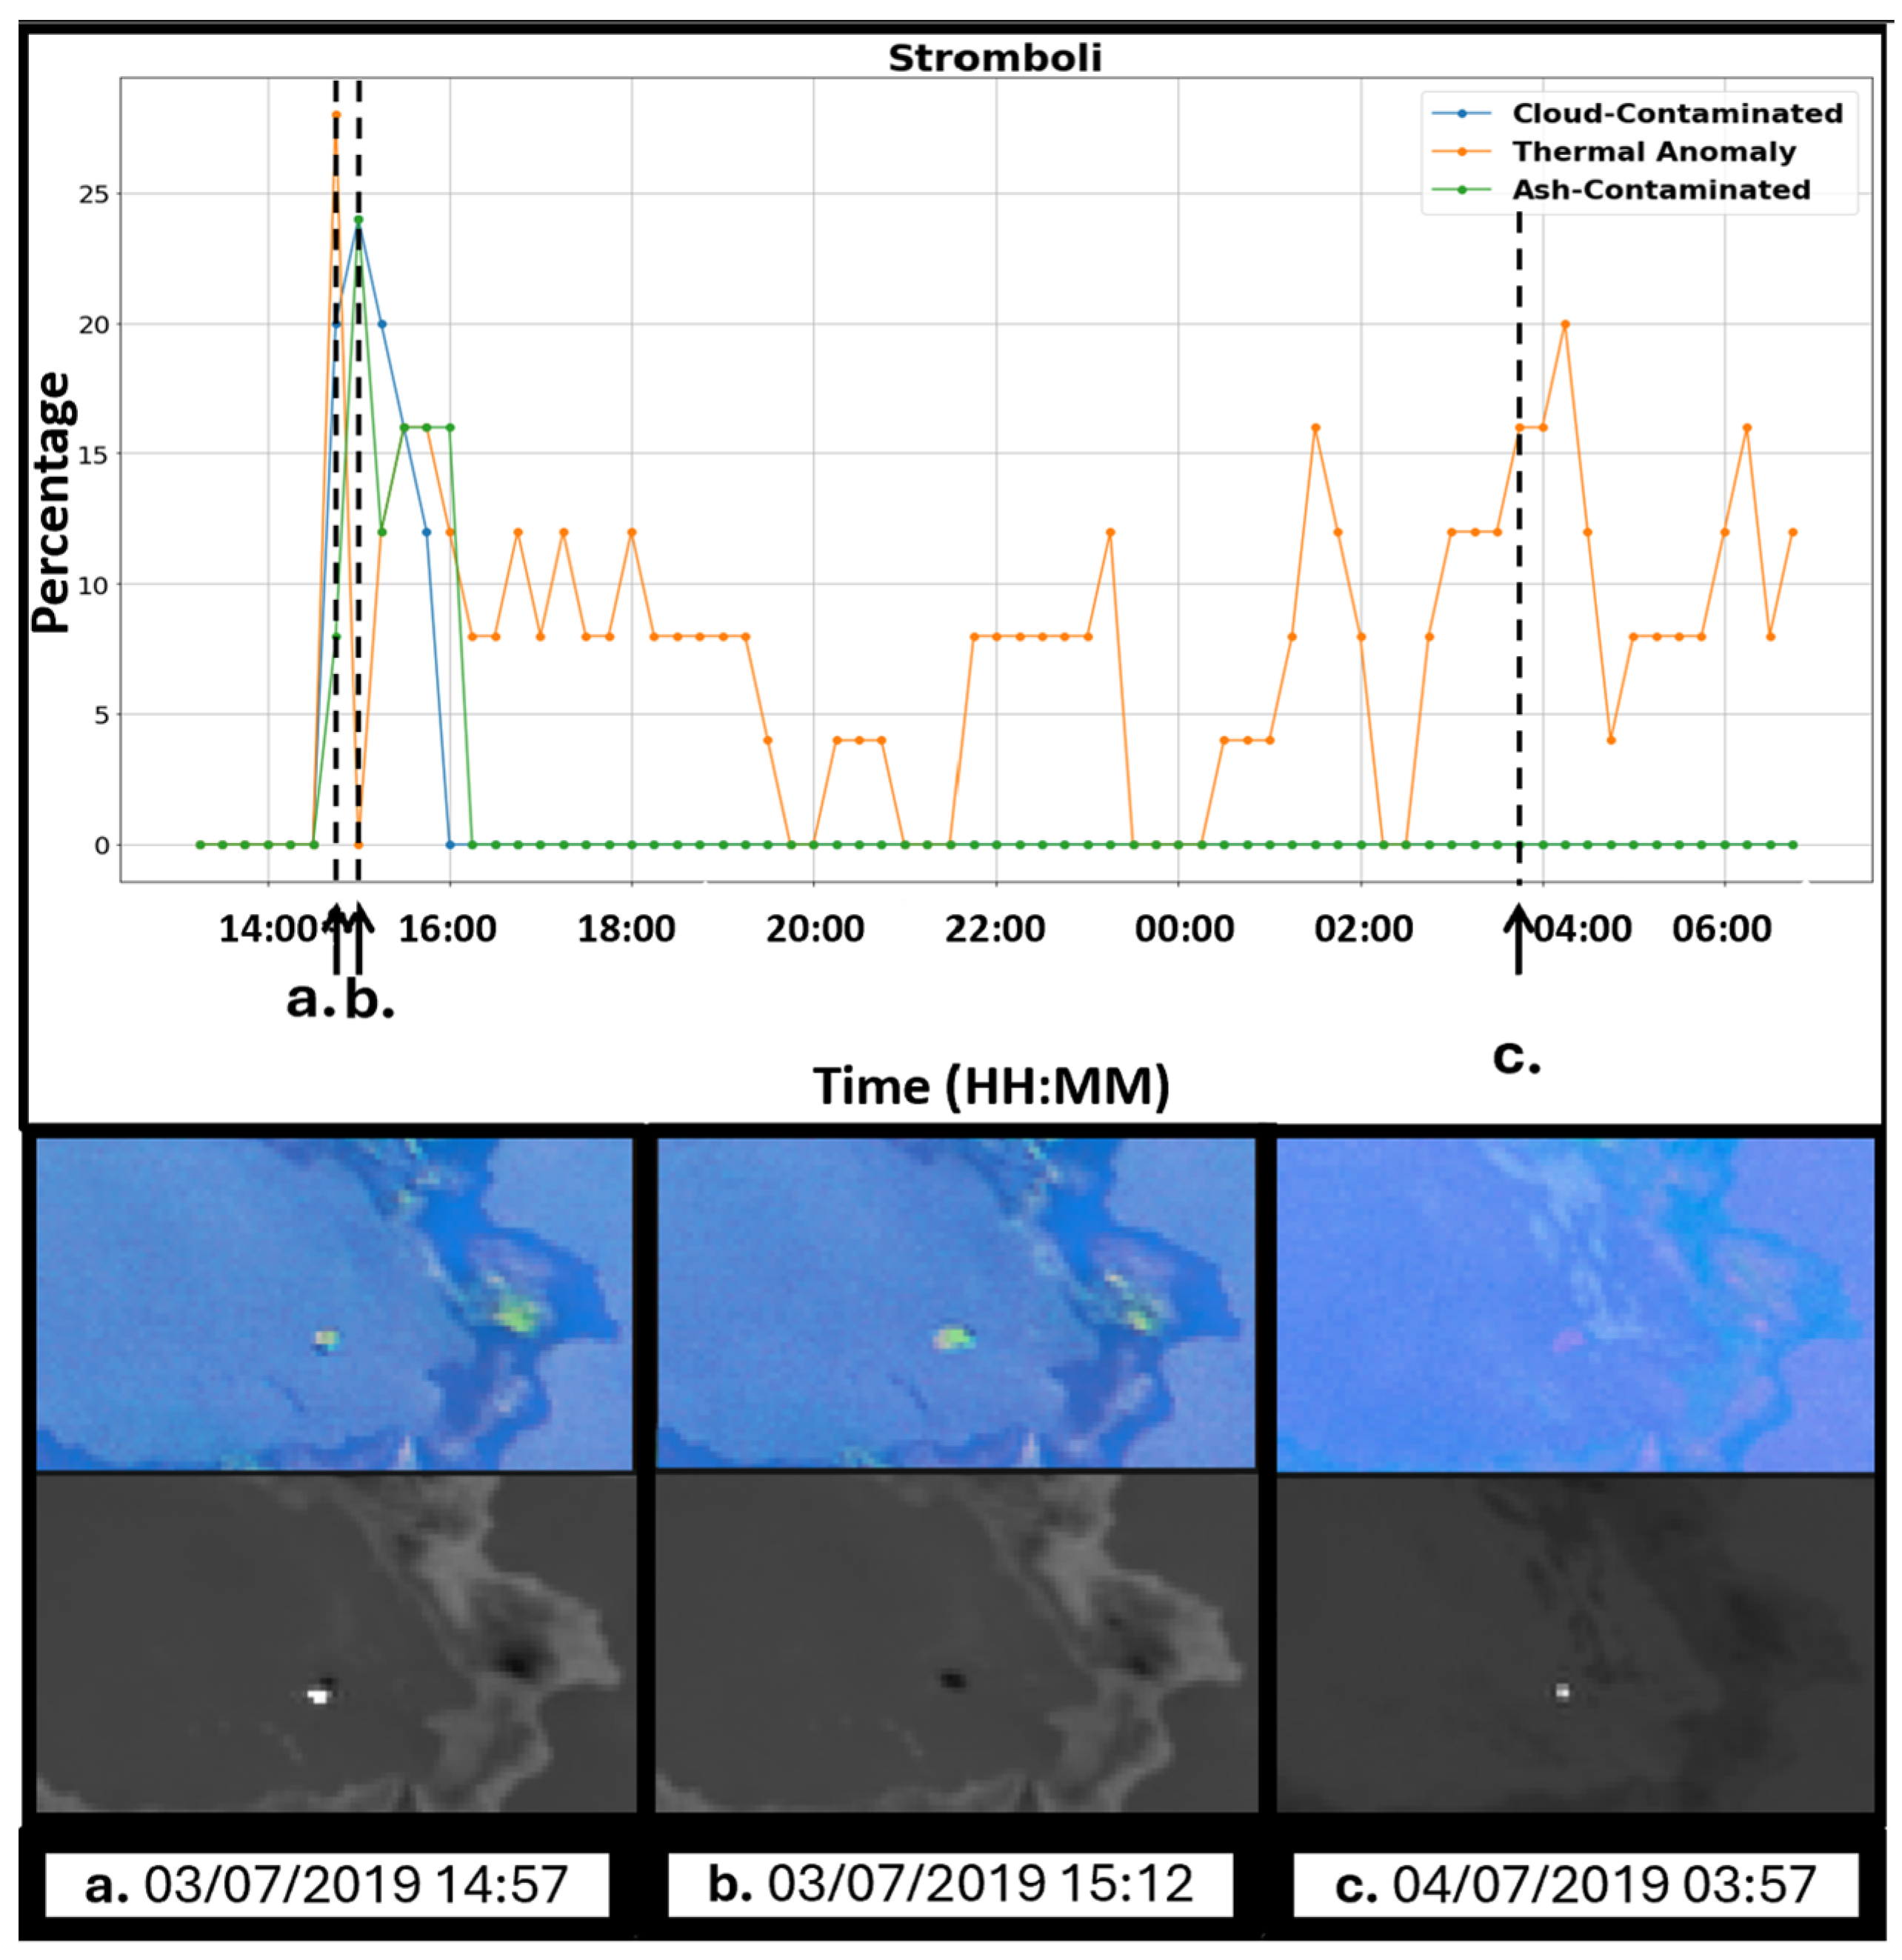
For this volcano, we used our SGAN-trained model to follow the paroxysmal event that occurred at Stromboli on 3 July 2019 (Figure 9). Also, in this case, the image above shows the behavior of meteorological clouds, ash, and thermal anomalies. We observed that the most explosive activity, associated with the paroxysmal event, was confined between 14:45 and 16:00 UTC on 3 July, characterized by a high percentage of pixels thermally anomalous (orange line) and pixels contaminated by ash (green line) within the 5 × 5 reference grid.
The peak of the thermal anomaly (orange line) represents the initial phase of the explosive event, followed by a period in which the emitted volcanic ash obstructed a clear observation of the thermal anomalies. Furthermore, we found that this initial phase of peak activity was followed by a gradual decrease in volcanic activity (orange line), although lower-intensity explosions recorded in the following hours continued to show pixels with thermal anomalies.
These results are consistent with the typical behavior of paroxysmal activity at the Stromboli volcano and are also confirmed by ground-based observations [50,51].

3.3. Tajogaite

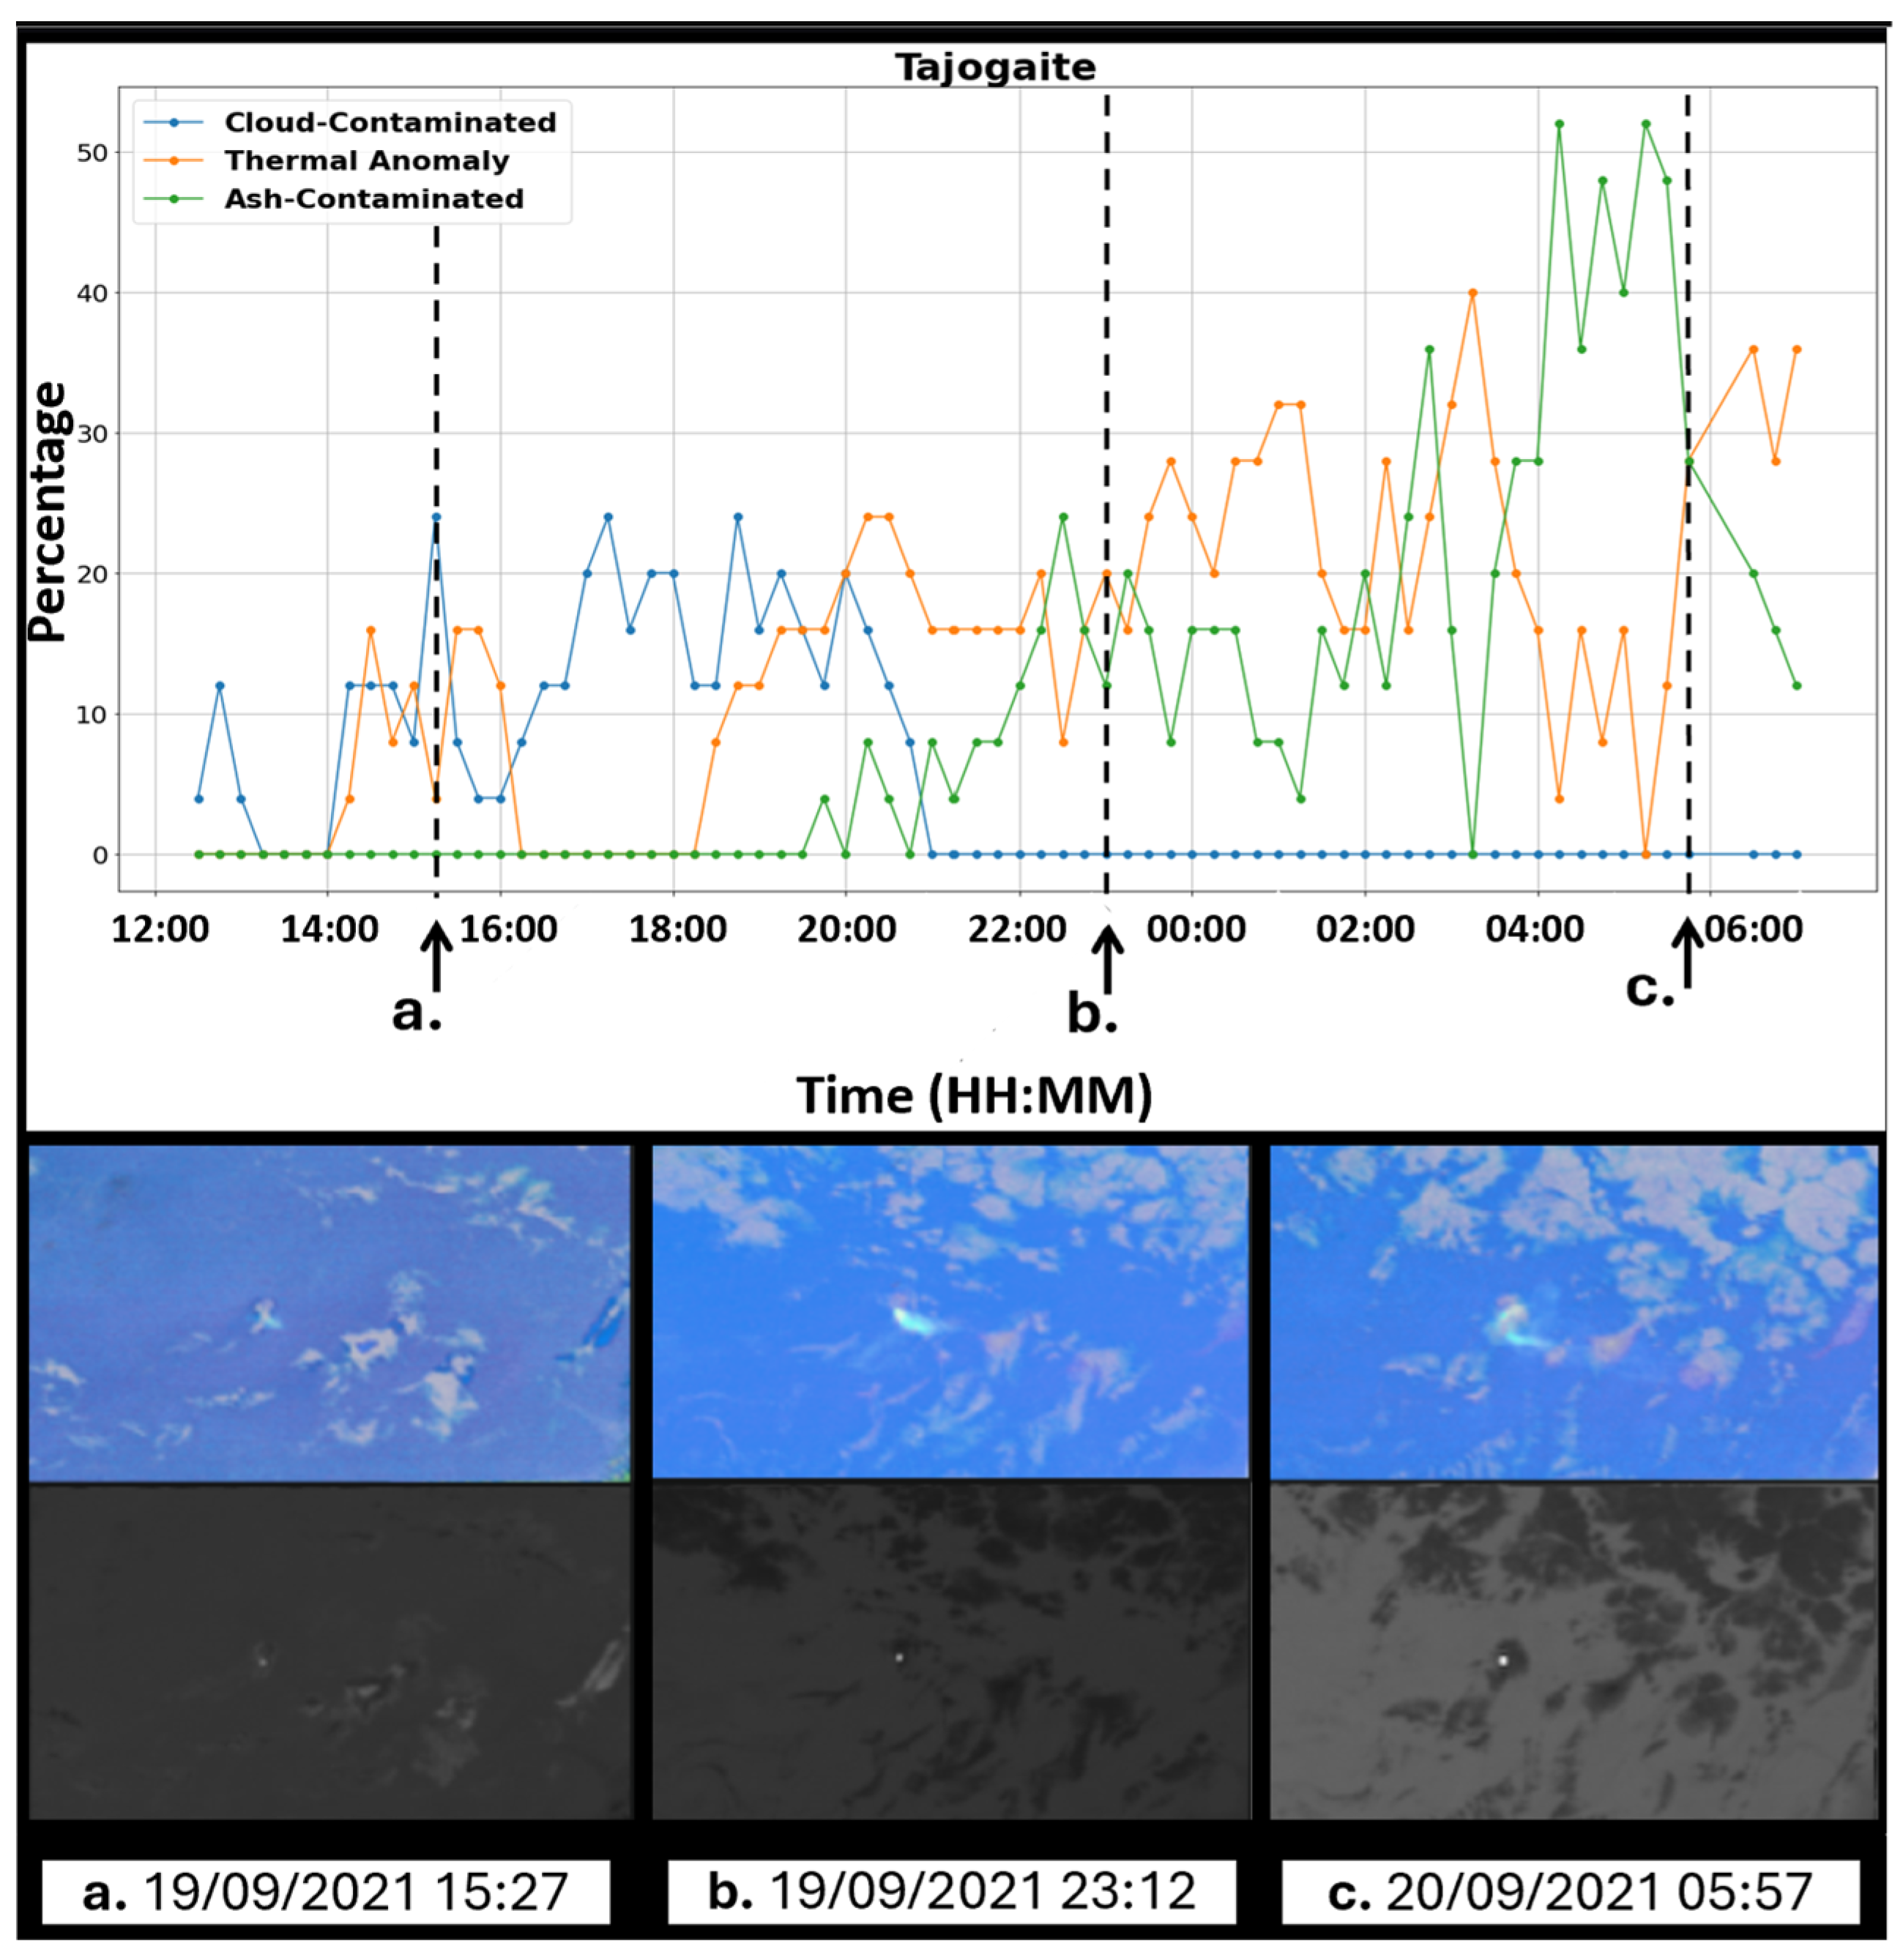
Our SGAN-trained model was able to detect the Tajogaite eruption, in La Palma Island, which started on 19 September 2021 and lasted 85 days, and which was one of the most devastating eruptions in recent history, involving extensive lava flows and ash fallout. Here, we report the results of the first two days of the eruption, characterized by a mixed activity, alternating effusive and explosive phases (Figure 10). This dynamic contributed to keeping high, for most of the analyzed period, both the percentage of pixels with thermal anomalies (orange line) and those contaminated by ash (green line). The onset of eruptive activity was attenuated by the presence of meteorological clouds, followed by a phase in which there was a strong presence of pixels with thermal anomalies and pixels contaminated by ash.

3.4. Nyiragongo

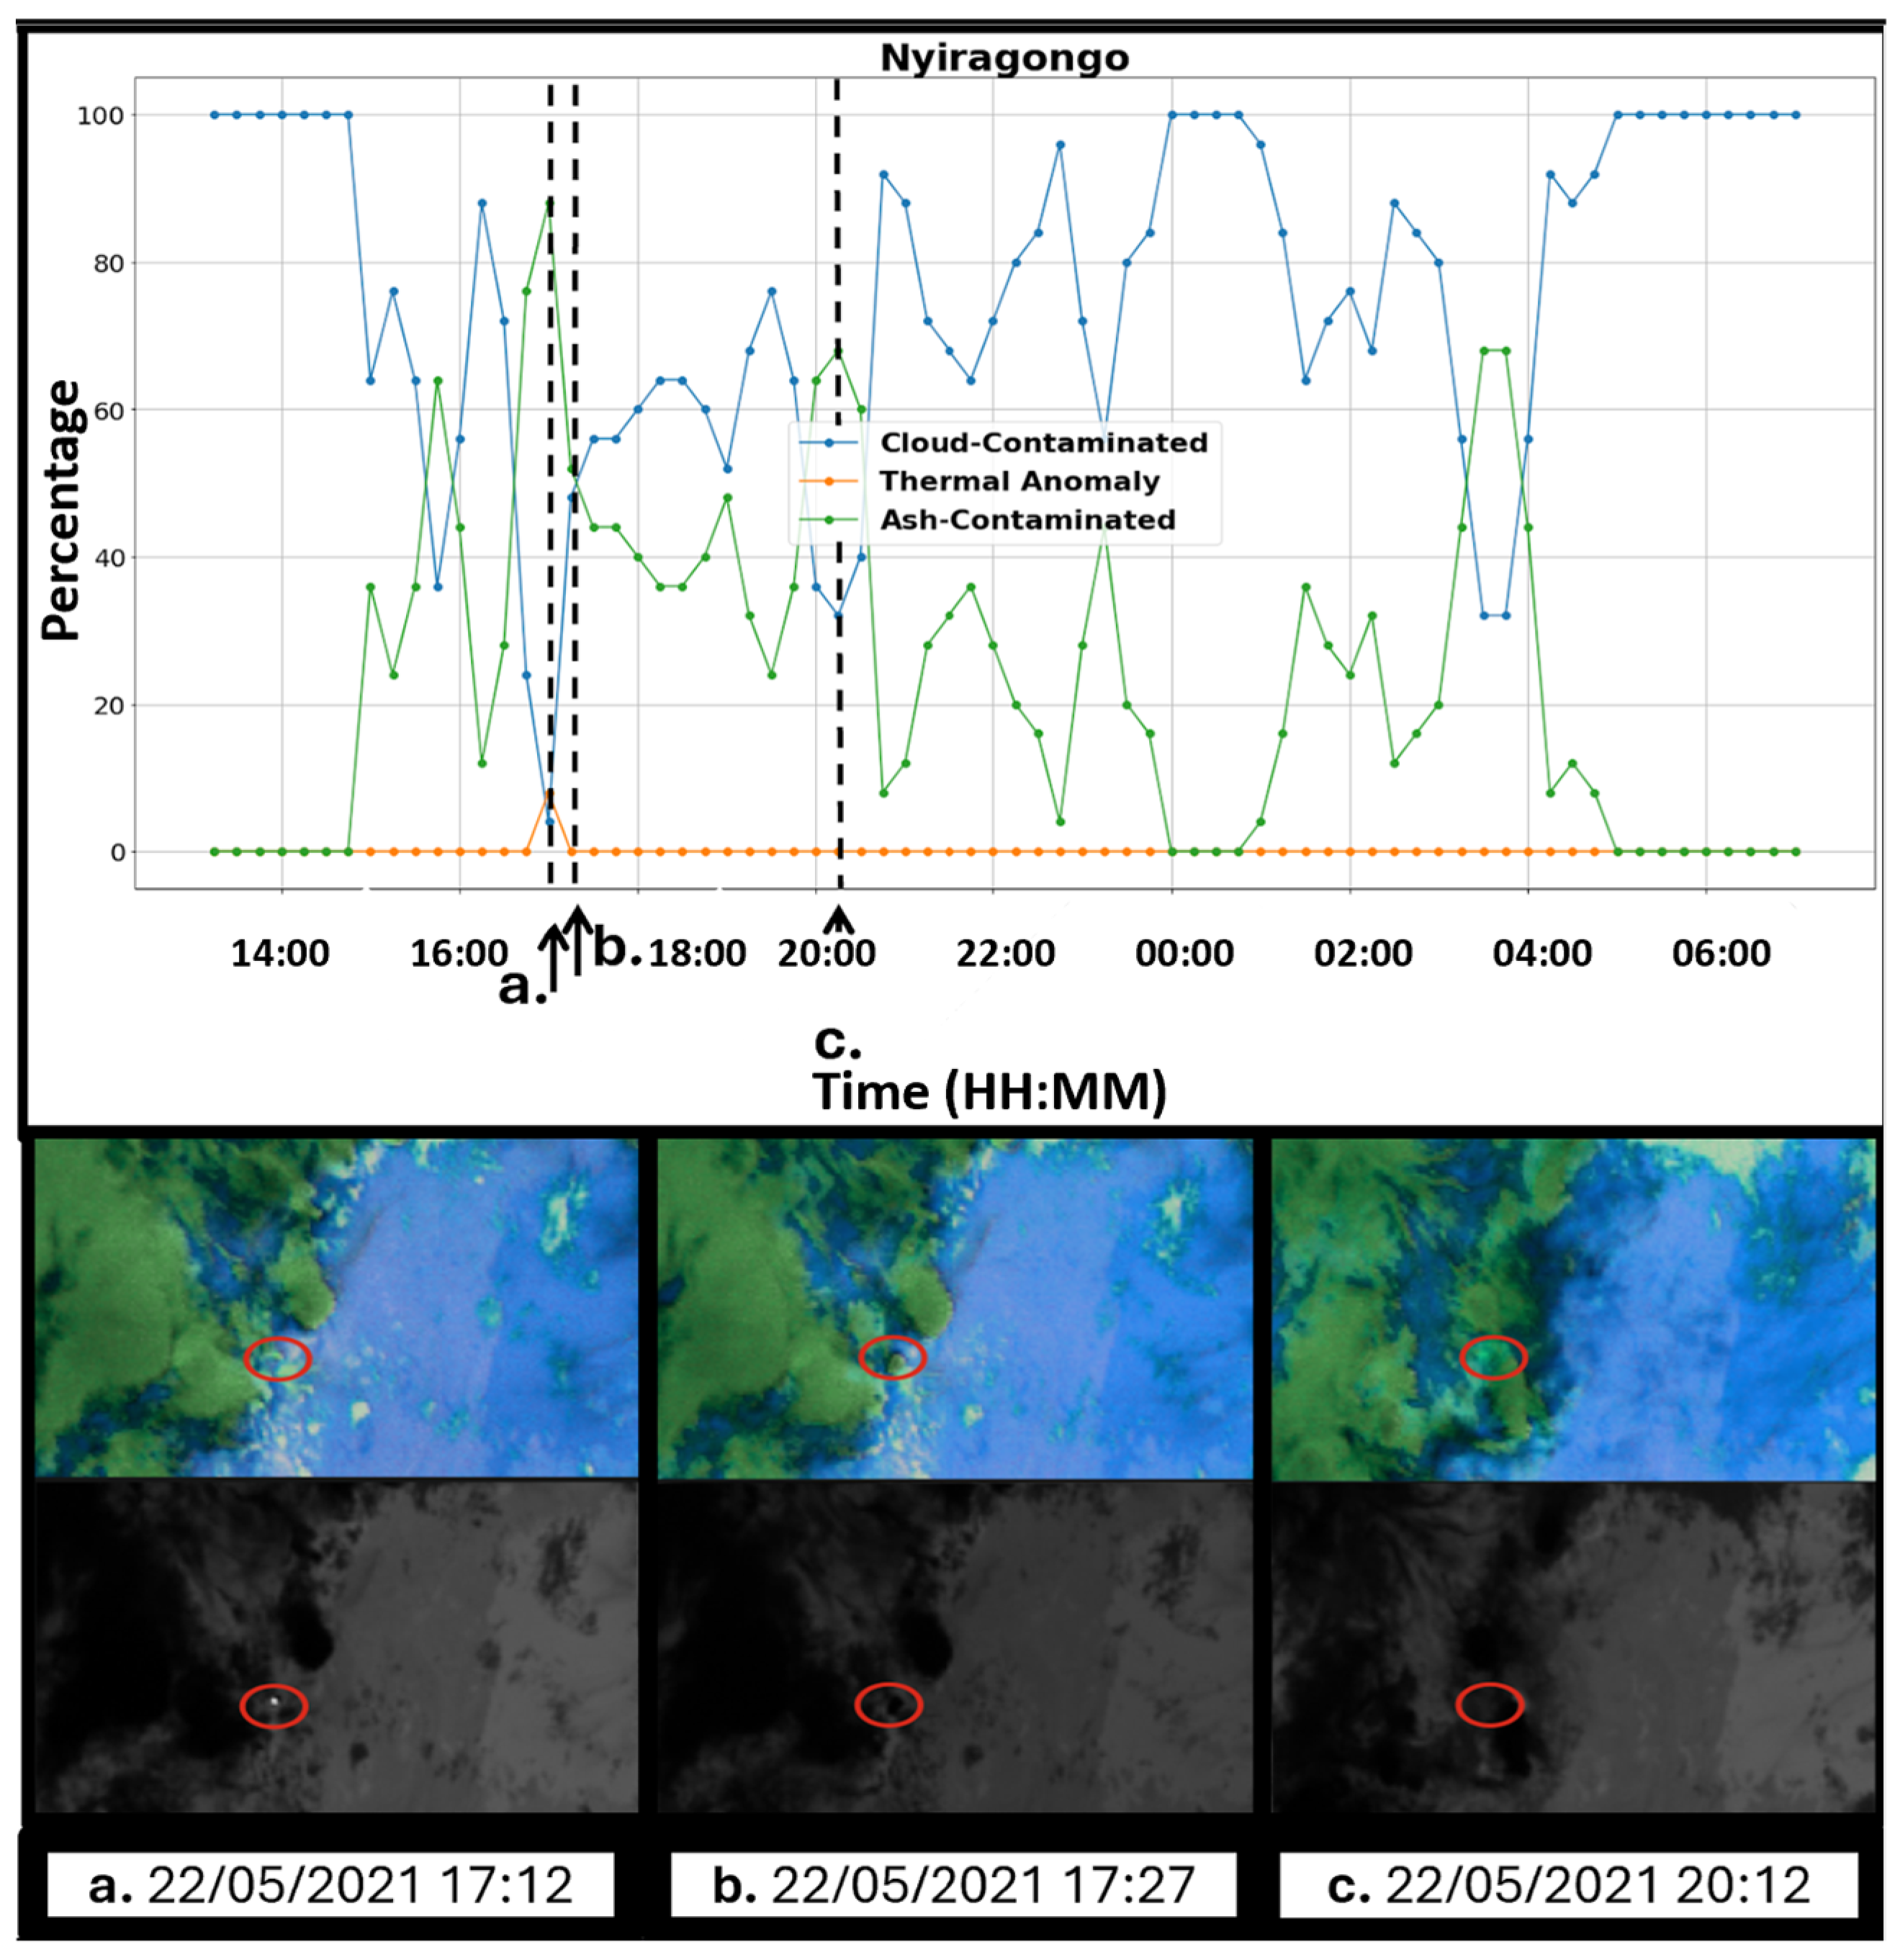
Finally, we characterized the Nyiragongo eruption from 22 to 23 May 2021, known for its catastrophic lava flows that impacted nearby populated areas (Figure 11). We found that the presence of a dense layer of meteorological clouds obscured the effusive activity for almost the entire duration of the eruption. The only moment when it was possible to observe the thermal activity associated with the lava flow, due to a temporary clearing of the cloud cover, was at 17:00 UTC on 22 May (peak of the orange line). For the rest of the eruption, the presence of the eruption was detected exclusively through the presence of ash-contaminated pixels (green line). This behavior was supported by the visual comparison performed between the classification results (pixels belonging to Classes 1, 2, and 3) and the SEVIRI images, confirming the actual meteorological cloud cover, thermal anomaly, and ash cover, respectively (Figure 11).

3.5. Performance Evaluation

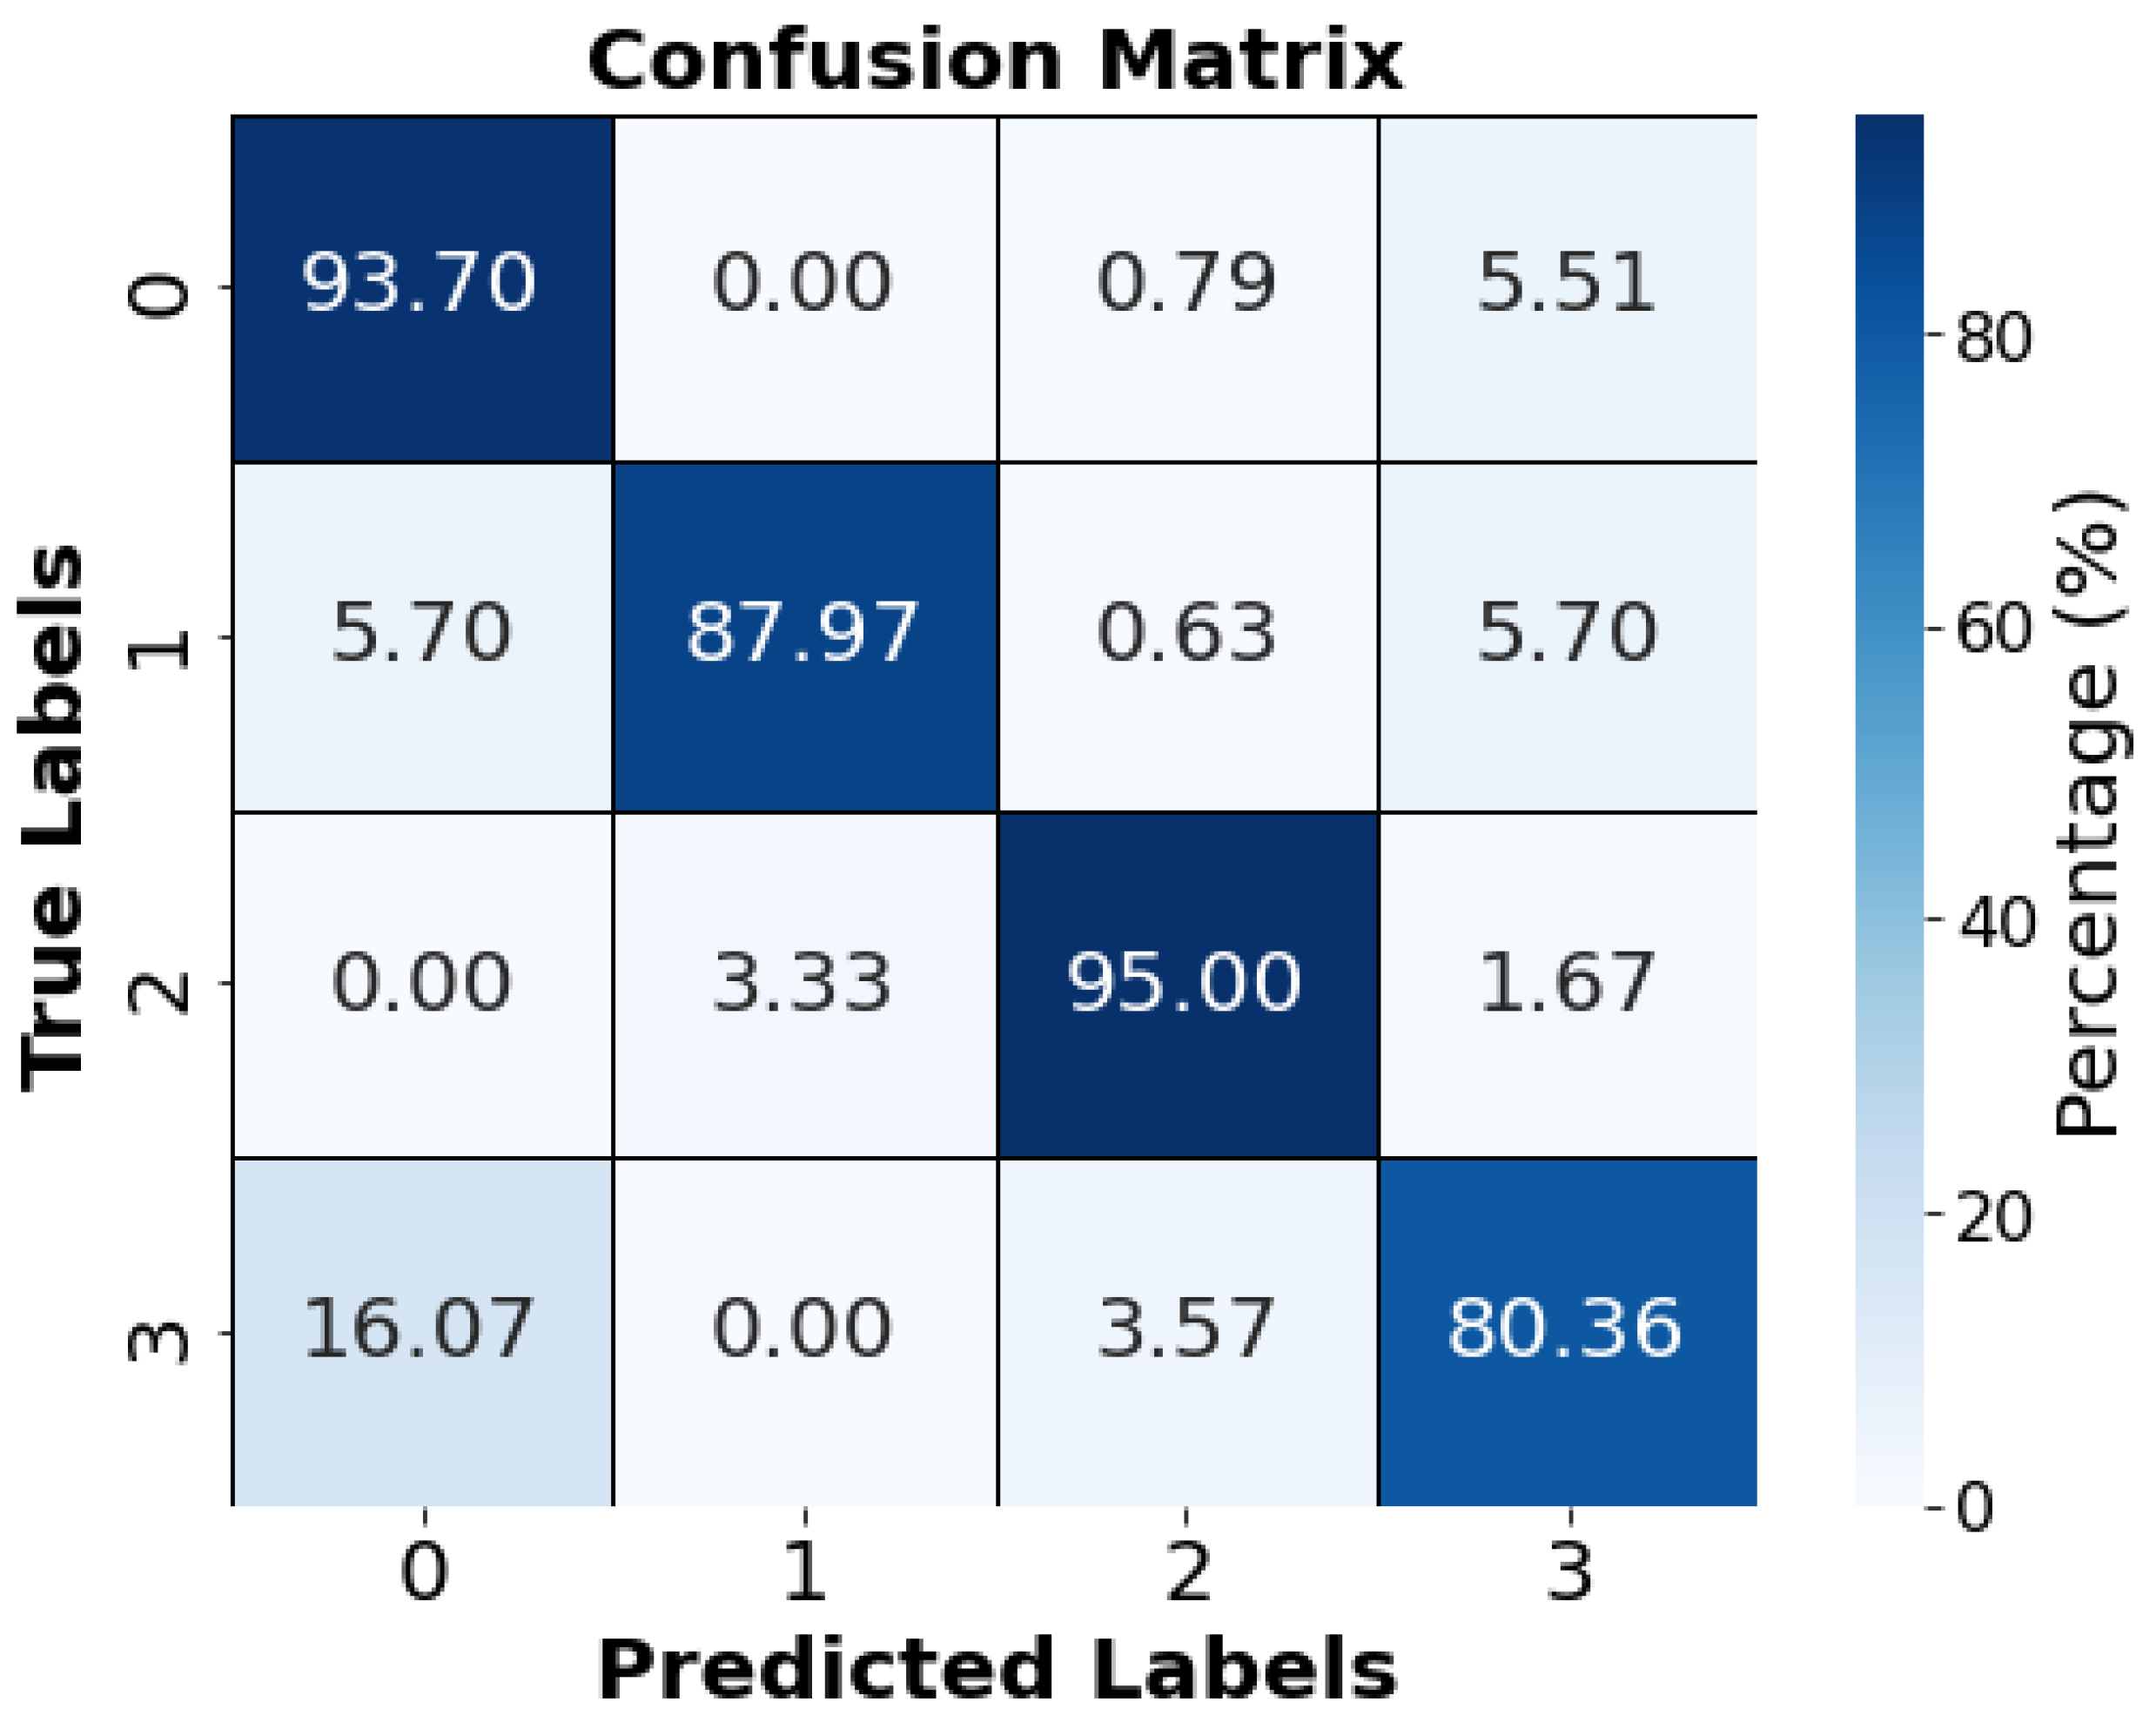
The confusion matrix constructed to evaluate the model performance shows that the ‘clear sky’, ‘cloud-contaminated’, ‘thermal anomaly’, and ‘ash-contaminated’ classes are well distinguished from each other (Figure 12). Indeed, the diagonal elements represent the percentage of correct predictions for each class (from 80.36 to 93.70), while the off-diagonal elements quantify the percentage of classification errors between classes (up to 16.07). This last highest value, due to the ash-contaminated pixels classified as clear sky, corresponds mainly to low-density, semi-transparent ash clouds that are inherently more difficult to detect.
This confusion matrix was used to calculate the macro precision, macro recall and macro F1-score, as described in Section 2.5. The macro precision and macro F1-score reach a value of 0.89, while the macro recall even attained a value of 0.91 (Table 2). This provides an average accuracy of 0.9, demonstrating the high performance of our SGAN model in the classification of the volcanic activity.

4. Discussion

Our SGAN model was able to effectively track the onset, evolution, and end of thermal anomalies and ash clouds associated with volcanic eruptions. From the plots showing the percentages of classified pixels generated by the trained SGAN model, a good correspondence was observed between the classification results and the SEVIRI images. For instance, during the sub-terminal eruption of Etna in July 2006, the model clearly identified the initial phase with a weak ash cloud directed southeastward and subsequently detected a temporary cloud cover that obscured the thermal anomaly. It later demonstrated how the eruptive activity continued with increased thermal intensity and an ash cloud moving southwestward. These findings are in agreement with the ground-based observations of the July 2006 eruption and, in general, with the typical trend in the thermal behavior of the sub-terminal eruptions occurring at Etna since 1970 [38,52,53].
For the 2008–2009 flank eruption, we also revealed the different effusive processes retrieved by the analysis of the time series of radiative power from SEVIRI and MODIS images [40]:
  • the early effusive phase, characterized by the emission of a huge ash plume associated with a lava fountain from the northern part of the eruptive fissure (on 13 May), and the initial increase in the thermal activity;
  • the waning phase, with a decrease in the thermal activity, which continued until 7 June, consistently with the low intensity of volcanic activity revealed by field observations during the same period;
  • the beginning of the rising phase, which lasted until 27 July, and was characterized by alternating periods of high thermal activity and ash emission during the Strombolian activity, which led to highly variable viewing conditions.
Finally, we also monitored the short-lived (a few hours long) phenomena, such as the lava fountain of 22–23 February 2021, with the maximum thermal activity at the eruption climax, when the lava fountain generated lava jets up to a thousand meters high above the SEC. The model also detected the presence of the ash cloud and the thermal anomaly due to the lava flows emitted by eruptive vents opened in the flanks of the SEC. Similarly, during the Stromboli paroxysmal event on 3 July 2019, the model captured the initial explosive phase characterized by thermal anomalies and volcanic clouds, followed by a moment in which the particularly thick ash column temporarily obscured the thermal anomaly. In the subsequent days, the time series of thermal anomalies exhibited a variable trend, with a particularly intense peak on the morning of 4 July. The characteristics of these events confirmed the typical trend in the paroxysmal eruptions, which involve significantly higher emission rates of both tephra and lava emitted in short times, compared to the emission events of lower energy lava flows [54].
In the case of the Tajogaite eruption, the model was able to precisely follow the thermal activity, initially accompanied by meteorological clouds. Then, the explosive activity consisting of alternating lava fountains and rapid Strombolian explosions was revealed, as confirmed by the ground-based observations [55]. The eruption then continued until 13 December 2021 with alternated phases of intense effusive and explosive activity, which led to the formation of a large lava flow field that buried about 3000 private and public buildings [56].
The May 2021 eruption of Mount Nyiragongo represents an isolated case, in which satellite data were only marginally able to follow the eruptive activity, due to dense layers of atmospheric clouds and ash that hindered thermal monitoring. This eruption took the scientific community by surprise due to the apparent lack of short-term precursors. Moreover, the fast-flowing lava traveled several kilometers in a few hours, destroying and/or damaging more than 1000 houses, with worldwide resonance [47].
The visual evidence between the plot of the classified pixels and the SEVIRI images for the different study cases represent a qualitative validation of our SGAN model. However, it is the quantitative performance evaluation that demonstrates the overall high and balanced classification outputted by the model. Indeed, the macro precision of 0.89 suggests that when the model assigns a label to a class, it is correct 89% of the time, reflecting a low false positive rate and good reliability in correctly predicting the classes. The macro recall of 0.91 highlights that the model is able to correctly identify the majority of examples belonging to each class, minimizing false negatives. The slightly higher value of macro recall compared to macro precision indicates that the model tends to identify a slightly greater number of positive examples compared to those correctly predicted. Finally, the macro F1-score of 0.89 confirms that the model maintains a good balance between precision and recall, showing that its predictions are both accurate and complete. The closeness of the F1-score to precision demonstrates that the model does not favor one aspect over the other, ensuring a balanced and reliable performance in multi-class classification.
The exceptional accuracy of the SGAN model has allowed us to identify nuances in eruptive activity that are often overlooked by conventional methods. The detection of these features allows the precise synchronization of significant thermal variations and ash emission. This gives our model high classification capabilities, making it a valuable tool for timely identification and monitoring of volcanic activity, and making it complementary to other satellite-based volcano monitoring systems developed to detect thermal anomalies and estimate radiative power, such as MIROVA [57], MODVOLC [58], and CL-HOTSAT [54].

5. Conclusions

In this work, we have introduced a new semi-supervised GAN model for the detection and characterization of the eruptive activity from SEVIRI imagery. The introduced model has been trained on the Etna volcano and successfully applied to detect eruptions in other volcanoes worldwide (i.e., Stromboli, La Palma, Nyiragongo).
The model classifies pixels in SEVIRI images as ‘clear sky’, ‘cloud-contaminated’, ‘thermal anomaly’, and ‘ash-contaminated’, allowing for the simultaneous analysis of various eruptive activities, such as effusive activity, lava fountains, and ash emission. This capability is essential for a detailed understanding of eruption dynamics (e.g., effusive and explosive activity) and for monitoring their evolution in near real-time.
Undoubtedly, machine learning models, such as the semi-supervised GAN, applied on satellite data, can greatly enhance the capabilities for monitoring and predicting volcanic eruptions, especially in remote and low-monitored volcanic areas. Indeed, these models not only improve the ability to detect and classify volcanic emissions in real-time but can also provide more accurate predictions of potential impact areas, significantly contributing to the safety and protection of populations living near active volcanoes. Additionally, integrating such models into global monitoring systems could facilitate international cooperation in managing volcanic risks, leveraging shared data and resources to enhance emergency response at a global level.
The main limitation of monitoring systems based on satellite data is posed by the atmospheric clouds, which can completely obscure the thermal anomaly, making it difficult to monitor eruptions from space. For example, during the July 2006 eruption of Etna, clouds temporarily prevented the observation of thermal anomalies during one of the critical phases of the eruption. A similar situation occurred during the Nyiragongo eruption, where dense cloud layers made it almost impossible to observe the thermal anomaly, leaving only the presence of ash visible.
Another challenge for the model lies in distinguishing between atmospheric clouds and volcanic plumes rich in water vapor. When volcanic water vapor crystallizes into ice at high altitudes, the spectral signatures resemble those of meteorological clouds, causing classification ambiguities [59]. This issue is evident during the Stromboli event on 3 July 2019, where part of the volcanic plume was erroneously classified as ‘cloud-contaminated’ due to the presence of water vapor. A similar case was observed during the Nyiragongo eruption, where the complexity of atmospheric conditions amplified this difficulty.
It is worth noting that SEVIRI’s spatial resolution (3 km at nadir) limits its ability to detect small-scale thermal phenomena, such as those due to weak Strombolian activity that may precede larger eruptions. On the other hand, sustained Strombolian activity and spattering usually provide a signal that can still be observed. When considering lava temperature (e.g., around 1400 K), a fractional area of only ~300 square meters size may be reliably detected [60]. This limitation can be readily overcome by applying the proposed method to data from the Meteosat Third Generation (MTG) satellite, which carries the Flexible Combined Imager (FCI) capable of acquiring 2 km spatial-resolution imagery in the MIR and TIR wavelengths every 10 min [61].
Future improvements will include integrating data from other satellite sources, such as VIIRS (both at 375 and 750 m) and SLSTR, to enrich the analysis and increase prediction accuracy. These satellites offer different spatial and temporal resolutions, as well as a stereo view in the case of SLSTR that could provide more detailed information on atmospheric conditions and volcanic emission characteristics.
Moreover, the development of more advanced models, such as deep neural networks with more sophisticated semi-supervised learning techniques, capable of handling an even greater amount of unlabeled data, could further enhance the effectiveness of eruption classification techniques. A further step forward will be the use of transfer learning techniques that could enable the rapid adaptation of models to new volcanic areas with limited data, improving model generalization.

Author Contributions

Conceptualization, G.G.; methodology, F.S. and G.G.; implementation, F.S., G.B. and M.S.; validation, F.Z. and A.C.; formal analysis, F.S.; resources, G.G.; data curation, G.B. and A.C.; writing—original draft preparation, F.S. and G.G.; writing—review and editing, F.S. and A.C.; visualization, F.S. and A.C.; supervision, G.G.; funding acquisition, G.G. All authors have read and agreed to the published version of the manuscript.

Funding

We thank the Istituto Nazionale di Geofisica e Vulcanologia, Italy, grant “Progetto INGV Pianeta Dinamico VT SAFARI”—code CUP D53J19000170001—funded by Italian Ministry MIUR (“Fondo Finalizzato al rilancio degli investimenti delle amministrazioni centrali dello Stato e allo sviluppo del Paese”, legge 145/2018).

Data Availability Statement

The original contributions presented in this study are included in the article. Further inquiries can be directed to the corresponding author.

Acknowledgments

We would like to thank EUMETSAT for providing the SEVIRI data which has been fundamental to this study.

Conflicts of Interest

The authors declare no conflicts of interest.

References

  1. Spark, R.S.J.; Aspinal, W.P. Volcanic Activity: Frontiers and challenges in forecasting, prediction and risk assessment. State Planet Front. Chall. Geophys. 2004, 19, 359–373. [Google Scholar]
  2. Sparks, R.S.J. Forecasting volcanic eruptions. Earth Planet. Sci. Lett. 2003, 210, 1–15. [Google Scholar] [CrossRef]
  3. Brown, S.K.; Loughlin, S.C.; Sparks, R.S.J.; Vye-Brown, C.; Barclay, J.; Calder, E.; Cottrell, E.; Jolly, G.; Komorowski, J.-C.; Mandeville, C.; et al. Global Volcanic Hazard and Risk; Cambridge University Press: Cambridge, UK, 2015; Volume 1, pp. 81–172. [Google Scholar]
  4. Chien, S.A.; Davies, A.G.; Doubleday, J.; Tran, D.Q.; Mclaren, D.; Chi, W.; Maillard, A. Automated volcano monitoring using multiple space and ground sensors. J. Aerosp. Inf. Syst. 2020, 17, 214–228. [Google Scholar] [CrossRef]
  5. Beker, T.; Ansari, H.; Montazeri, S.; Song, Q.; Zhu, X.X. Deep learning for subtle volcanic deformation detection with InSAR data in central volcanic zone. IEEE Trans. Geosci. Remote Sens. 2023, 61, 5218520. [Google Scholar] [CrossRef]
  6. Korolev, S.; Urmanov, I.; Sorokin, A.; Girina, O. Detecting Volcano Thermal Activity in Night Images Using Machine Learning and Computer Vision. Remote Sens. 2023, 15, 4815. [Google Scholar] [CrossRef]
  7. Punia, S.K.; Kumar, M.; Stephan, T.; Deverajan, G.G.; Patan, R. Performance analysis of machine learning algorithms for big data classification: Ml and ai-based algorithms for big data analysis. Int. J. E-Health Med. Commun. (IJEHMC) 2023, 12, 60–75. [Google Scholar] [CrossRef]
  8. Tilling, R.I. Volcanic hazards and their mitigation: Progress and problems. Rev. Geophys. 1989, 27, 237–269. [Google Scholar] [CrossRef]
  9. Munappy, A.; Bosch, J.; Olsson, H.H.; Arpteg, A.; Brinne, B. Data management challenges for deep learning. In Proceedings of the 2019 45th Euromicro Conference on Software Engineering and Advanced Applications (SEAA), Kallithea, Greece, 28–30 August 2019. [Google Scholar]
  10. Zhou, L.; Pan, S.; Wang, J.; Vasilakos, A.V. Machine learning on big data: Opportunities and challenges. Neurocomputing 2019, 237, 350–361. [Google Scholar] [CrossRef]
  11. Khalid, S.; Khalil, T.; Nasreen, S. A survey of feature selection and feature extraction techniques in machine learning. In Proceedings of the 2014 Science and Information Conference, London, UK, 27–29 August 2014. [Google Scholar]
  12. Dara, S.; Tumma, P. Feature extraction by using deep learning: A survey. In Proceedings of the 2018 Second International Conference on Electronics, Communication and Aerospace Technology (ICECA), Coimbatore, India, 29–31 March 2018. [Google Scholar]
  13. Valade, S.; Ley, A.; Massimetti, F.; D’Hondt, O.; Laiolo, M.; Coppola, D.; Loibl, D.; Hellwich, O.; Walter, T.R. Towards Global Volcano Monitoring Using Multisensor Sentinel Missions and Artificial Intelligence: The MOUNTS Monitoring System. Remote Sens. 2019, 11, 1528. [Google Scholar] [CrossRef]
  14. Guzman, S.; Carniel, R. Chapter Machine Learning in Volcanology: A Review. In Updates in Volcanology—Transdisciplinary Nature of Volcano Science; Németh, K., Ed.; IntechOpen: London, UK, 2021; pp. 1–26. [Google Scholar]
  15. Giudicepietro, F.; Calvari, S.; Alparone, S.; Bianco, F.; Bonaccorso, A.; Bruno, V.; Caputo, T.; Cristaldi, A.; D’Auria, L.; De Cesare, W.; et al. Integration of Ground-Based Remote-Sensing and In Situ Multidisciplinary Monitoring Data to Analyze the Eruptive Activity of Stromboli Volcano in 2017–2018. Remote Sens. 2019, 11, 1813. [Google Scholar] [CrossRef]
  16. Manley, G.F.; Mather, T.A.; Pyle, D.M.; Clifton, D.A.; Rodgers, M.; Thompson, G.; Londono, J.M. A deep active learning approach to the automatic classification of volcano-seismic events. Front. Earth Sci. 2022, 10, 807926. [Google Scholar] [CrossRef]
  17. Pignatelli, A.; Piochi, M. Machine learning applied to rock geochemistry for predictive outcomes: The Neapolitan volcanic history case. J. Volcanol. Geotherm. Res. 2021, 415, 107254. [Google Scholar] [CrossRef]
  18. Cabrera, L.; Ardid, A.; Melchor, I.; Ruiz, S.; Symmes-Lopetegui, B.; Carlos Báez, J.; Cronin, S. Eruption forecasting model for Copahue volcano (southern Andes) using seismic data and machine learning: A joint interpretation with geodetic data (GNSS and InSAR). Seismol. Res. Lett. 2024, 95, 2595–2610. [Google Scholar] [CrossRef]
  19. Dye, B.C.; Morra, G. Machine learning as a detection method of Strombolian eruptions in infrared images from Mount Erebus, Antarctica. Phys. Earth Planet. Inter. 2020, 305, 106508. [Google Scholar] [CrossRef]
  20. Witsil, A.J.; Johnson, J.B. Volcano video data characterized and classified using computer vision and machine learning algorithms. Geosci. Front. 2020, 11, 1789–1803. [Google Scholar] [CrossRef]
  21. Sun, J.; Wauthier, C.; Stephens, K.; Gervais, M.; Cervone, G.; La Femina, P.; Higgins, M. Automatic detection of volcanic surface deformation using deep learning. J. Geophys. Res. Solid Earth 2020, 125, e2020JB019840. [Google Scholar] [CrossRef]
  22. Fedkin, N.M.; Li, C.; Krotkov, N.A.; Hedelt, P.; Loyola, D.G.; Dickerson, R.R.; Spurr, R. Volcanic SO2 effective layer height retrieval for the Ozone Monitoring Instrument (OMI) using a machine-learning approach. Atmos. Meas. Tech. 2021, 14, 3673–3691. [Google Scholar] [CrossRef]
  23. Romeo, F.; Mereu, L.; Scollo, S.; Papa, M.; Corradini, S.; Merucci, L.; Marzano, F.S. Volcanic Cloud Detection and Retrieval Using Satellite Multisensor Observations. Remote Sens. 2023, 15, 888. [Google Scholar] [CrossRef]
  24. Saunders-Shultz, P. Deep Learning Detection and Quantification of Volcanic Thermal Signals in Infrared Satellite Data. Master’s Thesis, University of Alaska Fairbanks, Fairbanks, AK, USA, 2024. [Google Scholar]
  25. Usama, M.; Qadir, J.; Raza, A.; Arif, H.; Yau, K.L.A.; Elkhatib, Y.; Al-Fuqaha, A. Unsupervised machine learning for networking: Techniques, applications and research challenges. IEEE Access 2019, 7, 65579–65615. [Google Scholar] [CrossRef]
  26. Gupta, S.; Gupta, A. Dealing with noise problem in machine learning data-sets: A systematic review. Procedia Comput. Sci. 2019, 161, 466–474. [Google Scholar] [CrossRef]
  27. Nasteski, V. An overview of the supervised machine learning methods. Horizons 2017, 4, 56. [Google Scholar] [CrossRef]
  28. Zhu, X.; Goldberg, A.B. Introduction to Semi-Supervised Learning; Springer Nature: Cham, Switzerland, 2022. [Google Scholar]
  29. Odena, A. Semi-Supervised Learning with Generative Adversarial Networks. arXiv 2016, arXiv:1606.01583. [Google Scholar]
  30. Kerkmann, J.; Lutz, H.J.; König, M.; Prieto, J.; Pylkko, P.; Roesli, H.P.; Rosenfeld, D.; Zwatz-Meise, V.; Schmetz, J.; Schipper, J.; et al. MSG Channels, Interpretation Guide, Weather, Surface Conditions and Atmospheric Constituents. 2004. Available online: https://rammb.cira.colostate.edu/wmovl/vrl/pptlectures/eumetsat/index.html (accessed on 7 May 2025).
  31. Wooster, M.J.; Roberts, G.; Freeborn, P.H.; Xu, W.; Govaerts, Y.; Beeby, R.; He, J.; Lattanzio, A.; Fisher, D.; Mullen, R. LSA SAF Meteosat FRP products–Part 1: Algorithms, product contents, and analysis. Atmos. Chem. Phys. 2015, 15, 13217–13239. [Google Scholar] [CrossRef]
  32. Debaecker, V.; Kocaman, S.; Saunier, S.; Garcia, K.; Bas, S.; Just, D. On the geometric accuracy and stability of MSG SEVIRI images. Atmos. Environ. 2021, 262, 118645. [Google Scholar] [CrossRef]
  33. Marchese, F.; Falconieri, A.; Filizzola, C.; Pergola, N.; Tramutoli, V. Investigating Volcanic Plumes from Mt. Etna Eruptions of December 2015 by Means of AVHRR and SEVIRI Data. Sensors 2019, 19, 1174. [Google Scholar] [CrossRef] [PubMed]
  34. Alonso, C.; Durão, R.; Gouveia, C.M. A Year of Volcanic Hot-Spot Detection over Mediterranean Europe Using SEVIRI/MSG. Remote Sens. 2023, 15, 5219. [Google Scholar] [CrossRef]
  35. Ganci, G.; Cappello, A.; Zago, V.; Bilotta, G.; Herault, A.; Del Negro, C. 3D Lava flow mapping of the 17–25 May 2016 Etna eruption using tri-stereo optical satellite data. Ann. Geophys. 2019, 62, VO220. [Google Scholar] [CrossRef]
  36. Del Negro, C.; Cappello, A.; Neri, M.; Bilotta, G.; Hérault, A.; Ganci, G. Lava flow hazards at Mount Etna: Constraints imposed by eruptive history and numerical simulations. Sci. Rep. 2013, 3, 3493. [Google Scholar]
  37. Gieske, A.S.M.; Hendrikse, J.H.M.; Retsios, V.; Van Leeuwen, B.; Maathuis, B.H.P.; Albentosa, M.R.; Sobrino, J.A.; Timmermans, W.J.; Su, Z. Processing of MSG-1 SEVIRI Data in the Thermal Infrared-Algorithm Development with the Use of the SPARC2004 Data Set. In Proceedings of the ESA WPP-250 SPARC Final Workshop, Enschede, The Netherlands, 4–5 July 2005. [Google Scholar]
  38. Zuccarello, F.; Bilotta, G.; Ganci, G.; Proietti, C.; Cappello, A. Assessing impending hazards from summit eruptions: The new probabilistic map for lava flow inundation at Mt. Etna. Sci. Rep. 2023, 13, 19543. [Google Scholar] [CrossRef]
  39. Del Negro, C.; Cappello, A.; Ganci, G. Quantifying lava flow hazards in response to effusive eruption. Bulletin 2016, 128, 752–763. [Google Scholar] [CrossRef]
  40. Ganci, G.; Vicari, A.; Cappello, A.; Del Negro, C. An emergent strategy for volcano hazard assessment: From thermal satellite monitoring to lava flow modeling. Remote Sens. Environ. 2012, 119, 197–207. [Google Scholar] [CrossRef]
  41. Rosi, M.; Bertagnini, A.; Landi, P. Onset of the persistent activity at Stromboli volcano (Italy). Bull. Volcanol. 2000, 62, 294–300. [Google Scholar] [CrossRef]
  42. Mattia, M.; Di Lieto, B.; Ganci, G.; Bruno, V.; Romano, P.; Ciancitto, F.; De Martino, P.; Gambino, S.; Aloisi, M.; Sciotto, M. The 2019 Eruptive Activity at Stromboli Volcano: A Multidisciplinary Approach to Reveal Hidden Features of the “Unexpected” 3 July Paroxysm. Remote Sens. 2021, 13, 4064. [Google Scholar] [CrossRef]
  43. Civico, R.; Ricci, T.; Scarlato, P.; Taddeucci, J.; Andronico, D.; Del Bello, E.; Pérez, N.M. High-resolution digital surface model of the 2021 eruption deposit of Cumbre Vieja volcano, La Palma, Spain. Sci. Data 2022, 9, 435. [Google Scholar] [CrossRef] [PubMed]
  44. Sicard, M.; Córdoba-Jabonero, C.; Barreto, A.; Welton, E.J.; Gil-Díaz, C.; Carvajal-Pérez, C.V.; Comerón, A.; García, O.; García, R.; López-Cayuela, M.-Á. Volcanic Eruption of Cumbre Vieja, La Palma, Spain: A First Insight to the Particulate Matter Injected in the Troposphere. Remote Sens. 2022, 14, 2470. [Google Scholar] [CrossRef]
  45. Day, S.J.; Carracedo, J.C.; Guillou, H.; Gravestock, P. Recent structural evolution of the Cumbre Vieja volcano, La Palma, Canary Islands: Volcanic rift zone reconfiguration as a precursor to volcano flank instability? J. Volcanol. Geotherm. Res. 1999, 94, 135–167. [Google Scholar] [CrossRef]
  46. Hamaguchi, H.; Nishimura, T.; Zana, N. Process of the 1977 Nyiragongo eruption inferred from the analysis of long-period earthquakes and volcanic tremors. Tectonophysics 1992, 209, 241–254. [Google Scholar] [CrossRef]
  47. Tedesco, D.; Vaselli, O.; Papale, P.; Carn, S.A.; Voltaggio, M.; Sawyer, G.M.; Tassi, F. January 2002 volcano-tectonic eruption of Nyiragongo volcano, Democratic Republic of Congo. J. Geophys. Res. Solid Earth 2007, 112, B09202. [Google Scholar] [CrossRef]
  48. Boudoire, G.; Calabrese, S.; Colacicco, A.; Sordini, P.; Macumu, P.H.; Rafflin, V.; Valade, S.; Mweze, T.; Mwepu, J.-C.K.; Habari, F.S.; et al. Scientific response to the 2021 eruption of Nyiragongo based on the implementation of a participatory monitoring system. Sci. Rep. 2022, 12, 7488. [Google Scholar] [CrossRef]
  49. Goodfellow, I.; Pouget-Abadie, J.; Mirza, M.; Xu, B.; Warde-Farley, D.; Ozair, S.; Bengio, Y. Generative adversarial networks. Commun. ACM 2020, 63, 139–144. [Google Scholar] [CrossRef]
  50. Métrich, N.; Bertagnini, A.; Pistolesi, M. Paroxysms at Stromboli volcano (Italy): Source, genesis and dynamics. Front. Earth Sci. 2021, 9, 593339. [Google Scholar] [CrossRef]
  51. INGV-OE Bulletin. Available online: https://www.ct.ingv.it/index.php/monitoraggio-e-sorveglianza/prodotti-del-monitoraggio/bollettini-settimanali-multidisciplinari (accessed on 17 December 2024).
  52. Andronico, D.; Spinetti, C.; Cristaldi, A.; Buongiorno, M.F. Observations of Mt. Etna volcanic ash plumes in 2006: An integrated approach from ground-based and polar satellite NOAA–AVHRR monitoring system. J. Volcanol. Geotherm. Res. 2009, 180, 135–147. [Google Scholar] [CrossRef]
  53. Neri, M.; Behncke, B.; Burton, M.; Galli, G.; Giammanco, S.; Pecora, E.; Reitano, D. Continuous soil radon monitoring during the July 2006 Etna eruption. Geophys. Res. Lett. 2006, 33, L24316. [Google Scholar] [CrossRef]
  54. Ganci, G.; Bilotta, G.; Zuccarello, F.; Calvari, S.; Cappello, A. A Multi-Sensor Satellite Approach to Characterize the Volcanic Deposits Emitted during Etna’s Lava Fountaining: The 2020–2022 Study Case. Remote Sens. 2023, 15, 916. [Google Scholar] [CrossRef]
  55. Romero, J.E.; Burton, M.; Cáceres, F.; Taddeucci, J.; Civico, R.; Ricci, T.; Perez, N.M. The initial phase of the 2021 Cumbre Vieja ridge eruption (Canary Islands): Products and dynamics controlling edifice growth and collapse. J. Volcanol. Geotherm. Res. 2022, 431, 107642. [Google Scholar] [CrossRef]
  56. Biass, S.; Reyes-Hardy, M.P.; Gregg, C.; Di Maio, L.S.; Dominguez, L.; Frischknecht, C.; Perez, N. The spatiotemporal evolution of compound impacts from lava flow and tephra fallout on buildings: Lessons from the 2021 Tajogaite eruption (La Palma, Spain). Bull. Volcanol. 2024, 86, 10. [Google Scholar] [CrossRef] [PubMed]
  57. Coppola, D.; Laiolo, M.; Cigolini, C.; Massimetti, F.; Delle Donne, D.; Ripepe, M.; Arias, H.; Barsotti, S.; Parra, C.B.; Centeno, R.G.; et al. Thermal Remote Sensing for Global Volcano Monitoring: Experiences from the MIROVA System. Front. Earth Sci. 2020, 7, 362. [Google Scholar] [CrossRef]
  58. Wright, R.; Flynn, L.P.; Garbeil, H.; Harris, A.J.L.; Pilger, E. MODVOLC: Near-real-time thermal monitoring of global volcanism. J. Volcanol. Geotherm. Res. 2004, 135, 29–49. [Google Scholar] [CrossRef]
  59. Prata, F.; Lynch, M. Passive Earth Observations of Volcanic Clouds in the Atmosphere. Atmosphere 2019, 10, 199. [Google Scholar] [CrossRef]
  60. Wooster, M.J.; Roberts, G.; Perry, G.L.W.; Kaufman, Y.J. Retrieval of biomass combustion rates and totals from fire radiative power observations: FRP derivation and calibration relationships between biomass consumption and fire radiative energy release. J. Geophys. Res. Atmos. 2005, 110, D24311. [Google Scholar] [CrossRef]
  61. Ganci, G.; Bilotta, G.; Zuccarello, F.; Cappello, A. Opportunities Offered by the MTG Flexible Combined Imager for Volcano Monitoring. In Proceedings of the IGARSS 2023—2023 IEEE International Geoscience and Remote Sensing Symposium, Pasadena, CA, USA, 16–21 July 2023; pp. 4746–4747. [Google Scholar]
Figure 1. The four volcanoes that are considered as case studies: Etna and Stromboli (Italy), Tajogaite in La Palma Island (Spain), and Nyiragongo (Democratic Republic of Congo).
Remotesensing 17 01679 g001
Figure 2. Flowchart of the semi-supervised GAN model.
Remotesensing 17 01679 g002
Figure 3. The 5 × 5 pixel grids (red square) centered on the summit area of each analyzed volcano, called SEVIRI scenes.
Remotesensing 17 01679 g003
Figure 4. (top) Temporal variation in the pixel percentages in the 5 × 5 grid centered on the summit area of Mount Etna from 14 to 24 July 2006 at Etna. Letters ac show the timing of the SEVIRI scenes in the lower panel; (below) RGB composite (IR12.0 − IR10.8, IR10.8 − IR8.7, IR10.8) and IR3.9 of the SEVIRI images that show the thermal anomaly increasing and a thin ash cloud (snapshot a, on 15 July), the dense cloud layer completely obscuring the thermal anomaly (snapshot b, on 18 July), and an evident thermal anomaly without cloud interference (snapshot c, on 22 July).
Remotesensing 17 01679 g004
Figure 5. (top) Temporal variation in the pixel percentages in the 5 × 5 grid centered on the summit area of Mt Etna from 12 to 23 May 2008. Letters ac show the timing of the SEVIRI scenes in the lower panel; (below) RGB composite (IR12.0 − IR10.8, IR10.8 − IR8.7, IR10.8) and IR3.9 of the SEVIRI images that show the thermal anomaly increasing and an ash plume (snapshot a, on 13 May), a moment without meteorological and volcanic clouds, and a moment in which the thermal anomaly is clearly visible (snapshot b, on 17 May), and a situation where thick cloud coverage completely covers the thermal anomaly (snapshot c, on 21 May).
Remotesensing 17 01679 g005
Figure 6. (top) Temporal variation in the pixel percentages in the 5 × 5 grid centered on the summit area of Mt Etna from 24 May to 5 June 2008. Letters ac show the timing of the SEVIRI scenes in the lower panel; (below) RGB composite (IR12.0 − IR10.8, IR10.8 − IR8.7, IR10.8) and IR3.9 of the SEVIRI images that show the weak thermal anomaly accompanied by the presence of an ash plume (snapshot a, on 27 May and snapshot b, on 28 May) and the dense cloud layer completely obscuring the thermal anomaly (snapshot c, on 4 June).
Remotesensing 17 01679 g006
Figure 7. (top) Temporal variation in the pixel percentages in the 5 × 5 grid centered on the summit area of Mt Etna from 4 to 18 June 2008. Letters ac show the timing of the SEVIRI scenes in the lower panel; (below) RGB composite (IR12.0 − IR10.8, IR10.8 − IR8.7, IR10.8) and IR3.9 of the SEVIRI images that show the thermal anomaly (snapshot a, on 7 June), the presence of the thermal anomaly and ash plume (snapshot b, on 10 June) and an evident thermal anomaly without cloud interference (snapshot c, on 16 June).
Remotesensing 17 01679 g007
Figure 8. (top) Temporal variation in the pixel percentages in the 5 × 5 grid centered on the summit area of Mt Etna from 22 February at 18:00 UTC to 23 February 2022 at 23:00 UTC. Letters ac show the timing of the SEVIRI scenes in the lower panel; (below) RGB composite (IR12.0 − IR10.8, IR10.8 − IR8.7, IR10.8) and IR3.9 of the SEVIRI images that show the thermal anomaly due to the lava fountain and the ash cloud toward north-west (snapshot a, on 23 February at 00:57 GMT), and the thermal anomaly due to the lava flows (snapshot b and c, on 23 February at 04:42 and 9:27 GMT, respectively).
Remotesensing 17 01679 g008
Figure 9. (top) Temporal variation in the pixel percentages in the 5 × 5 grid centered on the summit area of Stromboli from 3 July at 13:00 UTC to 4 July 2019 at 07:00 UTC. Letters ac show the timing of the SEVIRI scenes in the lower panel; (below) the corresponding satellite images, RGB composite (IR12.0 − IR10.8, IR10.8 − IR8.7, IR10.8), and IR3.9, of the first thermal anomaly (snapshot a), of the ash and water vapor clouds that obscure the thermal anomaly (snapshot b), and of the explosive/effusive phase (snapshot c).
Remotesensing 17 01679 g009
Figure 10. (top) Temporal variation in the pixel percentages in the 5 × 5 grid centered on the summit area of Tajogaite from 19 September at 12:00 UTC to 20 September 2021 at 07:00 UTC. Letters ac show the timing of the SEVIRI scenes in the lower panel; (below) the corresponding satellite images, RGB composite (IR12.0 − IR10.8, IR10.8 − IR8.7, IR10.8), and IR3.9, showing the very initial phase of the eruption, with a weak thermal anomaly and atmospheric clouds (snapshot a), the thermal anomaly and ash cloud (snapshot b), and the intensification in the eruptive activity due to the ash dispersion (snapshot c).
Remotesensing 17 01679 g010
Figure 11. (top) Temporal variation in the pixel percentages in the 5 × 5 grid centered on the summit area of Nyiragongo (inside red circles in the images) from 22 to 23 May 2021. Letters ac show the timing of the SEVIRI scenes in the lower panel; (below) the corresponding satellite images, RGB composite (IR12.0 − IR10.8, IR10.8 − IR8.7, IR10.8), and IR3.9, showing the only time where the thermal anomaly is observable (snapshot a), and plumes of water vapor and ash that obscure the thermal anomaly (snapshots b and c).
Remotesensing 17 01679 g011
Figure 12. Confusion matrix for the testing of the semi-supervised GAN model on Etna volcano.
Remotesensing 17 01679 g012
Table 1. SEVIRI channels used in this work, together with the main characteristics of each spectral band.
ChannelsCharacteristics of Spectral Band (μm)
λcenλminλmax
1VIS0.60.6350.560.71
2VIS0.80.810.740.88
3NIR1.61.641.501.78
4IR3.93.903.484.56
5WV6.26.255.357.15
6WV7.37.356.857.85
7IR8.78.708.309.10
8IR9.79.669.389.94
9IR10.810.809.8011.80
10IR12.012.0011.0013.00
11IR13.413.4012.4014.40
Table 2. Metrics used to evaluate the SGAN model performance.
MetricsValue
Macro Precision0.89
Macro Recall0.91
Macro F1-Score0.89
Disclaimer/Publisher’s Note: The statements, opinions and data contained in all publications are solely those of the individual author(s) and contributor(s) and not of MDPI and/or the editor(s). MDPI and/or the editor(s) disclaim responsibility for any injury to people or property resulting from any ideas, methods, instructions or products referred to in the content.