Article

Vegetation Growth Changes and Their Constraining Effects on Ecosystem Services Under Ecological Restoration in the Shendong Mining Area

School of Surveying and Land Information Engineering, Henan Polytechnic University, Jiaozuo 454003, China
*
Author to whom correspondence should be addressed.
Remote Sens. 2025, 17(10), 1674; https://doi.org/10.3390/rs17101674
Submission received: 25 March 2025 / Revised: 21 April 2025 / Accepted: 8 May 2025 / Published: 9 May 2025

Abstract

Under the ecological restoration project, the vegetation in the mining area shows a significant improvement trend. Exploring the causal relationship among the implementation of ecological restoration projects in mining areas, vegetation restoration, and the improvement of ecosystem service functions is of great significance for the current green development of coal mines. Therefore, in this study, we used the kernel Normalized Vegetation Index (kNDVI) to measure how vegetation growth has changed since ecological restoration projects began. Changes in four major ecosystem service functions, including soil conservation, net primary productivity (NPP), water yield, and habitat quality, were assessed before and after the restoration projects. The relationship between kNDVI and ecosystem services was further discussed by using the constraint line method. The results show the following: (1) Under the implementation of ecological restoration projects from 1994 to 2022, the annual vegetation growth rate in the mining area has progressively risen each year at a rate of 0.0046/a. Spatially speaking, 90.44% of the mining area had a substantial upward trend, indicating clear evidence of vegetation restoration. (2) Under the scientific ecological restoration of the mining areas, the total ecosystem service index increased from 0.41 in 1994 to 0.49 in 2022. The functions of ecosystem services have been enhanced to differing extents. (3) KNDVI’s constraint effect on the four ecosystem services changed dramatically before and after the ecological restoration effort. After the ecological restoration project, kNDVI’s constraint on ecosystem services decreased. (4) After restoration, the threshold value of kNDVI for maximizing the benefits of the four ecosystem services ranges from 0.1 to 0.2, and the constraint on the total ecosystem services reaches the threshold value of 0.225. This study employs more comprehensive data to examine the intricate relationship between environmental change and service function, which is crucial for the scientific management of ecological processes and facilitates the sustainable green development of mining areas.

1. Introduction

As a core element of the global energy mix, coal is crucial to global energy supply, supporting 37% of global electricity demand [1]. Nonetheless, coal mining and its utilization frequently inflict harm on flora and natural ecosystems. Coal mining usually involves large-scale land excavation, destroying surface vegetation and soil structure, which leads to land degradation and ecosystem imbalance [2,3,4]. To resolve the contradiction between coal production and ecology, governments of various countries and international organizations have taken measures one after another to reduce the ecological damage caused by the development of coal resources [5]. For example, one could refer to improving coal mining techniques to reduce land destruction and water pollution; strengthening environmental supervision to ensure that coal enterprises fulfill their environmental responsibility; promoting the transformation of energy structure, developing clean energy, and gradually reducing reliance on coal [6,7]. The Chinese government has implemented a series of policies and measures, including land reclamation, ecological restoration, and afforestation, to improve the ecological environment quality of mining areas [8,9]. However, scientifically and accurately evaluating the benefits of ecological restoration engineering in mining areas and determining the threshold for environmental adaptation under ecological restoration projects are still the key problems for the authorities.
There are complex nonlinear relationships among ecosystem services, and the threshold effect is significant. Studies show that when key driving factors, such as vegetation coverage, precipitation, or the intensity of human intervention reach specific critical values, the enhancement effect of ecosystem services will weaken or even reverse [10,11]. For example, after the vegetation coverage threshold under forest and grassland types in the Loess Plateau exceeds the threshold, the gains of carbon fixation and soil conservation services tend to saturate [12]. Secondly, the trade-offs and collaborative relationships of ecosystem services change dynamically and require multi-objective optimization. Ecological restoration measures may simultaneously affect multiple services, manifested as synergy (such as carbon sinks and biodiversity conservation) or trade-offs (such as supply services and regulation services) [13]. For instance, while the project of returning farmland to forest enhances regulatory services (such as soil and water conservation), it may weaken agricultural supply services [14]. Although large-scale afforestation can increase carbon storage, it may lead to a decline in biodiversity due to a single tree species [15]. Especially in the context of the destruction and degradation of the ecosystem service functions in mining areas, a series of ecological restoration measures have been considered to adjust the land use pattern and achieve sustainable ecological benefits. However, the ecosystem services in mining areas are complex and diverse, and the improvement of one ecosystem service function may lead to the weakening of another ecosystem service function, resulting in a conflict between ecosystem services [16,17]. Consequently, it is imperative to implement appropriate strategies to harmonize the restoration of ecosystem services to satisfy the demand for these services. The Shendong mining area is one of the largest coal mines in the world [18]. In view of the ecological damage, this region has implemented proactive restoration initiatives to address the ecological issues resulting from coal mining. One of the most notable initiatives is the “returning farmland to forest project”. Previous studies have found that vegetation restoration measures increase soil conservation capacity, reduce water loss from surface runoff, and create a habitat for a variety of plant and animal species [19,20]. However, excessive restoration may consume a large amount of water resources and lead to soil water depletion [21]. Therefore, the continuous increase in vegetation growth does not necessarily lead to a corresponding increase in ecosystem service functions [22]. Because of this, we need to reconsider the discrepancy between the unique conditions of plant growth and the advantages to ecosystem services.
The most basic step of ecological restoration measures is to determine the degree and goal of restoration and maximize the benefits of integrating multiple ecosystem services [23]. The key core problem is to determine the optimal vegetation growth rate under the maximum benefit of ecosystem services. Relevant studies have shown that the interaction between different ecosystem services will, to a certain extent, hinder the simultaneous improvement of each ecosystem service function [24,25]. Up to now, relevant studies have revealed the degree of trade-off or synergy among ecosystem services. The trade-off–synergy relationship of ecosystem services is statistically characterized using the constraint line approach, illustrating the nonlinear variations in their interaction, initiated by the initial synergy and followed by a trade-off dynamics [26,27]. Previous studies have analyzed the relationship between vegetation growth and ecosystem services, and have discussed how changes in vegetation growth affect the provision of ecosystem services on a specific time scale [28]. This relationship, however, might be different on a larger time scale. With the increase in vegetation growth, the interaction between ecosystem services also changes [29]. The constraint effect between ecosystem services and plant growth aids in determining optimal restoration targets and tactics, enabling the formulation of targeted countermeasures based on the efficacy of vegetation restoration. Previous studies have proved the existence of a threshold effect. With the increase in vegetation growth, once it exceeds a certain critical threshold, the improvement of ecosystem service function is no longer sustainable [13,30]. Even small changes in vegetation growth can lead to significant changes in ecosystem services. As a result, applying the same ecosystem restoration goals across the entire coal mine region, without taking into account the changes in mining intensity and function, may result in suboptimal restoration results and forfeit enhanced ecosystem service advantages. Therefore, it is important to determine the appropriate vegetation growth threshold for sustainable ecological restoration, especially in areas with complex ecosystems such as mining sites.
Ecological restoration projects promote some ecosystem services by increasing vegetation [31], and there is a potential constraint relationship between vegetation growth and ecosystem services. By quantifying the complex nonlinear relationship between vegetation growth and ecosystem services, constraint lines are constructed to determine the threshold of the impact of vegetation on ecosystem services. The results could be used as an important reference for ecological restoration projects. This study will quantitatively analyze the change trend of vegetation growth since the implementation of the ecological restoration project. At the same time, according to the four main types of ecosystem services used in the existing research on the impact of ecological restoration on ecosystem services in Shendong mining area, we will evaluate the changes in the main ecosystem service functions. We will explore the relationship between ecosystem service functions and vegetation growth, and determine the threshold of the impact of vegetation growth on ecosystem services. The research results can help determine the best combination of vegetation growth and ecosystem services and provide a theoretical reference for ecosystem-based adaptive management.

2. Materials and Methods
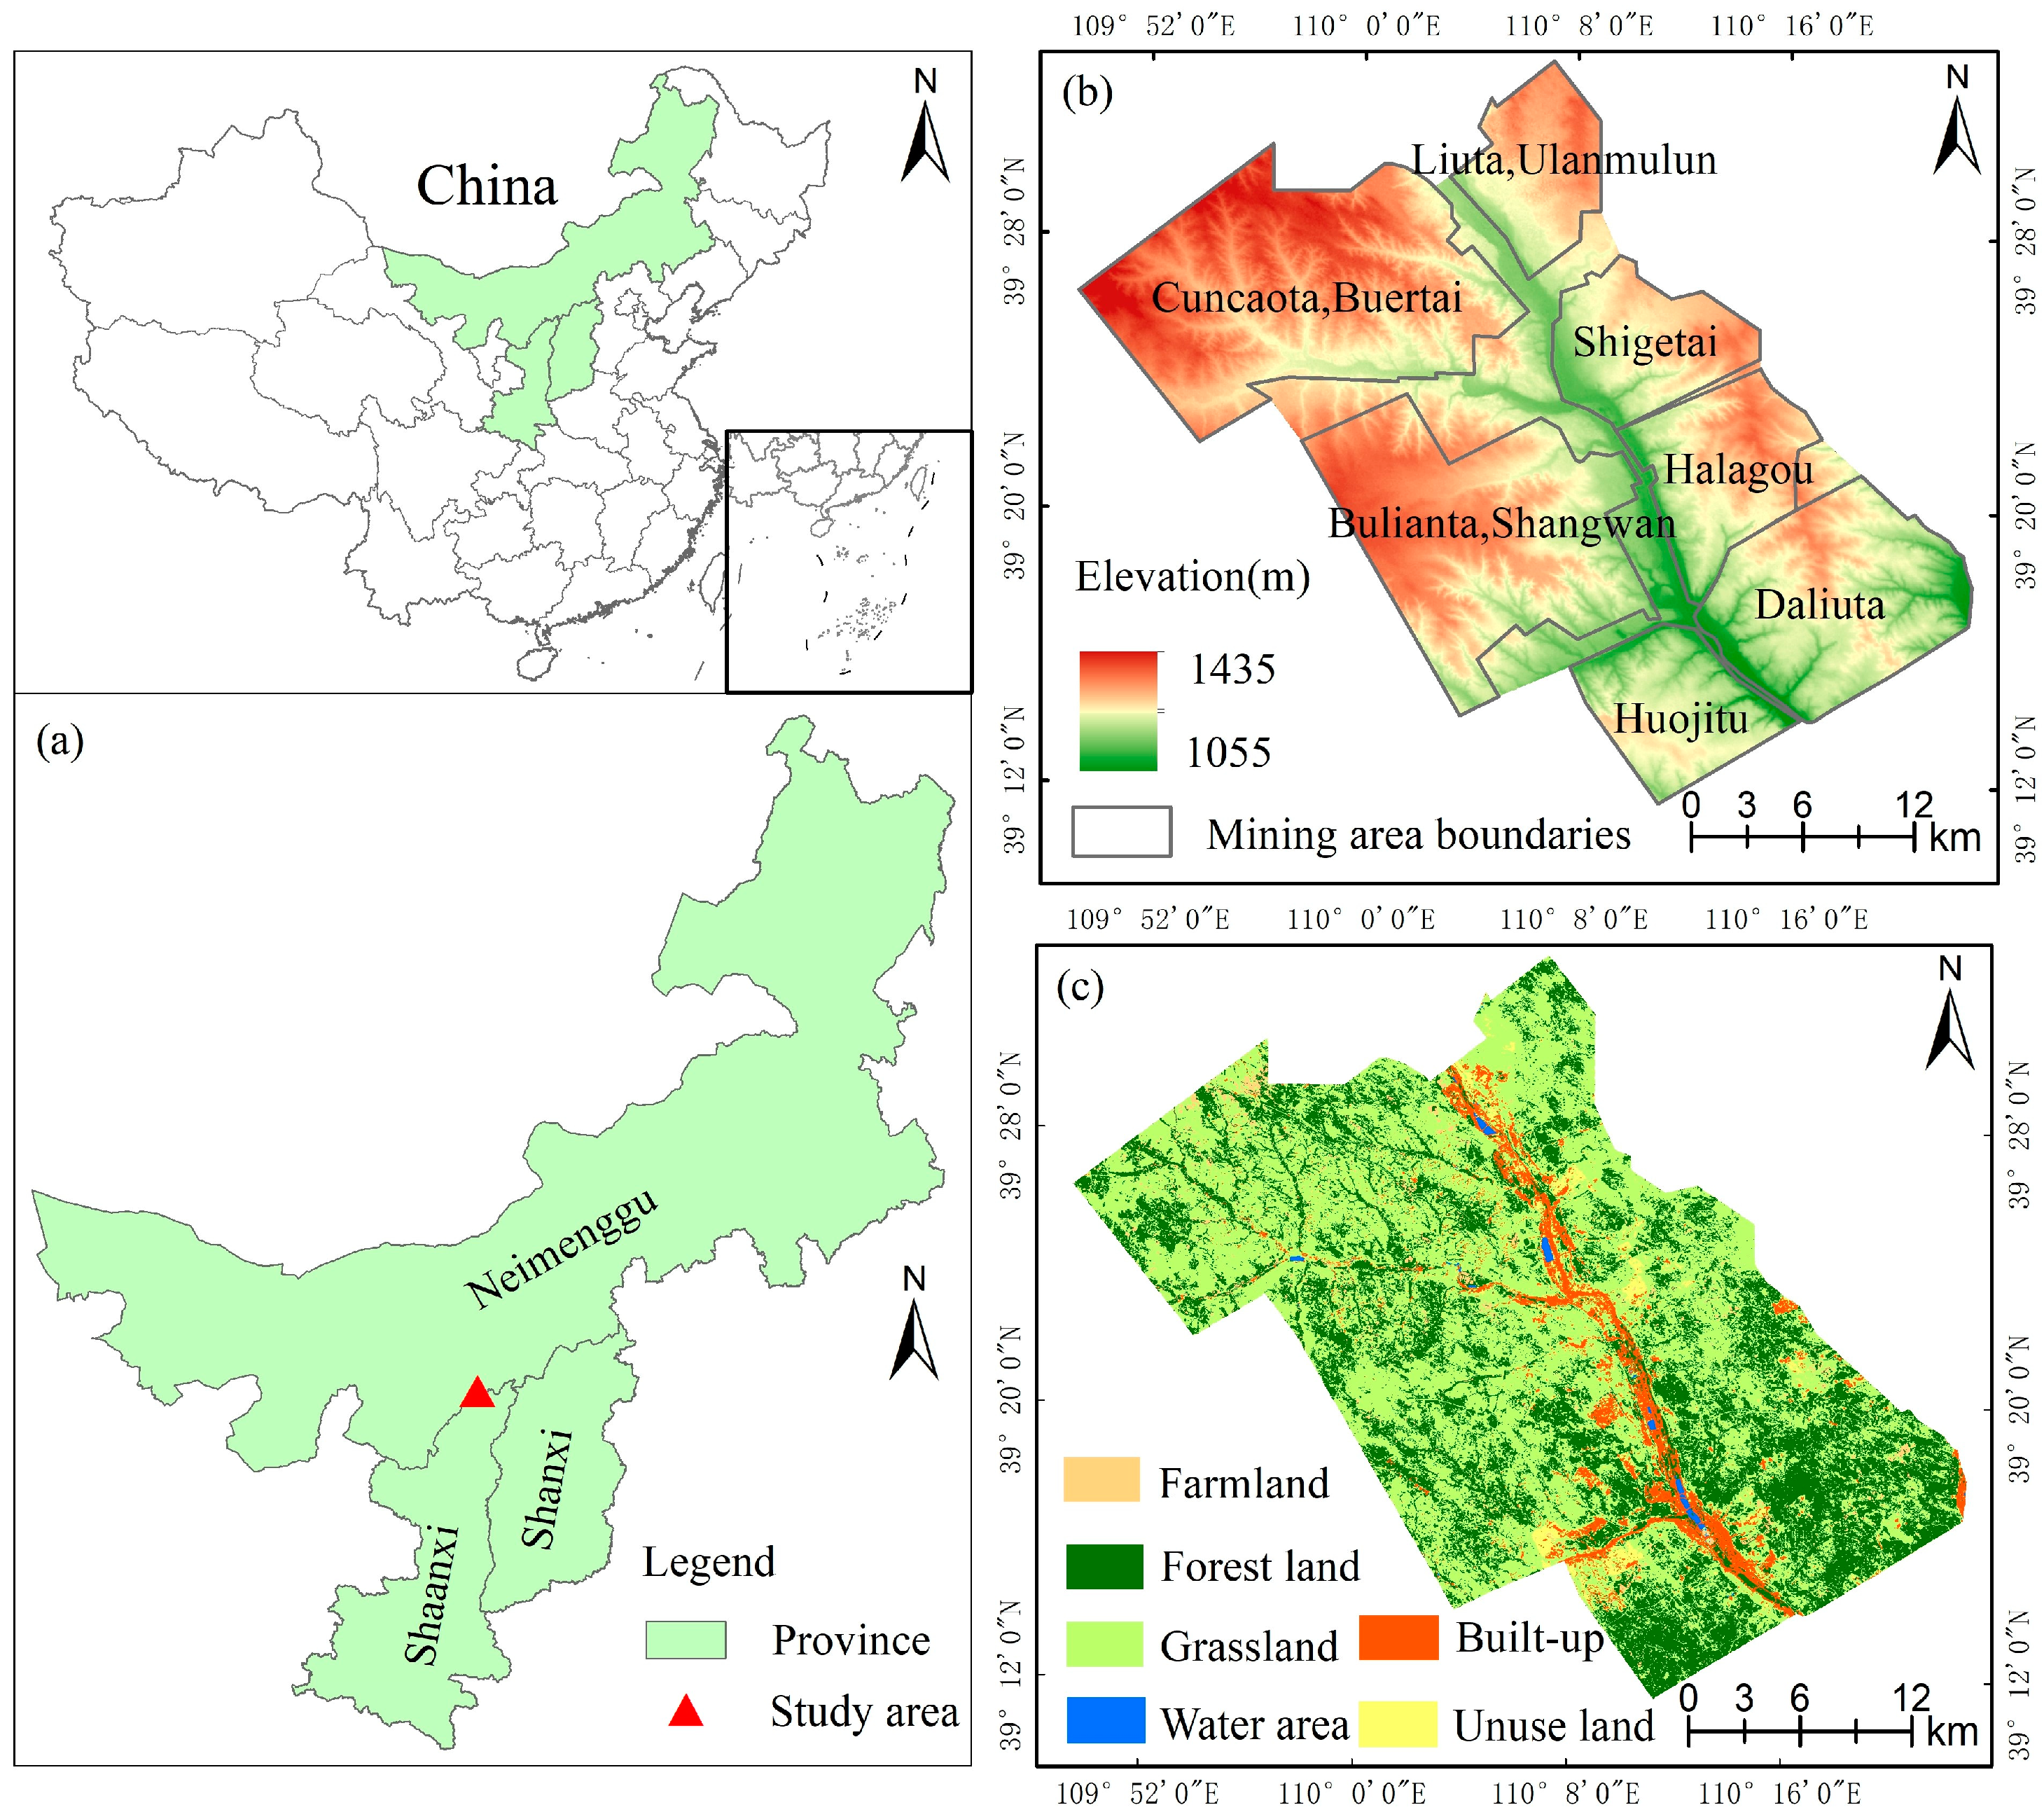
2.1. Study Area

The Shendong mining area is one of the thirteen large-scale coal bases in China. Its geographical coordinates range from 109.83° to 110.34°E and 39.56° to 39.19°N, with a total area of approximately 900 km2 (Figure 1a). The annual average temperature in this area is 6.2 °C. The annual precipitation is 300 to 400 mm, which is characteristic of arid and semi-arid continental climate. In recent decades, with the development of large-scale coal mining activities, the urbanization of the Shendong mining region has progressed swiftly, resulting in a significant expansion of industrial and mining land. After 1994, coal mining and ecological restoration efforts in the Shendong mining area began to advance simultaneously. There has been a consistent output of 10 million tons of coal mines up until this point [32]. Raw coal production from this region accounts for 6% of the country’s total output. It is the first production base in China to reach 200 million tons of commercial coal, playing a critical role in ensuring China’s energy security [33]. The Shendong coal mine consists of several sub-mining areas, including Wulanmulun coal mine, Liuta coal mine, Cuncaota coal mine, etc. (Figure 1b). The elevation ranges from 1054 to 1434 m (Figure 1b). This area has a monotonous vegetation cover. Following extensive ecological restoration, the predominant land use categories in the mining area consist of grassland, woodland, and urban centers (Figure 1c).

2.2. Data Sources

The annual kNDVI data of the mining area was used to evaluate the vegetation growth changes from 1994 to 2022. We used the Integrated Valuation of Ecosystem Services and Trade-offs (InVEST) model and the Carnegie–Ames–Stanford Approach (CASA) model and obtained ecosystem services. The four ecosystem services were calculated using a variety of data, including land use types in 1994 and 2022, Normalized Vegetation Index (NDVI), Digital Elevation Model (DEM), and climate and soil attribute data, as detailed in Table 1. Among them, the land use type data are generated by integrating high-resolution remote sensing images and field investigation data, adopting the human–computer interaction interpretation method (manual visual interpretation combined with computer-aided plotting), establishing a unified interpretation standard and integrating multi-source data. After field sampling verification and accuracy verification, high-precision land use vector data are finally produced. The pertinent parameters of the model in this study are primarily sourced from the model’s default values or associated literature. To facilitate the analysis, in this paper, the spatial resolution of the data is uniformly processed into two types, 500 m and 1000 m, through resampling, and the coordinates are uniformly processed into the WGS 84 coordinate system.

2.3. Methods

In this study, the kNDVI index was selected to study vegetation growth changes, and trend analysis and non-parameter test were used to analyze the change trend of kNDVI in Shendong mining area since the implementation of ecological restoration in 1994. The changes in ecosystem services in the Shendong mining area from 1994 to 2022 were calculated using InVEST and CASA models. The complex nonlinear relationship between vegetation growth change (kNDVI) and ecosystem services was quantified, and the constraint lines were established to determine the threshold of the impact of vegetation growth on ecosystem services, as shown in Figure 2:

2.3.1. kNDVI Calculation

In this study, the annual kNDVI data were calculated based on the Landsat surface reflectance data during 1994–2022 on the Google Earth Engine (GEE) platform. The kNDVI index is a normalized vegetation index based on kernel (machine learning) functions, which solves the difficulties of traditional NDVI in scale transformation and nonlinear problems. It can deliver more comprehensive and precise vegetation data across various scales and nonlinear variations [34,35]. This index is calculated according to Equations (1) and (2) as
k N D V I = t a n h N I R R e d 2 σ 2 = t a n h N D V I 2 τ 2 ,
where σ represents the ratio of the average reflectance values of the near-infrared band and the red light band. τ is a fixed parameter; τ = 0.5 [34]. According to σ = τ N I R + R e d , the kNDVI calculation formula can be evolved into Equation (2):
k N D V I = t a n h N D V I 2 .

2.3.2. Variation Trends Analysis

One-dimensional linear regression analysis and least square method were adopted, with time as the independent variable and annual kNDVI value as the dependent variable, to fit the S l o p e of vegetation growth change in the mining area pixel by pixel. The calculation formula is shown in Equation (3):
s l o p e = n × i = 1 n i × k N D V I i i = 1 n i × i = 1 n k N D V I i n × i = 1 n i 2 i = 1 n i 2 ,
In the formula, s l o p e is the slope of the linear regression equation; n represents the span quantity from 1994 to 2022; in this study, n   = 23; i is the index value of the i -th data point; and k N D V I i is the kNDVI value of the i -th data point. When s l o p e > 0, it indicates that the vegetation change shows a trend of increasing greening; conversely, it suggests a trend of decreasing decline [36].
In order to effectively reflect the change trend and spatial distribution characteristics of vegetation in the mining area, this study combined Sen’s trend analysis and the Mann–Kendall test to measure the change trend of vegetation growth in a long time series, and to obtain the vegetation change trend chart for the whole region. The Theil–Sen trend is used to reflect the change trend of time series data, and the Mann–Kendall is used to test the significance of the change trend. This combination of methods does not require data to follow normal or linear distribution, and can effectively remove noise interference [37,38]. The calculation formula of the Sen trend degree is shown in Formula (4)
β k N D V I = m e d i a n k N D V I j k N D V I i j i , i ,
where k N D V I i and k N D V I j are the vegetation growth conditions of the year i and j , respectively, and β k N D V I is the slope. When β k N D V I > 0.0005 , k N D V I shows an upward trend, while lower values indicate a downward trend.
Mann–Kendall (MK test) statistical test methods are shown in Formulas (5)–(8).
Z = S 1 V a r S   S > 0   0   S = 0 S 1 V a r S   S < 0 ,
S = j = 1 n = 1 i = j + 1 n s i g n k N D V I j k N D V I i ,
V a r S = n n 1 2 n + 5 18 ,
s i g n θ = 1   θ > 0 0   θ = 0 1   θ < 0 ,
where s i g n is a symbolic function, S is a normal distribution, V a r S is the variance, and n is the number of time series. When the value is greater than 10, Z tends to be normally distributed. Here, S is the size relationship between k N D V I i and k N D V I j . The value range of Z is , + . When Z > Z 1 α / 2 , there is a significant change trend at the α confidence level, while Z > 0 indicates an increasing trend, and Z < 0 indicates a decreasing trend.

2.3.3. Ecosystem Services Assessment

(1) Net Primary Production (NPP)
As an important indicator of vegetation growth, NPP is utilized to explore regional vegetations in carbon sequestration capacity, ecosystem changes, and response to climate change in the context of rising global CO2 concentration [39]. In this paper, the CASA model was used to obtain NPP data [40]. We used mask extraction and other tools to obtain annual NPP grid data with a spatial resolution of 250 m to characterize the vegetative carbon sequestration capacity in the mining area. For specific calculations, please refer to Formula (9),
N P P x , t = A P A R x , t × ε x , t ,
where A P A R x , t represents the amount of photosynthetically active radiation absorbed by the grid pixel during the t month period, which is measured by the total carbon produced per square meter per unit area in each month (gC·m−2·month−1). And ε x , t refers to the actual light energy conversion efficiency of the grid cell in month t , with the unit of total carbon per megajoule (gC·MJ−1).
(2) Water Yield
In this study, the difference between precipitation and actual evaporation is calculated to characterize regional water production capacity [41,42], as in Equation (10),
Y x = 1 A E T x P x × P x ,
where Y x represents the annual water quantity (mm) of grid cell x in the study area, P x is the annual precipitation (mm) of grid cell x in the study area, and A E T x is the interannual evaporation of grid x (mm).
(3) Soli Conservation
The soil erosion amount and potential soil erosion amount were calculated using the InVEST model [43,44]. The regional soil conservation services were obtained based on the difference between the two erosion categories. The calculation formula is provided in Equations (11)–(13)
S E D R E T x = R K L S x U S L E x ,
R K L S x = R x × K x × L S x ,
U S L E x = R x × K x × L S x × C x × P x ,
where S E D R E T x is the soil retention of grid x   t / h m 2 , R K L S x is the potential soil erosion amount of grid x   t / h m 2 , U S L E x is the actual soil erosion of grid x   t / h m 2 , L S x is a terrain factor which can be obtained by simulating elevation data, R x is the precipitation erosion factor, K x is the soil erodibility factor, C x is a vegetation growth management factor, and P x is the soil and water conservation measure factor.
(4) Habitat Quality
The habitat quality index (referred to as the habitat index) of the mining area in 1994 and 2022 was calculated using the InVEST model [45]. Its values range between zero and one, and are calculated according to equation (14)
Q x j = H x j 1 D x j z D x j z + k z ,
where Q x j is the habitat index of grid x in land use type j , H x j is the habitat suitability of grid x in land use type j , D x j is the habitat degradation degree of grid x in land use type j , k is the semi-satiety and parameter which is set to 0.05 according to relevant studies, and z is the model default constant [46].

2.3.4. Definition and Extraction of Constraint Lines

Constraint lines can characterize the restrictive effects of the main constraint factors on complex ecosystems and the potential range or maximum value of complex ecosystems under their effects [47]. The specific meaning refers to the boundary of the scatter cloud of two variables, defined as the maximum point or range that can be obtained by the dependent variable under the restriction of the influence factor [48]. At present, the extraction methods of constraint lines mainly include the parameter method, the scatter plot grid method, the quantile regression method, and the piecewise quantile regression method [49,50]. The piecewise quantile regression method proposed by Mills et al. (2006) is an effective method [51]. First, divide the range of the X-axis value into 150 equal intervals and determine the corresponding y value for each column. Select the 99.9th percentile of the corresponding variable on the Y-axis to obtain the boundary points and fit x and y. Finally, based on the shape of the scattered point cloud and the fitting degree R2, the type of the constraint line is determined, and the threshold is identified when the constraint line exists. The above steps are performed in Origin 2024. The relationship between ecosystem services and vegetation growth was revealed by the method of constraint line. The inflection point of the constraint effect between variables is taken as the threshold value, that is, the critical point where the increase in vegetation growth leads to significant changes in ecosystem services. This study aims to utilize the threshold value for policy guidance and to establish distinct ecological restoration objectives for the primary ecological functional areas.

3. Results

3.1. Vegetation Growth Distribution and Spatiotemporal Dynamics

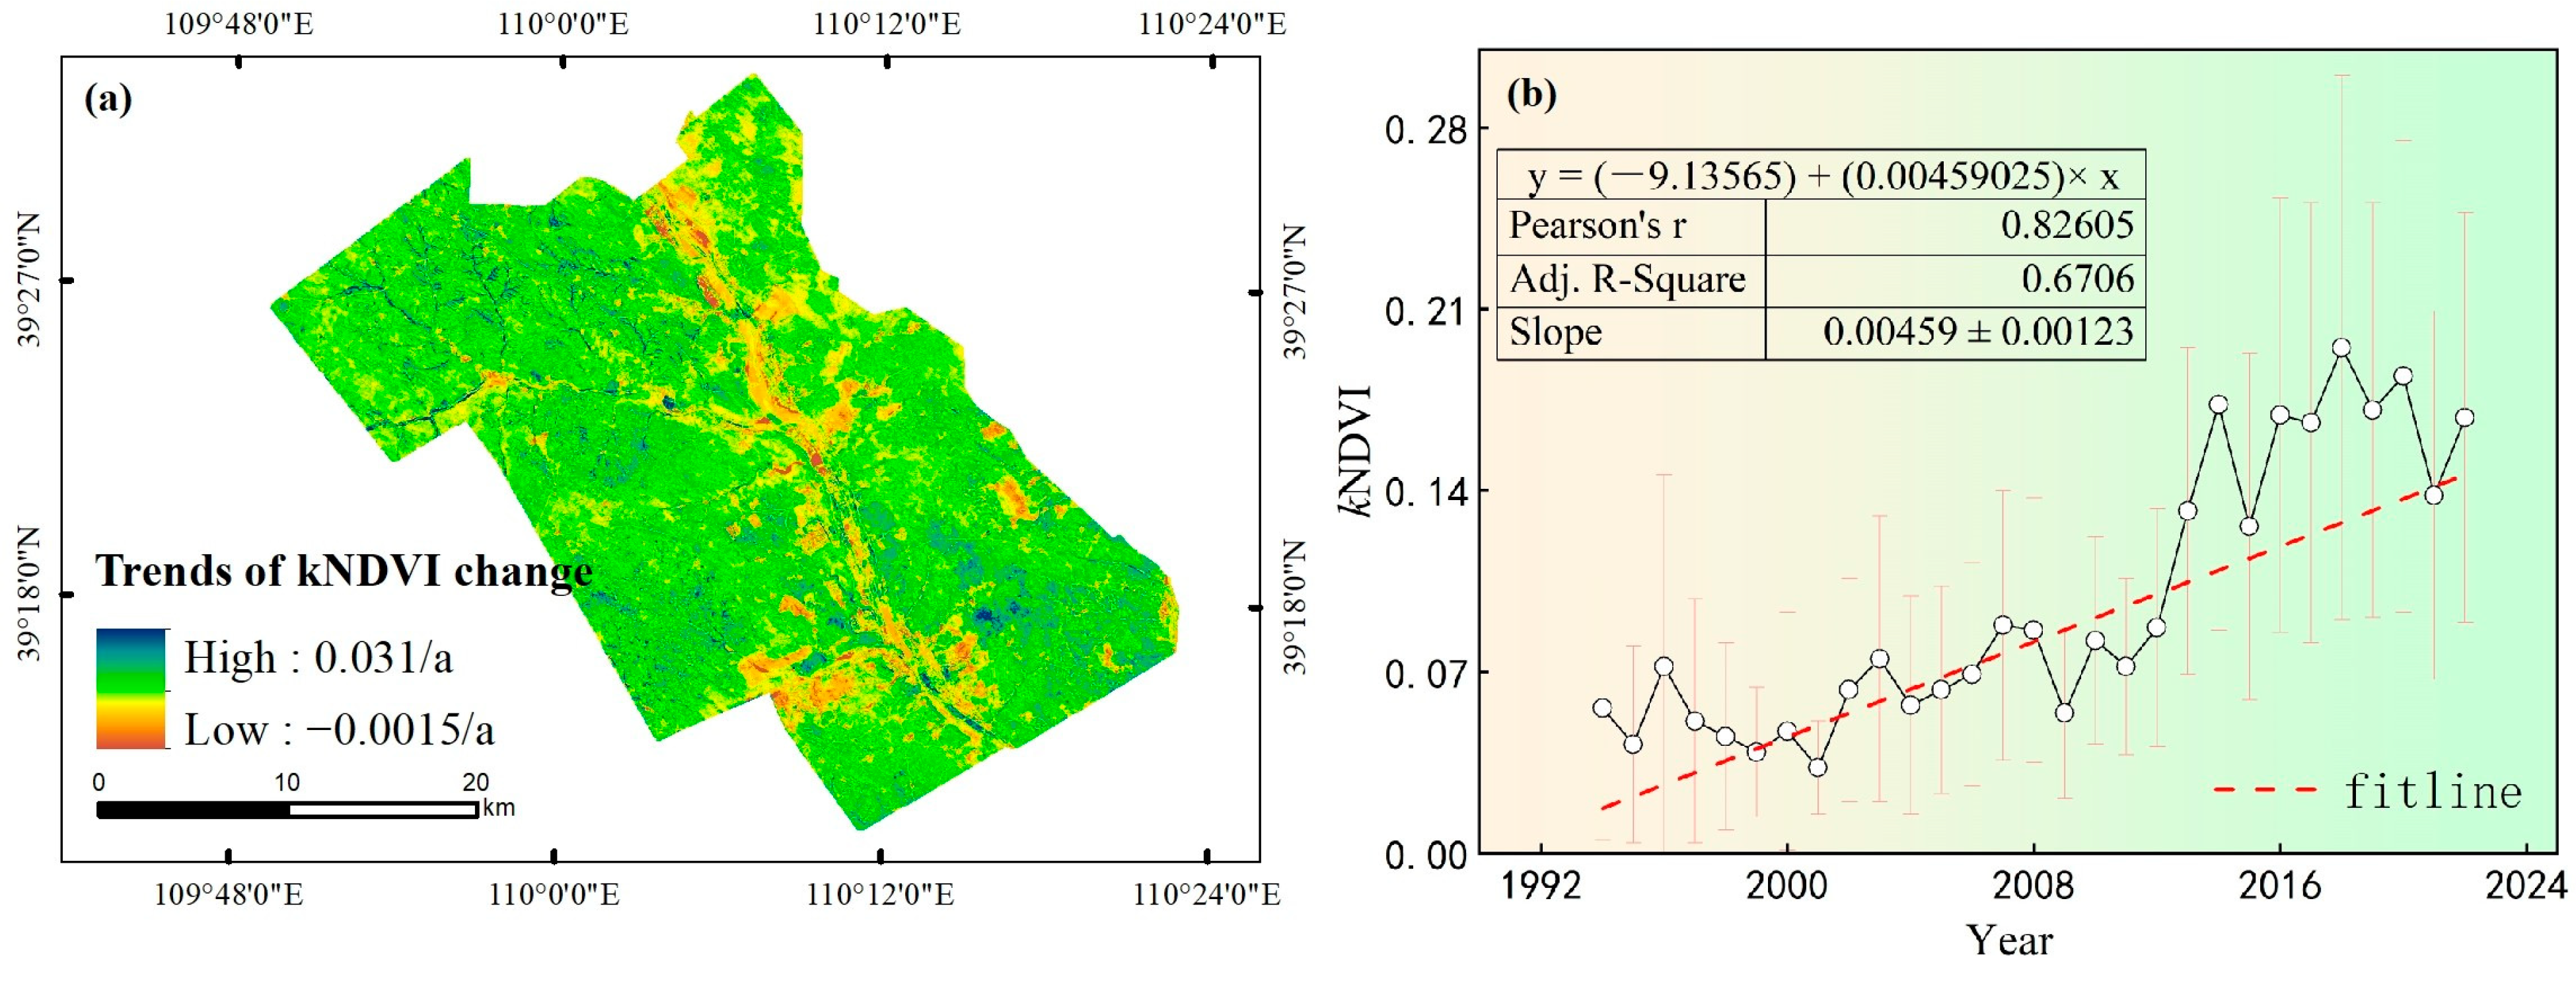
3.1.1. Vegetation Growth Dynamics Temporal Variation

The kNDVI slope of each pixel in the raster image from 1994 to 2022 was used as the vegetation growth condition to analyze the inter-annual kNDVI variation in the Shendong mining area. As shown in Figure 3a, during 1994–2022, vegetation growth showed an increasing trend in 93.82% (slope > 0) of the area. The area with the slope values lower than 0 accounts for 6.18% of the mining area, indicating that the vegetation growth of this part of the area is in a declining state during 1994–2022. Good vegetation growth is mostly found in the southeast and northwest of the mining area, while human activities have caused poor vegetation growth in some open-pit mining areas and urban areas. Temporally, vegetation growth fluctuated greatly during 1994–2022 and in different stages. As shown in Figure 3b, vegetation coverage in the Shendong mining area experienced four stages. (1) Vegetation growth decreased slightly from 1994 to 2001; (2) between 2001 and 2009, vegetation growth experienced a period of modest increase; (3) between 2009 and 2014, vegetation growth was robust and substantial; (4) vegetation growth tended to be stable from 2014 to 2022, but it still changed greatly during the years. In general, the vegetation growth rate of the Shendong mining area increased by 0.0046/a during 1994–2022.
This study carried out a separate study on vegetation growth change in different sub-mining areas, as shown in Figure 4. The interannual change line varies between mining locations; nonetheless, the overall trend indicates that vegetation growth in all mining regions has increased from 1994 to 2022, with slope values reflecting the intensity of this growth. Among them, Bulianta coal mine and Shangwan coal mine had the best vegetation growth (0.0065/a), while Shigetai coal mine had the worst vegetation growth (0.0029/a). The Daliuta coal mine is situated in the southeast of the Shendong mining area, while the Cuncaota and Buertai coal mines are positioned in the northwest, exhibiting relatively robust vegetation growth. Conversely, the Liuta and Ulan Mulun coal mines are located in the northeast corner of the Shendong mining area, adjacent to the Mu Us Desert, serving as functional zones for wind prevention and sand control. Owing to unfavorable geographical conditions, vegetative growth is rather limited.

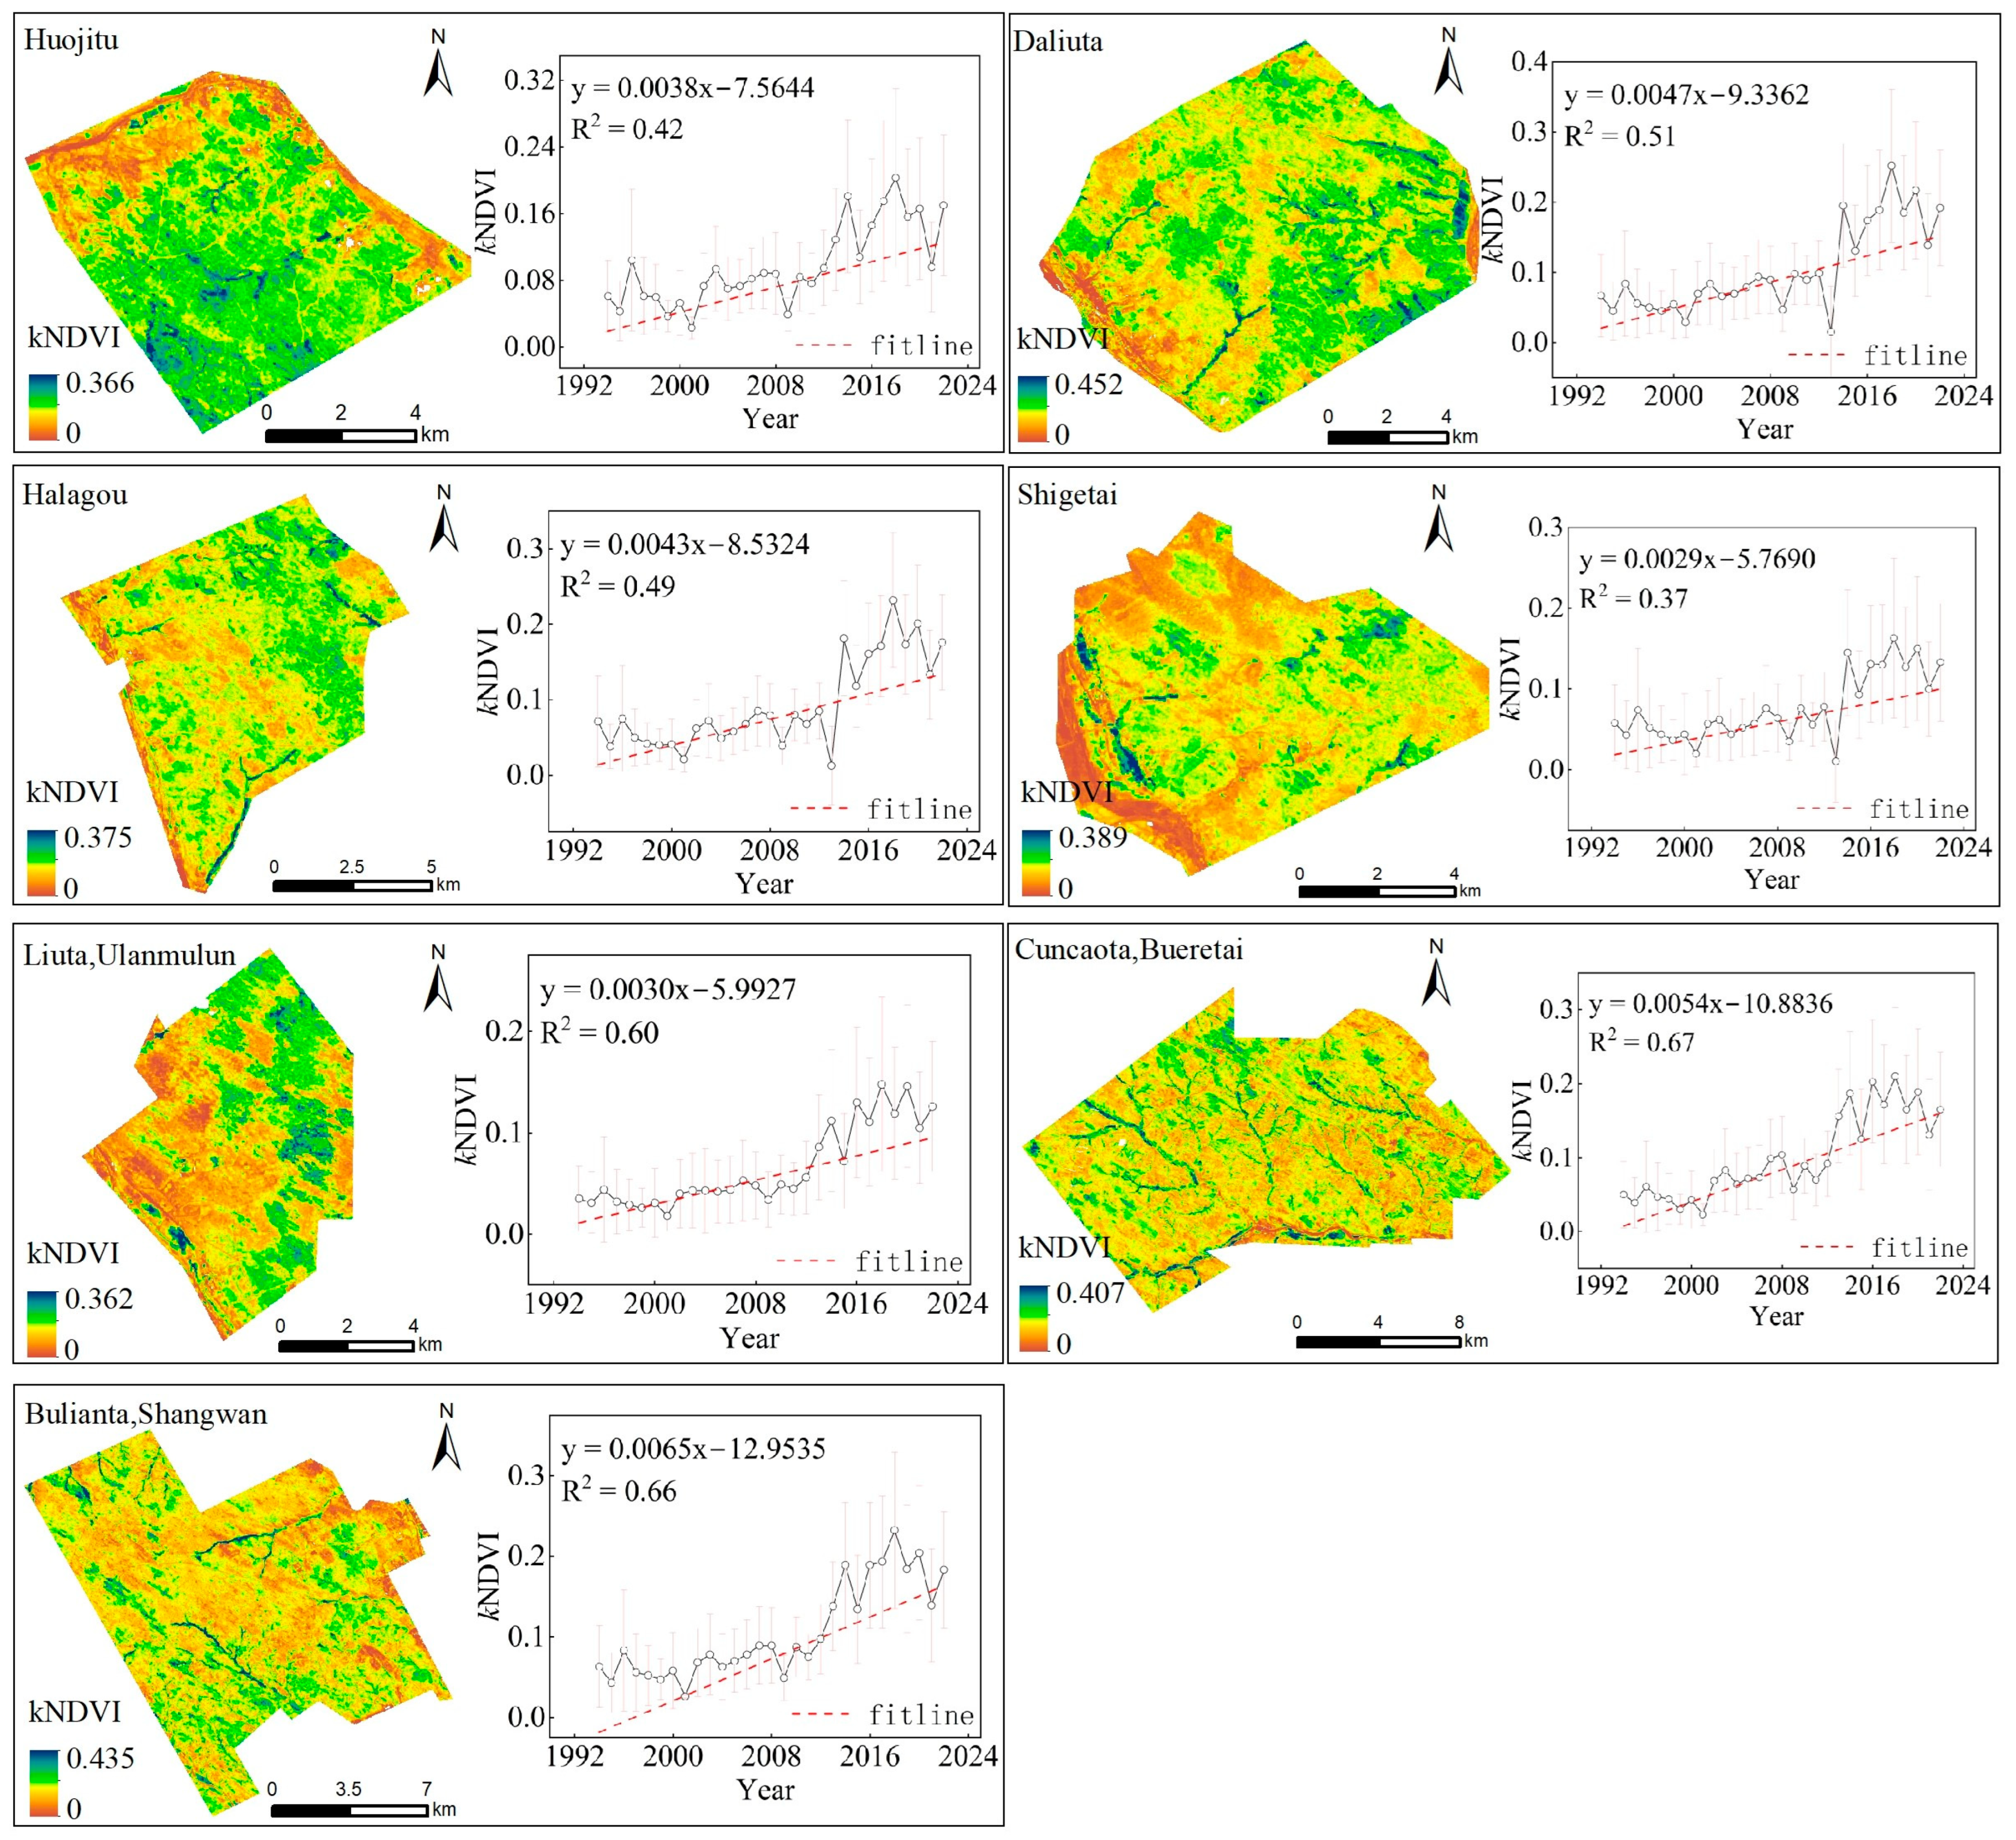
3.1.2. Spatial Distribution of Vegetation Growth Dynamics

In order to effectively reflect the growth and spatial distribution characteristics of vegetation in the mining area and different land use types, we combined Sen’s trend analysis with the Mann–Kendall test. Based on the pixel scale, vegetation growth was divided into five categories (Table 2), namely significantly increased, slightly increased, stable, slightly decreased, and significantly decreased, as shown in Figure 5a. The classification of vegetation growth indicates that there has been a considerable change in the vegetation across the whole Shendong mining area. Specifically, in 90.44% of the area, the change has been primarily an increase, mostly concentrated in the mountains on either side of the urban river. The distribution along the periphery of cities and certain mining regions exhibited a significant and moderate decline in vegetation growth, accounting for 2.54% of the total. The variation in vegetation growth strength across several land use types was examined, and the proportional area of each land use type was determined (Figure 5b). On cultivated land, vegetation growth exhibited an upward trend in 92.46% of the areas, with a significant increase observed in 80.50% of the regions. Grassland is the largest land use type in ecological restoration projects. Some 96.12% of the area showed vegetation growth. The significantly increased category accounted for 93.04% of the total grassland area. The forest region exhibited the highest proportion of plant growth, comprising 95.63% of the total forest area.

3.2. Changes in Ecosystem Service Functions Under Ecological Restoration Projects

3.2.1. Variations in Individual Ecosystem Service Functions

With the exploitation of mine resources, the development of local economy has been greatly promoted [52]. However, due to large-scale coal mining in the Shendong mining area, the local ecological environment has further deteriorated. In order to stop the deterioration of the local ecological environment, the Shendong mining area has taken a combination of engineering and biological measures since 1994. Comprehensive soil and water conservation management was implemented in minor watersheds surrounding the mining region [53]. Therefore, in this study, we selected the initial year of the implementation of the ecological restoration (1994) and 2022 to show the status of ecosystem services before and after the project. In the period between 1994 and 2022, soil conservation, net primary productivity (NPP), water yield, and habitat quality were selected to evaluate the overall ecology of the mining area according to previous studies. Figure 6 illustrates that from 1994 to 2022, the ecosystem service functions of the Shendong mining area underwent considerable changes, predominantly exhibiting an upward trend.
Between 1994 and 2022, 93.69% of the soil in the mining area had an upward trend, predominantly in the northwest, southwest, and southeast regions. The regions experiencing a loss in soil conservation services were predominantly located in the northeastern section and the central western area of the mining site, comprising 6.31% of the total mining area (Figure 6). As China prioritizes environmental protection and ecological urbanization, the government and enterprises pay more attention to soil protection and ecological restoration in the development process of mining areas, which improves the efficiency of soil conservation measures in mining areas to a certain extent.
From 1994 to 2022, the sites with NPP increases accounted for 96.88% of the total mining area. The areas with NPP increase were mainly concentrated in the southeast of the mining area, as well as the west and northwest of the mining area. In the unit raster, the 2022 NPP average is 103 g higher than 1994. The significant reduction mainly occurred in the southwestern part of the mining area and in the central urban region (Figure 6). Compared with 2022, the NPP per unit raster in some parts of the region has decreased by more than 12 g.
From 1994 to 2022, water production increased in most parts of the area, where 92.15% of the area showed an increasing trend. The area with a significant increase in NPP was mainly distributed in the central and southeastern parts of the mining area (Figure 6). On the contrary, due to mining disturbance, precipitation, and other climatic reasons, water production has decreased significantly in the northwest sections of the mining area. Compared with 1994, the areas with a decreasing NPP accounted for 7.85% of the total. On the whole, the amount of water produced in the mining area on the grid pixel scale has increased by more than 12 mm compared with 1994.
In the Shendong mining area, habitat quality is highest in the west and lowest in the east. In terms of spatial variations, the habitat quality showed an upward trend in 72.16% of the region from 1994 to 2022. Except for urban areas and coal mining areas, the habitat quality of other regions increased to some extent. There has been a significant decline in habitat quality as a result of human interference in urban and coal mining areas, with the decline area accounting for 27.84% of the total (Figure 6). On the whole, the habitat quality service in Shendong mining area improved by 0.025 points from 1994 to 2022.

3.2.2. Changes in Total Ecosystem Services

To assess the ecosystem service supply capacity of the Shendong mining area, we normalized each ecosystem service, determined its weight through principal component analysis, and calculated the total ecosystem service index to examine ecosystem service function changes before and after ecological restoration. In this study, the total ecosystem service is taken as an effective index to comprehensively reflect the ecosystem service supply capacity of the mining area. The average value of the total ecosystem services in the mining areas increased from 0.41 in 1994 to 0.49 in 2022 (Figure 7). The substantial improvement of overall ecosystem services was primarily concentrated in the southeastern and western regions of the mining area, whereas the increase was very modest in the northwestern region. Within the entire mining region, 84.26% of the area exhibits an upward tendency. The analysis of changing regions revealed that the spatial distribution of total ecosystem services closely aligned with that of habitat quality services and water production services. This suggests that the enhancement of total ecosystem services in mining areas predominantly stemmed from the improvements in habitat quality and water production services. From the perspective of evolutionary relationship, the improvement in vegetation in the mining area can directly or indirectly enhance the ecosystem service function. Vegetation can directly increase carbon fixation and reduce carbon emission by absorbing atmospheric carbon dioxide. Through vegetation restoration, soil erosion can be reduced, soil water retention capacity improved, and the water quality and quantity of rivers, lakes, and groundwater maintained [54,55]. Therefore, the improvement in vegetation greatly promotes the enhancement of ecosystem service functions.

3.3. Constraining Effect of Vegetation Growth Change on Ecosystem Service Function

3.3.1. Individual Ecosystem Service Function Constraint by Vegetation Growth Change

This study involved extracting constraint lines from two time points, prior to and following the implementation of the ecological restoration project. Various mathematical functions were employed to construct constraint lines with optimal goodness of fit, denoted as R2 (Figure 8), and the analysis was conducted accordingly. Before and after the project, the constraint line between vegetation growth (kNDVI) and soil conservation services exhibited a downward parabolic shape (Figure 8), indicating that when kNDVI increased, its constraint effect initially diminished and subsequently intensified. When the constraint line reaches a certain threshold, the constraining effect of kNDVI on water maintenance service gradually increases. Before the ecological restoration project was implemented in 1994, to the left of the constraint threshold line, the kNDVI of vegetation growth was predominantly at a moderate or low level, with a threshold ranging from 0 to 0.1. After the implementation of the project in 2022, the constraint threshold line shifted to the right, ranging between 0.1 and 0.2, demonstrating that the ongoing enhancement of vegetation has resulted in a delayed effect of kNDVI on soil conservation.
In the mining areas, the constraining effect of kNDVI on NPP changed greatly. In 1994, the constraint line of kNDVI on NPP exhibited a descending linear trend, indicating that as kNDVI increased, its constraining influence on NPP became progressively stronger. After the implementation of the ecological restoration project, the constraint line of kNDVI on NPP turned into a downward-opening parabola. Before kNDVI reached 0.12, its constraining effect on NPP steadily weakened, and after this point, it rose again. The constraining relationship between kNDVI and water production service also showed significant differences before and after the ecological restoration. In 1994, the constraint line of kNDVI and water production service followed an S-shaped curve, indicating that with the increase in kNDVI, the constraining effect of kNDVI on water production service first weakened, then strengthened, and finally weakened again. The constraint effect progressively intensifies beyond a kNDVI value of 0.06, but decreases upon reaching a kNDVI value of 0.36. After ecological restoration in 2022, the constraint line of kNDVI and water production service presents a downward-opening parabola. To the left of the threshold point, the constraining effect of kNDVI on water production service declines progressively, while it becomes increasingly pronounced upon crossing the threshold point.
The constraining effect of vegetation growth kNDVI on habitat quality is similar to that of water production service. Prior to ecological restoration, the constraint line of kNDVI and habitat quality service exhibited an S shape; subsequent to restoration, it transformed into a downward-opening parabola, with its trend aligning with that of kNDVI concerning water production service. The key distinction is the variation in threshold values among ecosystem services. Figure 8 illustrates that in 2022, the kNDVI threshold value for habitat quality services (0.18) exceeded that for water production services (0.14). With the continuous improvement in vegetation, habitat quality service has a small limitation on kNDVI.

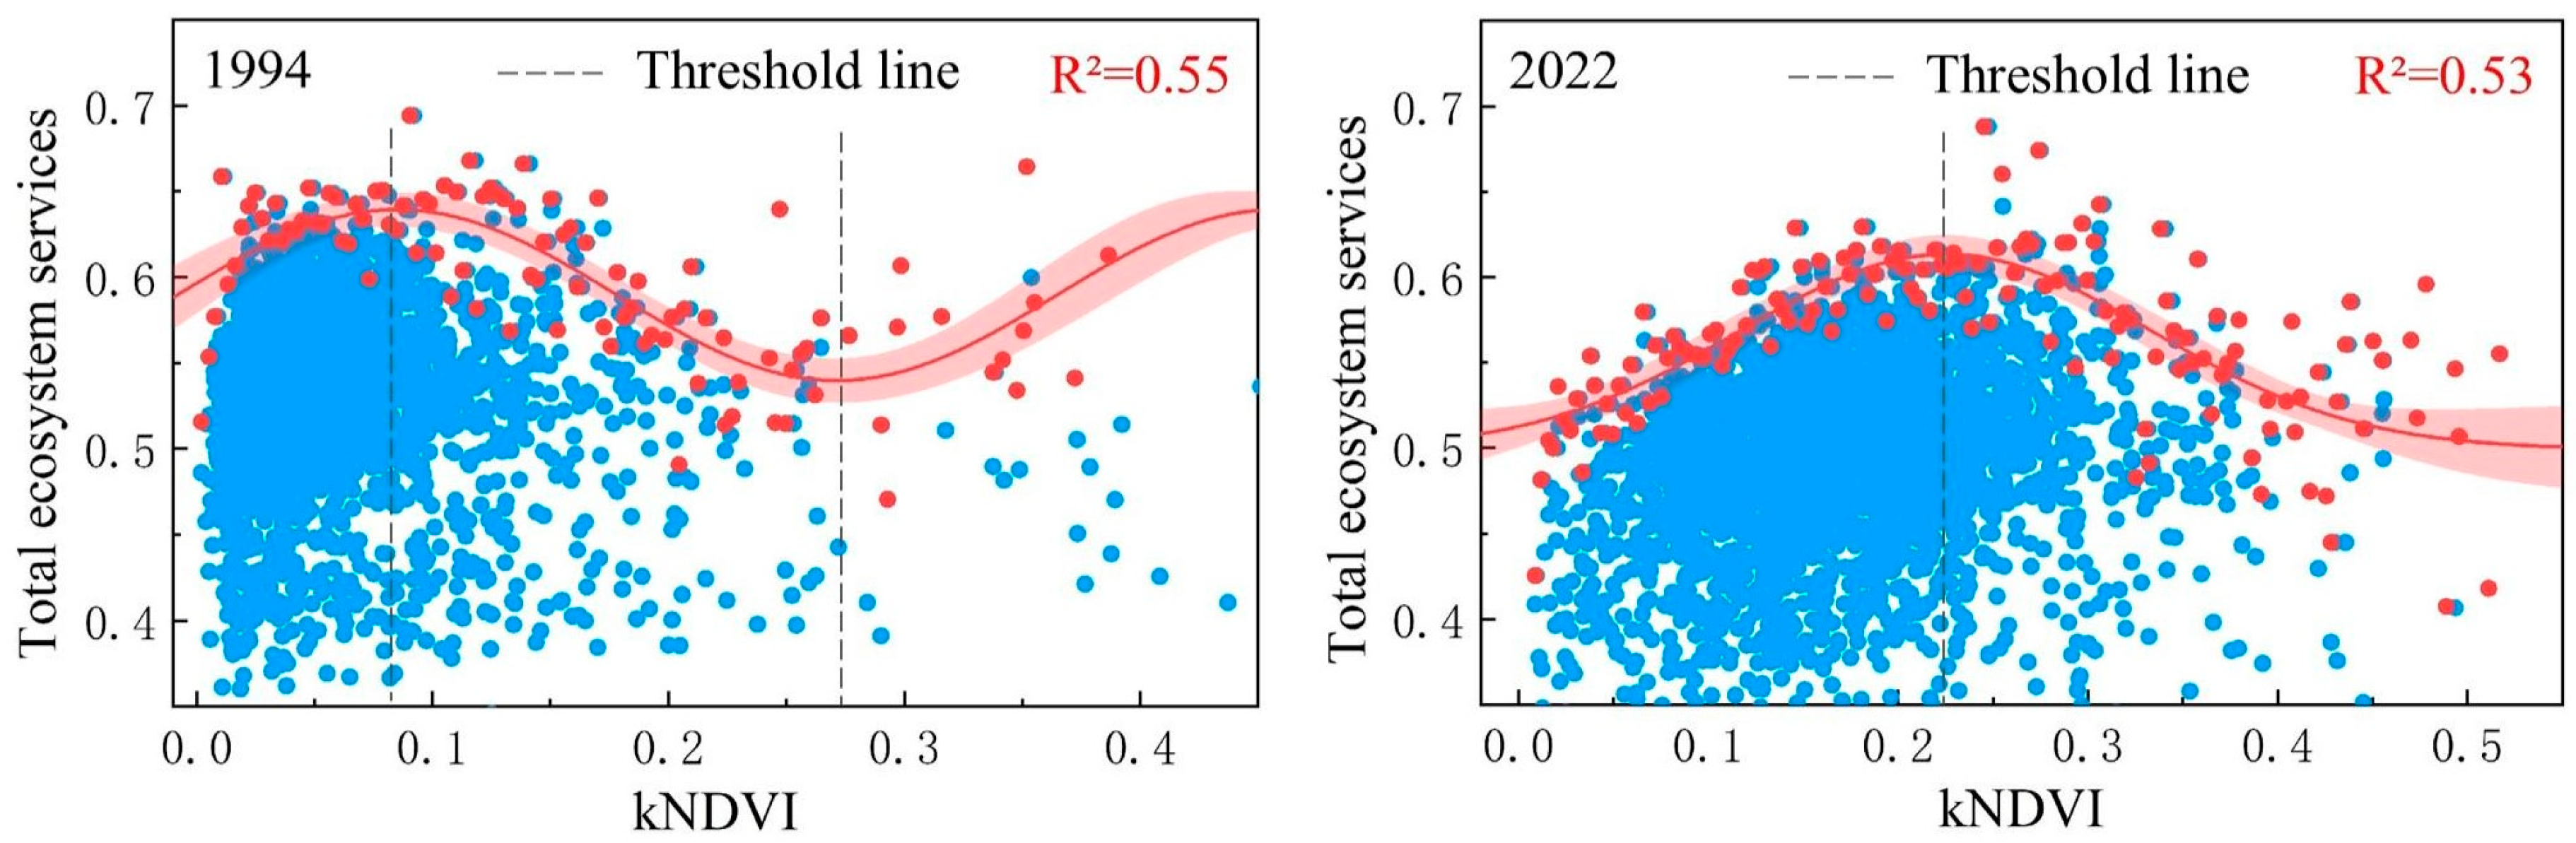
3.3.2. Constraining Effect of Vegetation Growth Change on Total Ecosystem Services

In order to more comprehensively explore the relationship between vegetation growth kNDVI and ecosystem services, we constructed a constraint relationship between kNDVI and total ecosystem services. As shown in Figure 9, before the ecological restoration project, the constraint line between kNDVI and total ecosystem services presented an S-shaped curve. This suggests that the constraint effect of kNDVI on total ecosystem services initially strengthens, subsequently diminishes, and then gradually intensifies, aligning with the constraint line type observed between kNDVI and both water production services and habitat quality services. This further substantiates that, to a certain degree, variations in total ecosystem services in mining areas are predominantly influenced by changes in habitat quality services and water production services. After the implementation of the ecological restoration project, the constraint line between kNDVI and the total ecosystem service took the shape of a downward-opening parabola. In other words, as the kNDVI value increases, the constraint effect initially weakens, but then gradually strengthens when the kNDVI value reaches the threshold value. Before the project, kNDVI values ranged from 0 to 0.08, and the increase in kNDVI gradually weakened the total ecosystem services. Subsequent to the restoration, the kNDVI progressively lowered the threshold from 0–0.08 to 0–0.22. The threshold line shifts backwards, weakening the constraining effect of kNDVI on total ecosystem services.

4. Discussion

4.1. Vegetation Growth and Construction of Constraint Lines in Shendong Mining Area

During 1994–2022, the vegetation growth kNDVI in most areas of the Shendong mining area showed a significant increasing trend with an annual growth rate of 0.0046. Vegetation change in a location is influenced by specific underlying variables. In the Shendong mining area, this shift is primarily driven by the combined effects of human activities and climatic factors, with human actions being pivotal in vegetation restoration [53]. Since China prioritizes the construction of ecological civilization, a number of ecological restoration projects have been implemented in the Shendong Mining area. These projects include converting farmlands to forest lands, converting pastures to grasslands, and soil and water conservation measures, which have effectively improved the ecological environment of the mining area. At the enterprise level, Shendong Coal Group and other enterprises actively respond to national policies and invest huge amounts of funds in ecological management of mining areas. Through innovative technological means, such as land consolidation, reclamation and greening, the vegetation coverage rate of the mining areas has increased from a low level in the early development period to more than 64% [56]. These human intervention measures directly promote the growth and recovery of vegetation. In addition to human factors, climate factors also play an important role in the improvement in FVC [57,58]. In the past few decades, global climate change has led to the change in climatic conditions in northern China, especially the increase in precipitation and temperature, which provides a more favorable environment for the growth of vegetation [59,60]. Studies have shown that the annual average vegetation coverage in North China is on the rise, which is closely related to the increase in precipitation caused by climate warming [61].
In this study, the operation of an ecosystem is a complex process. Besides the interaction among ecosystem services, it is also influenced by driving factors, such as climate factors, economic factors, social factors, and human activities [62,63]. As a result, the two factors are distributed in a scattered pattern. The reason for presenting this distribution characteristic is that the limiting factor cannot fully control the change in the response factor. Instead, the limiting factor only has a limiting effect on the response factor and is affected by many factors at the same time, so that the distribution of the response factor does not exceed a certain range. The boundary formed by this range is the constraint line. The existing research methods focus on principal component analysis, cluster analysis, traditional univariate regression equations, and binary regression equations to reveal the correlations among ecosystem services and between ecosystem services and driving factors [27,64]. However, the relationship among ecosystem services is not a simple linear one. Traditional correlation and regression methods are not suitable for the study of the correlation relationship where two variables are distributed in a scattered-point pattern. They require the data to be uniformly distributed around the mean, and the characteristics of ecological research data violate the basic assumptions of correlation and regression methods [65]. Therefore, compared with traditional regression and correlation statistical methods, the constraint line method is more suitable for the constraining effect of limiting factors on response factors in complex ecosystems affected by multiple factors. Therefore, it is reasonable for this paper to choose the constraint line method to explore the constraint threshold of vegetation coverage on ecosystem services.

4.2. Constraint Mechanism Between Ecosystem Services

Ecosystem services ensure the survival and development of human beings and promote the sustainable development of economy and society [66]. Within ecosystem services, the enhancement of one service may adversely affect the availability of other services. This relationship illustrates the reciprocal limitations across services, since resources (e.g., water, nutrients, energy) and environmental conditions (e.g., space, light) are finite, and augmenting investment in one service may diminish the resources accessible for another service [67]. Enhancing agricultural output may compromise biodiversity and environmental stability, as heavy land and chemical usage adversely affects wildlife habitats [68]. However, in some cases, there may be a positive interaction between ecosystem services—that is, enhancing one service may also increase the supply of one or more additional services [69,70]. This relationship reflects the mutual reinforcement of services, as some management measures may benefit multiple ecological processes simultaneously. For example, restoring wetlands not only provides habitat and protects biodiversity, but also improves water quality, reduces flood risk, and provides carbon sequestration services [71].
Studies have found that soil conservation measures play a key role in maintaining the stability of mining ecosystems by reducing soil erosion and improving soil fertility [72], but these measures have a significant trade-off effect on water production services [73]. Specifically, soil conservation measures increase surface roughness and soil infiltration rates, thereby reducing surface runoff and affecting water production services, especially during extreme precipitation events. At the same time, there is a positive synergistic relationship between soil conservation and NPP, since soil conservation measures provide favorable conditions for vegetation growth by improving soil structure and increasing soil nutrient content, thus promoting NPP [74]. This improvement is not only reflected in the increase in vegetation biomass, but also in the improvement in vegetation diversity and the enhancement of ecological functions [75]. The increase in NPP further promotes habitat quality and forms a virtuous cycle between vegetation, soil, and water, which is of great significance for the restoration of mining ecosystems. In the relationship between water production services and habitat quality, measures such as vegetation restoration and wetland construction may have a certain negative impact on water production services, but these measures have a significant positive effect on improving habitat quality. The restoration of vegetation enhances surface coverage and augments soil water retention capacity, facilitating the equilibrium between surface water and groundwater, hence positively influencing water production services in the long term [76]. At the same time, the improvement in habitat quality contributes to the increase in biodiversity, provides rich ecological niches for various organisms, and enhances the stability and resilience of the ecosystem [77].
The ecological restoration practice in the Shendong mining area shows that soil conservation measures reduce soil erosion and restrict water production services, but vegetation restoration and soil improvement can alleviate this restriction. The improvement in NPP and the improvement in habitat quality showed obvious synergistic effect, which was reflected not only in the optimization of ecosystem structure and function, but also in the enhancement of ecosystem service function. To sum up, in order to realize the sustainable development of the mining ecosystem, it is necessary to fully consider the trade-off and synergy between these services in the ecological restoration design, adopt comprehensive ecological engineering technology, optimize the ecosystem service function, and maximize the ecological, economic, and social benefits.

4.3. The Internal Mechanism of Vegetation Growth Change Constraining Ecosystem Service Function

Within a certain range, vegetation improvement can promote ecosystem service functions [78]. This is because vegetation improvement helps improve soil quality, retain water, and increase biodiversity, thus creating conditions for the action of ecosystem services. For example, vegetation improvement helps improve soil water retention capacity and promote plant growth, thereby increasing the primary productivity of the ecosystem and providing the material basis for the play of other ecosystem service functions [79]. However, the continuous improvement and increase in vegetation is not always conducive to the improvement of ecosystem service functions [29]. In areas with high vegetation coverage, there may be trade-offs between ecosystem service functions [80]. In addition, ecosystem services are inherently unstable and susceptible to disturbances, especially in complex mining environments where mining can disrupt topography and surface structure, directly affecting vegetation and animal habitat. This destruction can lead to a decline in biodiversity and affect the integrity of the ecosystem [16,81]. At the same time, the wastewater and waste produced during the mining process may contain harmful substances, such as heavy metals, which can enter rivers and groundwater through runoff, pollute water resources, and affect soil quality. It can also directly or indirectly lead to the decrease in biological populations, affecting the stability and resilience of the ecosystems [82]. The impact of mining activities on ecosystem services is complex. Mining activities not only destroy the natural structure of ecosystems, but also weaken their ability to provide services, posing a threat to human well-being and the sustainability of the natural environment [83]. Therefore, it is necessary to explore the internal mechanism of the restriction of vegetation growth on ecosystem service functions.
In regions with dense vegetation, the capacity of vegetation to restrict soil conservation services diminishes, leading to an increase in soil water retention. However, this outcome may decrease surface runoff, impact flood discharge, and consequently diminish the ecosystem’s regulatory function on climate [84]. In addition, excessive vegetation cover may lead to enhanced soil respiration and increased carbon emissions, with negative impacts on climate regulation. In areas with substantial vegetation coverage and vigorous growth, the kNDVI constraint line on the NPP function exhibits a parabolic shape, and its constraining effect diminishes rather than intensifies, thereby facilitating the ongoing enhancement of the ecosystem’s net primary productivity and influencing the quality of services rendered by the ecosystem. It further leads to soil impoverishment, affecting plant growth and ecosystem functions. Improved vegetation and increased coverage contribute to the improvement of ecosystem supporting service functions [30], such as soil conservation and water conservation. However, excessive enhancement of vegetation cover may lead to reduced ecosystem stability and weakened anti-interference ability, thus affecting the support service function of the ecosystem [85].
Based on the above discussion, the relationship between vegetation growth change and ecosystem service function in mining areas is not a simple linear relationship, but rather a nonlinear one. Within a certain range, the increase in vegetation coverage is conducive to improving ecosystem service functions, but when vegetation coverage reaches a certain threshold, the relationship between vegetation coverage and ecosystem service functions may change. Under these circumstances, it might show a nonlinear growth or a declining trend. The increase and improvement in vegetation in the Shendong mining area has a significant constraining effect on the ecosystem service functions. In the process of vegetation improvement, there are both positive and trade-off relationships between ecosystem service functions. In order to realize the continuous improvement of ecosystem service functions, it is necessary to rationally regulate vegetation coverage and fully consider the internal relationship between vegetation change and ecosystem service functions. On this basis, it is necessary to further explore the relationship between different regions, vegetation types and ecosystem service functions, so as to provide scientific basis for ecological restoration and ecosystem management in mining areas.

4.4. Limitation and Prospect

Firstly, in this study, we selected four kinds of ecosystem services based on the existing studies and analyzed their changes before and after the implementation of ecological restoration. However, these four categories have two limitations: (1) Whether they can fully represent the ecosystem services of the entire region. Therefore, future studies should consider more ecosystem services, including food supply and regulation services, to more accurately reflect the overall changes in ecosystem services of the study area and formulate more practical management strategies. (2) At present, the classification and quantification of ecosystem services commonly used in ecological restoration assessment in China are mainly based on some river basins and plateaus, and there are few ecosystem service choices in mining areas. Consequently, a range of models for evaluating alterations in ecosystem services within mining regions may be contemplated in the future. Secondly, when discussing the nonlinear relationship between vegetation growth kNDVI and ecosystem services, this study did not consider the constraint between ecosystem services themselves, and ignored the trade-off and synergic relationship between ecosystem services. At the same time, ecosystem services are not only affected by human factors, but also by climatic factors. Therefore, future studies should consider both natural and anthropogenic influences to obtain more accurate results.

5. Conclusions

Based on satellite data and kNDVI data from 1994 to 2022, the temporal and spatial dynamics of vegetation growth in the Shendong mining area were analyzed. Based on the segmented quantile regression method, the constraint line between vegetation growth kNDVI and ecosystem services was extracted, the constraint effect of vegetation growth on ecosystem services was discussed, and the threshold value of the limiting effect of vegetation growth on ecosystem services was determined. Specific conclusions are as follows:
(1)
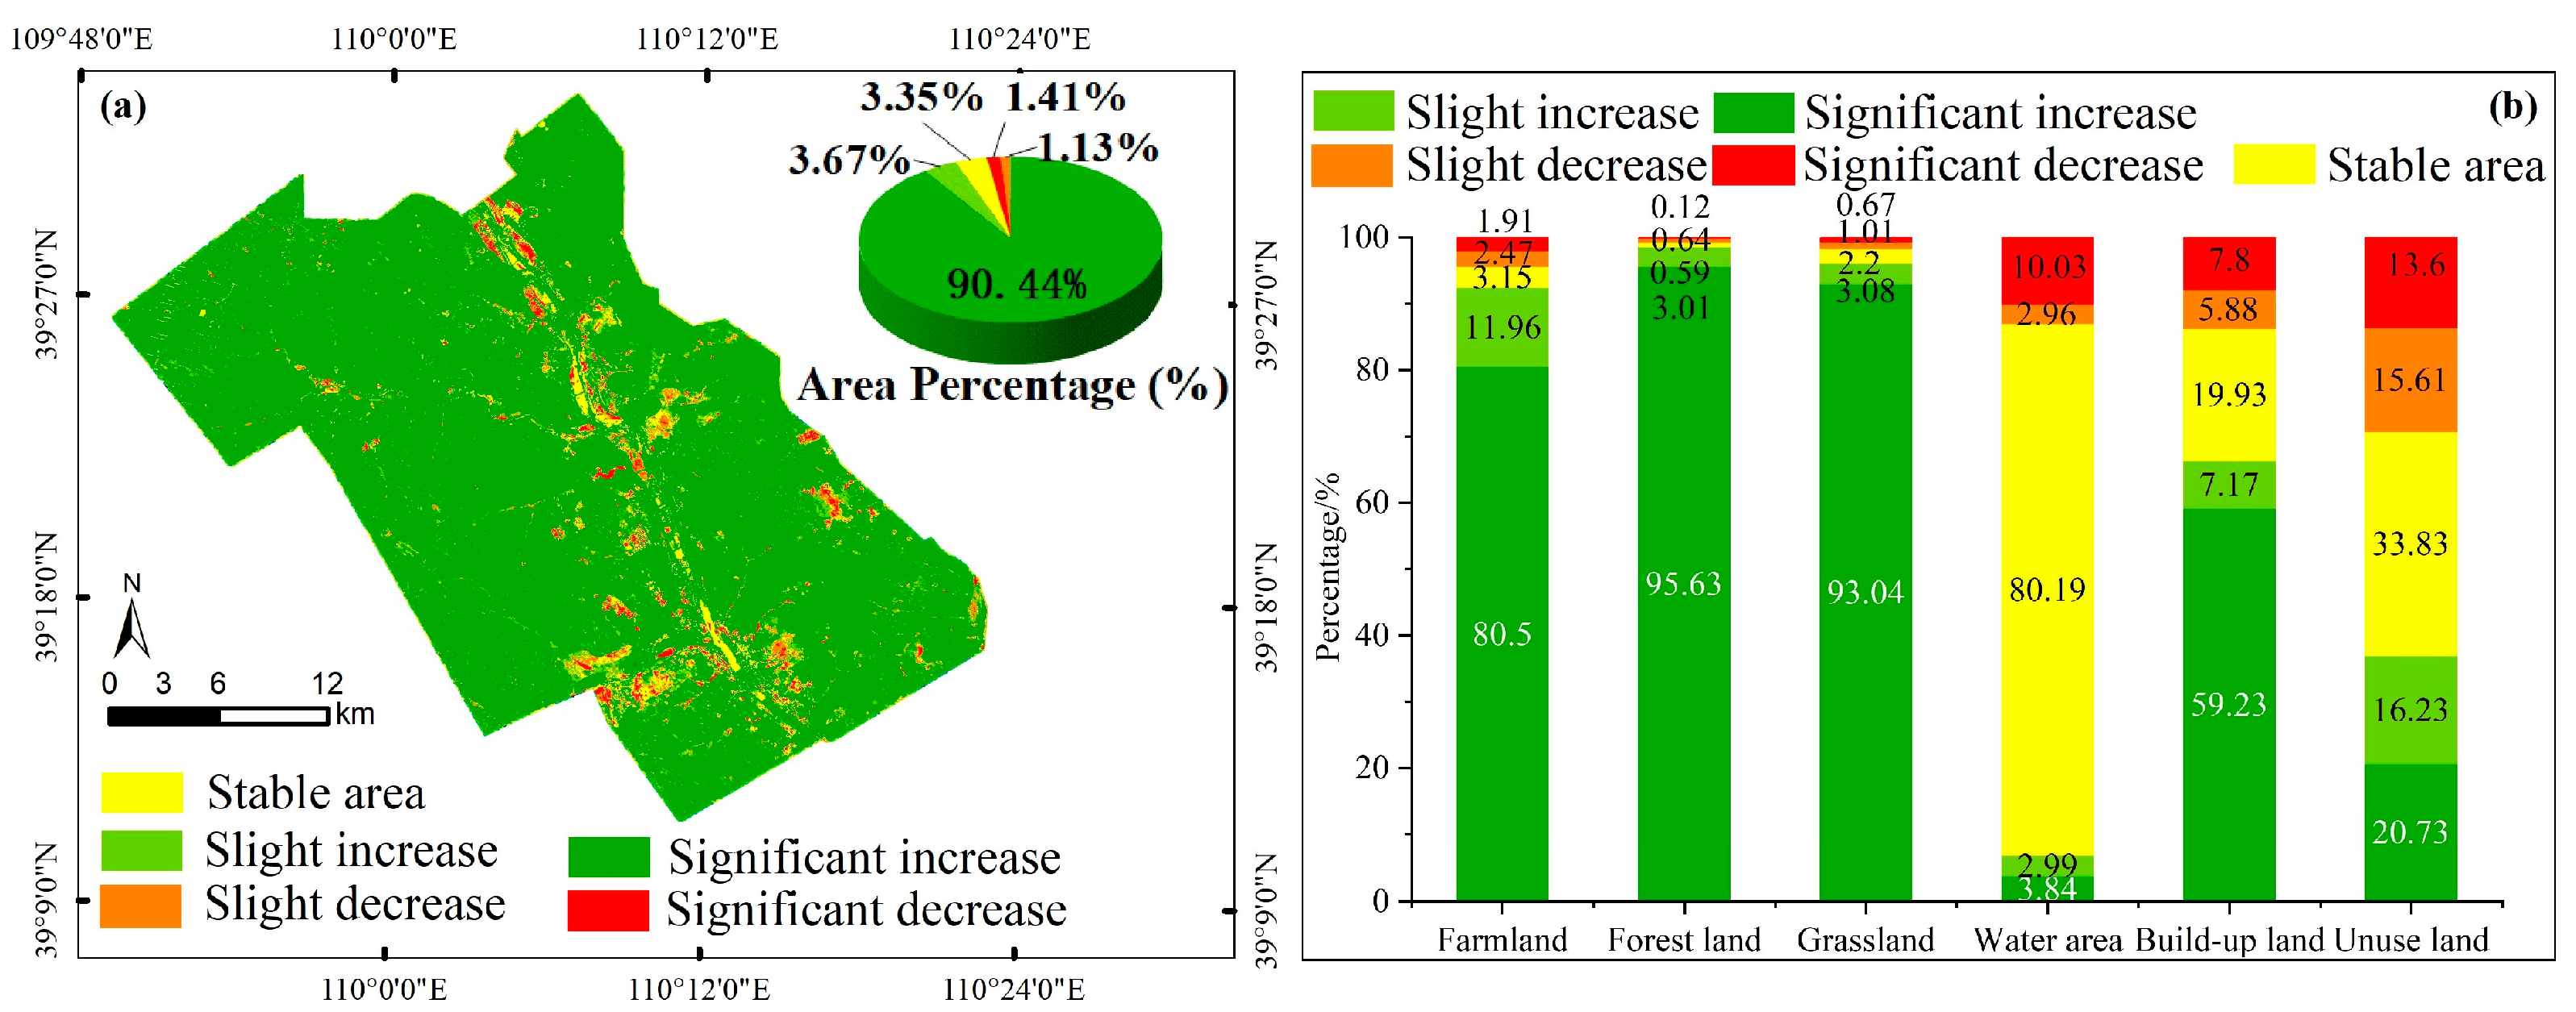
Under the influence of ecological restoration projects, kNDVI showed a fluctuating upward trend in the last 29 years, with an increase rate of 0.0046/a. In most parts of the mining area (90.44%), the vegetation growth kNDVI was significantly increased, with forest land, grassland, and cultivated land showing the largest increases. At the same time, due to the influence of human activities, the areas with poor vegetation growth mainly appeared on the edge of towns and mining areas.
(2)
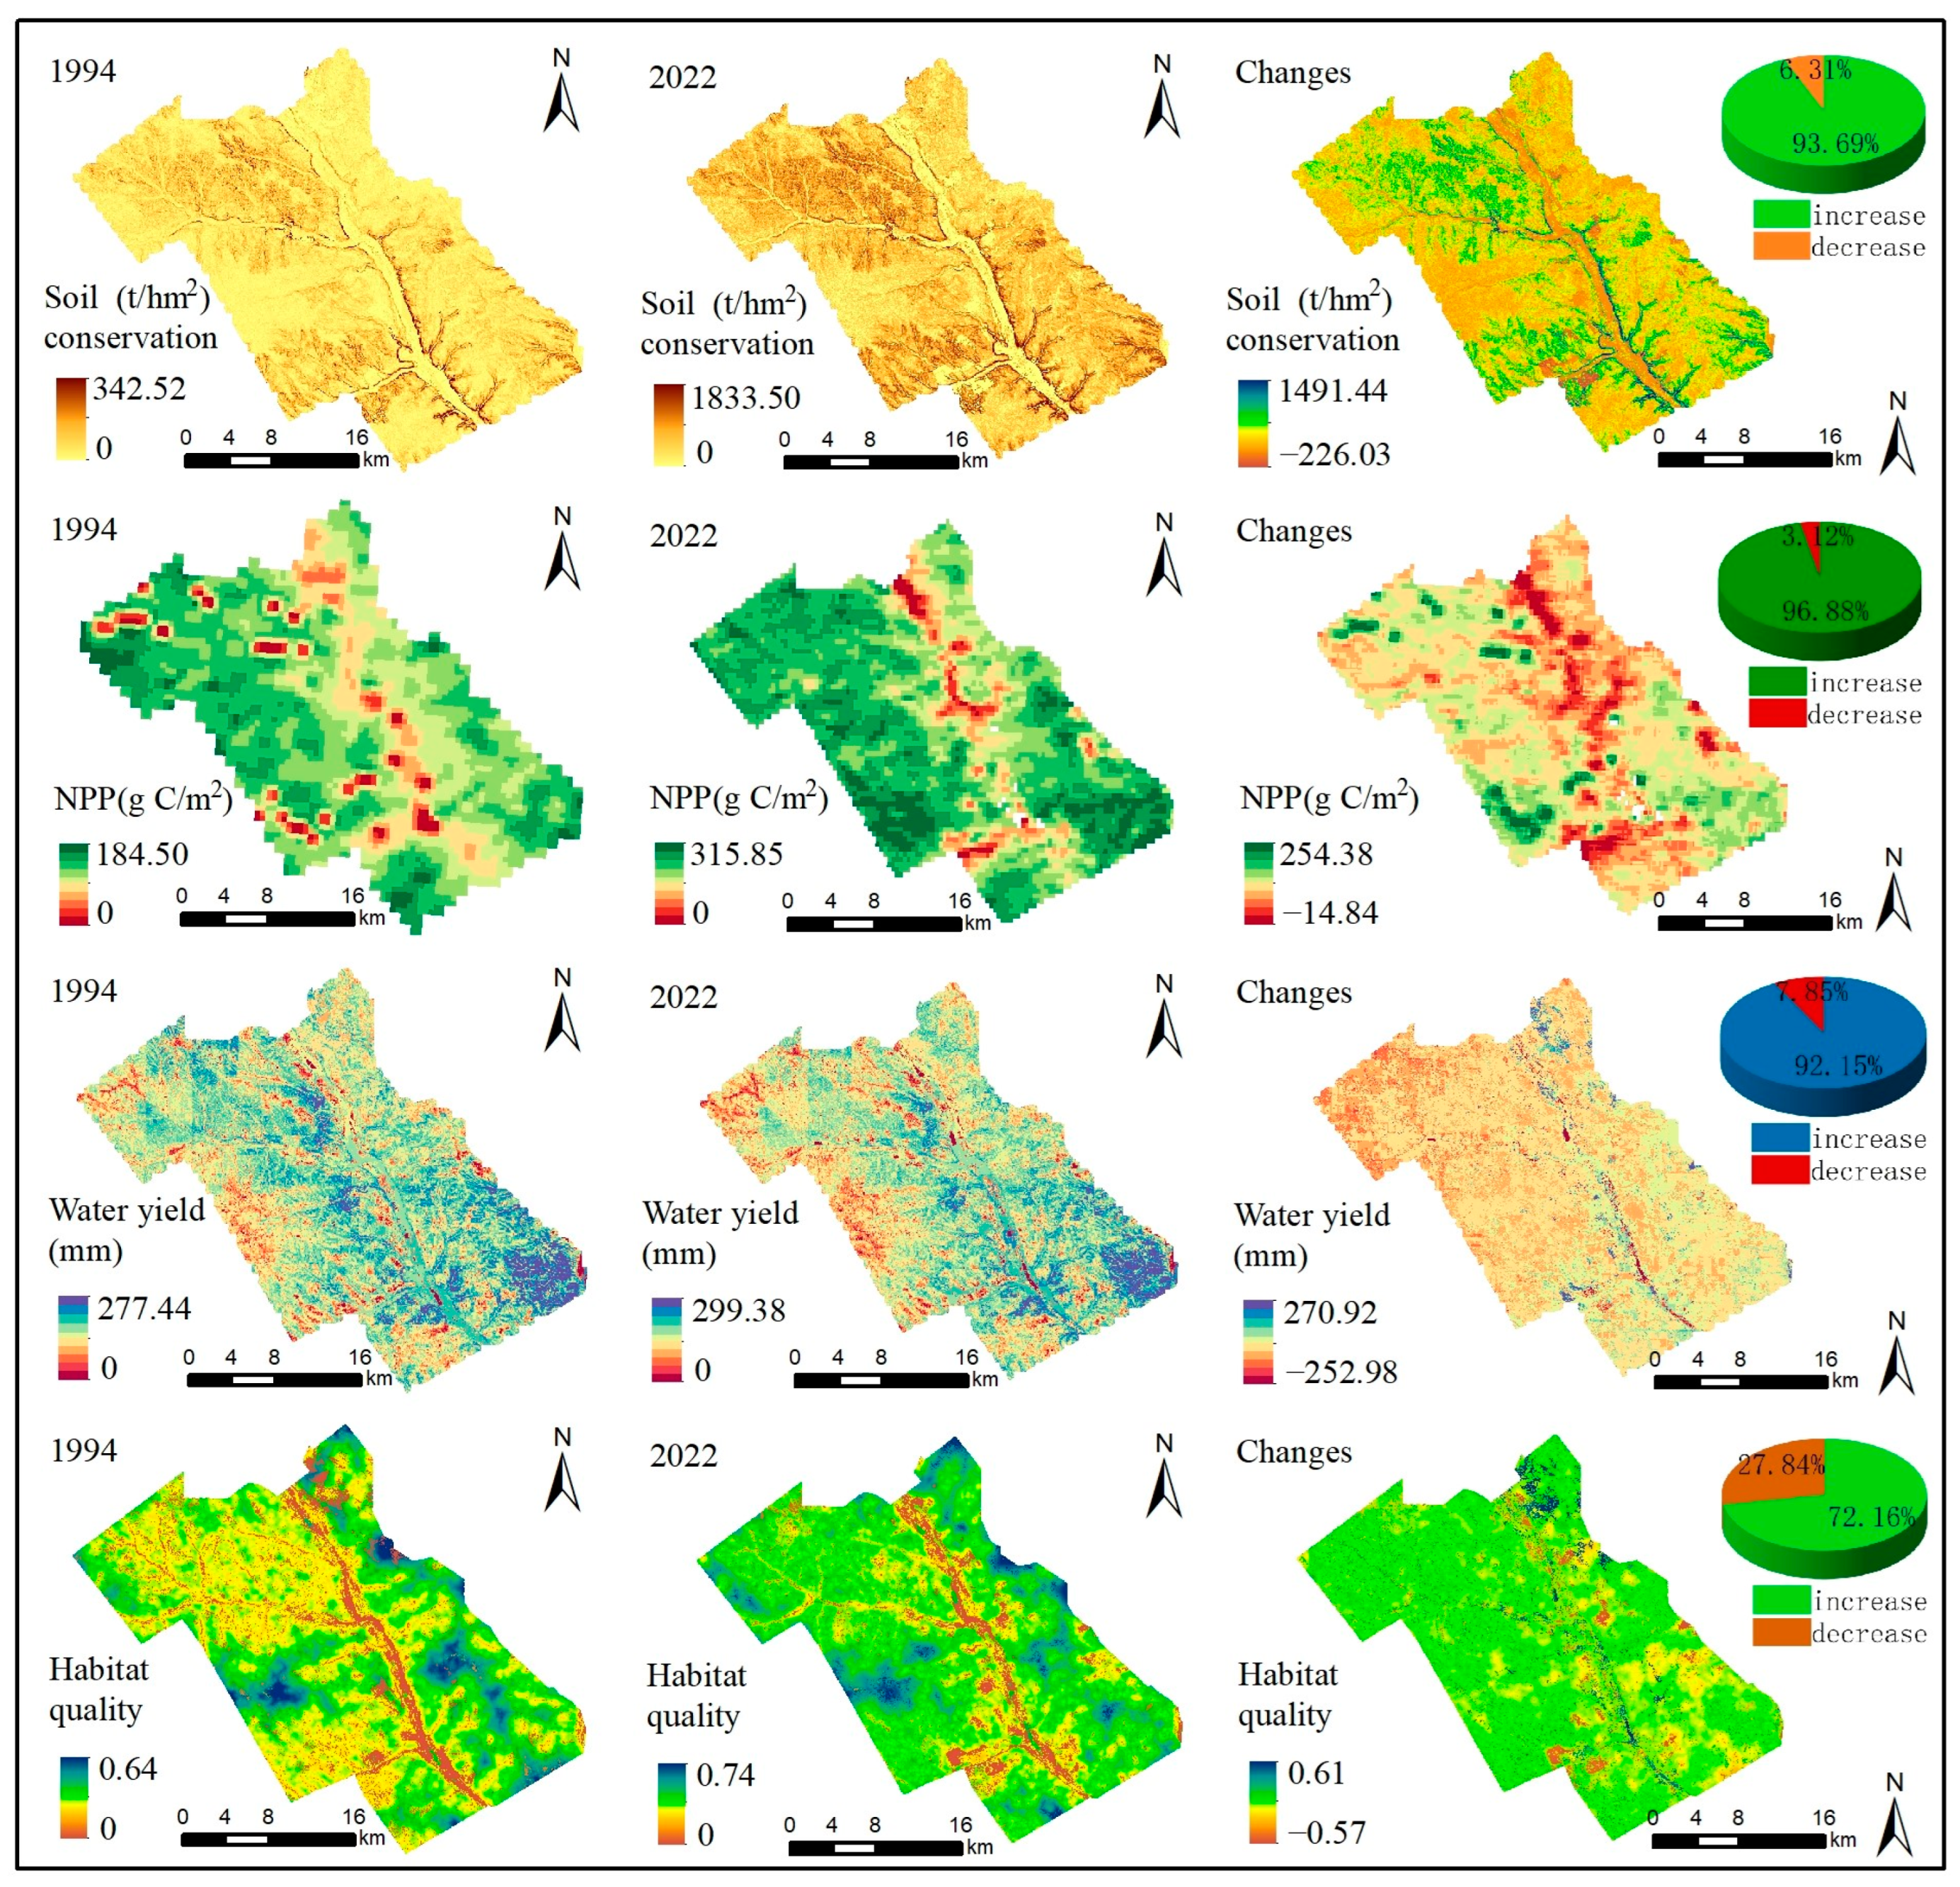
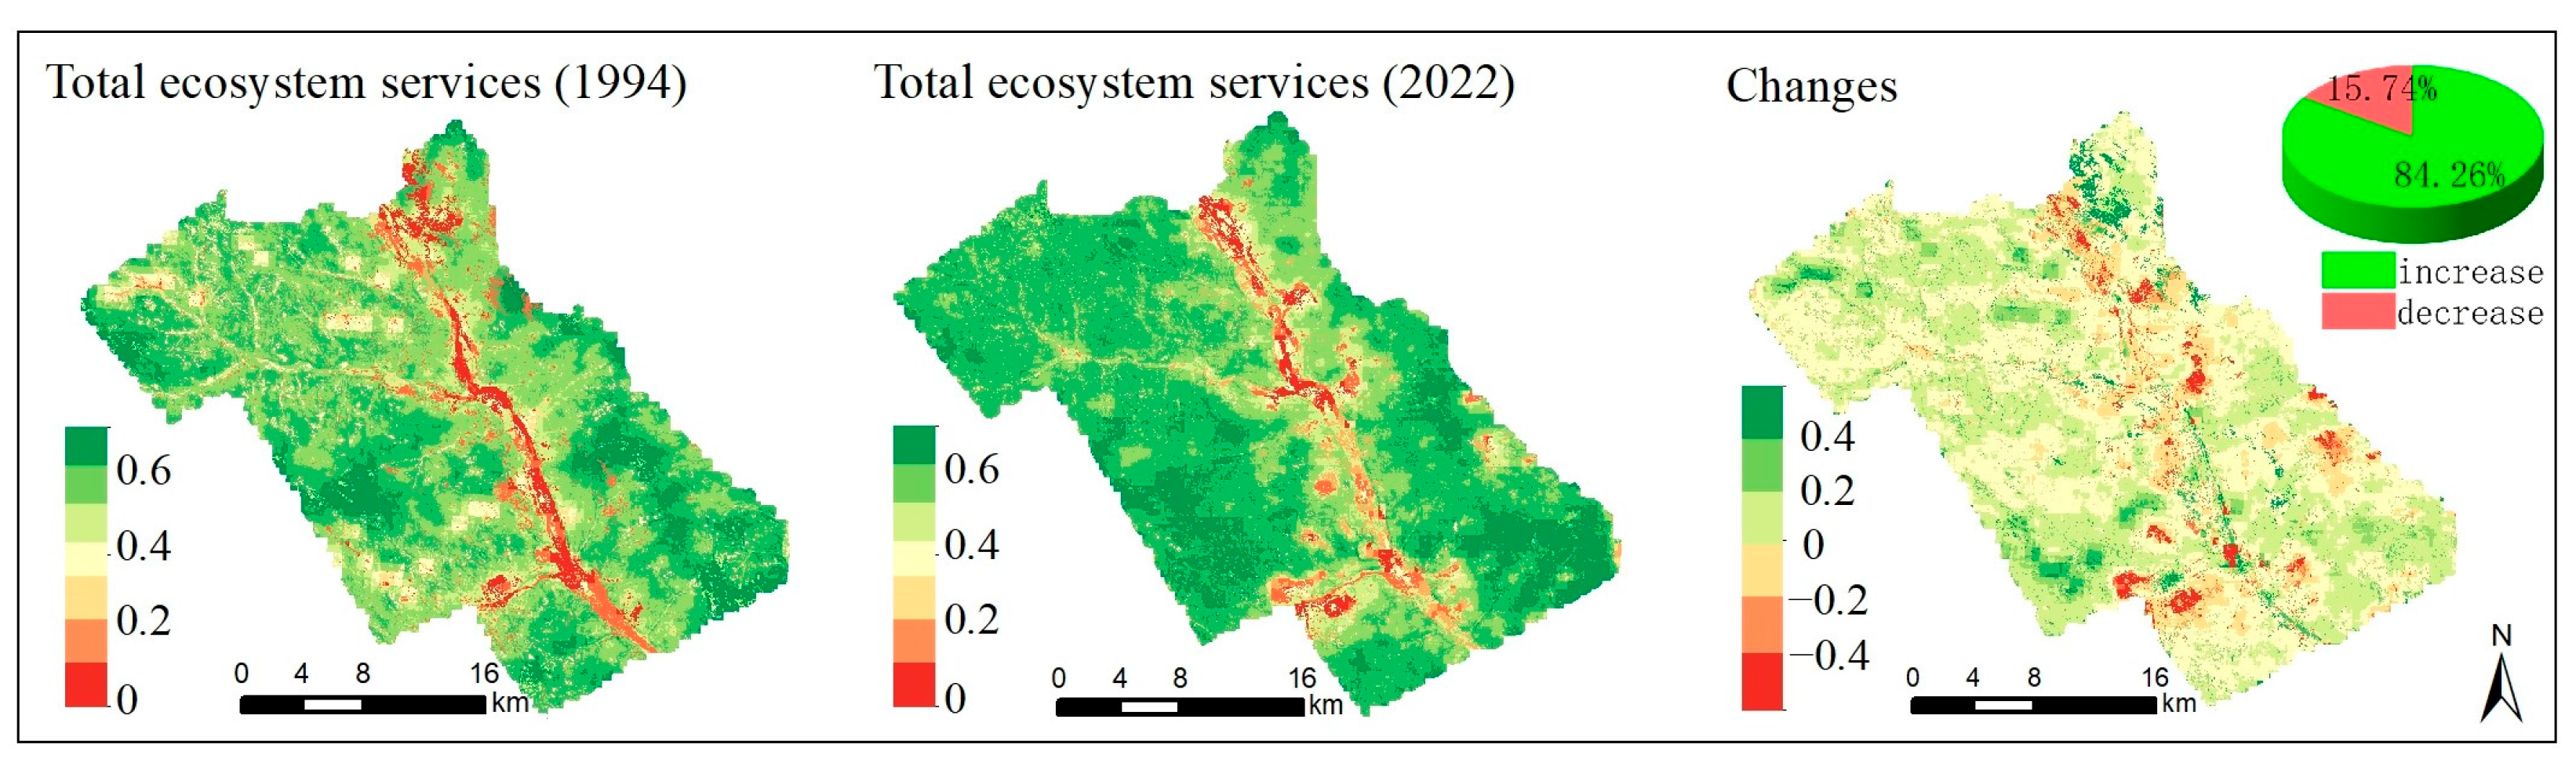
Since the implementation of the ecological restoration project in the Shendong mining area, all ecosystem service functions in the mining area have been significantly improved. The soil conservation service, NPP function, and water production service exhibit the most significant potential for enhancement, each above 92%. The ecological restoration of the mining area greatly promoted the improvement of total ecosystem services.
(3)
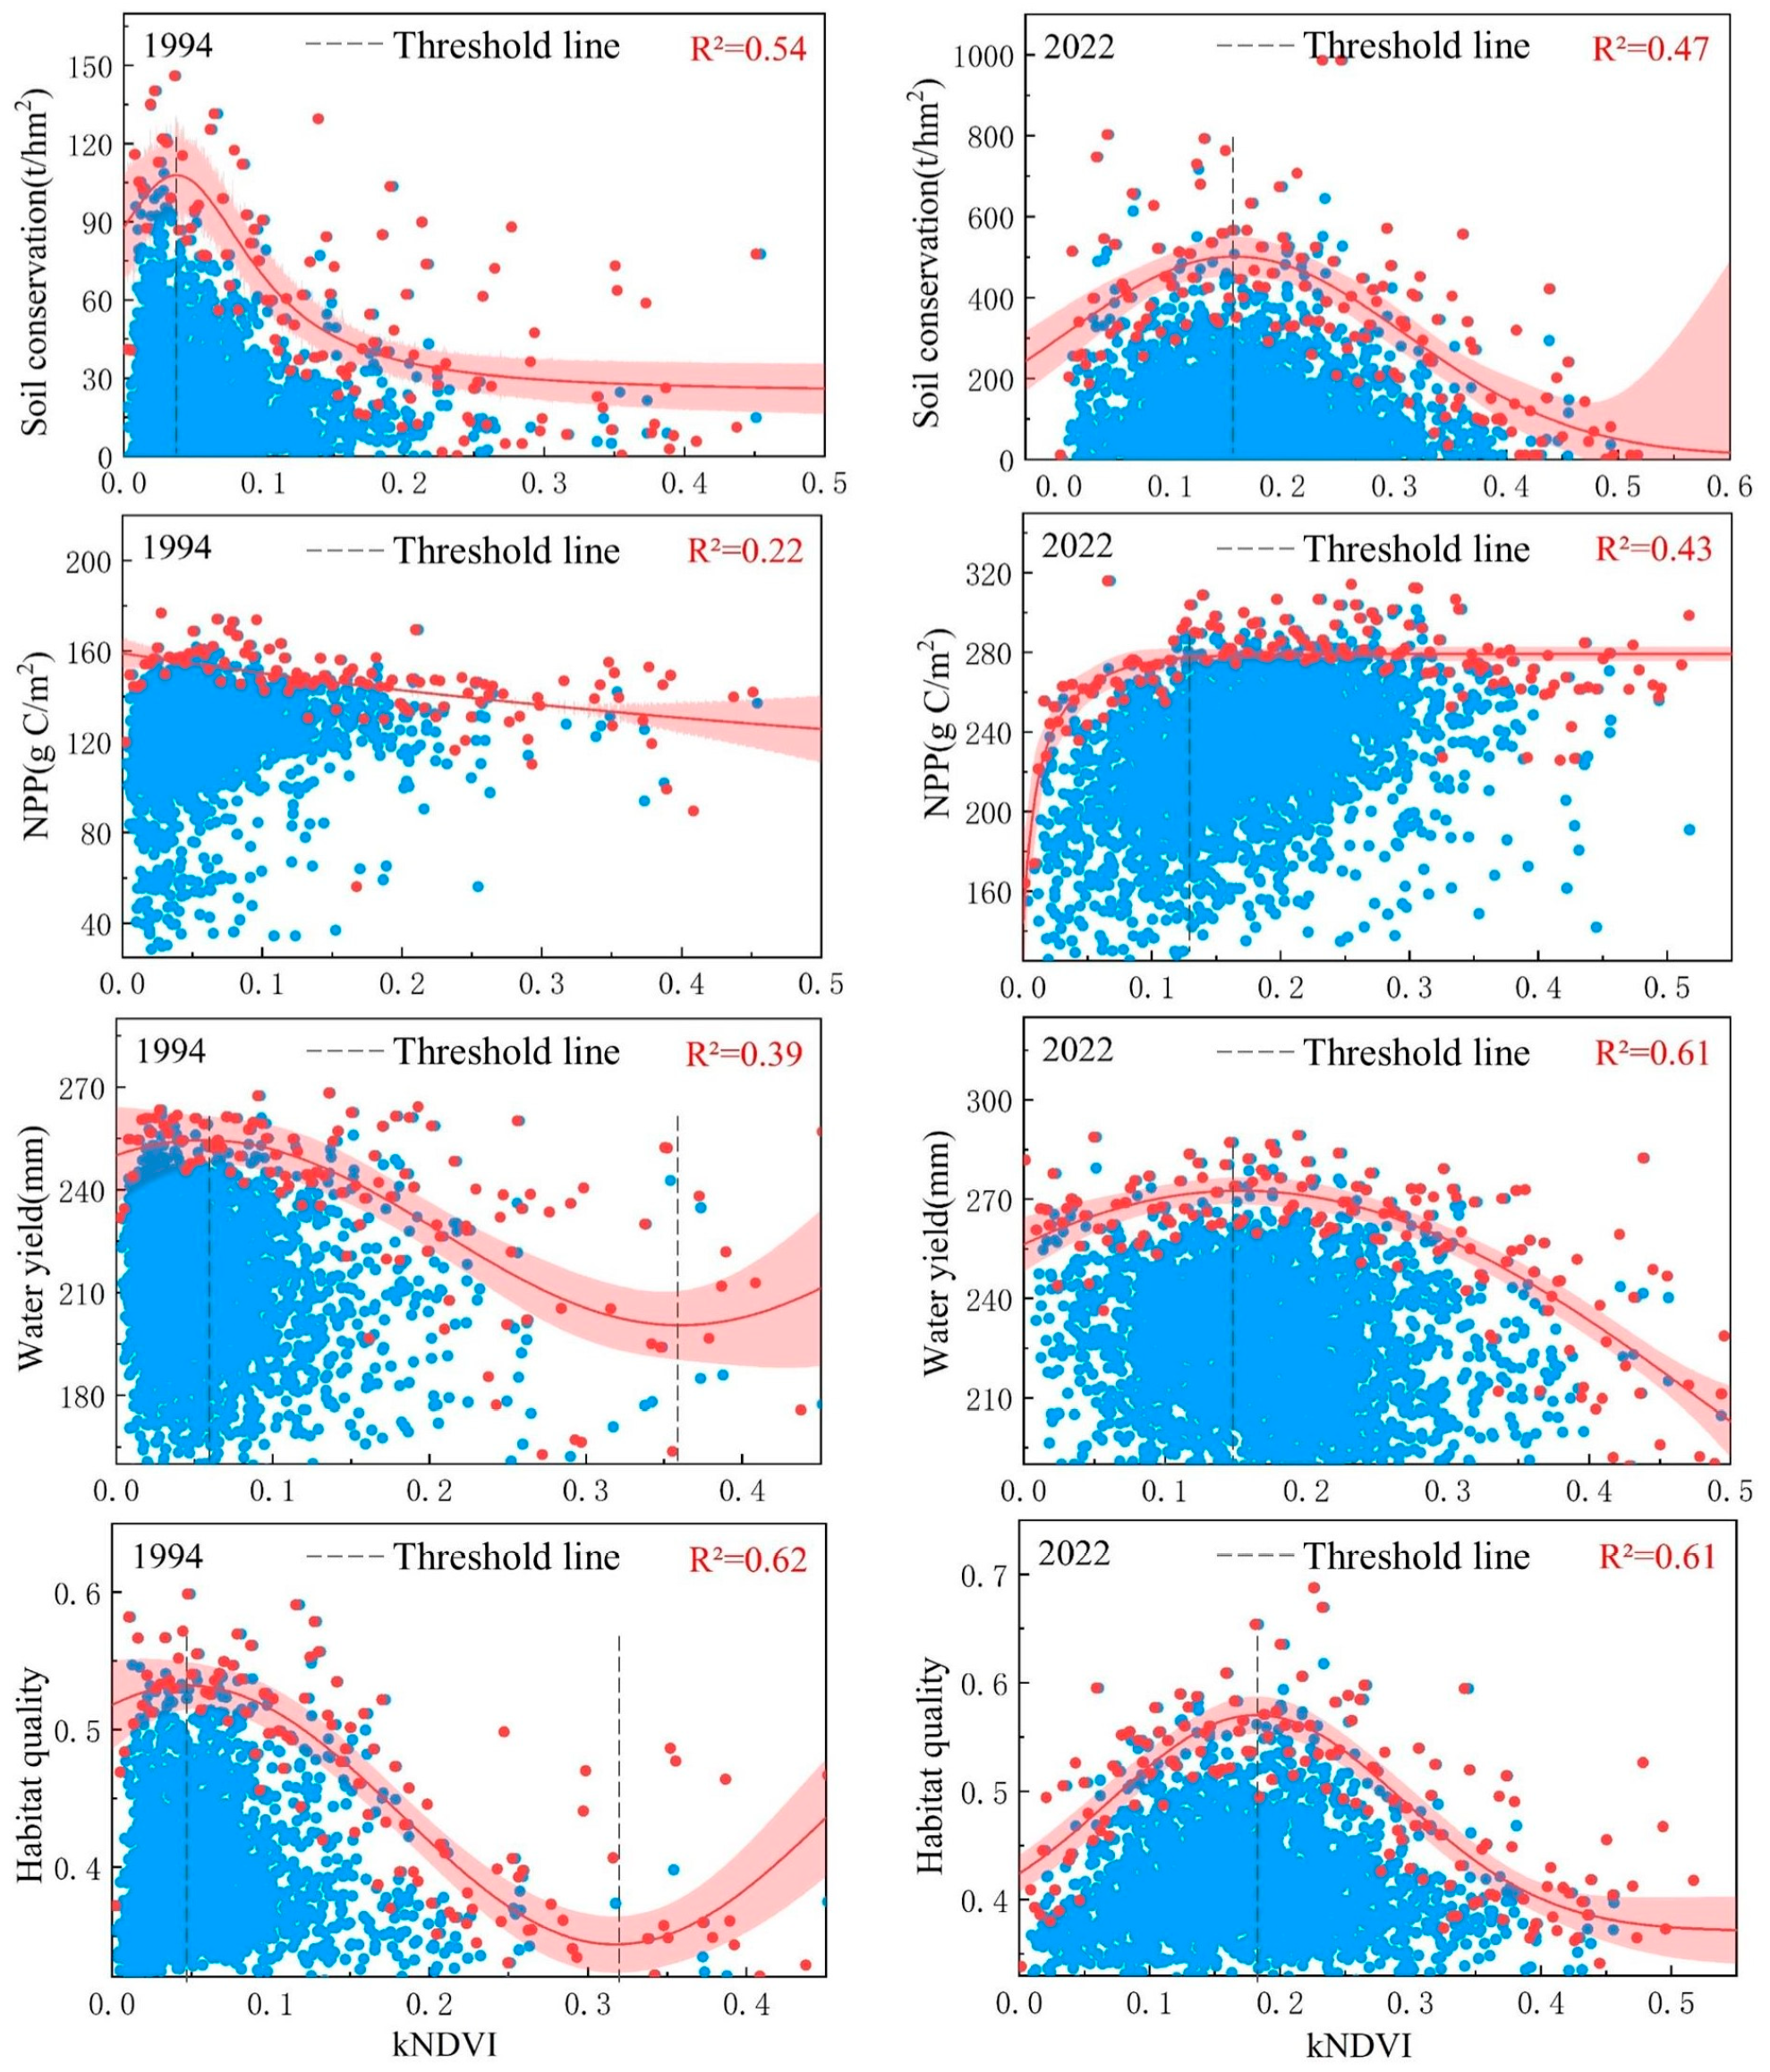
The restoration of vegetation has improved various ecosystem service functions in the Shendong mining area. Especially after the implementation of the ecological restoration project, the restriction of vegetation growth kNDVI on ecosystem services began to weaken. In 2022, the threshold of vegetation growth kNDVI for the maximum benefit of various ecosystem services should be between 0.1 and 0.2. The kNDVI threshold for the maximum benefit of total ecosystem services is 0.225.
(4)
Ecological restoration has increased the vegetation coverage rate in the mining area, and the increase in vegetation coverage has significantly enhanced the ecosystem service function. Ecological restoration projects, changes in vegetation coverage, and ecosystem services form a close and mutually reinforcing connection. Further explanation of the constraining effect of vegetation coverage kNDVI on various ecosystem services and its changes can serve as an important reference for future vegetation restoration, especially the constraining thresholds for various ecosystem services, which can be an important basis for future ecological regulation.

Author Contributions

Conceptualization, Z.C. and X.Z.; methodology, X.Z.; software, Y.J.; validation, Z.Z. and Y.C.; formal analysis, X.Z. and Z.C.; investigation, X.Z.; resources, Z.C.; data curation, X.Z.; writing—original draft preparation, S.W.; writing—review and editing, H.Z.; visualization, H.Z.; supervision, Z.C.; project administration, H.Z. and Z.C.; funding acquisition, H.Z. and Z.C. All authors have read and agreed to the published version of the manuscript.

Funding

The author(s) declare that financial support was received for the research, authorship, and/or publication of this article. This work is supported by the State Key Project of National Natural Science Foundation of China—Key projects of joint fund for regional innovation and development (grant number U22A20620 U21A20108), Doctoral Science Foundation of Henan Polytechnic University (grant number B2021-20), and China Shenhua Shendong Science and Technology Innovation Project (grant number E210100573).

Data Availability Statement

The original contributions presented in this study are included in the article. Further inquiries can be directed to the corresponding author.

Acknowledgments

We appreciate anonymous reviewers and their valuable comments. Also, we thank Editors for the editing and comments.

Conflicts of Interest

The authors declare that the research was conducted in the absence of any commercial or financial relationships that could be construed as a potential conflict of interest.

References

  1. Bogdanov, D.; Ram, M.; Aghahosseini, A.; Gulagi, A.; Oyewo, A.S.; Child, M.; Caldera, U.; Sadovskaia, K.; Farfan, J.; De Souza Noel Simas Barbosa, L.; et al. Low-cost renewable electricity as the key driver of the global energy transition towards sustainability. Energy 2021, 227, 120467. [Google Scholar] [CrossRef]
  2. Xu, Y.; Li, J.; Zhang, C.; Raval, S.; Guo, L.; Yang, F. Dynamics of carbon sequestration in vegetation affected by large-scale surface coal mining and subsequent restoration. Sci. Rep. 2024, 14, 13479. [Google Scholar] [CrossRef] [PubMed]
  3. Li, Y.; Cen, H.; Lin, T.-Y.; Lin, Y.-N.; Chiu, Y.-H. Sustainable coal mine and coal land development in China. Resour. Policy 2022, 79, 103092. [Google Scholar] [CrossRef]
  4. Feng, Y.; Wang, J.; Bai, Z.; Reading, L. Effects of surface coal mining and land reclamation on soil properties: A review. Earth-Sci. Rev. 2019, 191, 12–25. [Google Scholar] [CrossRef]
  5. Jakob, M.; Steckel, J.C.; Jotzo, F.; Sovacool, B.K.; Cornelsen, L.; Chandra, R.; Edenhofer, O.; Holden, C.; Löschel, A.; Nace, T.; et al. The future of coal in a carbon-constrained climate. Nat. Clim. Change 2020, 10, 704–707. [Google Scholar] [CrossRef]
  6. Liu, X.; Zeng, Y.; Wu, Q.; Meng, S.; Liang, J.; Hou, Z. Ecological-Based Mining: A Coal–Water–Thermal Collaborative Paradigm in Ecologically Fragile Areas in Western China. Engineering 2024, 38, 209–222. [Google Scholar] [CrossRef]
  7. Yang, S.; Gao, X. Application of environmental protection investment benefit model of coal enterprises in environmental protection construction of smart city. Heliyon 2023, 9, e19025. [Google Scholar] [CrossRef]
  8. Jiang, H.; Fan, G.; Zhang, D.; Zhang, S.; Fan, Y. Evaluation of eco-environmental quality for the coal-mining region using multi-source data. Sci. Rep. 2022, 12, 6623. [Google Scholar] [CrossRef]
  9. Zhao, L.-T.; Liu, Z.-T.; Cheng, L. How will China’s coal industry develop in the future? A quantitative analysis with policy implications. Energy 2021, 235, 121406. [Google Scholar] [CrossRef]
  10. Zhang, Z.; Tong, Z.; Zhang, L.; Liu, Y. What are the dominant factors and optimal driving threshold for the synergy and tradeoff between ecosystem services, from a nonlinear coupling perspective? J. Clean. Prod. 2023, 422, 138609. [Google Scholar] [CrossRef]
  11. Hong, G.; Liu, S.; Liu, W.; Wu, X. Nonlinear trade-off relationship and critical threshold between ecosystem services and climate resilience for sustainable urban development. Sustain. Cities Soc. 2024, 103, 105253. [Google Scholar] [CrossRef]
  12. Chen, Y.-P.; Wang, K.-B.; Fu, B.-J.; Wang, Y.-F.; Tian, H.-W.; Wang, Y.; Zhang, Y. 65% cover is the sustainable vegetation threshold on the Loess Plateau. Environ. Sci. Ecotechnol. 2024, 22, 100442. [Google Scholar] [CrossRef]
  13. Zhang, X.; Song, J.; Wang, Y.; Sun, H.; Li, Q. Threshold effects of vegetation coverage on runoff and soil loss in the Loess Plateau of China: A meta-analysis. Geoderma 2022, 412, 115720. [Google Scholar] [CrossRef]
  14. Li, W.; Chen, J.; Zhang, Z. Forest quality-based assessment of the Returning Farmland to Forest Program at the community level in SW China. For. Ecol. Manag. 2020, 461, 117938. [Google Scholar] [CrossRef]
  15. Wang, Q.; Liu, H.; Liang, B.; Shi, L.; Wu, L.; Cao, J. Will large-scale forestation lead to a soil water deficit crisis in China’s drylands? Sci. Bull. 2024, 69, 1506–1514. [Google Scholar] [CrossRef] [PubMed]
  16. Boldy, R.; Santini, T.; Annandale, M.; Erskine, P.D.; Sonter, L.J. Understanding the impacts of mining on ecosystem services through a systematic review. Extr. Ind. Soc. 2021, 8, 457–466. [Google Scholar] [CrossRef]
  17. Zhou, G.; Eisenhauer, N.; Terrer, C.; Eldridge, D.J.; Duan, H.; Guirado, E.; Berdugo, M.; Zhou, L.; Liu, S.; Zhou, X.; et al. Resistance of ecosystem services to global change weakened by increasing number of environmental stressors. Nat. Geosci. 2024, 17, 882–888. [Google Scholar] [CrossRef]
  18. Zhang, Z.; Li, G.; Su, X.; Zhuang, X.; Wang, L.; Fu, H.; Li, L. Geochemical controls on the enrichment of fluoride in the mine water of the Shendong mining area, China. Chemosphere 2021, 284, 131388. [Google Scholar] [CrossRef]
  19. Tianjiao, F.; Tianxing, W.; Keesstra, S.D.; Jianjun, Z.; Huaxing, B.; Ruoshui, W.; Ping, W. Long-term effects of vegetation restoration on hydrological regulation functions and the implications to afforestation on the Loess Plateau. Agric. For. Meteorol. 2023, 330, 109313. [Google Scholar] [CrossRef]
  20. Zheng, W.; Guo, X.; Zhou, P.; Tang, L.; Lai, J.; Dai, Y.; Yan, W.; Wu, J. Vegetation restoration enhancing soil carbon sequestration in karst rocky desertification ecosystems: A meta-analysis. J. Environ. Manag. 2024, 370, 122530. [Google Scholar] [CrossRef]
  21. Ma, T.; Wang, T.; Yang, D.; Yang, S. Impacts of vegetation restoration on water resources and carbon sequestration in the mountainous area of Haihe River basin, China. Sci. Total Environ. 2023, 869, 161724. [Google Scholar] [CrossRef] [PubMed]
  22. Wang, Z.; Fu, B.; Wu, X.; Li, Y.; Feng, Y.; Wang, S.; Wei, F.; Zhang, L. Vegetation resilience does not increase consistently with greening in China’s Loess Plateau. Commun. Earth Environ. 2023, 4, 336. [Google Scholar] [CrossRef]
  23. Liu, J.; Dou, Y.; Chen, H. Stepwise Ecological Restoration: A framework for improving restoration outcomes. Geogr. Sustain. 2024, 5, 160–166. [Google Scholar] [CrossRef]
  24. Zhang, Z.; Liu, Y.; Wang, Y.; Liu, Y.; Zhang, Y.; Zhang, Y. What factors affect the synergy and tradeoff between ecosystem services, and how, from a geospatial perspective? J. Clean. Prod. 2020, 257, 120454. [Google Scholar] [CrossRef]
  25. Chang, B.; Chen, B.; Chen, W.; Xu, S.; He, X.; Yao, J.; Huang, Y. Analysis of trade-off and synergy of ecosystem services and driving forces in urban agglomerations in Northern China. Ecol. Indic. 2024, 165, 112210. [Google Scholar] [CrossRef]
  26. Feng, Z.; Jin, X.; Chen, T.; Wu, J. Understanding trade-offs and synergies of ecosystem services to support the decision-making in the Beijing–Tianjin–Hebei region. Land Use Policy 2021, 106, 105446. [Google Scholar] [CrossRef]
  27. Liu, Y.; Zhang, C.; Zeng, H. Constraint effects among several key ecosystem service types and their influencing factors: A case study of the Pearl River Delta, China. Ecol. Indic. 2023, 146, 109883. [Google Scholar] [CrossRef]
  28. Zhao, Z.; Dai, E. Vegetation cover dynamics and its constraint effect on ecosystem services on the Qinghai-Tibet Plateau under ecological restoration projects. J. Environ. Manag. 2024, 356, 120535. [Google Scholar] [CrossRef]
  29. He, J.; Li, Y.; Shi, X.; Hou, H. Integrating the impacts of vegetation coverage on ecosystem services to determine ecological restoration targets for adaptive management on the Loess Plateau, China. Land Degrad. Dev. 2023, 34, 5697–5712. [Google Scholar] [CrossRef]
  30. de la Barrera, F.; Rubio, P.; Banzhaf, E. The value of vegetation cover for ecosystem services in the suburban context. Urban For. Urban Green. 2016, 16, 110–122. [Google Scholar] [CrossRef]
  31. Li, B.V.; Wu, S.; Hua, F.; Mi, X. The past and future of ecosystem restoration in China. Curr. Biol. 2024, 34, R379–R387. [Google Scholar] [CrossRef]
  32. Liu, Y.; Wei, J.; Bi, Y.; Yue, H.; He, X. Evaluation of ecosystem service function in Shendong mining area. Meitan Xuebao/J. China Coal Soc. 2021, 46, 1599–1613. [Google Scholar] [CrossRef]
  33. Wang, X.; Peng, S.; He, Y. Soil moisture evidence of self-restoration in coal mining subsidence area of Shendong Mining area: Cognition based on stable isotopes. Sci. Total Environ. 2024, 951, 175831. [Google Scholar] [CrossRef] [PubMed]
  34. Wang, Q.; Moreno-Martínez, Á.; Muñoz-Marí, J.; Campos-Taberner, M.; Camps-Valls, G. Estimation of vegetation traits with kernel NDVI. ISPRS J. Photogramm. Remote Sens. 2023, 195, 408–417. [Google Scholar] [CrossRef]
  35. Zeng, Y.; Hao, D.; Huete, A.; Dechant, B.; Berry, J.; Chen, J.M.; Joiner, J.; Frankenberg, C.; Bond-Lamberty, B.; Ryu, Y.; et al. Optical vegetation indices for monitoring terrestrial ecosystems globally. Nat. Rev. Earth Environ. 2022, 3, 477–493. [Google Scholar] [CrossRef]
  36. Guo, Y.; Huang, Y.; Li, J.; Ouyang, S.; Wu, L.; Qi, W. Study on the influence of mining disturbance on the variation characteristics of vegetation index: A case study of Lingwu Mining Area. Environ. Dev. 2023, 45, 100811. [Google Scholar] [CrossRef]
  37. Jiang, W.; Yuan, L.; Wang, W.; Cao, R.; Zhang, Y.; Shen, W. Spatio-temporal analysis of vegetation variation in the Yellow River Basin. Ecol. Indic. 2015, 51, 117–126. [Google Scholar] [CrossRef]
  38. Hamed, K.H. Trend detection in hydrologic data: The Mann–Kendall trend test under the scaling hypothesis. J. Hydrol. 2008, 349, 350–363. [Google Scholar] [CrossRef]
  39. Zhang, Y.; Hu, Q.; Zou, F. Spatio-Temporal Changes of Vegetation Net Primary Productivity and Its Driving Factors on the Qinghai-Tibetan Plateau from 2001 to 2017. Remote Sens. 2021, 13, 1566. [Google Scholar] [CrossRef]
  40. Zhu, W.-q.; Pan, Y.-z.; Liu, X.; Wang, A.-l. Spatio-temporal distribution of net primary productivity along the Northeast China Transect and its response to climatic change. J. For. Res. 2006, 17, 93–98. [Google Scholar] [CrossRef]
  41. Costanza, R.; d’Arge, R.; de Groot, R.; Farber, S.; Grasso, M.; Hannon, B.; Limburg, K.; Naeem, S.; O’Neill, R.V.; Paruelo, J.; et al. The value of the world’s ecosystem services and natural capital. Nature 1997, 387, 253–260. [Google Scholar] [CrossRef]
  42. Bai, Y.; Zheng, H.; Ouyang, Z.; Zhuang, C.; Jiang, B. Modeling hydrological ecosystem services and tradeoffs: A case study in Baiyangdian watershed, China. Environ. Earth Sci. 2013, 70, 709–718. [Google Scholar] [CrossRef]
  43. Lal, R. Soil conservation and ecosystem services. Int. Soil Water Conserv. Res. 2014, 2, 36–47. [Google Scholar] [CrossRef]
  44. Jamshidi, R.; Dragovich, D.; Webb, A.A. Distributed empirical algorithms to estimate catchment scale sediment connectivity and yield in a subtropical region. Hydrol. Process. 2014, 28, 2671–2684. [Google Scholar] [CrossRef]
  45. Yuan, W.; Chen, L.; Chen, H.; Deng, S.; Ji, H.; Liang, F. Assessing habitat quality at Poyang Lake based on InVEST and Geodetector modeling. Ecol. Evol. 2023, 13, e10759. [Google Scholar] [CrossRef]
  46. Tang, F.; Fu, M.; Wang, L.; Zhang, P. Land-use change in Changli County, China: Predicting its spatio-temporal evolution in habitat quality. Ecol. Indic. 2020, 117, 106719. [Google Scholar] [CrossRef]
  47. An, Q.; Yuan, X.; Zhang, X.; Yang, Y.; Chen, J.; An, J. Spatio-temporal interaction and constraint effects between ecosystem services and human activity intensity in Shaanxi Province, China. Ecol. Indic. 2024, 160, 111937. [Google Scholar] [CrossRef]
  48. Gao, Y.; Fu, S.; Cui, H.; Cao, Q.; Wang, Z.; Zhang, Z.; Wu, Q.; Qiao, J. Identifying the spatio-temporal pattern of drought characteristics and its constraint factors in the Yellow River Basin. Ecol. Indic. 2023, 154, 110753. [Google Scholar] [CrossRef]
  49. Zhang, L.; Ming, D.; Li, Y.; Cai, J.; Zhang, Z. A new slope unit extraction method based on terrain topology searching and vector similarity constraint for landslide analysis. CATENA 2024, 246, 108355. [Google Scholar] [CrossRef]
  50. Li, Z.; Guan, D.; Zhou, L.; Zhang, Y. Constraint relationship of ecosystem services in the Yangtze River Economic Belt, China. Environ. Sci. Pollut. Res. 2022, 29, 12484–12505. [Google Scholar] [CrossRef] [PubMed]
  51. Mills, A.; Fey, M.V.; Gröngröft, A.; Petersen, A.; Medinski, T. Unravelling the effects of soil properties on water infiltration: Segmented quantile regression on a large data set from arid south-west Africa. Aust. J. Soil Res. 2006, 44, 783–797. [Google Scholar] [CrossRef]
  52. Li, X.; Ma, L.; Ruman, A.M.; Iqbal, N.; Strielkowski, W. Impact of natural resource mining on sustainable economic development: The role of education and green innovation in China. Geosci. Front. 2024, 15, 101703. [Google Scholar] [CrossRef]
  53. Zhang, X.; Zhichao, C.; Jiao, Y.; Cheng, Y.; Zhu, Z.; Wang, S.; Zhang, H. Quantitative Analysis of Vegetation Dynamics and Driving Factors in the Shendong Mining Area under the Background of Coal Mining. Forests 2024, 15, 1207. [Google Scholar] [CrossRef]
  54. Sha, Z.; Bai, Y.; Li, R.; Lan, H.; Zhang, X.; Li, J.; Liu, X.; Chang, S.; Xie, Y. The global carbon sink potential of terrestrial vegetation can be increased substantially by optimal land management. Commun. Earth Environ. 2022, 3, 8. [Google Scholar] [CrossRef]
  55. Feng, H.; Kang, P.; Deng, Z.; Zhao, W.; Hua, M.; Zhu, X.; Wang, Z. The impact of climate change and human activities to vegetation carbon sequestration variation in Sichuan and Chongqing. Environ. Res. 2023, 238, 117138. [Google Scholar] [CrossRef]
  56. Yang, X.; Yao, W.; Li, P.; Hu, J.; Latifi, H.; Kang, L.; Wang, N.; Zhang, D. Changes of SOC Content in China’s Shendong Coal Mining Area during 1990–2020 Investigated Using Remote Sensing Techniques. Sustainability 2022, 14, 7374. [Google Scholar] [CrossRef]
  57. Zhang, L.; Yang, L.; Zohner, C.M.; Crowther, T.W.; Li, M.; Shen, F.; Guo, M.; Qin, J.; Yao, L.; Zhou, C. Direct and indirect impacts of urbanization on vegetation growth across the world’s cities. Sci. Adv. 2022, 8, eabo0095. [Google Scholar] [CrossRef]
  58. Li, Y.; Zheng, Z.; Qin, Y.; Rong, P. Relative contributions of natural and man-made factors to vegetation cover change of environmentally sensitive and vulnerable areas of China. J. Clean. Prod. 2021, 321, 128917. [Google Scholar] [CrossRef]
  59. Zhou, W.; Head, M.J.; Deng, L. Climate changes in northern China since the late Pleistocene and its response to global change. Quat. Int. 2001, 83–85, 285–292. [Google Scholar] [CrossRef]
  60. Wang, X.; Li, Y.; Yan, M.; Gong, X. Changes in temperature and precipitation extremes in the arid regions of China during 1960–2016. Front. Ecol. Evol. 2022, 10, 902813. [Google Scholar] [CrossRef]
  61. Duo, A.; Zhao, W.; Qu, X.; Jing, R.; Xiong, K. Spatio-temporal variation of vegetation coverage and its response to climate change in North China plain in the last 33 years. Int. J. Appl. Earth Obs. Geoinf. 2016, 53, 103–117. [Google Scholar] [CrossRef]
  62. Fu, B.; Wang, S.; Su, C.; Forsius, M. Linking ecosystem processes and ecosystem services. Curr. Opin. Environ. Sustain. 2013, 5, 4–10. [Google Scholar] [CrossRef]
  63. Wang, J.; Wu, W.; Yang, M.; Gao, Y.; Shao, J.; Yang, W.; Ma, G.; Yu, F.; Yao, N.; Jiang, H. Exploring the complex trade-offs and synergies of global ecosystem services. Environ. Sci. Ecotechnol. 2024, 21, 100391. [Google Scholar] [CrossRef] [PubMed]
  64. Li, S.; Li, X.; Dou, H.; Dang, D.; Gong, J. Integrating constraint effects among ecosystem services and drivers on seasonal scales into management practices. Ecol. Indic. 2021, 125, 107425. [Google Scholar] [CrossRef]
  65. He, S.; Xie, Y.; Zhang, J.; Luo, Y.; Wang, Q. Heterogeneity of Ecosystem Service Interactions Through Scale Effects and Time Effects and Their Social-Ecological Determinants in the Tuo River Basin. Land 2025, 14, 103. [Google Scholar] [CrossRef]
  66. Xu, Z.; Peng, J. Recognizing ecosystem service’s contribution to SDGs: Ecological foundation of sustainable development. Geogr. Sustain. 2024, 5, 511–525. [Google Scholar] [CrossRef]
  67. Ouyang, Z.; Zheng, H.; Xiao, Y.; Polasky, S.; Liu, J.; Xu, W.; Wang, Q.; Zhang, L.; Xiao, Y.; Rao, E.; et al. Improvements in ecosystem services from investments in natural capital. Science 2016, 352, 1455–1459. [Google Scholar] [CrossRef]
  68. Matson, P.A.; Parton, W.J.; Power, A.G.; Swift, M.J. Agricultural Intensification and Ecosystem Properties. Science 1997, 277, 504–509. [Google Scholar] [CrossRef]
  69. Wang, H.; Wang, L.; Yang, Q.; Fu, X.; Guo, M.; Zhang, S.; Wu, D.; Zhu, Y.; Wu, G. Interaction between ecosystem service supply and urbanization in northern China. Ecol. Indic. 2023, 147, 109923. [Google Scholar] [CrossRef]
  70. Yuan, Y.; Wu, S.; Yu, Y.; Tong, G.; Mo, L.; Yan, D.; Li, F. Spatiotemporal interaction between ecosystem services and urbanization: Case study of Nanjing City, China. Ecol. Indic. 2018, 95, 917–929. [Google Scholar] [CrossRef]
  71. Wang, X.; Xiao, X.; Xu, X.; Zou, Z.; Chen, B.; Qin, Y.; Zhang, X.; Dong, J.; Liu, D.; Pan, L.; et al. Rebound in China’s coastal wetlands following conservation and restoration. Nat. Sustain. 2021, 4, 1076–1083. [Google Scholar] [CrossRef]
  72. Mustafa, A.; Minggang, X.; Ali Shah, S.A.; Abrar, M.M.; Nan, S.; Baoren, W.; Zejiang, C.; Saeed, Q.; Naveed, M.; Mehmood, K.; et al. Soil aggregation and soil aggregate stability regulate organic carbon and nitrogen storage in a red soil of southern China. J. Environ. Manag. 2020, 270, 110894. [Google Scholar] [CrossRef]
  73. Xiong, M.; Sun, R.; Chen, L. Effects of soil conservation techniques on water erosion control: A global analysis. Sci. Total Environ. 2018, 645, 753–760. [Google Scholar] [CrossRef] [PubMed]
  74. Chen, Y.; Chen, L.; Cheng, Y.; Ju, W.; Chen, H.Y.H.; Ruan, H. Afforestation promotes the enhancement of forest LAI and NPP in China. For. Ecol. Manag. 2020, 462, 117990. [Google Scholar] [CrossRef]
  75. Hong, P.; Schmid, B.; De Laender, F.; Eisenhauer, N.; Zhang, X.; Chen, H.; Craven, D.; De Boeck, H.J.; Hautier, Y.; Petchey, O.L.; et al. Biodiversity promotes ecosystem functioning despite environmental change. Ecol. Lett. 2022, 25, 555–569. [Google Scholar] [CrossRef]
  76. Ou, Z.; Pang, S.; He, Q.; Peng, Y.; Huang, X.; Shen, W. Effects of vegetation restoration and environmental factors on understory vascular plants in a typical karst ecosystem in southern China. Sci. Rep. 2020, 10, 12011. [Google Scholar] [CrossRef]
  77. Ma, R.; Lü, Y.; Fu, B.; Lü, D.; Wu, X.; Sun, S.; Zhang, Y. A modified habitat quality model to incorporate the effects of ecological restoration. Environ. Res. Lett. 2022, 17, 104029. [Google Scholar] [CrossRef]
  78. Zhang, M.; Zhang, L.; He, H.; Ren, X.; Lv, Y.; Niu, Z.e.; Chang, Q.; Xu, Q.; Liu, W. Improvement of ecosystem quality in National Key Ecological Function Zones in China during 2000–2015. J. Environ. Manag. 2022, 324, 116406. [Google Scholar] [CrossRef]
  79. Xiao, S.; Fügener, T.; Wende, W.; Yan, W.; Chen, H.; Syrbe, R.; Xue, B. The dynamics of vegetation and implications for ecosystem services in the context of urbanisation: An example from Huangyan-Taizhou, China. Ecol. Eng. 2022, 179, 106614. [Google Scholar] [CrossRef]
  80. Shi, P.; Li, Z.; Li, P.; Zhang, Y.; Li, B. Trade-offs Among Ecosystem Services After Vegetation Restoration in China’s Loess Plateau. Nat. Resour. Res. 2021, 30, 2703–2713. [Google Scholar] [CrossRef]
  81. Sonter, L.J.; Ali, S.H.; Watson, J.E.M. Mining and biodiversity: Key issues and research needs in conservation science. Proc. R. Soc. B Biol. Sci. 2018, 285, 20181926. [Google Scholar] [CrossRef] [PubMed]
  82. Lèbre, É.; Corder, G.D.; Golev, A. Sustainable practices in the management of mining waste: A focus on the mineral resource. Miner. Eng. 2017, 107, 34–42. [Google Scholar] [CrossRef]
  83. Peng, X.; Dai, X.; Shi, R.; Zheng, Y.; Liu, X.; Xiao, Y.; Li, W.; Zhang, Y.; Wang, J.; Huang, H. Investigating the Effects of Mining on Ecosystem Services in Panzhihua City: A Multi-Scenario Analysis. Land 2024, 13, 819. [Google Scholar] [CrossRef]
  84. Huang, C.; Yang, Q.; Guo, Y.; Zhang, Y.; Guo, L. The pattern, change and driven factors of vegetation cover in the Qin Mountains region. Sci. Rep. 2020, 10, 20591. [Google Scholar] [CrossRef]
  85. Pennekamp, F.; Pontarp, M.; Tabi, A.; Altermatt, F.; Alther, R.; Choffat, Y.; Fronhofer, E.A.; Ganesanandamoorthy, P.; Garnier, A.; Griffiths, J.I.; et al. Biodiversity increases and decreases ecosystem stability. Nature 2018, 563, 109–112. [Google Scholar] [CrossRef]
Figure 1. Overview of the research area: (a) geographical location; (b) elevation and mining areas distribution; (c) land use types.
Remotesensing 17 01674 g001
Figure 2. Flowchart of the methodology.
Remotesensing 17 01674 g002
Figure 3. Vegetation growth in Shendong mining area from 1994 to 2022: (a) annual change trends in kNDVI; (b) inter-annual variation of the kNDVI from 1994 to 2022.
Remotesensing 17 01674 g003
Figure 4. Variations in interannual vegetation growth in different coal mines in Shendong mining area.
Remotesensing 17 01674 g004
Figure 5. Spatial distribution of vegetation growth in Shendong mining area: (a) overall trend of vegetation growth; (b) vegetation growth trend under different land use types.
Remotesensing 17 01674 g005
Figure 6. Ecosystem services in the Shendong mining area: their spatial distribution and variations from 1994 to 2022.
Remotesensing 17 01674 g006
Figure 7. Spatial distribution and change characteristics of total ecosystem services in the Shendong mining area from 1994 to 2022.
Remotesensing 17 01674 g007
Figure 8. Constraint relationship between kNDVI and ecosystem services in the Shendong mining area in 1994 and 2022 ((blue dot) scatter point, (red dot) boundary point, (red curve) constraint line, and (red shadow) 95% upper confidence limit).
Remotesensing 17 01674 g008
Figure 9. Constraint relationship between kNDVI and total ecosystem services in the Shendong mining area in 1994 and 2022 ((blue dot) scatter point, (red dot) boundary point, (red curve) constraint line, and (red shadow) 95% upper confidence limit).
Remotesensing 17 01674 g009
Table 1. Data sources utilized in this investigation.
DatasetTypeSpatial
Resolution/m
Time Resolution/YearData Source
Climatic dataTemperatureRaster10001994–2022 (monthly)National Tibetan Plateau Data Center
https//data.tpdc.ac.cn/ (accessed on 5 March 2025)
PrecipitationRaster10001994–2022 (monthly)National Tibetan Plateau Data Center
https//data.tpdc.ac.cn/ (accessed on 6 March 2025)
Elevation dataDEMRaster302019–2021China geospatial data cloud
https://www.gscloud.cn/ (accessed on 12 February 2025)
Soil dataSoil
properties
Shp/
Raster
10001994, 2022Soil Science Database
http://vdb3.soil.csdb.cn/ (accessed on 21 February 2025)
Land use dataLand use/coverRaster301994, 2022Human-computer interaction interpretation
Table 2. Classification of vegetation trends.
Sen’s ValueZ ValueTrend Type
≥0.0005≥1.96Significant increase
≥0.0005−1.96–1.96Slight increase
−0.0005–0.0005−1.96–1.96Stable area
≤−0.0005−1.96–1.96Slight decrease
≤−0.0005≤−1.96Significant decrease
Disclaimer/Publisher’s Note: The statements, opinions and data contained in all publications are solely those of the individual author(s) and contributor(s) and not of MDPI and/or the editor(s). MDPI and/or the editor(s) disclaim responsibility for any injury to people or property resulting from any ideas, methods, instructions or products referred to in the content.

