Abstract
In order to address the problem of Unmanned Aerial Vehicles (UAVs) being difficult to locate in environments without Global Navigation Satellite System (GNSS) signals or with weak signals, this paper proposes a localization method for UAV aerial images based on semantic topological feature matching. Unlike traditional scene matching methods that rely on image-to-image matching technology, this approach uses semantic segmentation and the extraction of image topology feature vectors to represent images as patterns containing semantic visual references and the relative topological positions between these visual references. The feature vector satisfies scale and rotation invariance requirements, employs a similarity measurement based on Euclidean distance for matching and positioning between the target image and the benchmark map database, and validates the proposed method through simulation experiments. This method reduces the impact of changes in scale and direction on the image matching accuracy, improves the accuracy and robustness of matching, and significantly reduces the storage requirements for the benchmark map database.
1. Introduction
With advances in the economy and society and the development of science and technology, the demand for UAVs has grown by leaps and bounds. Traditional unmanned aerial vehicles rely primarily on global navigation satellite systems (GNSSs) to determine their position and velocity during flight. However, due to electromagnetic interference, signal blockage and various terrains, GNSS signals may become distorted or lost. To address the challenge of operating in environments without reliable GNSS signals, it is necessary to study a system capable of effectively controlling the error accumulation in inertial navigation systems (INSs) and providing absolute positioning as an alternative or supplementary system. Visual navigation has garnered significant attention due to its robustness to interference, low power consumption, small size, simple equipment structure, and high positioning accuracy. It has become a hot topic in the field of navigation research [1,2].
Drone visual positioning methods primarily include visual odometry [3,4] and image-based localization [5,6,7]. Visual odometry determines the platform’s motion trajectory by analyzing a sequence of images captured by visual sensors, using relative pose estimation to calculate the positioning. However, due to matching errors and positioning algorithms, visual odometry accumulates drift errors, which increasingly deviate with distance. To mitigate this issue, a closed-loop detection module can be designed to correct these errors; otherwise, cumulative errors may become too large to effectively utilize visual odometry.
Image-based localization involves matching images captured by on-board equipment with a geographic database to determine the position with the most similar baseline position [8,9,10,11]. Its basis lies in extracting and matching image features. Based on optical flow tracking technology, Shan [12] et al. employed histogram of oriented gradients (HOG) features to align aerial images with Google Maps using histogram matching techniques, and then applied particle filter technology to determine the drone’s current location; Hou [13] et al. utilized convolutional neural networks (CNNs) to extract deep features and matched aerial images with satellite imagery fused with geographic data and digital elevation models (DEMs) to achieve positioning; given the significant variation in visual features in outdoor scenes, some studies have proposed pre-capturing image baselines along the flight path in a realistic three-dimensional reconstruction model (e.g., Google Earth), creating a reference database for visual navigation purposes [14]. While this expanded the application scope of image-based localization methods, it posed challenges to these traditional feature extraction methods due to variations in scale, direction and lighting conditions. Additionally, the large storage requirements of baseline image databases also hindered the practicality of image-based localization techniques. Recently, deep learning-based feature extraction methods have advanced rapidly; for example, Kernels proposed using DCNN networks to encode images into high-dimensional feature vectors, transforming the retrieval process into a vector inner product operation, thus reducing memory consumption while improving the search efficiency [15]. Zhongzhen Sun [16,17] et al. proposed a multi-scale dynamic feature fusion network to extract more robust SAR image features. Although deep learning-based feature extraction methods enhance the robustness of image features to some extent, they lack generalizability and explainability compared to traditional approaches.
To address these issues, this paper proposes a localization method for UAV aerial images based on semantic topological feature matching. By extracting semantic–topological features from aerial images and geographic baseline databases (Semantic–Topological Features: visual reference objects’ semantics and their topological relationships), an appropriate algorithm is selected to construct a mode feature vector that represents the semantic information of an entire image. This approach converts aerial images into robust feature information that is resistant to changes in scale, direction and lighting conditions, thereby significantly reducing the impact of these variations on matching accuracy. Additionally, by storing baseline image databases as semantic information-based mode feature vectors rather than traditional pixel-level storage methods, the amount of storage required is notably reduced.
The main contributions of our work are as follows:
- A semantic topological feature-matching-based localization framework is proposed and applied to the navigation and localization of UAVs.
- The needs of scale invariance, rotation invariance, and semantic recognition are fully considered, and the image-based localization problem is transformed into a topological relational feature matching problem, providing stable matching results while accurately understanding the complex environment.
This paper is organized as follows: Section 2 introduces the localization method based on semantic topological feature matching, which mainly includes the basic framework and method design; Section 3 carries out the experimental design and simulation experiments; Section 4 discusses the performance of the method, which mainly includes an analysis of the scale invariance, analysis of the rotation invariance, and analysis of the storage capacity. Section 5 is the conclusion.
2. The Localization Method Based on Semantic Topological Feature Matching
2.1. Basic Framework
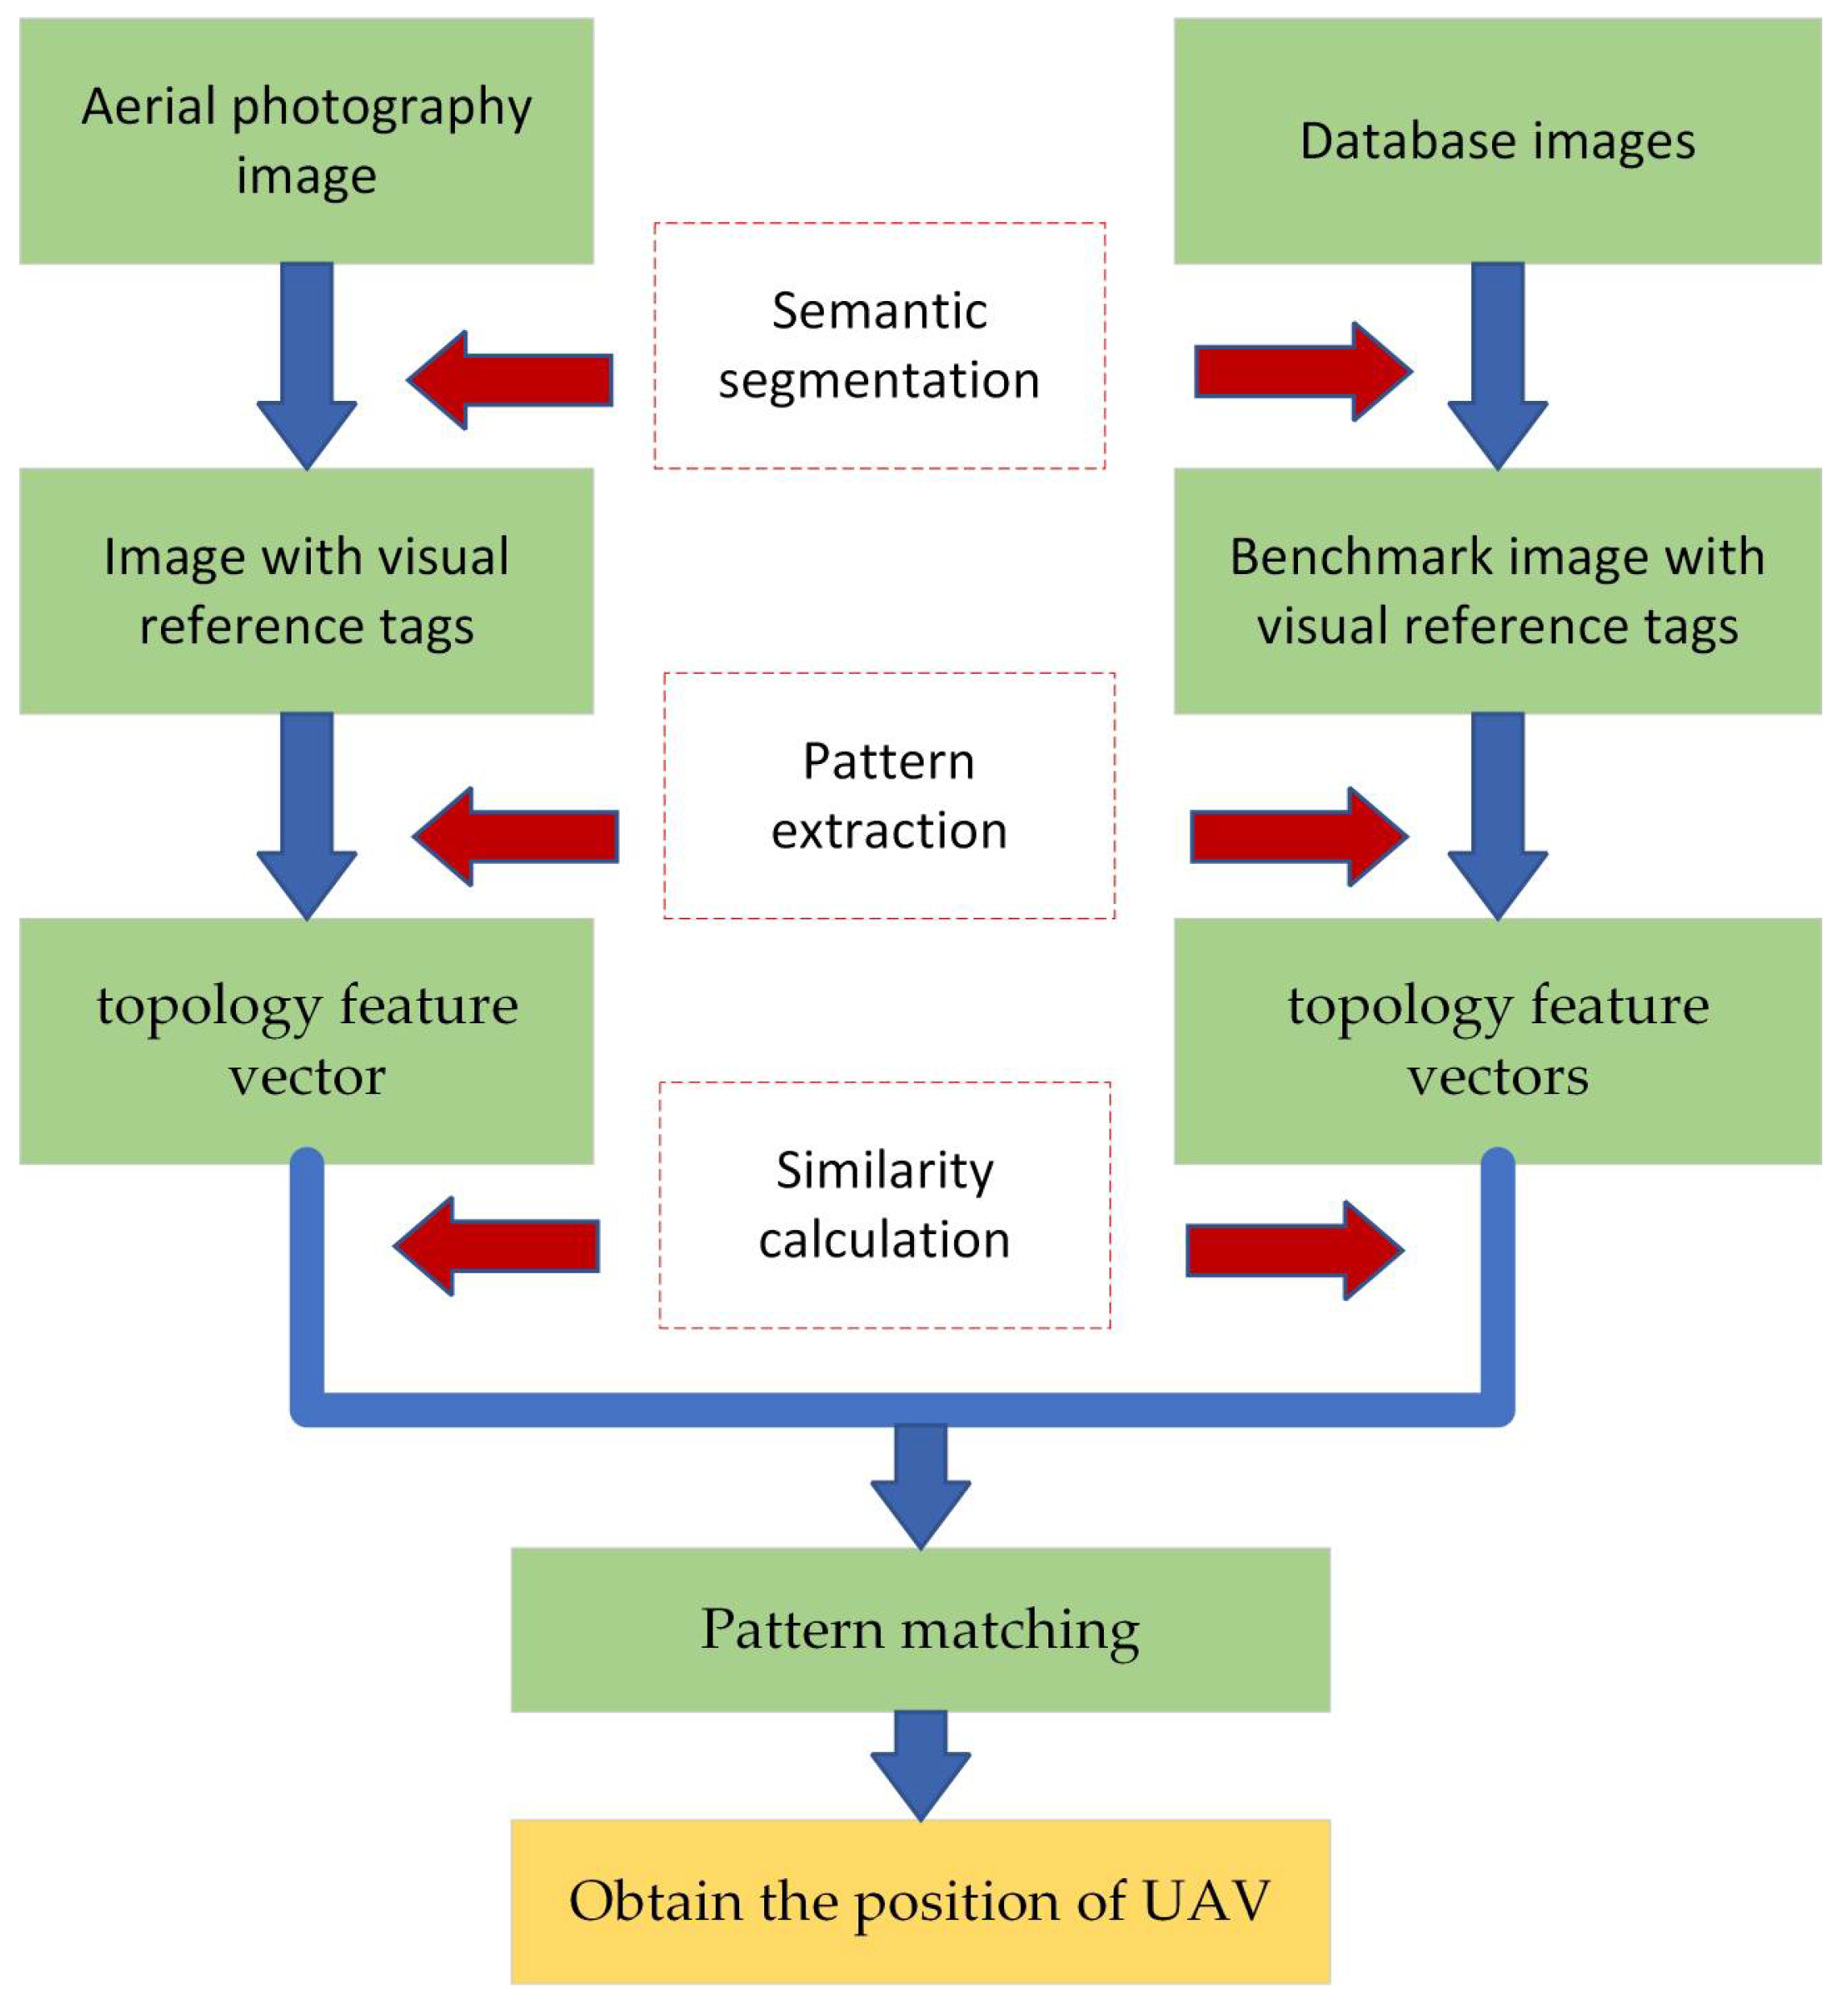
The basic framework of the proposed method is shown in Figure 1. There are two different sources of images used at the input of the algorithm, that is, the aerial image and the reference database image, and the basis of the aerial image matching and localization method is realizing the alignment between the aerial image and the database image. Each frame of the aerial image is denoted, and in this study, it is assumed to be a completely overhead image and completely within the range of the database image. By incorporating semantic segmentation and topology feature vector design and extraction, the image is represented as a set of mode feature vectors that encapsulate the semantics of visual reference objects in the image along with their topological positional relationships. The similarity between the aerial image and the database image is measured using Euclidean distance-based similarity degree calculation methods, enabling pattern matching to determine the optimal match. For the database image, the latitude and longitude coordinates of each pixel are known quantities. After successful image matching, the location of the center pixel of the aerial image in the database image can be determined as the latitude and longitude coordinates of the UAV in the world coordinate system.
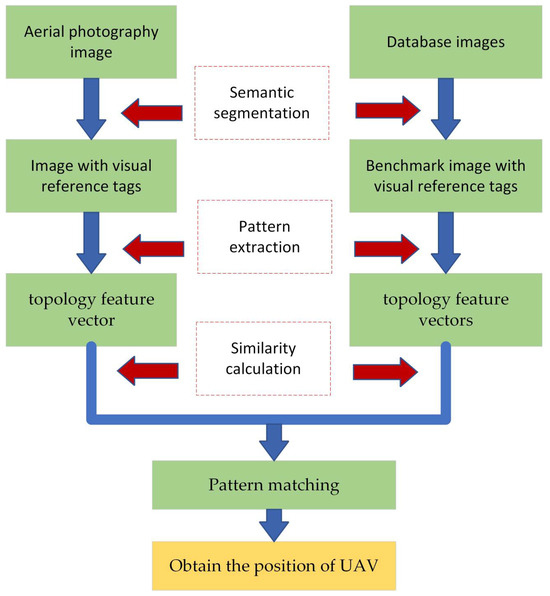
Figure 1.
Basic framework of semantic topological feature matching.
The pattern-matching process is as follows:
- (1)
- Preprocess the aerial image using semantic segmentation technology to generate a base map containing visual reference object labels and position coordinates.
- (2)
- Considering the rotation and scale change of the aerial image, extract the configuration information of the visual references through the center of gravity algorithm, and design the extraction pattern feature vector by using the relative position relationship between the visual references as the pattern features.
- (3)
- Find the image most similar to the current image in the map database by the pattern-matching algorithm, so as to realize the matching from image to map.
- (4)
- According to the matching results, information such as the position of the UAV on the map can be obtained to realize the visual navigation of the airway.
2.2. Design of the Method
2.2.1. Design of Feature Vectors for High-Level Semantic Topological Relations
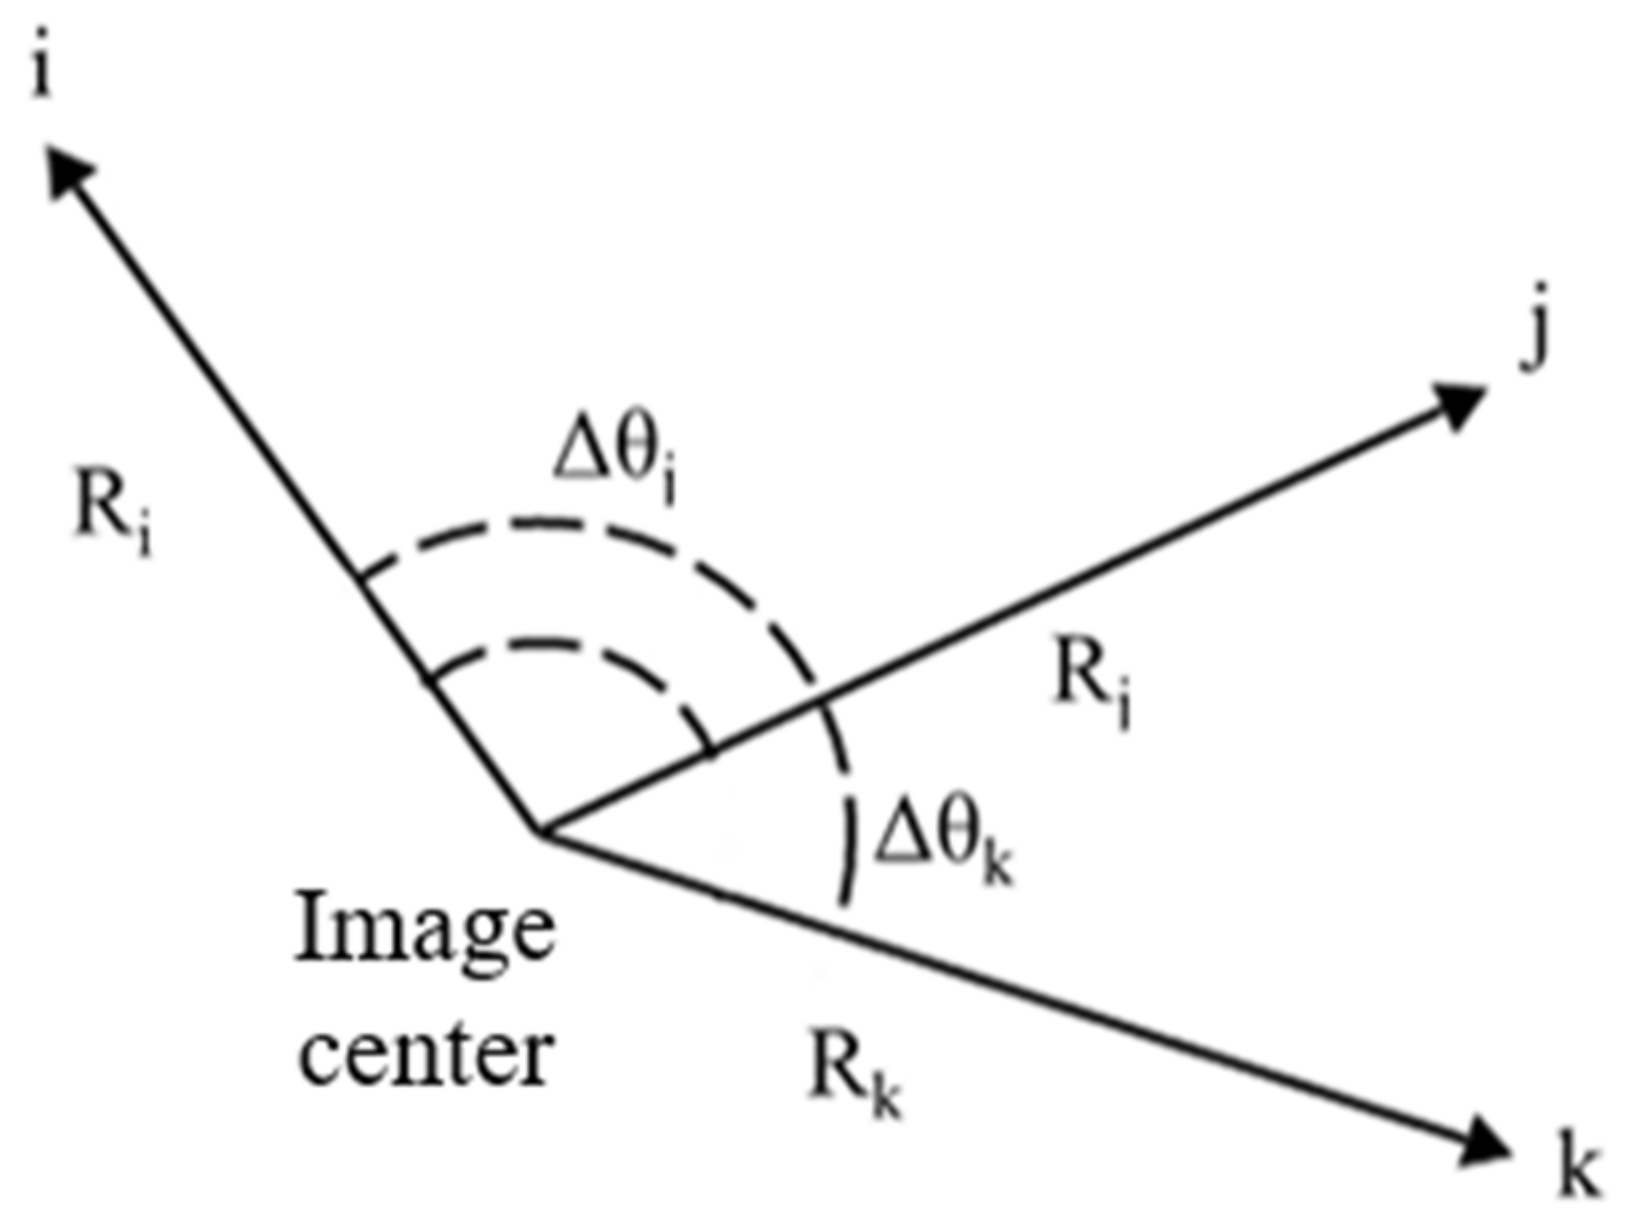
The relative relationship between visual references can be abstracted into the geometric relationship shown in Figure 2, in which , and represent different visual references, and in which , , , and represent some distributional geometric features of each visual reference. The geometric distributional features of the visual references within a certain range around the center of the image will be extracted to represent the semantic information of the picture as a pattern feature vector, and in the process of matching, the pattern database will be searched for patterns that are similar to those of the observed patterns.

Figure 2.
Schematic diagram of the geometric relationship between visual references.
In order to satisfy the requirements of scale invariance, rotation invariance and semantic recognition, the distance ratio, angle difference, and semantic labels between the visual references in the image are selected to construct the pattern feature vector, and the vector structure is shown in Equation (1).
where represents the set of the distance ratio, represents the set of normalized angular differences, and represents the set of semantic labeling information.
- (1)
- Distance ratio
In order to cope with the demand for scale invariance in the matching algorithm, a new feature extraction method is investigated in this paper, that is, the configuration information of visual references is characterized by calculating the relative distance ratio between each visual reference in the image and the center point of the image.
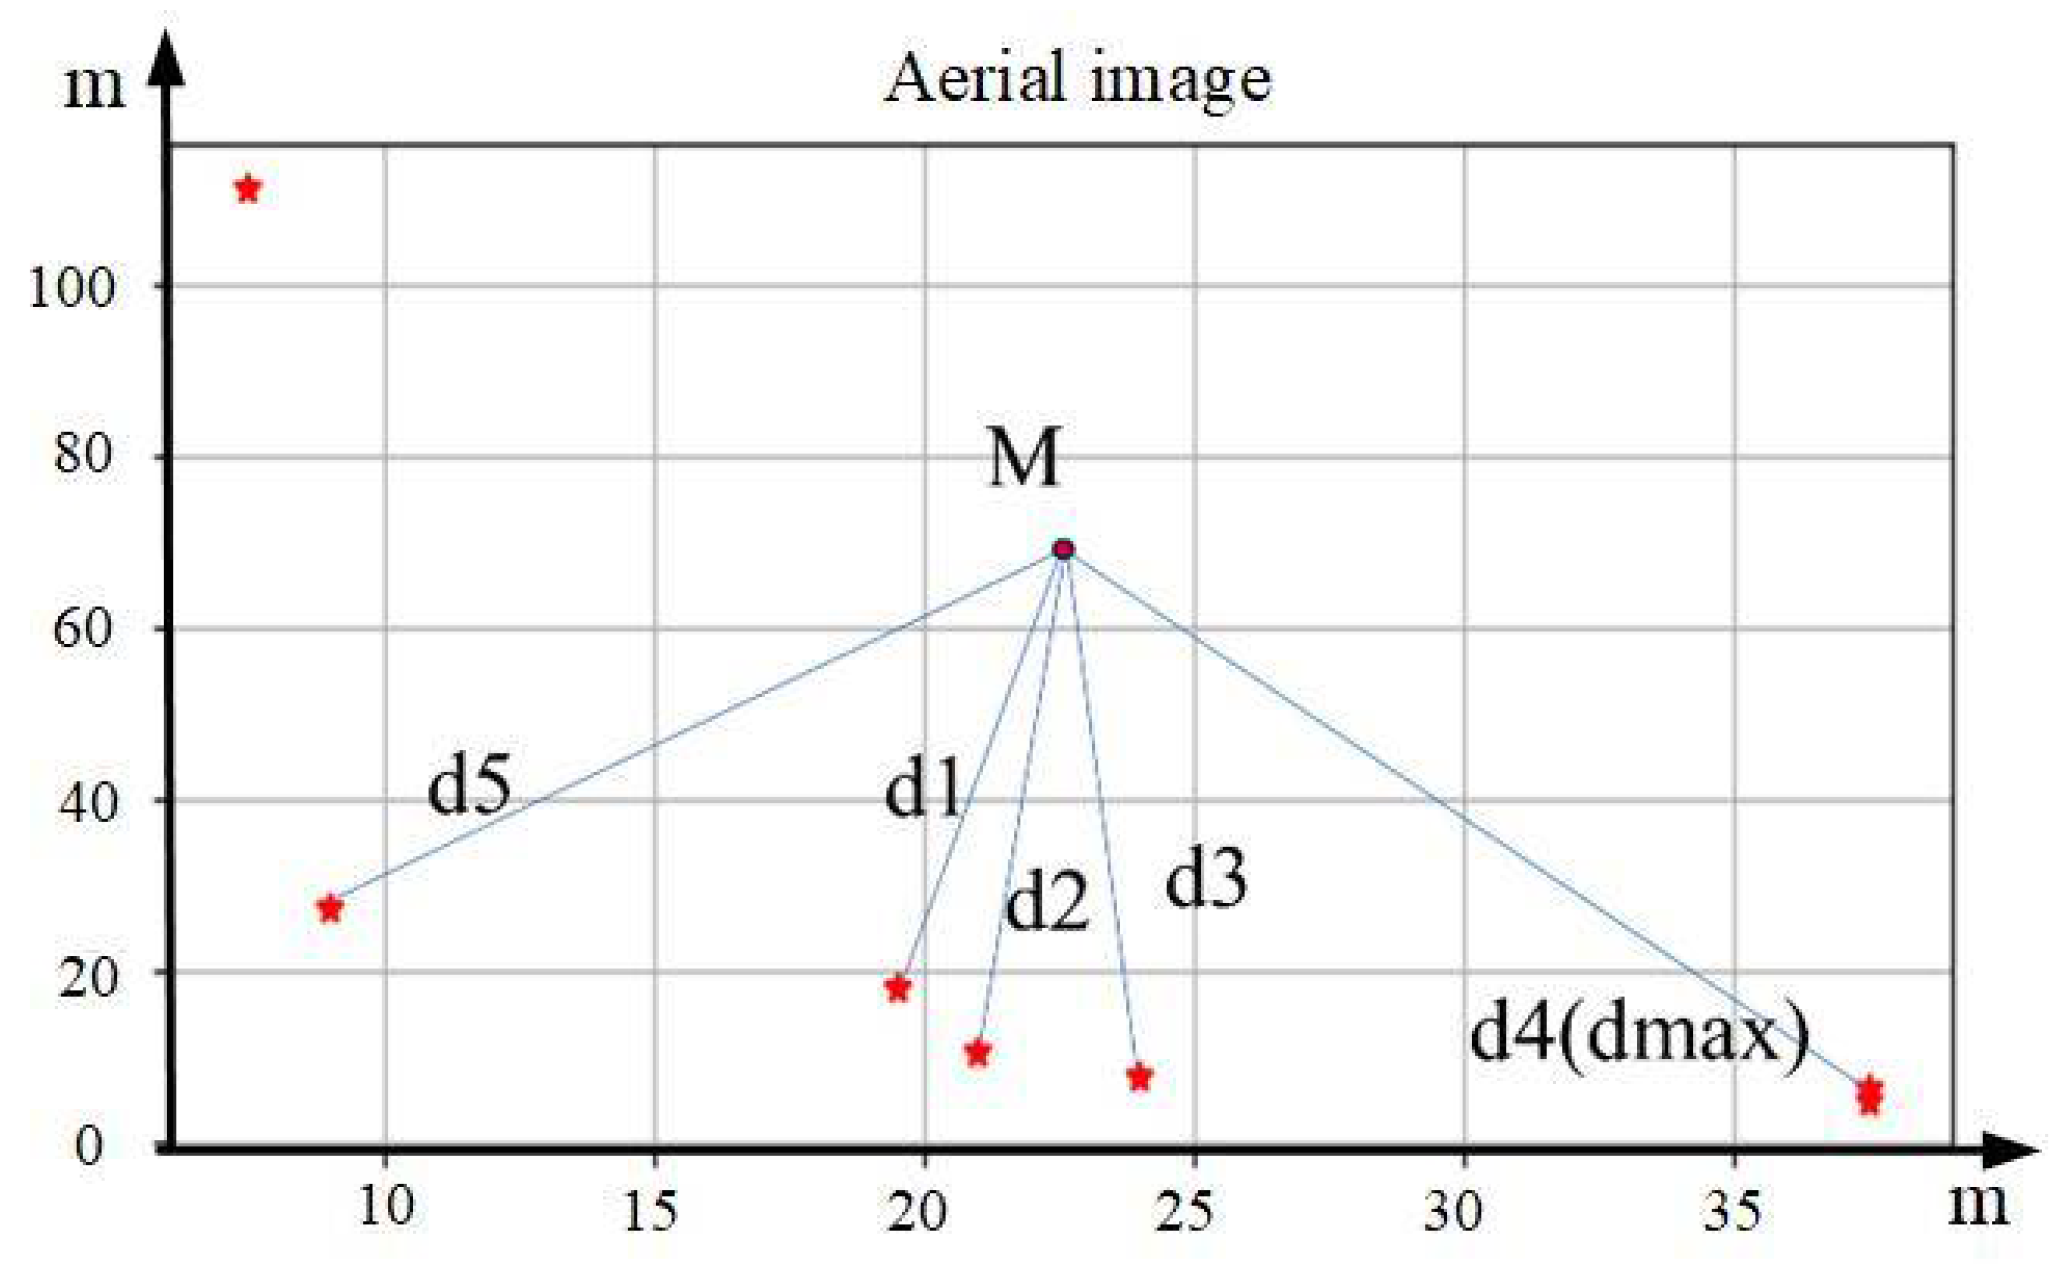
As shown in Figure 3, the red five-pointed stars represent the positions of various visual reference objects. Firstly, the center M of the picture is selected as the center of the entire aerial image, and the distances between the centers of gravity of various visual reference objects and M are determined. Then, the X visual reference objects closest in distance are selected as the matching objects. The purpose of the above approach is to reduce the matching error caused by the change in the number of visual reference objects in the image due to scale changes.
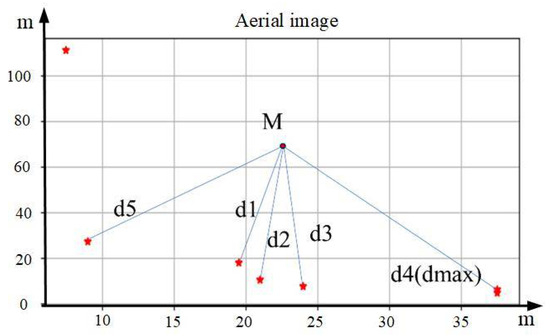
Figure 3.
Schematic diagram of distance ratio among visual references. Asterisks indicate centers of visual reference objects.
Select several visual reference objects as matching objects. Compare the distances between each of these visual reference objects and M with the farthest distance from M among all the visual reference objects, respectively, to obtain , , and ; then, obtain set d of the distance ratio between each visual reference object and the center , that is,
To improve the matching accuracy, this paper defines a clear rule to sort the elements within the set, ensuring that for the same image, the same distance ratio can be obtained even if the information processing order of visual reference objects is different.
The sorting process of visual reference objects is as follows.
① For the X selected visual references, their respective pixel coordinates are calculated. Subsequently, the angle between the line between these coordinates and the center point of the image and the positive direction of the X-axis of the image is calculated. For negative angle values appearing in the calculation results, they are converted to positive values in the range of 0° to 360° by adding 360°.
② According to the calculated angle values, the index values of the elements in the distance ratio set are sorted in increasing order.
③ The index value corresponding to the visual reference farthest from the center is identified.
④ The original distance ratio set is reordered according to the sorted set of index values to obtain a new distance ratio set .
Through the above four steps, the sorting of the matched visual references is successfully realized, and a new set for the distance ratio is obtained, which is sorted in clockwise order with the farthest visual reference as the starting point. Since the distance ratio is used as the matching element, the distance ratios between the corresponding visual references are the same for pictures of different scales, so the scale invariance can be solved effectively.
- (2)
- Angle difference
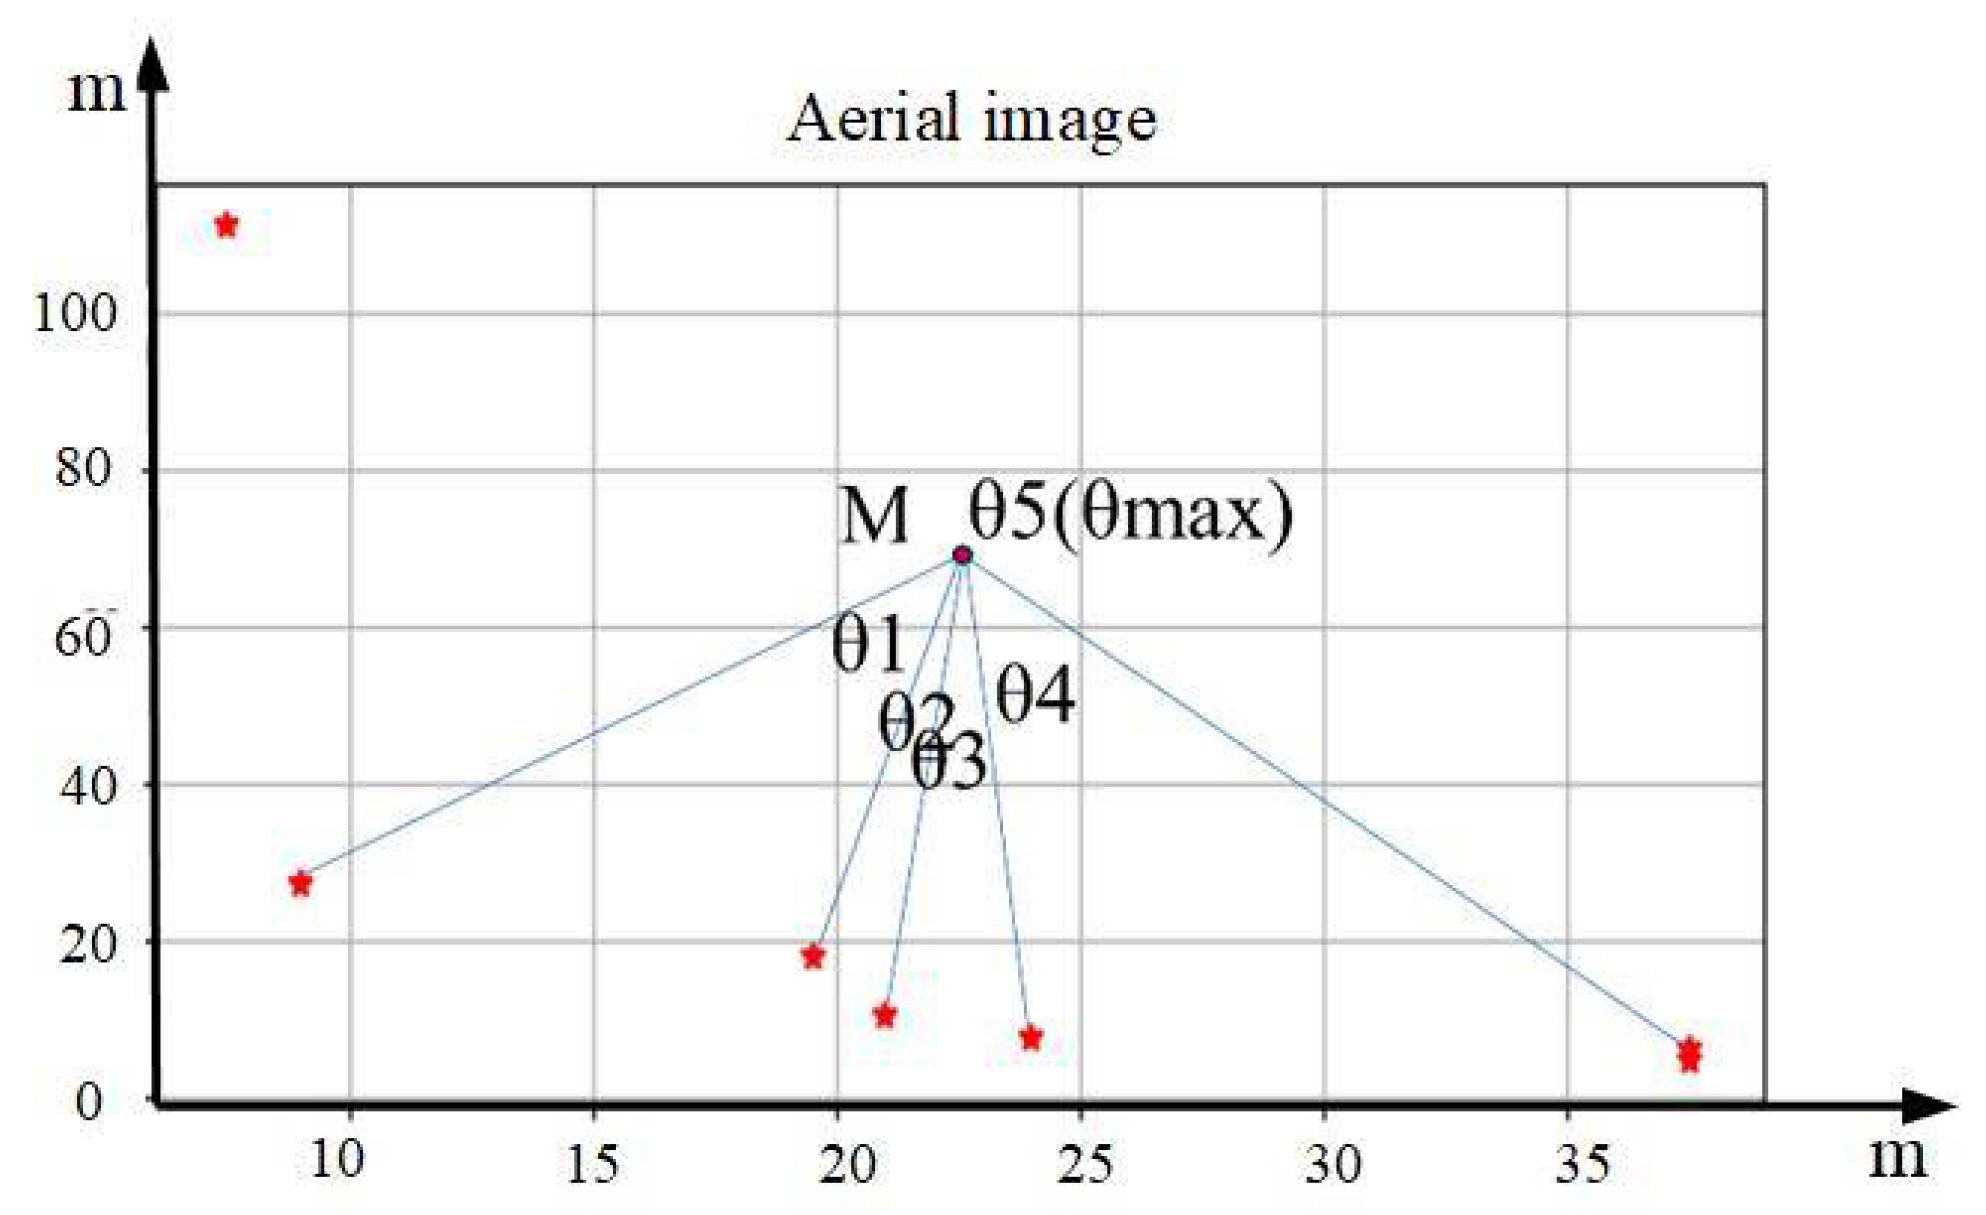
To cope with the need for rotational invariance in the matching algorithm, a new feature extraction method is investigated in this paper, that is, the configuration information of the visual references is characterized by calculating the angular difference between the lines connecting each visual reference in the image and the image center point M. As shown in Figure 4, M is first selected, and the angle between the connecting line between these coordinates and M and the positive direction of the X-axis of the image is calculated. The original set of angles is reordered by the set of index values obtained in the previous section, and a new set of angles in clockwise order with the farthest visual reference as the starting point is obtained. The angle difference between neighboring lines is then calculated. The calculation formula is shown in Equation (3).
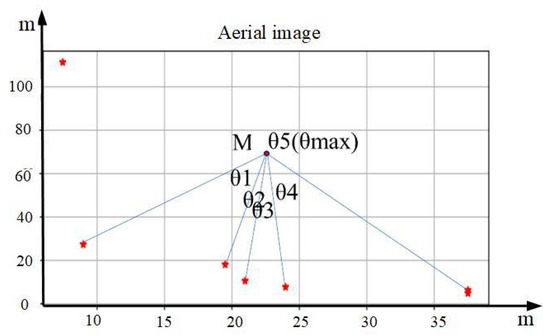
Figure 4.
Schematic diagram of angle differences among visual references. Asterisks indicate centers of visual reference objects.
The angular difference is normalized by Equation (4), that is,
Finally, the set of normalized angular differences is obtained. Since the angular differences are used as matching elements, for pictures at different angles, the angular differences of the connecting lines between the corresponding visual reference objects and the center of the picture are the same. Therefore, the requirement for rotation invariance can be well met.
- (3)
- Semantic label
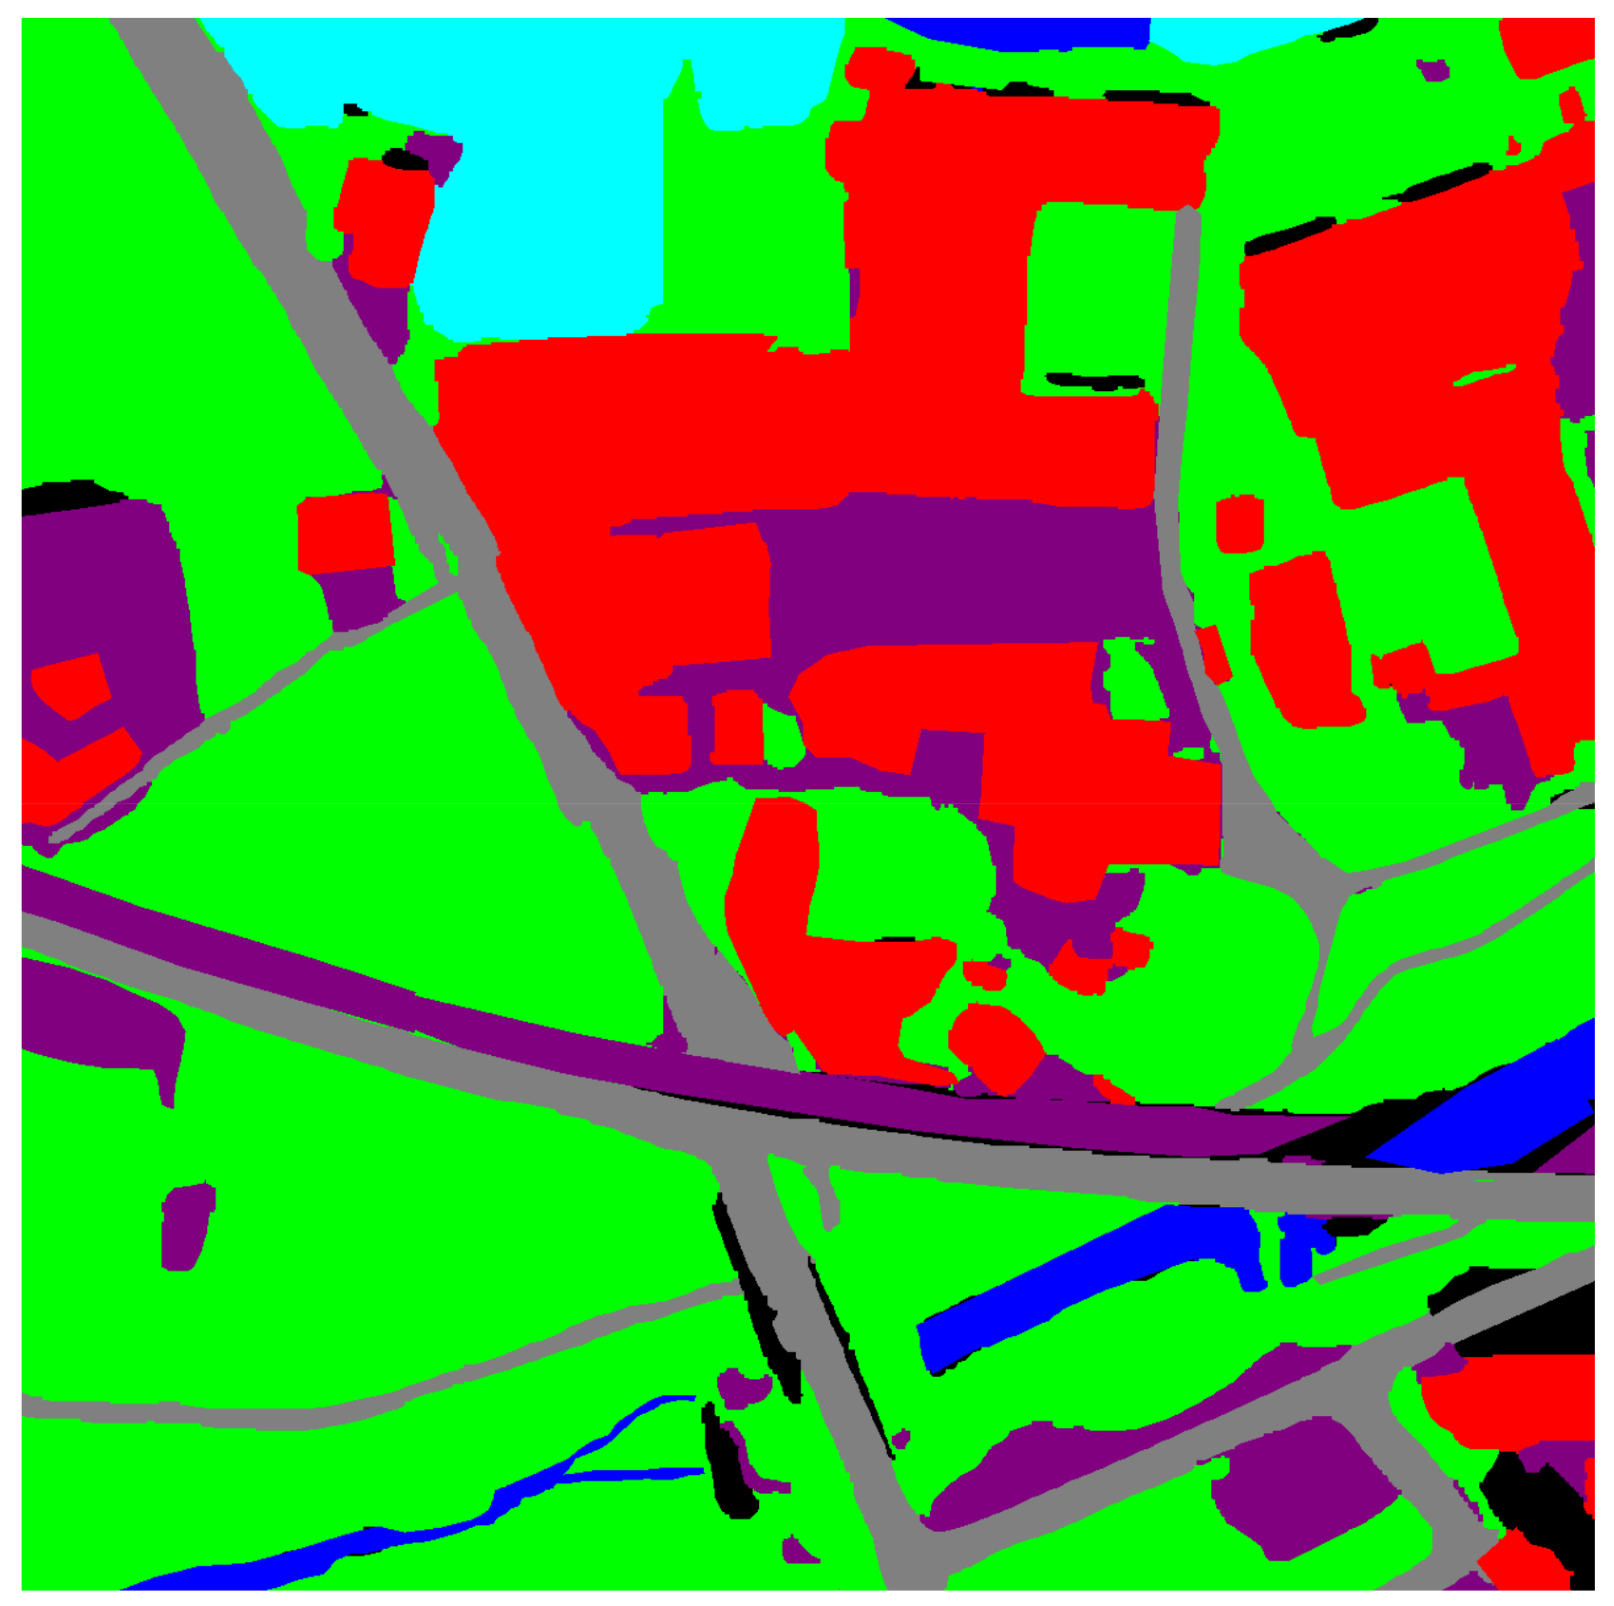
In order to improve the matching success rate, the label information of visual reference objects is introduced into the pattern feature vector for the matching of visual reference objects. As shown in Figure 5, it is a schematic diagram of the classification of different types of visual reference objects. Different color patches are used in the image to represent different visual reference objects. Among them, the red color patch represents houses, the purple color patch represents bare land, the blue color patch represents river waters, the green color patch represents forest land, the deep blue color patch represents cultivated land, and the black color patch represents others.

Figure 5.
Schematic diagram of classification of different types of visual references.
The original set of labels is reordered using the set of index values obtained in the previous section, and a new set of labels in clockwise order, with the farthest visual reference as the starting point, is obtained. The final pattern feature vector is obtained by assigning it as shown in Equation (1).
2.2.2. Destruction Resistance Analysis
- (1)
- Semantic Segmentation Algorithm
The accuracy of semantic segmentation in this method forms the foundation of the approach. This study adopted the Pyramid Attention Network algorithm proposed in reference [18] to perform semantic segmentation on images. First, we used BIGMAP v4 software to obtain satellite imagery of the target area; we then performed manual classification using the AI Earth platform’s ground object human annotation interface. The results were stored in shapefile vector files. Subsequently, QGIS 3.34 software was used to read the AI Earth platform’s ground object classification results, and the vector files were corrected accordingly. Finally, the geometric elements and categories from the vector file were converted into pixel-level semantic maps with high precision at the study area’s scale, achieving a detailed semantic map of the target region.
This precise semantic map was divided into smaller images to serve as training datasets for the PAN semantic segmentation network. After training, the trained network was used to perform semantic segmentation on aerial images. Figure 6a shows the original image, while Figure 6b presents the label image after semantic segmentation. In Figure 6b, different colored blocks represent different types of visual references in the semantic-labeled image.
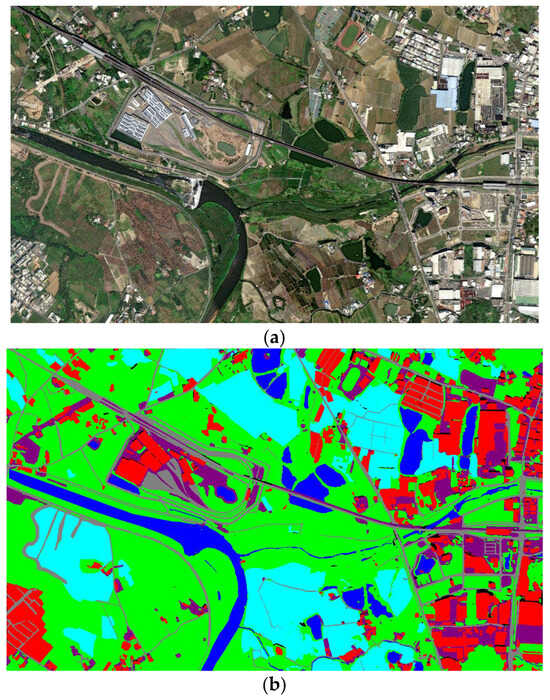
Figure 6.
Image after semantic segmentation:(a) satellite imagery of the target area; (b) label image after semantic segmentation.
- (2)
- Method of Center-of-Gravity Calculation
The block diagram of the center-of-gravity calculation method is shown in Figure 7. The input of the entire algorithm is the aerial image after semantic segmentation, and the output is the center-of-gravity positions of different visual reference objects that meet certain requirements, as well as their pixel coordinates on the aerial image.
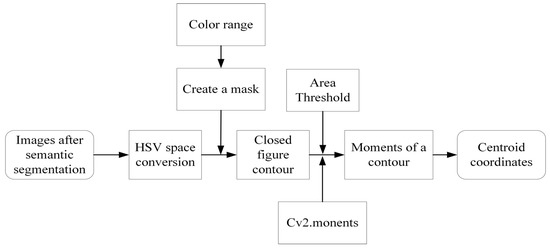
Figure 7.
Block diagram of the center of gravity calculation method.
The specific process is as follows: Take the image obtained after the semantic segmentation of the aerial image as the input, apply the center-of-gravity calculation method, and convert the image from the common BGR color space to the HSV color space. According to the previously designed different color labels for each visual reference object, set different HSV ranges to select appropriate types of visual reference objects for matching. Set a reasonable area threshold so that those contours with too small an area and not meeting the requirements can be filtered out. Create a mask for that color range, find the contours of the image in the HSV space according to the mask, and calculate the area of the contours. After obtaining the contours that meet the conditions, use the cv2.moments() function of OpenCV for each contour to calculate the moments of each contour. Finally, the algorithm utilizes this moment information to calculate the center-of-gravity of the contours that meet the requirements and obtain their pixel coordinates on the aerial image.
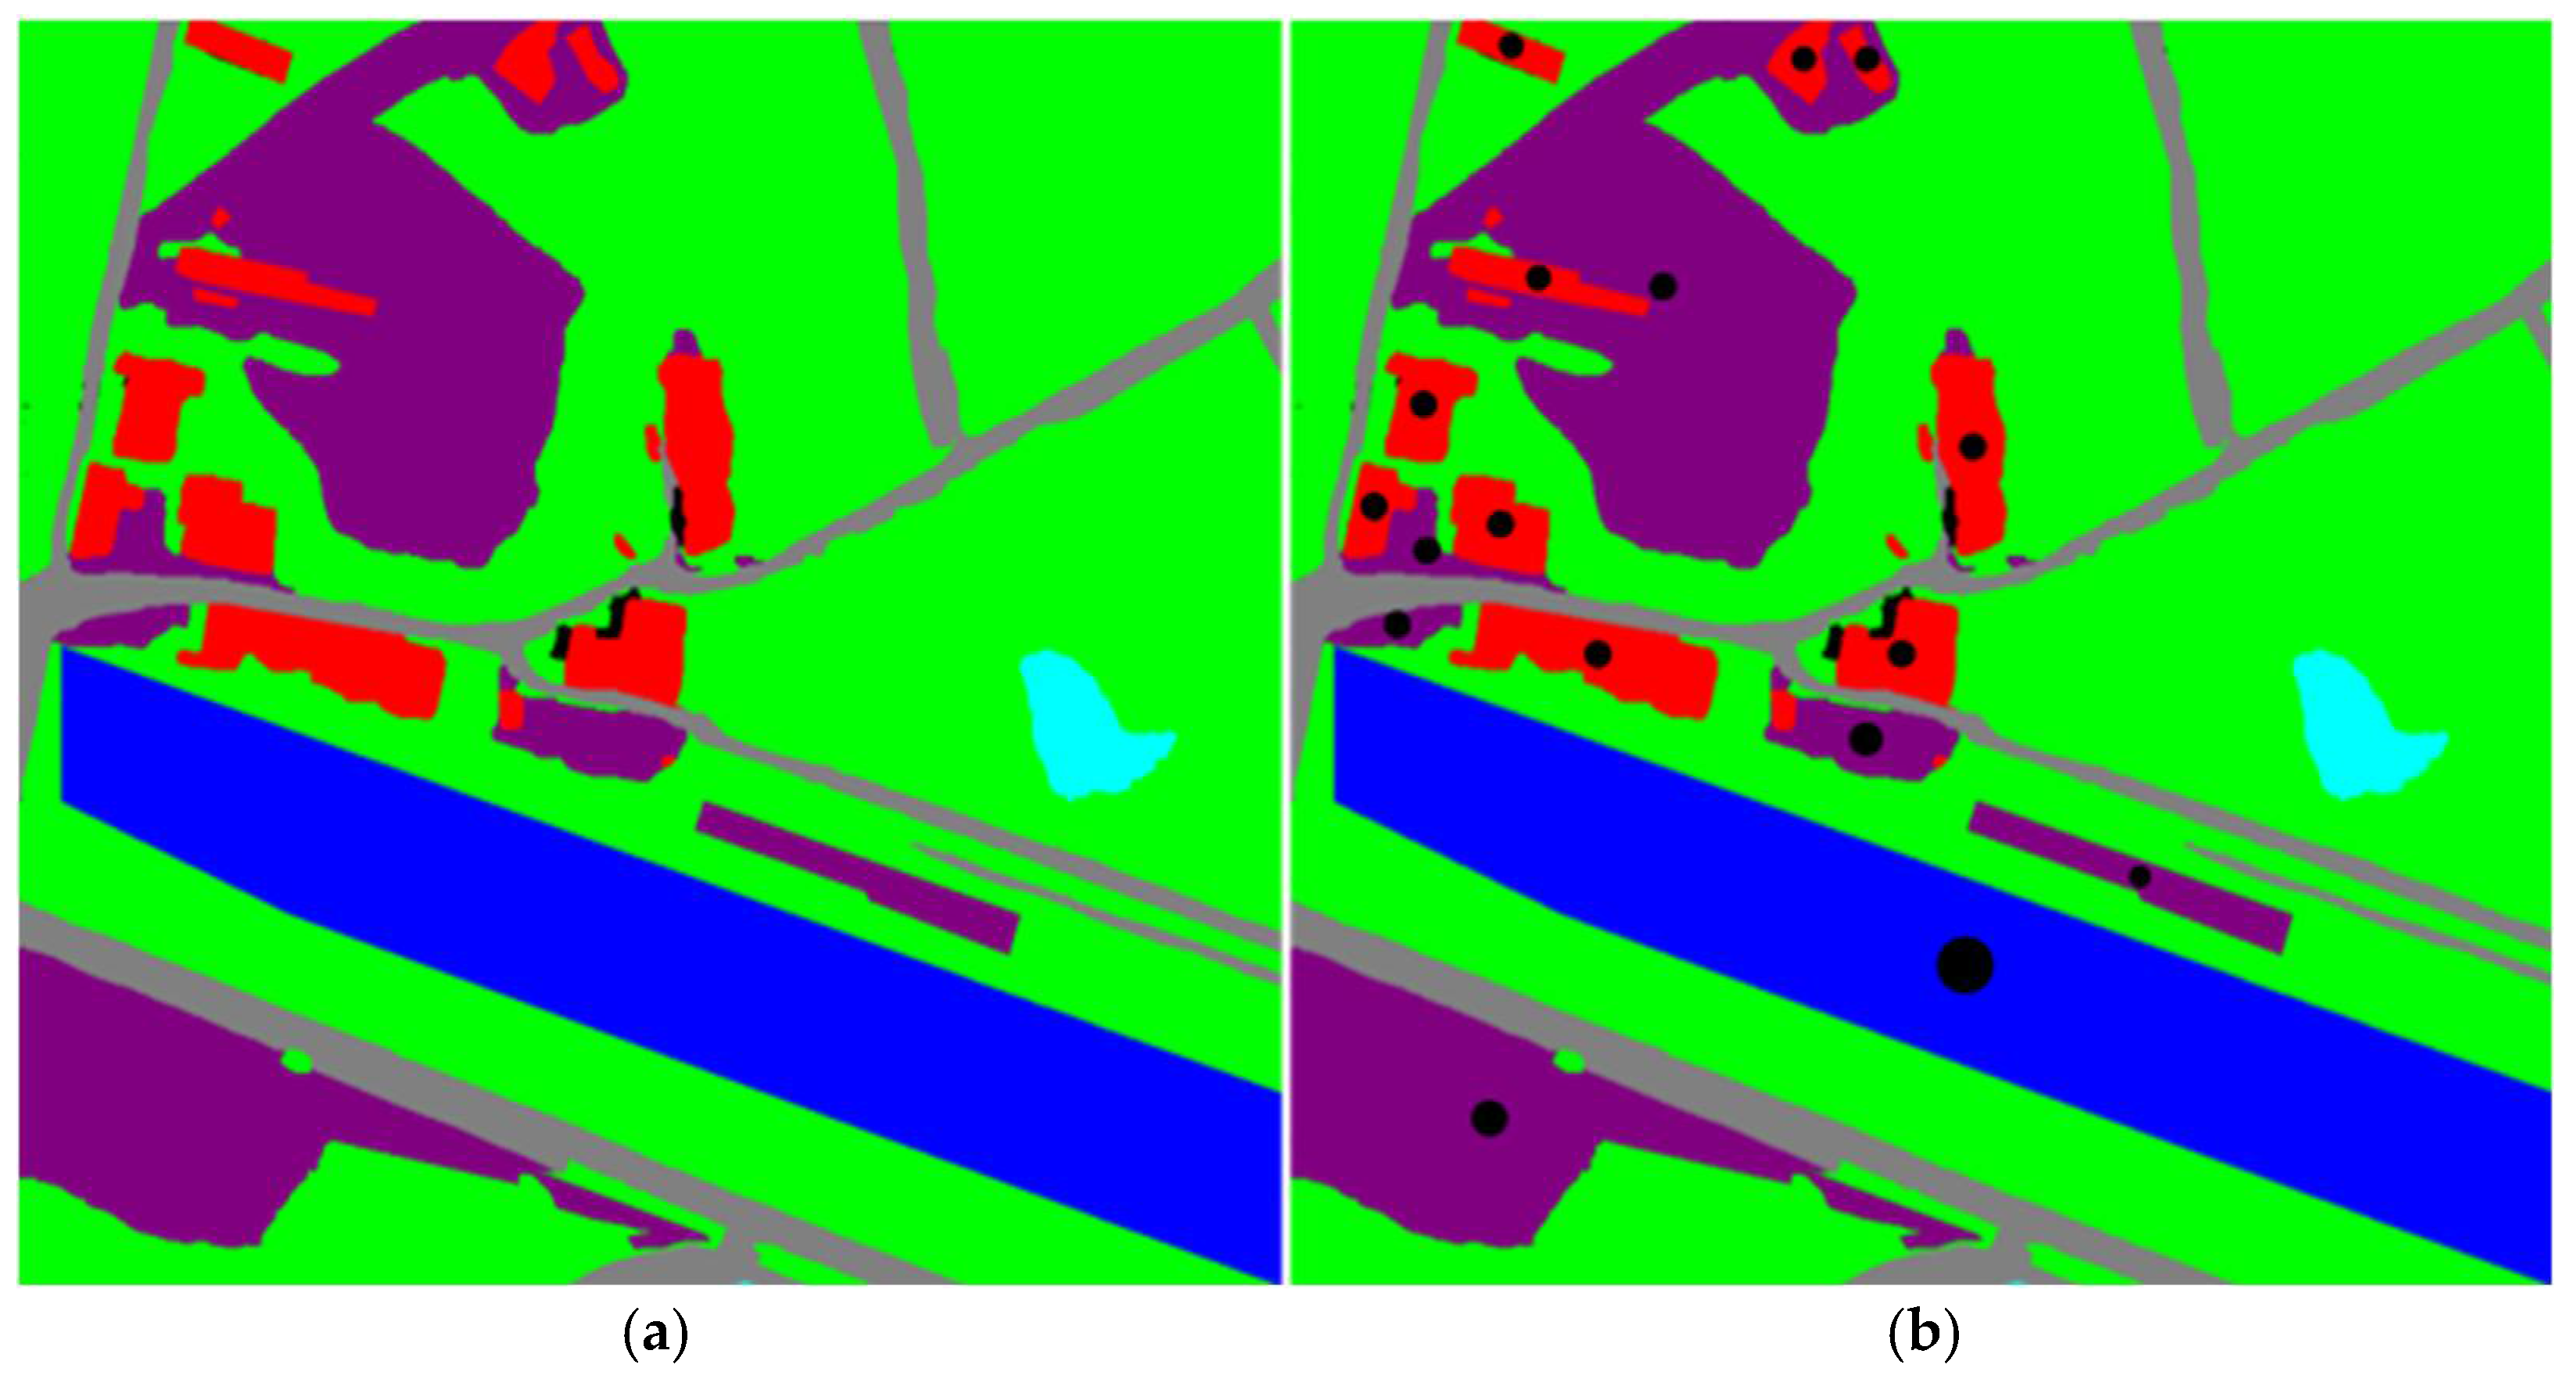
After being processed by the center-of-gravity calculation method, for each aerial image, the center-of-gravity coordinates of specific visual reference objects can be obtained, and these coordinates provide the position information of the visual reference objects in the image. Figure 8a shows the picture of 0_0.png after being processed by the semantic segmentation algorithm, and Figure 8b is the result of the center-of-gravity calculation for the three types of visual reference objects, namely “residential buildings”, “bare land” and “river waters”, after it is sent to the center-of-gravity calculation method. The black dots represent the centers of gravity of their different contours.
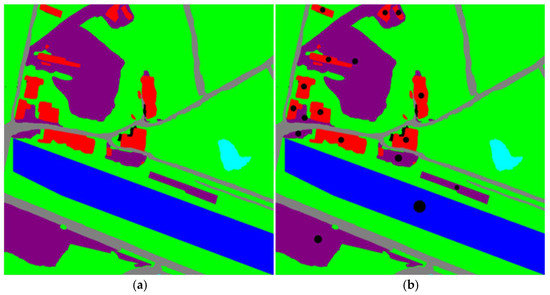
Figure 8.
Calculation of the center of gravity: (a) picture of 0_0.png after being processed by the semantic segmentation algorithm, and (b) result of the center-of-gravity calculation. In picture (b), the black dot in each area represents the gravity of the area.
2.2.3. Perform Matching and Positioning Based on the Feature Vectors
Once the processing of the above semantic segmentation algorithm and the center-of-gravity calculation method have been completed, the database image and the pattern feature vectors to be matched can be obtained. Based on the Euclidean distance, the pattern feature vectors of the image to be matched are compared with the database pattern feature vectors, and the database image with the smallest Euclidean distance is selected as the matching result.
For points A and B in dimensional space, where the coordinates of point A and point B are, the Euclidean distance is computed using Equation (5).
For points A and B in an -dimensional space, where the coordinates of point A are and the coordinates of point B are , the Euclidean distance is calculated through Equation (5).
Meanwhile, in order to quantitatively evaluate the results of image pattern matching, the confidence based on the Euclidean distance is introduced. This confidence aims to calculate a score based on the minimum Euclidean distance to assess the degree of similarity between the feature vector and the target feature vector. Specifically, after obtaining the minimum Euclidean distance, this distance is compared with the preset threshold. If the distance is less than or equal to the threshold, the confidence is calculated; otherwise, i the matching is considered to fail.
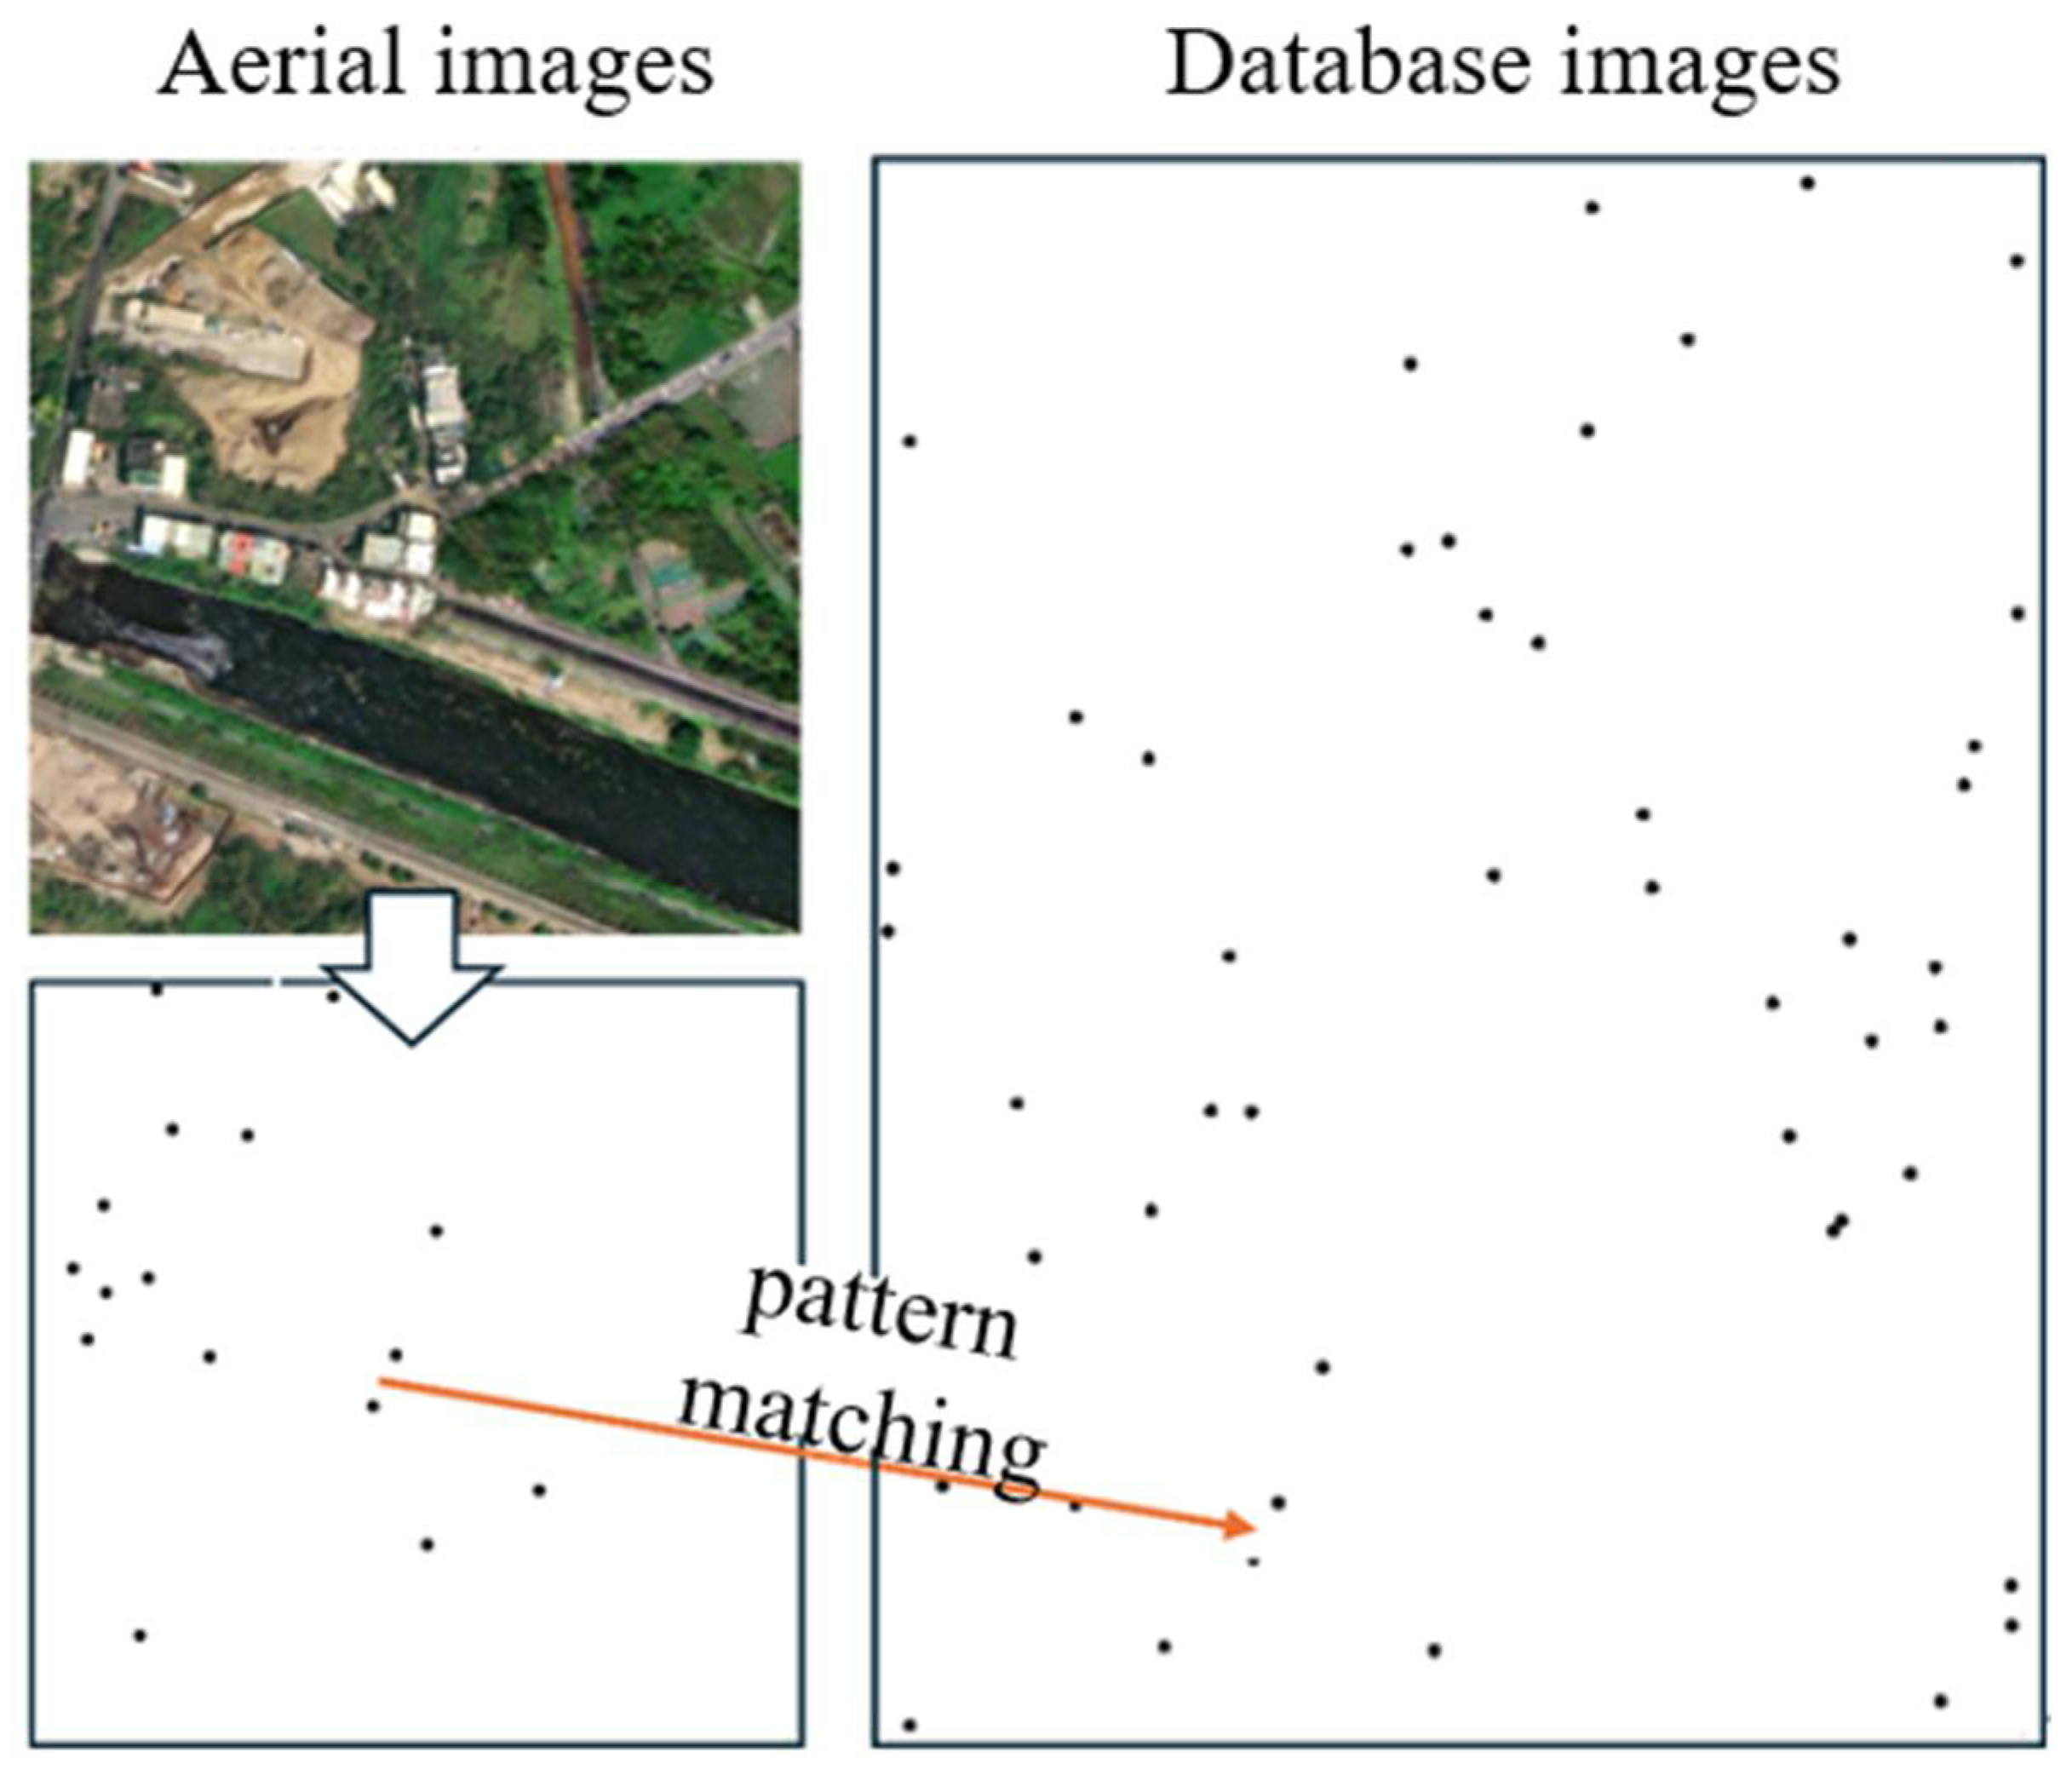
Figure 9 shows a schematic diagram of the pattern matching. During the matching process, the location of the UAV can be obtained by searching for the corresponding image in the database that is most similar to the observed pattern feature vector. The upper left side of the figure is the aerial image, the black dots in the lower left side represent the locations of different types of visual references, and the right side of the image represents the locations of the visual references in the map database, which are matched with the database image on the right side through the logical relationship between the locations of the visual references.

Figure 9.
Schematic diagram of pattern matching.
3. Experiments
This paper implemented semantic segmentation, center of gravity extraction, topological pattern vector extraction, and a matching localization algorithm using the Python programming language, the development environment is Ubuntu 20.04 and Python 3.6.
3.1. Data Preparation and Processing
Figure 6a shows a horizontal aerial view of a certain area taken from Google Maps, which is used as an aerial image database for simulation experiments. This image contains various types of visual reference objects such as mountains, rivers, buildings, roads, and farmlands.
Firstly, semantic segmentation is performed on the picture. The horizontal aerial view is input into the semantic segmentation model to obtain the classification results of each pixel, and different labels are assigned to different types of visual reference objects. Figure 6b is the reference image after semantic segmentation.
The benchmark images are obtained by sliding window cropping with a certain step size. The size of the step directly influences the precision of pattern matching; smaller steps lead to higher precision, but smaller steps also increase the storage requirements and matching time. Therefore, the choice of step size should balance the area sizes of the visual reference objects within the target region, image dimensions, and resource demands. This comprehensive consideration is essential for selecting an optimal step size. Using a window size of 1280 × 1280 and a stride of 350 for sliding window cropping, a group of 276 database images is obtained. Each image is named after the position coordinates of its initial pixel point in the original image, such as 0_0.png, 0_350.png, etc. Here, these position coordinates are used to replace the real coordinates of the pictures. After segmentation by the sliding window algorithm, the storage of the 276 data images requires 837 MB.
3.2. Matching Results
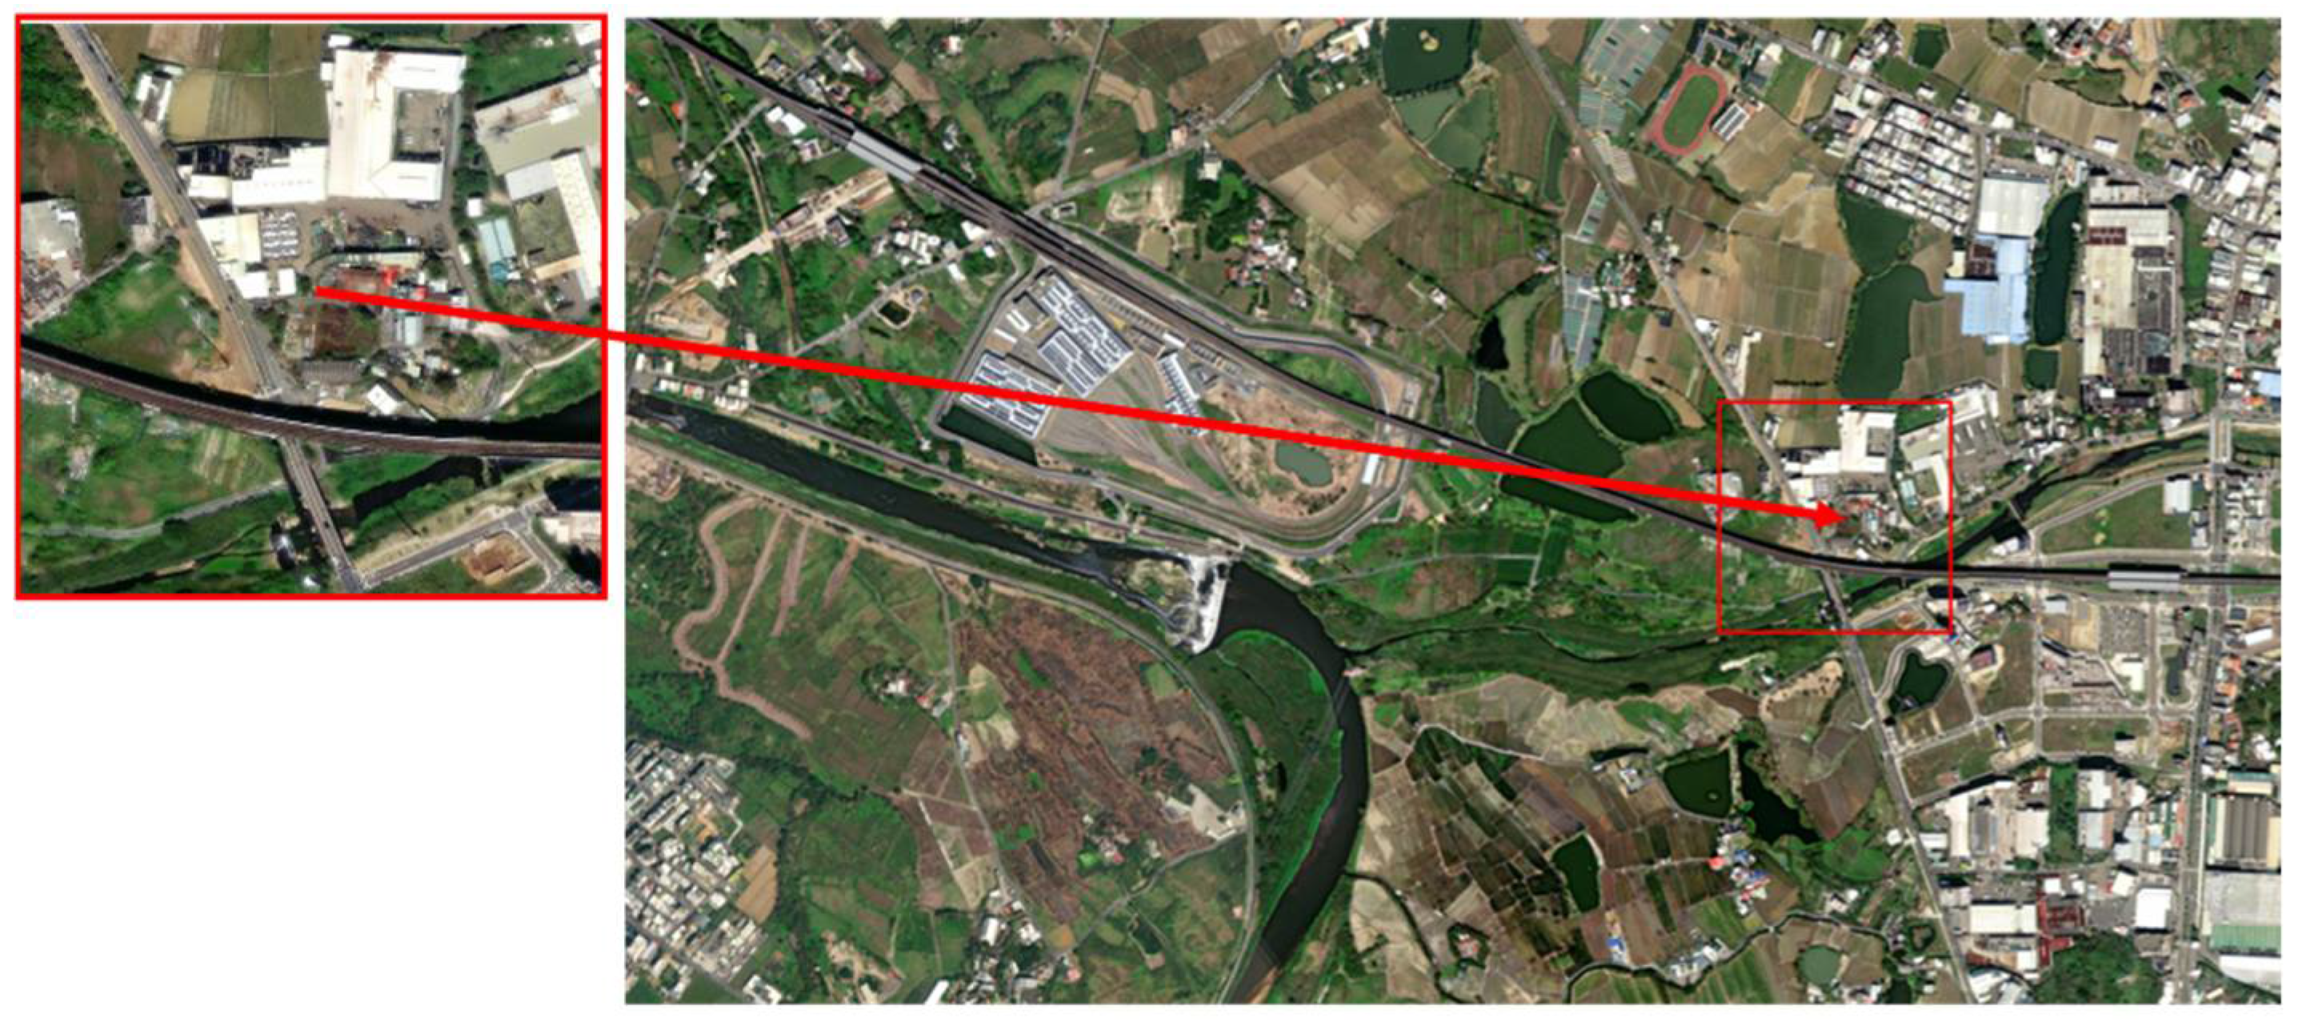
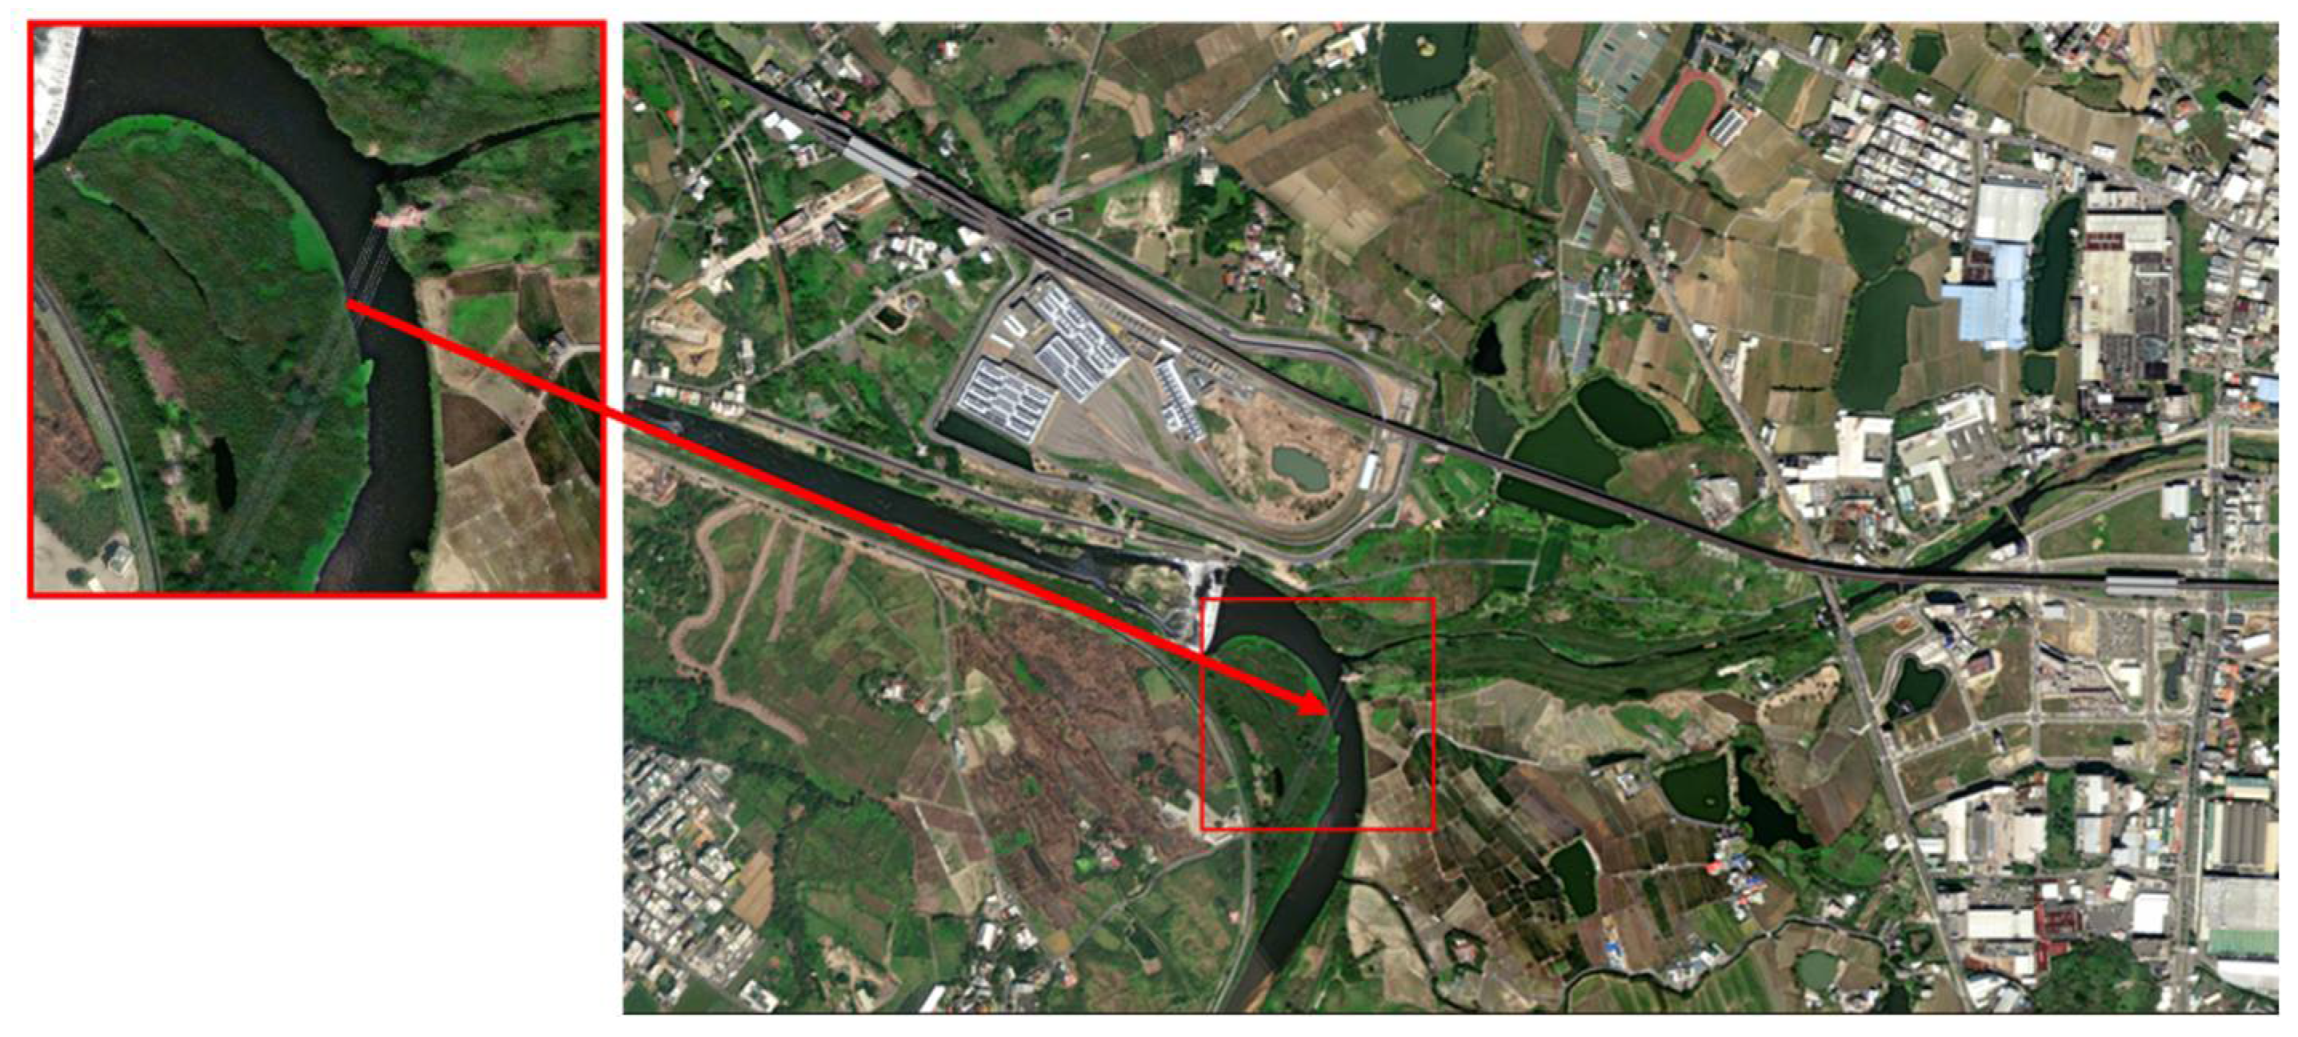
To verify whether the algorithm can conduct precise matching, three pictures are selected from the database images to extract their pattern feature vectors. Then, the Euclidean distance calculation is performed between these extracted vectors and the pattern feature vectors in the database. Figure 10a–c show the original images of 0_1400.png, 5950_2100.png and 3150_3150.png, respectively, while Figure 10d–f show the images after semantic segmentation processing, which are taken as the images to be matched.
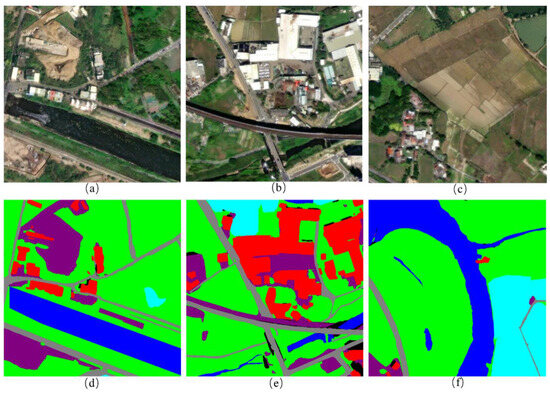
Figure 10.
Original and semantically segmented images to be matched: (a–c) the original images; (d–f) images after the semantic segmentation processing of (a–c), respectively.
The images to be matched are fed into the algorithm to obtain the pattern feature vectors of the aerial images and then the Euclidean distance calculation is carried out between them and the 276 pattern feature vectors of the database images. The final output experimental matching results are shown in Figure 11, Figure 12 and Figure 13. Among them, Figure 11 is the matching result of 0_1400.png, Figure 14 is the matching result of 5950_2100.png, and Figure 15 is the matching result of 3150_3150.png.
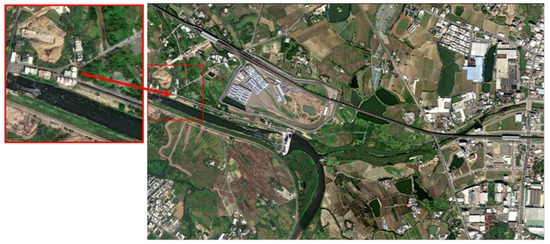
Figure 11.
Final matching output results of 0_1400.png.

Figure 12.
Final matching output results of 5950_2100.png.

Figure 13.
Final matching output results of 3150_3150.png.

Figure 14.
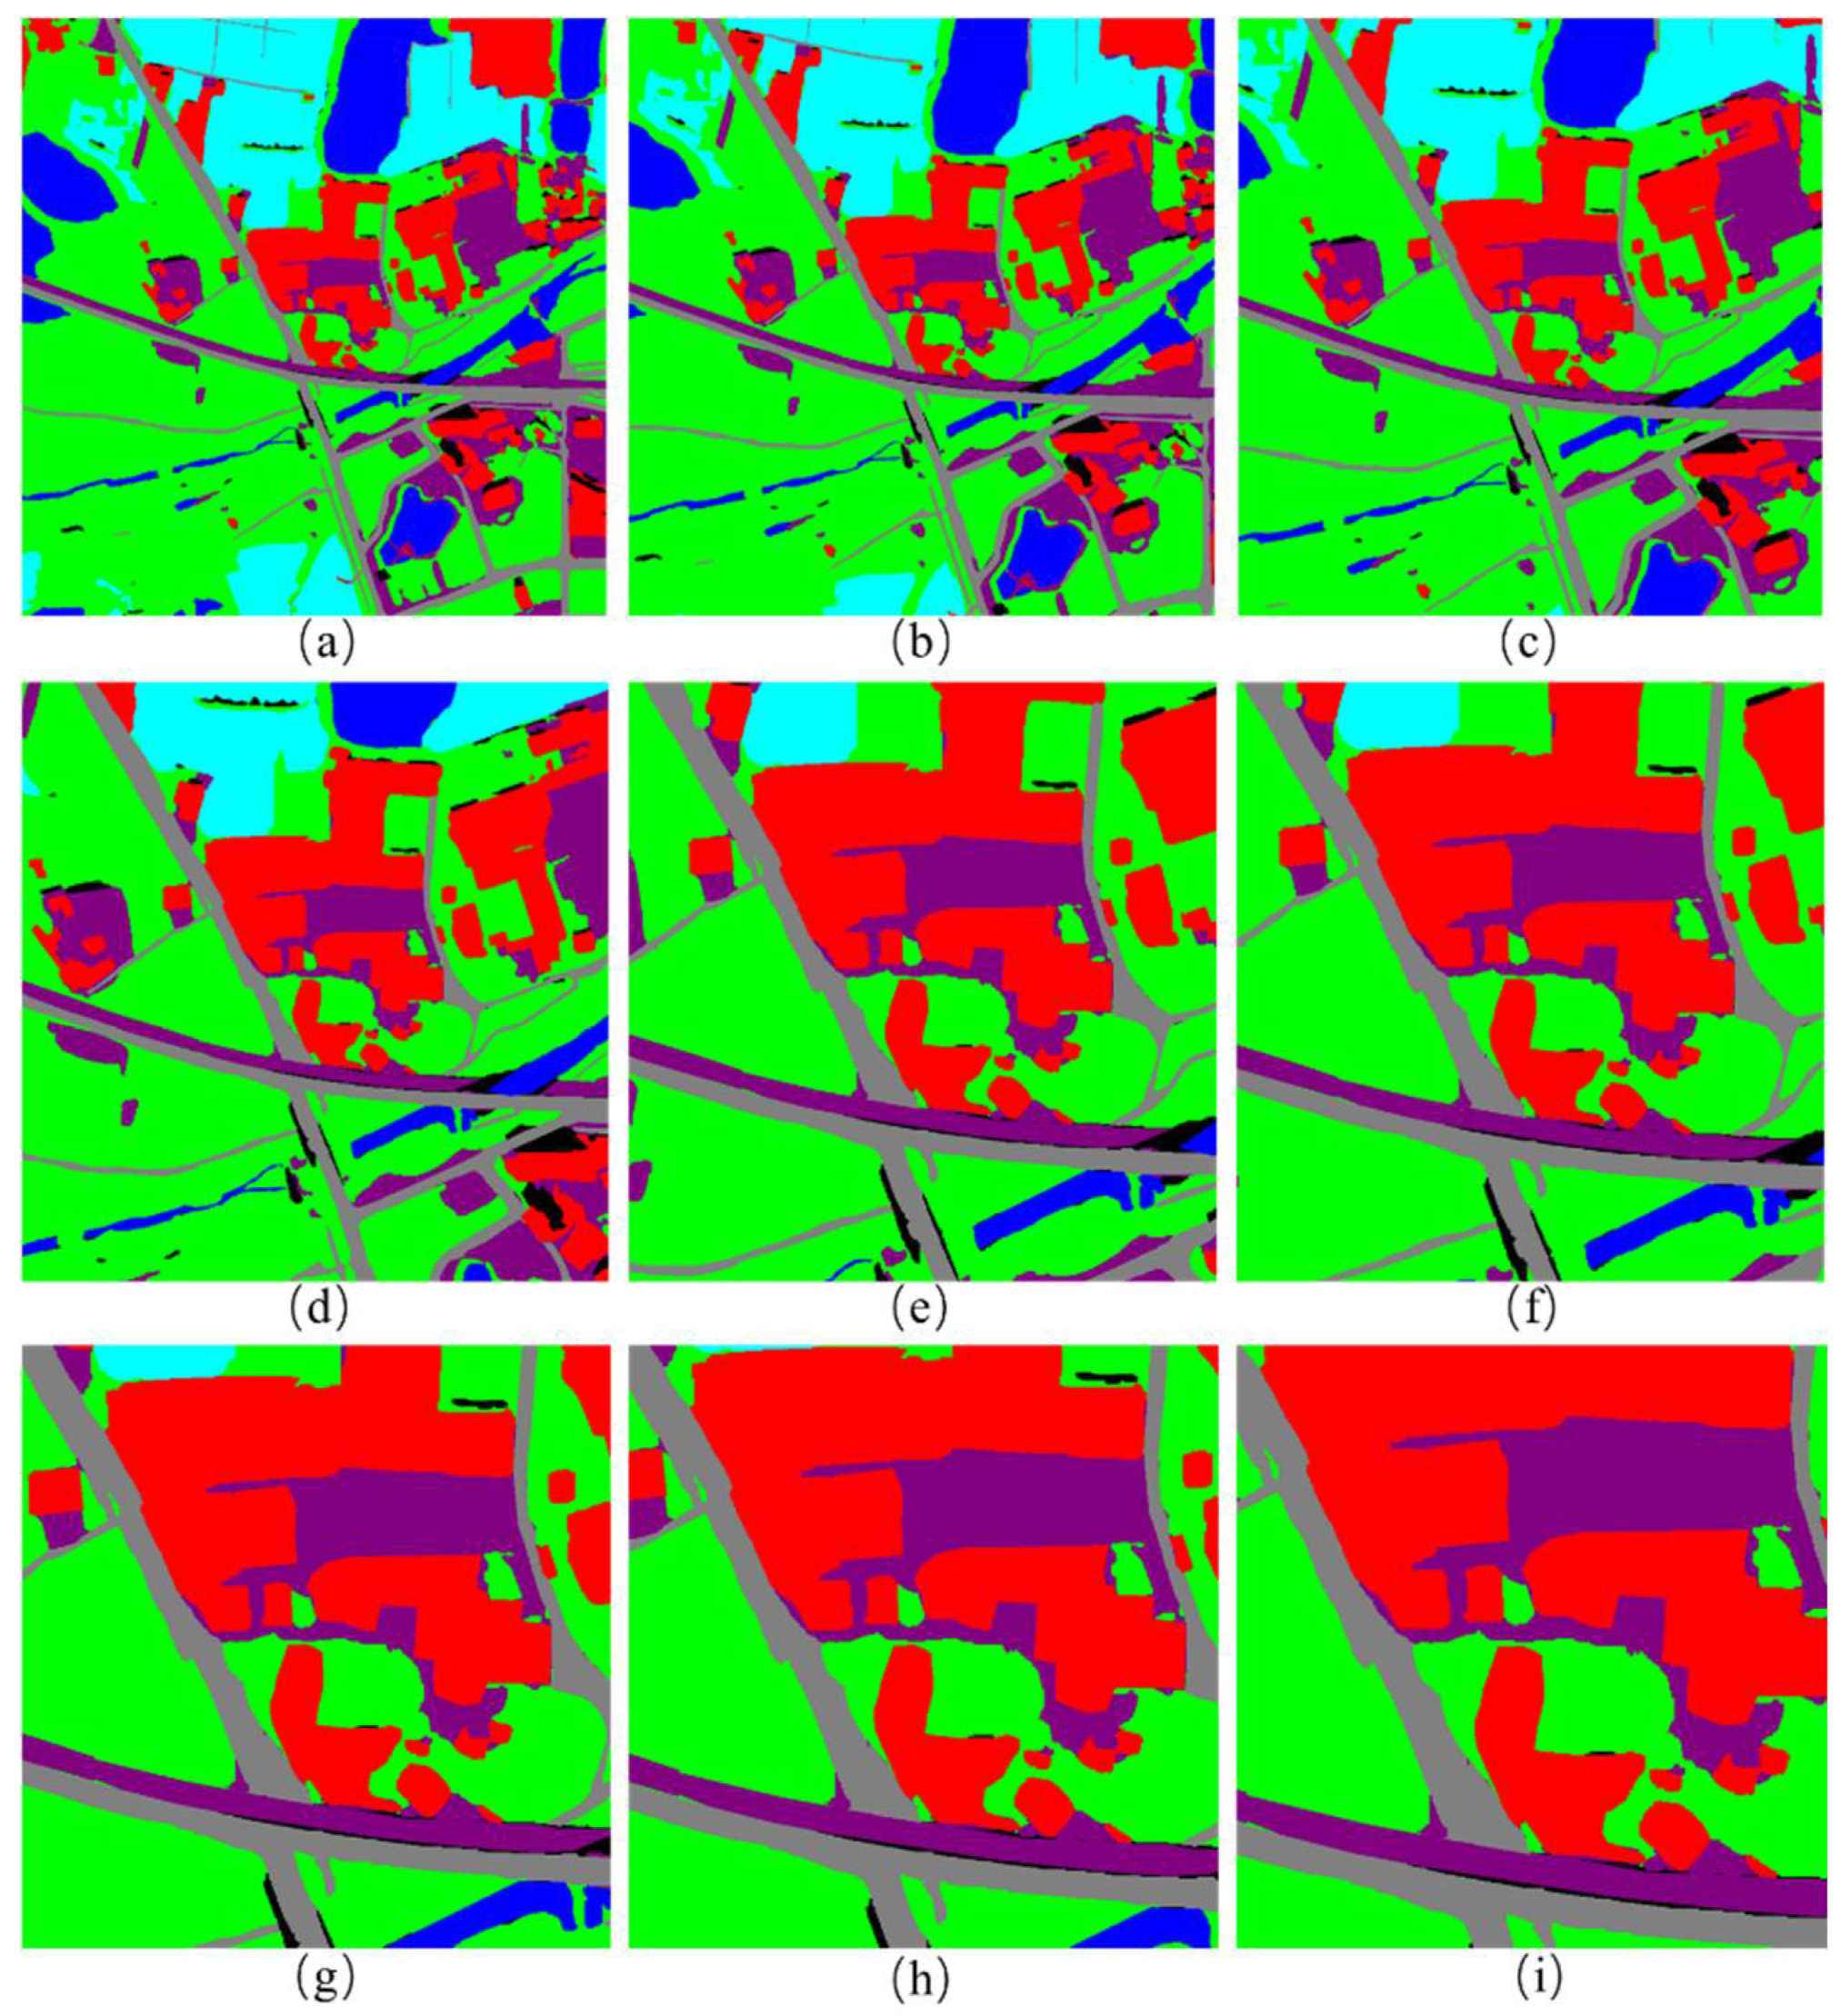
Images after different scale transformations: (a–i) images generated by enlarging or reducing the view radius of 5950_2100.png by 2, 1.8, 1.5, 1.2, 0.8, 0.75, 0.65, 0.6 and 0.5 times, respectively.
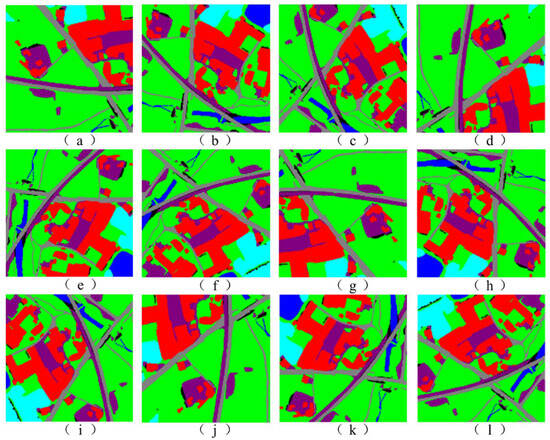
Figure 15.
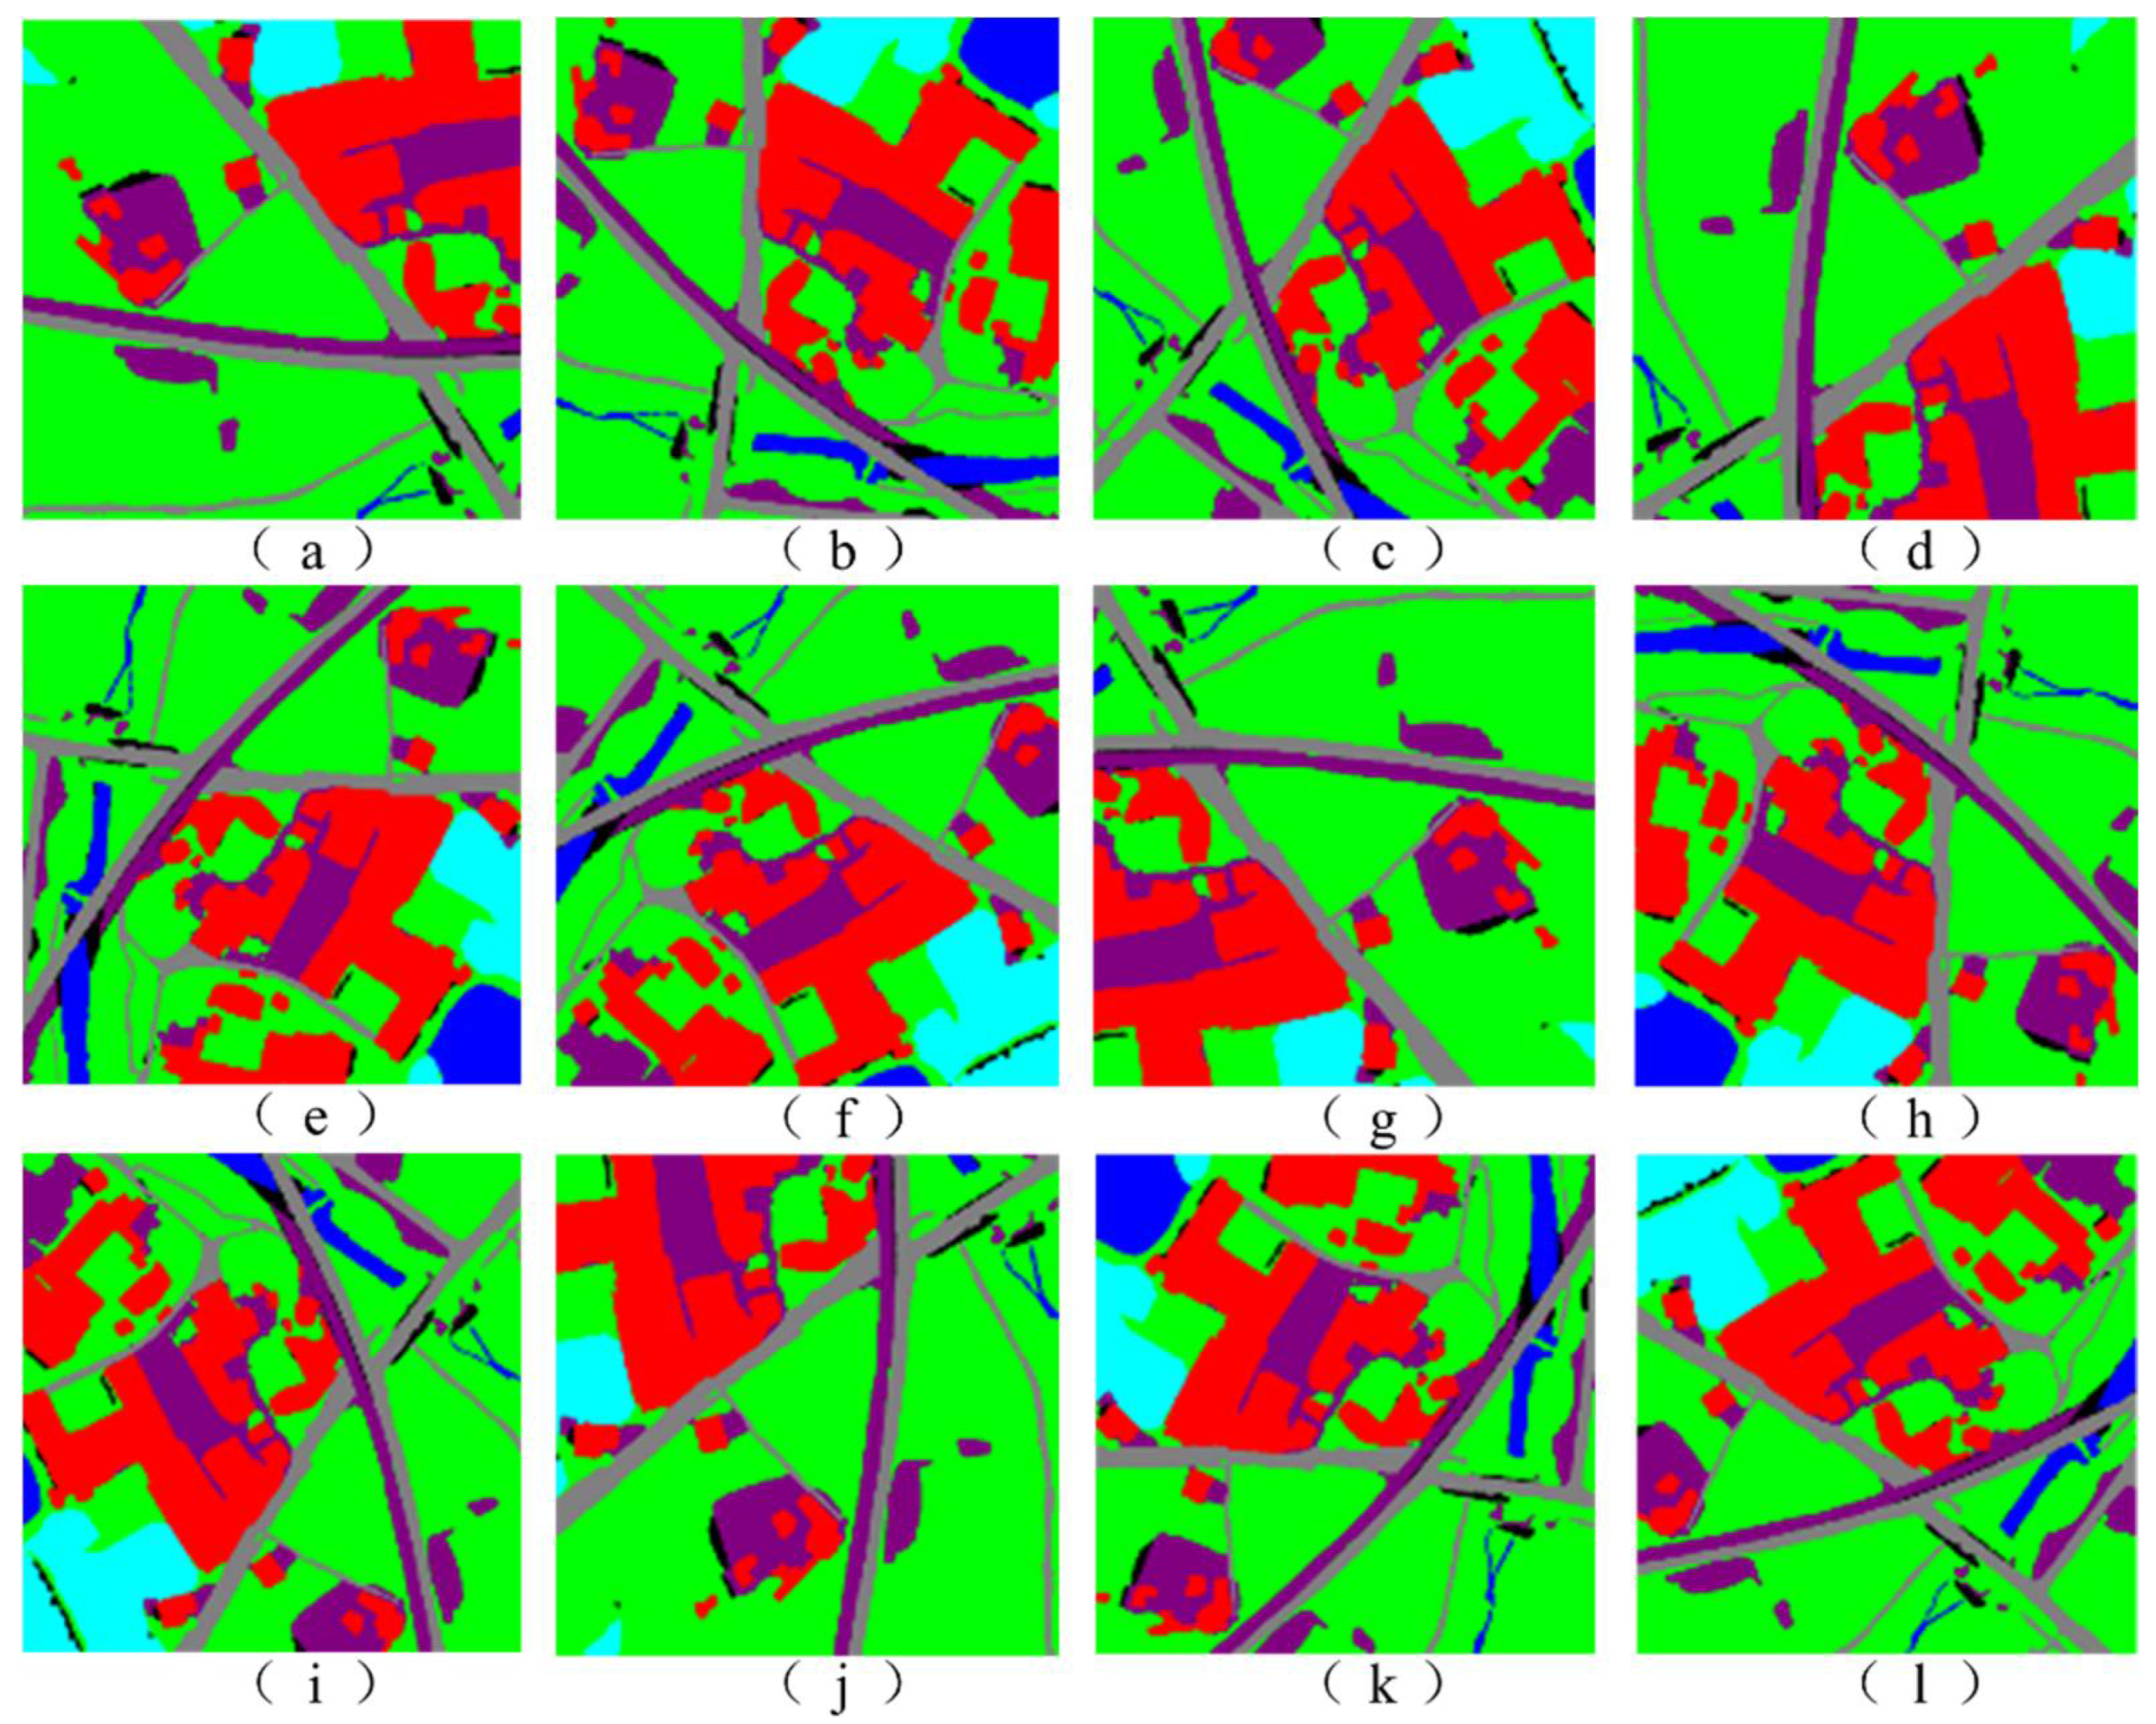
Pictures of the original label image after different angle transformations: (a–l) original image of 5950_2100.png rotated by 0, 30, 60, 90, 120, 150, 180, 210, 240, 270, 300 and 330, respectively.
The matching result data for the three images are shown in Table 1, Table 2 and Table 3, respectively.

Table 1.
Matching results for 0_1400.
Table 2.
Matching results for 5950_2100.
Table 3.
Matching results for 3150_3150.
It can be seen from the above table that the Euclidean distances of the three pictures are basically 0, the confidence levels reach 1.0, and the final output images are consistent with the input images. This indicates that the matching results are very accurate. Therefore, the pattern-matching algorithm proposed in this paper can basically achieve precise matching.
4. Discussion
The main advantage of the proposed method is reflected in two aspects: first, semantic information from images is used and it demonstrates good robustness. This is mainly reflected in the scale and rotation invariance of the algorithm; second, by storing images using vectors, the storage space can be significantly reduced. Below, we will analyze and discuss these points, particularly focusing on the scale and rotation invariance of the algorithm, as well as storage space.
4.1. Analysis of Scale Invariance
To analyze the scale invariance of the pattern-matching algorithm used in this paper, a benchmark image from the database is randomly selected. The nine images shown in a–i of Figure 14 are the images generated by enlarging or reducing the view radius of 5950_2100.png by 2, 1.8, 1.5, 1.2, 0.8, 0.75, 0.65, 0.6 and 0.5 times, respectively.
For each transformed image, its pattern feature vectors are extracted and the Euclidean distance is calculated with the pattern feature vectors in the database. The labeled images at different scales are fed into the pattern-matching system and the obtained matching results are shown in Table 4.
Table 4.
Matching results under different scales.
In the 5900_2100.png image, the purple area that crosses the picture in the central part represents a piece of bare land. The experimental results show that when the scale is small, due to the limited resolution, this piece of bare land may not be fully displayed. When the scale becomes larger, the whole picture of this bare land can be shown, and the position of its center of gravity on the map as well as its relative position will also change accordingly. As a result, it affects the extraction of the pattern feature vectors and then directly influences the accuracy of pattern matching. Once the scale is smaller than a certain range, the number of visual reference objects participating in pattern extraction may be less than the minimum threshold required by the algorithm, and key information such as the distance ratio, angle differences, and label sequences in the pattern feature vectors will all change. Therefore, the algorithm perfectly achieves scale invariance within a certain scale range (about 0.6–1.8 times). Although this range interval seems relatively small at present, in practical applications, due to the relatively high altitude of airplanes or aerial drones, the change in this scale range may correspond to a large change in the actual altitude and be sufficient to cover most of the navigation requirements. If there are higher precision requirements, the topological feature vectors of benchmark image databases can be stored at different height layers. During matching, different benchmark databases are selected for use at various height layers to achieve the desired positioning accuracy. Although this approach increases the storage requirements by storing multiple feature vector sets, it is still more efficient than storing raw image data, as only feature vectors need to be retained and processed.
4.2. Analysis of Rotation Invariance
In order to verify the rotational invariance of the pattern-matching algorithm used in this paper, a series of angular transformations are performed on 5950_2100.png as an example to generate images with different angles, which are subjected to pattern extraction and matching, respectively. For each transformed image, its pattern feature vector is extracted and the Euclidean distance is calculated with the pattern feature vector in the database.
Figure 15 shows the original labeled image of 5950_2100.png after semantic segmentation was performed at different angles, and Figure 15a–l show the original image of 5950_2100.png and the image after rotating it by 30, 60, 90, 120, 150, 180, 210, 240, 270, 300 and 330, respectively.
The labeled images under different rotation angles are fed into the pattern-matching system separately, and the matching results obtained are shown in Table 5.
Table 5.
Matching results under different rotation angles.
By analyzing the matching results, the following results can be obtained: (1) Matching accuracy: even after the image has been rotated by a larger angle, the matching confidence score is basically above 0.95, and the algorithm is still able to basically satisfy the need for pattern matching accuracy. (2) Rotation angle and matching accuracy: when the image is rotated by 90, 180 and 270 degrees, the final minimum Euclidean distance is significantly smaller, and the matching confidence score is very close to 1. This indicates that the matching error of the algorithm is the smallest and that the matching accuracy is the highest under these specific rotation angles. This may be related to the symmetry of the image rotations, as the rotations at these angles can be viewed as simple transformations of the image in the plane, with less impact on the texture and features of the image.
4.3. Analysis of Storage Capacity
When constructing an aerial image database, the choice of storage method is crucial for system performance and resource utilization. In this example, for the 276 original baseline images obtained from segmentation, the storage capacity reaches 837 MB in the original storage method, while by using the method of storing the pattern feature vectors, the storage capacity is reduced to only 77.5 KB, which is one thousandth of the original storage method. Moreover, since the dimensions of pattern feature vectors are much lower than those of the original pixel data, the system can process and compare the vectors faster during the matching and retrieval process, thus improving the matching speed and accuracy.
Therefore, by storing the pattern feature vectors of the original baseline image as a matching database, a significant reduction in storage is successfully achieved. In addition, since the pattern feature vectors are abstract representations of the main information of the images, the pattern feature vectors are able to remain relatively stable even if the images undergo certain changes in illumination, angle or scale, thereby improving the robustness of the system.
5. Conclusions
To address the robustness, real-time performance, and limited computer resource requirements of aerial visual navigation positioning, this study proposes a method for extracting advanced features from aerial images and map databases. Specifically, semantic segmentation techniques are employed to extract prominent visual reference object identifiers from aerial images, followed by advanced feature matching based on the topological position relationships between these visual references. This approach simplifies the image-based positioning problem into a topological relationship feature matching issue, thereby significantly reducing the effects of scale changes and orientation variations on the matching precision. Consequently, this method enhances the accuracy and robustness of the matching process while notably decreasing the storage requirements for the map database.
Author Contributions
Conceptualization, J.H.; Methodology, J.H.; Software, J.H.; Formal analysis, Q.W.; Investigation, Q.W. All authors have read and agreed to the published version of the manuscript.
Funding
This research was funded by Project of National Natural Science Foundation of China, grant number 62206310.
Data Availability Statement
The original contributions presented in the study are included in the article, further inquiries can be directed to the corresponding author.
Acknowledgments
The authors would like to thank all reviewers and editors for their comments on this paper.
Conflicts of Interest
The authors declare no conflicts of interest.
References
- Butila, E.V.; Boboc, R.G. Urban Traffic Monitoring and Analysis Using Unmanned Aerial Vehicles (UAVs): A Systematic Literature Review. Remote Sens. 2022, 14, 620. [Google Scholar] [CrossRef]
- Yang, J.; Qin, D.; Tang, H.; Tao, S.; Bie, H.; Ma, L. DINOv2-Based UAV Visual Self-Localization in Low-Altitude Urban Environments. IEEE Robot. Autom. Lett. 2025, 10, 2080–2087. [Google Scholar] [CrossRef]
- Couturier, A.; Akhloufi, M.A. A review on absolute visual localization for UAV. Robot. Auton. Syst. 2021, 135, 10366. [Google Scholar] [CrossRef]
- Wilson, D.; Zhang, X.; Sultani, W.; Wshah, S. Visual and Object Geo-localization: A Comprehensive Survey. arXiv 2023, arXiv:2112.15202. Available online: http://arxiv.org/abs/2112.15202 (accessed on 11 October 2023).
- Ding, L.; Zhou, J.; Meng, L.; Long, Z. A practical Cross-View Image Matching Method between UAV and Satellite for UAV-Based Geo-localization. Remote Sens. 2020, 13, 47. [Google Scholar] [CrossRef]
- Dai, M.; Hu, J.; Zhuang, J.; Zheng, E. A Transformer-Based Feature Segmentation and Region Alignment Method For UAV-View Geo-localization. IEEEE Trans. Circuits Syst. Video Technol. 2022, 32, 4376–4389. [Google Scholar] [CrossRef]
- Liu, R.; Liu, H.; Meng, X.; Li, T.; Hancock, C.M. Detecting GNSS Spoofing and Re-localization on UAV based on Imagery Matching. Meas. Sci. Technol. 2025, 36, 016320. [Google Scholar] [CrossRef]
- Babenko, A.; Slesarev, A.; Chigorin, A.; Lempitsky, V. Neurl Codes for Image Retrieval. arXiv 2014, arXiv:1404.1777. Available online: http://arxiv.org/abs/1404.1777 (accessed on 7 July 2014).
- Hao, Y.; Meng, Z.Y.; Ai, J.W.; Wu, Y.Q. Localization method by aerial image matching in urban environment based on semantic segmentation. J. Huazhong Univ. Sci. Technol. 2022, 50, 79–84. [Google Scholar]
- Yang, X.W.; Wang, W.; Wang, Y.J. Research on UAV Target Fast Searching Method Based on Scene Matching Research on UAV Target Fast Searching Method Based on Scene Matching. Geomat. Spat. Inf. Technol. 2023, 46, 206–208+211. [Google Scholar]
- Zheng, K.; Yin, S.M.; Zheng, X.M.; Lin, H.X.; Chen, G.W. A UAV Matching Positioning Approach with High Accuracy Based on POS Data. Fire Control Command. Control 2023, 48, 160–166. [Google Scholar]
- Shan, M.; Wang, F.; Lin, F.; Gao, Z.; Tang, Y.Z.; Chen, B.M. Google Map Aided Visual Navigation for UAVs in GPS-denied Environment. arXiv 2017, arXiv:1703.10125. [Google Scholar]
- Hou, H.; Xu, Q.; Lan, C.; Lu, W.; Zhang, Y.; Cui, Z.; Qin, J. UAV Pose Estimation in GNSS-Denied Environment Assisted by Satellite Imagery Deep Learning Features. IEEE Access 2021, 9, 6358–6367. [Google Scholar] [CrossRef]
- Luo, J.; Ye, Q. UAV Large Oblique Image Geo-localization Using Satellite Images in the Dense Buildings Area. ISPRS Ann. Photogramm. Remote Sens. Spat. Inf. Sci. 2023, 10, 1065–1072. [Google Scholar] [CrossRef]
- Masadeh, A.; Alhafnawi, M.; Salameh, H.A.B.; Musa, A.; Jararweh, Y. Reinforcement Learning-Based Security/Safety UAV System for Intrusion Detection Under Dynamic and Uncertain Target Movement. IEEE Trans. Eng. Manag. 2024, 71, 12498–12508. [Google Scholar] [CrossRef]
- Zhang, X.; Zhang, S.; Sun, Z.; Liu, C.; Sun, Y.; Ji, K.; Kuang, G. Cross-Sensor SAR Image Target Detection Based on Dynamic Feature Discrimination and Center-Aware Calibration. IEEE Trans. Geosci. Remote Sens. 2025, 63, 5209417. [Google Scholar] [CrossRef]
- Sun, Z.; Leng, X.; Zhang, X.; Zhou, Z.; Xiong, B.; Ji, K.; Kuang, G. Arbitrary-Direction SAR Ship Detection Method for Multi-Scale Imbalance. IEEE Trans. Geosci. Remote Sens. 2025, 63, 5208921. [Google Scholar] [CrossRef]
- Li, H.; Xiong, P.; An, J.; Wang, L. Pyramid Attention Network for Semantic Segmentation. arXiv 2018, arXiv:1805.10180v3. [Google Scholar]


Disclaimer/Publisher’s Note: The statements, opinions and data contained in all publications are solely those of the individual author(s) and contributor(s) and not of MDPI and/or the editor(s). MDPI and/or the editor(s) disclaim responsibility for any injury to people or property resulting from any ideas, methods, instructions or products referred to in the content. |
© 2025 by the authors. Licensee MDPI, Basel, Switzerland. This article is an open access article distributed under the terms and conditions of the Creative Commons Attribution (CC BY) license (https://creativecommons.org/licenses/by/4.0/).