Article

Cloud and Aerosol Impacts on the Radiation Budget over China from 2000 to 2023

1
Southern Marine Science and Engineering Guangdong Laboratory (Zhuhai), School of Atmospheric Sciences, Sun Yat-sen University, Zhuhai 519082, China
2
Guangdong Province Key Laboratory for Climate Change and Natural Disaster Studies, Zhuhai 519082, China
*
Author to whom correspondence should be addressed.
Remote Sens. 2025, 17(10), 1666; https://doi.org/10.3390/rs17101666
Submission received: 13 March 2025 / Revised: 28 April 2025 / Accepted: 3 May 2025 / Published: 9 May 2025
(This article belongs to the Section Atmospheric Remote Sensing)

Abstract

:
Aerosols and clouds influence Earth’s radiative energy budget, but their regional radiative impacts remain insufficiently understood. This study investigates the spatial distribution patterns and long-term trends of radiative fluxes over China from March 2000 to February 2023 using CERES-SYN data. Notable decreasing trends in the net radiative fluxes over China at the top of the atmosphere (−0.38 W m−2 year−1) and the surface (−0.35 W m−2 year−1) during the study period have been observed. Cloud properties from CERES-SYN and aerosol properties from MERRA-2 are used to assess the impacts of aerosols and clouds on radiative flux variations. Results show that aerosols are the primary drivers of radiative flux variations across China, while cloud changes exert notable but regionally dependent influences. In southern China, reductions in black carbon and organic carbon aerosols substantially influence radiative flux variations, along with contributions from changes in mid-high, mid-low, and low clouds. In northern China, decreases in dust and organic carbon aerosols primarily drive radiative flux trends. Over the Tibetan Plateau, variations in mid-high clouds predominantly affect radiative flux changes. In Xinjiang and Inner Mongolia, fluctuations in high, mid-high, and mid-low clouds, along with dust and sulfate aerosols, jointly contribute to the radiative flux variations, although the overall impacts remain relatively small.

1. Introduction

The Earth’s energy budget is a critical driver of atmospheric circulation, ocean currents, and the hydrological cycle [1,2], serving as a key determinant of global weather patterns and climate change [3]. The radiation budget of the surface–atmosphere system encompasses components at the top of the atmosphere (TOA), within the atmosphere (ATM), and at the surface (SFC) [1,4], each regulated by shortwave (SW, 0.2~4 µm) and longwave (LW, 4~100 µm) radiation [5,6,7]. SW radiation is primarily governed by incoming solar radiation, which is affected by the solar constant, Earth–sun distance [8], latitude, and surface albedo [9,10]. LW radiation is influenced by the Earth’s thermal emission and greenhouse gases, which absorb and re-emit longwave radiation [11]. Land use changes modify surface albedo, thereby influencing both SW and LW radiation [12]. While astronomical and geographical factors determine radiation distribution, their effects are invariant for specific times and locations [8,10]. Atmospheric gases, such as greenhouse gases, have long atmospheric lifetimes and relatively stable radiative effects, and thus are not the primary contributors to the temporal and spatial variability in radiation [11]. In contrast, clouds and aerosols are the dominant drivers of the temporal and spatial variations in SW and LW radiation [9]. Clouds reflect SW radiation and absorb and re-emit LW radiation, whereas aerosols predominantly scatter and absorb SW radiation [4].
Numerous studies have extensively examined the roles of aerosols and clouds in regulating the Earth’s radiation budget, with particular emphasis on their impact on surface solar radiation (SSR). Over recent decades, SSR has undergone significant inter-decadal changes globally, characterized by a “dimming” phase (a decline in SSR) from the 1950s to the 1980s, followed by a “brightening” (an increase in SSR) phase [13,14]. Ground-based observations [15,16], satellite retrievals [17], reanalysis data [18], and model simulations [19] have primarily linked the SSR variations with the changes in aerosol and cloud, where significant regional and temporal differences are found. For instance, cloud changes have driven SSR in specific regions, such as the “dimming” observed during the 1960s–1980s [20] and the “brightening” from 1996 to 2011 [21] in the U.S., the “dimming” in Canada from 1958 to 1999 [22], and the post-2000 “dimming” over the Arabian Peninsula, South America, and Australia [23]. Aerosol-driven trends are also prominent in several regions like the persistent “dimming” in China and India since the late 20th century, and the “brightening” over Europe, the Mediterranean [24], and Japan [25] after the 1980s. Some studies have also suggested that the SSR variations are jointly influenced by aerosols and clouds. Long-term SSR trends in Europe are primarily driven by aerosols, and seasonal and interannual variations are more influenced by changes in clouds [26]. Overall, the impacts of aerosols and clouds on SSR changes exhibit pronounced spatial and temporal disparities across different regions and periods, depending on various meteorological and environmental conditions [9,27,28].
IPCC AR6 [29] highlights large uncertainties in assessing the impacts of aerosols and clouds on the Earth’s radiation budget. In particular, China, as one of the largest sources of aerosols and their precursors, exhibits both high aerosol loading and abundant and complex cloud cover, jointly exerting substantial influences on the regional radiation budget [30]. Correspondingly, the trends in SSR in China generally mirror the global trend, which shows a “dimming” from the 1950s to the 1980s [31,32,33], a period of weakened “dimming” during the 1990s [34,35], and a subsequent “brightening” after the 2000s [36,37]. These phases of SSR evolution are primarily attributed to the effects of aerosols and clouds, although their relative contributions remain the subject of ongoing debate [30].
Several studies have suggested that either aerosols or clouds individually dominate SSR trends. During the “dimming” phases, increased aerosol concentrations, particularly absorbing (e.g., black carbon) and scattering (e.g., sulfate) aerosols, have been identified as the primary drivers by reducing solar radiation directly and altering cloud properties indirectly [31,38,39]. Cloud cover changes have been found to exert minimal influence on SSR between 1971 and 1989 [40]. In the subsequent weakening of the “dimming” phase (1990–2002), clouds played a more prominent role, with variations in cloud cover contributing significantly to SSR trends [41]. Specifically, the post-1990 SSR increases have been mainly attributed to decreases in cirrus and stratiform cloud fractions [42]. The subsequent “brightening” phase was also associated with reductions in aerosol loading, which improved atmospheric transparency and enhanced SSR [43,44]. Furthermore, an increasing number of studies emphasize the combined effects of aerosols and clouds in modulating SSR changes. The “brightening” trend since 1990 was linked to decreased aerosol levels and cloud cover [45]. From 1980 to 2010, the SSR variations were impacted by aerosol effects and aerosol–cloud interactions [46], where clouds often mitigated the radiative impact of aerosols [36]. These findings highlight that the relative contributions of aerosols and clouds to SSR variability remain a subject of debate across different periods, compounded by significant regional disparities. For instance, lower SSR levels are found in high-aerosol-emission regions such as eastern and southern China compared with the less-polluted western China [47], with aerosols dominating SSR changes in northern China and clouds exerting a stronger influence in southern regions [30]. Overall, the relative contributions of aerosols and clouds to SSR variability at both temporal and spatial scales still need further investigation.
Ground-based observations, satellite-derived products, and reanalysis data are the primary datasets used to analyze the SSR trends [48]. The analysis of SSR trends over China primarily relies on surface observations from the China Meteorological Administration (CMA), but their limited station density constrains the spatial coverage, limiting large-scale applications [49]. In contrast, satellite-derived products and reanalysis datasets offer continuous spatiotemporal data [28]. Clouds and Earth’s Radiant Energy System Synoptic TOA and surface fluxes and clouds (CERES-SYN) product shows the best agreement with observed SSR globally [28,50], outperforming Modern-Era Retrospective Analysis for Research and Applications Version 2 (MERRA-2) product [51]. However, comprehensive validation of CERES-SYN data against other satellite-derived products and reanalysis datasets remains limited for the China region. To extend the validation of CERES-SYN data, this study compares CERES-SYN against multiple satellite-derived products (including CERES Energy Balanced and Filled (EBAF), International Satellite Cloud Climatology Project (ISCCP-FH), and Global Energy and Water Cycle Experiment Surface Radiation Budget (GEWEX-SRB)), reanalysis datasets (including European Centre for Medium-Range Weather Forecasts Reanalysis Version 5 (ERA5) and MERRA-2), and ground-based observations (CMA) over China, to assess its ability to capture regional SSR trends across China. Existing studies primarily analyze SSR variations using the above datasets, focusing on the consistency between SSR, total aerosol optical depth (AOD), and total cloud cover [52,53]. However, the contributions of different cloud and aerosol properties, as well as their regional disparities, remain to be further discussed. In this context, this study employs CERES-SYN data to systematically assess regional variations in radiative fluxes across China, investigates regional variations in aerosol and cloud effects, and attributes these changes to specific cloud and aerosol properties to comprehensively understand their impacts.
The structure of this paper is organized as follows. Section 2 describes the data sources and methodology. Section 3 validates CERES-SYN SSR against ground-based observations from CMA, satellite datasets (CERES-EBAF, GEWEX-SRB, ISCCP-FH), and reanalysis datasets (MERRA-2, ERA5), and analyzes the shortwave, longwave, and net radiative fluxes at the TOA and SFC over China. We further examine the impacts of regional cloud radiative effects (CREs) and aerosol radiative effects (AREs), in combination with cloud property data from CERES-SYN and aerosol characteristics from MERRA-2. Section 4 investigates the trends in radiation flux variations over the study period and explores the key drivers behind these changes. Finally, Section 5 summarizes the main conclusions.

2. Materials and Methods

2.1. Data Description

This study employs a variety of datasets, including ground-based measurements from CMA, satellite datasets from CERES-EBAF, GEWEX-SRB, and ISCCP-FH, as well as reanalysis datasets from MERRA-2 and ERA5, to validate the applicability of CERES-SYN surface solar radiative fluxes over China. A summary of the datasets used is provided in Table 1, with detailed descriptions below.

2.1.1. Ground-Based Radiation Observations

Monthly averaged SSR from 99 ground-based stations across China, provided by CMA, covering March 2000 to June 2016, are used for validation. Rigorous quality control procedures have been applied to these data, including checks for climatological limits, internal consistency, and temporal continuity [49].

2.1.2. Radiation from Satellite and Reanalysis Datasets

(a) CERES-SYN (Edition 4.1)
The CERES-SYN dataset spans from March 2000 to February 2023 at the spatial resolution of 1° × 1°, offering both LW and SW monthly radiative fluxes under all-sky, clear-sky, all-sky-no-aerosol, and pristine (clear-sky-no-aerosol) conditions [54]. The SSR is derived using NASA Langley’s Fu-Liou radiative transfer model, which integrates Moderate Resolution Imaging Spectroradiometer (MODIS) cloud properties and the Goddard Earth Observing System (GEOS) atmospheric and surface temperature, the Model for Atmospheric Transport and Chemistry aerosol compositions, and MODIS AOD [55].
(b) CERES-EBAF (Edition 4.2)
The CERES EBAF dataset spans from March 2000 to June 2016 at 1° × 1° resolution, which provides monthly SSR under all-sky and clear-sky conditions. The algorithm constrains satellite-derived surface, cloud, and aerosol properties (mainly from MODIS) using CERES TOA observations to ensure consistency [56].
(c) ISCCP-FH
The ISCCP-FH dataset spans from March 2000 to June 2016 at 1° × 1° resolution, which delivers monthly SSR products under all-sky and clear-sky conditions. As the third-generation ISCCP dataset [57,58,59], ISCCP-FH enhances the representation of radiative effects from gases and aerosols, improves cloud vertical distribution models, and refines spatial resolution. Advanced calibration and aerosol processing significantly improve its ability to capture radiative flux variations [59,60].
(d) GEWEX-SRB
The GEWEX-SRB dataset spans from March 2000 to June 2016 at 1° × 1° resolution, and provides monthly SSR for both all-sky and clear-sky conditions. The release 4 dataset integrates multi-source data products [50,61], and applies algorithm updates to enhance the accuracy and reliability of TOA and SFC radiation estimates [62,63].
(e) ERA5
The ERA5 reanalysis dataset spans from March 2000 to June 2016 at 1° × 1° resolution, and provides the monthly SSR using the Rapid Radiative Transfer Model. It integrates global observations with model simulations via the Integrated Forecast System and advanced data assimilation techniques for enhanced accuracy and efficiency [64].
(f) MERRA-2
MERRA-2 spans from March 2000 to June 2016 at 0.5° × 0.625° resolution and provides monthly SSR. Developed by NASA with the GEOS Data Assimilation System [51], MERRA-2 integrates aerosol data from satellite observations, and possesses high resolution and accuracy for various research studies [65].

2.1.3. Satellite Products for Cloud and Aerosol Properties

This study uses cloud property data, including cloud fraction (CF), cloud optical depth (COD), cloud top height, liquid cloud particle radius, and ice cloud particle radius, for total cloud (TC), high cloud (HC, 50–300 hPa), middle-high cloud (mid-HC, 300–500 hPa), middle-low cloud (mid-LC, 500–700 hPa), and low cloud (LC, 700–surface hPa), derived from CERES SYN Edition 4.1 monthly mean products (March 2000–February 2023, 1° × 1° resolution). The Edition 4 product improves cloud retrievals with a 1.24 μm channel for COD over snow, optimized spectral channels, and refined algorithms for cloud phase and height, resulting in increased cloud cover estimates (0.035 at day and 0.068 at night) and consistency between Aqua and Terra observations [66,67]. Compared with Cloud-Aerosol Lidar and Infrared Pathfinder Satellite Observations, the Edition 4 product achieves 90–96% daytime and 88–95% nighttime cloud/clear-sky identification accuracy, excelling in cloud phase and height retrievals for water and ice clouds [68].
Aerosol property data, including AOD, scattering AOD, and Ångström Exponent (AE), are obtained from the MERRA-2 dataset (March 2000–February 2023, 0.5° × 0.625° resolution) [69,70,71]. Single-scattering albedo (SSA), calculated as the ratio of the aerosol scattering coefficient to the total extinction coefficient, is also used in this study. MERRA-2 provides high-resolution aerosol information at hourly intervals, encompassing concentration, composition, and optical properties, thus serving as a valuable dataset for aerosol analyses [28,69,72]. Moreover, MERRA-2 exhibits superior accuracy in AOD retrievals and shows strong correlations with Aerosol Robotic Network observations for AOD and fine-mode fraction [70,73], making it a reliable resource for assessing aerosol properties over China [74].

2.2. Data Processing

2.2.1. Clouds and Aerosols Radiation Calculations

Monthly SW and LW radiative fluxes are obtained from CERES-SYN, covering various conditions, including all-sky, clear-sky, all-sky-no-aerosol, and pristine (clear-sky-no-aerosol). These data are processed at both the TOA and SFC to quantify the radiative effects of clouds and aerosols.
(1) Radiative Flux Calculations
The radiative fluxes for SW and LW are computed as the difference between downward and upward fluxes, as shown in Equations (1) and (2). The net radiative flux (NET) is calculated as the sum of SW and LW radiative fluxes, as given in Equation (3).
F SW = F SW F SW ,
F LW = F LW F LW ,
F NET = F SW + F LW = F SW F SW + F LW F LW ,
where FSW↓ and FLW↓ are the downward shortwave and longwave radiative fluxes. FSW↑ and FLW↑ are the upward shortwave and longwave radiative fluxes.
(2) Cloud Radiative Effect (CRE)
CRE is calculated as the difference in radiative fluxes between all-sky and clear-sky conditions, representing the contribution of clouds to the Earth’s radiation budget. The CRE for SW, LW, and NET is computed in Equation (4),
CRE = F all F clr ,
where Fall represents SW, LW, and NET radiative fluxes under all-sky conditions, and Fclr represents SW, LW, and NET radiative fluxes under clear-sky conditions.
(3) Aerosol Radiative Effect (ARE)
ARE is computed by comparing radiative fluxes with and without aerosols under all-sky (ARE_all) and clear-sky (ARE_clr) conditions, which are calculated as in Equations (5) and (6),
ARE _ all = F all _ aerosol F all no - aerosol ,
ARE _ clr = F clr _ aerosol F clr _ no - aerosol ,
where Fall_aerosol and Fclr_aerosol represent SW, LW, and NET radiative fluxes with aerosols under all-sky and clear-sky conditions, respectively. Fall_no-aerosol and Fclr_no-aerosol represent the radiant fluxes under all-sky and clear-sky conditions without aerosols. Note the term “radiative flux” is used for short of “radiative flux density” and bears the unit of W m−2 in this study.

2.2.2. Evaluation Metrics

This study uses several statistical indicators, including the coefficient of determination (R), mean absolute error (MAE), and root-mean-square error (RMSE), to assess the accuracy of satellite-derived and reanalysis radiation SSR data against ground-based measurements from CMA stations in China. The calculation methods are given in Equations (7)–(9),
R = 1 i = 0 n ( y ^ i y i ) 2 i = 0 n ( y i y ¯ ) 2 ,
MBE = 1 n i = 0 n ( ŷ i y i ) ,
RMSE = 1 n i = 0 n ( ŷ i y i ) 2 ,
where ŷi denotes the nearest grid point SSR from satellite or reanalysis products, yi represents observed SSR from CMA stations, ȳ is the mean SSR at CMA stations, and n is the total sample size. The coefficient of determination R in Equation (7) ranges from 0 to 1, with values closer to 1 indicating a better fit between satellite/reanalysis data and CMA observations. Equations (8) and (9) assess the mean bias and error magnitude between satellite/reanalysis and ground-based data. The student t-test is applied to evaluate the statistical significance of the regression trends.

3. Results

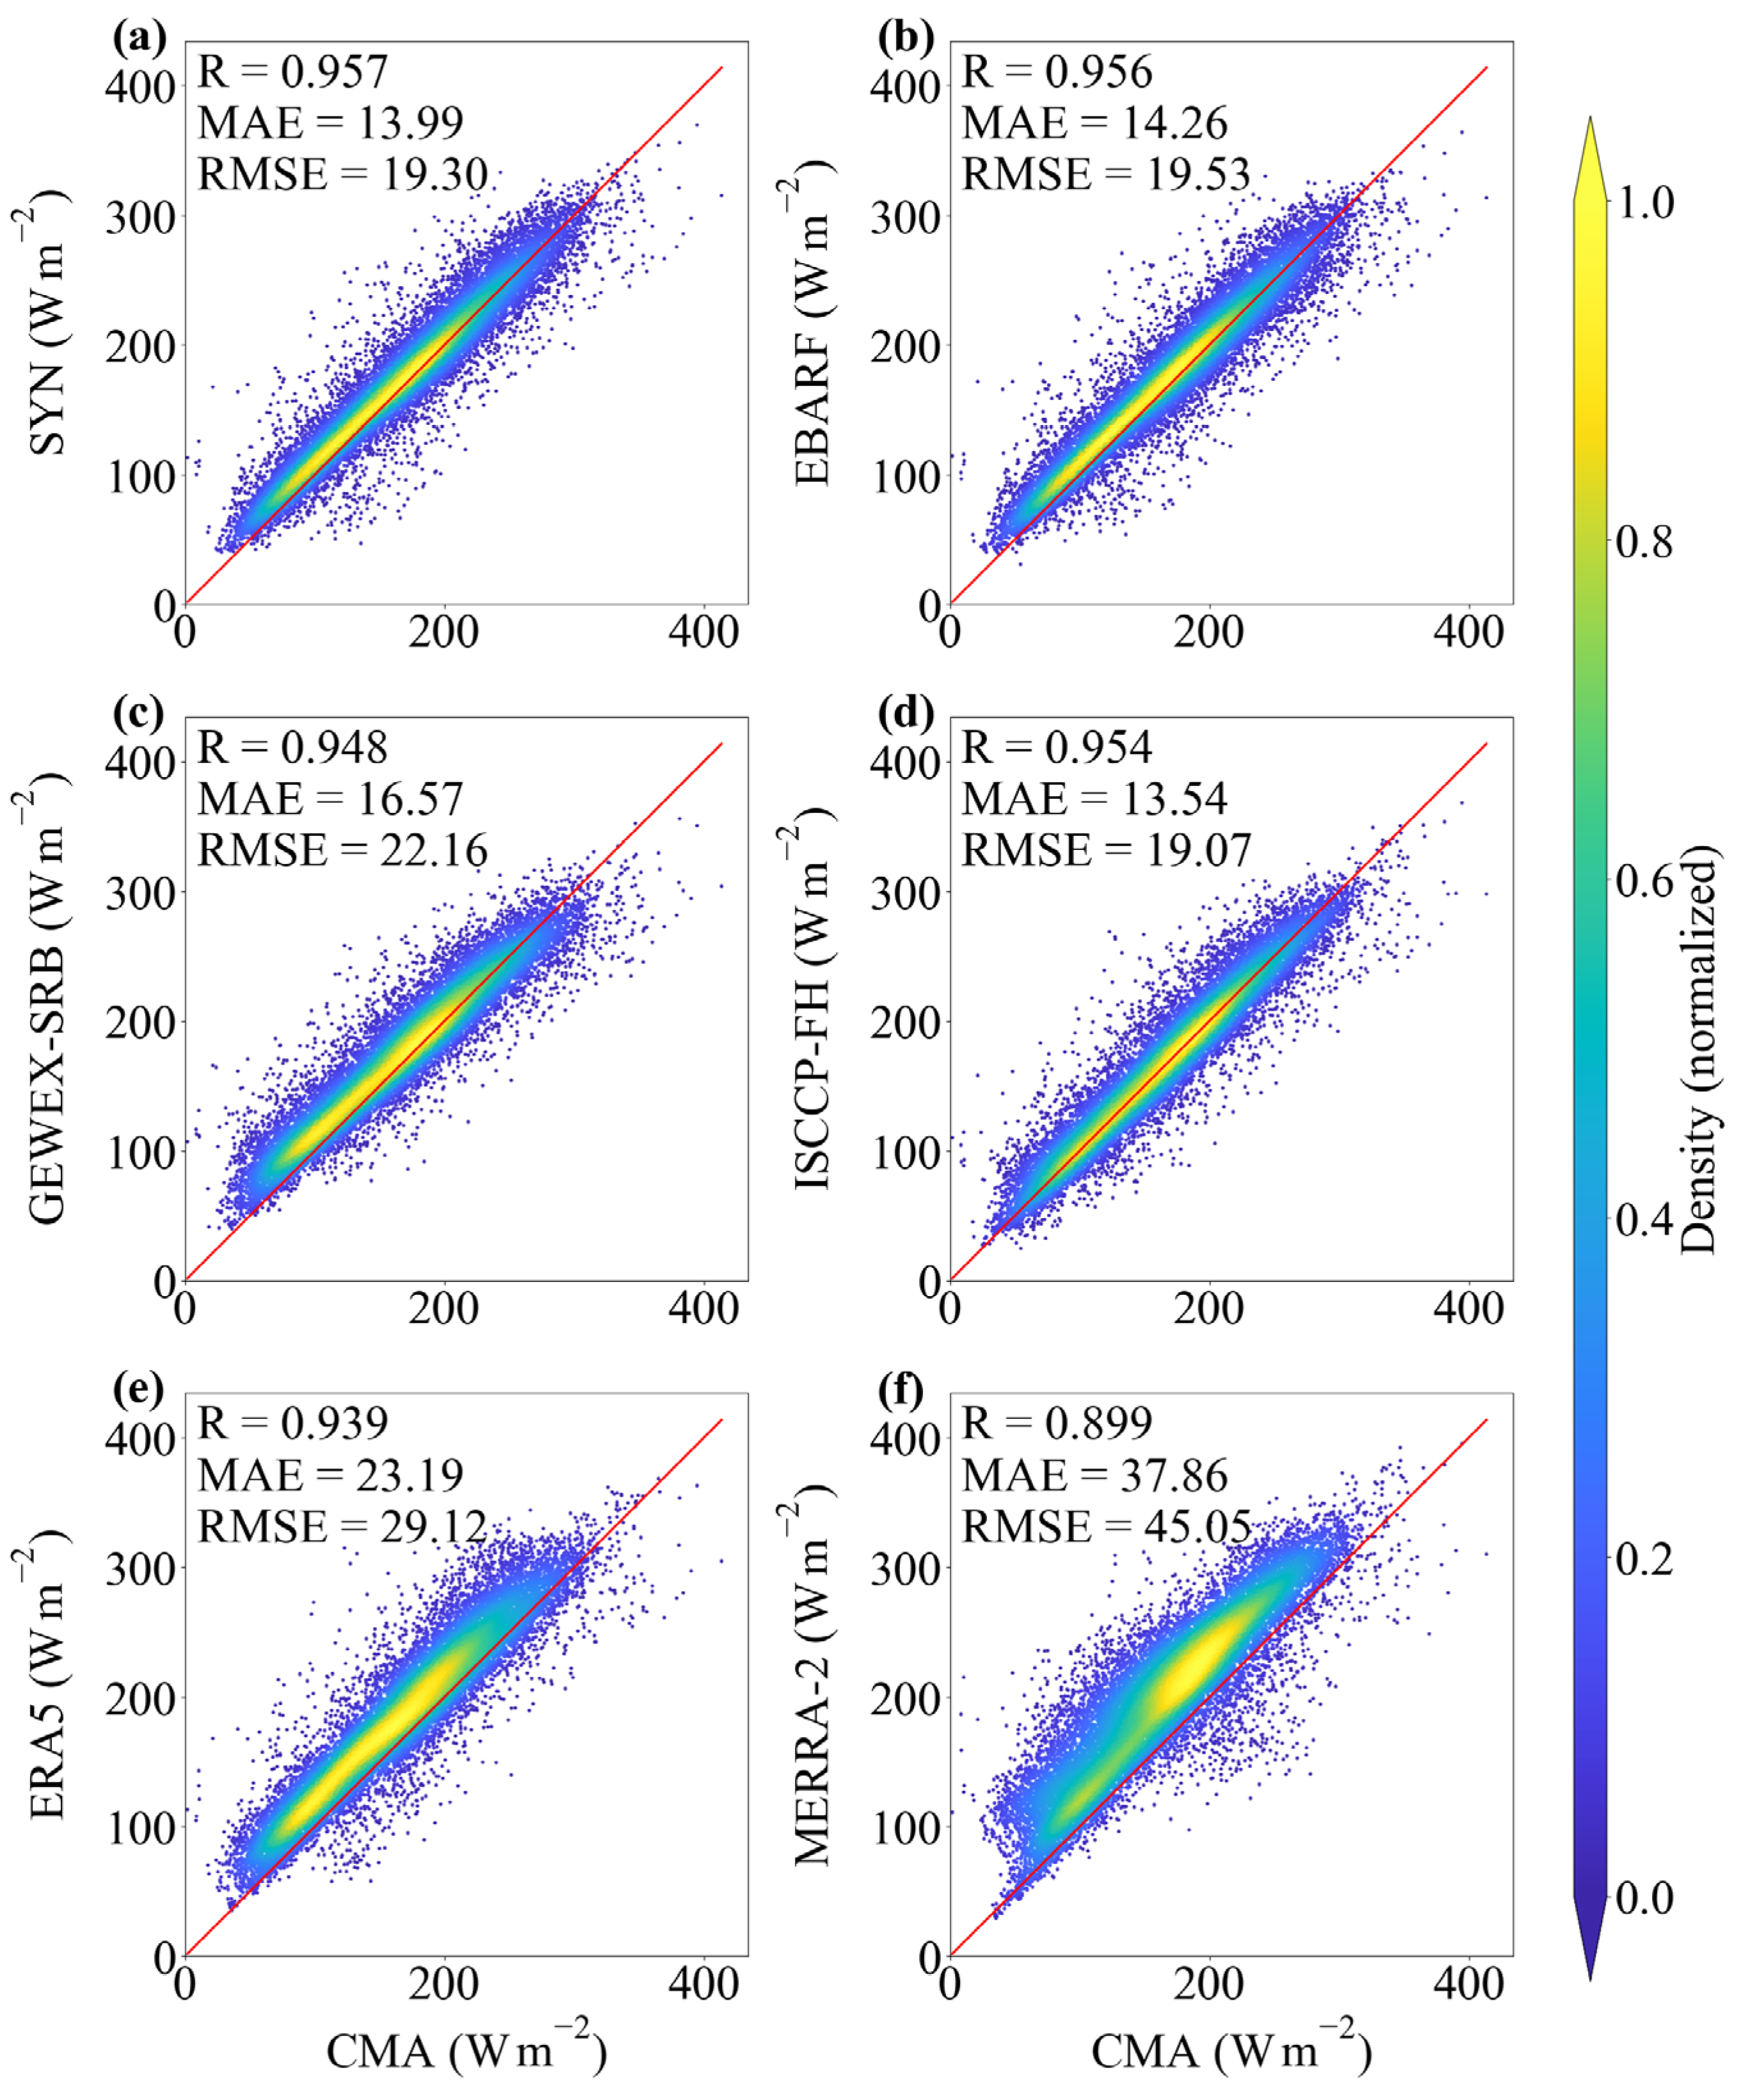
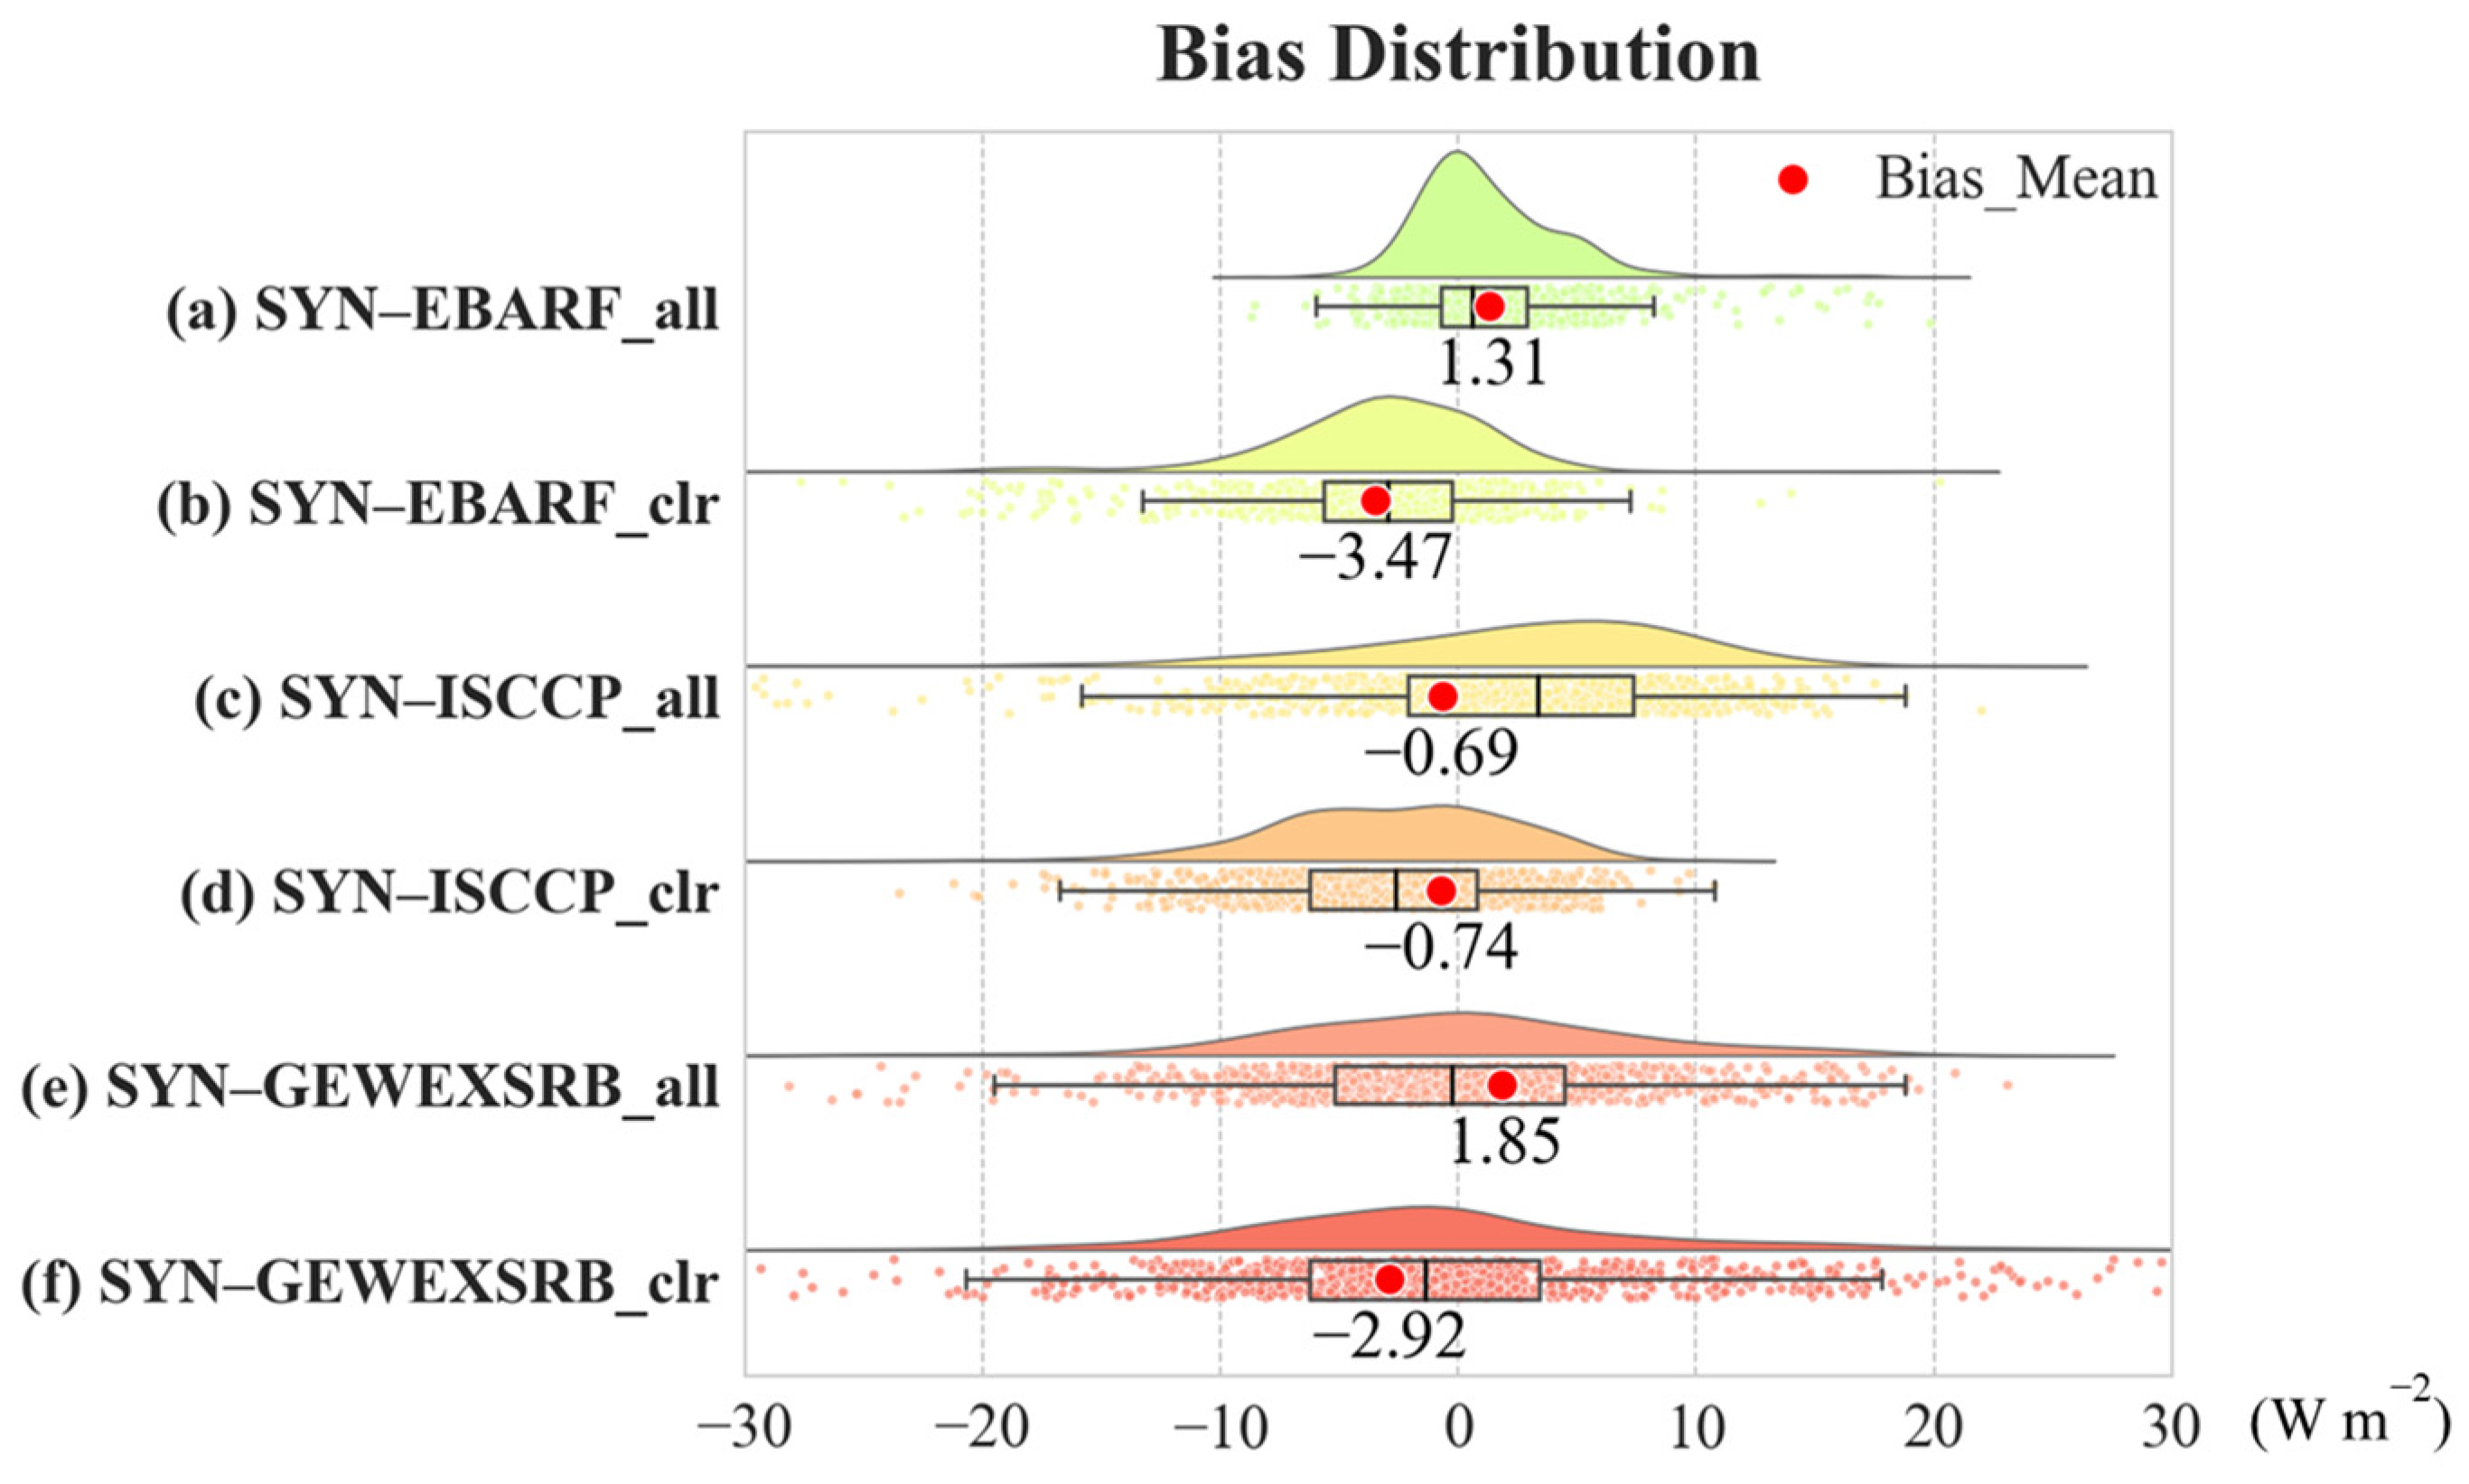
3.1. Validation of Satellite and Reanalysis Radiation

This study compares SSR results from three satellite datasets (CERES-EBAF, GEWEX-SRB, and ISCCP-FH) and two reanalysis datasets (ERA5 and MERRA-2) with monthly averaged surface radiation data from 99 CMA stations (March 2000 to June 2016) to assess the accuracy and applicability of CERES-SYN SSR data in China. To ensure precise comparisons, the satellite and reanalysis data corresponding to each CMA station were extracted by selecting the nearest grid point based on the station’s geographical coordinates (latitude and longitude) for all monthly data throughout the study period. Figure 1 illustrates the scatter density distribution for SSR between each dataset and the observation data, with a color gradient from deep blue to yellow representing normalized scatter density. The results show that CERES-SYN SSR strongly correlates with the observed SSR (R = 0.957), with relatively low errors (MAE = 13.99 W m−2, RMSE = 19.30 W m−2), suggesting the high reliability for analysis in China. The ISCCP-FH SSR also performs well, with slightly smaller errors (MAE = 13.54 W m−2, RMSE = 19.07 W m−2), but its correlation with the observation is marginally lower (R = 0.954). Both CERES-EBAF (R = 0.956) and GEWEX-SRB (R = 0.939) show a good correlation with the observation with higher biases as compared with CERES-SYN and ISCCP-FH. In contrast, ERA5 and MERRA-2 show more dispersed data points with larger deviations from the 1:1 line. Particularly, MERRA-2 exhibits notable discrepancies (R = 0.899, MAE = 37.86 W m−2, RMSE = 45.05 W m−2). Overall, satellite-derived radiation products align better with ground-based observations than reanalysis datasets, which often introduce biases from cloud and aerosol simulations [75]. Both ERA5 and MERRA-2 encounter challenges in simulating cloud properties and dynamics. ERA5 performs poorly in complex regions, and the temporal resolution and cloud parameterization limitations in MERRA-2 contribute to the discrepancies in radiation estimations [76,77]. Among these datasets, CERES-SYN stands out due to its more accurate cloud property inputs [78], and exhibits a close match with observational data and relatively low errors, which makes it a reliable choice for studying radiation changes over China.
To further investigate the differences between CERES-SYN and other satellite datasets, this study compares CERES-SYN with other datasets (CERES-EBAF, ISCCP-FH, GEWEX-SRB) for SSR from March 2000 to June 2016. The satellite datasets, each with a 1° × 1° spatial resolution and consistent latitude–longitude grid, were directly compared by matching the monthly data points for the entire study period to the corresponding grid points, under all-sky and clear-sky conditions, as presented in Figure 2.
The bias distributions for all datasets generally follow a normal pattern, with most biases centered around zero. Among these, CERES-EBAF shows an averaged bias of 1.31 W m−2 under all-sky conditions, but a larger negative bias of −3.47 W m−2 under clear-sky conditions, suggesting challenges in accurately estimating clear-sky radiation compared with CERES-SYN. The ISCCP-FH data exhibit smaller biases (−0.69 W m−2 for all-sky and −0.74 W m−2 for clear-sky), with stable error distribution near zero, indicating consistency with CERES-SYN. The GEWEX-SRB, by comparison, shows a mean bias of 1.85 W m−2 under all-sky conditions and a larger negative bias of −2.92 W m−2 under clear-sky conditions, which points to the systematic underestimations of clear-sky radiation relative to CERES-SYN. Despite of these differences, the overall bias distributions under both all-sky and clear-sky conditions show similar patterns. The consistent patterns suggest that factors beyond cloud properties, such as variations in data processing or retrieval algorithms, may be driving these discrepancies [28]. The differences in the algorithms used by each dataset are important in explaining these biases. CERES-EBAF, for instance, relies on a long-term radiation budget approach, which may face difficulties in capturing short-term variations in radiation as compared with CERES-SYN [56]. The cloud retrieval method of ISCCP-FH also has difficulty in accurately representing detailed cloud dynamics. The lower temporal resolution of GEWEX-SRB further limits its ability to capture diurnal cloud variability [59,63]. In contrast, CERES-SYN integrates MODIS cloud data from Terra and Aqua satellites along with the 3-hourly GEOS updates, and improves the accuracy in capturing diurnal cloud–radiation interactions, which enhances its stability and reliability for radiation studies in China [75,78]. In summary, the CERES-SYN product consistently shows relatively low bias and high accuracy in radiation estimation, and it is deemed reliable for the spatiotemporal analysis of radiative fluxes over China.

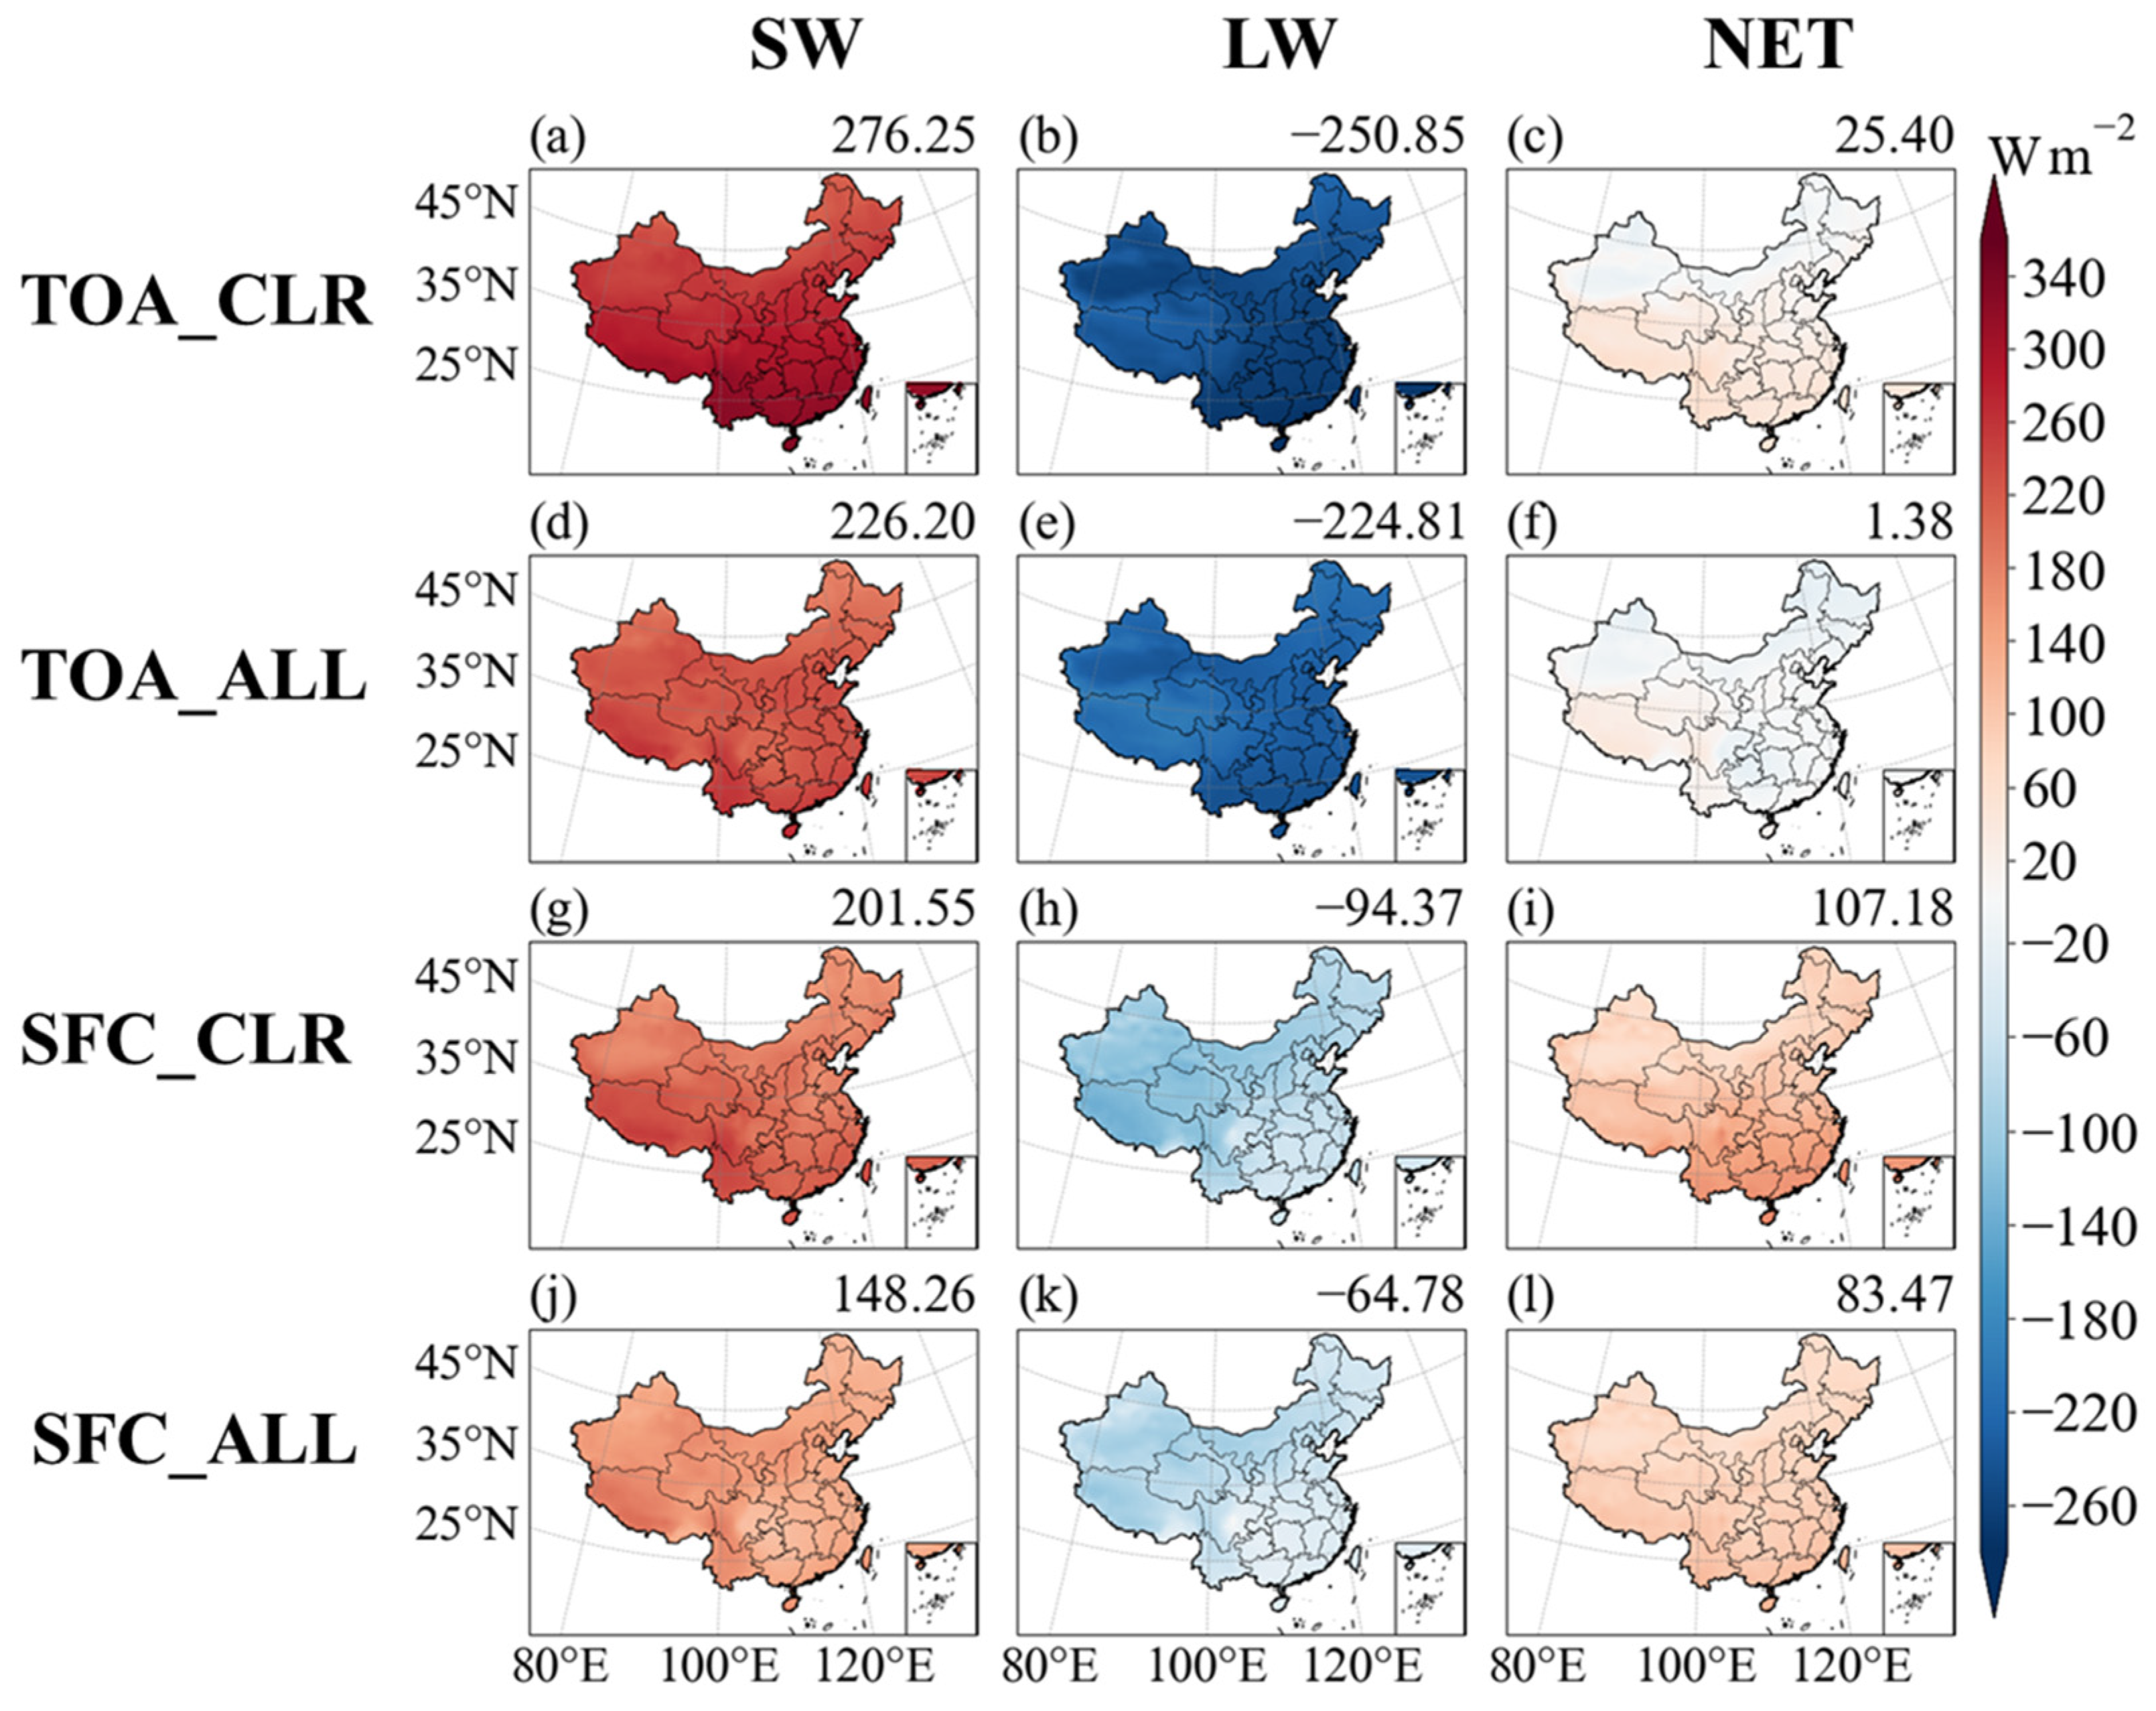
3.2. Radiative Flux Variations in China

This study analyzes the spatial distribution characteristics of radiative flux at the top of atmosphere (TOA) and surface (SFC) over China under clear-sky and all-sky conditions from March 2000 to February 2023, based on the CERES-SYN dataset (Figure 3). The results show that under all conditions, shortwave (SW) radiation remains positive, indicating that incoming SW radiation exceeds the outgoing radiation, and varies across different latitudes. At the TOA under clear- and all-sky conditions, SW radiation decreases with increasing latitude, which is primarily influenced by changes in the solar zenith angle [79]. In China to the south of 35°N, the clear- and all-sky SW radiative fluxes are 40.86 and 12.08 W m−2 higher than those in the north of 35°N, respectively, suggesting that clouds have a more significant impact on SW radiation in southern regions [30]. Similarly, SW radiation at the SFC also decreases with latitude and is generally lower than that at the TOA. For example, the clear- and all-sky SW radiative flux at the SFC to the south of 35°N are higher than those to the north of 35°N by 33.33 and 1.96 W m−2, respectively. However, these values are lower than those at the TOA by 7.53 and 10.12 W m−2, which suggests that atmospheric components, particularly clouds and aerosols, suppress SW radiation reaching the surface [30].
Longwave (LW) radiation is negative at the TOA and SFC, which means the LW radiation is outgoing. Under clear- and all-sky conditions at the TOA, the LW radiative flux is stronger in southern and eastern China, with the lowest absolute values found in the Tibetan Plateau (−237.55 and −209.32 W m−2). This is mainly due to the complex topography [80], lower surface temperature, reduced water vapor [81], and cloud cover [82]. Under clear- and all-sky conditions at the SFC, the LW radiative flux in the Tibetan Plateau (−118.55 and −79.35 W m−2) have differences of −119 and −129.97 W m−2 as compared with the TOA counterparts, respectively. This indicates that the atmospheric components, especially clouds, strongly modulate the LW radiation [82]. Additionally, to the south of 35°N, the LW radiative fluxes under clear- and all-sky conditions at the SFC differ remarkably from the TOA values, with values of −199.14 and −198.19 W m−2, suggesting large impacts of atmospheric components on LW radiation.
The NET radiation exhibits regional variations due to the combined influence of SW and LW radiation. Under the clear-sky condition at the TOA, most areas show positive values, while northern regions such as Inner Mongolia and Xinjiang display negative values. This is primarily due to their higher latitudes which results in lower SW radiation than the LW outgoing radiation. Over the Tibetan Plateau, the NET radiation under all-sky condition at the TOA is slightly lower than that under clear-sky. In regions south of 35°N and east of 100°E (southern China), the TOA all-sky NET radiation is significantly lower than that under clear-sky, indicating that cloud notably alters the spatial distribution of NET radiation by influencing SW radiation. Under clear- and all-sky conditions at the SFC, the NET radiation is primarily driven by SW radiation, showing distinct regional differences as compared with those at the TOA. This further underscores the significant impact of atmospheric components, such as aerosols and clouds, on NET radiation distribution.

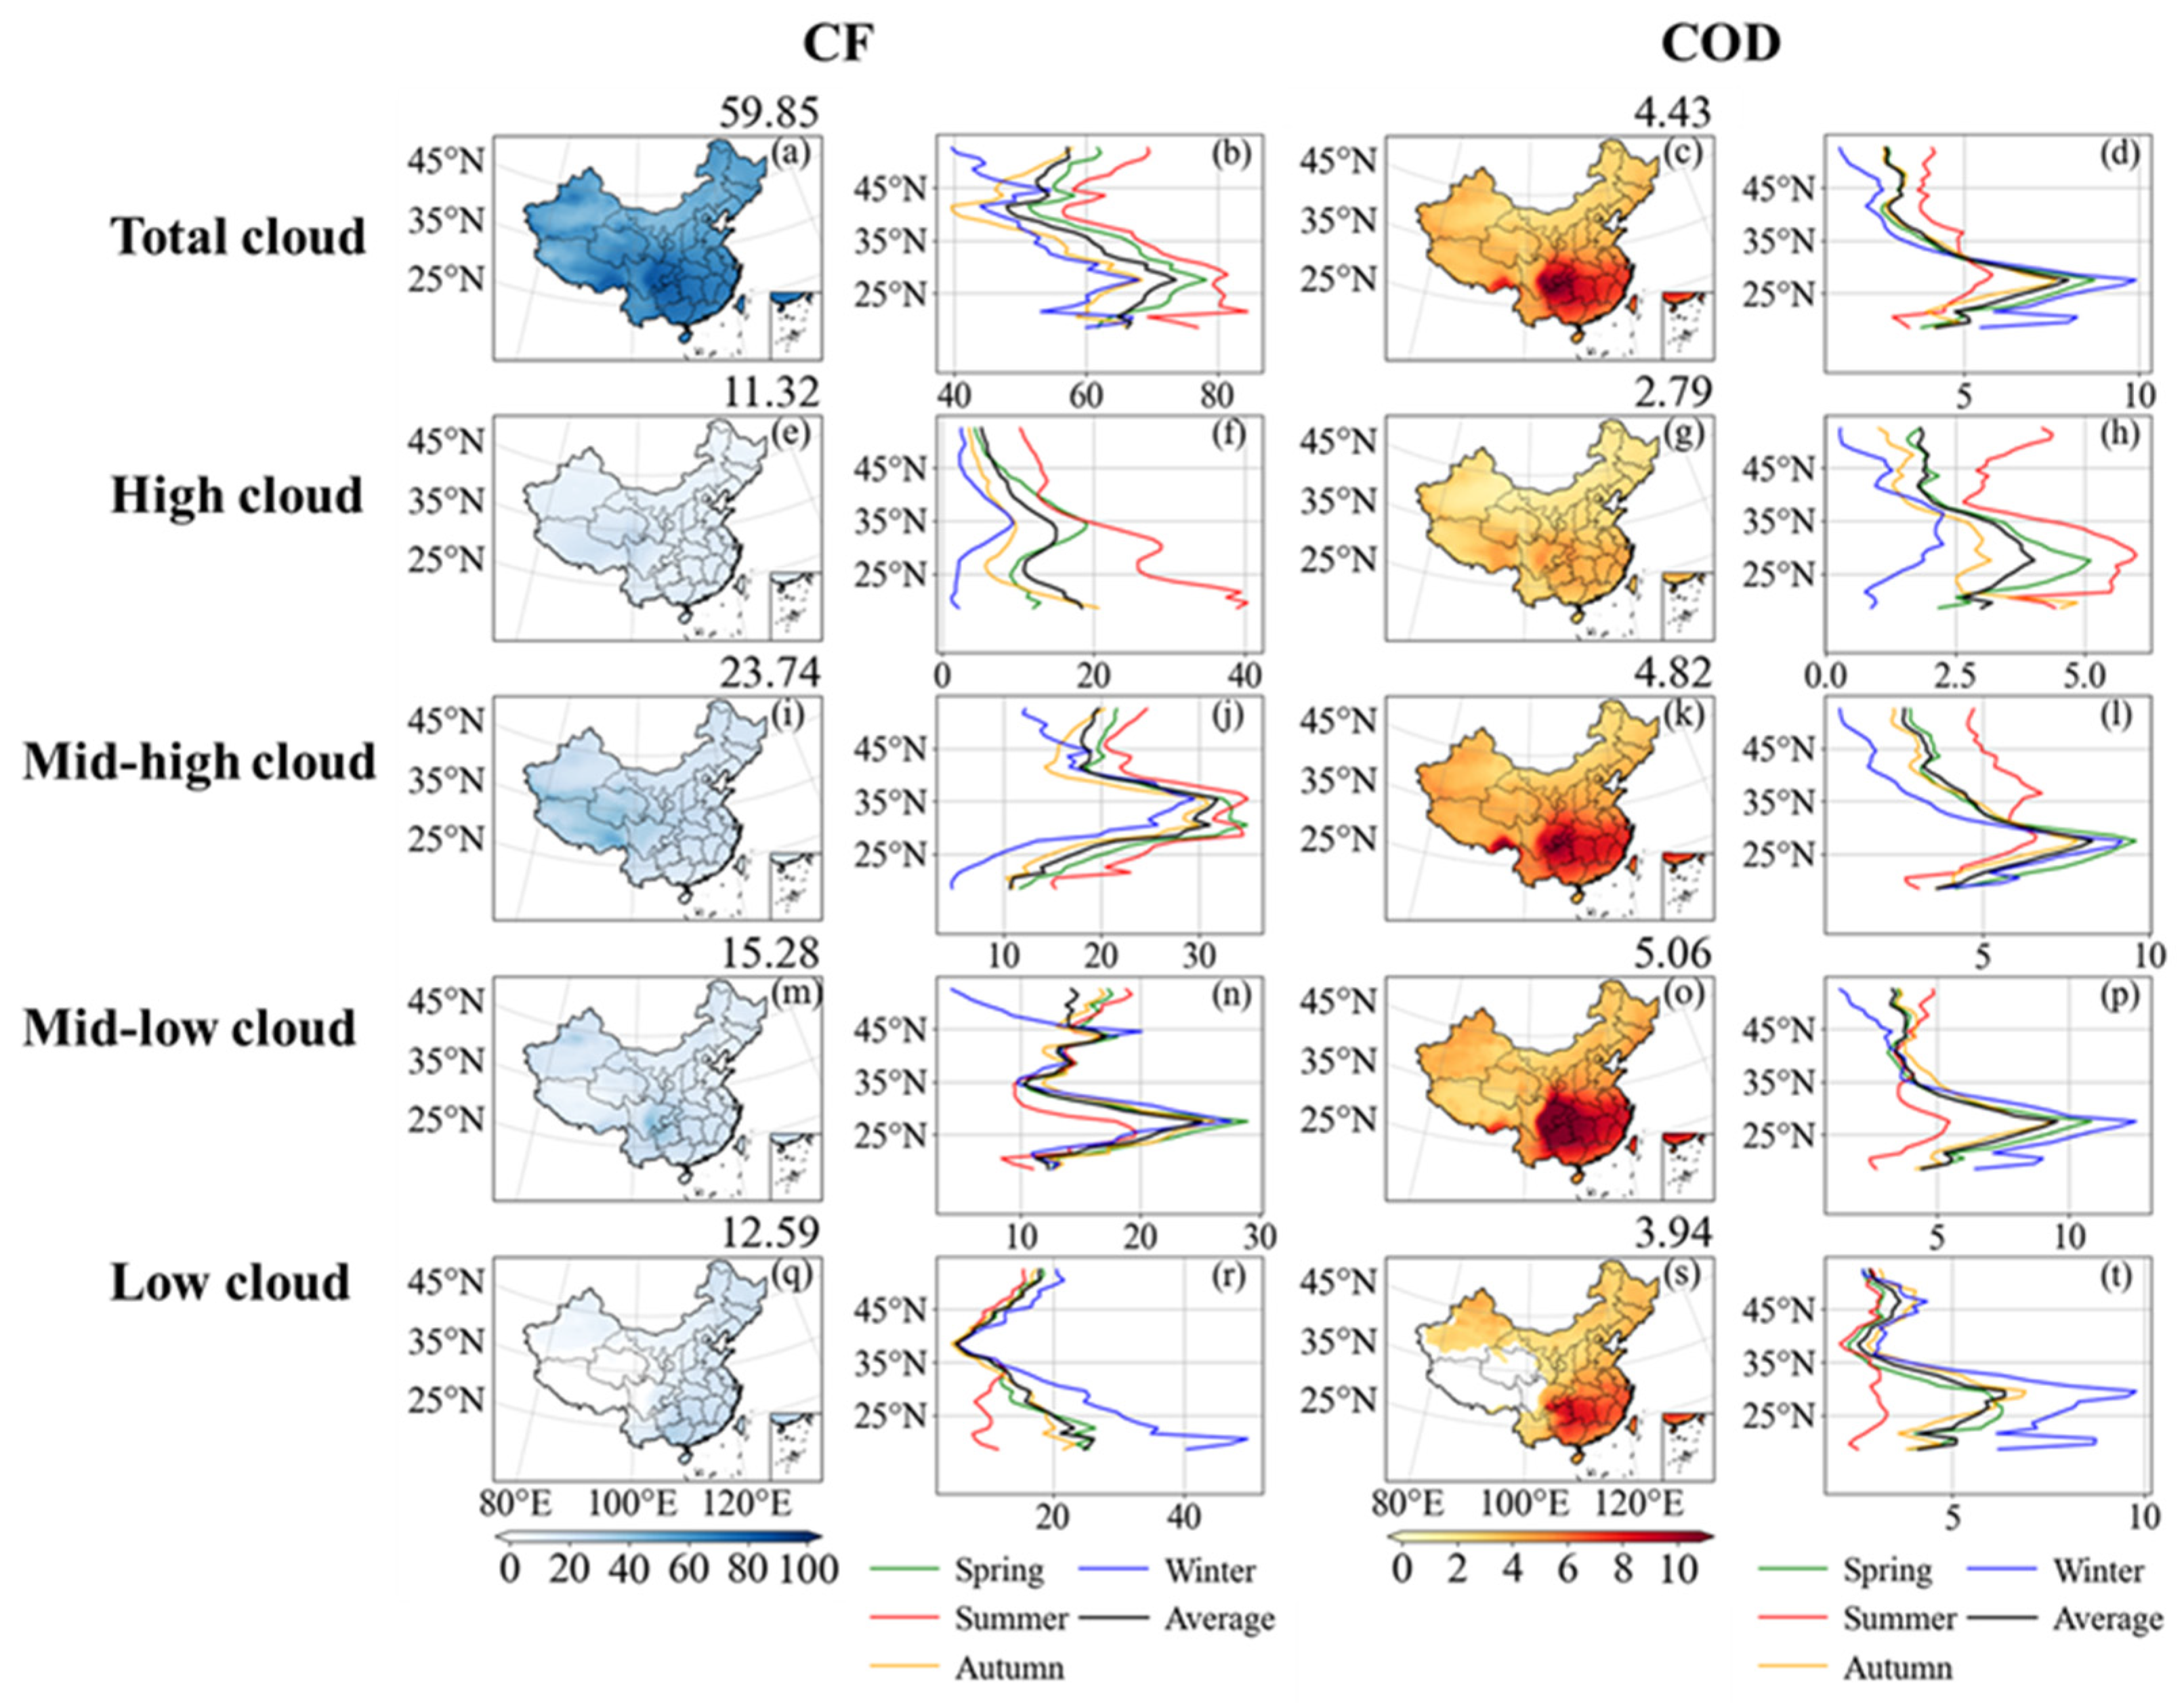
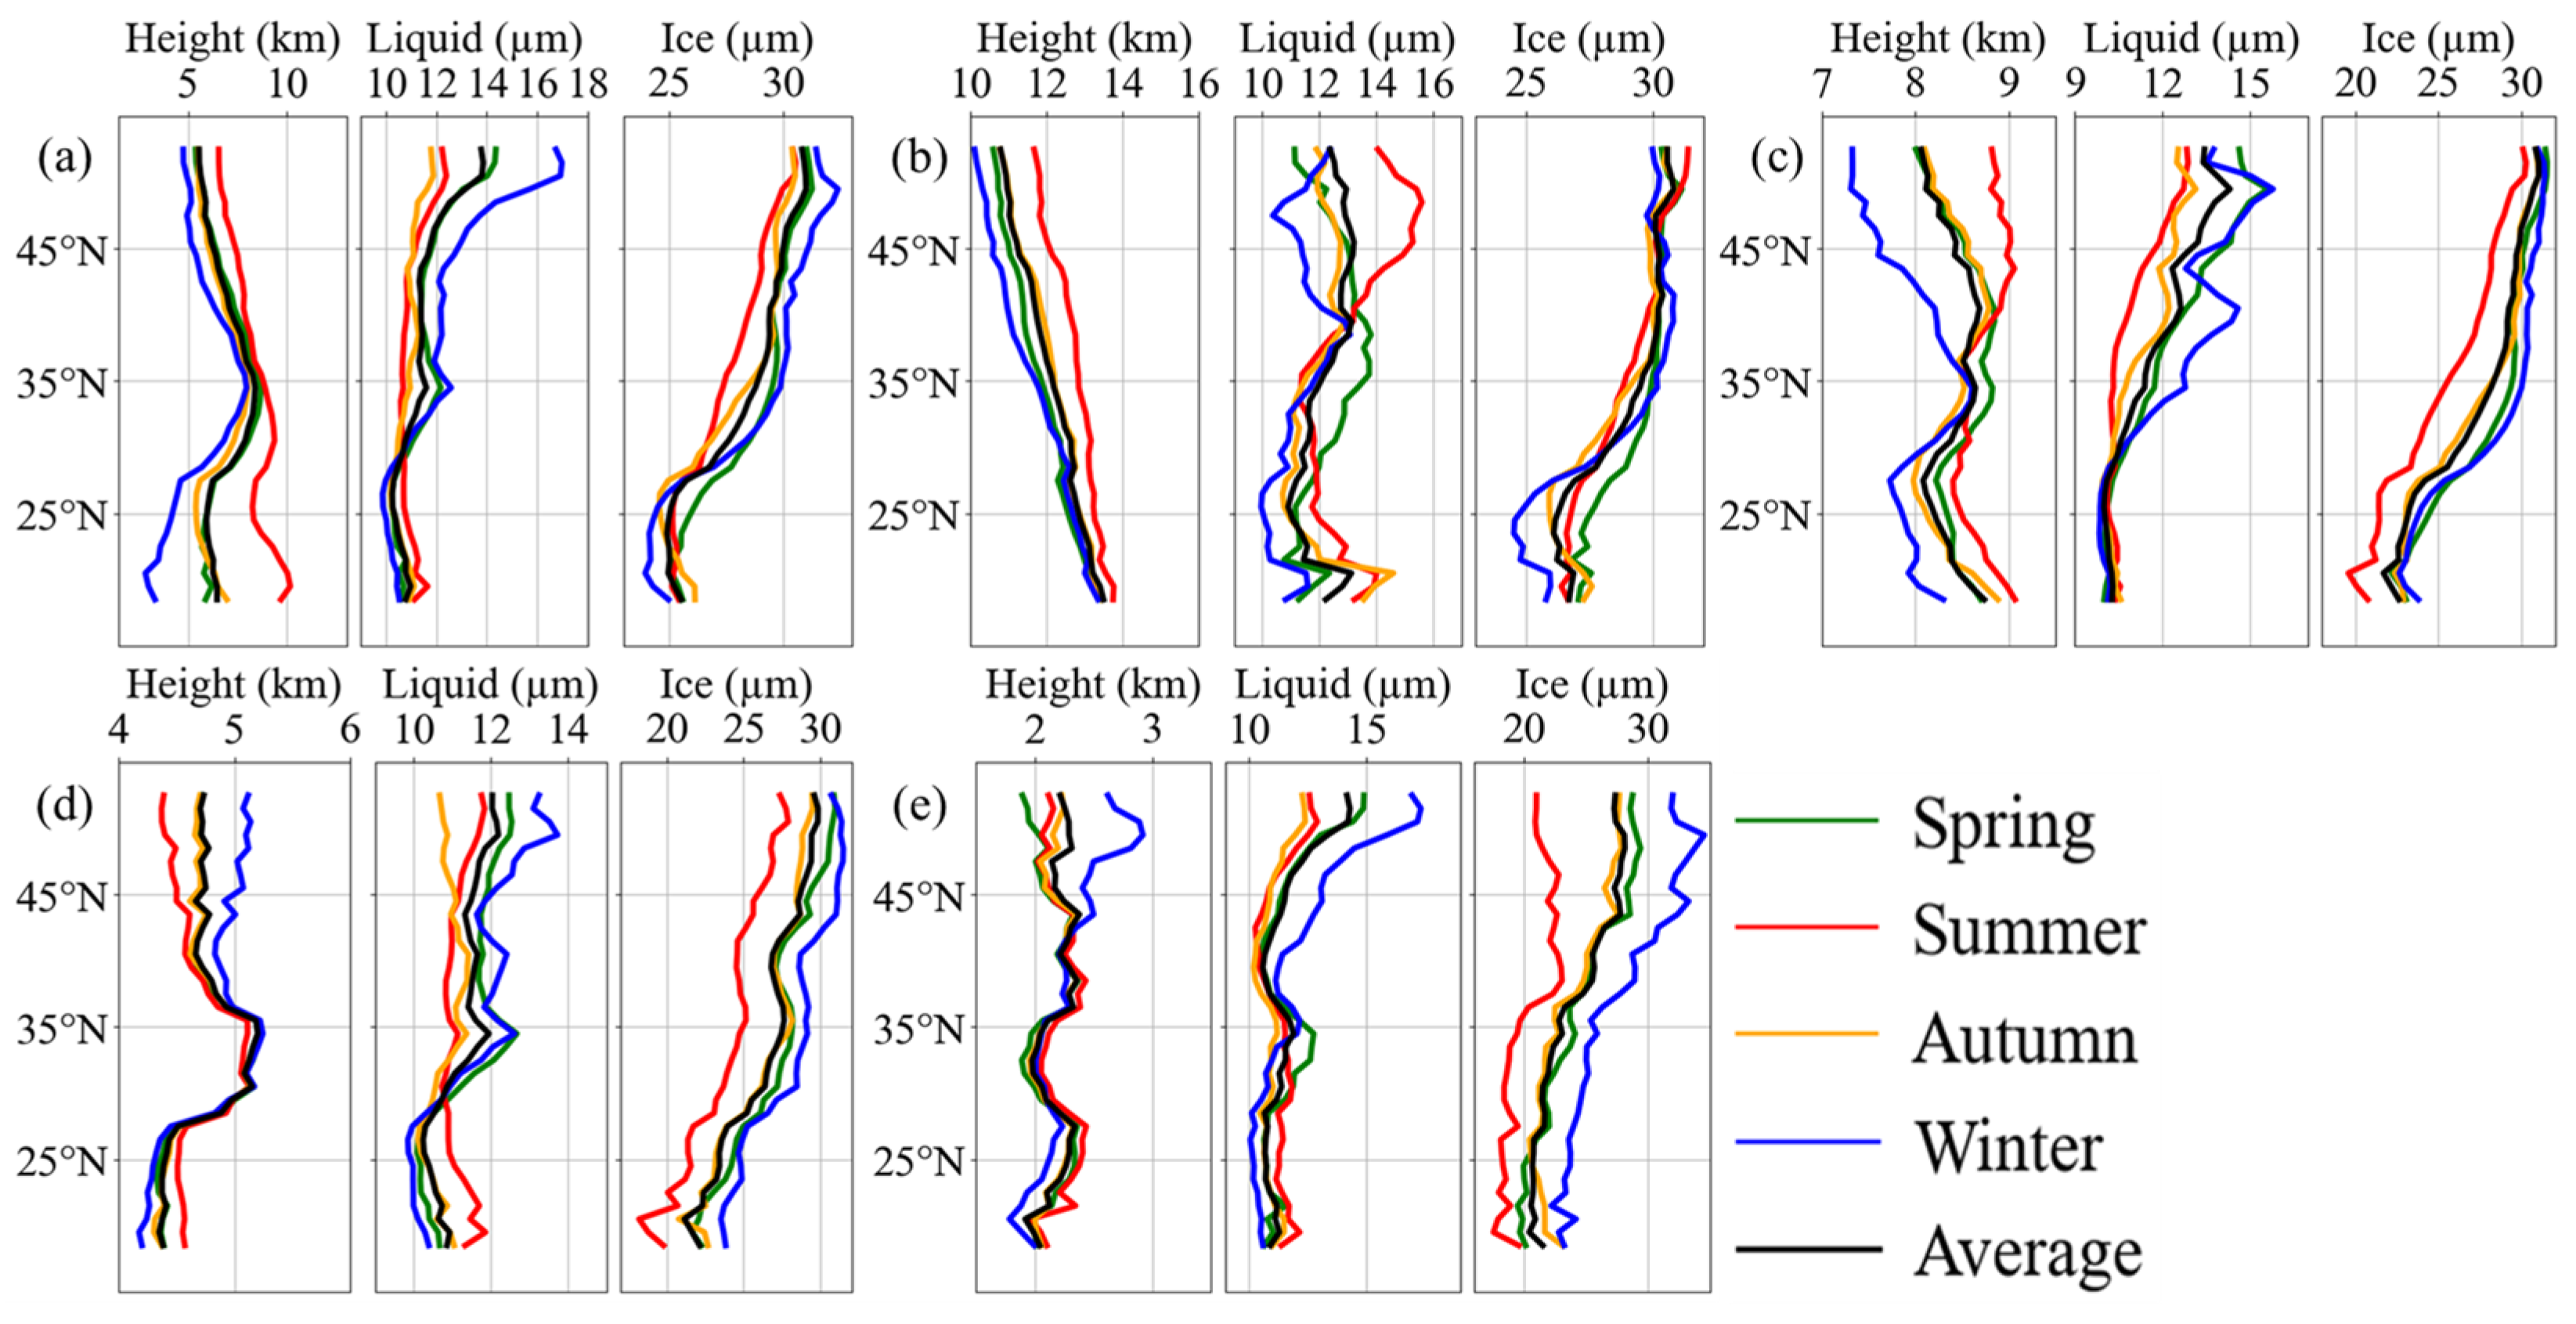
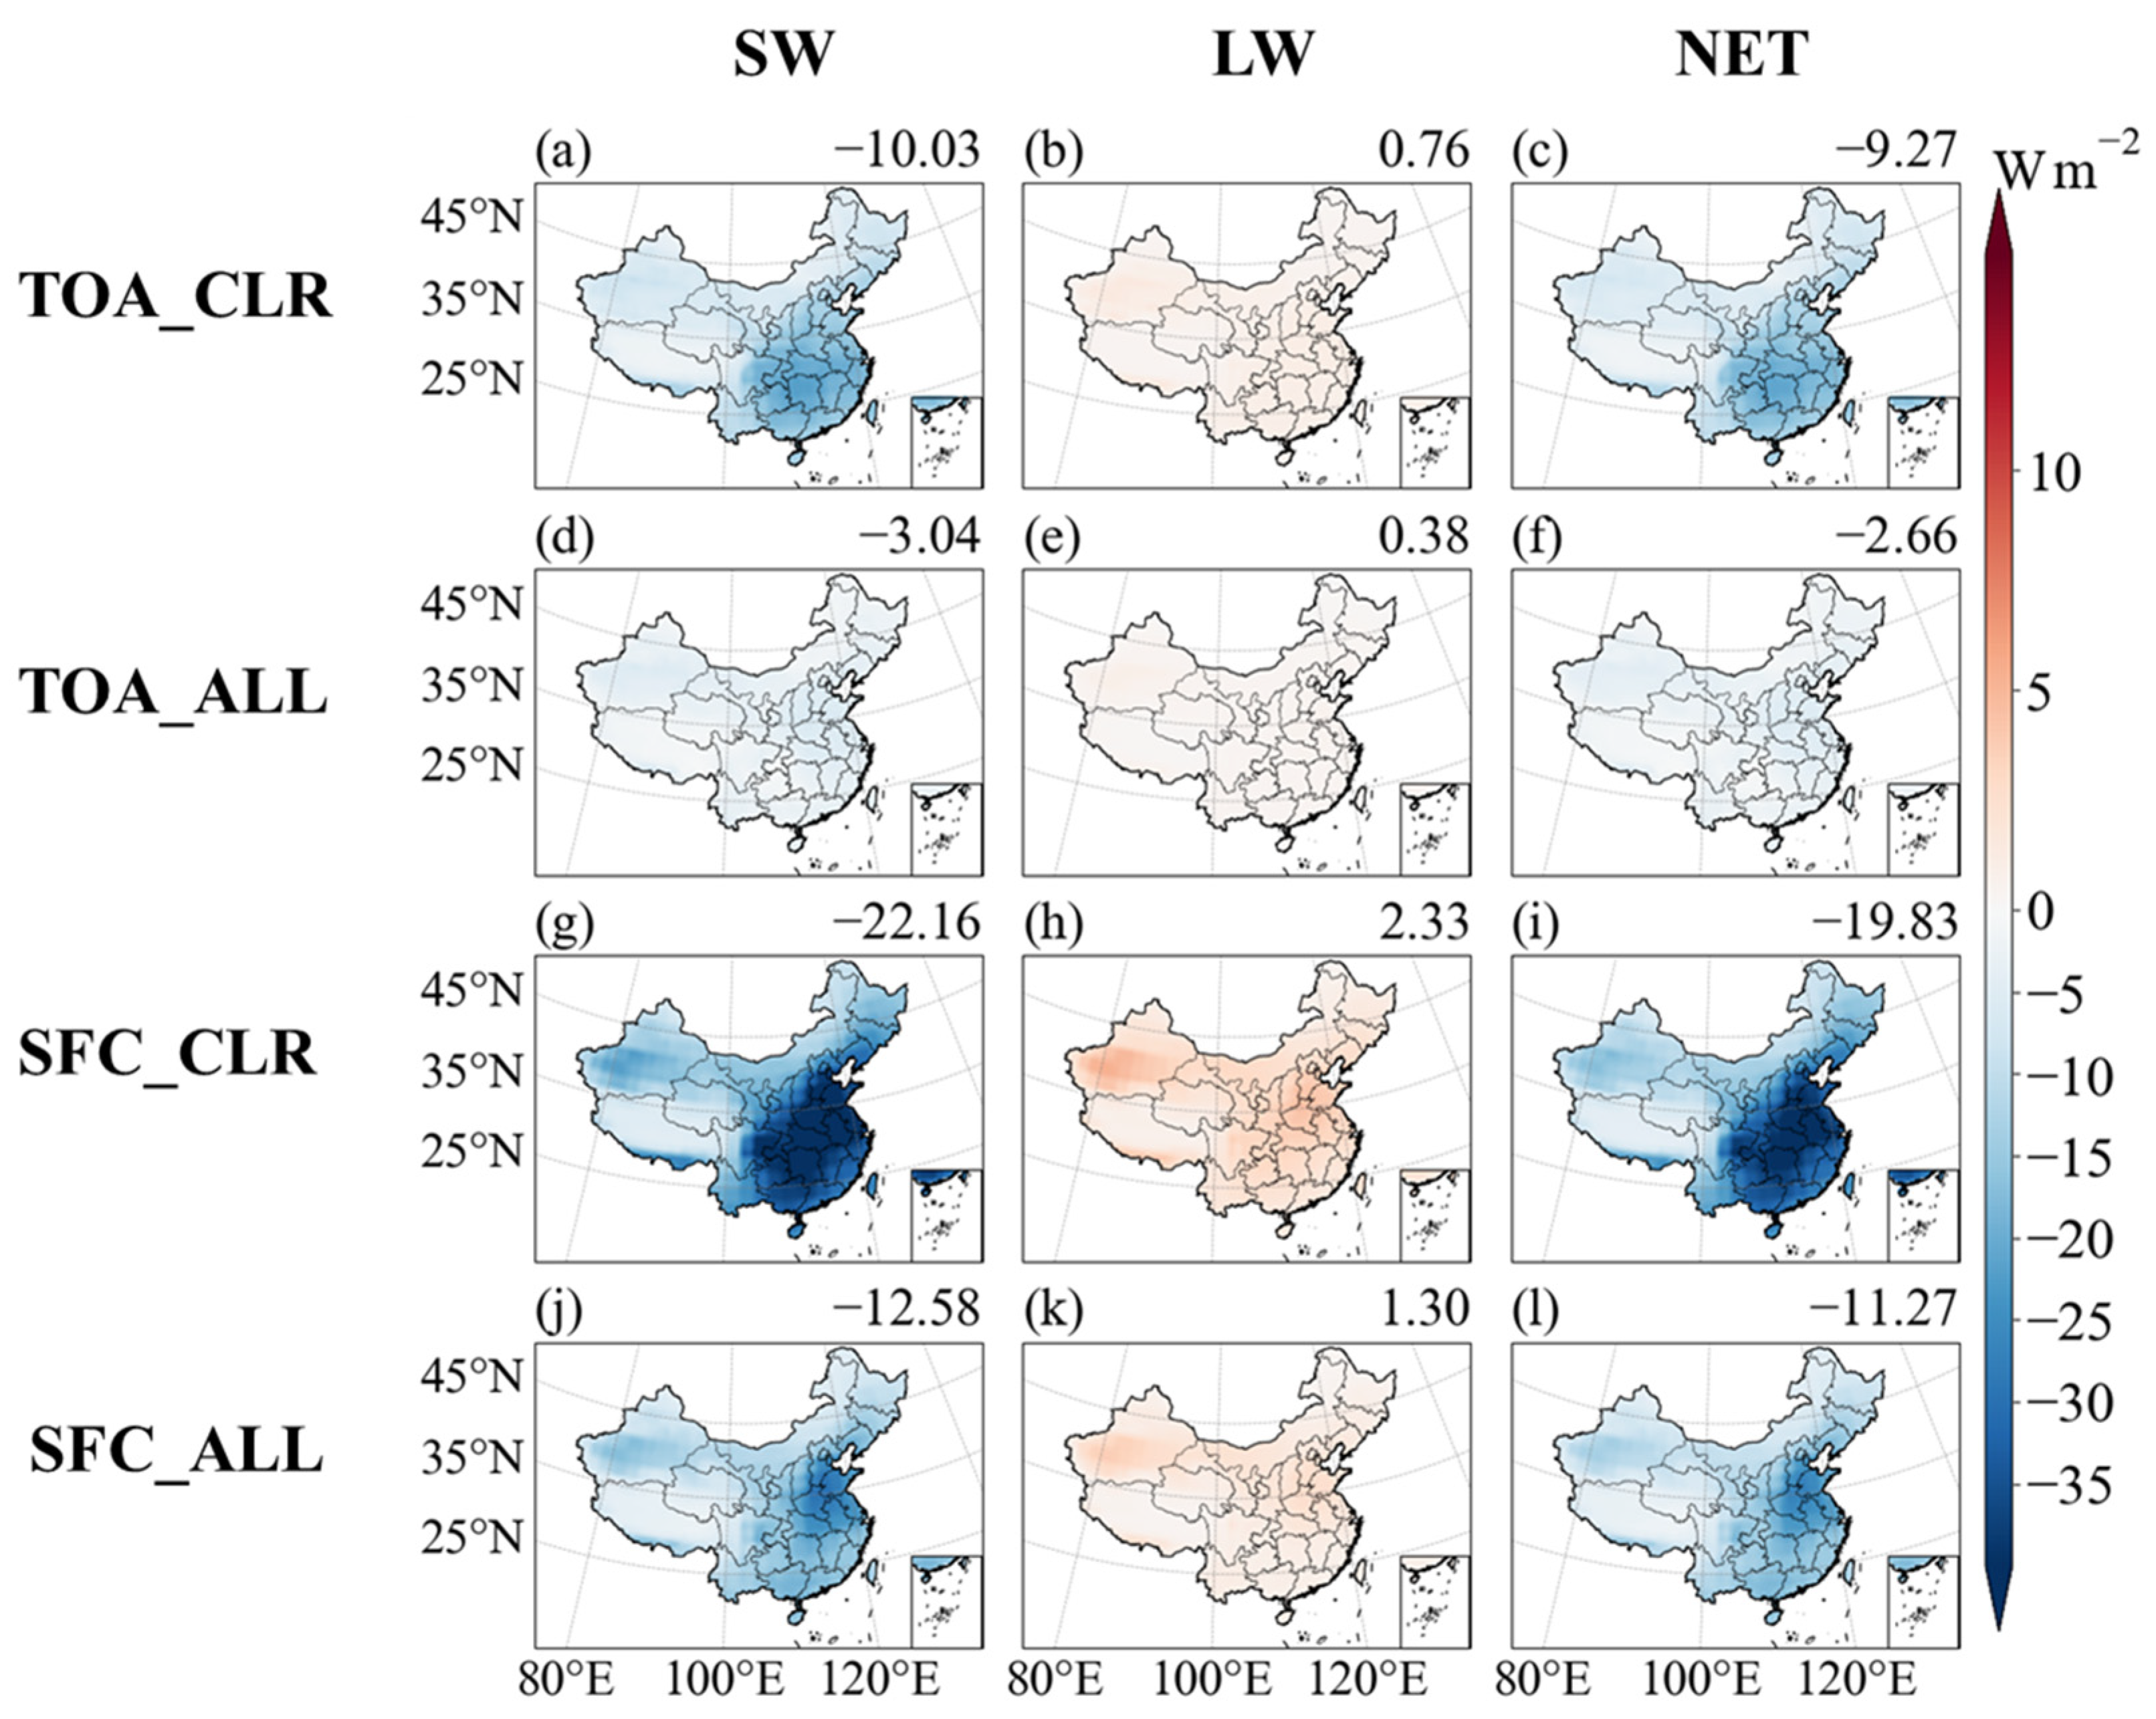
3.3. Cloud Radiative Effects and Cloud Characteristics in China

To analyze the impact of clouds on radiation over China, this study calculates the shortwave, longwave, and net cloud radiative effects at the top of atmosphere, atmosphere (ATM), and surface using CERES SYN Ed4 data (Figure 4). The results indicate that clouds exert a net cooling effect at both TOA and SFC, which weaken with increasing latitude. In the regions south of 35°N and east of 100°E (southern China), the spatial distributions of SW CRE at the SFC and TOA are similar, with values of −75.88 and −77.19 W m−2, respectively. Over the Tibetan Plateau, the SW CREs are relatively strong, with values of −47.87 W m−2 at the TOA and −55.93 W m−2 at the SFC. Whereas, regions such as Xinjiang and Inner Mongolia exhibit weaker cloud cooling effects, with the TOA and SFC SW CRE values being −27.53 and −29.03 W m−2, respectively. For both TOA and SFC, clouds contribute to a LW heating effect, similar to the spatial distribution of SW CRE outside the Tibetan Plateau. In southern China, the LW CRE is stronger than that in northern regions, with the TOA and SFC differences being 6.68 and 4.25 W m−2, respectively. Over the Tibetan Plateau, SFC LW CRE exceeds TOA LW CRE by 10.98 W m−2. The NET CRE at the TOA and SFC is primarily driven by SW radiation, weakening the cooling effect toward higher latitudes. In the atmosphere (ATM), ATM SW CRE is weak across all regions, showing a slight heating effect. In contrast, ATM LW CRE contributes to cooling in most areas, with the strongest effect being over the Tibetan Plateau (−10.98 W m−2). The combined ATM NET CRE leads to a weak heating effect in southern China (2.26 W m−2) but a slight cooling effect (ranging from 0 to −3 W m−2) across most other regions. Overall, clouds predominantly modulate radiation at the TOA and SFC through shortwave processes. The spatial pattern of CRE across China is highly heterogeneous and is primarily determined by regional cloud distributions. To further elucidate these regional differences, this study also examines the cloud properties across China.
Figure 5 presents the spatial distribution and variations of cloud cover fraction (CF) and cloud optical depth (COD), which characterize the ability of cloud to attenuate, scatter, and absorb radiation, for total cloud (TC), high cloud (HC), middle-high cloud (mid-HC), middle-low cloud (mid-LC), and low cloud (LC) based on the CERES-SYN Ed4 product during the study period. Note the TC layer is the average of the 4 separate layers (HC, mid-HC, mid-LC, and LC) which is weighted by cloud fraction and log optical depth, as depicted in the CERES SYN product description [55]. The results indicate that the spatial distributions of TC_CF (Figure 5a) and TC_COD (Figure 5c) exhibit similar spatial distribution patterns in that they both decreases with increasing latitude. The total CF and COD are notably higher in southern China, where TC_CF exceeds 70% and TC_COD is greater than 5. The spatial distributions of CF show that TC_CF reaches its highest value of 86.56% in the Sichuan-Chongqing-Guizhou region.In the same region, mid-LC_CF (Figure 5m) and LC_CF (Figure 5q) show high values, with a maximum of 44.77% and 31.44%, respectively. This suggests that variations in TC_CF in this area are strongly influenced by mid-LC and LC cloud cover. Over the Tibetan Plateau, TC_CF is 59.36%, while mid-HC_CF (Figure 5i) reaches 23.55%, and mid-LC and HC_CF (Figure 5e) both exceed 10%, indicating that mid-HC cloud coverage strongly affects TC_CF in this region.
Similarly, TC_COD peaks at 12.17 in the Sichuan-Chongqing-Guizhou region. In this area, the maximum values for mid-HC_COD (Figure 5k), mid-LC_COD (Figure 5o), and LC_COD (Figure 5s) are 11.17, 15.40, and 8.93, respectively, highlighting mid-HC and mid-LC as the primary contributors to TC_COD. Additionally, TC_COD remains relatively high over the Tibetan Plateau, with a value of 4.31, while mid-HC_COD and mid-LC_COD reach 4.93 and 3.85, respectively, indicating that mid-HC clouds play a dominant role in influencing TC_COD in this region. In summary, mid-HC and mid-LC clouds significantly impact TC_CF and TC_COD, particularly in the Sichuan-Chongqing-Guizhou region and the Tibetan Plateau.
To further analyze the variations in CF and COD across China, their latitudinal and seasonal variations are examined (Figure 5). The results indicate that TC_CF is higher to the south of 35°N than to the north of 35°N (Figure 5b) and reaches its maximum near 29.5°N. The CF is notably higher in summer and spring than in other seasons. The HC_CF generally decreases with increasing latitude (Figure 5f), forming a “Z” shape between 25°N and 35°N, where CF remains below 30%. A local minimum is observed near 28.5°N, with the summer CF being notably higher than those in other seasons. Mid-HC_CF follows an inverted “S” shape between 25°N and 35°N (Figure 5j), with values greater than 30%, and peaks slightly around 29.5°N in summer and autumn. The Mid-LC_CF decreases near 35°N but forms a counterclockwise “V” shape south of it (Figure 5n), reaching a maximum near 29.5°N. The CF in spring and winter is higher than those in other seasons. The LC_CF increases with latitude north of 35°N (Figure 5r), but decreases with latitude south of 35°N, which shows a minimum at 38.5°N. To the south of 35°N, the winter CF is higher than those in other seasons. Overall, TC_CF to the north of 35°N is mainly influenced by mid-HC and mid-LC clouds, while to the south of 35°N, it is jointly influenced by HC, mid-HC, and mid-LC, with higher CF of mid-HC playing a key role in seasonal variations, especially in summer. The latitudinal distribution of COD differs slightly from CF. The TC_COD decreases with latitude to the north of 35°N (Figure 5d), while to the south of 35°N, it forms a “V” shape with a peak at 28.5°N, where COD reaches the maximum in winter and the minimum in summer. The Mid-HC, mid-LC, and LC display similar COD patterns (Figure 5l,p,t). The HC variation is stable (Figure 5h), with the highest COD being in summer and the lowest being in winter. To the north of 35°N, LC_COD peaks in winter, while other cloud types reach their maximum in summer. Both TC_COD and mid-HC_COD decrease with latitude to the north of 35°N. The HC_COD also generally decreases with latitude, except that it increases to the north of 45°N in summer. Overall, TC_COD is primarily influenced by HC and mid-HC clouds to the north of 35°N, while to the south of 35°N, it is mainly affected by mid-HC, mid-LC, and LC.
To further examine the impact of cloud properties on radiation, this study analyzes the distribution of cloud top height, water particle radius, and ice particle radius across different latitudes and seasons (Figure 6). The results show that TC cloud top height typically ranges from 5 to 10 km (Figure 6a). To the north of 35°N, cloud top height decreases with latitude, whereas to the south of 35°N, it drops sharply with decreasing latitude and then declines more steadily. The HC cloud top height ranges from 10 to 14 km (Figure 6b) and decreases with increasing latitude. The Mid-HC and mid-LC cloud top heights range from 7 to 9 km and from 4 to 6 km, respectively (Figure 6c,d), following a distribution similar to TC. However, the cloud top height of LC shows an opposite trend between 25°N and 35°N compared with the other regions. Seasonal patterns for HC and mid-HC cloud top height resemble to TC, with maximum heights in summer and minimum heights in winter. In contrast, mid-LC and LC exhibit different seasonal variations, with the highest cloud tops occurring in winter to the north of 35°N and in summer to the south of 28°N.
The water and ice particle radii show a general decrease with increasing latitude. Water particle radius of TC ranges from 10 to 17.5 μm, with a maximum in winter to the north of 32°N and a minimum in summer. To the south of 32°N, the maximum occurs in summer and the minimum in winter. A similar trend is observed for mid-HC, mid-LC, and LC, with radius ranges of 9.5–15.5 μm, 9.5–14 μm, and 10–15.5 μm, respectively. Water particle radius distribution of HC is similar to other clouds, but to the north of 40°N, particularly in summer, the radius reaches 13–16 μm, which indicates that high moisture levels in summer likely promote HC formation in northern China. The latitudinal distribution of ice particle radius follows a similar distribution to water particle radius, with smaller particles in the south and larger particles in the north. Ice particle radius of TC ranges from 24 to 34 μm, showing a maximum in winter and minimum in summer to the north of 32°N, while to the south of 32°N, it peaks in spring and is lowest in winter. The ice particle radius of the HC distribution mirrors that of TC, indicating that HC significantly influences the distribution of the ice particle radius of TC. For mid-HC, mid-LC, and LC, the ice particle radius decreases with cloud top height and follows a pattern of maximum values in winter and minimum values in summer. In conclusion, TC cloud top height is primarily influenced by mid-HC and mid-LC clouds, the water particle radius is influenced by mid-HC, mid-LC, and LC clouds, and the ice particle radius is mainly determined by HC clouds.
Based on the analysis of cloud properties across China and the spatial variations in CRE, it is evident that the distribution of CRE at the TOA, ATM, and SFC is closely linked to cloud property attributes. The results indicate that cloud exerts a net cooling effect (primarily influenced by SW radiation) at both TOA and SFC, which diminishes with increasing latitude and is also closely related to the spatial distribution of cloud properties. In southern China, the cooling effect is most pronounced, primarily due to the high CF and COD of mid-HC and mid-LC clouds, as well as the smaller water and ice particle radius that enhance radiation scattering. Regions such as Xinjiang and Inner Mongolia experience weaker cooling effects, attributable to lower CF, smaller COD, and larger particle radius, which reduce scattering. Over the Tibetan Plateau, the CRE remains with relatively strong cooling, which is driven by the high CF and COD of mid-HC clouds. In summary, the spatial variations in CRE across China are primarily influenced by cloud properties, with high CF and COD in mid-HC and mid-LC clouds contributing to the CRE in southern China, and mid-HC clouds leading to the CRE over the Tibetan Plateau.

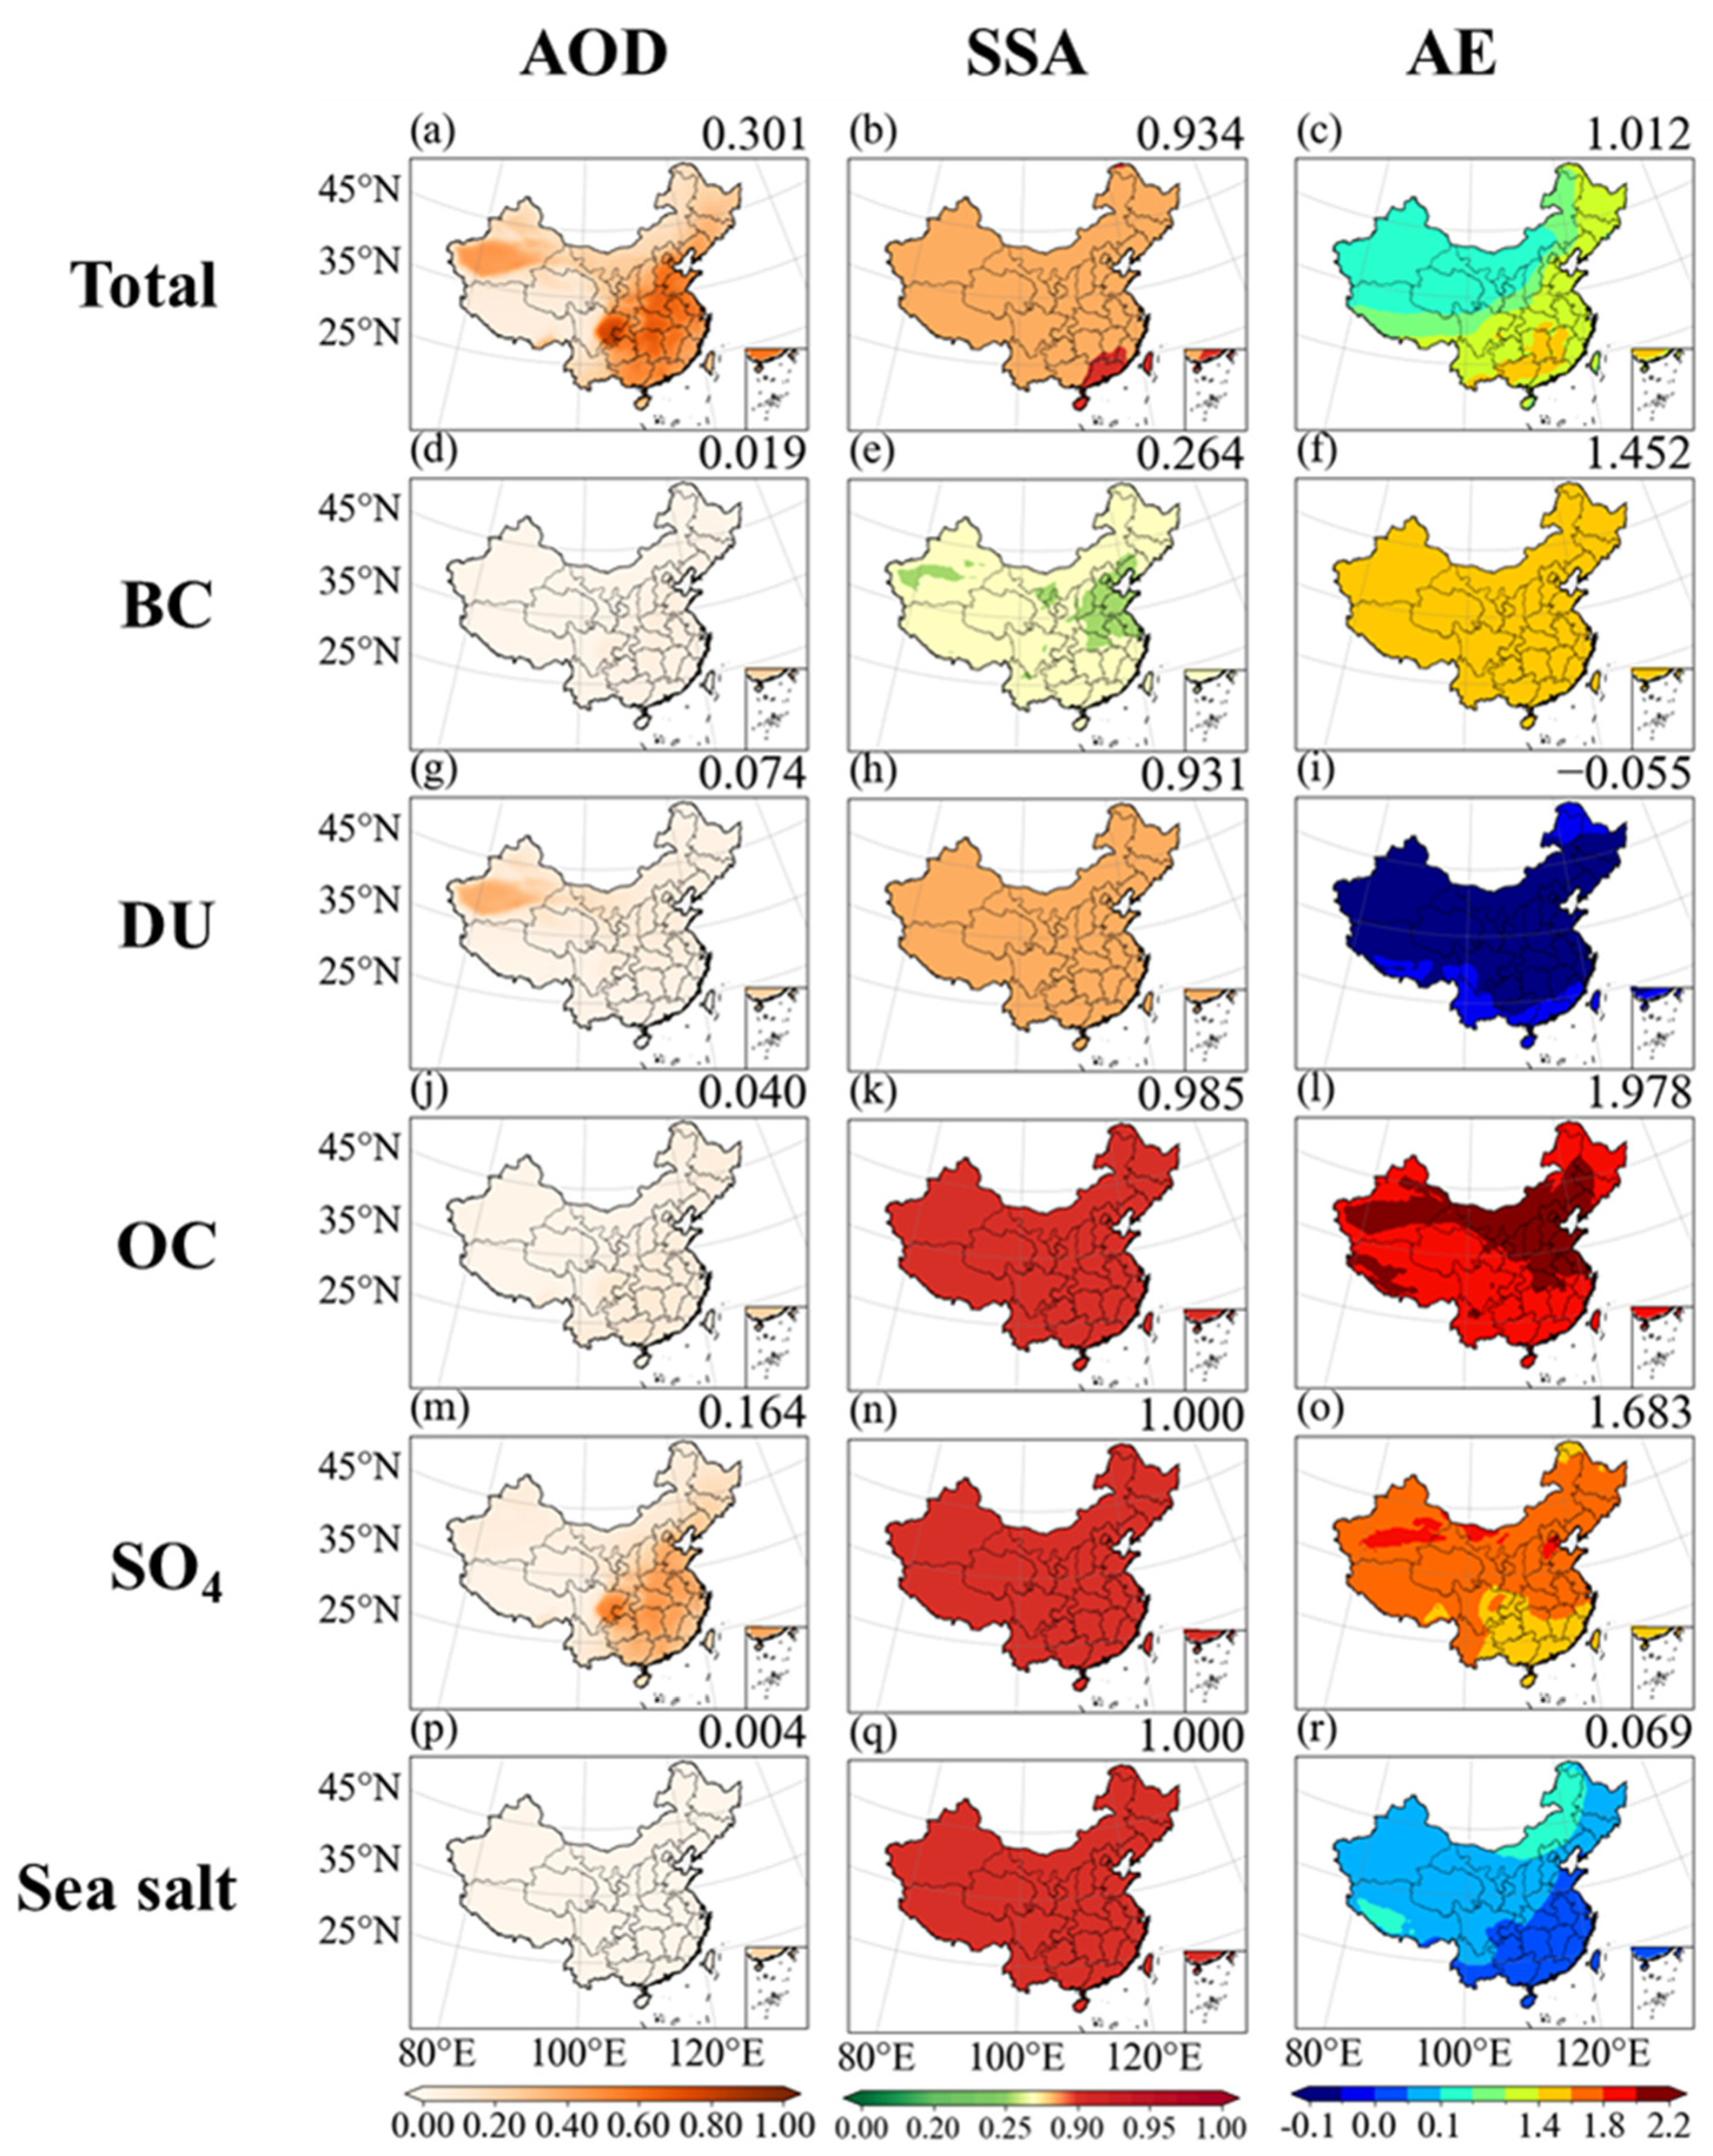
3.4. Aerosol Radiative Effects and Aerosol Properties in China

To further investigate the impact of aerosols on radiation over China, this study utilized the CERES-SYN product to compute the spatial distribution of aerosol radiative effects (AREs) under both all-sky and clear-sky conditions, as shown in Figure 7. Overall, under both all-sky (ARE_all) and clear-sky (ARE_clr) conditions, NET AREs at the TOA and SFC are negative, indicating a cooling effect of aerosols on radiation. The ARE_clr is weaker at the TOA than at the SFC, suggesting that aerosol direct scattering and absorption in the atmosphere effectively reduce the intensity of radiation reaching the surface. In southern China (the region south of 35°N and east of 100°E), SW ARE_clr values at the TOA and SFC are −17.12 and −35.00 W m−2, respectively. In the northern regions (e.g., Beijing-Tianjin-Hebei, Heilongjiang-Jilin-Liaoning, and Shandong-Shanxi), SW ARE_clr values at the TOA and SFC are −10.63 and −25.87 W m−2, respectively. In the northwest (e.g., Xinjiang, Gansu, Inner Mongolia, and Ningxia) and Tibetan Plateau, the SW ARE_clr cooling is weaker. The LW ARE_clr shows a generally weak heating effect (with a maximum value of less than 3 W m−2), and the SFC heating is higher than that at the TOA. The spatial distribution and intensity of LW AREs are opposite to those of the SW counterparts, with the magnitude following the order of northwest region > Tibetan Plateau > northern region > southern region. By combining the ARE_clr for both SW and LW, it is found that aerosols exerted a strong SW cooling at the TOA and SFC, while showing a weaker LW heating. Overall, the cooling effect of SW ARE_clr is stronger than the heating effect of LW, leading to a net cooling effect on radiation.
The distribution of ARE_all is similar to that under ARE_clr, but there are noticeable differences in magnitude. On average, the cloud presence reduces SW ARE by 7.26 and 9.58 W m−2 at the TOA and SFC over China, respectively. In southern China, the reductions at the TOA and SFC are 13.94 and 18.13 W m−2, while in the northern region, the reductions are 6.96 and 10.25 W m−2, respectively. In other regions, the reduction is less than 6 W m−2. Previous studies have shown that the high aerosol concentrations in southern China could modify cloud properties, such as the cloud water droplet radius [83], cloud base stability, and cloud cover [84], further affecting radiation. Overall, the influence of aerosols on radiation in China is complex. Their presence alone can have a direct and remarkable impact on radiation, while the aerosol interactions with clouds further modulate this effect. To further investigate these influences, the subsequent sections will focus on analyzing the distribution of aerosol properties across different types of aerosols in China.
Using MERRA-2 data, we examine the spatial distribution of AOD, SSA, and AE for Total, Black Carbon (BC), Dust (DU), Sulfate (SO4), Organic Carbon (OC), and Sea Salt aerosols, as shown in Figure 8. The results show that AOD (representing the vertical attenuation of sunlight by atmospheric aerosols) is relatively high in northern and southern China, with regional averaged values of 0.36 and 0.48, respectively. These elevated levels are primarily attributed to anthropogenic emissions from industry, transportation, and biomass burning [85]. In both regions, SO4 is the dominant aerosol type, contributing to the AOD values of 0.22 in the northern and 0.32 in the southern regions. Additional contributions in the north come from DU (0.06) and OC (0.05), while in the south, OC (0.07) and BC (0.03) also have a contribution.
The SSA which indicates the scattering and absorption properties of aerosols, ranges from 0 to 1, with values closer to 1 representing stronger scattering and those near 0 indicating greater absorption [28,86]. At the visible wavelength of 550 nm, SO4 and sea salt act as typical scattering aerosols, with the SSA values being close to 1. BC has an SSA of 0.23–0.32, while OC and DU have SSA values of 0.98–0.99 and 0.93–0.94, respectively. DU exhibits lower SSA than OC, indicating weaker scattering and stronger absorption effects, with its radiative properties varying depending on mineral composition and environmental conditions [87].
The AE represents the wavelength dependence of AOD and reflects aerosol particle size, with higher values indicating smaller particles [28,86]. The total AE is 1.19 in northern China and 1.35 in the south. SO4 maintains a consistent AE of 1.69 in both regions, while DU has a negative AE (−0.054). OC exhibits values of 2.00 in the north and 1.94 in the south, suggesting the dominance of fine-mode SO4 and OC particles in both regions.
In northwestern China, the total AOD, SSA, and AE are 0.26, 0.93, and 0.66, respectively, indicating significant influence from coarse-mode DU aerosols (AOD: 0.15, SSA: 0.93, AE: −0.06) [88]. Over the Tibetan Plateau, the aerosol loading is low, with a total AOD of 0.10, mainly influenced by natural DU aerosols (AOD: 0.04, SSA: 0.93, AE: −0.05) [89]. In coastal regions (e.g., eastern China and the South China Sea), AOD is low (<0.01), SSA is close to 1, and AE is near 0, and the dominant aerosol type is sea salt [90]. Overall, southern China is primarily influenced by SO4 and OC, while northern China is affected by SO4, DU, and OC. The Tibetan Plateau and northwestern China are dominated by DU, whereas coastal regions are primarily influenced by sea salt aerosols.
In summary, the distributions of different aerosol properties are closely related with the spatial distribution of aerosol radiative effects. The presence of aerosols leads to a greater ARE at the surface than at TOA. In the southern region, SO4 and OC aerosols, which have higher loading, stronger scattering properties, and smaller particle sizes, play an important role in affecting radiation. In the northern regions, SO4, OC, and DU aerosols are the dominant factors influencing radiation. In the northwest and Tibetan Plateau, the SW ARE cooling is weaker, and is primarily due to lower loading of DU aerosol.

4. Discussion

The spatial variation trends of shortwave, longwave, and net radiative fluxes at the top of the atmosphere and at the surface across China during the period from March 2000 to March 2023 are shown in Figure 9. During this period, the TOA NET radiative flux in China declined at 0.38 W m−2 year−1. At the surface, the SW radiative flux exhibited a decreasing trend at 0.19 W m−2 year−1, leading to a surface dimming phenomenon, with a decrease in the surface NET radiative flux at 0.35 W m−2 year−1. To further elucidate these trends, detailed analyses of SW, LW, and NET radiative fluxes at both the TOA and the SFC are conducted, focusing on their temporal variations and spatial patterns. At the TOA, SW_up radiative flux has increased at 0.17 W m−2 year−1, while SW_net radiative flux has decreased at −0.33 W m−2 year−1, indicating that the TOA SW radiative flux changes are primarily influenced by variations in incoming SW radiative flux. Spatially, SW_net radiative flux follows a pattern similar to SW_up. The LW_up radiative flux at the TOA has shown an overall decline at −0.05 W m−2 year−1, though Xinjiang exhibits an increasing trend (0.09 W m−2 year−1). Most other regions have experienced a decline, with the sharpest decrease in southern Tibet (−0.29 W m−2 year−1). Under the combined influence of SW and LW radiative fluxes, TOA NET radiative flux has declined at −0.38 W m−2 year−1. At the SFC, SW_down radiative flux shares a similar spatial pattern as the TOA SW_up radiative flux. Due to the overall decline in incoming SW radiative flux at the TOA, SW_down radiative flux at the SFC has also decreased at −0.19 W m−2 year−1. Similarly, SW_net radiative flux at the SFC, primarily driven by SW_down radiative flux, has declined at −0.12 W m−2 year−1. LW_net radiative flux at the SFC has decreased at −0.22 W m−2 year−1, following a spatial distribution similar to TOA LW radiation. The most significant declines occur in the Tibetan Plateau (−0.38 W m−2 year−1) and Inner Mongolia (−0.37 W m−2 year−1), while southwestern Xinjiang shows a notable increase, reaching 0.58 W m−2 year−1. Overall, SFC NET radiative flux has declined at −0.35 W m−2 year−1, influenced by both SW and LW radiative fluxes. The greatest reductions are observed in the Tibetan Plateau, Inner Mongolia, and parts of Xinjiang, while southern China experiences a smaller decrease.
Our analysis indicates that SW_net radiative flux at the TOA and SFC has changed at the rates of −0.33 W m−2 year−1 and −0.12 W m−2 year−1, respectively, while LW radiative flux at the TOA and SFC has decreased at −0.05 W m−2 year−1 and −0.22 W m−2 year−1, which imply a stronger influence of atmospheric components on SW radiation. Based on the findings in Section 3.3 and Section 3.4, cloud effects mainly influence SW radiative flux at both TOA and SFC, while aerosol radiative effects are more concentrated at the surface.
Further analysis shows that SW CRE and ARE at the SFC have changed at the rates of 0.06 W m−2 year−1 and 0.14 W m−2 year−1, respectively, which reflects enhanced cloud-induced cooling and a weakening aerosol cooling effect at the surface (Figure 9). Figures S1 and S2 further illustrate the interannual variations of SW radiative flux at the TOA and SFC and the associated radiative effects. Before 2013, both cloud and aerosol radiative cooling effects are intensified, contributing to the observed SFC SW trends. After 2013, however, cloud-induced cooling continues to increase, while aerosol cooling effects are weakened. These changes may reflect the influence of emission control measures and evolving aerosol–cloud interactions in the past decade [85]. In addition to the temporal trends, spatial patterns also reveal distinct regional characteristics in SW_net variability at both TOA and SFC, reflecting differing contributions from cloud and aerosol effects across China (Table S1). In Inner Mongolia, clouds and aerosols jointly influence SFC SW radiation. In Xinjiang, the aerosol and cloud impacts are relatively minor, suggesting the role of additional factors. Over the Tibetan Plateau, cloud-driven processes dominate SW radiative flux variability. In northern China, aerosol effects are predominant, supplemented by cloud contributions. In southern China, changes in aerosol loading are the primary driver, with minimal cloud influence. Overall, SFC SW radiation changes across China are predominantly driven by aerosol effects, with the regional variations modulating the relative importance of cloud and aerosol contributions.
To better understand the regional variations in cloud and aerosol radiative effects, this study examines the trends of cloud fraction and cloud optical depth for different cloud types, and aerosol optical depth (excluding sea salt) over the study period. These trends, as shown in Figure 10, reveal significant spatial differences in cloud and aerosol properties, which play a crucial role in radiation changes across China, as summarized in Table 2. Nationally, an increase in total cloud fraction (0.06 % year−1) and a decrease in total COD (−0.04 year−1) suggest enhanced cloud coverage with thinner clouds; while the declining AOD (−0.0005 year−1), which is mainly attributable to reductions in BC, DU, and OC, weakens the aerosol cooling effect. Large regional variations are observed. In Inner Mongolia, the reduction in mid-LC CF and COD decreases the cloud cooling effect, and the declines in DU and SO4 aerosols further weaken the aerosol cooling effect. Over the Tibetan Plateau, the decrease in mid-HC CF and COD primarily weakens the cloud cooling effect. In Xinjiang, increases in mid-HC CF, and DU AOD lead to radiation changes, though their overall impact on radiation remains relatively minor. In northern China, reductions in OC and DU weaken the aerosol cooling effect, while decreases in mid-LC and LC CF and COD further reduce the CRE. In southern China, the decline in OC and BC aerosols weakens the aerosol cooling effect, while the cloud variations at different altitudes are complex and the CRE changes are primarily influenced by the combined impacts of mid-HC, mid-LC, and LC variations. Overall, regional differences in cloud and aerosol properties reveal that aerosols and cloud such as BC, OC, DU, mid-LC, and mid-HC, have distinct effects on radiation changes across China, for example, aerosols predominantly affect the radiative cooling in southern and northern China, mid-LC clouds reduce cloud radiative cooling in Inner Mongolia, mid-HC clouds reduce cloud cooling on the Tibetan Plateau, and changes in HC, mid-HC, and DU aerosols lead to minor radiation changes in Xinjiang.

5. Conclusions

This study quantitatively assesses the impact of aerosols and clouds on radiation over China from March 2000 to February 2023 using CERES-SYN radiative flux data. Additionally, we explore the factors driving variations in cloud and aerosol radiative effects by incorporating cloud properties from CERES-SYN and aerosol properties from MERRA-2. The key findings are listed as follows:
(1)
Validation of Radiation Data Products in China: By comparing the surface solar radiation from CMA ground-based stations with satellite-derived products (CERES-SYN, CERES-EBAF, GEWEX-SRB, ISCCP-FH) and reanalysis datasets (ERA5 and MERRA-2), this study finds that CERES-SYN product has reasonable agreement with CMA data, and it is well suited for further analysis over China.
(2)
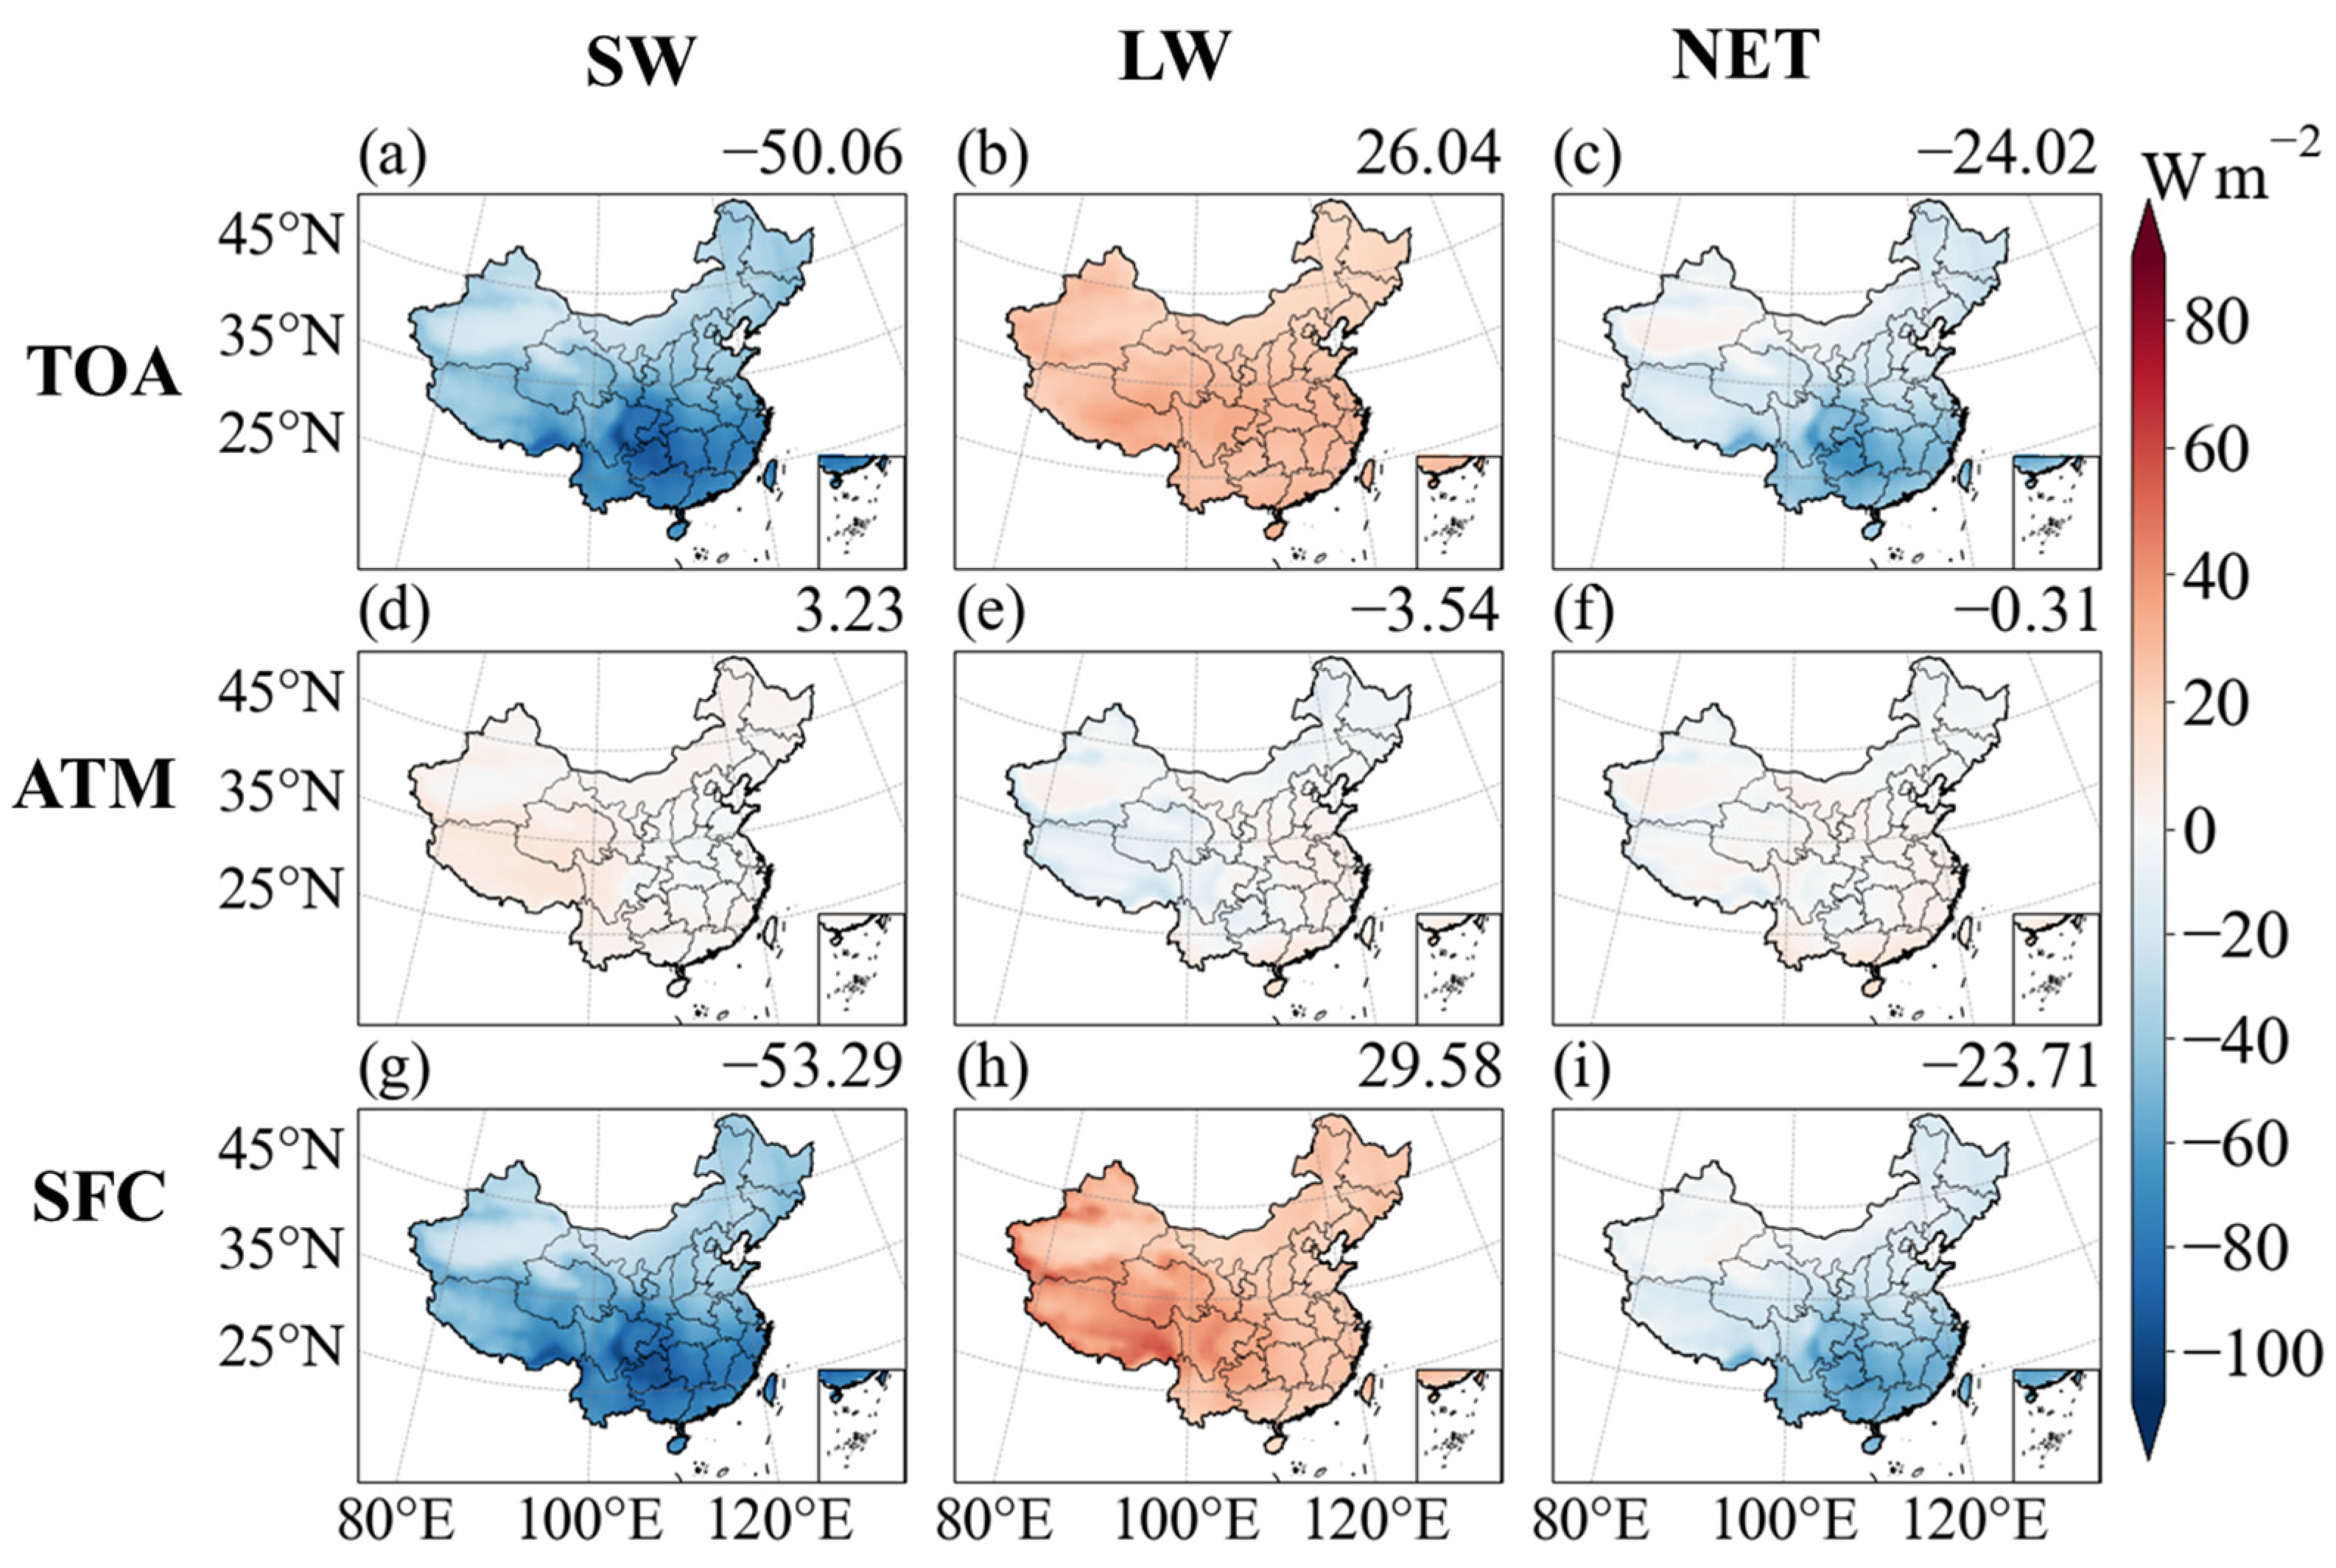
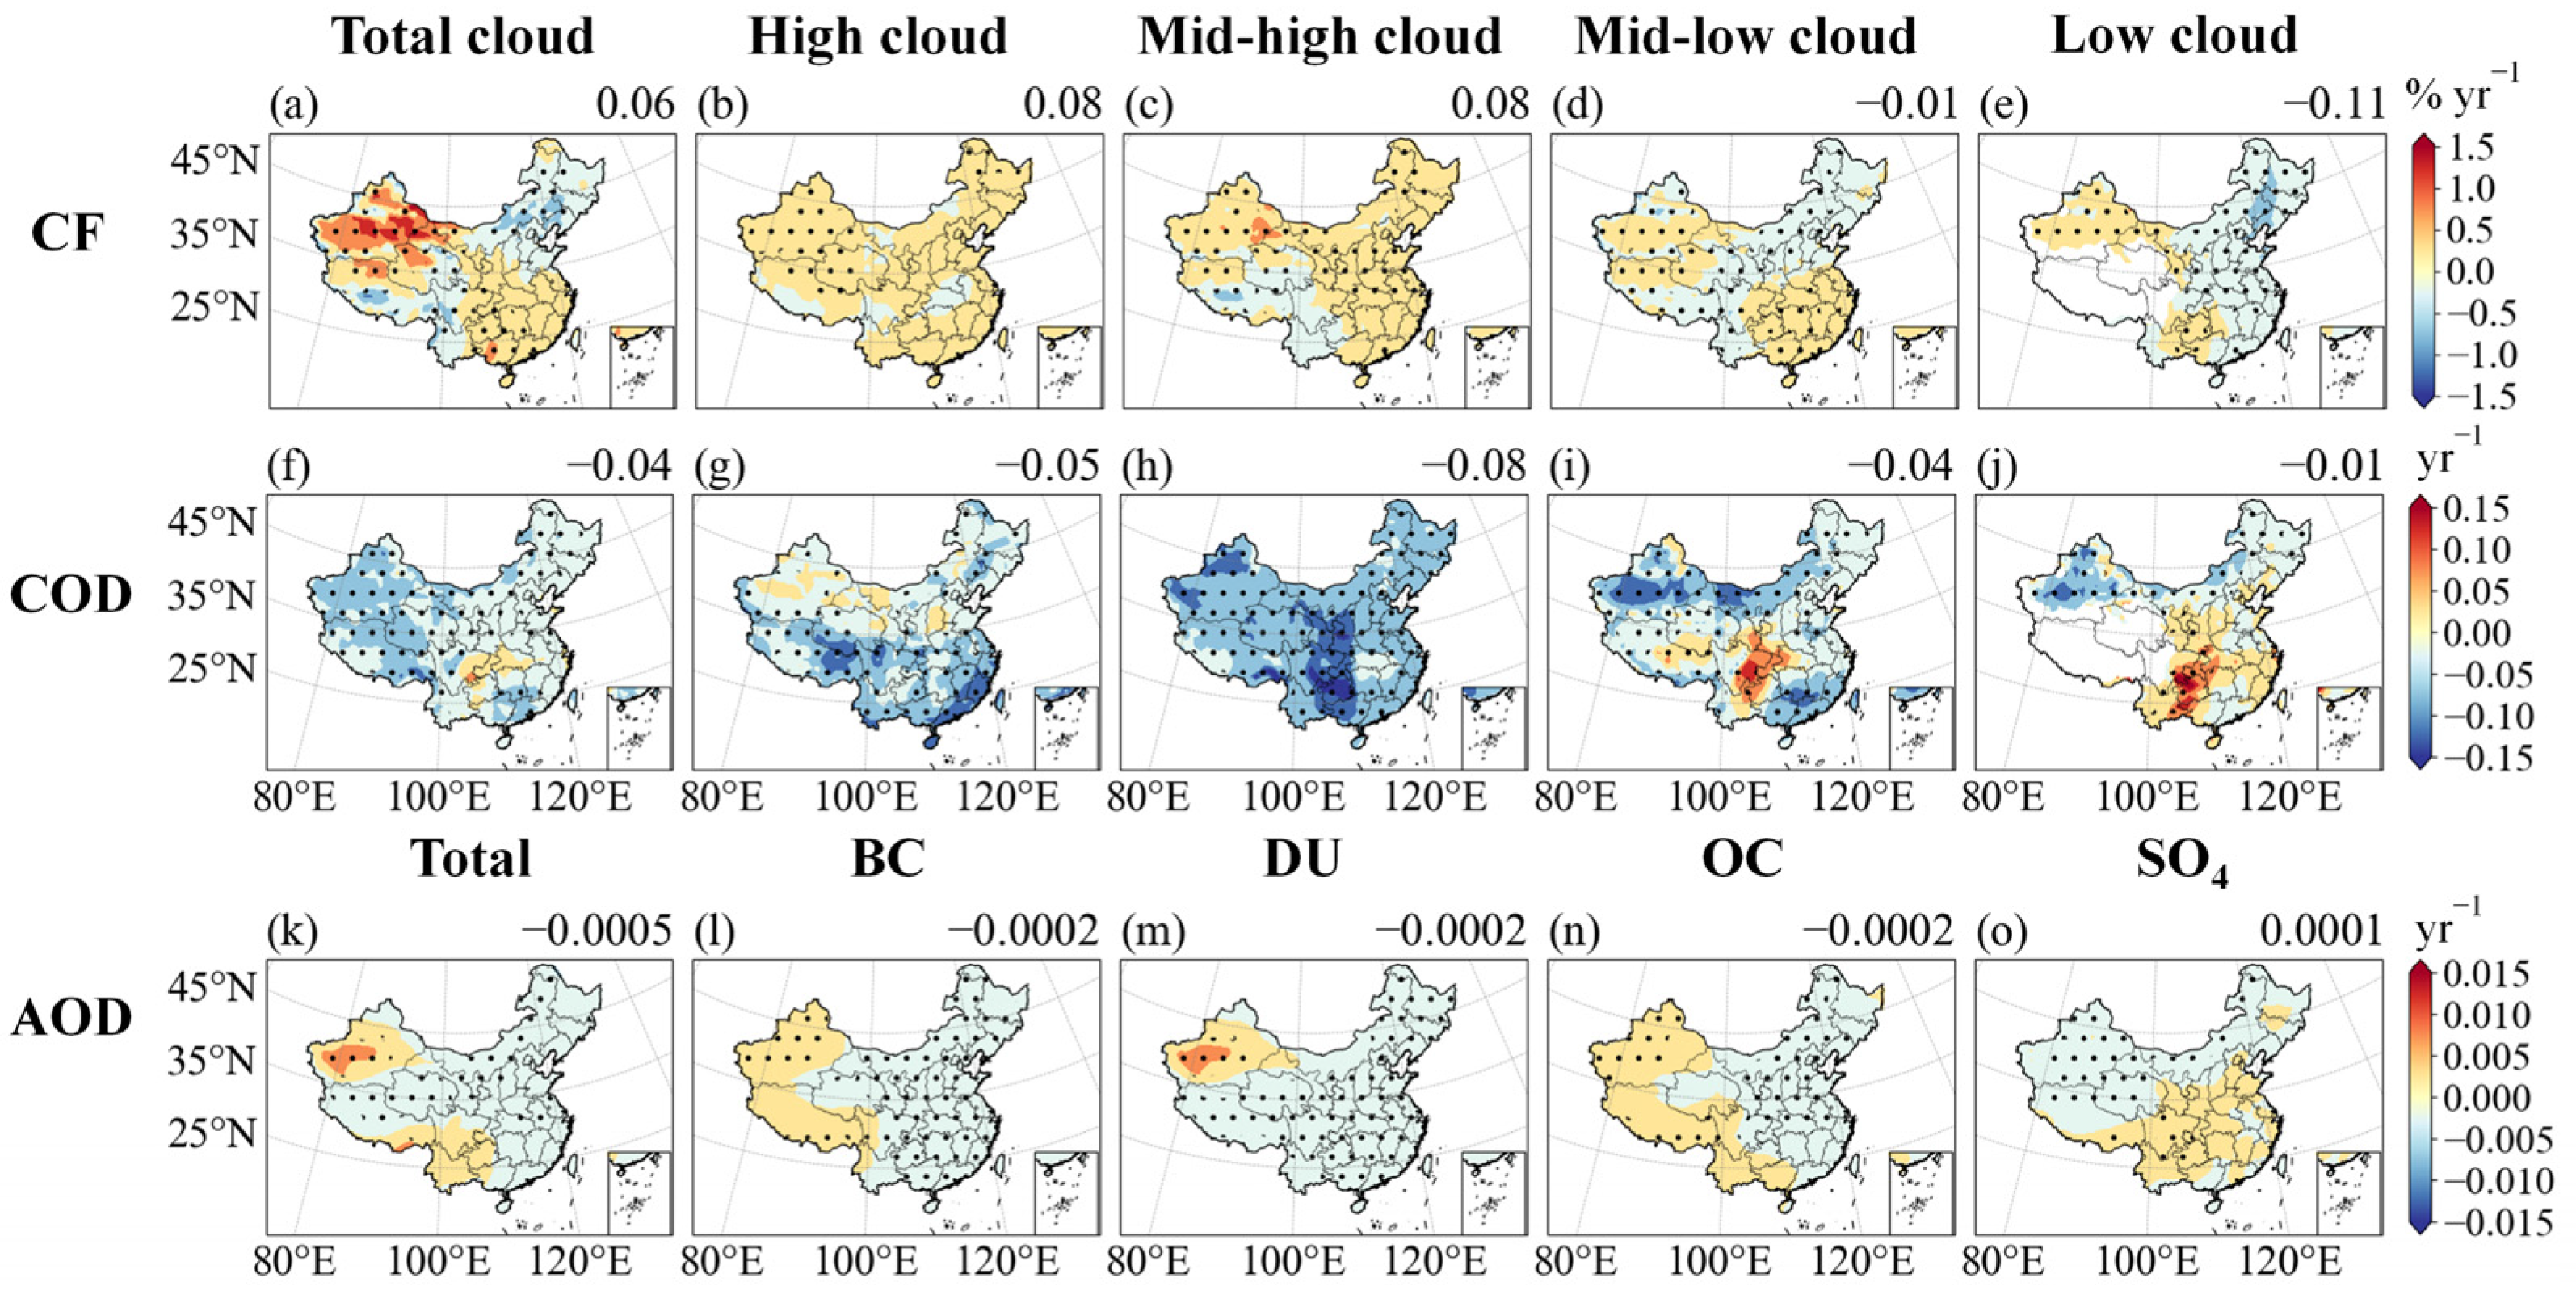
Cloud Radiative Effects and Cloud Properties: The multi-year averaged NET CRE over China is −23.17 W m−2, which weakens with increasing latitude. The CRE is primarily driven by the scattering of SW radiation, while LW absorption compensates for the NET radiation in certain regions. In southern China, the high CRE is mainly due to high CF and COD of mid-HC and mid-LC, along with the smaller cloud water and ice particle radius. Over Tibetan Plateau, CRE is mainly affected by the high CF and COD of mid-HC and the smaller ice particle sizes. In contrast, northern regions such as Xinjiang and Inner Mongolia exhibit a weaker CRE cooling due to lower CF, smaller COD, and larger cloud particle sizes.
(3)
Aerosol Radiative Effects and Aerosol Properties: Aerosols exert an overall cooling effect under both clear-sky and all-sky conditions, which result from a strong SW cooling effect and a slight LW warming effect. The NET ARE at both TOA and SFC is primarily influenced by SW radiation and generally exhibits negative values and apparent regional variations. In southern China, ARE is largely driven by SO4 and OC, whereas in northern China, it is influenced by a combination of SO4, DU, and OC. In northwest China and the Tibetan Plateau, DU is the dominant contributor, while in coastal regions, sea salt plays a major role.
(4)
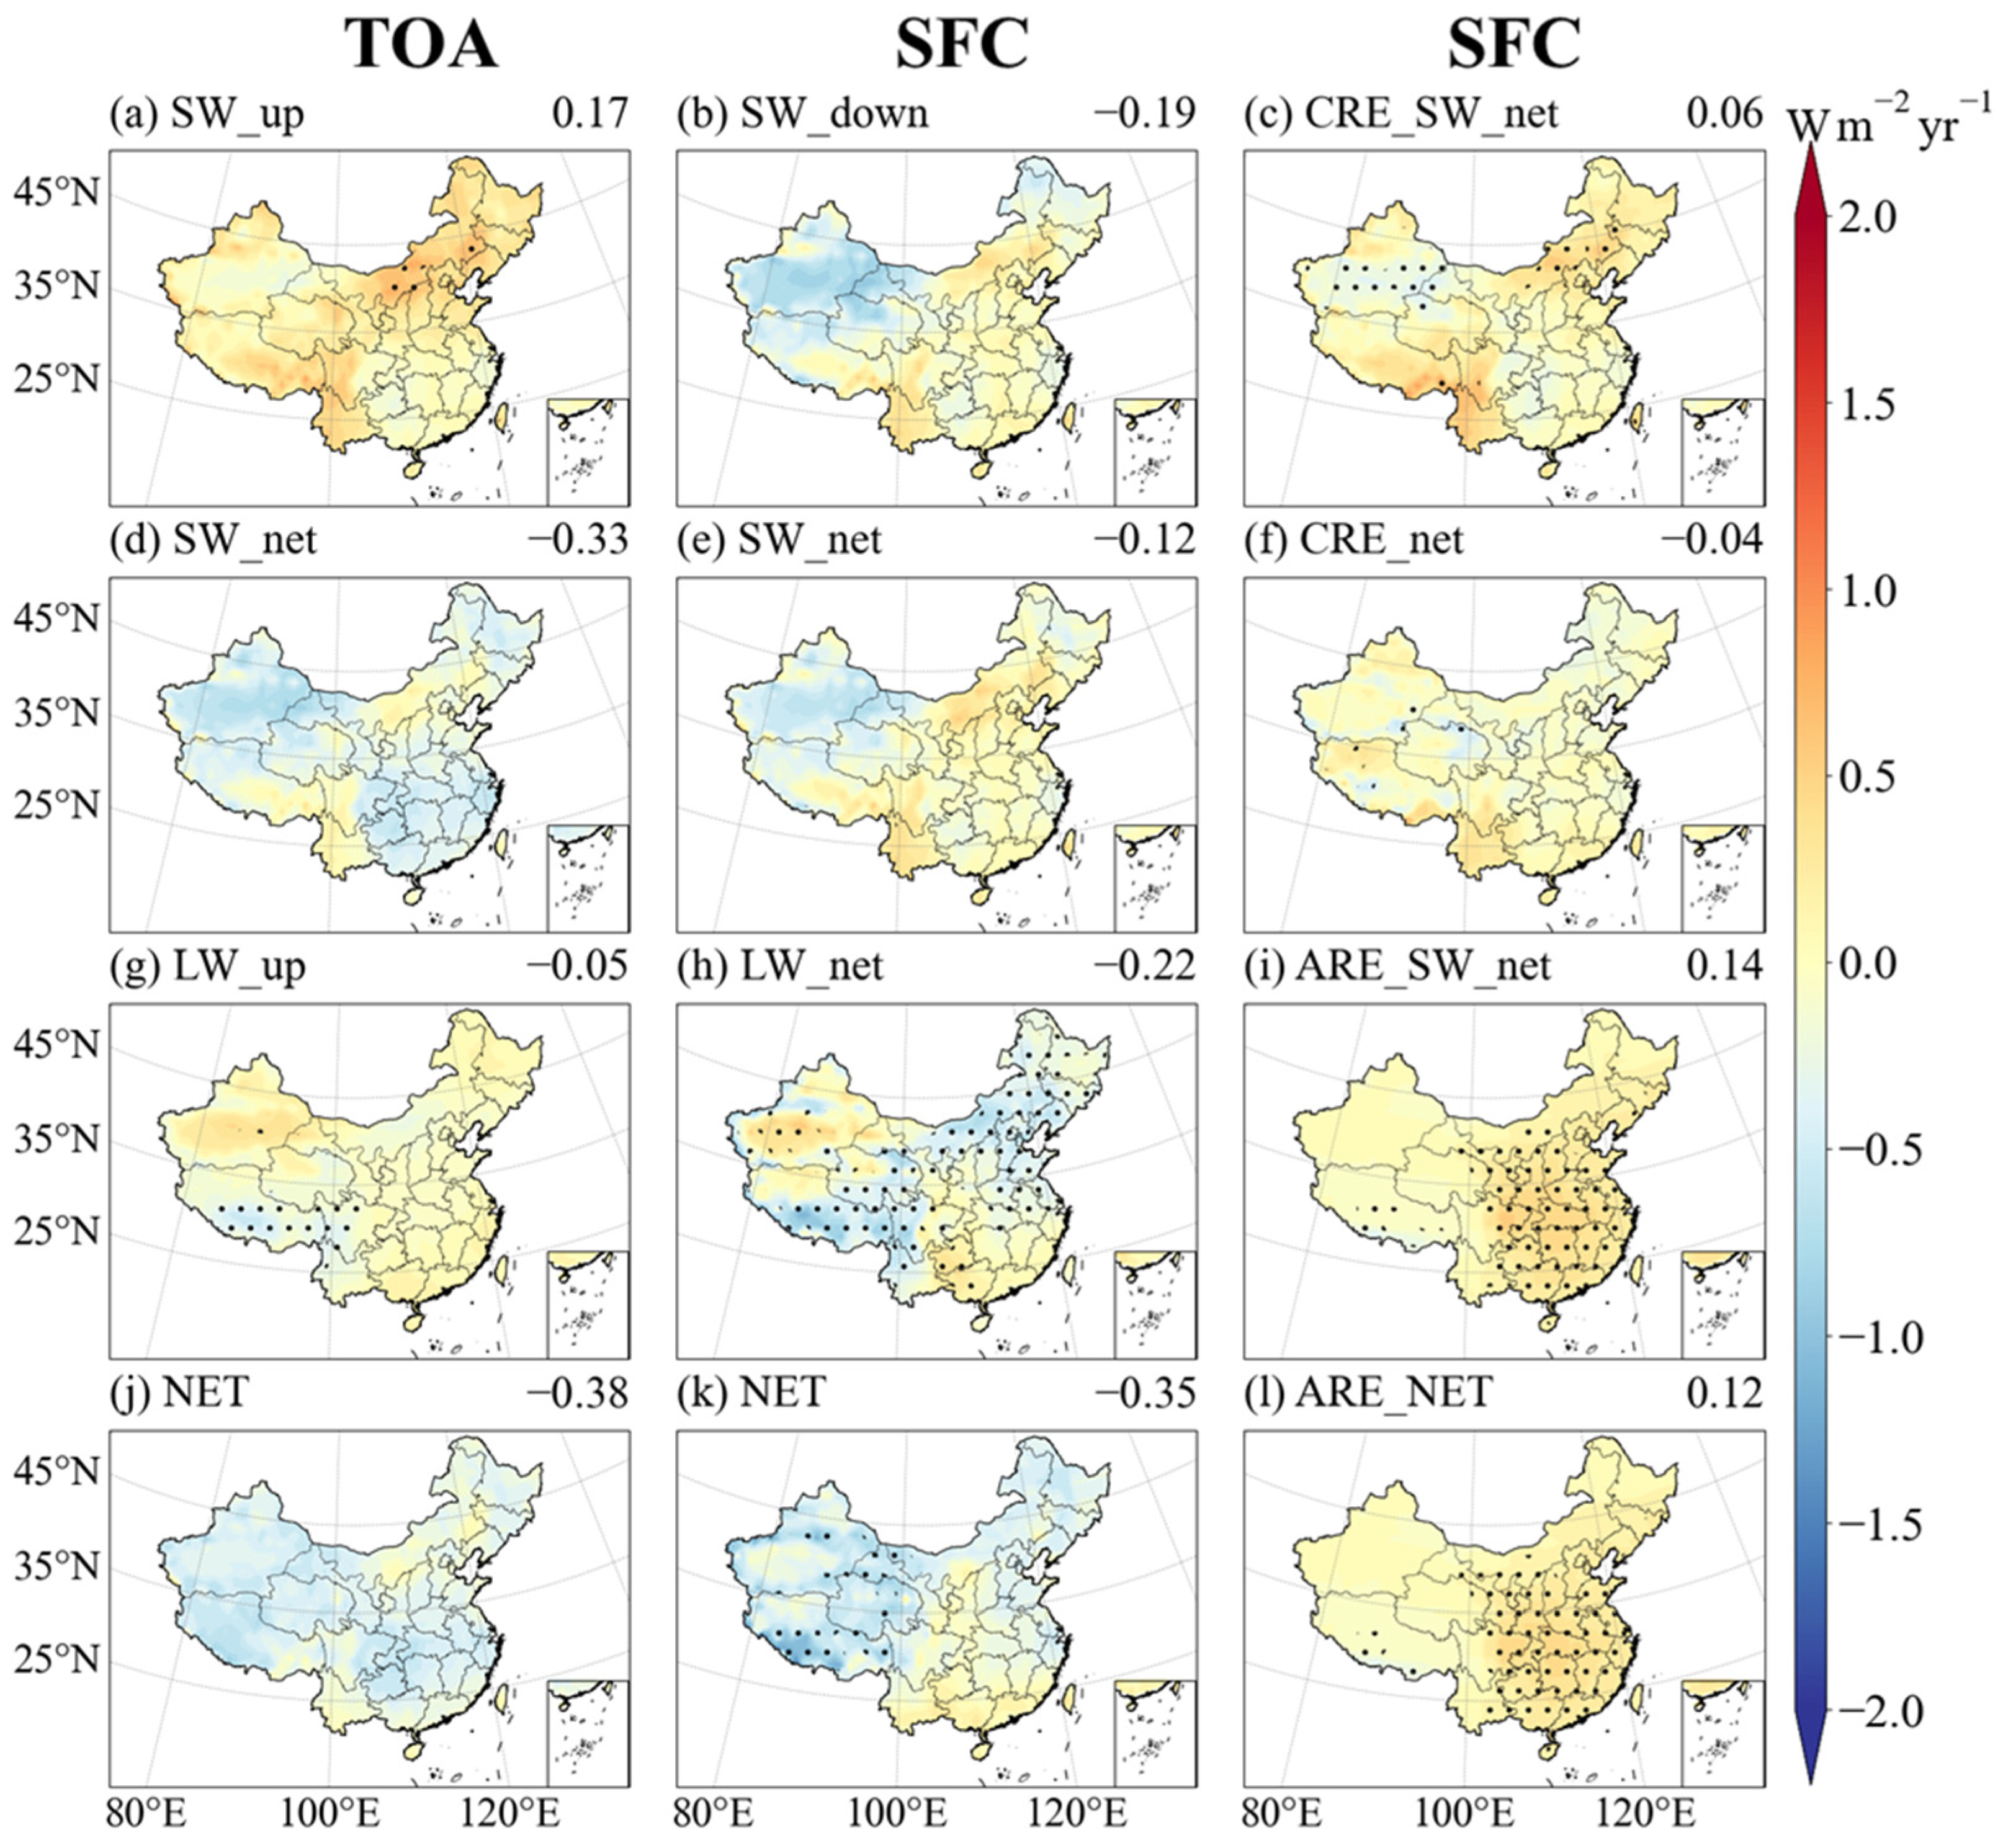
Influence of Clouds and Aerosols on Radiation Changes in China: From March 2000 to February 2023, decreases in the net radiative fluxes over China at the top of the atmosphere (at −0.38 W m−2 year−1) and the surface (at −0.35 W m−2 year−1) during the study period has been observed. The different radiation variation trends at the SFC and TOA in different regions reveals that cloud and aerosol variations are important to explain the disparities. In southern China, reductions in OC and BC weaken the aerosol cooling effect, while the CRE effects are complex due to the combined influence of mid-HC, mid-LC, and LC clouds. In northern China, aerosol reductions in OC and DU drive the radiative flux changes, and decreases in mid-LC and LC clouds further diminish the CRE cooling. Over the Tibetan Plateau, the decrease in mid-HC CF and COD drives the radiation changes. In Xinjiang, increases in HC and mid-HC CF, and DU aerosol contribute to radiative flux changes, though their overall impacts are relatively small. In Inner Mongolia, the weakening of the CRE cooling is linked to reductions in mid-LC CF and COD, while decreases in DU and SO4 further weakened the aerosol cooling effect. Overall, while aerosol radiative effects dominate radiative flux changes across China, the complex variations in cloud properties, particularly the influence of different cloud layers in southern China, also play a crucial role and should not be overlooked.
(5)
Challenges and Limitations: First, uncertainties in the estimation of aerosol properties from the MERRA-2 dataset, particularly the potential biases in AOD and composition retrievals, highlight the necessity for further refinement and independent validation of aerosol datasets over China. Second, although this study reveals regional disparities in the influences of aerosols and clouds on radiative flux variations, the effects of post-2013 anthropogenic emission reductions on aerosol radiative effects, as well as their spatial manifestations, require more comprehensive investigation. Finally, advancing the understanding of how aerosols and clouds influence regional and large-scale radiation budgets, thereby affecting climate processes, remains a critical challenge.

Supplementary Materials

Supplementary data to this article can be found in the supplementary material document. The following supporting information can be downloaded at: https://www.mdpi.com/article/10.3390/rs17101666/s1, Figure S1: Annual variations of TOA SW Radiative flux, SW CRE, and SW ARE. Figure S2: Annual variations of SFC SW Radiative flux, SW CRE, and SW ARE. Table S1: Regional Trends of Cloud and Aerosol Effects on TOA and Surface Shortwave Radiative flux over China (2000–2023). All trend values are statistically significant at the 90% confidence level.

Author Contributions

Conceptualization, S.W. and B.Y.; methodology, S.W.; software, S.W.; validation, S.W. and B.Y.; formal analysis, S.W.; investigation, S.W.; resources, S.W.; data curation, S.W.; writing—original draft preparation, S.W.; writing—review and editing, S.W. and B.Y.; visualization, S.W.; supervision, B.Y.; project administration, B.Y.; funding acquisition, B.Y. All authors have read and agreed to the published version of the manuscript.

Funding

This work is partially supported by the project supported by Innovation Group Project of Southern Marine Science and Engineering Guangdong Laboratory (Zhuhai) (No. 311024001), the Science and Technology Planning Project of Guangdong Province (2023B1212060019), the Zhujiang Talent Program of the Department of Science and Technology of Guangdong Province (2017GC010619), and the Guangdong Basic and Applied Basic Research Foundation (2019A1515011230).

Data Availability Statement

The data supporting the results of this study are publicly available through the following sources: The CERES-SYN data (March 2000 to February 2023, 1° × 1° spatial resolution) can be accessed at https://asdc.larc.nasa.gov/data/CERES/SYN1deg-Day/ (assessed on 24 December 2024); CERES-EBAF data (March 2000 to February 2023, 1° × 1° spatial resolution) at https://asdc.larc.nasa.gov/data/CERES/EBAF/ (assessed on 24 December 2024); ISCCP-FH data (March 2000 to June 2016, 1° × 1° spatial resolution) at https://isccp.giss.nasa.gov/pub/flux-fh/ (assessed on 24 December 2024); GEWEX-SRB data (March 2000 to June 2016, 1° × 1° spatial resolution) at https://asdc.larc.nasa.gov/project/SRB (assessed on 24 December 2024); MERRA-2 data (March 2000 to February 2023, 0.5° × 0.625° spatial resolution) at https://gmao.gsfc.nasa.gov/reanalysis/MERRA-2/ (assessed on 24 December 2024); ERA5 data (March 2000 to June 2016, 0.1° × 0.1° spatial resolution) at https://doi.org/10.24381/cds.68d2bb30 (assessed on 24 December 2024); and CMA radiation data (March 2000 to June 2016, 99 sites) at http://data.cma.cn/ (assessed on 24 December 2024).

Conflicts of Interest

The authors declare no conflicts of interest. The funders had no role in the design of the study; in the collection, analyses, or interpretation of data; in the writing of the manuscript; or in the decision to publish the results.

References

  1. Stephens, G.L. An Update on Earth’s Energy Balance in Light of the Latest Global Observations. Nat. Geosci. 2012, 5, 691–696. [Google Scholar] [CrossRef]
  2. Wild, M. The Global Energy Balance as Represented in CMIP6 Climate Models. Clim. Dyn. 2020, 55, 553–577. [Google Scholar] [CrossRef]
  3. Wild, M. Towards Global Estimates of the Surface Energy Budget. Curr. Clim. Chang. Rep. 2017, 3, 87–97. [Google Scholar] [CrossRef]
  4. Wild, M.; Folini, D.; Schär, C.; Loeb, N.; Dutton, E.G.; König-Langlo, G. The Global Energy Balance from a Surface Perspective. Clim. Dyn. 2013, 40, 3107–3134. [Google Scholar] [CrossRef]
  5. Trenberth, K.E.; Fasullo, J.T.; Kiehl, J. Earth’s Global Energy Budget. Bull. Amer. Meteor. Soc. 2009, 90, 311–324. [Google Scholar] [CrossRef]
  6. Beer, J.; Mende, W.; Stellmacher, R. The Role of the Sun in Climate Forcing. Quat. Sci. Rev. 2000, 19, 403–415. [Google Scholar] [CrossRef]
  7. Gray, L.J.; Beer, J.; Geller, M.; Haigh, J.D.; Lockwood, M.; Matthes, K.; Cubasch, U.; Fleitmann, D.; Harrison, G.; Hood, L.; et al. Solar Influences on Climate. Rev. Geophys. 2010, 48, RG4001. [Google Scholar] [CrossRef]
  8. Kiehl, J.T.; Trenberth, K.E. Earth’s Annual Global Mean Energy Budget. Bull. Amer. Meteor. Soc. 1997, 78, 197–208. [Google Scholar] [CrossRef]
  9. Wild, M. Global Dimming and Brightening: A Review. J. Geophys. Res. 2009, 114, D00D16. [Google Scholar] [CrossRef]
  10. Stephens, G.L.; O’Brien, D.; Webster, P.J.; Pilewski, P.; Kato, S.; Li, J. The Albedo of Earth. Rev. Geophys. 2015, 53, 141–163. [Google Scholar] [CrossRef]
  11. Ramanathan, V.; Feng, Y. Air Pollution, Greenhouse Gases and Climate Change: Global and Regional Perspectives. Atmos. Environ. 2009, 43, 37–50. [Google Scholar] [CrossRef]
  12. Zhu, G.; Qiu, D.; Zhang, Z.; Sang, L.; Liu, Y.; Wang, L.; Zhao, K.; Ma, H.; Xu, Y.; Wan, Q. Land-Use Changes Lead to a Decrease in Carbon Storage in Arid Region, China. Ecol. Indic. 2021, 127, 107770. [Google Scholar] [CrossRef]
  13. Stanhill, G.; Cohen, S. Global Dimming: A Review of the Evidence for a Widespread and Significant Reduction in Global Radiation with Discussion of Its Probable Causes and Possible Agricultural Consequences. Agric. For. Meteorol. 2001, 107, 255–278. [Google Scholar] [CrossRef]
  14. Wild, M.; Gilgen, H.; Roesch, A.; Ohmura, A.; Long, C.N.; Dutton, E.G.; Forgan, B.; Kallis, A.; Russak, V.; Tsvetkov, A. From Dimming to Brightening: Decadal Changes in Solar Radiation at Earth’s Surface. Science 2005, 308, 847–850. [Google Scholar] [CrossRef]
  15. Wild, M. Decadal Changes in Radiative Fluxes at Land and Ocean Surfaces and Their Relevance for Global Warming. WIREs Clim. Chang. 2016, 7, 91–107. [Google Scholar] [CrossRef]
  16. Sanchez-Lorenzo, A.; Wild, M.; Brunetti, M.; Guijarro, J.A.; Hakuba, M.Z.; Calbó, J.; Mystakidis, S.; Bartok, B. Reassessment and Update of Long-term Trends in Downward Surface Shortwave Radiation over Europe (1939–2012). J. Geophys. Res. Atmos. 2015, 120, 9555–9569. [Google Scholar] [CrossRef]
  17. Pinker, R.T.; Zhang, B.; Dutton, E.G. Do Satellites Detect Trends in Surface Solar Radiation? Science 2005, 308, 850–854. [Google Scholar] [CrossRef]
  18. Wang, Z.; Zhang, M.; Wang, L.; Feng, L.; Ma, Y.; Gong, W.; Qin, W. Long-Term Evolution of Clear Sky Surface Solar Radiation and Its Driving Factors over East Asia. Atmos. Environ. 2021, 262, 118661. [Google Scholar] [CrossRef]
  19. Golaz, J.; Horowitz, L.W.; Levy, H. Cloud Tuning in a Coupled Climate Model: Impact on 20th Century Warming. Geophys. Res. Lett. 2013, 40, 2246–2251. [Google Scholar] [CrossRef]
  20. Liepert, B.G. Observed Reductions of Surface Solar Radiation at Sites in the United States and Worldwide from 1961 to 1990. Geophys. Res. Lett. 2002, 29, 61-1–61-4. [Google Scholar] [CrossRef]
  21. Augustine, J.A.; Dutton, E.G. Variability of the Surface Radiation Budget over the United States from 1996 through 2011 from High-quality Measurements. J. Geophys. Res. Atmos. 2013, 118, 43–53. [Google Scholar] [CrossRef]
  22. Cutforth, H.W.; Judiesch, D. Long-Term Changes to Incoming Solar Energy on the Canadian Prairie. Agric. For. Meteorol. 2007, 145, 167–175. [Google Scholar] [CrossRef]
  23. Hatzianastassiou, N.; Ioannidis, E.; Korras-Carraca, M.-B.; Gavrouzou, M.; Papadimas, C.D.; Matsoukas, C.; Benas, N.; Fotiadi, A.; Wild, M.; Vardavas, I. Global Dimming and Brightening Features during the First Decade of the 21st Century. Atmosphere 2020, 11, 308. [Google Scholar] [CrossRef]
  24. Nabat, P.; Somot, S.; Mallet, M.; Sanchez-Lorenzo, A.; Wild, M. Contribution of Anthropogenic Sulfate Aerosols to the Changing Euro-Mediterranean Climate since 1980. Geophys. Res. Lett. 2014, 41, 5605–5611. [Google Scholar] [CrossRef]
  25. Kudo, R.; Uchiyama, A.; Ijima, O.; Ohkawara, N.; Ohta, S. Aerosol Impact on the Brightening in Japan. J. Geophys. Res. 2012, 117, 2011JD017158. [Google Scholar] [CrossRef]
  26. Chiacchio, M.; Wild, M. Influence of NAO and Clouds on Long-term Seasonal Variations of Surface Solar Radiation in Europe. J. Geophys. Res. 2010, 115, 2009JD012182. [Google Scholar] [CrossRef]
  27. Wild, M. Enlightening Global Dimming and Brightening. Bull. Am. Meteorol. Soc. 2012, 94, 27–37. [Google Scholar] [CrossRef]
  28. Yu, L.; Zhang, M.; Wang, L.; Li, H.; Li, J. Characteristics of Aerosols and Clouds and Their Role in Earth’s Energy Budget. J.Clim. 2024, 37, 995–1014. [Google Scholar] [CrossRef]
  29. Climate Change 2021—The Physical Science Basis: Working Group I Contribution to the Sixth Assessment Report of the Intergovernmental Panel on Climate Change; Cambridge University Press: Cambridge, UK, 2021; p. 959. ISBN 978-1-009-15789-6.
  30. Wang, Q.; Zhang, H.; Yang, S.; Chen, Q.; Zhou, X.; Shi, G.; Cheng, Y.; Wild, M. Potential Driving Factors on Surface Solar Radiation Trends over China in Recent Years. Remote Sens. 2021, 13, 704. [Google Scholar] [CrossRef]
  31. Che, H.Z.; Shi, G.Y.; Zhang, X.Y.; Arimoto, R.; Zhao, J.Q.; Xu, L.; Wang, B.; Chen, Z.H. Analysis of 40 Years of Solar Radiation Data from China, 1961–2000. Geophys. Res. Lett. 2005, 32, 2004GL022322. [Google Scholar] [CrossRef]
  32. Shi, G.-Y.; Hayasaka, T.; Ohmura, A.; Chen, Z.-H.; Wang, B.; Zhao, J.-Q.; Che, H.-Z.; Xu, L. Data Quality Assessment and the Long-Term Trend of Ground Solar Radiation in China. J. Appl. Meteorol. Climatol. 2008, 47, 1006–1016. [Google Scholar] [CrossRef]
  33. Wang, Y.; Wild, M. A New Look at Solar Dimming and Brightening in China. Geophys. Res. Lett. 2016, 43, 11777–11785. [Google Scholar] [CrossRef]
  34. He, Y.; Wang, K.; Zhou, C.; Wild, M. A Revisit of Global Dimming and Brightening Based on the Sunshine Duration. Geophys. Res. Lett. 2018, 45, 4281–4289. [Google Scholar] [CrossRef]
  35. Tang, W.-J.; Yang, K.; Qin, J.; Cheng, C.C.K.; He, J. Solar Radiation Trend across China in Recent Decades: A Revisit with Quality-Controlled Data. Atmos. Chem. Phys. 2011, 11, 393–406. [Google Scholar] [CrossRef]
  36. Yang, S.; Wang, X.L.; Wild, M. Causes of Dimming and Brightening in China Inferred from Homogenized Daily Clear-Sky and All-Sky in Situ Surface Solar Radiation Records (1958–2016). J. Clim. 2019, 32, 5901–5913. [Google Scholar] [CrossRef]
  37. Yang, S.; Wang, X.L.; Wild, M. Homogenization and Trend Analysis of the 1958–2016 In Situ Surface Solar Radiation Records in China. J. Clim. 2018, 31, 4529–4541. [Google Scholar] [CrossRef]
  38. Liang, F.; Xia, X.A. Long-Term Trends in Solar Radiation and the Associated Climatic Factors over China for 1961-2000. Ann. Geophys. 2005, 23, 2425–2432. [Google Scholar] [CrossRef]
  39. You, Q.; Sanchez-Lorenzo, A.; Wild, M.; Folini, D.; Fraedrich, K.; Ren, G.; Kang, S. Decadal Variation of Surface Solar Radiation in the Tibetan Plateau from Observations, Reanalysis and Model Simulations. Clim. Dyn. 2013, 40, 2073–2086. [Google Scholar] [CrossRef]
  40. Yin, Q.; Zhang, H.; He, J. Long-Term Change of Surface Total Solar Radiation and Influencing Factors over East China in Recent 48 Years. Atmos. Environ. Opt. 2011, 6, 37–46. [Google Scholar]
  41. Norris, J.R.; Wild, M. Trends in Aerosol Radiative Effects over China and Japan Inferred from Observed Cloud Cover, Solar “Dimming”, and Solar “Brightening”. J. Geophys. Res. 2009, 114, 2008JD011378. [Google Scholar] [CrossRef]
  42. Wang, C.; Zhang, Z.; Tian, W. Factors Affecting the Surface Radiation Trends over China between 1960 and 2000. Atmos. Environ. 2011, 45, 2379–2385. [Google Scholar] [CrossRef]
  43. Schwarz, M.; Folini, D.; Yang, S.; Allan, R.P.; Wild, M. Changes in Atmospheric Shortwave Absorption as Important Driver of Dimming and Brightening. Nat. Geosci. 2020, 13, 110–115. [Google Scholar] [CrossRef]
  44. Streets, D.G.; Yu, C.; Wu, Y.; Chin, M.; Zhao, Z.; Hayasaka, T.; Shi, G. Aerosol Trends over China, 1980–2000. Atmos. Res. 2008, 88, 174–182. [Google Scholar] [CrossRef]
  45. Wang, Y.; Yang, Y.; Han, S.; Wang, Q.; Zhang, J. Sunshine Dimming and Brightening in Chinese Cities (1955-2011) Was Driven by Air Pollution Rather than Clouds. Clim. Res. 2013, 56, 11–20. [Google Scholar] [CrossRef]
  46. Tang, W.; Yang, K.; Qin, J.; Niu, X.; Lin, C.; Jing, X. A Revisit to Decadal Change of Aerosol Optical Depth and Its Impact on Global Radiation over China. Atmos. Environ. 2017, 150, 106–115. [Google Scholar] [CrossRef]
  47. Xie, H.; Zhao, J.; Wang, K.; Peng, H. Long-Term Variations in Solar Radiation, Diffuse Radiation, and Diffuse Radiation Fraction Caused by Aerosols in China during 1961–2016. PLoS ONE 2021, 16, e0250376. [Google Scholar] [CrossRef] [PubMed]
  48. Wang, D.; Liang, S.; Li, R.; Jia, A. A Synergic Study on Estimating Surface Downward Shortwave Radiation from Satellite Data. Remote Sens. Environ. 2021, 264, 112639. [Google Scholar] [CrossRef]
  49. Wang, K.; Ma, Q.; Li, Z.; Wang, J. Decadal Variability of Surface Incident Solar Radiation over China: Observations, Satellite Retrievals, and Reanalyses. J. Geophys. Res. Atmos. 2015, 120, 6500–6514. [Google Scholar] [CrossRef]
  50. Zhang, X.; Liang, S.; Wild, M.; Jiang, B. Analysis of Surface Incident Shortwave Radiation from Four Satellite Products. Remote Sens. Environ. 2015, 165, 186–202. [Google Scholar] [CrossRef]
  51. Feng, F.; Wang, K. Does the Modern-era Retrospective Analysis for Research and Applications-2 Aerosol Reanalysis Introduce an Improvement in the Simulation of Surface Solar Radiation over China? Int. J. Climatol. 2019, 39, 1305–1318. [Google Scholar] [CrossRef]
  52. Peng, N.; Su, J.; Han, X.; Deng, X.; Lan, W.; Wang, J. Distributions and Direct Radiative Effects of Different Aerosol Types in North China. Remote Sens. 2023, 15, 5511. [Google Scholar] [CrossRef]
  53. Najarian, H.; Sakaeda, N. The Influence of Cloud Types on Cloud-Radiative Forcing During DYNAMO/AMIE. J. Geophys. Res. Atmos. 2023, 128, e2022JD038006. [Google Scholar] [CrossRef]
  54. Wang, G.; Wang, T.; Xue, H. Validation and Comparison of Surface Shortwave and Longwave Radiation Products over the Three Poles. Int. J. Appl. Earth Obs. Geoinf. 2021, 104, 102538. [Google Scholar] [CrossRef]
  55. Rutan, D.A.; Kato, S.; Doelling, D.R.; Rose, F.G.; Nguyen, L.T.; Caldwell, T.E.; Loeb, N.G. CERES Synoptic Product: Methodology and Validation of Surface Radiant Flux. J. Atmos. Ocean. Technol. 2015, 32, 150310071019003. [Google Scholar] [CrossRef]
  56. Loeb, N.G.; Doelling, D.R.; Wang, H.; Su, W.; Nguyen, C.; Corbett, J.G.; Liang, L.; Mitrescu, C.; Rose, F.G.; Kato, S. Clouds and the Earth’s Radiant Energy System (CERES) Energy Balanced and Filled (EBAF) Top-of-Atmosphere (TOA) Edition-4.0 Data Product. J. Clim. 2018, 31, 895–918. [Google Scholar] [CrossRef]
  57. Zhang, Y.; Rossow, W.B.; Lacis, A.A. Calculation of Surface and Top of Atmosphere Radiative Fluxes from Physical Quantities Based on ISCCP Data Sets: 1. Method and Sensitivity to Input Data Uncertainties. J. Geophys. Res. 1995, 100, 1149–1165. [Google Scholar] [CrossRef]
  58. Young, A.H.; Knapp, K.R.; Inamdar, A.; Hankins, W.; Rossow, W.B. The International Satellite Cloud Climatology Project H-Series Climate Data Record Product. Earth Syst. Sci. Data 2018, 10, 583–593. [Google Scholar] [CrossRef]
  59. Rossow, W.B.; Knapp, K.R.; Young, A.H. International Satellite Cloud Climatology Project: Extending the Record. J. Clim. 2022, 35, 141–158. [Google Scholar] [CrossRef]
  60. Zhang, Y.; Rossow, W.B. Global Radiative Flux Profile Data Set: Revised and Extended. J. Geophys. Res. Atmos. 2023, 128, e2022JD037340. [Google Scholar] [CrossRef]
  61. Pinker, R.T.; Laszlo, I. Modeling Surface Solar Irradiance for Satellite Applications on a Global Scale. J. Appl. Meteor. 1992, 31, 194–211. [Google Scholar] [CrossRef]
  62. Zhang, T.; Stackhouse, P.W.; Cox, S.J.; Mikovitz, J.C.; Long, C.N. Clear-Sky Shortwave Downward Flux at the Earth’s Surface: Ground-Based Data vs. Satellite-Based Data. J. Quant. Spectrosc. Radiat. Transf. 2019, 224, 247–260. [Google Scholar] [CrossRef] [PubMed]
  63. Zhang, T.; Stackhouse, P.W.; Cox, S.J.; Mikovitz, J.C. The Uncertainty of the BSRN Monthly Mean Global 1 and Global 2 Fluxes Due to Missing Hourly Means with and without Quality-Control and an Examination through Validation of the NASA GEWEX SRB Datasets. J. Quant. Spectrosc. Radiat. Transf. 2020, 255, 107272. [Google Scholar] [CrossRef]
  64. Jiang, H.; Yang, Y.; Bai, Y.; Wang, H. Evaluation of the Total, Direct, and Diffuse Solar Radiations From the ERA5 Reanalysis Data in China. IEEE Geosci. Remote Sens. Lett. 2020, 17, 47–51. [Google Scholar] [CrossRef]
  65. Gelaro, R.; McCarty, W.; Suárez, M.J.; Todling, R.; Molod, A.; Takacs, L.; Randles, C.A.; Darmenov, A.; Bosilovich, M.G.; Reichle, R.; et al. The Modern-Era Retrospective Analysis for Research and Applications, Version 2 (MERRA-2). J. Clim. 2017, 30, 5419–5454. [Google Scholar] [CrossRef]
  66. Minnis, P.; Sun-Mack, S.; Chen, Y.; Chang, F.-L.; Yost, C.R.; Smith, W.L.; Heck, P.W.; Arduini, R.F.; Bedka, S.T.; Yi, Y.; et al. CERES MODIS Cloud Product Retrievals for Edition 4—Part I: Algorithm Changes. IEEE Geosci. Remote Sens. Lett. 2021, 59, 2744–2780. [Google Scholar] [CrossRef]
  67. Trepte, Q.Z.; Bedka, K.M.; Chee, T.L.; Minnis, P.; Sun-Mack, S.; Yost, C.R.; Chen, Y.; Jin, Z.; Hong, G.; Chang, F.-L.; et al. Global Cloud Detection for CERES Edition 4 Using Terra and Aqua MODIS Data. IEEE Geosci. Remote Sens. 2019, 57, 9410–9449. [Google Scholar] [CrossRef]
  68. Yost, C.R.; Minnis, P.; Sun-Mack, S.; Chen, Y.; Smith, W.L. CERES MODIS Cloud Product Retrievals for Edition 4—Part II: Comparisons to CloudSat and CALIPSO. IEEE Trans. Geosci. Remote Sens. 2021, 59, 3695–3724. [Google Scholar] [CrossRef]
  69. Randles, C.A.; Silva, A.M.D.; Buchard, V.; Colarco, P.R.; Darmenov, A.; Govindaraju, R.; Smirnov, A.; Holben, B.; Ferrare, R.; Hair, J.; et al. The MERRA-2 Aerosol Reanalysis, 1980 Onward. Part I: System Description and Data Assimilation Evaluation. J. Clim. 2017, 30, 6823–6850. [Google Scholar] [CrossRef]
  70. Gueymard, C.A.; Yang, D. Worldwide Validation of CAMS and MERRA-2 Reanalysis Aerosol Optical Depth Products Using 15 Years of AERONET Observations. Atmos. Environ. 2020, 225, 117216. [Google Scholar] [CrossRef]
  71. Ukhov, A.; Mostamandi, S.; Shevchenko, I.; Stenchikov, G. Assessment of Natural and Anthropogenic Aerosol Air Pollution in the Middle East Using MERRA-2, CAMS Data Assimilation Products, and High-Resolution WRF-Chem Model Simulations. Atmos. Chem. Phys. 2020, 20, 9281–9310. [Google Scholar] [CrossRef]
  72. Buchard, V.; Randles, C.A.; Da Silva, A.M.; Darmenov, A.; Colarco, P.R.; Govindaraju, R.; Ferrare, R.; Hair, J.; Beyersdorf, A.J.; Ziemba, L.D.; et al. The MERRA-2 Aerosol Reanalysis, 1980 Onward. Part II: Evaluation and Case Studies. J. Clim. 2017, 30, 6851–6872. [Google Scholar] [CrossRef]
  73. Su, X.; Huang, Y.; Wang, L.; Cao, M.; Feng, L. Validation and Diurnal Variation Evaluation of MERRA-2 Multiple Aerosol Properties on a Global Scale. Atmos. Environ. 2023, 311, 120019. [Google Scholar] [CrossRef]
  74. Sun, E.; Xu, X.; Che, H.; Tang, Z.; Gui, K.; An, L.; Lu, C.; Shi, G. Variation in MERRA-2 Aerosol Optical Depth and Absorption Aerosol Optical Depth over China from 1980 to 2017. Atmos. Sol.-Terr. Phys. 2019, 186, 8–19. [Google Scholar] [CrossRef]
  75. Wang, H.; Wang, Y. Evaluation of the Accuracy and Trend Consistency of Hourly Surface Solar Radiation Datasets of ERA5, MERRA-2, SARAH-E, CERES, and Solcast over China. Remote Sens. 2025, 17, 1317. [Google Scholar] [CrossRef]
  76. Chakraborty, T.; Lee, X. Large Differences in Diffuse Solar Radiation Among Current-Generation Reanalysis and Satellite-Derived Products. J. Clim. 2021, 34, 6635–6650. [Google Scholar] [CrossRef]
  77. Zhang, X.; Lu, N.; Jiang, H.; Yao, L. Evaluation of Reanalysis Surface Incident Solar Radiation Data in China. Sci. Rep. 2020, 10, 3494. [Google Scholar] [CrossRef]
  78. Doelling, D.R.; Loeb, N.G.; Keyes, D.F.; Nordeen, M.L.; Morstad, D.; Nguyen, C.; Wielicki, B.A.; Young, D.F.; Sun, M. Geostationary Enhanced Temporal Interpolation for CERES Flux Products. J. Atmos. Ocean. Technol. 2013, 30, 1072–1090. [Google Scholar] [CrossRef]
  79. Loeb, N.G.; Wang, H.; Rose, F.G.; Kato, S.; Smith, W.L.; Sun-Mack, S. Decomposing Shortwave Top-of-Atmosphere and Surface Radiative Flux Variations in Terms of Surface and Atmospheric Contributions. J. Clim. 2019, 32, 5003–5019. [Google Scholar] [CrossRef]
  80. Pang, G.; Chen, D.; Wang, X.; Lai, H.-W. Spatiotemporal Variations of Land Surface Albedo and Associated Influencing Factors on the Tibetan Plateau. Sci. Total Environ. 2022, 804, 150100. [Google Scholar] [CrossRef]
  81. Xu, X.; Lu, C.; Shi, X.; Gao, S. World Water Tower: An Atmospheric Perspective. Geophys. Res. Lett. 2008, 35, 2008GL035867. [Google Scholar] [CrossRef]
  82. Hua, S.; Liu, Y.; Jia, R.; Chang, S.; Wu, C.; Zhu, Q.; Shao, T.; Wang, B. Role of Clouds in Accelerating Cold-season Warming during 2000–2015 over the Tibetan Plateau. Int. J. Climatol. 2018, 38, 4950–4966. [Google Scholar] [CrossRef]
  83. Wang, Y.; Zhao, P.; Xiao, H.; Zhang, P. Aerosol Effects on Liquid Cloud Microphysical Properties in South China: Land–Ocean Contrasts. Atmos. Pollut. Res. 2024, 15, 102032. [Google Scholar] [CrossRef]
  84. Khatri, P.; Yoshida, K.; Hayasaka, T. Aerosol Effects on Water Cloud Properties in Different Atmospheric Regimes. J. Geophys. Res. Atmos. 2023, 128, e2023JD039729. [Google Scholar] [CrossRef]
  85. Liu, M.; Matsui, H. Aerosol Radiative Forcings Induced by Substantial Changes in Anthropogenic Emissions in China from 2008 to 2016. Atmos. Chem. Phys. 2021, 21, 5965–5982. [Google Scholar] [CrossRef]
  86. Kinne, S.; O’Donnel, D.; Stier, P.; Kloster, S.; Zhang, K.; Schmidt, H.; Rast, S.; Giorgetta, M.; Eck, T.F.; Stevens, B. MAC-v1: A New Global Aerosol Climatology for Climate Studies. J. Adv. Model. Earth Syst. 2013, 5, 704–740. [Google Scholar] [CrossRef]
  87. Dubovik, O.; Holben, B.; Eck, T.F.; Smirnov, A.; Kaufman, Y.J.; King, M.D.; Tanré, D.; Slutsker, I. Variability of Absorption and Optical Properties of Key Aerosol Types Observed in Worldwide Locations. J. Atmos. Sci. 2002, 59, 590–608. [Google Scholar] [CrossRef]
  88. Zhang, L.; Li, J. Variability of Major Aerosol Types in China Classified Using AERONET Measurements. Remote Sens. 2019, 11, 2334. [Google Scholar] [CrossRef]
  89. Liu, B.; Cong, Z.; Wang, Y.; Xin, J.; Wan, X.; Pan, Y.; Liu, Z.; Wang, Y.; Zhang, G.; Wang, Z.; et al. Background Aerosol over the Himalayas and Tibetan Plateau: Observed Characteristics of Aerosol Mass Loading. Atmos. Chem. Phys. 2017, 17, 449–463. [Google Scholar] [CrossRef]
  90. Wang, G.; Chen, J.; Xu, J.; Yun, L.; Zhang, M.; Li, H.; Qin, X.; Deng, C.; Zheng, H.; Gui, H.; et al. Atmospheric Processing at the Sea-Land Interface Over the South China Sea: Secondary Aerosol Formation, Aerosol Acidity, and Role of Sea Salts. J. Geophys. Res. Atmos. 2022, 127, e2021JD036255. [Google Scholar] [CrossRef]
Figure 1. Comparison of monthly average SSR between CMA stations in China and (a) CERES-SYN, (b) CERES-EBAF, (c) GEWEX-SRB, (d) ISCCP-FH, (e) ERA5, and (f) MERRA-2.
Remotesensing 17 01666 g001
Figure 2. Bias distribution of SSR over China: comparison of CERES SYN with CERES EBAF, ISCCP-FH, and GEWEX-SRB datasets under all-sky and clear-sky conditions (the red dot indicating the mean bias for each comparison).
Remotesensing 17 01666 g002
Figure 3. The multi-year averaged results of SW, LW, and NET radiative fluxes at TOA and SFC over China from March 2000 to February 2023 under all-sky and clear-sky conditions (with the numbers in the upper right corner representing the area-weighted averages for the entirety of China). Subfigures are arranged as follows: (ac) TOA SW, LW, and NET radiative fluxes under clear-sky; (df) TOA same variables as in (ac) under all-sky; (gi) SFC SW, LW, and NET radiative flux under clear-sky; (jl) SFC same variables as in (gi) under all-sky.
Remotesensing 17 01666 g003
Figure 4. The multi-year averaged results of SW, LW, and NET CRE at TOA, ATM, and SFC over China from March 2000 to February 2023 (with the numbers in the upper right corner representing the area-weighted averages for the entirety of China). Subplots are arranged as follows: (ac) TOA SW, LW, NET CRE, (df) ATM SW, LW, NET CRE, and (gi) SFC SW, LW, NET CRE.
Remotesensing 17 01666 g004
Figure 5. The multi-year averaged spatial distribution of TC, HC, mid-HC, mid-LC, and LC CF (%) and COD over China (with the numbers in the upper right corner representing area-weighted averages) and their latitudinal and seasonal variations. Subplots are arranged as follows: (a) TC, (e) HC, (i) mid-HC, (m) mid-LC, (q) LC CF spatial distributions; (b) TC, (f) HC, (j) mid-HC, (n) mid-LC, (r) LC CF latitudinal and seasonal variations; (c) TC, (g) HC, (k) mid-HC, (o) mid-LC, (s) LC COD spatial distributions; (d) TC, (h) HC, (l) mid-HC, (p) mid-LC, (t) LC COD latitudinal and seasonal variations.
Remotesensing 17 01666 g005
Figure 6. Seasonal variations in cloud top height, water cloud particle radius, and ice cloud particle radius for (a) TC, (b) HC, (c) mid-HC, (d) mid-LC, and (e) LC over China.
Remotesensing 17 01666 g006
Figure 7. Multi-year averaged results of aerosol SW, LW, and NET at TOA and SFC ARE over China from March 2000 to February 2023 under all-sky and clear-sky conditions (with the numbers in the upper right corner representing area-weighted averages for the entirety of China). Subfigures are arranged as follows: (ac) TOA SW, LW, and NET ARE under clear-sky; (df) TOA same variables as in (ac) under all-sky; (gi) SFC SW, LW, and NET ARE under clear-sky; (jl) SFC same variables as in (gi) under all-sky.
Remotesensing 17 01666 g007
Figure 8. The averaged AOD, SSA, and AE results for different types of aerosols over China from March 2000 to February 2023 (with the numbers in the upper right corner representing area-weighted averages for the entire China region). Subfigures are arranged as follows: (ac) AOD, SSA and AE for total aerosol; (df), (gi), (jl), (mo), (pr) same variables as in (ac) for black carbon, dust, organic carbon, sulfate and sea salt.
Remotesensing 17 01666 g008
Figure 9. Trends in SW, LW, NET, CRE, and ARE at TOA and SFC over China (with the numbers in the upper right corner representing the average trend across the entire China region, and the stipples in the figure indicating trends that are significant at the 90% confidence level according to the t-test). Subfigures are arranged as follows: (a) TOA SW upward, (d) TOA SW, (g) TOA LW, (j) TOA NET radiative flux trends; (b) SFC SW downward, (e) SFC SW, (h) SFC LW, (k) SFC NET radiative flux trends, (c) SW CRE; (f) Net CRE; (i) Net SW ARE; (l) Net ARE trends.
Remotesensing 17 01666 g009
Figure 10. Long-term trends of TC, HC, mid-HC, mid-LC, and LC CF (ae) and COD (fj), as well as total (k), BC (l), dust (m), OC (n), and SO4 (o) AOD over China (the numbers in the upper right corner represent the trend area-weighted average for the entirety of China, with the points in the figure indicating trends that are significant at the 90% confidence level according to the t-test).
Remotesensing 17 01666 g010
Table 1. Main characteristics of the satellite, reanalysis, and ground-based observations.
DatasetAvailable PeriodsThe Period in This StudySpatial ResolutionOrganizationURL
CERES-SYN2000–presentMarch 2000–February 20231° × 1°NASA Langley Research Center (LaRC)https://asdc.larc.nasa.gov/data/CERES/SYN1deg-Day/ (assessed on 24 December 2024)
CERES-EBAF2000–presentMarch 2000–February 20231° × 1°NASA Langley Research Center (LaRC)https://asdc.larc.nasa.gov/data/CERES/EBAF/ (assessed on 24 December 2024)
ISCCP-FH1983–2017March 2000–June 20161° × 1°NASA Goddard Institute for Space Studies (GISS)https://isccp.giss.nasa.gov/pub/flux-fh/ (assessed on 24 December 2024)
GEWEX-SRB1983–2017March 2000–June 20161° × 1°Global Energy and Water Cycle Experiment (GEWEX), NASAhttps://asdc.larc.nasa.gov/project/SRB (assessed on 24 December 2024)
MERRA-21980–presentMarch 2000–February 20230.5° × 0.625°NASA Global Modeling and Assimilation Office (GMAO)https://gmao.gsfc.nasa.gov/reanalysis/MERRA-2/ (assessed on 24 December 2024)
ERA51950–presentMarch 2000–June 20160.1° × 0.1°European Centre for Medium-Range Weather Forecasts (ECMWF)https://doi.org/10.24381/cds.68d2bb30 (assessed on 24 December 2024)
CMA1957–2017March 2000–June 2016Ground observationChina Meteorological Administrationhttp://data.cma.cn/ (assessed on 24 December 2024)
Table 2. Regional trends of cloud and aerosol properties and radiative effects in China. All listed values have passed significance test at the 90% confidence level.
RegionCRE_SW
(W m−2 year−1)
Total CF
(% year−1)
Total COD
(year−1)
Specific CF
(% year−1)
ARE_SW
(W m−2 year−1)
AOD
(year−1)
Specific AOD
(year−1)
China0.060.06−0.04HC (CF: 0.08, COD: −0.05), mid-HC (CF: 0.08, COD: −0.08)0.14−0.0005BC (−0.0002), DU (−0.0002), OC (−0.0002)
Inner Mongolia0.18−0.2−0.04mid-LC (CF: −0.12, COD: −0.06)0.12−0.0002DU (−0.00004), SO4 (−0.00004)
Xinjiang−0.10.46−0.06HC (CF: 0.15, COD: −0.02)
mid-HC (CF: 0.22, COD: −0.09)
0.020.0001DU (0.0001)
Tibetan Plateau0.12−0.06−0.06mid-HC (CF:0.07, COD: −0.09)−0.009−0.0003DU (−0.0004)
Northern China0.13−0.16−0.03LC (CF: −0.31, COD: −0.01)0.20−0.002OC (−0.001), DU (−0.001)
Southern China0.010.14−0.02mid-HC (CF: 0.07, COD: −0.09), mid-LC CF: 0.09, COD: −0.02), LC (CF: −0.08, COD: 0.03),0.29−0.0008OC (−0.0003), BC (−0.0004)
Disclaimer/Publisher’s Note: The statements, opinions and data contained in all publications are solely those of the individual author(s) and contributor(s) and not of MDPI and/or the editor(s). MDPI and/or the editor(s) disclaim responsibility for any injury to people or property resulting from any ideas, methods, instructions or products referred to in the content.

