Article

Direct Comparison of Infrared Channel Measurements by Two ABIs to Monitor Their Calibration Stability

1
Earth Resources Technology (ERT), Greenbelt, MD 20770, USA
2
National Oceanic and Atmospheric Administration, National Environmental Satellite, Data, and Information Service, Center for Satellite Applications and Research, College Park, MD 20740, USA
3
Cooperative Institute for Satellite Earth System Studies (CISESS), University of Maryland, College Park, MD 20740, USA
*
Author to whom correspondence should be addressed.
Remote Sens. 2025, 17(10), 1656; https://doi.org/10.3390/rs17101656
Submission received: 17 March 2025 / Revised: 3 May 2025 / Accepted: 6 May 2025 / Published: 8 May 2025

Abstract

:
This paper introduces a method of monitoring infrared channel calibration stability through direct comparison of calibrated radiances by two Advanced Baseline Imager (ABI) on two geostationary (GEO) platforms. This GEO-GEO comparison is based on radiances in the overlapping area observed by the two ABIs, pixel by pixel, at approximately the same time, location, spectrum, and viewing zenith angle. It was initially developed for GOES-17 and subsequent GOES missions to validate the ABI’s calibration around its local midnight—a subject of particular interest for instruments on three-axis stabilized geostationary satellites. With the cryocooler anomaly of the GOES-17 ABI, however, the GEO-GEO comparison became an indispensable tool to characterize GOES-17 ABI infrared (IR) channel calibration with high frequency, low uncertainty, and in near real time, providing critical feedback to root cause investigation and mitigation options. Later, the GEO-GEO comparison was applied to the GOES-18 ABI as originally intended and was proved successful. It confirms that, with few exceptions, radiometric calibration for all ABIs is stable to within 0.1 K when the radiance fluctuation is converted to the brightness temperature at 300 K.

Graphical Abstract

1. Introduction

The Advanced Baseline Imager (ABI) onboard the Geostationary Operational Environmental Satellite (GOES) is an important asset of the National Oceanic and Atmospheric Administration (NOAA). A total of four ABIs have been launched (Table 1). Dozens of meteorological and geophysical products are routinely generated from ABI measurements. These include aerosols (detection and optical depth), atmosphere (temperature and moisture profile, stability, and motion vector or wind), cloud (mask, height, layers, type, phase, and optical and microphysical properties), ice (motion, temperature, thickness, concentration, and age), imagery (cloud and moisture), fire and hot spots, land surface (temperature, albedo, and snow cover), rainfall, sea surface temperature, shortwave radiation (downward and upward), and volcanic ash (detection and height) [1]. Many of these products use measurements from the ABIs’ ten infrared (IR) channels (Table 2 and Figure 1). To ensure product quality, the ABI IR channels must be well calibrated.
The ABI IR channels are calibrated onboard, using the views of the Internal Calibration Target (ICT) and the cold space, augmented with the scan mirror temperature and emissivity, system nonlinearity, and other ancillary information [2]. However, ABI IR channel calibration must be independently validated because deficiencies in onboard calibration are often difficult to detect using the ABI’s own data. A well-established method of validation is to compare the radiances from a sensor on a geostationary platform (“GEO”) with those from a hyperspectral sensor on a Low Earth Orbit spacecraft (“LEO”) [3,4]. This GEO-LEO comparison has been used to validate ABI radiance [5].
Another method of validation is to compare the radiances measured by two GEO instruments, hence the name GEO-GEO, which was used informally to assess the reasonableness of the radiance by GOES-10 and the subsequent GOES immediately post launch [6,7,8,9,10]. Applications of GEO-GEO comparison were rather limited in the early days, however, partly because the mismatch in the spectral response function (SRF) of the two GEOs introduces uncertainty in the validation of absolute accuracy. It was not until the advent of hyperspectral sensors that the validation of absolute accuracy for spectrally mismatched channels was later enabled [3].
It was later realized, however, that instruments on a three-axis stabilized spacecraft in geostationary orbit are subject to diurnally varying heating, particularly at satellite night, that poses unprecedent challenge to IR calibration, for example the Midnight Blackbody Calibration Correction [11]. It is of interest to confirm whether ABIs have overcome this challenge, for which GEO-LEO calibration was helpful but inadequate [12,13], because LEO orbits underpass GEO only twice a day. On the other hand, GEO-GEO comparison for ABIs can be made all day long every ten minutes, which makes it an ideal tool for this application. Therefore, with a stable and well performed GOES-16 ABI having achieved its Full Validation Maturity [14], GEO-GEO comparison was planned for GOES-17 and the future GOES missions to frequently evaluate the calibration among the ABIs by studying their relative difference, leaving the validation of absolute calibration accuracy to GEO-LEO comparisons.
The ABI on GOES-17 suffered an unexpected anomaly shortly after launch. Its Loop Heat Pipe (LHP) did not function as designed, leading to insufficient cooling capacity to maintain the temperature of its Focal Plane Module (FPM) and other optical components [15]. This anomaly affected the radiometric calibration of its IR channels (except for Channel 7 at 3.9 µm). Efforts were made to mitigate the impacts of this anomaly, including the following:
Raise the FPM temperature from 60 K (designed) to 81 K (and even higher later) and optimize the Gain Set (“GS I”) for the elevated FPM temperature;
Use an alternative Gain Set (“GS III”) daily, when applicable, to extend the usable period of ABI IR channels when the FPM temperature could not be maintained;
Increase ICT calibration frequency from every ten minutes to five minutes;
A semi-annual yaw flip to minimize the heating;
Implement the Predictive Calibration (pCal) [16,17] that extrapolates the space count and detector responsivity to compensate for the rapidly changing instrument temperature;
Reduce earth observations during a certain period of time to delay the onset of saturation.
The effect of the GOES-17 ABI LHP anomaly is fundamentally diurnal (worse around midnight), in addition to seasonal (worse during eclipse season) and long term (worse in later years). GEO-GEO comparison is an ideal tool to detect, characterize, and verify the mitigation of diurnally varying calibration challenges. GEO-GEO comparison has also been implemented for the GOES-18 ABI that performed nominally. This paper demonstrates how GEO-GEO comparison can be used for normal and abnormal satellite instruments. Following this introduction, Section 2 of this paper describes the algorithm of GEO-GEO inter-comparison; Section 3 presents its general characteristics; Section 4 shows selected applications; and Section 5 summarizes conclusions.

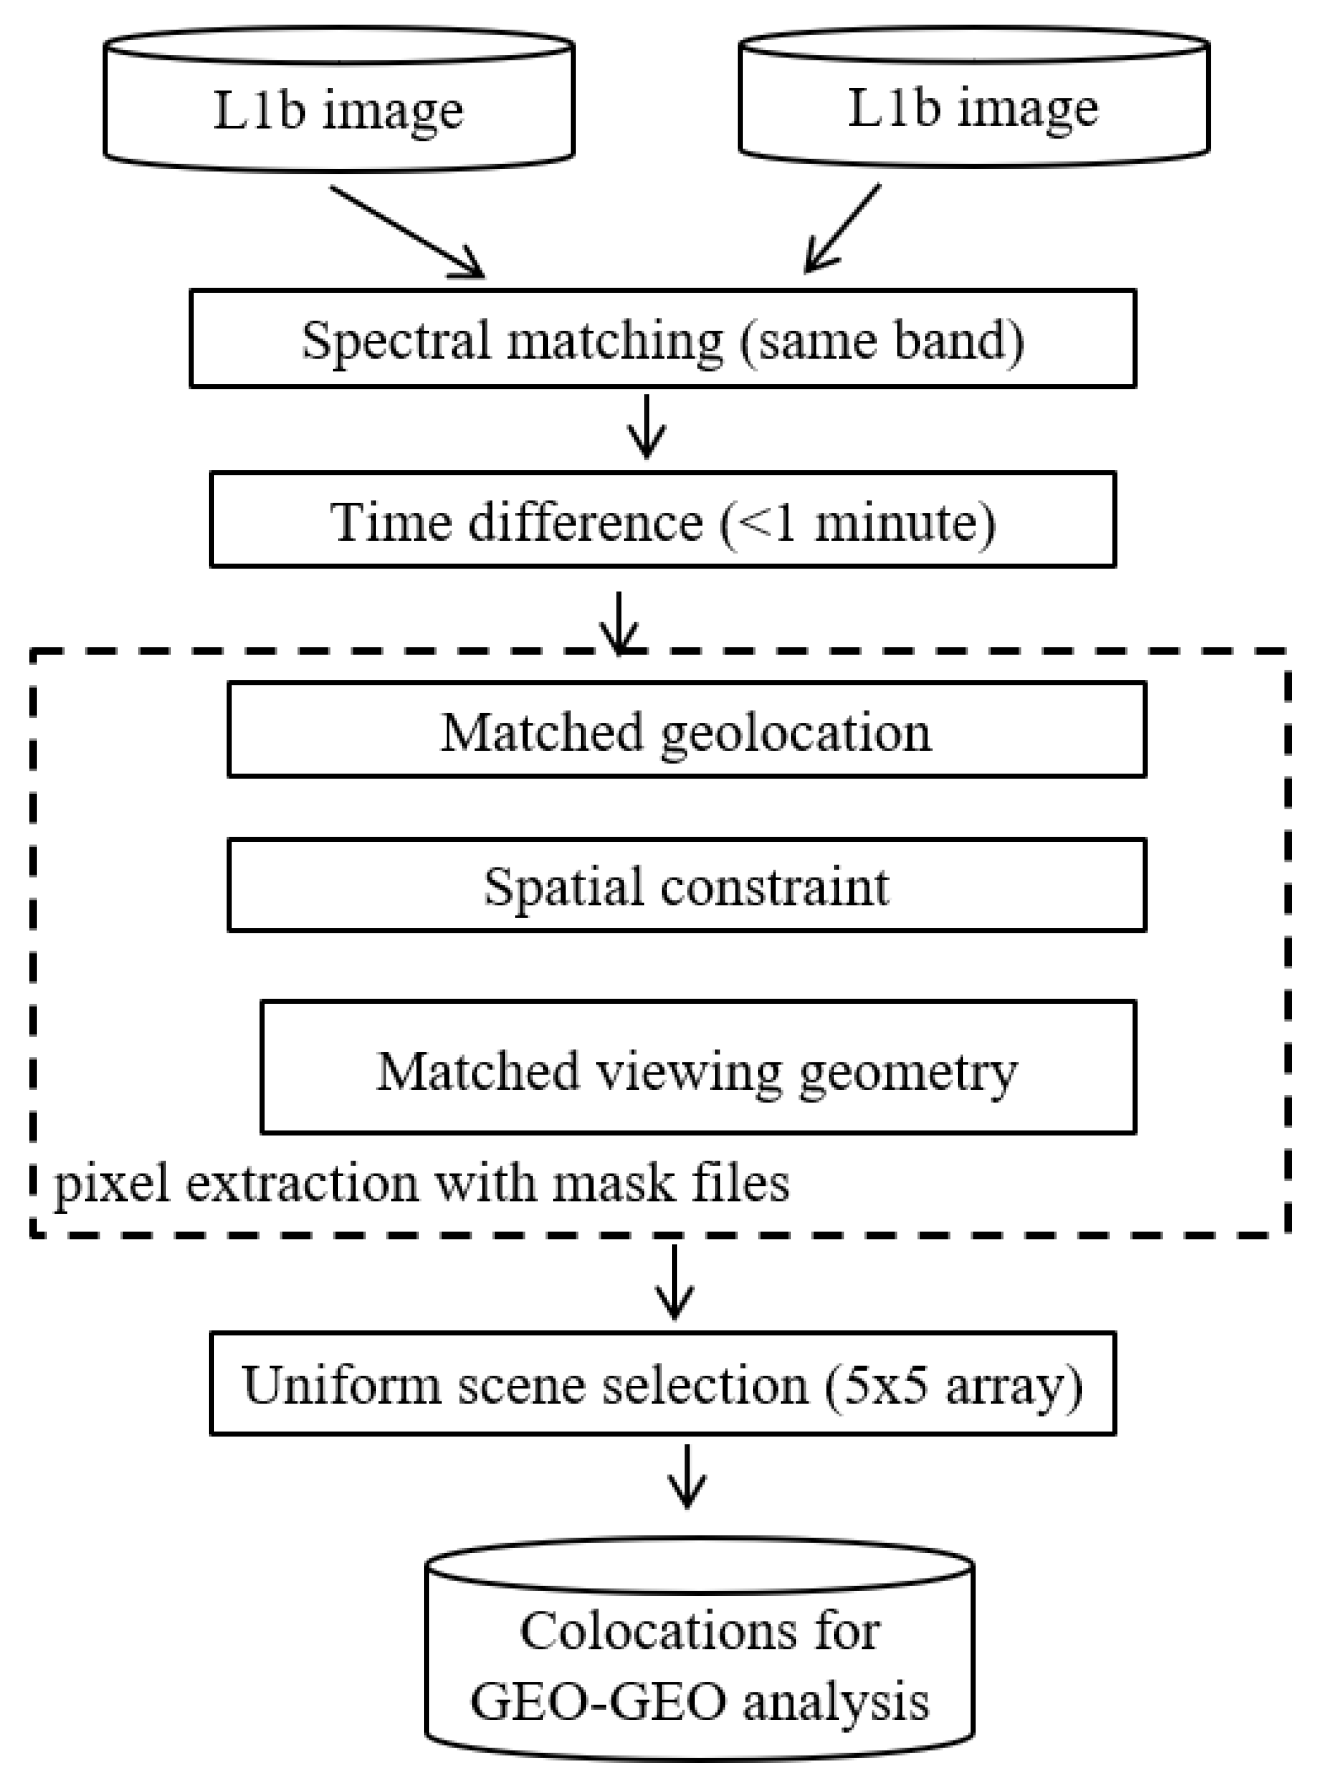
2. Algorithm of GEO-GEO Inter-Comparison

The GEO-GEO comparison in this study is based on the pixel-to-pixel radiance difference of uniform scenes from the overlapping ocean areas, which is in the middle of two satellite nadirs. Figure 2 illustrates the flowchart for the collocated pixel selection. All the inputs are the Level 1b (L1b) Full Disk (FD) images for the IR channels.

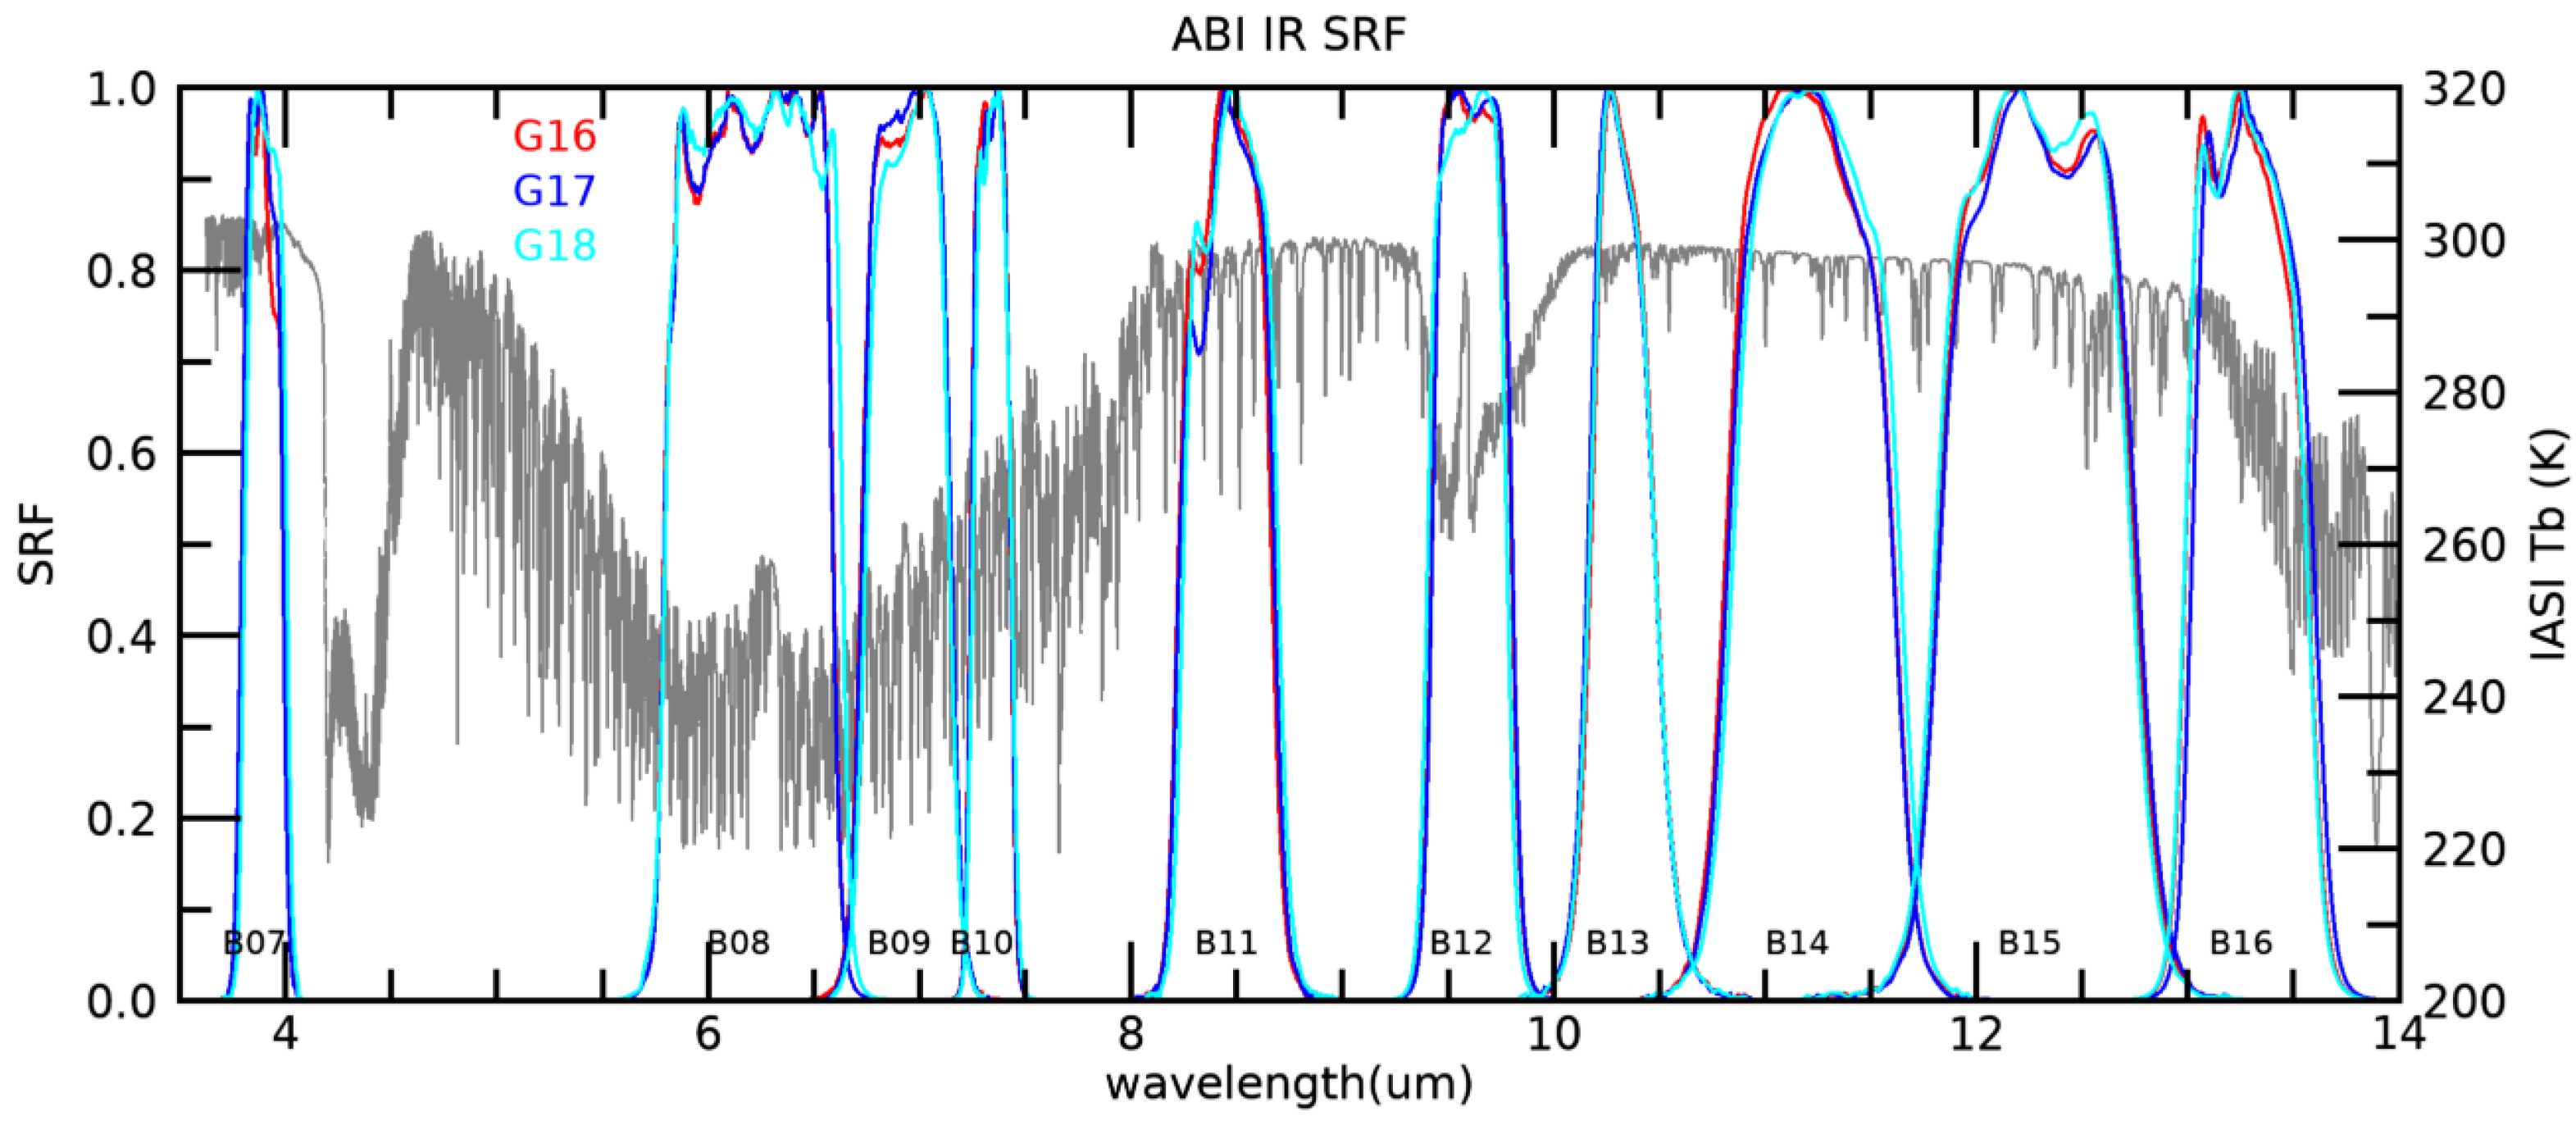
2.1. Spectral Matching

Radiances of matching channels from different ABIs are compared. As shown in Figure 1, their SRFs are not the same. It is possible to compensate for the SRF difference to some extent with a spectral adjustment method [18]. Yet, in this study, it is the time-series of radiance difference without SRF adjustment that is used to examine the calibration consistency between two monitored instruments.

2.2. Temporal Matching

The default ABI scan mode is Mode 6, which consists of one FD scan every ten minutes. It allows for the GEO-GEO inter-comparison every ten minutes. Although a temporal threshold of one-minute is set to select FD images, the actual scan time difference at the collocated scenes is generally within a few seconds. Figure 3 shows the histograms of the time difference between the points centered between the start and end times of the concurrent FD images among the three satellites in November 2022. The time difference is less than four seconds between G18 and G16, and generally less than five seconds between G17 and G16 and G17 and G18. There is a small number of paired images between G17 and G16 and G17 and G18 showing a time difference of about 48 s. This is because a special timeline, called the Mode 3 “cooling” timeline, with more space views to dissipate heat, was employed for G17 from 6:00 UTC to 12:00 UTC for certain days near the eclipse seasons since February 2020 to mitigate the impact of instrument thermal stress near eclipse seasons. In Figure 3, it was from 14 October till 15 November 2022. This Mode 3 timeline features a 15 min interval of FD images, contributing to the slightly larger time difference between G17 and G16 and G17 and G18. Since more than 95% of the collocations are within five seconds, differences due to the time difference are considered negligible.

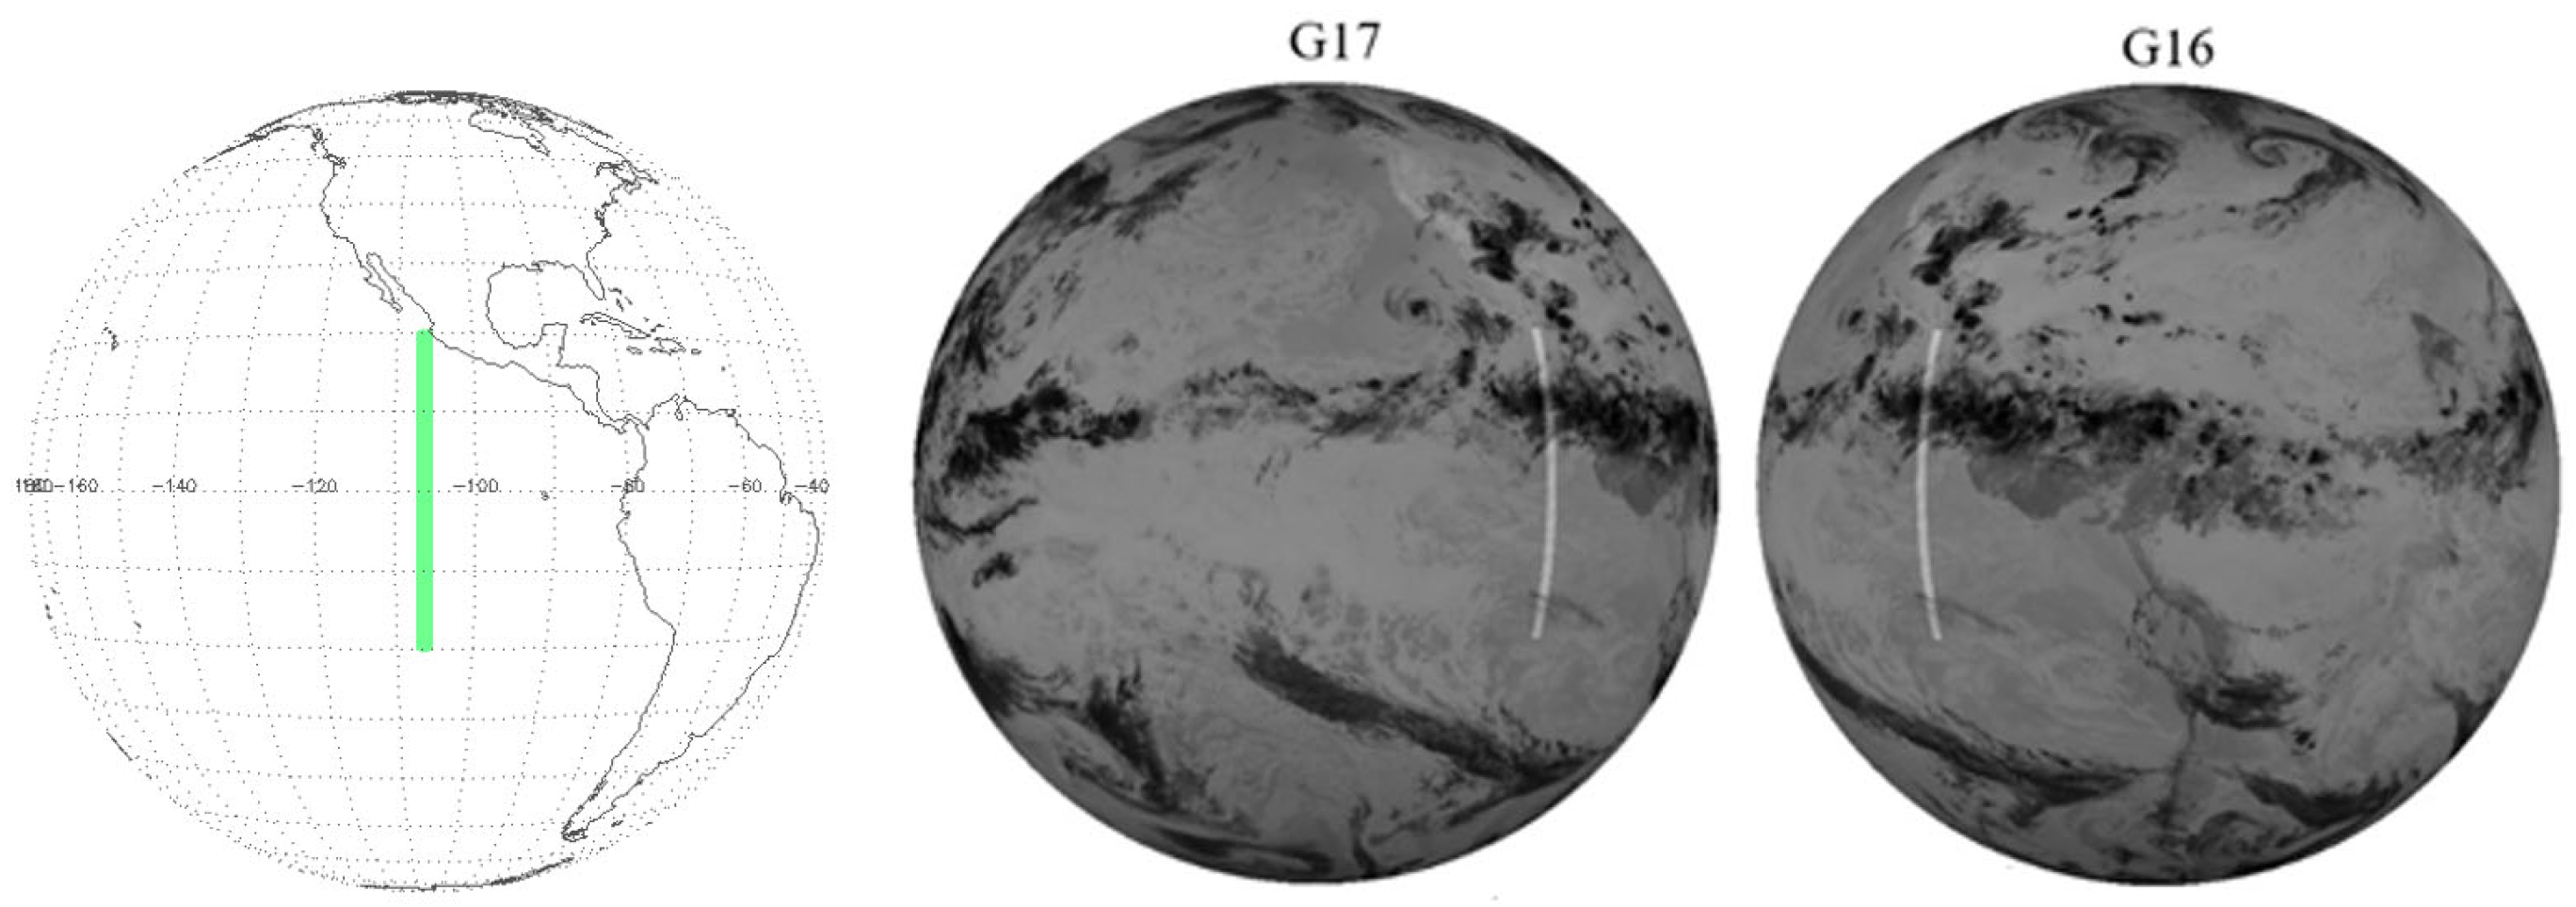
2.3. Geolocation Matching

For an ABI pixel in the area of comparison, the nearest pixel of the other ABI is found, and these two pixels are designated as the matched pixels. Since the angular separation distance between ABI IR pixels is 56 µrad (2 km at nadir), the distance between the matched pixels must be less than 28√2 = 40 µrad, often much less. This is an order of magnitude larger than geolocation error of ABIs but is an order of magnitude smaller than the effects of parallax and atmospheric refraction (ref. Section 2.6).

2.4. Spatial Constraint

Due to the impact of shadows, rough land surfaces can exhibit directional emissivity during daytime [19]. The phenomenon was observed for the ABI IR channels in the time-series of G17 and G16 inter-comparison over the land area in Mexico [20]. For the GOES-East and GOES-West ABI inter-comparison, data between the latitude of 20°S and 20°N, which mainly cover ocean surface, are used in this study.

2.5. Viewing Zenith Matching

Viewing azimuth control is essentially impractical for the GEO-GEO comparison. However, matching in viewing zenith angle is applied to reduce the difference in path length. Since the path length is inversely proportional to the cosine viewing zenith angle, the cosine viewing zenith angle difference is used to characterize the viewing geometric difference [3].
v i e w i n g   z e n i t h   a n g l e   d i f f e r e n c e = 1 c o s ( V Z N _ G 1 ) c o s ( V Z N _ G 2 )
where VZN_G1 and VZN_G2 are the viewing zenith angles of the two comparison satellites, respectively.
The maximum value of the cosine viewing zenith difference is set to 2% for the GOES-East and GOES-West satellites [21,22]. As the geolocation of the ABI L1b pixel is in a fixed grid, a mask file is used for the pixels meeting the geolocation and geometric criteria within 20°S and 20°N latitude inside the dashed box in Figure 2. The spatial distributions of the pixels covered with the mask files are shown in Figure 4 for GOES-East (G16) and GOES-West (G17). The number of the mask pixels is about 171,000 for G17–G16 and about 172,000 for G18–G16, due to the slight satellite position difference between G17 and G18.

2.6. Uniformity

A mismatch in space can happen even if the geolocation of both ABIs is perfect. For clear ocean, scenes farther away from the ABI nadir may appear at the designated location due to atmospheric refraction. For features with high elevation such as mountains and clouds, on the other hand, scenes closer to the ABI nadir may appear at the designated location due to parallax. Since these effects depend on atmospheric density profile and cloud height, it is not practical to predict and correct them beforehand. Instead, the collocated pixels are required to be in a relatively uniform area such that even if mismatch occurs, the measurements would still be similar.
In this study, scene uniformity is characterized by the standard deviation within a region of 5 × 5 pixels (10 km by 10 km at nadir) centered at the matched pixel. As shown in Appendix A, this is adequate to mitigate both the effects of parallax and atmospheric refraction. The threshold values are set at 10 times the mean detector noise of each IR band measured for G16 and G17 (GS I period for G17). The same thresholds of G16 are used for G18 IR bands, as their detector noise magnitude are comparable [21]. As shown in Table 3, the mean detector noise for G17 is generally larger than that of G16 and G18 across all the IR bands, except for B07, where all three satellites exhibit relatively high noise levels. The GEO-GEO difference is represented with the mean radiance difference of the selected collocations for each matched timeline at every 10 min.

2.7. Tb Difference at Equivalent Brightness Temperature 300 K

The ABI data are calibrated to and analyzed as radiance. To facilitate the interpretation and comparison of performance among different IR bands, the difference in radiance ΔR is converted to the difference in brightness temperature (ΔTb) at 300 K as follows [14]:
T b = R / R λ T ( λ , 300   K )
where R λ T ( λ , 300   K ) is the partial derivative of the Plank function with respect to temperature at wavelength λ and temperature 300 K.

3. Characteristics of GEO-GEO Inter-Comparison

3.1. Temperature Range

Figure 5 and Figure 6 present the density scatterplots of the G17–G16 and G18–G16 difference for the ten IR channels, respectively, using collocation data collected between 02:30 and 03:30 UTC on 24 November 2022. The collocations are predominant over warm oceans, with a narrow Tb range of about 15–25 K across all IR channels for both satellite pairs. B07 exhibits the largest Tb range of about 35 K for both satellite pairs, due to a relaxed threshold for this channel of all three satellites (Table 3).
The GEO-GEO differences are highly clustered around the mean difference, which helps reduce the potential GEO-GEO variations due to changing Earth scenes. The fitting slope is none-zero, which reflects a combination of SRF and possible radiometric calibration differences in the paired IR channel. Since this paper focuses on the mean radiance difference of each timeline, the narrow Tb range of collocation data also contributes to reducing the GEO-GEO variation associated with scene variability.

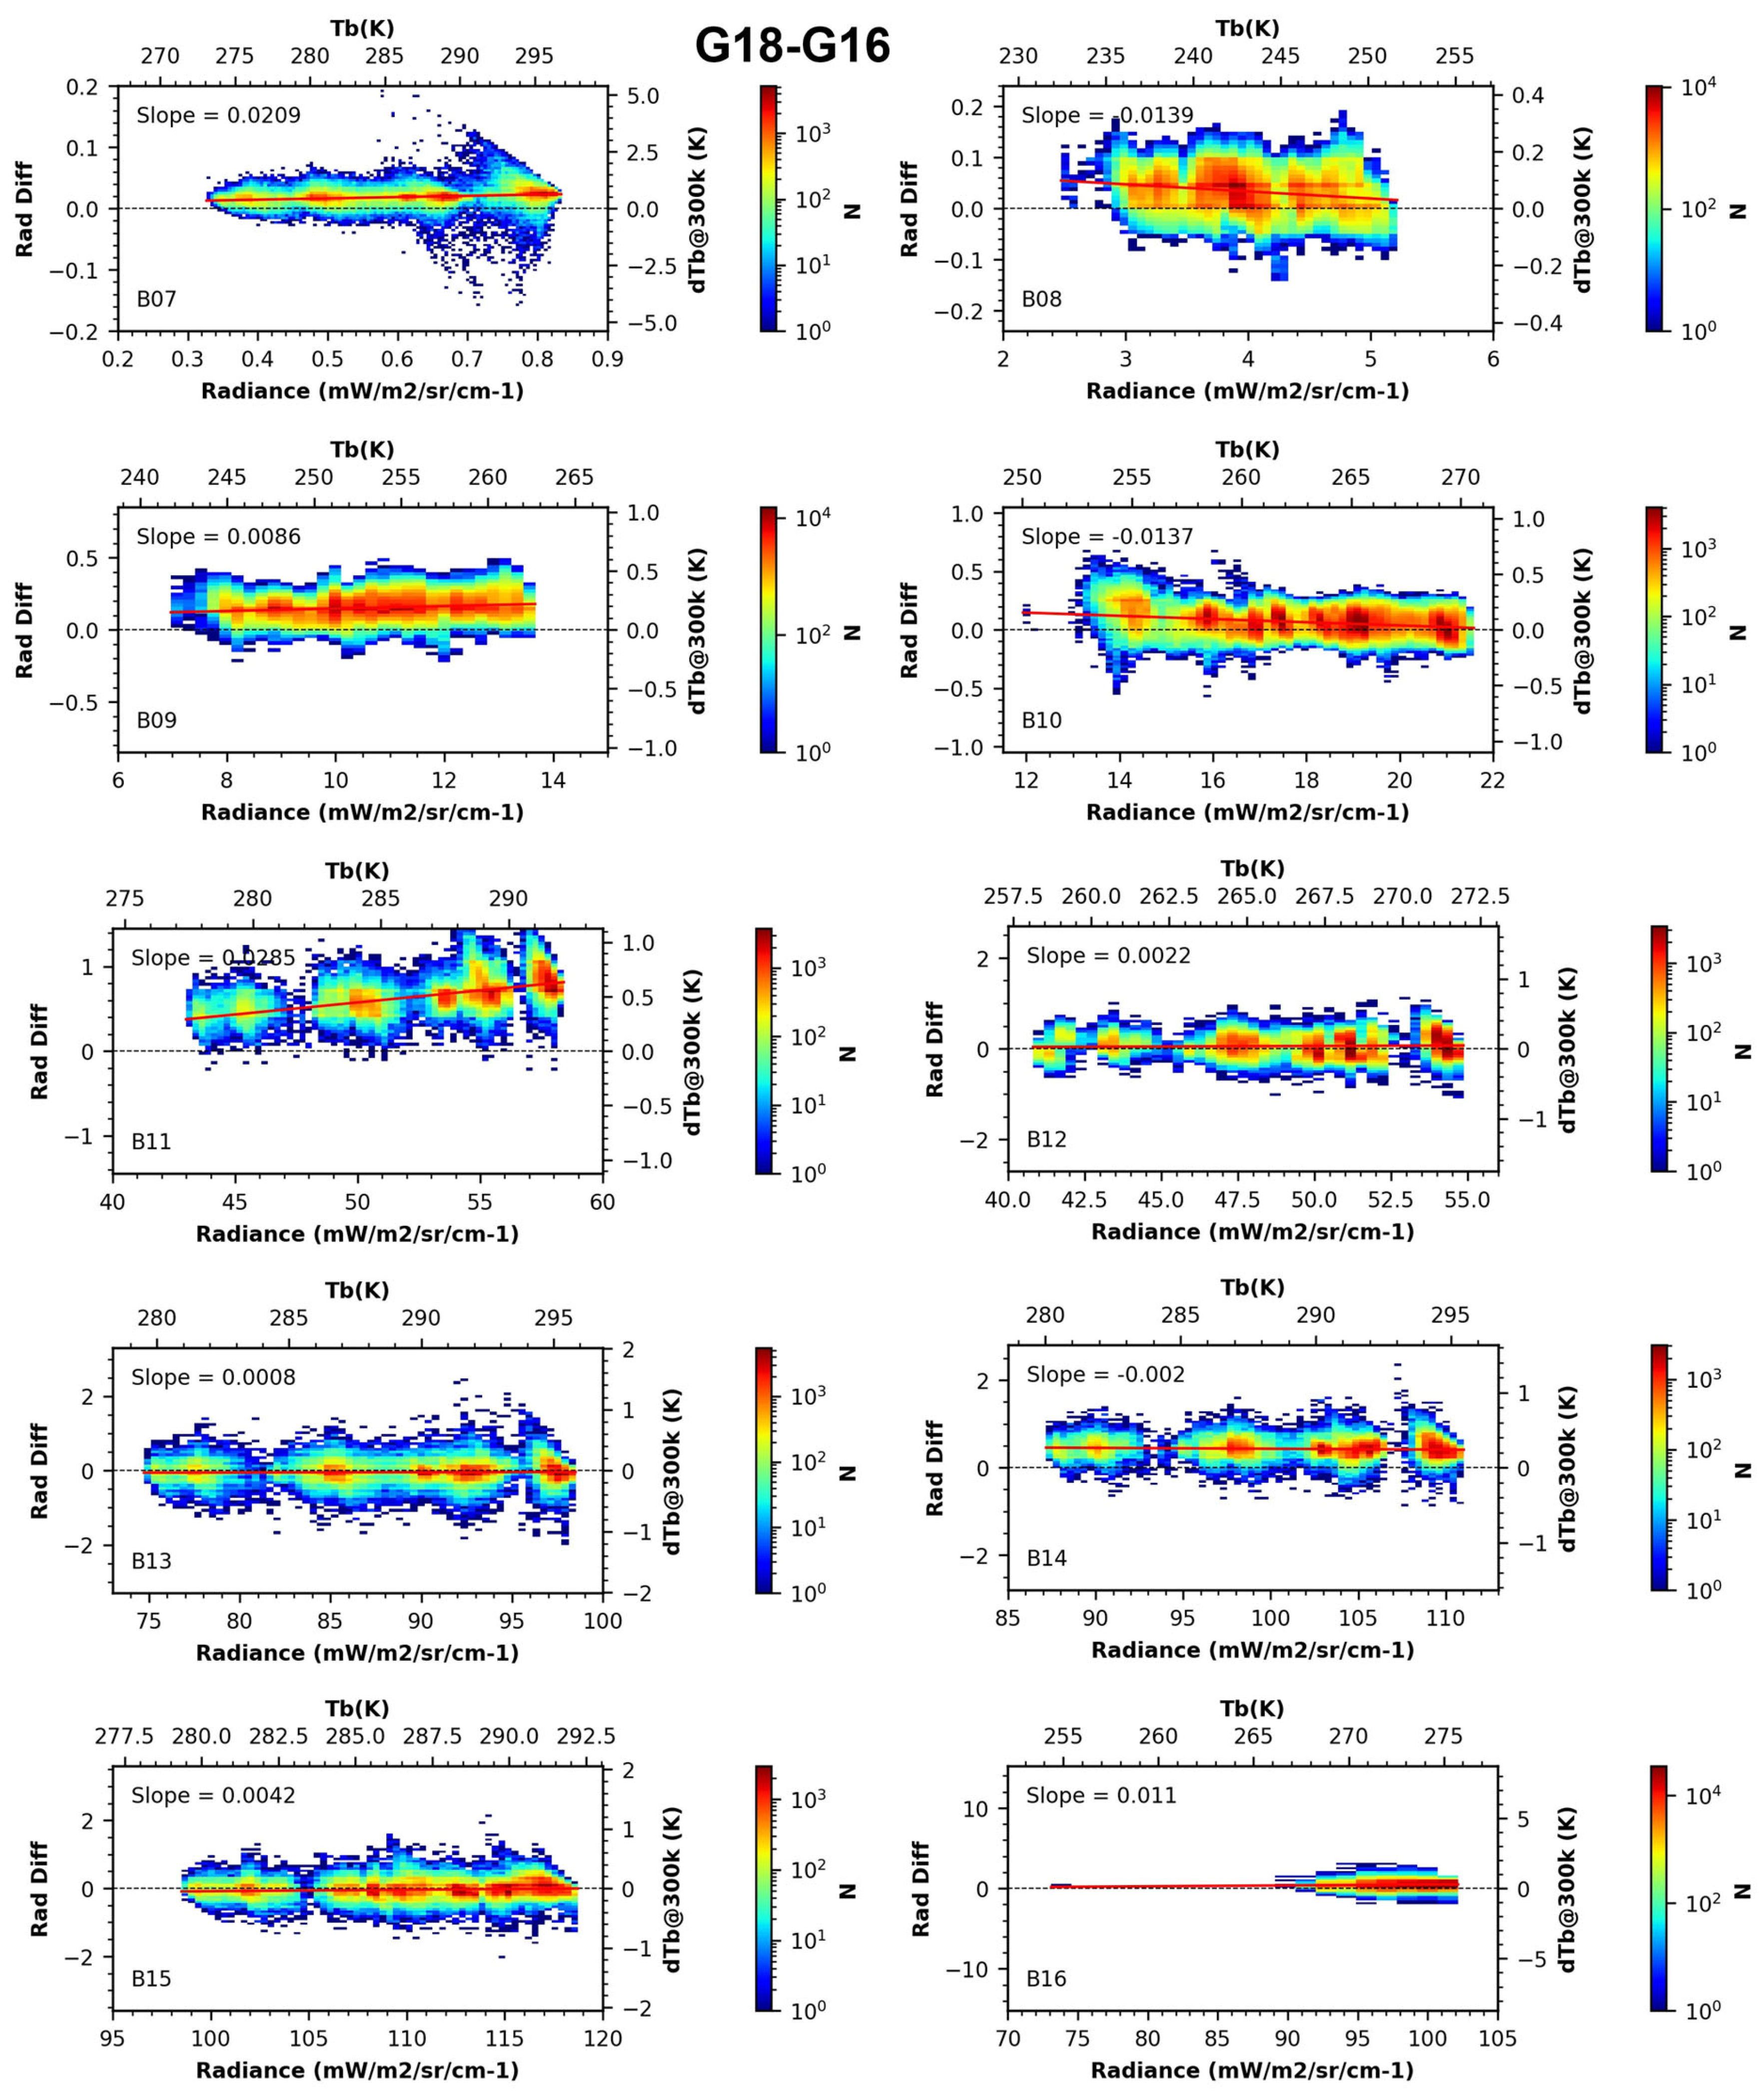
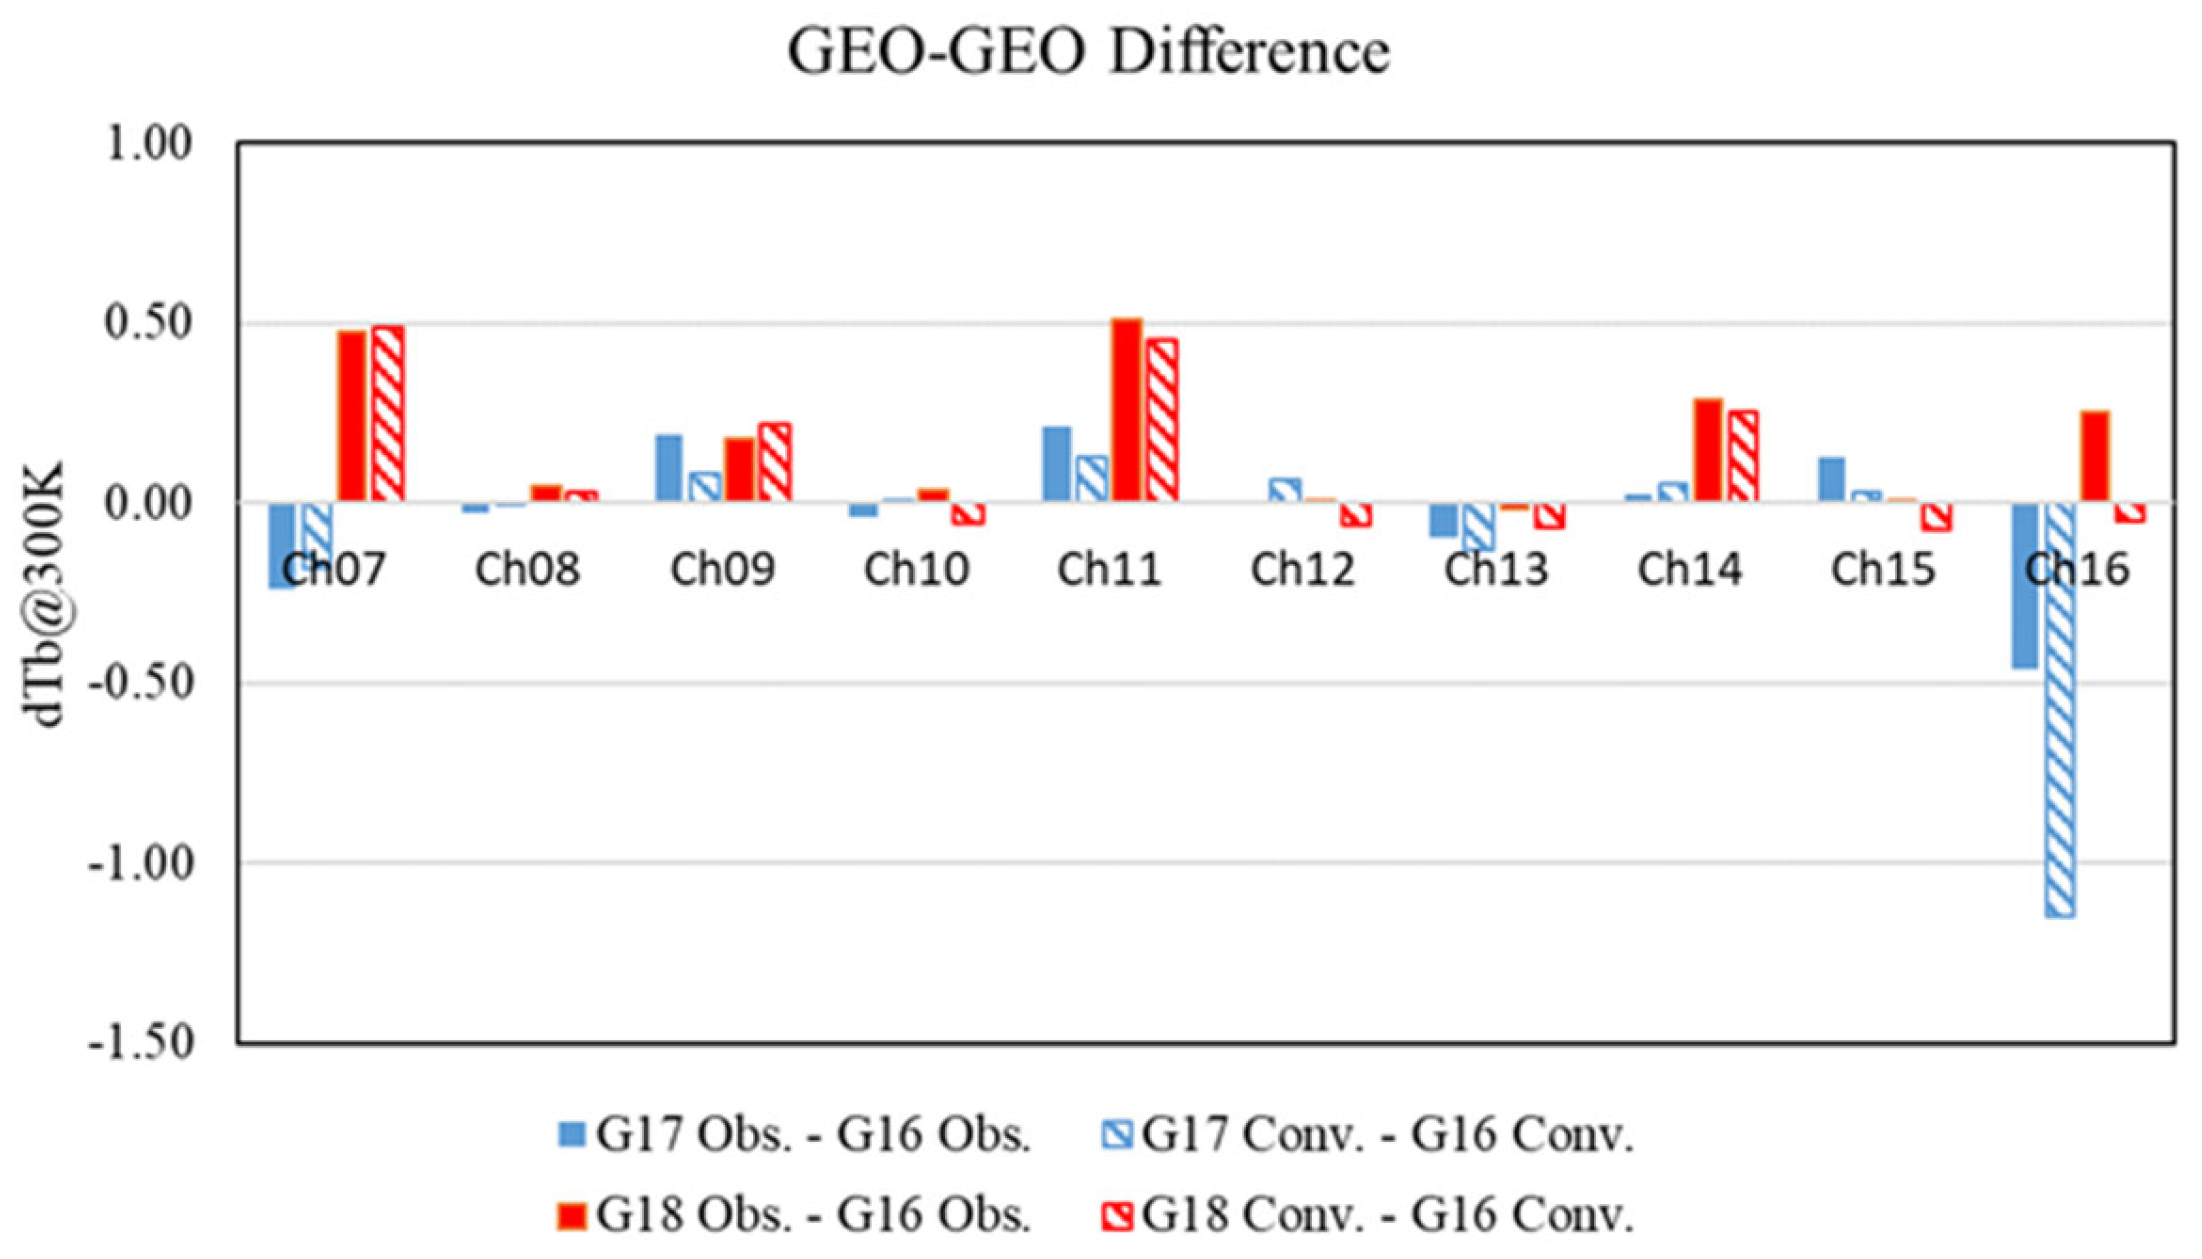
3.2. Mean Differences
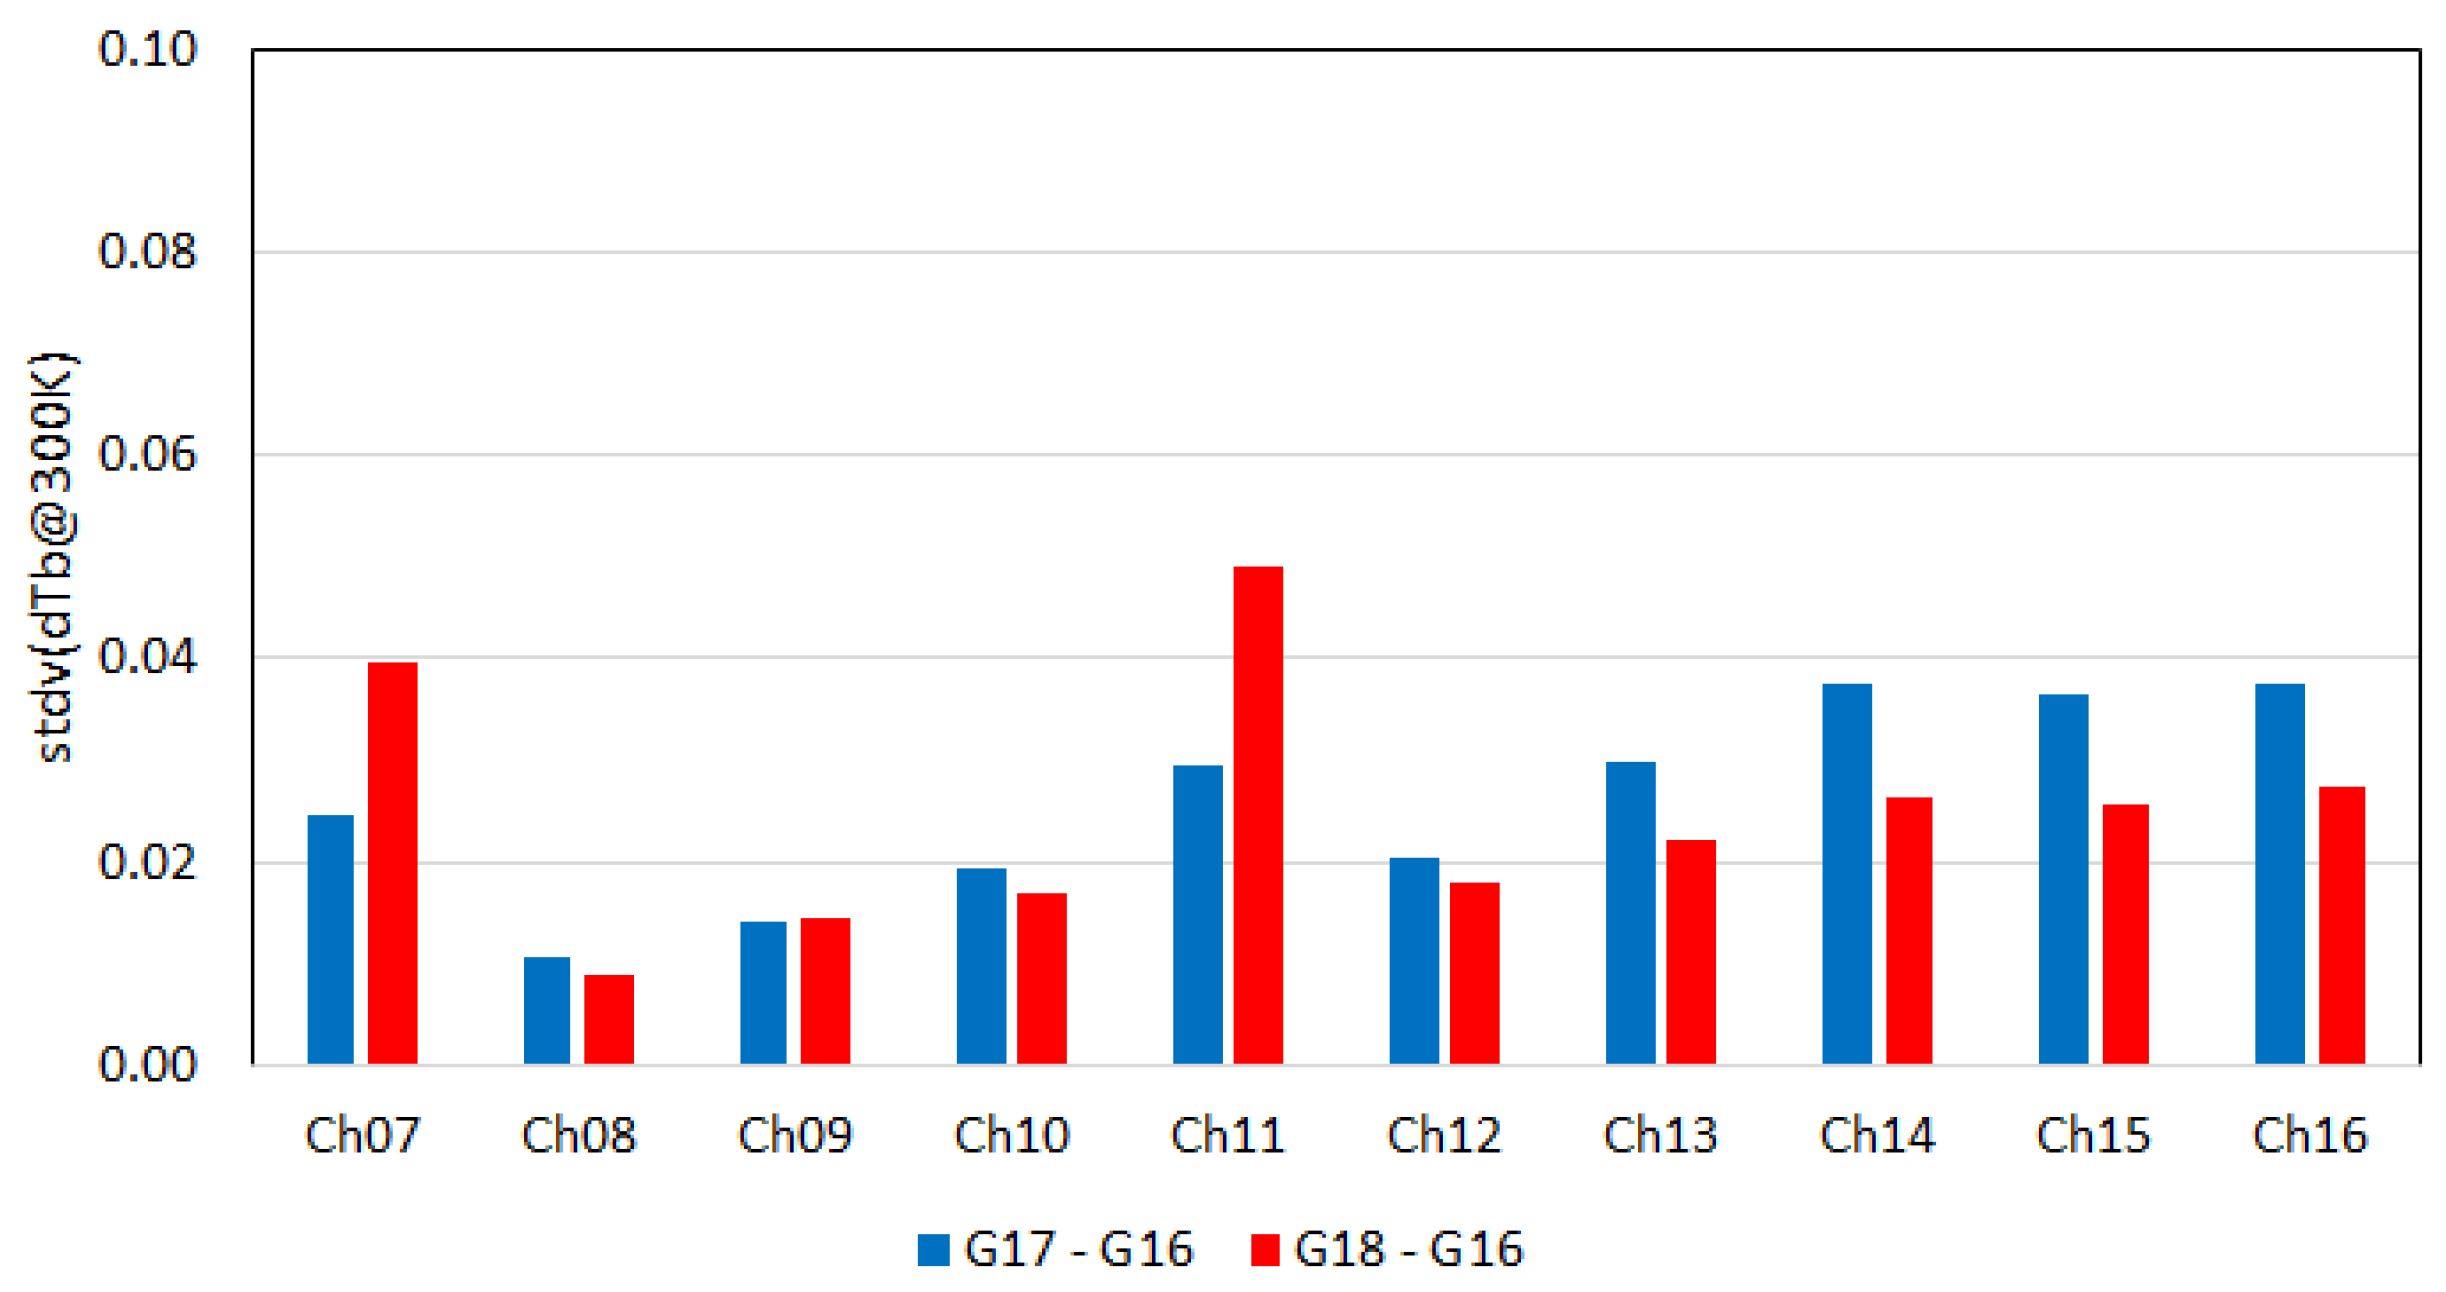
Mean differences of the ten ABI IR channels for two pairs of ABIs (G17–G16 in blue and G18–G16 in red) are shown in Figure 7. In addition to the measured radiance difference in solid bars, also shown in striped bars are the radiance differences that were convolved with the collocated IASI-C radiances and respective SRFs. While the differences vary among channels and between ABI pairs, they are primarily due to the SRF differences for most IR channels. The relatively large differences for Ch16 of both satellite pairs are likely due to the spectral calibration uncertainty for this channel [23,24], which are more significant for G17 as it was operated at a temperature different from design.

3.3. Uncertainty

The uncertainty of the GEO-GEO comparison is estimated by the standard deviation of the radiance difference for the data between 15 and 25 November 2022. During this time period, the radiometric calibration of all the three satellites was stable. For the G17–G16 difference, only data between 20:00 and 8:00 UTC when G17 was in the GS I period are used for B08–B16. For B07, in all cases, only the nighttime data (02:00–12:00 UTC) are used to avoid the reflected solar radiance. Contributors to the uncertainty include mismatches in time and space, atmospheric variability, instrument noise, calibration fluctuations, and so forth.
As shown in Figure 8, the uncertainty is within 50 mK across all IR channels at both satellite pairs. The uncertainty for G17–G16 is slightly higher than G18–G16 in most IR channels. The high temporal resolution of every 10 min interval, coupled with the low uncertainty of this method, makes the GEO-GEO comparison highly sensitive to detecting subtle changes in ABI calibration at varying temporal scales, which is crucial for improving the operational calibration algorithms.

4. Applications of GEO-GEO Comparisons

4.1. Monitoring Calibration in near Real Time

The daily GEO-GEO comparison derived with the algorithms described in this paper is routinely monitored on the GOES Calibration website https://www.star.nesdis.noaa.gov/GOESCal/. Figure 9 is a typical daily monitoring of the GEO-GEO difference between GOES-West (G17/G18) and GOES-East (G16), using the data from 23–24 November 2022 as an example. During this time, G18 was positioned near the GOES-West location, only 0.3 degrees apart from G17.
For Ch07, consistent GEO-GEO differences are observed for G17–G16 and G18–G16 between approximately 01:00 UTC and 12:00 UTC, which corresponds to nighttime in the collocation area. These consistent offsets build a robust demonstration of radiometric calibration stability for the three satellites during these hours. However, during the daytime, between approximately 12:00 UTC and 01:00 UTC, strong variations are observed between the two GOES-East and GOES-West datasets due to directional solar reflected radiation. Yet due to the nearly identical viewing geometry between G17 and G18 on these days, the impact of directional solar radiation is greatly cancelled out for G17–G18, providing a unique opportunity to use the GEO-GEO method to examine the daytime calibration stability for this channel between these two satellites. As shown in the figure, the G17–G18 difference is generally consistent throughout day and night. The small perturbation at the collocation local noon (about 19:00 UTC) may be attributed to the residual of reflected solar energy difference which is the strongest at local noon in the day.
For Ch08 through Ch16, the differences between G16 and G18 are generally consistent, with most IR channels showing variation within about 0.1 K@300K. The largest variation of about 0.2 K@300K was observed in Ch11 for G18–G16. The consistency of G18–G16 difference implies small diurnal variation for both satellites in these channels. During the G17 GS I period, consistent offsets are also observed between G17 and G16, demonstrating the stable calibration for G17 during this time period, except that the largest variation of about 0.3 K@300K occurred in Ch14 for G17–G16. Similar results were reported by Gunshor et al. [25] using an area-based GEO-GEO method, confirming that G17 IR channels were stable during its GS I period.
However, notable variations and data gaps are observed for some G17–G16 IR channels during the G17 GS III period. These reflect the calibration challenges during this period for G17, particularly around the peak FPM temperature near the satellite midnight as the detectors in some IR channels become saturated (https://www.goes-r.gov/users/GOES-17-ABI-Performance.html).

4.2. Revising Calibration Algorithm

For the GOES-17 ABI, as indicated by the black symbols in Figure 9 and Figure 10, its FPM temperature became unstable during certain times of the day because of the limited cooling capacity. It rose rapidly, peaked after satellite midnight, and fell ack to normal just as quickly. The detector responsivity and dark current changed with the fluctuating FPM temperature. These combined impacts led to a channel-dependent warm or cold radiance [17], which increased toward the updates of gain every five minutes, and the space look count was at less than about 30 s. This came to an end when the FPM temperature stabilized, and the reverse process began when the FPM temperature fell back to normal, as shown by the blue curves in Figure 10.
Assuming GOES-16 ABI measurements were stable [5], the blue curve in Figure 10 shows that the GOES-17 ABI bias is proportional to the first derivative of the FPM temperature. To mitigate this impact, a “Predictive Calibration (pCal)” was implemented that uses the last two space look measurements and the last two gain values to extrapolate the space count and responsivity to the time of each earth scene measurement. The red curve in Figure 10 shows that pCal substantially reduced the bias caused by the unstable FPM temperature. GEO-GEO comparison played a critical role in the development of the pCal algorithm by providing GOES-17 ABI bias at high frequency and certainty in near real time.

4.3. Improving Calibration Operation

GOES-17 ABI IR channel calibration presented many unique calibration challenges, directly or indirectly related to the LHP anomaly, for which GEO-GEO comparison was often an invaluable tool. For example, another mitigation for the LHP anomaly, mentioned in the Introduction, is to use an alternative Gain Set (“GS III”) almost daily to extend the usable period of ABI IR channels when the peak FPM temperature was predicted to beyond 85 K [15]. However, this is incompatible with pCal, because space look measurements would change a lot after a Gain Set switch, leading to large errors in extrapolation. For this reason, pCal must be enabled after switching to GS III and disabled before switching back to GS I (it was feasible but unnecessary to activate and deactivate pCal for GS I because the FPM temperature was stable). An algorithm must be designed, tested, verified, and monitored to avoid the “collision” of the Gain Set switch and pCal activation, the details of which is beyond the scope of this paper.
Figure 11 is an example showing how GEO-GEO comparison is used in improving calibration operation. The GEO-GEO difference shows a spike for B12 at 10:00 UTC, when the thermal environment of the GOES-17 ABI became increasingly unstable and pCal should thus be applied to alleviate this instability. In fact, pCal was applied at 10:10 UTC, which brought the GEO-GEO difference back to normal, until the GOES-17 ABI was so hot that this channel was saturated at 11:00 UTC until 16:00 UTC on this day. The spike in this plot, along with similar occurrences on other days, prompted a review and led to subsequent improvement of the pCal activation procedure. The capability for near-real time detection of anomalies has enhanced timely troubleshooting and significantly reduced the frequency of such incidents.
Figure 12 shows another example. The top panel shows a bump of about 0.3 K@300K in the G17–G16 difference for Ch15 at 4:50 UTC on 16 October 2020. This bump with varying magnitude occurred at almost the same time for a few days in mid-October. While that alone cannot tell which ABI had the anomaly and for what reason, it triggered further investigation, such as the bottom panel of Figure 12, that reveals that the G16 image at 04:50 UTC has abnormally cold radiance. Inspection of similar images at another time and for G17 (now shown) did not reveal any anomalies. Further investigation revealed that this anomaly was attributed to the unexpected retainment of outdated calibration data for the impacted FD images, which was later resolved by adjusting the corresponding calibration look-up-table. Without the GEO-GEO comparison, it would be much more difficult to discover the incident, find the root cause, and validate the mitigation.

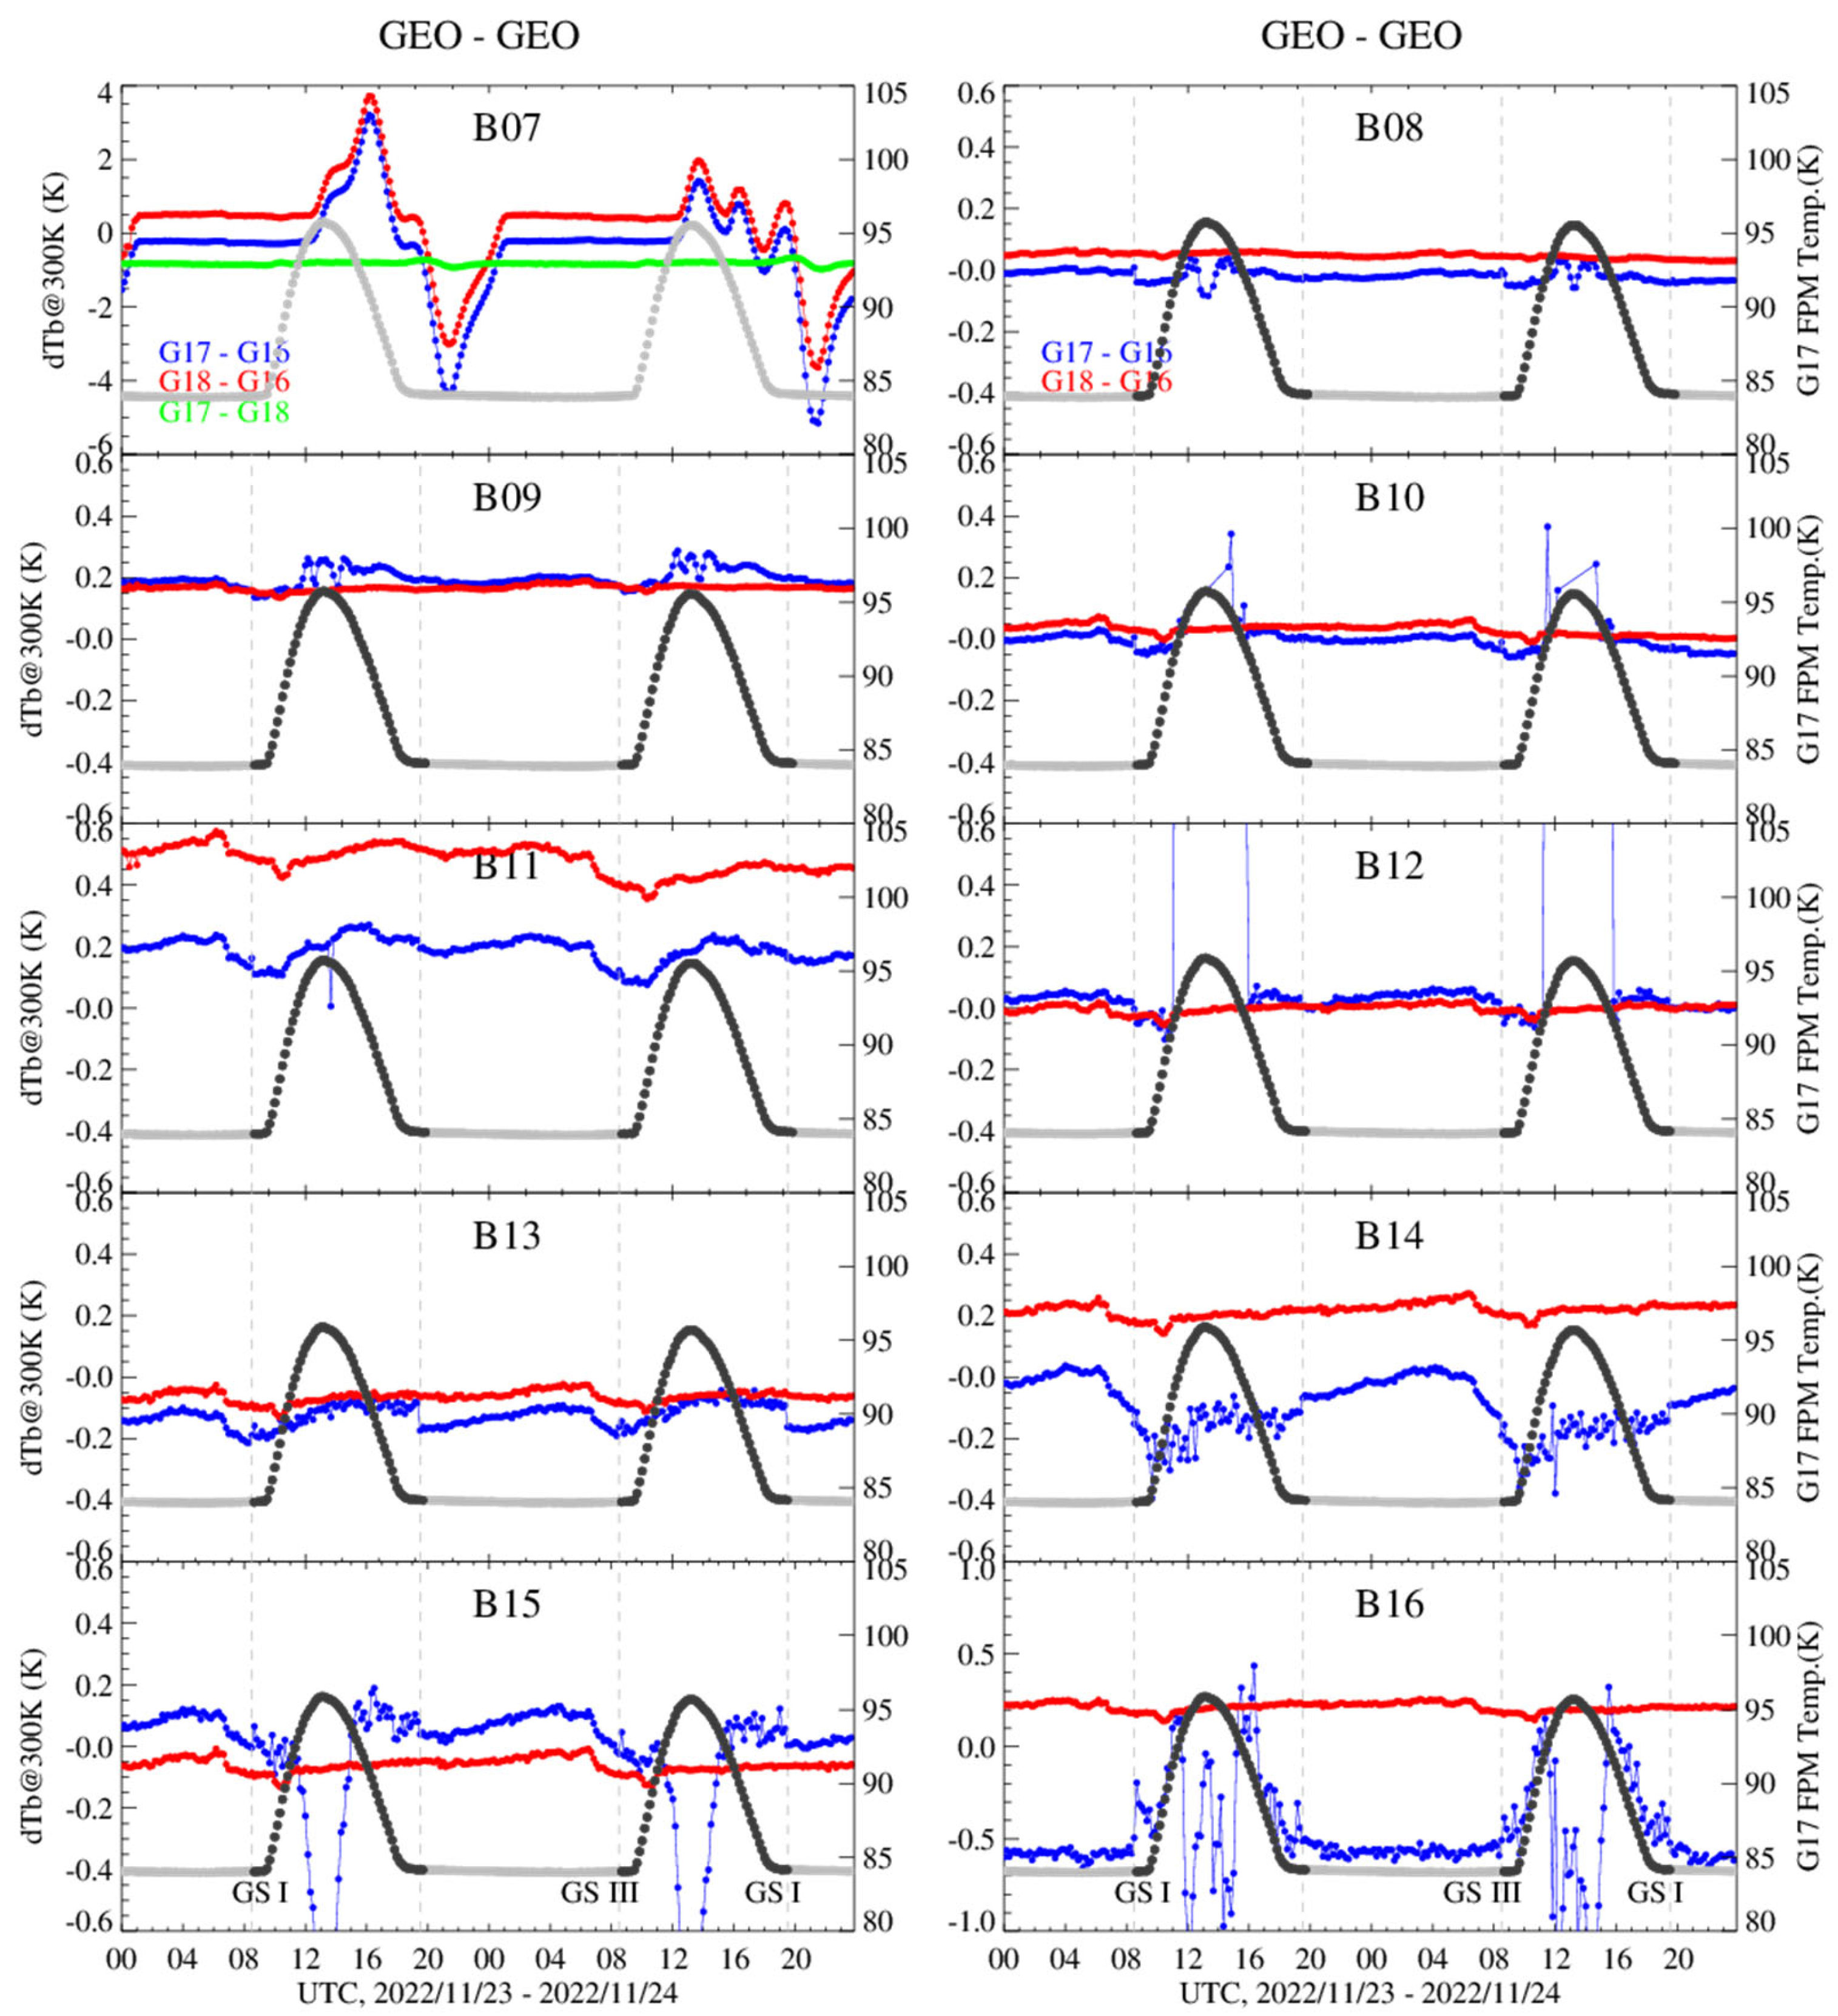
4.4. Detecting Calibration Anomalies

Figure 13 is the time-series of G17–G16 differences for Ch07 on 11 October 2022. Similar to the GEO-GEO Ch07 curves in Figure 9, a large variation in the differences was observed between approximately 13:00 UTC (06:00 local time at collocation) and 01:00 UTC (18:00 local time at collocation), due to the directionally reflected sunlight from the collocation to the two ABIs. However, unlike in Figure 9 which shows a consistent radiance difference between 02:00 UTC and 12:00 UTC during the nighttime at the collocation area, two excursions from the mean difference, with a maximum magnitude of about 0.25 K at 04:20 UTC and 09:20 UTC, were observed on this day. These excursions occurred around local midnight for GOES-16 and GOES-17, respectively, and were caused by straylight contamination when each respective ABI was observing the collocation area. The timing and magnitude of the straylight for Ch07 are consistent with previous findings [26,27], further confirming that Ch07 straylight remains well within the requirements.
As another example of using GEO-GEO comparison to monitor operational calibration, the left panel of Figure 14 shows a small bump in the G18–G16 difference on 25 July 2024. An investigation of the consecutive FD image difference displayed that the G16 image at 21:40 UTC had two narrow stripes of a cold anomaly, as shown on the right panel of Figure 14. This anomaly was further traced to lunar contamination in the space look at that time for this and a few other channels. The lunar intrusion rejection algorithm performed well for the other channels and the central portion of the intrusion for this channel but failed at the edges of the Moon. This discovery led to further assessment to optimize the lunar intrusion rejection thresholds.

4.5. Assessing Calibration Stability

Figure 15 depicts the G18–G16 difference for Ch13, showing every 10 min in a day (vertical axis) and every day in the year of 2023 (horizonal axis). The difference is relatively uniform and neutral (green) during daytime at collocation (13–01 UTC). At nighttime, however, it tends to be positive (yellow) between 04 and 07 UTC and negative (blue) 08–11 UTC. However, there are four oval shaped features of neutral difference (green) during two eclipse seasons, surrounded by positive differences around 05 UTC and negative differences around 09 UTC, the local midnight of G16 and G18, respectively. This is believed to be caused by straylight contamination to the space look of the ABIs. On an equinox day, as the Sun approaches the ABI nadir towards 05 UTC (G16 midnight), the ABI space look can be contaminated by minute but increasing amount of straylight, which reduces the calibrated radiance of its earth view data and leads to a positive G18–G16 difference. At a certain time, the Earth eclipses the Sun and shuts down the straylight, making the G18–G16 difference neutral, until the Sun emerges from the other side of the Earth, causing the sudden appearance but diminishing straylight contamination. This process repeats daily, with slightly different timing each day for the beginning, ending, and duration of the straylight, resulting in the oval shaped feature of the neutral difference in Figure 15. A similar process also happens to G18 later, resulting in similar oval shaped features around its eclipse at 08–11 UTC that are surrounded by negative differences. Further investigation revealed the causes of the colder radiance at midnight during eclipse seasons and around the winter solstice [28], which is beyond the scope of this paper.
As shown in Figure 15, the mean difference of the G18–G16 ABIs for this channel is −0.06 K. The deviation from the mean, due to straylight contamination at midnight, is less than 0.10 K [28], which is compliant with the requirement. This example demonstrates how GEO-GEO comparison can be used to confirm the precision and stability of ABI calibration.

5. Summary and Conclusions

This study presents an algorithm of direct comparison of similar instruments on two geostationary satellites with overlapping areas and its applications to the GOES ABI to improve the calibration and validation of its infrared channels. The algorithm is based on spectrally, spatially, and temporally collocated pixels in a homogeneous area over the ocean, which results in low uncertainty of the radiance comparison (50 mK at 300 K, 1-σ) for all IR channels of the ABIs on GOES-East (GOES-16) and GOES-West (GOES-17/18). This, combined with its high temporal resolution (every ten minutes), makes the GEO-GEO comparison capable of continuous monitoring of relative differences between two ABIs with high certainty in near real time, which is an ideal complement to the GEO-LEO comparison that quantifies the absolute calibration accuracy of each ABI.
The GEO-GEO comparison has been critical in optimizing the service of GOES-17 that suffered an anomaly in its cooling subsystem by revising the calibration algorithm and operation procedure. For normal operation, GEO-GEO comparisons have been used to detect calibration anomalies and assess calibration stability. For GOES-16/17/18 ABIs (during the GS I period), it is found that the excursion of calibrated radiance, when converted to brightness temperature variations at 300 K, is often less than 0.1 K except for some channels around midnight hours during eclipse seasons. Additionally, the GEO-GEO comparison is so sensitive that it detects the instability of ABI IR channel calibration near their local midnight and its seasonal variation. While the instability is negligible (well within the requirement) and has not been noticed by users, the fact that GEO-GEO comparison can characterize such small and transient calibration variations is a demonstration of what it is capable of.
ABIs employ linear arrays of detectors for their spectral bands. With hundreds of detector rows in each of the IR bands, calibration uniformity among individual detectors in a spectral band is of great interest. While the GEO-LEO and GEO-GEO comparisons are dedicated to monitoring channel average calibration accuracy and stability, respectively, other methods are better suited for evaluating the calibration uniformity among individual detectors in a spectral band. This will be described in a forthcoming communication.

Author Contributions

Conceptualization—X.W.; methodology and investigation—F.Y.; data analysis—F.Y., X.W., H.Y., H.X. and H.Q.; data collection and support—F.Y., H.Y., H.X. and H.Q.; software and plotting—F.Y., H.Y. and H.X.; initial manuscript—F.Y.; constructive review, editing, and oversight of this research—X.W.; manuscript reviews—all. All authors have read and agreed to the published version of the manuscript.

Funding

This work is funded by the NOAA GOES-R Program first through grant NA19NES432002 (Cooperative Institute for Satellite Earth System Studies—CISESS) at the Earth System Science Interdisciplinary Center (ESSIC), University of Maryland, and then contract 1305M423DNEEA0006/1332KP24F005 at Earth Resources Technology. The views, opinions, and findings contained in this paper are those of the authors and should not be construed as official positions, policy, or decisions of the NOAA or the U.S. Government.

Data Availability Statement

Public datasets are available at the link: https://www.aev.class.noaa.gov/saa/products/.

Acknowledgments

The authors would like to thank the NOAA PRO team for the effective coordination and the OSPO teams for the quick feedback on the operational calibration anomaly and variation detections.

Conflicts of Interest

Author Fangfang Yu, Hui Xu and Haifeng Qian were employed by the company Earth Resource Technology (ERT). The remaining authors declare that the research was conducted in the absence of any commercial or financial relationships that could be construed as a potential conflict of interest.

Appendix A. Uniformity Considerations

Appendix A.1. Displacement Due to Parallax

Derivation of parallax angle θ
Figure A1. Schematic of geometry to estimate the parallax angle (θ) for a cloud (C) at a height of h (km) above a point (P) on the Earth’s surface (blue curve). E stands for the Earth’s center, and S stands for the satellite. CP′ is perpendicular to SP ( C P S P ) ; S P   S P .
Remotesensing 17 01656 g0a1
As illustrated in Figure A1, from the Cosine Theorem:
S P 2 = S E 2 + P E 2 2 S E E P c o s ( δ )
and Sine Theorem:
sin ζ = S E s i n ( δ ) S P
Since
h = h s i n ( ζ )
It follows that
θ h S P h sin ζ S P = h SE * sin ζ S P 2 = S E     h sin δ S E 2 + P E 2 2 S E     P E cos δ
For a GEO satellite, SE (Satellite height + Earth radius = 35,786 km + 6378 km = 42,164 km) and PE (Earth radius = 6378 km) are known. For the comparison area that is between [20°S, 20°N] along 106°W, δ ( S E P S E C ) is 31.0° at equator and up to 36.3° at the south and north end. These yields θ = 16 h at the equator and θ = 18 h at the maximum (in unit of µrad/km). For θ = 280 µrad (5 IR pixels), clouds of up to 17.5 km at the equator or 15.5 km at the two ends of the comparison area can be accommodated.

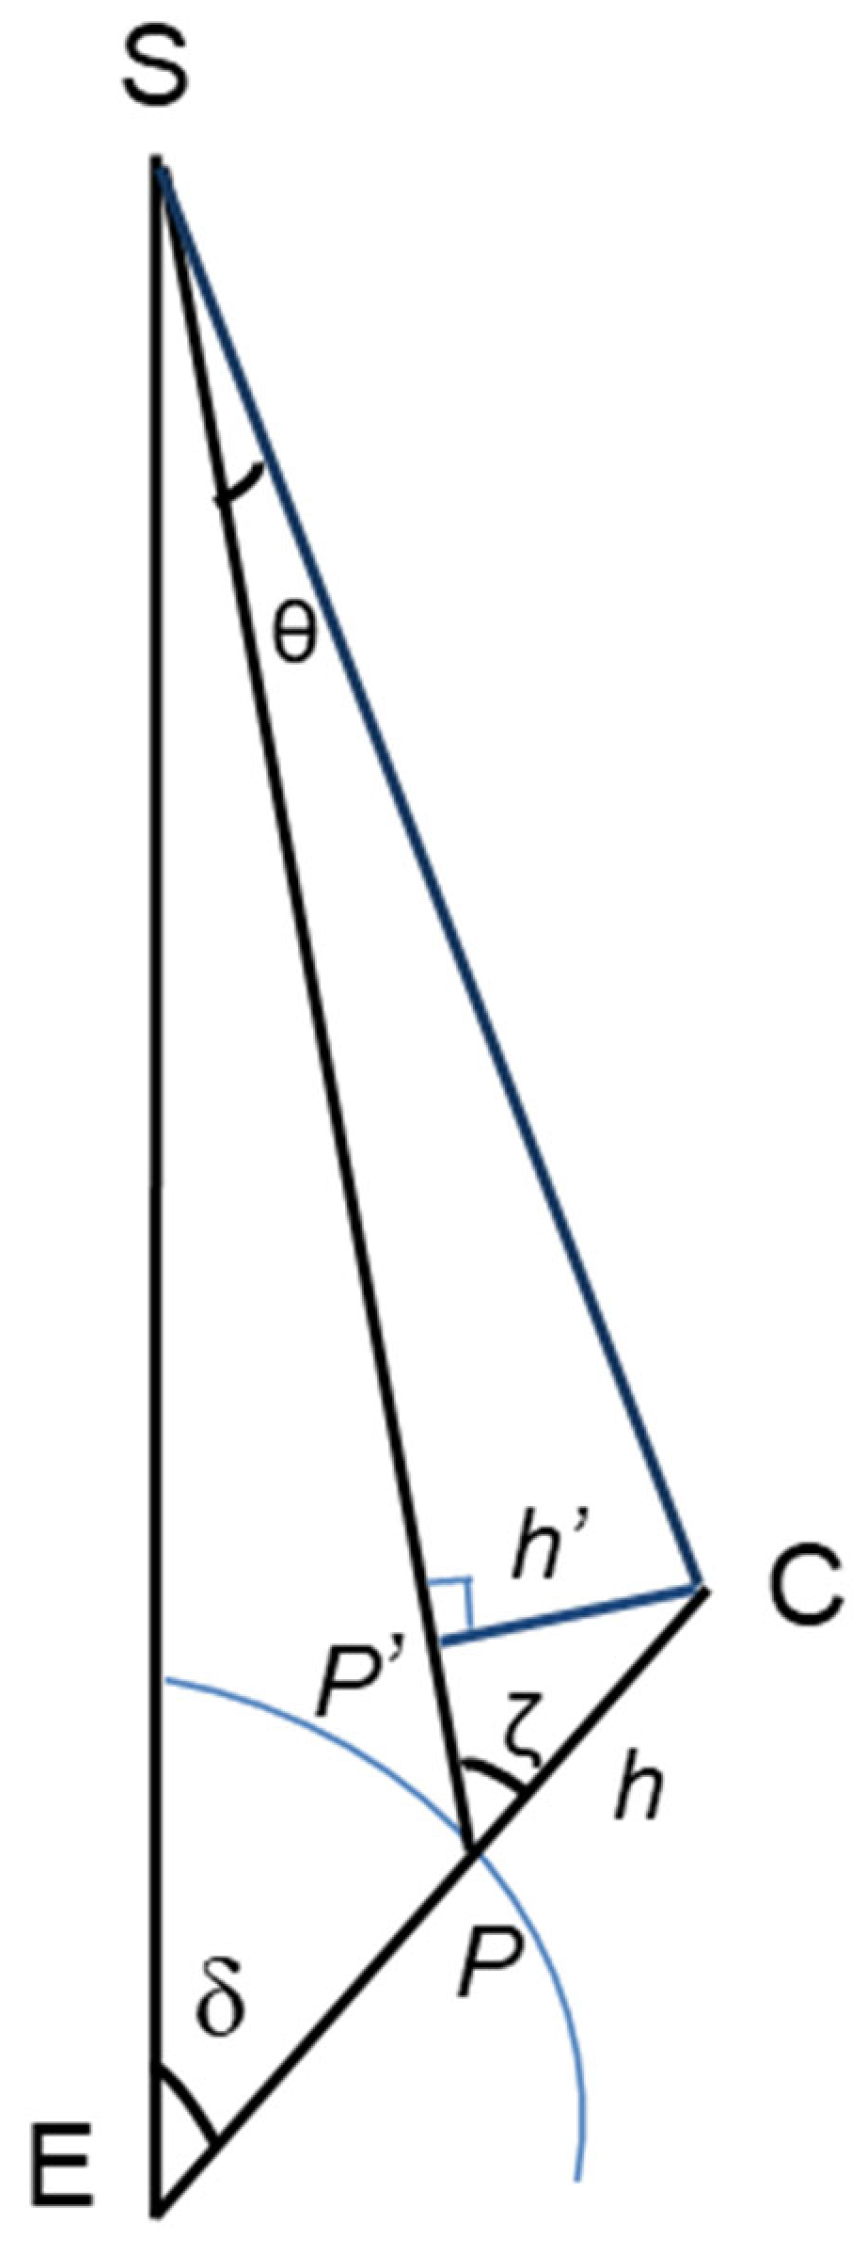
Appendix A.2. Displacement Due to Atmospheric Refraction

According to [29], the atmospheric refraction R (in arcsecond) can be estimated as follows:
R = c o t h a + 10.3 h a + 5.11
where ha (in degree) is the elevation angle of satellite or 90—ζ in Figure A1. For the maximum δ of 36.3°, ζ = 42.2° from Equation (A2), ha = 47.8°, and R = 262 µrad from Equation (A5), which is comparable with 280 µrad of 5 IR pixels.

References

  1. GOES-R Product Algorithm Theoretical Basis Documents (ATBDS). Available online: https://www.goes-r.gov/resources/docs.html (accessed on 5 May 2025).
  2. Kalluri, S.; Alcala, C.; Carr, J.; Griffith, P.; Lebair, W.; Lindsey, D.; Race, R.; Wu, X.; Zierk, S. From photons to pixels: Processing data from the Advanced Baseline Imager. Remote Sens. 2018, 10, 177. [Google Scholar] [CrossRef]
  3. Wu, X.; Hewison, T.; Tahara, Y. GSICS GEO-LEO inter-calibration: Baseline algorithm and early results. Proc. SPIE 2009, 7456, 745604-1–745604-12. [Google Scholar]
  4. Hewison, T.J.; Wu, X.; Yu, F.; Tahara, Y.; Hu, X.; Kim, D.; Koenig, M. GSICS inter-calibration of infrared channels of Geostationary Imagers using Metop/IASI. IEEE Trans. Geosci. Remote Sens. 2013, 51, 1160–1170. [Google Scholar] [CrossRef]
  5. Yu, F.; Wu, X.; Yoo, H.; Qian, H.; Shao, X.; Wang, Z.; Iacovazzi, R. Radiometric calibration accuracy and stability of GOES-16 ABI Infrared radiance. J. Appl. Remote Sens. 2021, 15, 048504. [Google Scholar] [CrossRef]
  6. Daniels, J.M.; Schmit, T.J. NESDIS 103 GOES-11 Imager and Sounder Radiance and Product Validations for the GOES-11 Science Test; NESDIS 103; U.S. Department of Commerce National Oceanic and Atmospheric Administration: Washington, DC, USA, 2001. [Google Scholar]
  7. Hillger, D.W.; Schmit, T.J.; Daniels, J.M. The GOES-12 Science Test: Imager and Sounder Radiance and Product Validations. NOAA Technical Report NESDIS 115. 2002. Available online: https://rammb.cira.colostate.edu/research/calibration_validation_and_visualization/docs/GOES-12-TechReport.pdf (accessed on 5 May 2025).
  8. Hillger, D.W.; Schmit, T.J. The GOES-13 Science Test: Imager and Sounder Radiance and Product Validations. NOAA Technical Report NESDIS 125. 2007. Available online: https://rammb.cira.colostate.edu/projects/goes-n/NOAA_Tech_Report_NESDIS_125_GOES-13_Science_Test.pdf (accessed on 5 May 2025).
  9. Hillger, D.W.; Schmit, T.J. The GOES-14 Science Test: Imager and Sounder Radiance and Product Validations. NOAA Technical Report NESDIS 131. 2010. Available online: https://rammb.cira.colostate.edu/projects/goes-o/NOAA_Tech_Report_NESDIS_131_GOES-14_Science_Test_with_Corrigendum.pdf (accessed on 5 May 2025).
  10. Hillger, D.W.; Schmit, T.J. The GOES-15 Science Test: Imager and Sounder Radiance and Product Validations. NOAA Technical Report NESDIS 141. 2011. Available online: https://rammb.cira.colostate.edu/projects/goes-p/noaa_technical_report_141_goes-15_science_test.pdf (accessed on 5 May 2025).
  11. Johnson, R.X.; Weinreb, M.P. GOES-8 imager midnight effects and slope correction. In GOES-8 and Beyond; Washwell, E.R., Ed.; SPIE: Bellingham, WA, USA, 1996; Volume 2812, pp. 596–607. [Google Scholar]
  12. Hewison, T.; Wagner, S. Can We Modify GSICS GEO-LEO IR ATBD to Apply to GEO-GEO Inter-Comaprisons? GSICS IR Subgroup Meeting. 17 October 2019. Available online: https://gsics.atmos.umd.edu/bin/view/Development/20191017 (accessed on 5 May 2025).
  13. Yu, F.; Wu, X.; Rama Varma Raja, M.K.; Wang, L.; Li, Y.; Goldberg, M. Evaluation of the diurnal and scan angle calibration variations of the GOES Imager Infrared instruments. IEEE Trans. Geosci. Remote Sens. 2013, 51, 671–683. [Google Scholar] [CrossRef]
  14. Wu, X.; Schmit, T.J. Product Performance Guide for Data Users of GOES-16 ABI Level1b (L1b) and Cloud and Moisture Imagery (CMI) Released for Full Validation Data Quality. NOAA Satellite Information System. 2019. Available online: https://www.ncei.noaa.gov/sites/default/files/2021-08/GOES-16_ABI-L1b-CMI_Full-Validation_ProductPerformanceGuide_v2.pdf (accessed on 5 May 2025).
  15. Van Naarden, J.; Lindsey, D. Saving GOES-17. Aerospace America. 2019. Available online: https://aerospaceamerica.aiaa.org/departments/saving-goes-17/ (accessed on 5 May 2025).
  16. McCorkel, J.; Van Naarden, J.; Lindsey, D.; Efremova, B.; Coakley, M.; Black, M.; Krimchansky, A. GOES-17 Advanced Baseline Imager performance recovery summary. In Proceedings of the IEEE International Geoscience and Remote Sensing Symposium, Yokohama, Japan, 28 July–2 August 2019. [Google Scholar] [CrossRef]
  17. Wang, Z.; Wu, X.; Yu, F.; Fulbright, J.; Kline, E.; Yoo, H.; Schmit, T.; Gunshor, M.; Coakley, M.; Black, M.; et al. On-orbit calibration and characterization of GOES-17 ABI IR bands under dynamic thermal condition. J. Appl. Remote Sens. 2020, 14, 034527. [Google Scholar] [CrossRef]
  18. Murata, H.; Yogo, Y.; Takahashi, M. Himawari-8/9 AHI GEO-GEO comparisons. In Proceedings of the GSICS Annual Meeting, Shanghai, China, 19–23 March 2018; Available online: http://gsics.atmos.umd.edu/bin/view/Development/20180319 (accessed on 5 May 2025).
  19. Minnis, P.; Khaiyer, M. Anisotropy of land surface skin temperature derived from satellite data. J. Appl. Meteorol. Climatol. 2020, 39, 1117–1129. [Google Scholar] [CrossRef]
  20. Yu, F.; Wu, X.; Yoo, H.; Wang, Z. GEO-GEO inter-comparison for G17 IR radiance monitoring and anomaly detection. In Proceedings of the GSICS Annual Meeting, Frascati, Italy, 4–8 March 2019. [Google Scholar]
  21. Yoo, H.; Yu, F.; Wu, X. Evaluation of radiometric calibration consistency of GOES-17 ABI using GEO-GEO collocations. In Proceedings of the AGU Fall Meeting, Washington, DC, USA, 10–14 December 2018. [Google Scholar]
  22. Yoo, H.; Yu, F.; Wu, X. GEO-GEO inter-comparison as a tool for ABI performance validation and monitoring. In Proceedings of the AMS Conference, Boston, MA, USA, 16 January 2020. [Google Scholar]
  23. Wu, X.; Yu, F. Correction for GOES Imager spectral response functions using GSICS: Theory. IEEE Trans. Geosci. Remote Sens. 2013, 51, 1215–1223. [Google Scholar] [CrossRef]
  24. Yu, F.; Wu, X. Correction for GOES Imager spectral response functions using GSICS: Applications. IEEE Trans. Geosci. Remote Sens. 2013, 51, 1200–1214. [Google Scholar] [CrossRef]
  25. Gunshor, M.; Schmit, T.; Nelson, J.; Bachmeier, S. GOES-18 versus GOES-17 ABI. In Proceedings of the AMS 2023 Annual Meeting, Denver, CO, USA, 8–12 January 2023; Available online: https://ams.confex.com/ams/103ANNUAL/meetingapp.cgi/Paper/418091 (accessed on 5 May 2025).
  26. Shao, X.; Wu, X.; Yu, F.; Cao, C. Characterization and monitoring of GOES-16 ABI stray light and comparison with Himawari-8 AHI and GOES-17 ABI. J. Appl. Remote Sens. 2021, 15, 017503. [Google Scholar] [CrossRef]
  27. Xu, H.; Wu, X.; Yu, F. Characterize straylight in GOES ABI and Himawari AHI CH07. In Proceedings of the GSICS Annual Meeting, College Park, MD, USA, 27 February–3 March 2023; Available online: http://gsics.atmos.umd.edu/bin/view/Development/Gsicsannualmeeting2023/ (accessed on 5 May 2025).
  28. Yu, F.; Wu, X.; Xu, H.; Qian, H. GOES ABI IR midnight calibration variations. In Proceedings of the SPIE Proceeding, San Diego, CA, USA, 18–22 August 2024. [Google Scholar]
  29. Bennett, G.G. The Calculation of Astronomical Refraction in Marine Navigation. J. Navig. 1982, 35, 255–259. [Google Scholar] [CrossRef]
Figure 1. Spectral response function of IR channels of ABIs on GOES-16 (red), GOES-17 (blue), and GOES-18 (cyan). The gray lines are the brightness temperature (Tb) measured by an Infrared Atmospheric Sounding Interferometer (IASI) over a clear sky tropical ocean scene.
Remotesensing 17 01656 g001
Figure 2. Flowchart of the collocation data selections. To facilitate the data processing, a mask file is generated for each paired satellite for the pixels meeting the criteria within the dashed box.
Remotesensing 17 01656 g002
Figure 3. Frequency of the time difference between G17 vs. G16 (in red), G18 vs. G16 (in blue), and G17 vs. G18 (in green) for the FD images in November 2022. The time difference is less than 2–4 s between G18 and G16 (in blue) and generally less than five seconds between G17 and G16 (in red) and G17 and G18 (in green).
Remotesensing 17 01656 g003
Figure 4. Spatial distribution of the mask (in green) between GOES-East and GOES-West. The pixels within the mask are shown on G17, and G16 images are shown on the right.
Remotesensing 17 01656 g004
Figure 5. Density scatterplots of the G17–G16 radiance difference versus the scene radiance of G16. The collocations are collected for the period of 2:30–3:30 UTC on 24 November 2022. The radiance difference is plotted on the primary y-axis and represented as the Tb difference at 300 K in the second y-axis. The primary x-axis is radiance, and the second x-axis is Tb. N is the density of collocation pixels within each radiance versus the radiance difference grid. The red line is the linear fitting.
Remotesensing 17 01656 g005
Figure 6. Same as Figure 5, but for G18–G16.
Remotesensing 17 01656 g006
Figure 7. Radiance differences for the ten ABI IR channels and two pairs of satellites (G17–G16 in blue and G18–G16 in red), measured by ABI (solid bars) and convolved with IASI-C spectral radiance and the respective SRF. Derived from the data collected in October and November 2022 when all measurements were collocated.
Remotesensing 17 01656 g007
Figure 8. Standard deviation of the mean of the radiance difference for the two satellite pairs (G17–G16 in blue and G18–G16 in red) converted to dTb at 300 K in unit K.
Remotesensing 17 01656 g008
Figure 9. Time-series of radiance difference for G17–G16 (in blue) and G18–G16 (in red) between 23 November 2022 and 24 November 2022. The G17 IR FPM temperature is plotted in gray, overlaid with the pCal mark (in black). The pCal algorithm and GS III were not implemented for G17 Ch07. During this time period, GS I was applied between 19:30 UTC and 08:30 UTC, and GS III was set between 08:30 UTC and 19:30 UTC for G17 Ch08–Ch16. The radiance difference for G17–G18 is plotted for Ch07 (in green).
Remotesensing 17 01656 g009
Figure 10. Time-series of G17–G16 radiance temperature for Ch08-16 on 25 July 2019 (blue, without pCal) and on 26 July 2019 (red, with pCal), overlaid with the FPM temperature (referring to the second y-axis) on 26 July 2019 when pCal was applied (black) or not (gray).
Remotesensing 17 01656 g010
Figure 11. The time-series of the G17–G16 difference (in blue) for B12 on 11 October 2022. The gray line (referring to the second y-axis) is the FPM temperature, and the green dots indicate the application of the pCal algorithm. The GEO-GEO gap between about 11:00 UTC and 16 UTC is due to the detector saturation at the high PFM temperature.
Remotesensing 17 01656 g011
Figure 12. Top: time-series of G17–G16 difference for Ch15 on 16 October 2020. The gap between about 9:30 and 17:00 UTC was due to detector saturation at the warm FPM temperature during this time period. Bottom: brightness temperature difference between two consecutive FD images, 04:30–04:40 UTC (left), 04:50–05:00 UTC (middle), and 05:00–05:10 UTC (right) on that day. The data missing near the South Pole are because of the solar avoidance scans during this time period.
Remotesensing 17 01656 g012
Figure 13. Time-series of G17–G16 difference for Ch07 on 11 October 2022.
Remotesensing 17 01656 g013
Figure 14. (Left): time-series of G18–G16 difference for Ch16 on 25 July 2024. Note the small bump at 21:40 UTC. (Right): brightness temperature difference for G16 Ch16 between 21:30 UTC and 21:40 UTC. The two red stripes are due to the cold radiance from the image at 21:40 UTC.
Remotesensing 17 01656 g014
Figure 15. G18–G16 difference for Ch13, every ten minutes in a day (vertical axis) and every day in the year of 2023 (horizontal axis). Color represents the value difference, with missing data in white.
Remotesensing 17 01656 g015
Table 1. Date of launch and operational, nominal and actual sub-satellite point (SSP), and status of the four ABIs on GOESs.
SatelliteLaunchOperationalNominal SSPActual SSPStatus
GOES-1619 November 201618 December 2017–7 April 202575.0°W75.2°W 18 December 2017–17 March 2025;
75.5°W 17 March 2025–7 April 2025
Storage
GOES-171 March 201812 February 2019–4 January 2023137.0°W137.2°W
(12 February 2019–15 July 2022)
Storage
137.3°W
(15 July 2022–4 January 2023)
GOES-181 March 20224 January 2023137.0°W137.0°W since 21 July 2022Operational
GOES-1925 June 20247 April 202575.0°W75.2°WOperational
Table 2. Central wavelength and noise requirement (in terms of noise equivalent differential temperature at 300 K) of the ABIs’ ten IR channels. The values in parenthesis are the relaxed requirements for the GOES-17 ABI.
Channel No.Central Wavelength (µm)Noise (NEdT at 300 K) (K)
Ch073.90.1
Ch086.20.1
Ch096.90.1
Ch107.30.1
Ch118.40.1
Ch129.60.1 (0.12)
Ch1310.30.1
Ch1411.20.1
Ch1512.30.1
Ch1613.30.3 (0.37)
Table 3. Thresholds used for the spatial uniformity selection. Unit: K @300K.
Ch07Ch08Ch09Ch10Ch11Ch12Ch13Ch14Ch15Ch16
G16/G180.740.130.150.230.190.180.280.190.220.34
G170.700.200.200.400.201.000.350.300.903.37
Disclaimer/Publisher’s Note: The statements, opinions and data contained in all publications are solely those of the individual author(s) and contributor(s) and not of MDPI and/or the editor(s). MDPI and/or the editor(s) disclaim responsibility for any injury to people or property resulting from any ideas, methods, instructions or products referred to in the content.

