Article

Disentangling the Roles of Climate Variables in Forest Fire Occurrences in China

1
School of Public Affairs, Nanjing University of Science and Technology, Nanjing 210094, China
2
Institute of Geographic Sciences and Natural Resources Research, Chinese Academy of Sciences, Beijing 100101, China
3
College of Resources and Environment, University of Chinese Academy of Sciences, Beijing 100049, China
4
Key Laboratory of Natural Disaster Monitoring, Early Warning and Assessment of Jiangxi Province, Jiangxi Normal University, Nanchang 330022, China
*
Author to whom correspondence should be addressed.
Remote Sens. 2025, 17(1), 88; https://doi.org/10.3390/rs17010088
Submission received: 4 November 2024 / Revised: 21 December 2024 / Accepted: 24 December 2024 / Published: 29 December 2024

Abstract

:
In the context of global warming, climate strongly affects forest fires. With long-term and strict fire prevention policies, China has become a unique test arena for comprehending the role of climatic variables in affecting forest fires. Here, using GIS spatial analysis, Pearson correlation, and geographical detector, the climate drivers of forest fires in China are revealed using the 2003–2022 active fire data from the MODIS C6 and climate products from CHELSA (Climatologies at high resolution for the Earth’s land surface areas). The main conclusions are as follows: (1) In total, 82% of forest fires were prevalent in the southern and southwestern forest regions (SR and SWR) in China, especially in winter and spring. (2) Forest fires were mainly distributed in areas with a mean annual temperature and annual precipitation of 14~22 °C (subtropical) and 800~2000 mm (humid zone), respectively. (3) Incidences of forest fires were positively correlated with temperature, potential evapotranspiration, surface downwelling shortwave flux, and near-surface wind speed but negatively correlated with precipitation and near-surface relative humidity. (4) Temperature and potential evapotranspiration dominated the roles in determining spatial variations of China’s forest fires, while the combination of climate variables complicated the spatial variation. This paper not only provides new insights on the impact of climate drives on forest fires, but also offers helpful guidance for fire management, prevention, and forecasting.

1. Introduction

Forest fires play important roles in atmospheric and terrestrial systems [1,2,3,4,5], with profound effects on the carbon cycle, ecosystems, and biodiversity [1,6,7,8,9,10,11,12,13]. The adverse effects of growing forest fires on human society and natural ecology are becoming a global problem [14,15,16]. Forest fire activity may continue to increase due to the predicted climate warming [17]. At the same time, fire activities show great interannual changes on global and regional scales [4,18]. Fire activities have a strong impact on the atmosphere through a large number of emissions, which further affect the pollution level, atmospheric chemistry and climate [12,19,20]. In recent years, forest fires in Chile, Portugal, Greece, the United States, Australia, Spain, and Canada have had significant negative impacts on society and the environment [14,16,21,22,23,24,25]. In particular, climate change is the most important macro-driver of temporal variability in fire activity. Efforts to better understand how climatic factors influence the development of fires are critical for accurately estimating changes in biogeochemical cycles, vegetation composition, and fire-related hazards [26].
The combination of human activity and climate has a significant impact on the mechanisms underlying the occurrence of forest fires [3,27], and both can alter biomass burning, the number of ignitions, and the potential spread of fire [28]. However, the complexity of human and climatic influences on fire activity makes it difficult to distinguish between the effects of these drivers in many countries and regions [29]. Previous research has demonstrated that the effects of climate on local fire regimes (e.g., ignition and suppression) are overshadowed by human activities (e.g., land-use change and policy management) [30]. Therefore, human influence may dominate complex human-climate-fire interactions [14]. However, global warming is accelerating the frequency of extreme fires [31]. In parts of the globe where climate influences forest fires more dramatically than human activities [15], climate may be a leading driver of regional forest fire occurrence [24]. Some scholars have attempted to disentangle climate and anthropogenic impacts, such as by using empirical modelling [29,32]. To our knowledge, quantitative assessments of the effects of climate and human activity on forest fires are rare in research [27], and complex human-climate-fire interactions have not yet been well characterized [32]. On one hand, the lack of anthropogenic data and the extent to which climate and anthropogenic data match further constrain integrated studies of drivers [9]. On the other hand, distinguishing between the anthropogenic and climatic impacts of forest fires at a global or regional scale remains a challenge for the scientific community. It is therefore difficult to identify regions where climate is strongly influencing fire occurrences, or how many of them across the globe are dominated by climate factors. However, areas with low anthropogenic impacts [22] or areas with strict fire prevention policies [31] provide an ideal place to separate climate and anthropogenic impacts on forest fires. Importantly, these regions (e.g., China) provide new perspectives and opportunities for understanding the development of forest fires driven by climatic factors.
China has become a typical region to study the factors that contribute to forest fires due to climate [31]. Since the 1987 large forest fires, China’s forest fire prevention work has been very strict, featuring a general policy of "prevention first and active eradication" [33]. Under strict and consistent forest fire suppression policies, climate has possibly become the most important variable driver of forest fire occurrence in China [31]. Researchers have studied China’s forest fires and their climatic drivers. Liu, et al. [34] found that the predicted change of overall fire occurrence density was positively related to the degree of temperature and precipitation change in the northeast and north of China. Ying, et al. [35] emphasized the important role of climatic drivers, particularly relative humidity, in forest fire occurrences in southwestern China. Zhou, Zhang and Wu [33] showed that climate was the main factor influencing the frequency of forest fires in northeast China at various times. Wu, et al. [36] discovered that relative humidity and wind speed are the two most significant climate variables of spatial patterns of forest burn severity in Northeast China. These studies on the drivers of forest fires in China have focused on the regional and provincial scales, especially in the northeast and southwest [37]. Scholars have used different spatiotemporal scales, datasets, and methods to determine the drivers of forest fires. However, national long-term analysis of the roles of climate variables in the forest fire occurrences has not been well revealed in the context of strict fire prevention policies [38].
We assume that all climate variables have negative effects on the frequency of forest fires. To understand the impacts of climate drivers on China’s forest fires in the context of strict fire prevention policies, we reveal the impacts of fire climate drivers on China’s forest fires based on the MODIS C6 product combined with the products of climate element indicators utilizing the methods of GIS spatial analysis, correlation analysis, and geographical detection. This paper will provides new insights on the impact of climate drives on forest fires and offers helpful guidance for fire management, prevention, and forecasting.

2. Study Area, Materials, and Methods

2.1. Study Area

China is a vast country with a land area of about 9.6 × 10⁶ km2. China’s topography is complex, with high terrain in the west and low terrain in the east. The proportion of various landforms in the country’s land area is: mountains at 33.3%, plateaus at 26%, basins at 18.8%, plains at 12%, and hills at 9.9%. The climate in China is complex and diverse, including temperate monsoon climate, subtropical monsoon climate, tropical monsoon climate, temperate continental climate and plateau mountain climate, and spans tropical, subtropical, warm temperate, middle temperate and cold temperate temperature zones from south to north. The vegetation in China is rich in species and complicated in distribution. In the eastern monsoon region, there are tropical rain forests, tropical monsoon forest, evergreen broad-leaved forests in central and southern subtropics, deciduous broad-leaved evergreen broad-leaved mixed forests in northern subtropics, temperate deciduous broad-leaved forests, cold temperate coniferous forests, subalpine coniferous forests, temperate forest grasslands and other vegetation types. In the northwest and Qinghai-Tibet Plateau, there are vegetation types such as dry grassland, semi-desert grassland shrub, dry desert grassland shrub, plateau cold desert, alpine grassland meadow shrub and so on.
China’s forest resources are mainly distributed in the southern forest region (SR), southwestern forest region (SWR), northeastern forest region (NER), and northern forest region (NR) according to the natural zoning of China’s forest industry (Figure 1). Since the implementation of major forestry projects, such as the 2000 Natural Forest Protection Project [39] and the 2003 “Returning Cultivated Land to Forests” project [40], the quantity and quality of China’s forest resources have improved. China has contributed 25% to the world’s green increment. According to the 2014 Eighth China Forest Resources Inventory, the total forest cover was approximately 208 million hectares, with a forest coverage rate of 21.6%. However, forest fires, as important disturbance factors of forest ecosystems, have never disappeared [41].

2.2. Materials

2.2.1. Active Fire Data

The MODIS Collection 6 active fire products with a spatial resolution of 1 km and a coordinate system of WGS1984 are available in three formats [42,43]. MODIS active fire data contain a variety of metrics, such as FRP, coordinates, date/time, brightness, and confidence. The data products are a combination of observations from the Terra and Aqua satellites, which began acquiring global active fire information in November 2000 and July 2002, respectively. This dataset is the newest forest active fire product with the longest time scale and global coverage to date and has been widely used for forest fire monitoring, fire risk prediction, fire condition assessment [44], atmospheric pollution evaluation [17,45], and climate modelling [46]. To obtain active fire products from both satellites at the same time, active fire data from 2003 to 2022 were selected to study the climate drivers of forest fires in China. In this study, active fire points in China were extracted using year-by-year land-cover products.

2.2.2. Land Cover Data

China’s Land Cover Datasets (CLCD) [47] were used to extract forest fire points. CLCD are the first long time-series annual land cover products (1990–2022) derived from 30-m Landsat imagery for China and include 9 types. To further enhance the spatiotemporal consistency of the data, the products employ a postprocessing technique that combines logical inference and spatiotemporal filtering. An overall accuracy of 79.31% was attained by the CLCD. These products exhibit good consistencies with the Global Forest Change, the Global Surface Water, and three impervious surface products when compared to thematic products derived from Landsat.

2.2.3. Climate Variables Data

Climatologies at High Resolution for the Earth Land Surface Areas (CHELSA), developed and maintained by the Swiss Federal Institute for Forestry, Snow, and Landscape Research [48], provides monthly products of multiple types of global climate elements, including precipitation and temperature, at a spatial resolution of 30”. CHELSA has an accuracy level equivalent to that of WorldClim, the Climatic Research Unit (CRU), and ERA-Interim. However, the corresponding prediction accuracy for precipitation has significantly improved. Since its release, it has been widely used in the fields of climate, Earth sciences, and bioenvironment. In this paper, six typical climate elements, temperature (Tas), near-surface relative humidity (Hurs), potential evapotranspiration (Pe), precipitation (Pr), near-surface wind speed (Sfcwind), and surface downwelling shortwave flux (Rsds), were selected to study the climate drivers of forest fires in China. These monthly data products are pre-processed consistently, including resampling (0.25° × 0.25°) and mask extraction.

2.3. Methods

2.3.1. GIS-Based Fishnet Analysis

A 0.25° × 0.25° grid system was developed using the ArcGIS 10.8 [49] spatial analysis tools to investigate the climate drivers of forest fires in China. The WGS84 coordinate system was used, and the coordinate system matched that of the MODIS C6 active fire products. The number of fire points was assigned to the corresponding grids and then converted into raster data for further analyses in this study. All raster products need to be resampled to a resolution of 0.25° × 0.25° when they are analyzed.

2.3.2. Trend Analysis

The Theil–Sen slope (TS) and Mann–Kendall (MK) methods were used for the trend analysis and significance test of climatic factors in forest fire areas in China. The TS method is a robust nonparametric trend analysis method [50], and it is very suitable for the analysis of long time series data. At the same time, because the TS method is mainly based on the median of data, it is insensitive to outliers and reduces the impact of outliers [51]. The MK method can be used for significance tests, and it is usually used together with the TS method. The MK method is a nonparametric statistical method; it does not need the original data to obey normal distribution and is not affected by missing values or abnormal values [52]. By combining the TS and MK methods, the method of judging the trend significance of climate factors in forest fire areas in China was developed, as shown in Table 1.

2.3.3. Correlation Analysis

A common method for determining the level of correlation between two variables is to use its value, which ranges from −1 to 1. In this paper, annual raster data of forest fires were used as samples to analyze their spatial correlations with major climatic factors via the correlation coefficient method. The correlation coefficient classes were categorized according to the following criteria (Table 2):

2.3.4. Geographical Detector

A geographical detector is used to identify the factors that cause the spatial heterogeneity of geographic elements [53]. The four modules that make up the geographical detector are the factor, risk, interaction, and ecological detectors. In this work, we analyzed climatic drivers of forest fire using an interaction detector and factor detector. The primary functions of the factor detector are to identify the degree of spatial dissimilarity of the dependent variable and the degree of explanation of the dependent variable by the independent variable, the latter whose magnitude is indicated by the q value. Interactions between various risk factors are identified by the interaction detector. It evaluates whether the combined effects of factors X1 and X2 enhance or decrease the dependent variable Y’s capacity for explanation. In this paper, we used the ArcGIS 10.8 zonal statistics tool to count the independent variable (driver) and dependent variable (forest fire frequency) class by class into the same fishing net (0.25° × 0.25°) vector data as the input element class of the geo-detector, and the data included the multiyear average elemental values of the different variables to characterize the driving mechanism of the occurrence of forest fires in China since the beginning of the century.

3. Results and Analyze

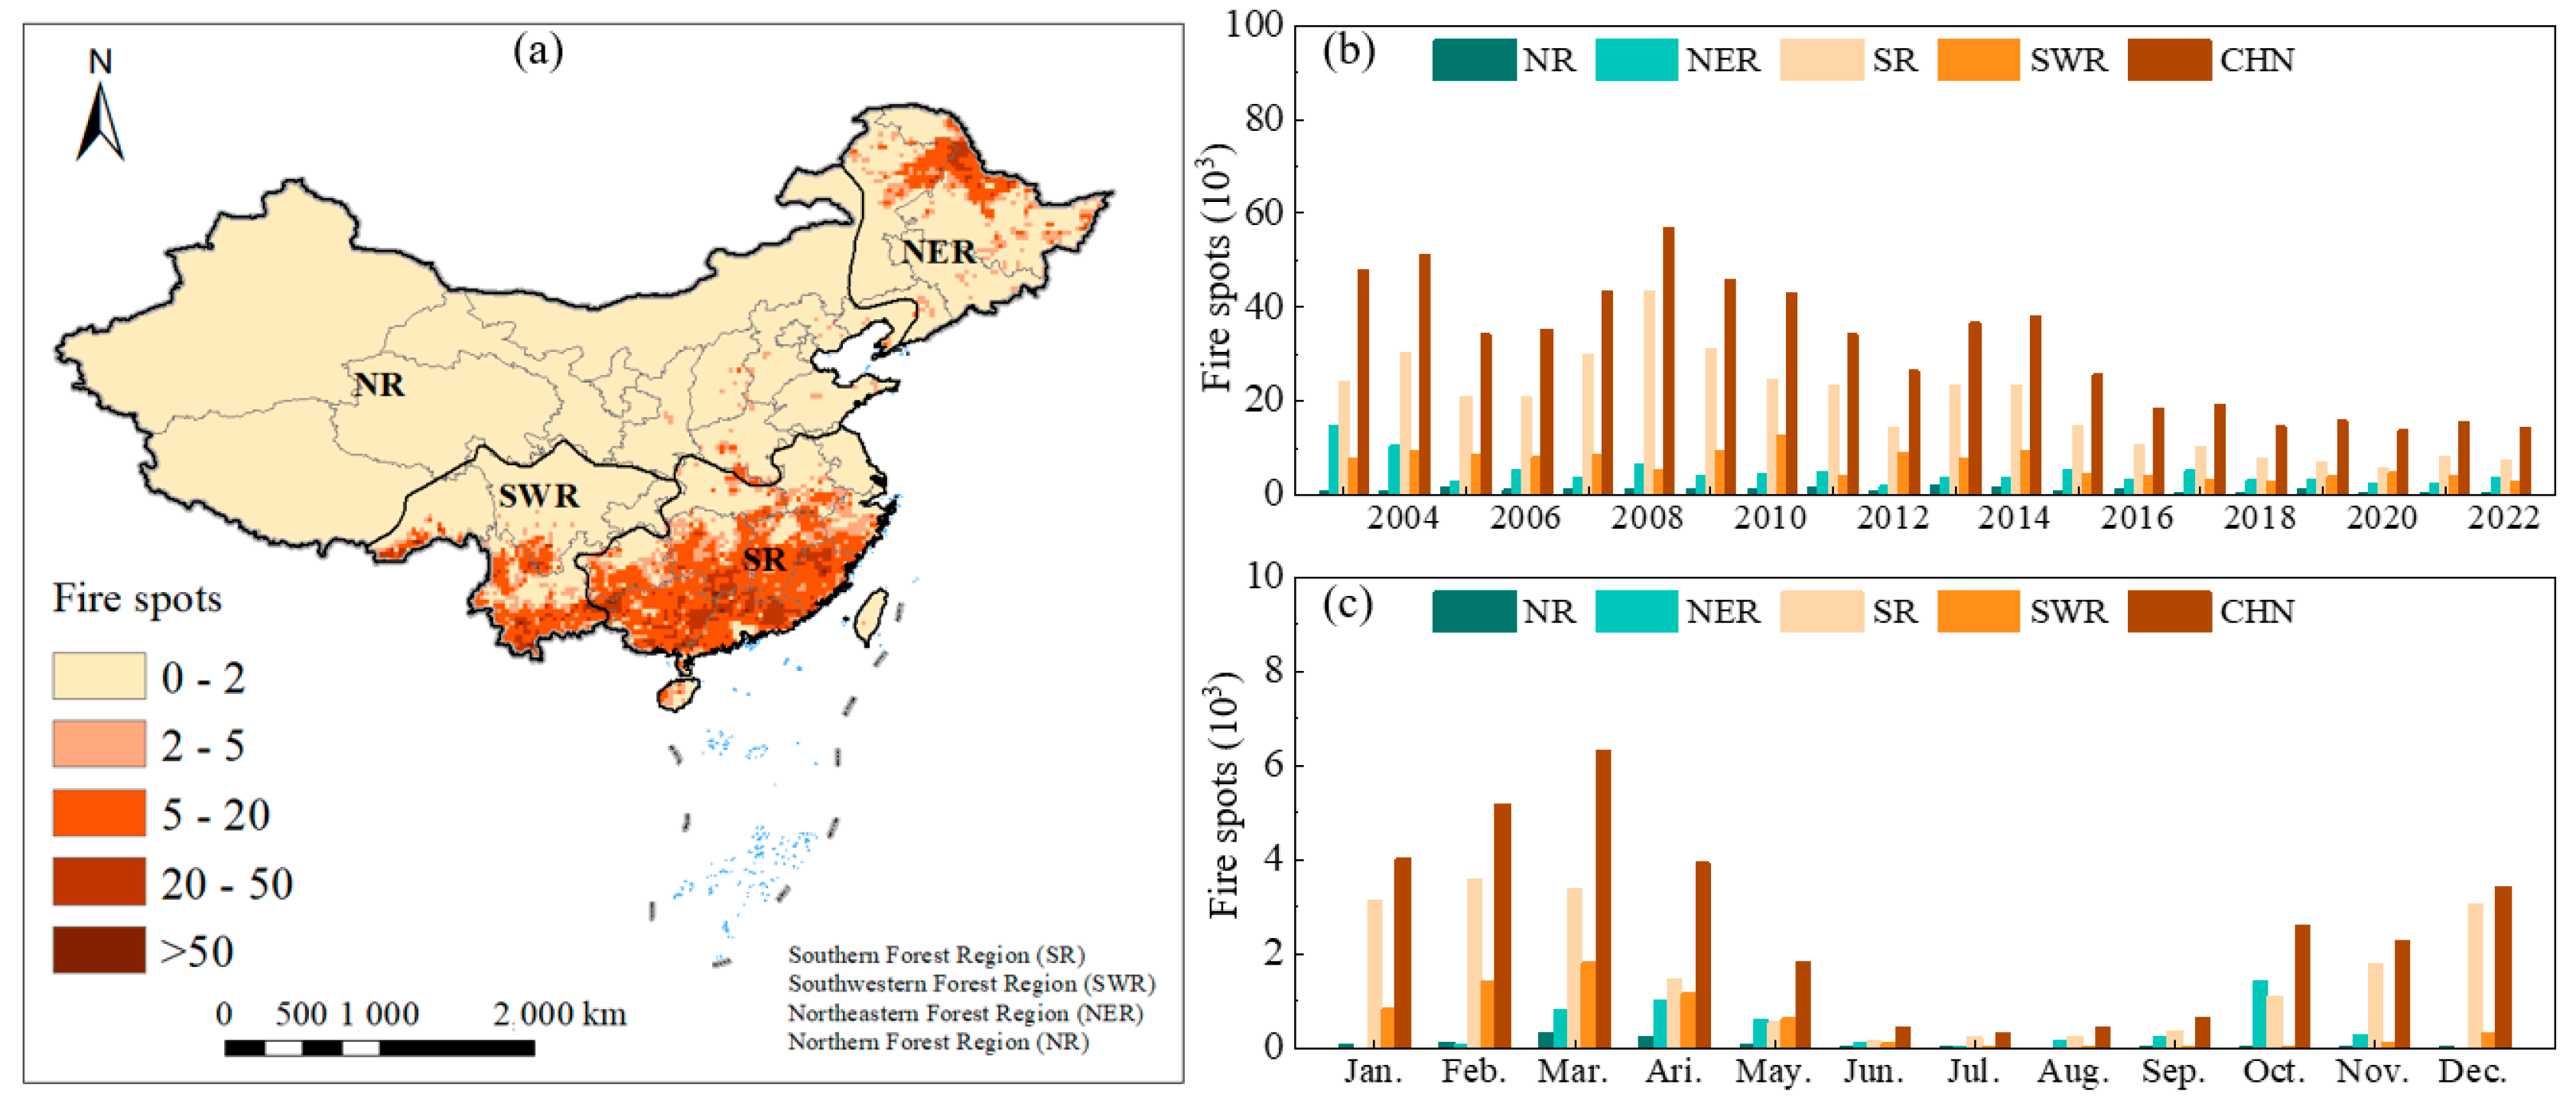
3.1. Overall Characteristics of Forest Fire in China

Over the past 20 years, the general pattern of forest fire distribution is more evident in the south and less in the north. Cumulative forest fires in China were about 63.03 × 10⁴, of which the SR ranked first, accounting for 60.61%, followed by the SWR (20.89%), the NER (15.14%), and the NR (3.35%). Spatially, they were mainly distributed in the southeastern hills, Xingan Mountains, the Yunnan-Guizhou Plateau, and the Hengduan Mountains. From 2003 to 2022, the overall trend of forest fires decreased (Figure 1), with an average annual frequency of 3.15 × 10⁴. In terms of intra-annual changes, forest fires had a high incidence in winter and spring, with an average monthly frequency of 2.63 × 10³ and a maximum in March.

3.2. Trend of Climatic Factors in Forest Fire Areas of China

Since the 21st century, the climate in China has generally tended to be warm and humid. Among the various climatic factors, the temperature, precipitation and near-surface relative humidity have all increased, while the near-surface wind speed, potential evapotranspiration and surface downwelling shortwave flux have weakened, and the regional differences are significant (Figure 2). Specifically, more than 80% of China’s forest fire areas show an increase in temperature, mainly with no significant increase (67%); less than 20% of the areas show a decreasing trend, and the decrease is not significant. The area with rising temperature covers the NR, SR, SWR and the northern part of the NER. In particular, the Hengduan Mountains, southern Tibet and hilly areas of Shandong show a very significant upward trend. The areas with decreasing temperature are mainly distributed in the Northeast Plain, and there are also sporadic distributions in the border areas of Guangdong and Guangxi. Nearly 90% of the forest fire areas in China have increased precipitation, mainly with no significant increase (58%). The areas with increasing precipitation are mainly distributed in the NER, SR and SWR. Among them, eastern Heilongjiang, northwestern Zhejiang and central and eastern Sichuan show a very significant increasing trend. The areas with decreasing precipitation are mainly distributed in southern Shanxi, western Henan, and central and eastern Shandong in the NR.
The proportion of potential evapotranspiration in forest fire areas is 6.5:3.5, which shows both a decrease and an increase. Of these, 48% and 33% are in areas of no-significant decrease and no-significant increase, respectively. The areas with decreasing potential evapotranspiration are mainly distributed in SR, most of Heilongjiang in the NER and central and southern Yunnan in the SWR. Among them, Zhejiang and southern Anhui, Guangxi and western Guangdong and southern Hunan are most significant. The areas with increasing potential evapotranspiration are mainly distributed in mountainous areas, including the Xinganling Mountains, Changbai Mountains, Shandong hills, Qinling Mountains and Hengduan Mountains. The trend and distribution area of near-surface relative humidity in China are contrary to the potential evapotranspiration (Figure 2). The surface downwelling shortwave flux from forest fire areas in China shows a decrease in 82% of the area. Of forest fire areas, 57% are in areas of no significant decrease. The area showing an increase accounts for 18%, with no significant increases. In particular, the areas with significant and highly significant decreases are mostly located in the southeast coast of the SR. The increasing areas are mainly located in the Changbai Mountains and Hengduan Mountains. As far as the near-surface wind speed is concerned, most areas show a decreasing trend, and only the Xinganling Mountains, Changbai Mountains, Hengduan Mountains and southern Tibet show an increasing trend.

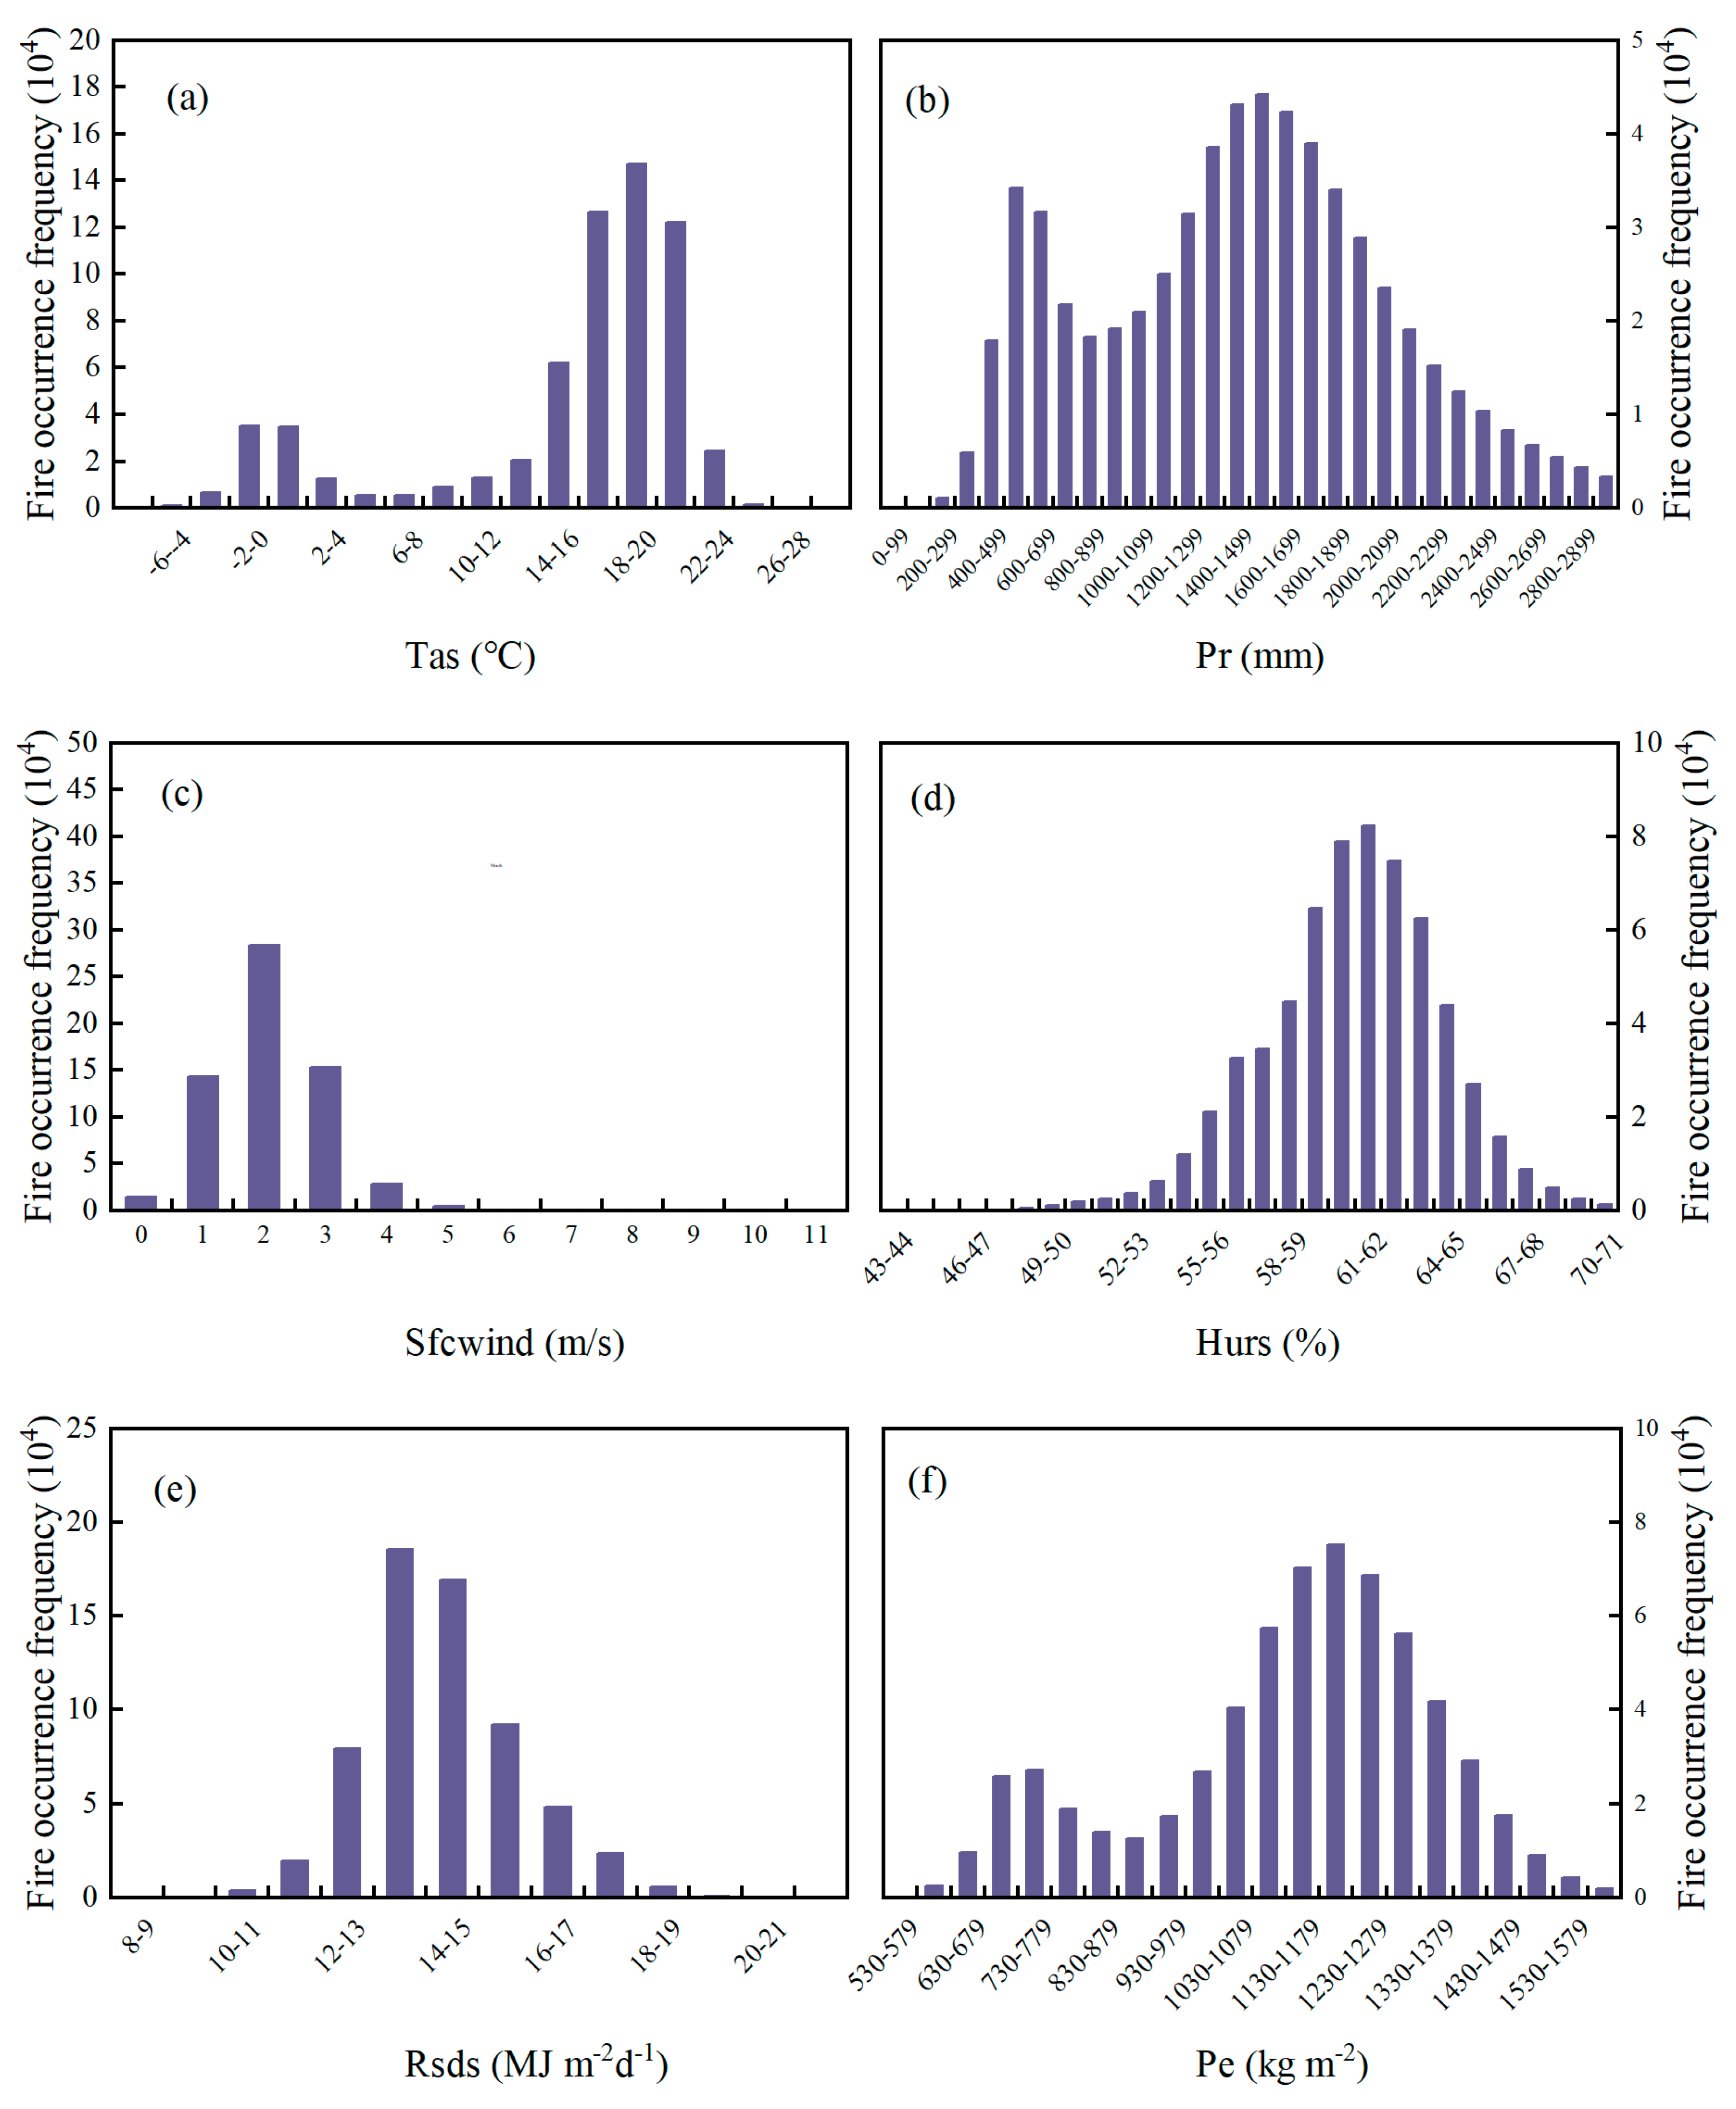
3.3. Climatic Characteristics of Forest Fires in China

Forest fires and climate elements were spatially coupled to characterize the relationship between each climate element and forest fires (Figure 3). Regarding temperature, forest fires exhibited a bimodal distribution pattern with increasing temperature, with a large peak occurring at 18~20 °C and a small peak occurring at –2~2 °C. Specifically, the proportion of forest fires above 14~22 °C was 73%, indicating that forest fires in China were mainly distributed in subtropical regions. In addition, 12% of the forest fires occurred at –2~2 °C, which showed that the forest fires were distributed in the middle-temperate zone, especially in the NER. In terms of precipitation, forest fires also exhibited a bimodal distribution with increasing precipitation, with peaks occurring at intervals ranging from 500–700 mm and 1300–1800 mm. Specifically, the proportions of forest fires associated with precipitation of 0–200 mm, 200–400 mm, 400–800 mm, and >800 mm were 0.05%, 1.12%, 16.74% and 82.09%, respectively. The proportion of forest fires with an annual precipitation of 400 mm or more exceeds 98%, indicating that forest fires are concentrated in humid and semi-humid areas.
The forest fires exhibited a bimodal distribution with increasing potential evapotranspiration, with peak values occurring in the range of 1180~1230 kg m−2 and lower peaks occurring in the range of 730~780 kg m−2. Overall, forest fires accounted for 73% of the total forest fires in the range of 980~1430 kg m−2, and the forest fires accounted for 12% of the total forest fires in the range of 680~830 kg m−2. The forest fires exhibited a single-peak distribution with an increase in the near-surface relative humidity, with a peak value of 61%~62%, and the overall distribution was concentrated in the area with 55~66% near-surface relative humidity, accounting for 92% of the total. The forest fires also exhibited a single-peak distribution with increasing surface downwelling shortwave flux, with peaks occurring at 13~14 MJ m−2d−1, concentrating in areas with a surface downwelling shortwave flux of 12~17 MJ m−2d−1, accounting for 91% of the forest fire points. As far as the near-surface wind speed is concerned, forest fires showed a trend of increasing and then decreasing with increasing wind speed, and they were mainly distributed in areas with lower wind speeds. Specifically, the proportions of forest fires in areas with wind speeds of 0~1 m/s, 2~3 m/s, 4~5 m/s, and >5 m/s were 25.07%, 69.39%, 5.31%, and 0.93%, respectively. Overall, the highest percentage (94%) of forest fires occurred in areas with wind speeds of 3 m/s or less.

3.4. The Impacts of Climate on Forest Fires in China

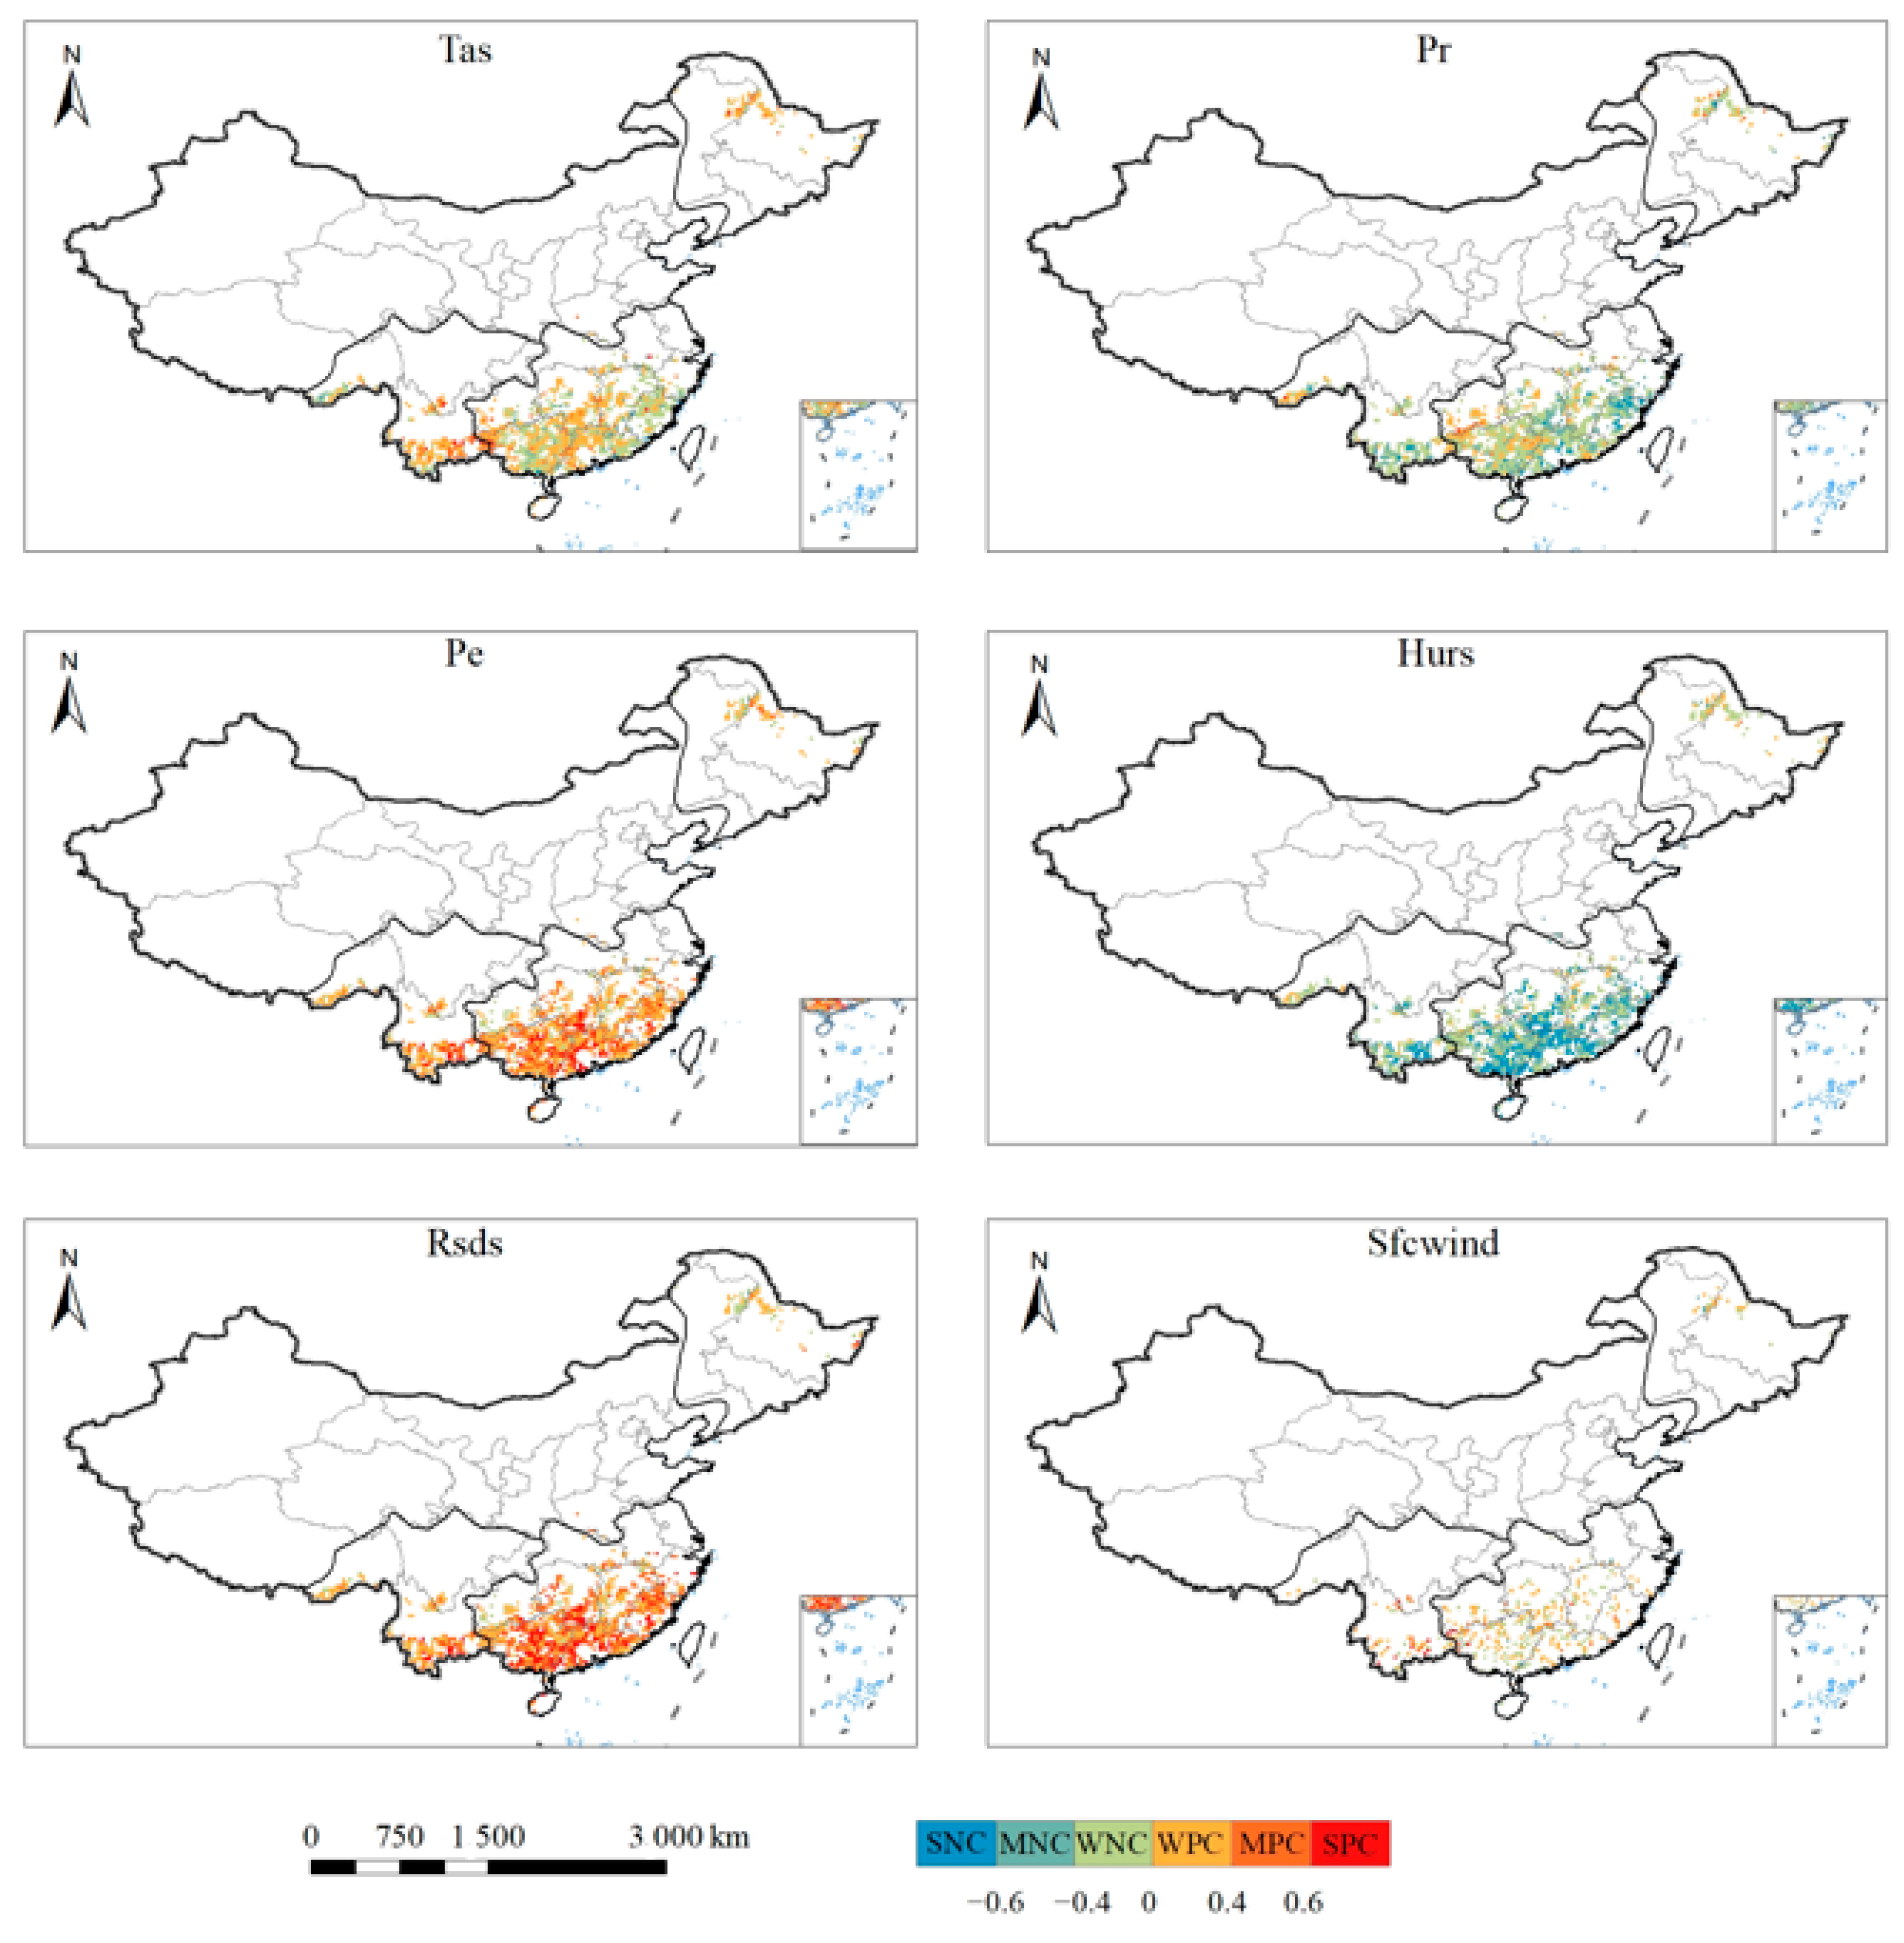
3.4.1. Forest Fires–Climate Correlation

Previous studies have demonstrated that fuels’ moisture content is influenced by precipitation, and that a high precipitation level can contribute to combustible materials’ moisture content, which lowers the risk of forest fire [29]. The present study is in agreement with previous studies that forest fire and precipitation correlations are generally characterized by negative correlations [37]. Specifically, the correlation between the frequency of forest fires and total annual precipitation showed a strong negative correlation (SNC), medium negative correlation (MNC), weak negative correlation (WNC), weak positive correlation (WPC), medium positive correlation (MPC), and strong positive correlation (SPC) with area shares of 2.87%, 19.80%, 58.56%, 17.11%, 1.48%, and 0.19%, respectively (Figure 4, Table 3). Specifically, the areas showing medium to strong negative correlations are concentrated in the southeastern SR. The correlation between forest fires and temperature showed significant geographical differences. Specifically, the correlations between forest fires and temperature showed a strong negative correlation (SNC), medium negative correlation (MNC), weak negative correlation (WNC), weak positive correlation (WPC), medium positive correlation (MPC), and strong positive correlation (SPC) with area percentages of 0.47%, 5.23%, 40.90%, 44.54%, 7.66%, and 1.21%, respectively. Among them, 53% of the area showing a positive correlation was widely distributed in major forest regions. These are areas where precipitation is limited during the fire season, and high temperatures increase evaporation and dry out fuels, leading to more fire activity [31]. The areas with negative correlations were mainly distributed in the SR, such as the central part of Guangxi, the eastern part of Guangdong, and most of Fujian. In particular, south Tibet and the Xishuangbanna area in Yunnan also exhibited negative correlations. These areas are all regions with abundant precipitation and high temperatures. As the temperature continues to increase, the amount of water vapour in the air continues to increase, increasing the fuel intake and thus reducing the occurrence of fires [26]. Overall, forest fires in areas with higher temperatures and abundant precipitation had a negative correlation with temperature; forest fires in areas with lower average temperatures and less precipitation had a positive correlation with temperature.
The correlation between forest fires and potential evapotranspiration was generally positive. Specifically, the correlations between forest fires and annual potential evapotranspiration were represented by a medium negative correlation (MNC), weak negative correlation (WNC), weak positive correlation (WPC), and medium positive correlation (MPC), which accounted for 0.28%, 11.01%, 49.36%, 31.10%, and 8.26%, respectively, of the area. In particular, strong positive correlations were observed in the southern SR. The correlation between forest fires and relative humidity in China is opposite to that of potential evapotranspiration. Due to its ability to influence biomass consumption and decrease fuel moisture through increased evaporation, wind is frequently viewed as a major cause of forest fires. The overall correlation between forest fires and wind speed in China was characterized by a positive correlation. Specifically, the percentages of the areas showing a medium negative correlation (MNC), weak negative correlation (WNC), weak positive correlation (WPC), medium positive correlation (MPC), and strong positive correlation (SPC) were 2.26%, 34.46%, 52.26%, 7.63%, and 3.39%, respectively. Additionally, strong positive correlations were observed in southern Yunnan in the SWR and western Guangxi in the SR. The overall correlation between forest fires and surface downwelling shortwave flux correlation at the surface is positive. Exposure to higher solar radiation exacerbates fuel moisture reduction and favours ignition [28]. Specifically, the forest fire frequency and surface downwelling shortwave flux correlations revealed that the medium negative correlation (MNC), weak negative correlation (WNC), weak positive correlation (WPC), medium positive correlation (MPC), and strong positive correlation (SPC) had area shares of 0.18%, 8.72%, 40.55%, 35.60%, and 15.05%, respectively. In particular, strong positive correlations were observed in the southern SR.

3.4.2. Contribution of Climatic Variables to Forest Fire Occurrences

Each climatic factor not only affects the probability and intensity of fires individually but also influences the development of fires through a complex mechanism involving the interaction of different factors. The explanatory power of six selected climate drivers of forest fires in China was ranked by the factor detection model of geographical detectors. The statistical significance of all the factors was maintained at the 0.05 level, suggesting a significant contribution of each factor to the spatial distribution of forest fires in China. Specifically, the explanatory powers of temperature, potential evapotranspiration, precipitation, near-surface relative humidity, near-surface wind speed, and surface downwelling shortwave flux were 24.73%, 16.73%, 14.11%, 13.44%, 5.36%, and 5.29%, respectively. In particular, the temperature reached 24.73%, which showed that overall forest fires were most strongly influenced by temperature.
In addition, an interaction detector of the geographical detector was used for the two-factor detection of forest fire spatial differentiation (Table 4). According to the results, there was a greater explanatory power for the two-factor interaction than for the single factor, suggesting a greater overall influence of the two factors. The types of interaction detection for forest fires in China were nonlinear enhancement and two-factor enhancement. There were eight interaction effects greater than 0.25, accounting for more than 50% of the total, all of which were combinations of temperature or potential evapotranspiration and other factors. Among them, the temperature ∩ relative humidity is the highest at 0.32, and the potential evapotranspiration ∩ relative humidity (0.30) is the second highest. The combination of temperature, potential evapotranspiration and other factors further enhances the effect on the spatial differentiation of forest fires. In particular, temperature in combination with other factors has a stronger explanatory power for forest fires in China.

4. Discussion

To date, some research has investigated the spatiotemporal characteristics as well as the driving forces behind fires at the local and global levels using active fire data [8,26,29,54]. However, several factors may limit our understanding of active fire data. First, the forest fires in China are mainly found in subtropical areas. Unfavourable conditions, such as the severity of cloud cover in these areas, may affect the detection of forest fires, leading to some omission errors [55]. However, because forest fires in subtropical areas occur mainly in the dry winter and spring seasons, the resulting errors are very small [31]. Second, smaller fires may be harder to detect and, as a result, smaller fires may go unnoticed because the fire data used in this paper are MODIS active fire data, which have a coarse spatial resolution of 1 kilometer [56,57]. Third, our present study is an analysis of the climate drivers of forest fires under strict fire prevention and suppression policies. Since the 21st century, although China’s overall policies are strict, the implementation of fire prevention policies in different provinces has varied, which may introduce errors into the effects of climate drivers. Finally, China is a unique region. The fire prevention policy is very strict. Since the 21st century, under the strict and stable forest fire prevention and extinguishing policy, climate has become the most important variable driving factor of forest fires in China. China is the most typical area to understand the climatic driving factors of forest fires [31,37]. However, we do not distinguish between man-made forest fires and forest fires caused by climate and fuel, and this may introduce errors. Nevertheless, our research is still very meaningful. These factors constitute an important source of uncertainty in the study of forest fires. Despite these shortcomings, this study provides a valuable analysis of the climate drivers of forest fires within China. Our findings not only contribute to the understanding of the relationship between forest fires and climatic influences but also help central and local governments formulate policies related to fire prevention. Studying the climatic drivers of forest fires can minimize the loss of human life and property caused by major forest fires.
Against the background of global warming, extreme weather occurs frequently worldwide, and countries, such as Australia, Canada and the United States, have experienced frequent catastrophic fires in recent years [58,59,60]. In 2019, extreme fires in Australia burned more than 10 million hectares of land [31], resulting in economic losses of approximately 110 billion US dollars, accounting for 7.9% of the country’s GDP [61]. Since May 2023, Canada has experienced persistent and widespread fires, with a record-breaking cumulative area of 156,000 square kilometers as of August 31, more than twice the previous maximum since 1983, and more than half of the world’s landmass [60]. However, scientific study on the impact of extreme climate conditions on fires is still lacking. There is an urgent need for governments and the scientific community to understand the development of fires under extreme climatic conditions. We will continue to concentrate on how fires are affected by extreme weather conditions in the future, as well as the underlying mechanisms in relation to global warming.

5. Conclusions

Our study investigated the climatic drivers of China’s forest fires under a strict fire suppression policy based on Moderate Resolution Imaging Spectroradiometer (MODIS) Collection 6 (C6) forest fire data from 2003 to 2022. In total, 82% of forest fires were prevalent in the SR and SWR, especially in winter and spring. Forest fires were mainly distributed in areas with a mean annual temperature and annual precipitation of 14~22 °C (subtropical) and 800~2000 mm (humid zone), respectively. Incidences of forest fires were positively correlated with temperature, potential evapotranspiration, surface downwelling shortwave flux, and near-surface wind speed but negatively correlated with precipitation and near-surface relative humidity. Temperature and potential evapotranspiration dominated the roles in determining spatial variations of China’s forest fires, while the combination of climate variables complicated the spatial variation. This study not only provides a new and pure understanding of the impact of climate drivers on forest fires in China, but also offers helpful guidance for fire management, prevention and forecasting.

Author Contributions

Conceptualization, Z.F.; methodology, C.L.; software, C.L.; validation, C.L.; formal analysis, C.L.; investigation, C.L.; resources, C.L.; data curation, C.L.; writing—original draft preparation, C.L.; writing—review and editing, Z.F.; visualization, C.L. and B.G.; supervision, Z.F. and H.G.; project administration, Z.F. and B.G.; funding acquisition, Z.F. All authors have read and agreed to the published version of the manuscript.

Funding

This research was funded by the National Natural Science Foundation of China (42130508), and the Opening Fund of Key Laboratory of Natural Disaster Monitoring, Early Warning and Assessment of Jiangxi Province (Jiangxi Normal University) (JXZRZH202305).

Data Availability Statement

Some or all data and models that support the findings of this study are available from the corresponding author upon reasonable request.

Conflicts of Interest

The authors declare no conflict of interest.

References

  1. Bowman, D.; Balch, J.K.; Artaxo, P.; Bond, W.J.; Carlson, J.M.; Cochrane, M.A.; D’Antonio, C.M.; DeFries, R.S.; Doyle, J.C.; Harrison, S.P.; et al. Fire in the Earth System. Science 2009, 324, 481–484. [Google Scholar] [CrossRef] [PubMed]
  2. Jolly, W.M.; Cochrane, M.A.; Freeborn, P.H.; Holden, Z.A.; Brown, T.J.; Williamson, G.J.; Bowman, D.M.J.S. Climate-induced variations in global wildfire danger from 1979 to 2013. Nat. Commun. 2015, 6, 7537. [Google Scholar] [CrossRef] [PubMed]
  3. Molina, J.R.; Herrera, M.A.; Rodríguez y Silva, F. Wildfire-induced reduction in the carbon storage of Mediterranean ecosystems: An application to brush and forest fires impacts assessment. Environ. Impact Assess. Rev. 2019, 76, 88–97. [Google Scholar] [CrossRef]
  4. Earl, N.; Simmonds, I. Spatial and Temporal Variability and Trends in 2001–2016 Global Fire Activity. J. Geophys. Res. Atmos. 2018, 123, 2524–2536. [Google Scholar] [CrossRef]
  5. Bowd, E.J.; Banks, S.C.; Strong, C.L.; Lindenmayer, D.B. Long-term impacts of wildfire and logging on forest soils. Nat. Geosci. 2019, 12, 113–118. [Google Scholar] [CrossRef]
  6. Turetsky, M.R.; Benscoter, B.; Page, S.; Rein, G.; van der Werf, G.R.; Watts, A. Global vulnerability of peatlands to fire and carbon loss. Nat. Geosci. 2014, 8, 11–14. [Google Scholar] [CrossRef]
  7. van der Werf, G.R.; Randerson, J.T.; Giglio, L.; van Leeuwen, T.T.; Chen, Y.; Rogers, B.M.; Mu, M.; van Marle, M.J.E.; Morton, D.C.; Collatz, G.J.; et al. Global fire emissions estimates during 1997–2016. Earth Syst. Sci. Data 2017, 9, 697–720. [Google Scholar] [CrossRef]
  8. Le Page, Y.; Pereira, J.M.C.; Trigo, R.; da Camara, C.; Oom, D.; Mota, B. Global fire activity patterns (1996–2006) and climatic influence: An analysis using the World Fire Atlas. Atmos. Chem. Phys. 2008, 8, 1911–1924. [Google Scholar] [CrossRef]
  9. Aldersley, A.; Murray, S.J.; Cornell, S.E. Global and regional analysis of climate and human drivers of wildfire. Sci. Total Environ. 2011, 409, 3472–3481. [Google Scholar] [CrossRef]
  10. Mancini, L.D.; Corona, P.; Salvati, L. Ranking the importance of Wildfires’ human drivers through a multi-model regression approach. Environ. Impact Assess. Rev. 2018, 72, 177–186. [Google Scholar] [CrossRef]
  11. Elia, M.; D’Este, M.; Ascoli, D.; Giannico, V.; Spano, G.; Ganga, A.; Colangelo, G.; Lafortezza, R.; Sanesi, G. Estimating the probability of wildfire occurrence in Mediterranean landscapes using Artificial Neural Networks. Environ. Impact Assess. Rev. 2020, 85, 106474. [Google Scholar] [CrossRef]
  12. Bowman, D.; Kolden, C.A.; Abatzoglou, J.T.; Johnston, F.H.; van der Werf, G.R.; Flannigan, M. Vegetation fires in the Anthropocene. Nat. Rev. Earth Environ. 2020, 1, 500–515. [Google Scholar] [CrossRef]
  13. Chuvieco, E.; Giglio, L.; Justice, C. Global characterization of fire activity: Toward defining fire regimes from Earth observation data. Glob. Change Biol. 2008, 14, 1488–1502. [Google Scholar] [CrossRef]
  14. Syphard, A.D.; Keeley, J.E.; Pfaff, A.H.; Ferschweiler, K. Human presence diminishes the importance of climate in driving fire activity across the United States. Proc. Natl. Acad. Sci. USA 2017, 114, 13750–13755. [Google Scholar] [CrossRef]
  15. Pechony, O.; Shindell, D.T. Driving forces of global wildfires over the past millennium and the forthcoming century. Proc. Natl. Acad. Sci. USA 2010, 107, 19167–19170. [Google Scholar] [CrossRef]
  16. Richardson, D.; Black, A.S.; Irving, D.; Matear, R.J.; Monselesan, D.P.; Risbey, J.S.; Squire, D.T.; Tozer, C.R. Global increase in wildfire potential from compound fire weather and drought. NPJ Clim. Atmos. Science 2022, 5, 23. [Google Scholar] [CrossRef]
  17. Voulgarakis, A.; Field, R.D. Fire Influences on Atmospheric Composition, Air Quality and Climate. Curr. Pollut. Rep. 2015, 1, 70–81. [Google Scholar] [CrossRef]
  18. Giglio, L.; Csiszar, I.; Justice, C.O. Global distribution and seasonality of active fires as observed with the Terra and Aqua Moderate Resolution Imaging Spectroradiometer (MODIS) sensors. J. Geophys. Res. Biogeosciences 2006, 111, G02016. [Google Scholar] [CrossRef]
  19. Zheng, B.; Ciais, P.; Chevallier, F.; Yang, H.; Canadell, J.G.; Chen, Y.; van der Velde, I.R.; Aben, I.; Chuvieco, E.; Davis, S.J.; et al. Record-high CO2 emissions from boreal fires in 2021. Science 2023, 379, 912–917. [Google Scholar] [CrossRef]
  20. Aguilera, R.; Corringham, T.; Gershunov, A.; Benmarhnia, T. Wildfire smoke impacts respiratory health more than fine particles from other sources: Observational evidence from Southern California. Nat. Commun. 2021, 12, 1493. [Google Scholar] [CrossRef]
  21. Jager, H.I.; Coutant, C.C. Knitting while Australia burns. Nat. Clim. Change 2020, 10, 170. [Google Scholar] [CrossRef]
  22. Brown, P.T.; Hanley, H.; Mahesh, A.; Reed, C.; Strenfel, S.J.; Davis, S.J.; Kochanski, A.K.; Clements, C.B. Climate warming increases extreme daily wildfire growth risk in California. Nature 2023, 621, 760–766. [Google Scholar] [CrossRef] [PubMed]
  23. Genton, M.G.; Butry, D.T.; Gumpertz, M.L.; Prestemon, J.P. Spatio-temporal analysis of wildfire ignitions in the St Johns River Water Management District, Florida. Int. J. Wildland Fire 2006, 15, 87–97. [Google Scholar] [CrossRef]
  24. Abatzoglou, J.T.; Kolden, C.A. Relationships between climate and macroscale area burned in the western United States. Int. J. Wildland Fire 2013, 22, 1003–1020. [Google Scholar] [CrossRef]
  25. Abram, N.J.; Henley, B.J.; Sen Gupta, A.; Lippmann, T.J.R.; Clarke, H.; Dowdy, A.J.; Sharples, J.J.; Nolan, R.H.; Zhang, T.; Wooster, M.J.; et al. Connections of climate change and variability to large and extreme forest fires in southeast Australia. Commun. Earth Environ. 2021, 2, 8. [Google Scholar] [CrossRef]
  26. Abatzoglou, J.T.; Williams, A.P.; Boschetti, L.; Zubkova, M.; Kolden, C.A. Global patterns of interannual climate-fire relationships. Glob. Change Biol. 2018, 24, 5164–5175. [Google Scholar] [CrossRef]
  27. Yang, J.; Tian, H.; Tao, B.; Ren, W.; Kush, J.; Liu, Y.; Wang, Y. Spatial and temporal patterns of global burned area in response to anthropogenic and environmental factors: Reconstructing global fire history for the 20th and early 21st centuries. J. Geophys. Res. Biogeosciences 2014, 119, 249–263. [Google Scholar] [CrossRef]
  28. Xiong, Q.; Luo, X.; Liang, P.; Xiao, Y.; Xiao, Q.; Sun, H.; Pan, K.; Wang, L.; Li, L.; Pang, X. Fire from policy, human interventions, or biophysical factors? Temporal–spatial patterns of forest fire in southwestern China. For. Ecol. Manag. 2020, 474, 118381. [Google Scholar] [CrossRef]
  29. Zubkova, M.; Boschetti, L.; Abatzoglou, J.T.; Giglio, L. Changes in Fire Activity in Africa from 2002 to 2016 and Their Potential Drivers. Geophys. Res. Lett. 2019, 46, 7643–7653. [Google Scholar] [CrossRef]
  30. Zou, Y.; Rasch, P.J.; Wang, H.; Xie, Z.; Zhang, R. Increasing large wildfires over the western United States linked to diminishing sea ice in the Arctic. Nat. Commun. 2021, 12, 6048. [Google Scholar] [CrossRef]
  31. Fang, K.; Yao, Q.; Guo, Z.; Zheng, B.; Du, J.; Qi, F.; Yan, P.; Li, J.; Ou, T.; Liu, J.; et al. ENSO modulates wildfire activity in China. Nat. Commun. 2021, 12, 1764. [Google Scholar] [CrossRef] [PubMed]
  32. Wei, F.L.; Wang, S.; Fu, B.J.; Brandt, M.; Pan, N.Q.; Wang, C.; Fensholt, R. Nonlinear dynamics of fires in Africa over recent decades controlled by precipitation. Glob. Change Biol. 2020, 26, 4495–4505. [Google Scholar] [CrossRef] [PubMed]
  33. Zhou, Q.; Zhang, H.; Wu, Z. Effects of Forest Fire Prevention Policies on Probability and Drivers of Forest Fires in the Boreal Forests of China during Different Periods. Remote Sens. 2022, 14, 5724. [Google Scholar] [CrossRef]
  34. Liu, Z.; Yang, J.; Chang, Y.; Weisberg, P.J.; He, H.S. Spatial patterns and drivers of fire occurrence and its future trend under climate change in a boreal forest of Northeast China. Glob. Change Biol. 2012, 18, 2041–2056. [Google Scholar] [CrossRef]
  35. Ying, L.; Cheng, H.; Shen, Z.; Guan, P.; Luo, C.; Peng, X. Relative humidity and agricultural activities dominate wildfire ignitions in Yunnan, Southwest China: Patterns, thresholds, and implications. Agric. For. Meteorol. 2021, 307, 108540. [Google Scholar] [CrossRef]
  36. Wu, Z.; He, H.S.; Fang, L.; Liang, Y.; Parsons, R.A. Wind speed and relative humidity influence spatial patterns of burn severity in boreal forests of northeastern China. Ann. For. Sci. 2018, 75, 66. [Google Scholar] [CrossRef]
  37. Guo, M.; Yao, Q.; Suo, H.; Xu, X.; Li, J.; He, H.; Yin, S.; Li, J. The importance degree of weather elements in driving wildfire occurrence in mainland China. Ecol. Indic. 2023, 148, 110152. [Google Scholar] [CrossRef]
  38. Ying, L.; Han, J.; Du, Y.; Shen, Z. Forest fire characteristics in China: Spatial patterns and determinants with thresholds. For. Ecol. Manag. 2018, 424, 345–354. [Google Scholar] [CrossRef]
  39. Yan, K.; Wang, W.; Li, Y.; Wang, X.; Jin, J.; Jiang, J.; Yang, H.; Wang, L. Identifying priority conservation areas based on ecosystem services change driven by Natural Forest Protection Project in Qinghai province, China. J. Clean. Prod. 2022, 362, 132453. [Google Scholar] [CrossRef]
  40. Huang, H.; Zhou, Y.; Qian, M.; Zeng, Z. Land Use Transition and Driving Forces in Chinese Loess Plateau: A Case Study from Pu County, Shanxi Province. Land 2021, 10, 67. [Google Scholar] [CrossRef]
  41. Zong, X.; Tian, X.; Yao, Q.; Brown, P.M. An analysis of fatalities from forest fires in China, 1951–2018. Int. J. Wildland Fire 2022, 31, 507–517. [Google Scholar] [CrossRef]
  42. Davies, D.K.; Ilavajhala, S.; Min Minnie, W.; Justice, C.O. Fire Information for Resource Management System: Archiving and Distributing MODIS Active Fire Data. IEEE Trans. Geosci. Remote Sens. 2009, 47, 72–79. [Google Scholar] [CrossRef]
  43. Giglio, L.; Schroeder, W.; Justice, C.O. The collection 6 MODIS active fire detection algorithm and fire products. Remote Sens. Environ. 2016, 178, 31–41. [Google Scholar] [CrossRef]
  44. Yaduvanshi, A.; Srivastava, P.K.; Pandey, A.C. Integrating TRMM and MODIS satellite with socio-economic vulnerability for monitoring drought risk over a tropical region of India. Phys. Chem. Earth Parts A/B/C 2015, 83-84, 14–27. [Google Scholar] [CrossRef]
  45. Vadrevu, K.; Lasko, K. Intercomparison of MODIS AQUA and VIIRS I-Band Fires and Emissions in an Agricultural Landscape-Implications for Air Pollution Research. Remote Sens. 2018, 10, 978. [Google Scholar] [CrossRef]
  46. Forsythe, N.; Kilsby, C.G.; Fowler, H.J.; Archer, D.R. Assessment of Runoff Sensitivity in the Upper Indus Basin to Interannual Climate Variability and Potential Change Using MODIS Satellite Data Products. Mt. Res. Dev. 2012, 32, 16–29. [Google Scholar] [CrossRef]
  47. Yang, J.; Huang, X. The 30 m annual land cover dataset and its dynamics in China from 1990 to 2019. Earth Syst. Sci. Data 2021, 13, 3907–3925. [Google Scholar] [CrossRef]
  48. Karger, D.N.; Lange, S.; Hari, C.; Reyer, C.P.O.; Conrad, O.; Zimmermann, N.E.; Frieler, K. CHELSA-W5E5: Daily 1 km meteorological forcing data for climate impact studies. Earth Syst. Sci. Data 2023, 15, 2445–2464. [Google Scholar] [CrossRef]
  49. ESRI. ArcGIS Desktop: Release 10.8.; Environmental Systems Research Institute: Redlands, CA, USA, 2020. [Google Scholar]
  50. Sen, P.K. Estimates of the Regression Coefficient Based on Kendall’s Tau. Journal of the American Statistical Association 1968, 63, 1379–1389. [Google Scholar] [CrossRef]
  51. Vanem, E.; Walker, S.-E. Identifying trends in the ocean wave climate by time series analyses of significant wave heightdata. Ocean Engineering 2013, 61, 148–160. [Google Scholar] [CrossRef]
  52. Forthofer, R.N.; Lehnen, R.G. Rank Correlation Methods. In Public Program Analysis: A New Categorical Data Approach, Forthofer, R.N., Lehnen, R.G., Eds.; Springer US: Boston, MA, USA, 1981; pp. 146–163. [Google Scholar]
  53. Wang, J.-F.; Zhang, T.-L.; Fu, B.-J. A measure of spatial stratified heterogeneity. Ecol. Indic. 2016, 67, 250–256. [Google Scholar] [CrossRef]
  54. Jain, P.; Castellanos-Acuna, D.; Coogan, S.C.P.; Abatzoglou, J.T.; Flannigan, M.D. Observed increases in extreme fire weather driven by atmospheric humidity and temperature. Nat. Clim. Change 2021, 12, 63–70. [Google Scholar] [CrossRef]
  55. Li, P.; Feng, Z.; Jiang, L.; Liao, C.; Zhang, J. A Review of Swidden Agriculture in Southeast Asia. Remote Sens. 2014, 6, 1654–1683. [Google Scholar] [CrossRef]
  56. Smith, C.; Perkins, O.; Mistry, J. Global decline in subsistence-oriented and smallholder fire use. Nat. Sustain. 2022, 5, 542–551. [Google Scholar] [CrossRef]
  57. Ramo, R.; Roteta, E.; Bistinas, I.; van Wees, D.; Bastarrika, A.; Chuvieco, E.; van der Werf, G.R. African burned area and fire carbon emissions are strongly impacted by small fires undetected by coarse resolution satellite data. Proc. Natl. Acad. Sci. USA 2021, 118, e2011160118. [Google Scholar] [CrossRef]
  58. Iglesias, V.; Balch, J.K.; Travis, W.R. U.S. fires became larger, more frequent, and more widespread in the 2000s. Sci. Adv. 2022, 8, eabc0020. [Google Scholar] [CrossRef]
  59. Dutta, R.; Das, A.; Aryal, J. Big data integration shows Australian bush-fire frequency is increasing significantly. R. Soc. Open Sci. 2016, 3, 150241. [Google Scholar] [CrossRef]
  60. Wang, Z.; Wang, Z.; Zou, Z.; Chen, X.; Wu, H.; Wang, W.; Su, H.; Li, F.; Xu, W.; Liu, Z.; et al. Severe Global Environmental Issues Caused by Canada’s Record-Breaking Wildfires in 2023. Adv. Atmos. Sci. 2023, 41, 565–571. [Google Scholar] [CrossRef]
  61. Tang, X.; Machimura, T.; Li, J.; Yu, H.; Liu, W. Evaluating Seasonal Wildfire Susceptibility and Wildfire Threats to Local Ecosystems in the Largest Forested Area of China. Earth’s Future 2022, 10, e2021EF002199. [Google Scholar] [CrossRef]
Figure 1. Annual average number (a,b) and monthly average number (c) of forest fires in China during 2003–2022.
Remotesensing 17 00088 g001
Figure 2. The trend of climatic factors in forest fire areas of China.
Remotesensing 17 00088 g002
Figure 3. Climatic factors and forest fires relationships.
Remotesensing 17 00088 g003
Figure 4. Correlations between forest fire occurrence and climate factors.
Remotesensing 17 00088 g004
Table 1. Trend categories.
Slope (TS)Z (MK)Trend Features
Slope > 02.58 < Z
1.96 < Z ≤ 2.58
1.65 < Z ≤ 1.96
Z ≤ 1.65
Highly Significant Increase (HSI)
Significant Increase (SI)
Slightly Significant Increase (SSI)
No Significant Increase (NSI)
Slope < 02.58 < Z
1.96 < Z ≤ 2.58
1.65 < Z ≤ 1.96
Z ≤ 1.65
Highly Significant Decrease (HSD)
Significant Decrease (SD)
Slightly Significant Decrease (SSD)
No Significant Decrease (NSD)
Table 2. Correlation coefficient grade division table.
CategoriesStrong Negative Correlation (SNC)Medium Negative Correlation (MNC)Weak Negative Correlation (WNC)Weak Positive Correlation (WPC)Medium Positive Correlation (MPC)Strong Positive Correlation
(SPC)
Coefficient−1.0~−0.6−0.6~−0.4−0.4~00~0.40.4~0.60.6~1.0
Table 3. Relative area proportion of correlation between forest fires and climate factors.
Climate
Factors
Strong Negative Correlation (SNC)Medium Negative Correlation (MNC)Weak Negative Correlation (WNC)Weak Positive Correlation (WPC)Medium Positive Correlation (MPC)Strong Positive Correlation
(SPC)
Pr2.87%19.80%58.56%17.11%1.48%0.19%
Tas0.47%5.23%40.90%44.54%7.66%1.21%
Pe0.00%0.28%11.01%49.36%31.10%8.26%
Hurs18.79%37.31%37.12%6.69%0.09%0.00%
Sfcwind0.00%2.26%34.46%52.26%7.63%3.39%
Rsds0.00%0.18%8.72%40.55%35.60%15.05%
Table 4. Detection results of China’s forest fires interaction.
CHNPrSfcwindTasHursPeRsds
Pr0.14
Sfcwind0.160.05
Tas0.290.290.25
Hurs0.190.170.320.13
Pe0.270.260.290.300.17
Rsds0.220.140.290.250.230.05
Disclaimer/Publisher’s Note: The statements, opinions and data contained in all publications are solely those of the individual author(s) and contributor(s) and not of MDPI and/or the editor(s). MDPI and/or the editor(s) disclaim responsibility for any injury to people or property resulting from any ideas, methods, instructions or products referred to in the content.

