Abstract
As an important target of space exploration, Mars has attracted a lot of attention due to its unique geographical and atmospheric conditions. The detection of the vertical profiles of Mars atmospheric parameters provides deeper insights into the structure and composition of the Martian atmosphere. Meanwhile, it holds significant importance for the design and execution of Mars exploration missions. This paper presents a detection method for the Martian atmosphere utilizing laser occultation technology based on a network of high-orbit and low-orbit satellites around Mars. The measurement principle of Mars laser occultation is first introduced, which is that the atmospheric temperature and pressure are measured by analyzing the absorption spectrum characteristics of infrared carbon dioxide. Then, a detailed simulation process is described, including the establishment and validation of both the radiation intensity calculation model for laser occultation signals and the method for retrieving atmospheric parameters. A set of satellite payload parameters is also designed. The simulation results reveal that this method can accurately measure temperature and pressure at a vertical resolution of 100 m from 5 km to 50 km altitude of the Martian atmosphere with deviations of 0.43 K and 1.06%, respectively. It is indicated that the proposed laser occultation method can achieve effective detection of temperature and pressure and provide a promising approach for high vertical resolution profile detection of the Martian atmosphere in the future.
1. Introduction
Mars is a major target for current space exploration. Temperature and pressure are the most important thermodynamic parameters of the Martian atmosphere. Compared to Earth, Mars has a thinner atmosphere, with an average pressure of about 0.6% of that on Earth, and its temperatures are generally lower and vary more widely. In recent years, detecting the temperature and pressure of the Martian atmosphere has become a primary objective for Mars exploration missions by various countries. It is the key to a deep understanding of the changes in Martian weather and climate characteristics and is vital for the accurate implementation of the entry, descent, and landing (EDL) process of Mars spacecraft [1].
Currently, spaceborne occultation technology is an effective approach to detecting planetary atmospheres, which uses detectors on satellites to receive stellar radiation signals or artificial radiation signals from behind the planet’s atmosphere. It obtains atmospheric parameters such as temperature and pressure by measuring the spectral absorption or refraction changes of the planetary atmosphere. This technology has been widely applied on exploration satellites of various countries to obtain atmospheric parameter information on planets like Earth, Mars, and Venus [2,3,4,5]. As early as the 1960s, scientists from the Jet Propulsion Laboratory (JPL) and Stanford University in the United States proposed the concept of radio occultation for detecting the planetary atmosphere and ionosphere [6]. In 1964, the Mariner 4, developed by the National Aeronautics and Space Administration (NASA), was successfully launched and conducted the first measurements of the Martian atmosphere and ionosphere [7]. By measuring the frequency, phase, and amplitude changes of the radio signals, it obtained the composition, density, and temperature distribution of the Martian atmosphere, as well as the electron density profile of the Martian ionosphere [8,9]. Following the successful application of radio occultation technology in Mars exploration, the United States further launched multiple satellites for studying the Martian atmosphere and ionosphere, including the Mars Global Surveyor (MGS), Mars Odyssey (MO), and Mars Reconnaissance Orbiter (MRO) [10,11,12,13,14,15]. These Mars detectors have collected a wealth of Martian atmospheric parameter profile data through long-term occultation observations, providing significant support for scientific research on Mars.
Radio occultation technology can provide the detection of Martian atmospheric temperature, pressure, and other key atmospheric parameters. For example, the Tianwen-1 mission successfully obtained vertical profile data of the Martian ionosphere and atmosphere by using single-frequency radio occultation technology, revealing the temperature variation characteristics from the planetary boundary layer to the mesosphere in the Martian atmosphere and the electron density profiles of the M1 and M2 layers in the ionosphere [16]. However, due to the diffraction effect of radio waves, this technology has certain limitations in vertical resolution, which makes it difficult to meet the requirements of atmospheric scientific research. Additionally, stellar occultation is another method for detecting the Martian atmosphere. For instance, by analyzing the solar transmission spectra measured by the Imaging UltraViolet Spectrograph (IUVS) instrument of the Mars Atmosphere and Volatile EvolutioN (MAVEN) mission, Gröller et al. [17] retrieved number density profiles of major atmospheric molecules and temperature profile at altitudes ranging from 20 km to 160 km in the Martian atmosphere, covering a pressure variation range of 8 orders of magnitude. However, stellar occultation uses natural radiation sources as the light source, and its relatively weak signal strength limits the spectral resolution. Moreover, common solar occultations require observations at dawn and dusk, resulting in a low data acquisition rate and an inability to ensure continuous observation throughout the day.
Laser is an active light source with extremely high directionality and tunability, which can flexibly adjust its output wavelength. Due to the very small divergence angle and narrow line width of the laser, using it as a light source for occultation detection technology can not only overcome the limitations of vertical resolution and accuracy in atmospheric temperature and pressure profile detection by radio occultation but also avoid the specific time restrictions like solar occultation. In 2010, the ACCURATE (Atmospheric Climate and Chemistry in the UTLS Region And Climate Trends Explorer) issued by the European Space Agency (ESA) introduced the laser occultation detection technology for the first time. This mission is used for accurate measurements of temperature, pressure, radial wind speed, and greenhouse gases in the Earth’s atmosphere to provide high-precision and long-term stable climate benchmark data [18]. In brief, the method based on laser occultation detection can provide an effective means for obtaining the temperature and pressure profiles of the Martian atmosphere.
This paper is structured as follows. We first introduce the basic principles of laser occultation observation in Section 2. Next, we establish a Martian high-orbit and low-orbit laser occultation model for simulating the laser occultation signal and provide payload technical specifications based on actual conditions in Section 3. Then, in Section 4, a high vertical resolution data inversion method is described in detail, and the temperature and pressure profiles of the Martian atmosphere are retrieved by inverting the simulated laser occultation signals using this method. At the same time, the inversion results are compared with the true values in the model, and the factors that influence the inversion errors are analyzed. Finally, conclusions are drawn in Section 5.
2. Laser Occultation Principle
Laser occultation is a technical method that studies the signal variations generated by the interaction of a laser beam hidden behind the planetary atmosphere with the atmosphere. By analyzing the variation characteristics of the signal, the atmospheric parameter information along the laser transmission path can be retrieved. Figure 1a is a schematic diagram of laser occultation measurement, and the specific implementation process is shown in Figure 1b. When the high-orbit satellite transmitter and the low-orbit satellite receiver on Mars reach a certain geometric position, the transmitter’s laser emits a series of laser pulses with equal frequency intervals. Then, the laser signals are scattered and absorbed through the Martian atmosphere. Finally, the receiver’s detector receives the laser transmission signals of different frequencies after passing through the Martian atmosphere. With the two satellites constantly moving along their orbits, scanning measurements of laser occultation signals at different altitudes can be achieved from top to bottom (descending occultation event) or bottom to top (ascending occultation event), thereby reflecting the variation characteristics of atmospheric molecular absorption spectra. Finally, the vertical distribution of Martian atmospheric temperature and pressure can be obtained by the fitting method. The calculation of the occultation signal and the inversion method of temperature and pressure will be introduced in detail in Section 3.3 and Section 4.1, respectively.
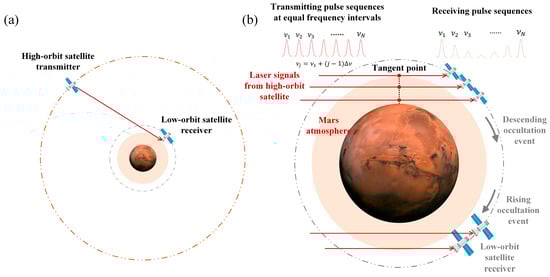
Figure 1.
(a) The schematic diagram of laser occultation of high-orbit and low-orbit satellites around Mars; (b) the schematic diagram of the satellite receiver receiving the laser occultation signal from the satellite transmitter.
Considering that the Martian atmosphere is composed mainly of carbon dioxide (about 95%), nitrogen (about 2.6%), and argon (about 1.9%), it also contains very small amounts of oxygen, water vapor, and other noble gases [19]. Therefore, when conducting Mars atmosphere exploration, the emission wavelength of the transmitter’s laser needs to cover the characteristic absorption spectral range of carbon dioxide. The receiver’s detector also needs to select a sensitive wavelength suitable for the absorption spectral range of carbon dioxide so as to accurately obtain the information of Martian atmosphere parameters. Since the absorption spectrum of carbon dioxide is mainly concentrated in the infrared band, this paper chooses the wavelength range of carbon dioxide from 1.55 μm to 1.6 μm for study. When selecting the spectral range of carbon dioxide, some key factors are considered. Firstly, a significant advantage in this wave band is that the interference from background light is relatively small, which helps to improve the accuracy of the detection. Secondly, laser technology in this band has been very mature and reliable, and the laser can provide high power and stable output. At the same time, the wavelength of the laser is also easier to tune, which allows for a more precise selection of specific wavelengths. Finally, the detector has the characteristics of high sensitivity, a wide dynamic range, and low noise in this wavelength range, which is conducive to capturing weak signals generated from a long distance during the occultation process and improving the detection signal-to-noise ratio (SNR). In order to meet the detection requirements of high vertical resolution and high precision, the parameters of the laser and detector need to be designed, and the specific design content is introduced in Section 3.3.
3. Simulation of Mars Laser Occultation Model
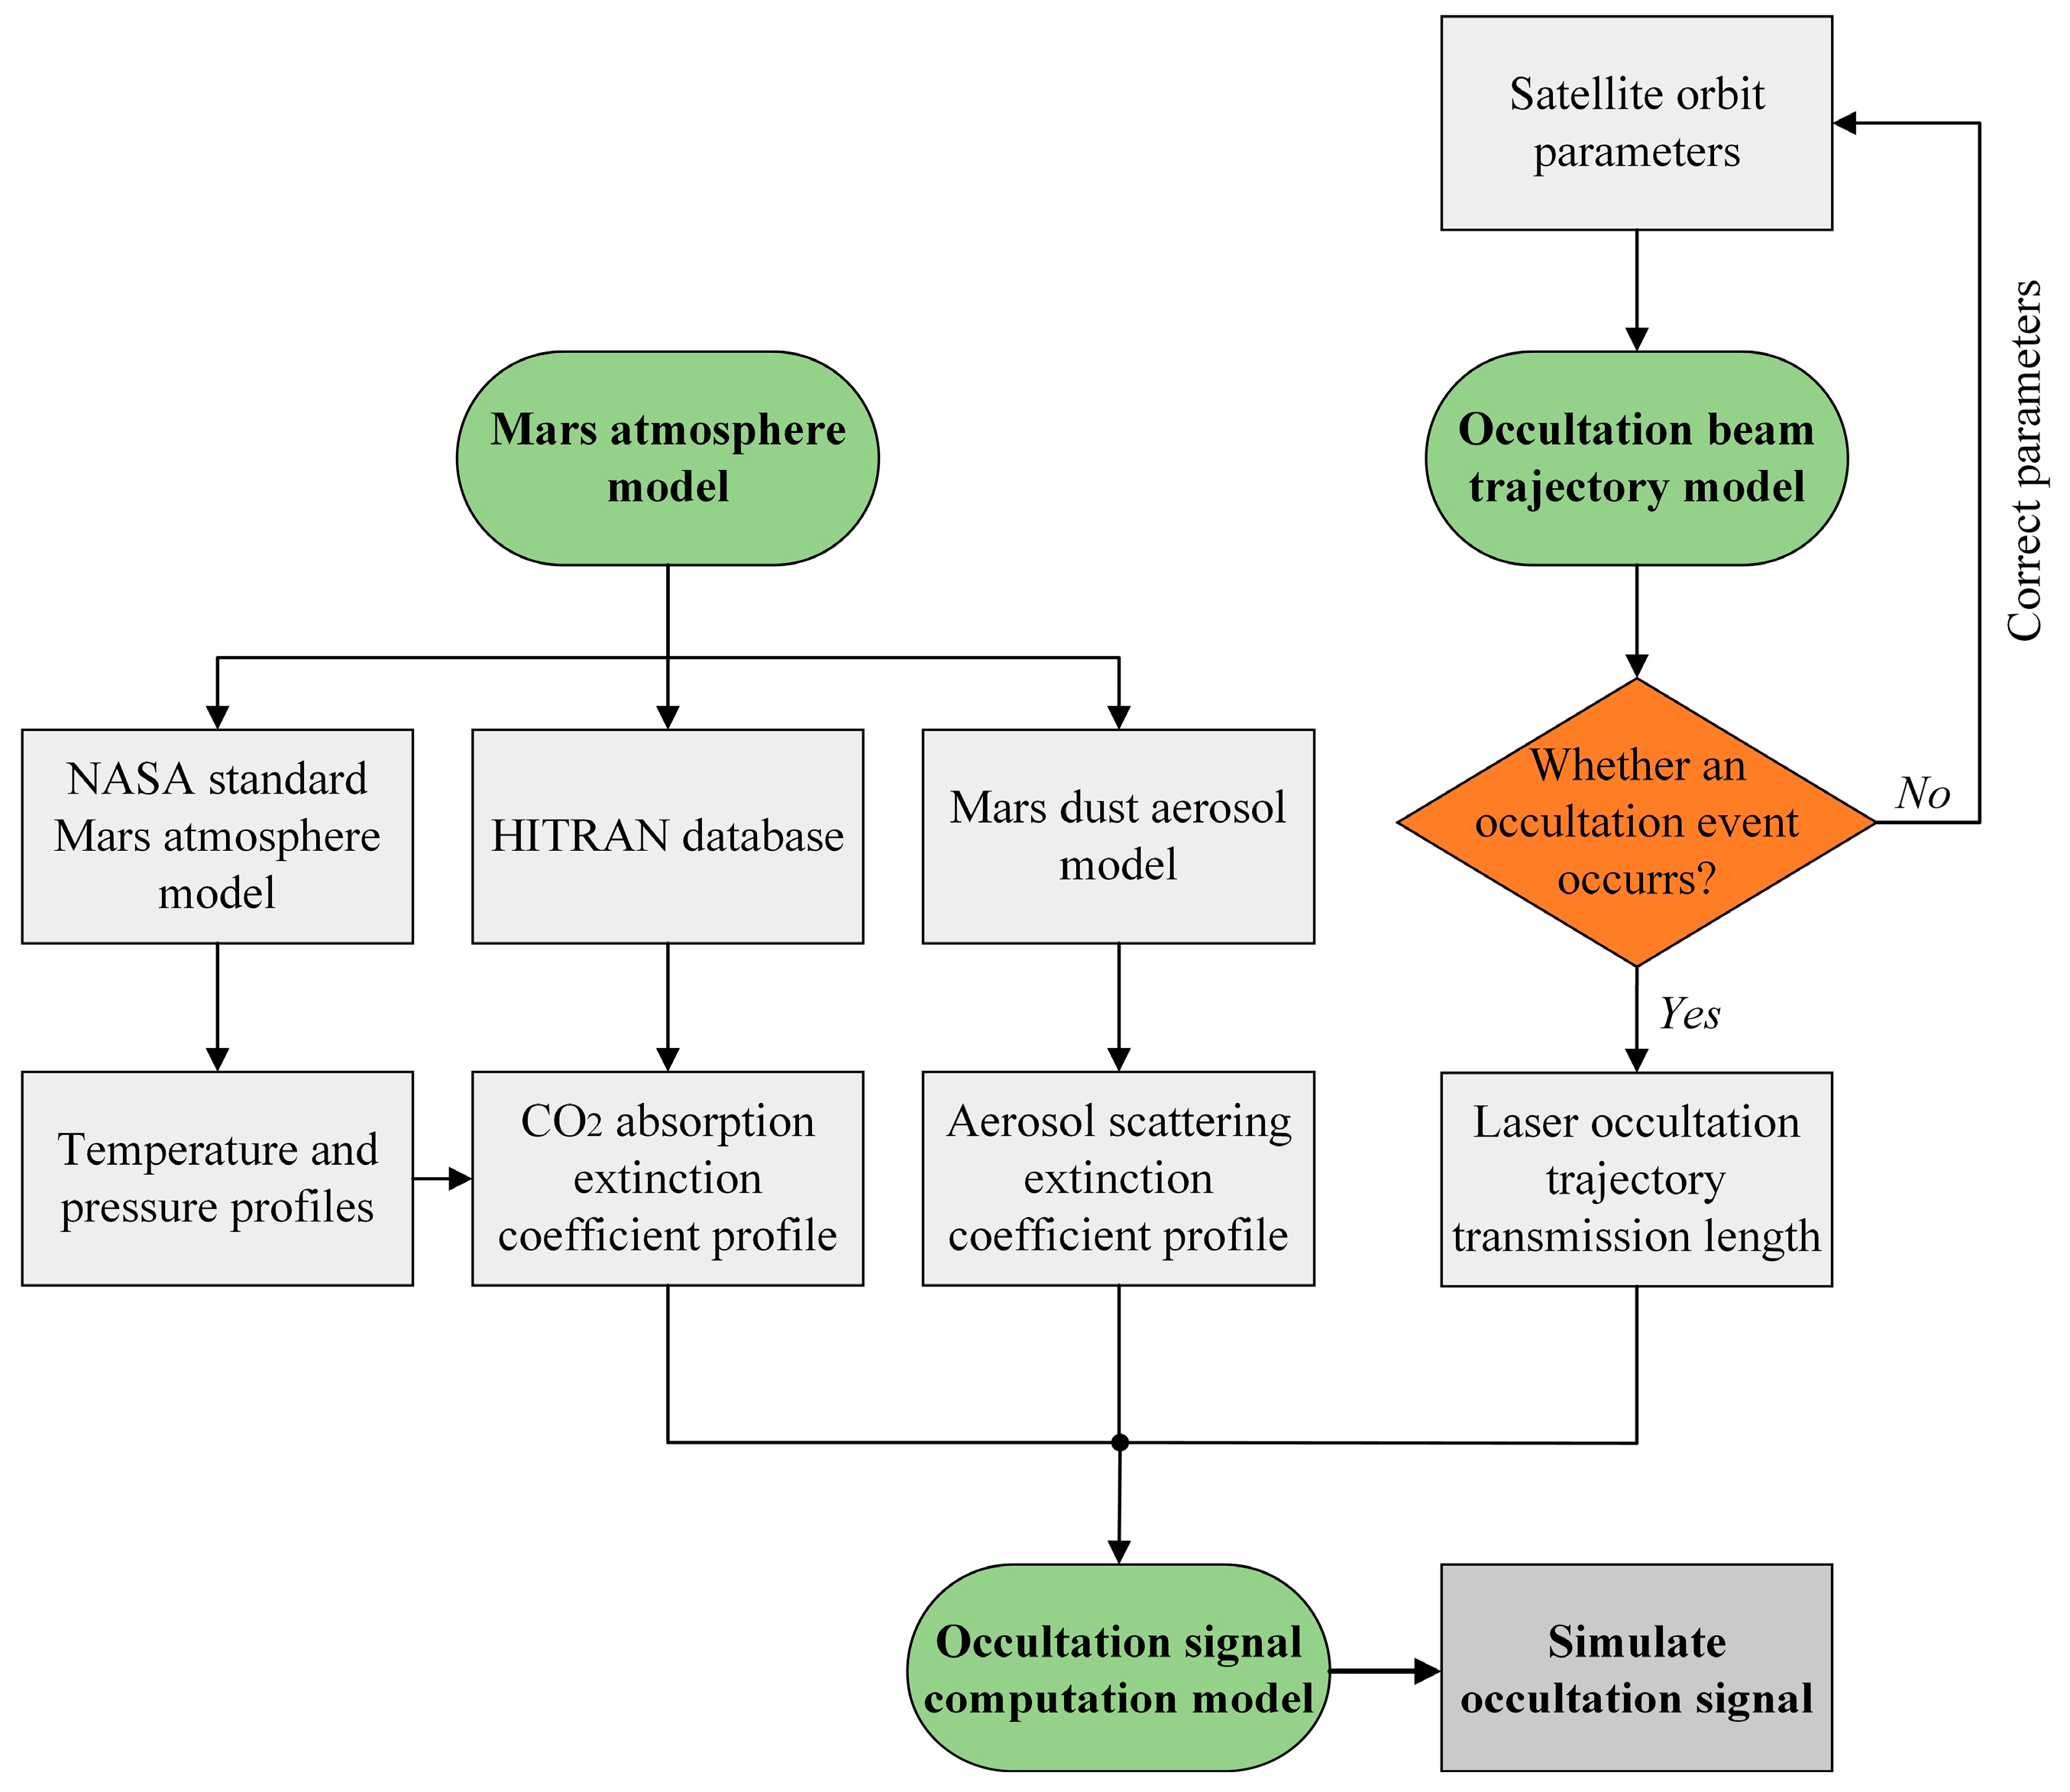
The Mars laser occultation model includes the Mars atmosphere model, the occultation beam trajectory model, and the signal radiation intensity calculation model. The overall framework of the occultation model is shown in Figure 2. Firstly, the Mars atmosphere model, including the temperature, pressure, atmospheric molecule extinction model, and dust aerosol extinction model, is established to simulate the Martian atmosphere environment. Secondly, the occultation beam trajectory model is established according to the pre-planned orbital parameters of the two satellites, and the trajectory information in the laser transmission process is calculated so that the occultation event can be judged. Finally, the signal radiation intensity calculation model is established, and the intensity of the laser occultation signal detected by the satellite receiver is calculated by using the given load parameters and the parameters given in the model.

Figure 2.
The model framework for laser occultation detection of the Martian atmosphere.
3.1. Mars Atmosphere Model
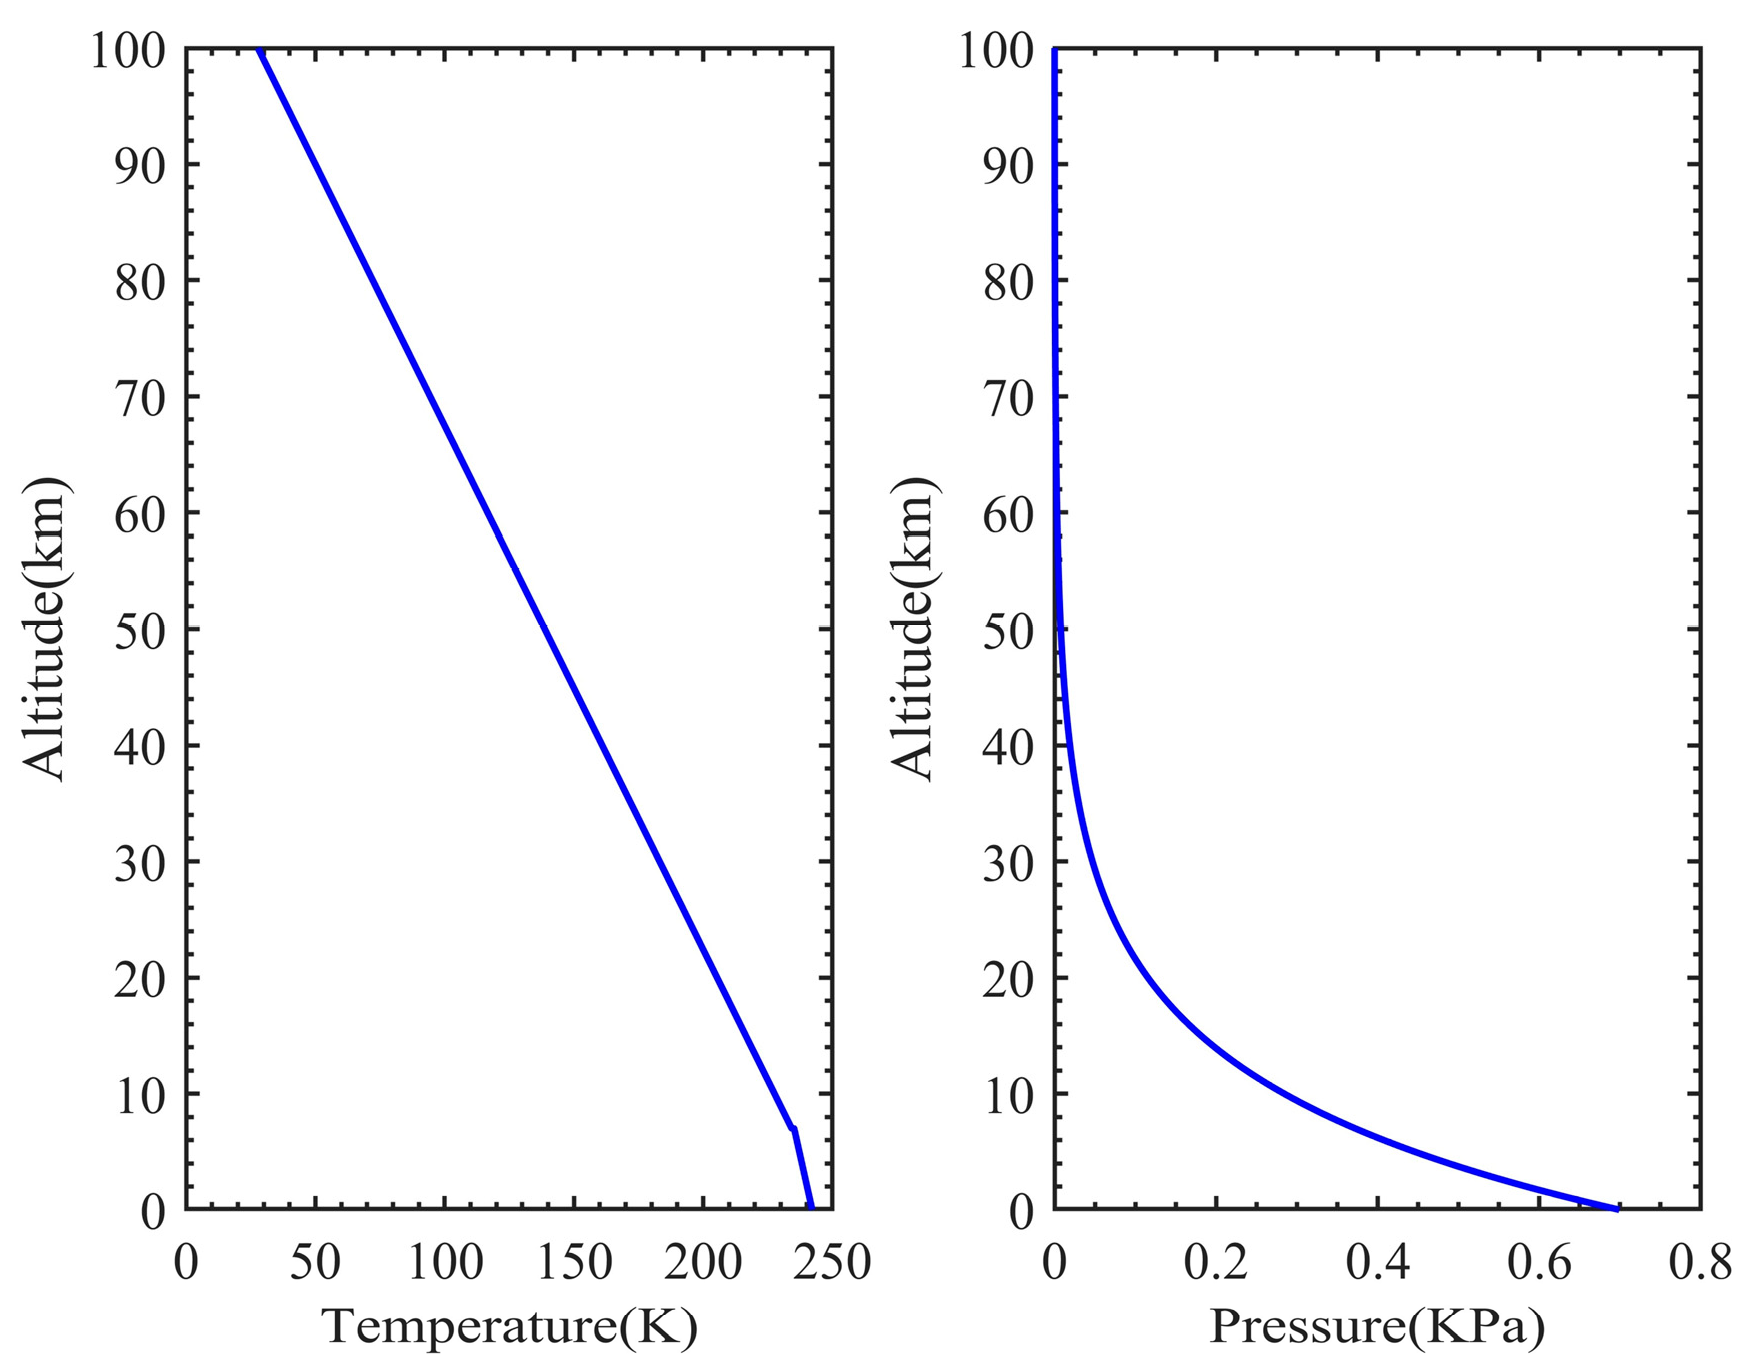
The Mars atmosphere model is the basis for building the Mars laser occultation model. In this section, Martian atmospheric temperature, pressure, atmospheric molecular extinction, and aerosol extinction are simulated. The temperature and pressure data are used to calculate atmospheric molecular extinction, provided by the NASA Standard Mars Atmosphere Model [20], as shown in Figure 3.
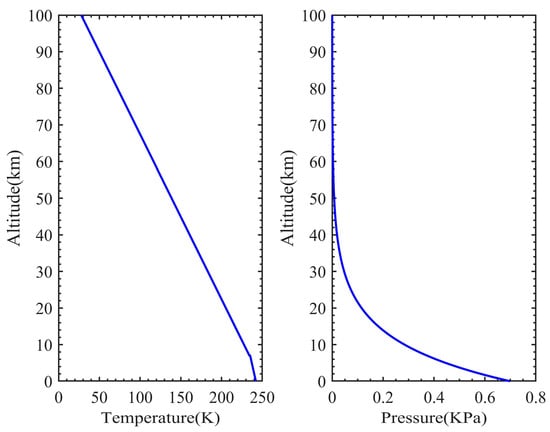
Figure 3.
The Martian atmospheric temperature and pressure profiles generated by the NASA Standard Mars Atmosphere Model.
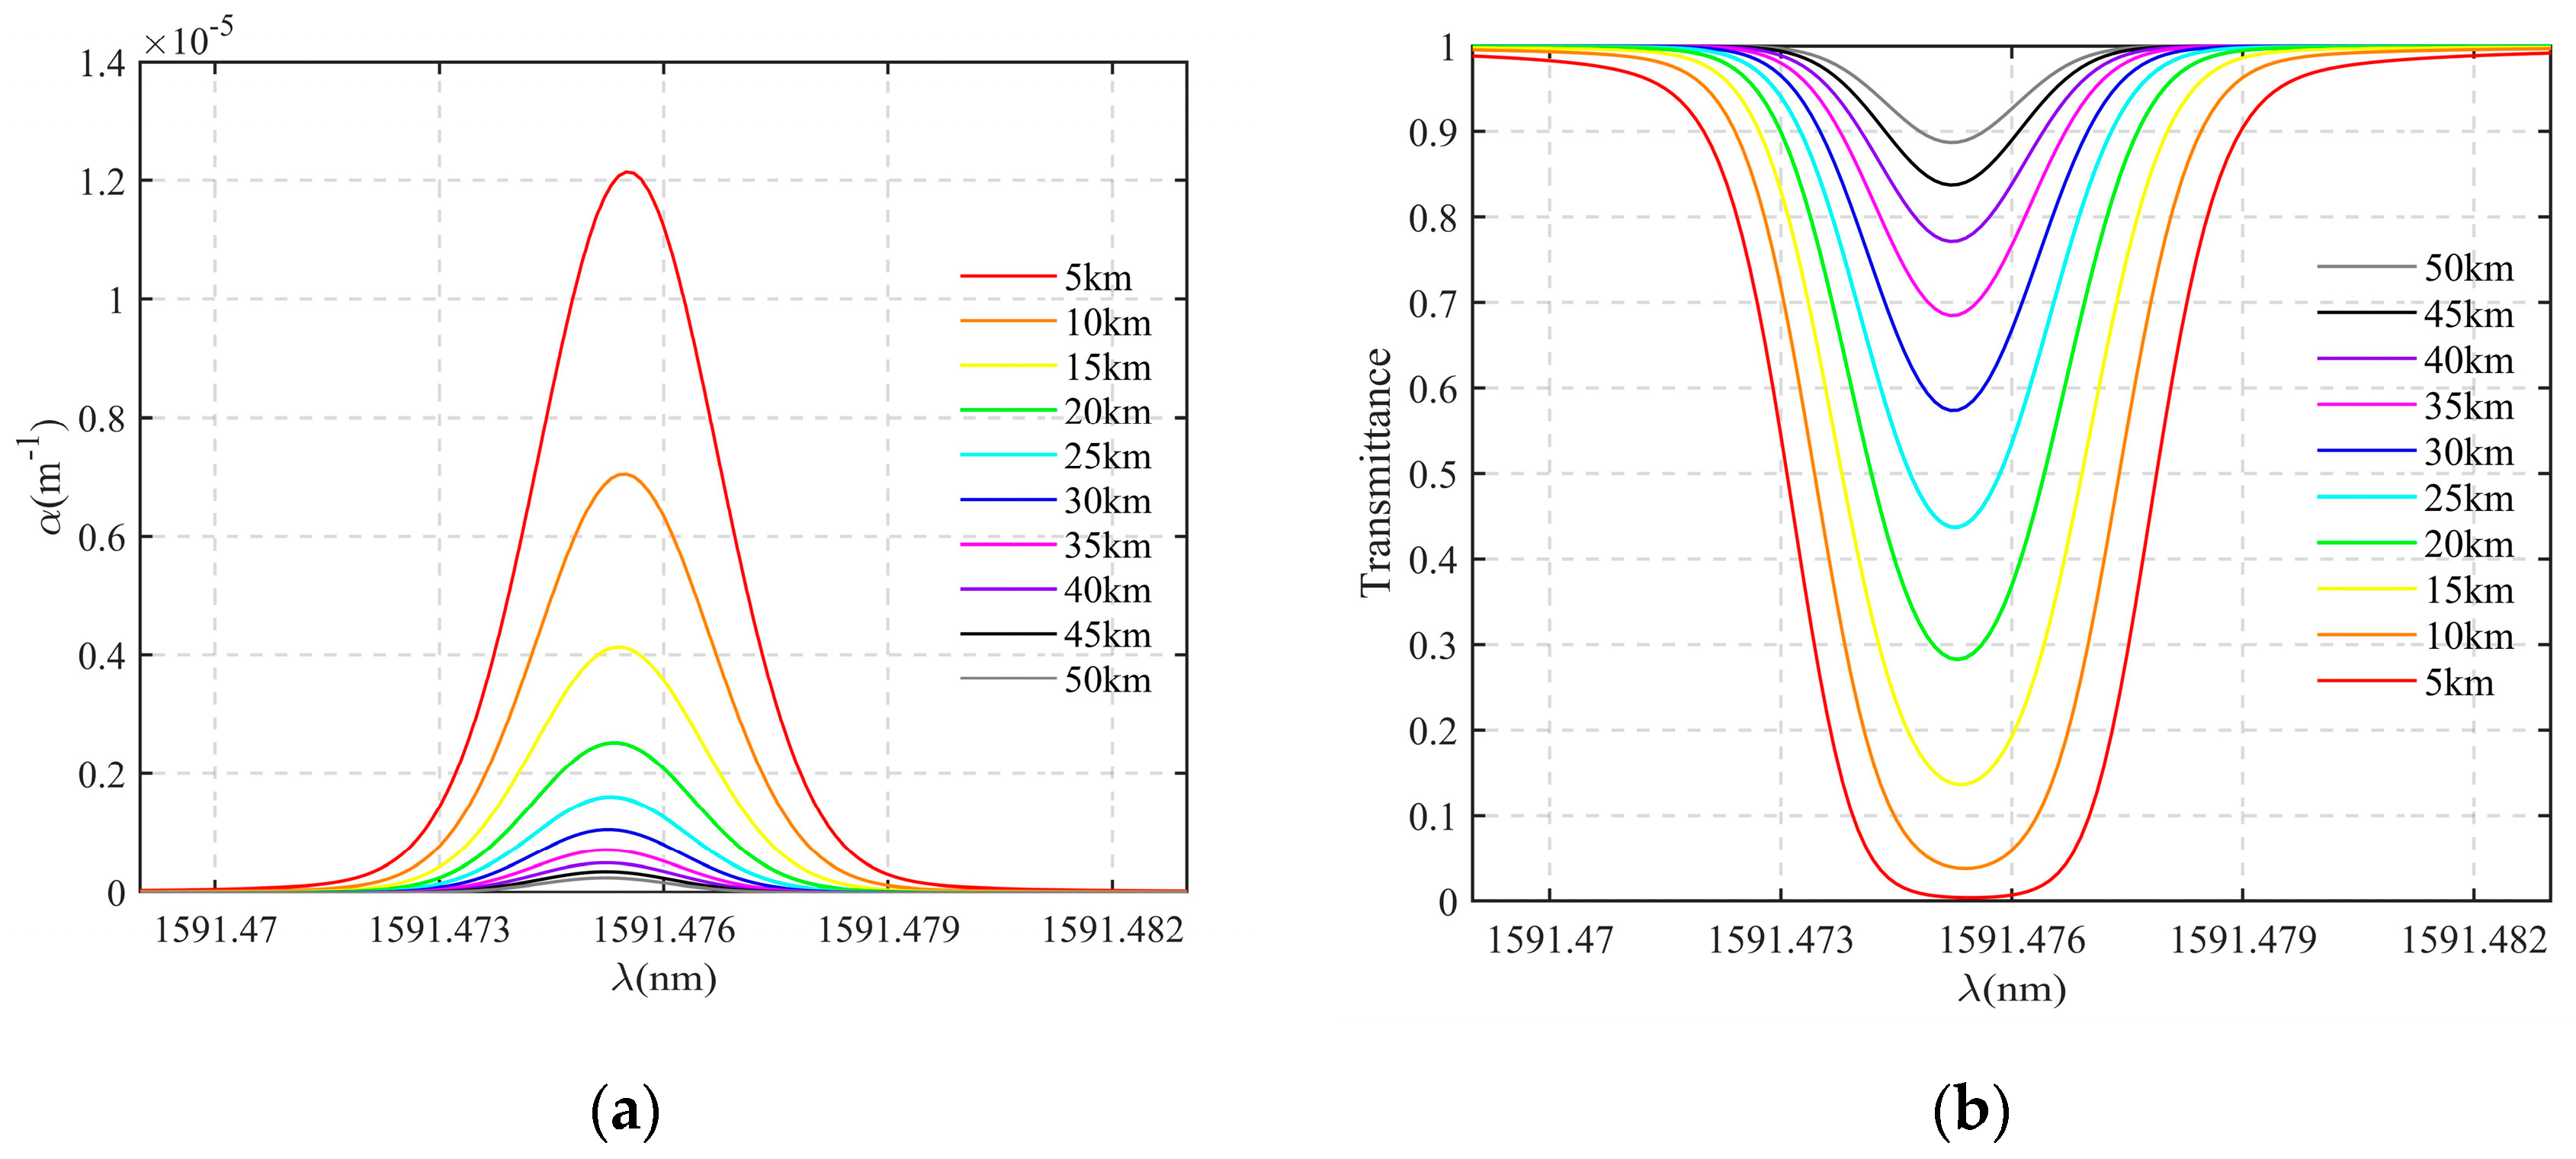
The molecular extinction of the Martian atmosphere is mainly the absorption extinction of carbon dioxide molecules. Extinction data come from the HITRAN database, which provides a variety of atmospheric molecular absorption line parameters covering a wide spectral range, such as position, intensity, half-width, etc. [21]. Since the absorption line of gas molecules has a certain width, the absorption line of carbon dioxide in this model uses the Voigt profile, which is the convolution of the Lorentzian profile and Gaussian profile [22]. Using the HITRAN database, this paper constructs the spectral distribution of extinction coefficients based on various temperature and pressure combinations of Martian atmospheric components, as shown in Figure 4a. Further, the absorption transmittance can be calculated, as shown in Figure 4b. As can be seen from the figure, absorption is stronger at the central wavelength of 1591.476 nm compared to other nearby wavelengths.

Figure 4.
(a) The absorption coefficient spectrum under the combination of temperature and pressure corresponding to different tangent point altitudes from 5 km to 50 km around the 1591.476 nm absorption spectral line of carbon dioxide; (b) the corresponding absorption transmission spectrum.
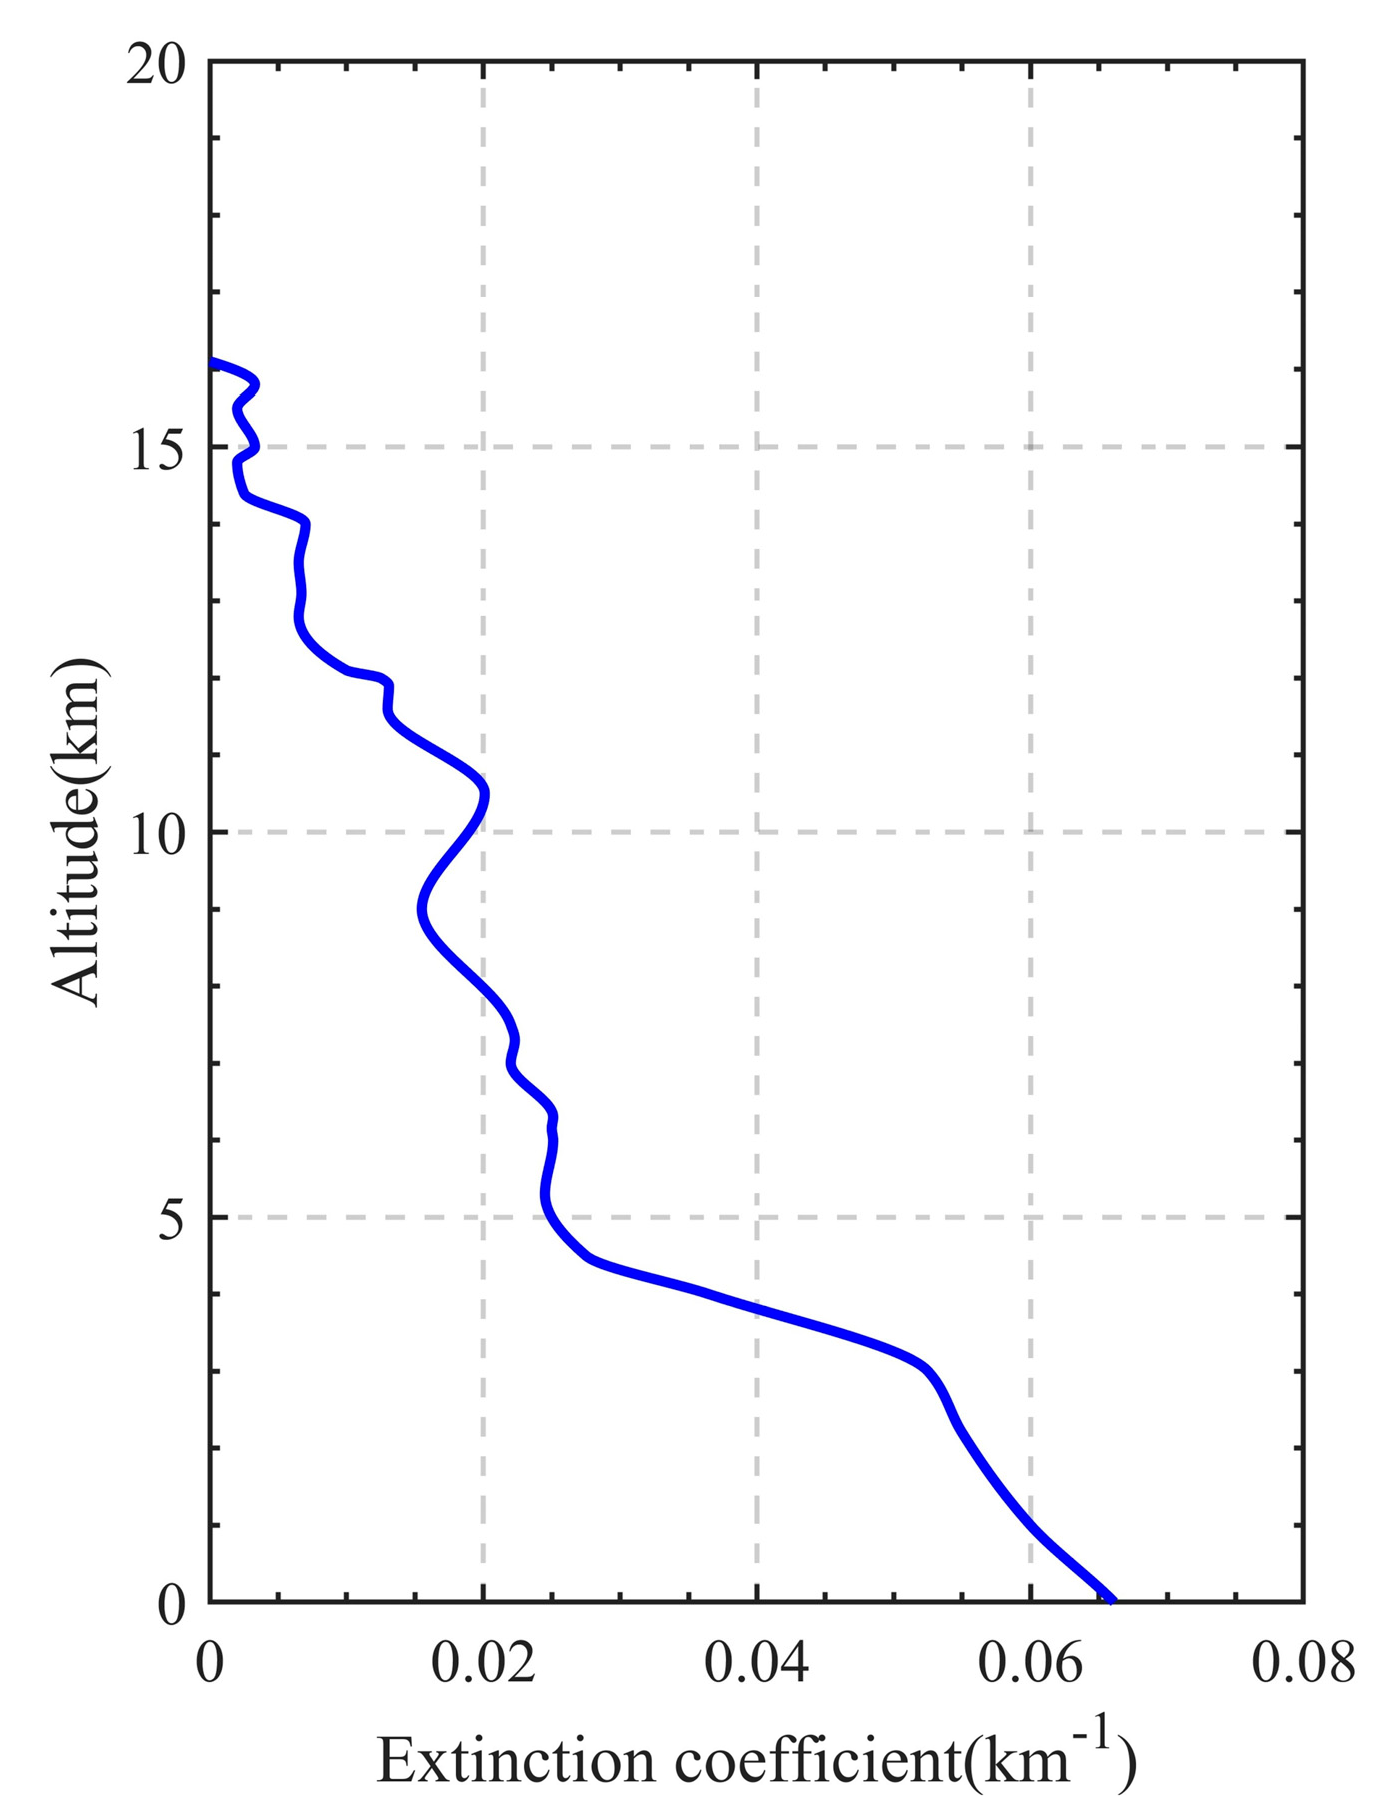
In addition to the absorption extinction of the Martian atmosphere, the impact of scattering extinction must also be considered. The Martian atmosphere contains not only atmospheric molecules but also a significant amount of dust, and the scattering by atmospheric molecules can be neglected because it is much weaker compared to that by dust [23]. Therefore, the scattering extinction by dust aerosols in the Martian atmosphere is the primary cause of signal attenuation. For typical occultation detection, the lower the detection altitude, the greater the attenuation caused by dust aerosol scattering in the Martian atmosphere. In this model, the dust aerosols extinction data of the Martian atmosphere are provided by the observation results of the LiDAR carried on the Phoenix Mars Lander launched by NASA in the North Pole region of Mars, as shown in Figure 5 [24]. This LiDAR operated at dual wavelengths of 532 nm and 1064 nm, with the extinction of dust aerosols primarily originating from 532 nm. In this study, the Martian atmospheric parameters are detected by analyzing the absorption spectrum of carbon dioxide, so laser wavelengths that cover the absorption characteristics of carbon dioxide are required. The 532 nm extinction data obtained by LiDAR on the Phoenix can be converted according to the Ångström relationship, which is as follows:
where is the extinction coefficient, with units of m−1, and Å is the Ångström constant. Referring to data from NASA’s Mars mission, the Ångström constant is assumed to be 0.3 in this model, and the extinction coefficient of Martian atmospheric dust aerosols at other wavelengths can be calculated by the above relationship. Since the main component of the Martian atmosphere is carbon dioxide, the proportion of other atmospheric molecules is relatively small, which has little impact on the results and is ignored in this model. Therefore, the above model can simulate the Martian atmosphere more realistically.
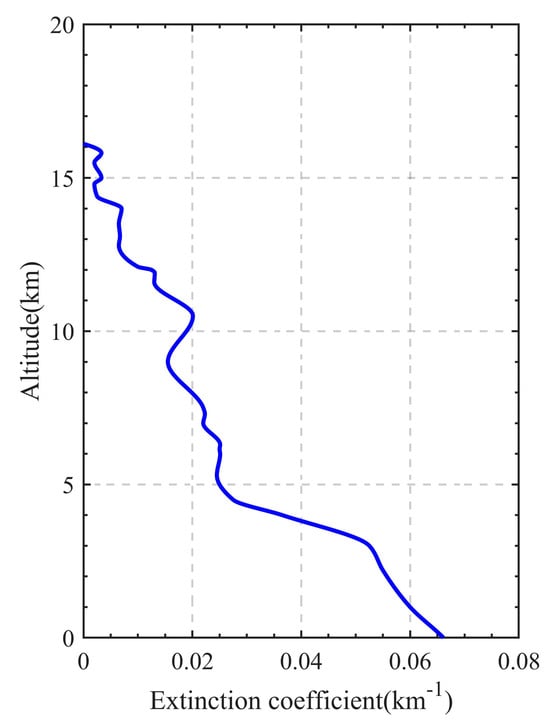
Figure 5.
The extinction coefficient profile of 532 nm Martian atmospheric dust aerosols obtained by Phoenix LiDAR.
3.2. Occultation Beam Trajectory Model
In the process of Mars occultation, the laser transmission path has an important impact on the final detection results, so it is necessary to first consider the setting of the orbital parameters of the two satellites. In the simulation, the orbital altitude of the satellite at the transmitting end is set to 100,00 km (high orbit), and the orbital altitude of the satellite at the receiving end is set to 280 km (low orbit). Meanwhile, the orbit of the satellite is approximated as a circular orbit, and Mars is approximately spherical. Secondly, when calculating the trajectory between the two satellites, it is also necessary to consider the bending effect of the Martian atmosphere on the laser. Due to the considerable distance between the high-orbit satellite and the low-orbit satellite, and the fact that the refractive index at the Martian surface is about two orders of magnitude lower than that of Earth. Thus, the bending of the laser caused by the Martian atmosphere during transmission is very slight. Taking this into account, this slight bending effect can be ignored when modeling and analyzing the trajectory of Mars occultation, and the laser transmission trajectory can be approximated as a straight line.
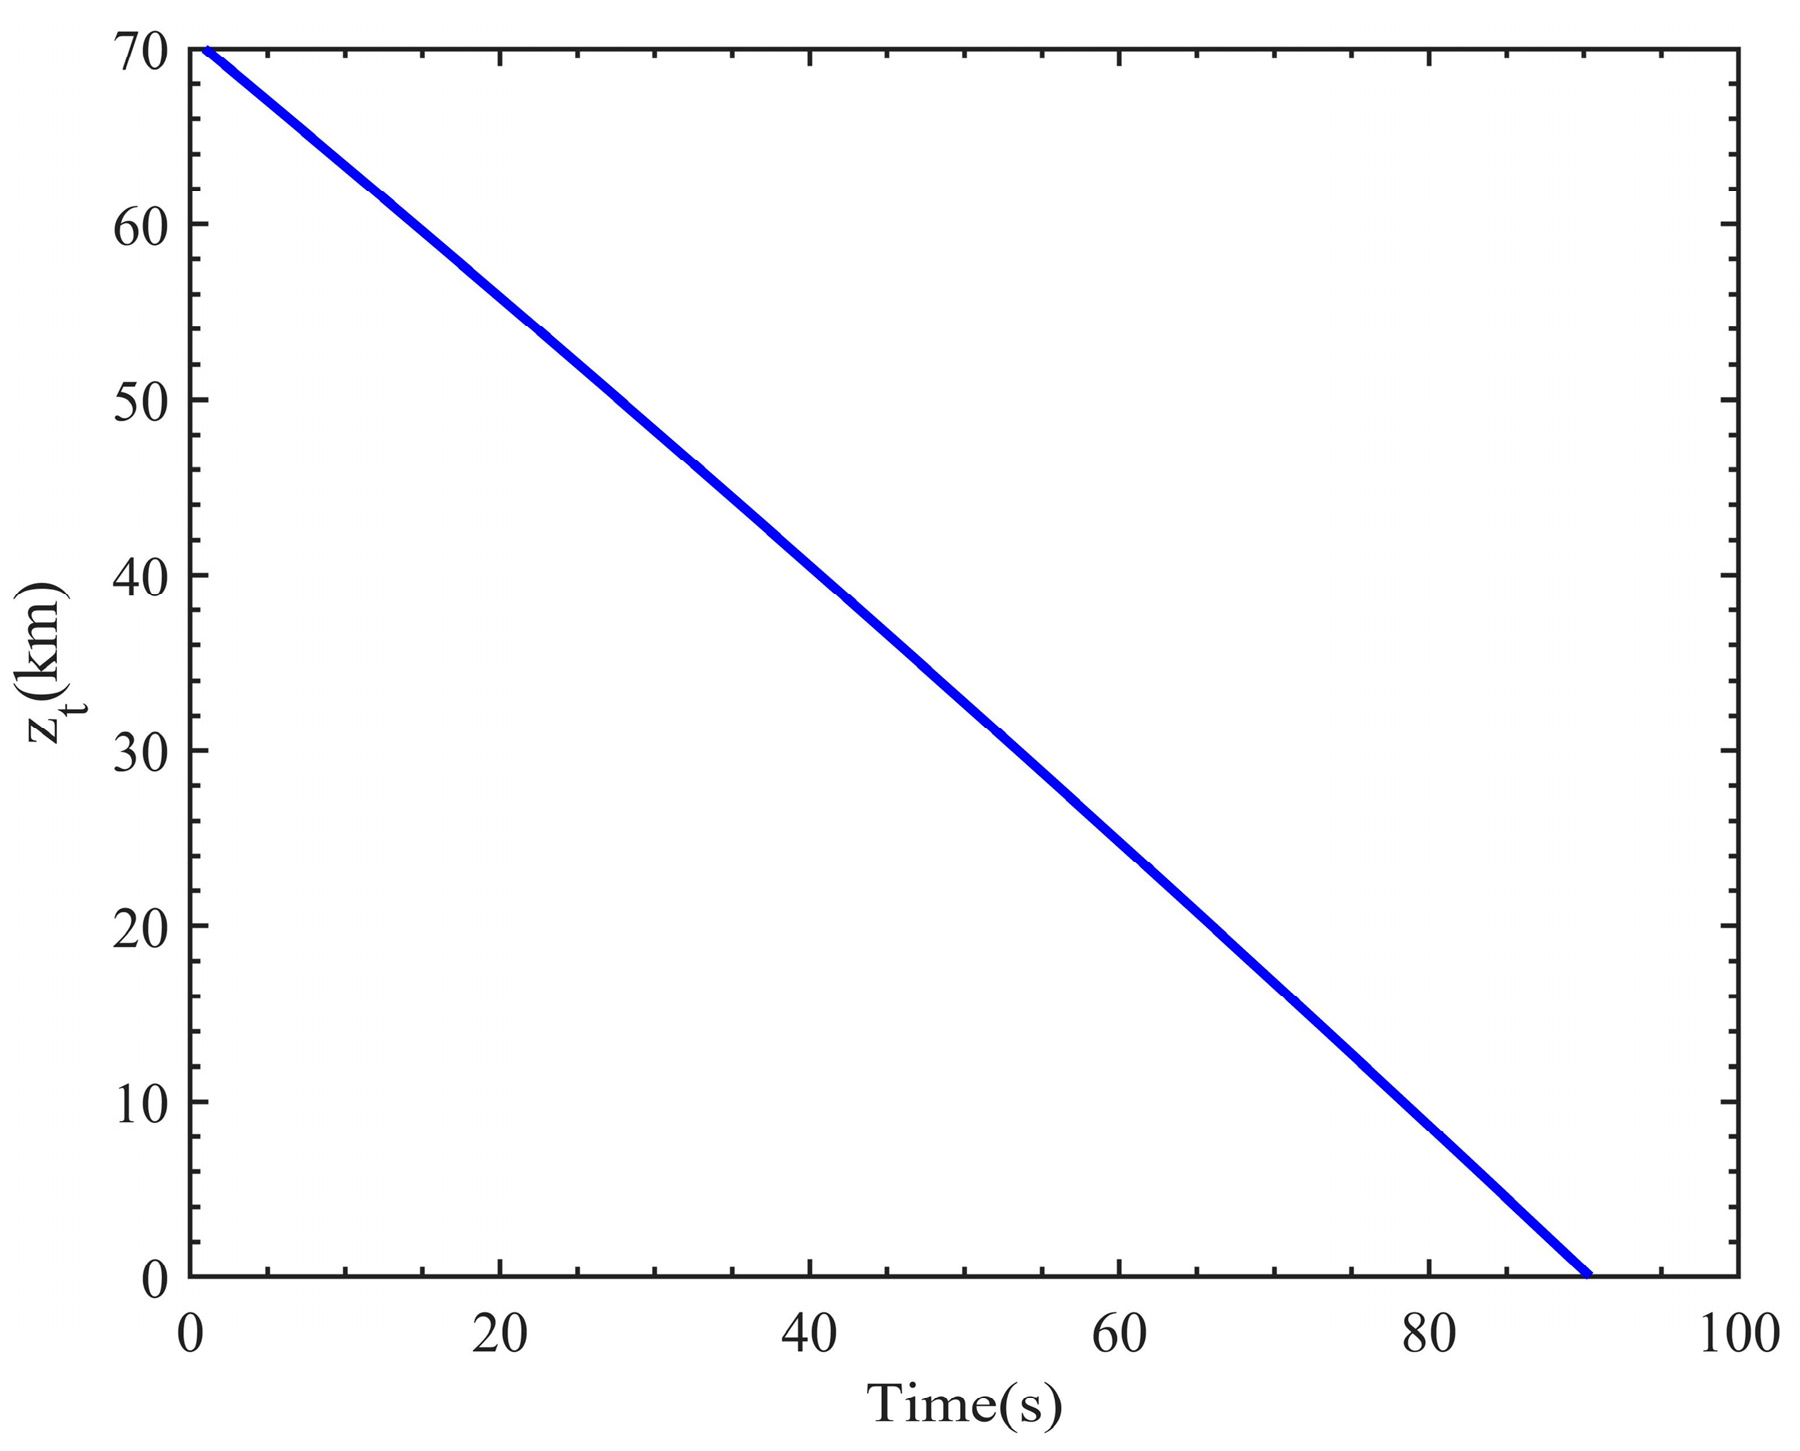
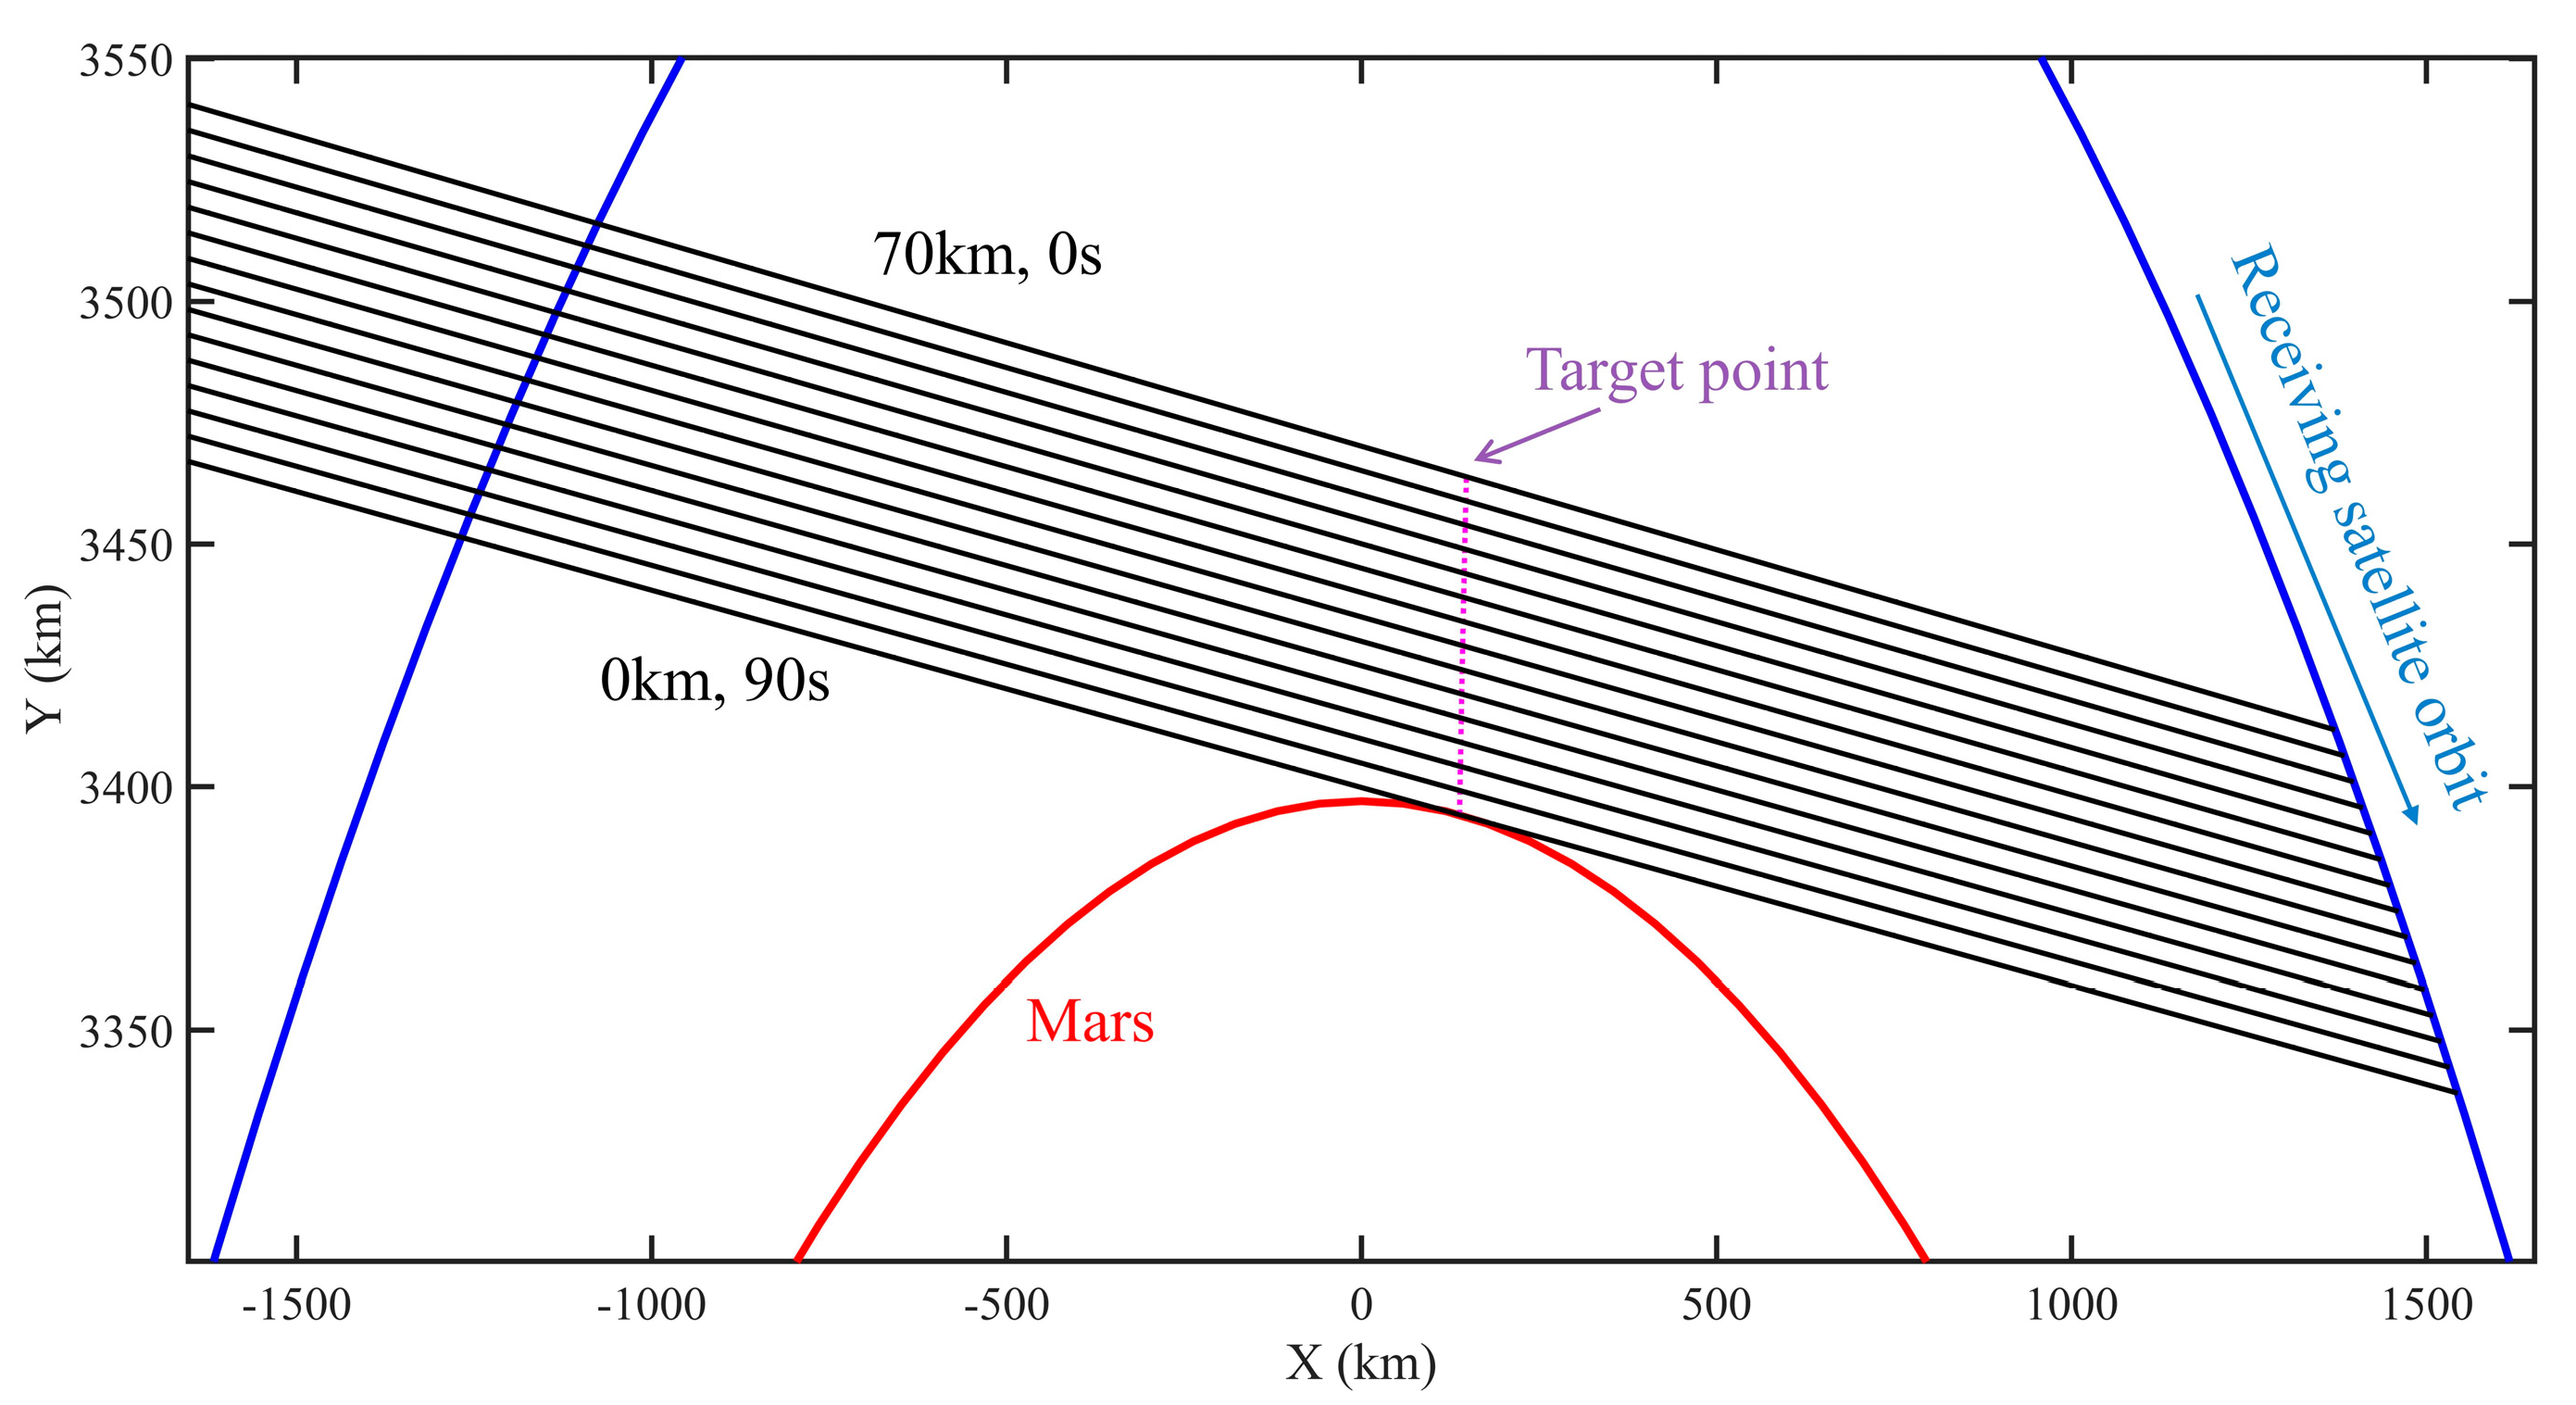
The orbital period formula of the satellite is , where is the gravitational constant of Mars, is the mass of Mars, and is the orbital radius. According to the orbital parameters, the initialized positions of the two satellites are given, and the positions at each moment are then calculated using the orbital period formula. Consequently, the laser trajectory transmission length between the two satellites and the closest distance from the trajectory to the Martian surface which is the tangent point altitude, are obtained. Based on the relative positions of the two satellites and Mars, it can be determined whether an occultation event occurred at a certain time. If an occultation event occurs, the tangent point altitude will be greater than the Martian radius. If the geometric position relationship is not satisfied, then the laser will enter Mars, meaning there is no tangent point altitude. Figure 6 shows the variation of tangent point altitude with time during a descending occultation event calculated by using the above orbital formula. Figure 7 shows the variation of the laser transmission trajectory between the two satellites, with an interval of 5 km. During the descending occultation event, the two satellites move in opposite directions around Mars from their initial positions, with the tangent point altitude decreasing from 70 km to 0 km. It takes approximately 90 s. With the two satellites constantly moving along their orbits, scanning measurements of laser occultation signals at different altitudes from top to bottom can be achieved, thereby obtaining the vertical distribution of multiple parameters in the Martian atmosphere.

Figure 6.
In the process of a descending occultation event, the variation of different tangent point altitudes corresponding to different trajectories with the movement time of two satellites.

Figure 7.
In the process of a descending occultation event, the variation of the laser transmission trajectory between the two satellites is shown. The trajectory decreases from a tangent point altitude of 70 km to 0 km, and the altitude interval of the adjacent trajectory is 5 km.
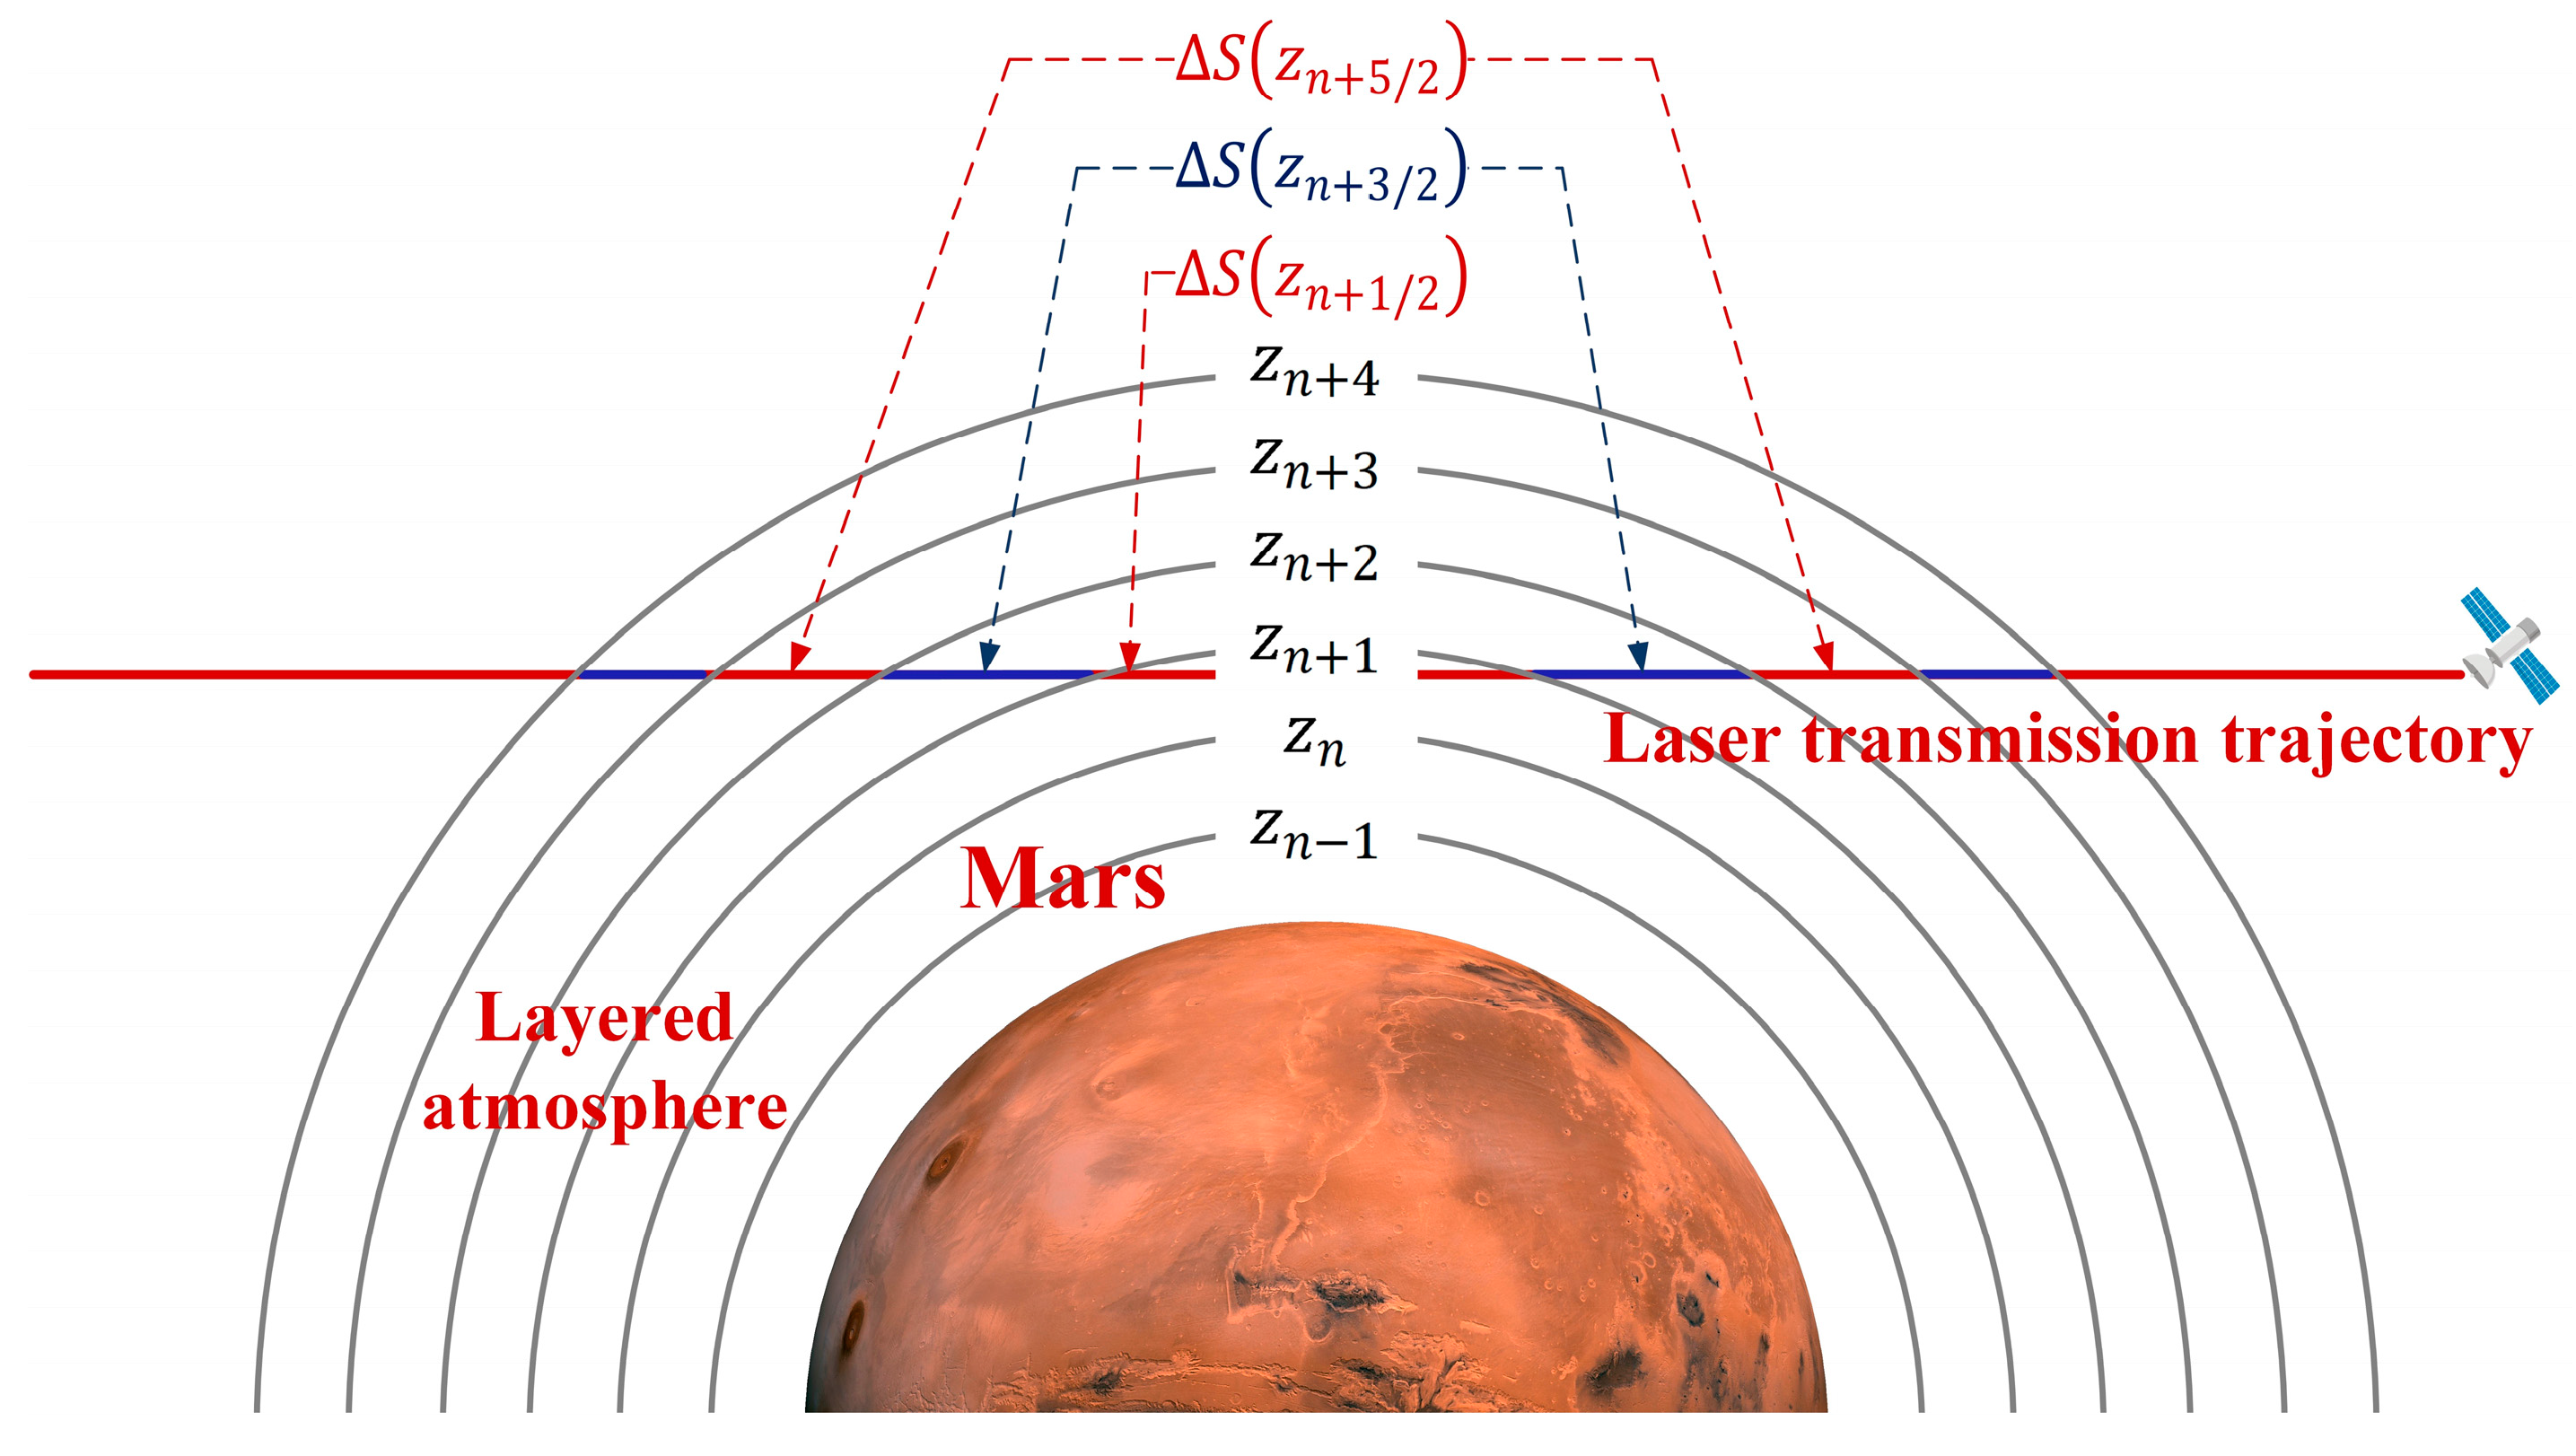
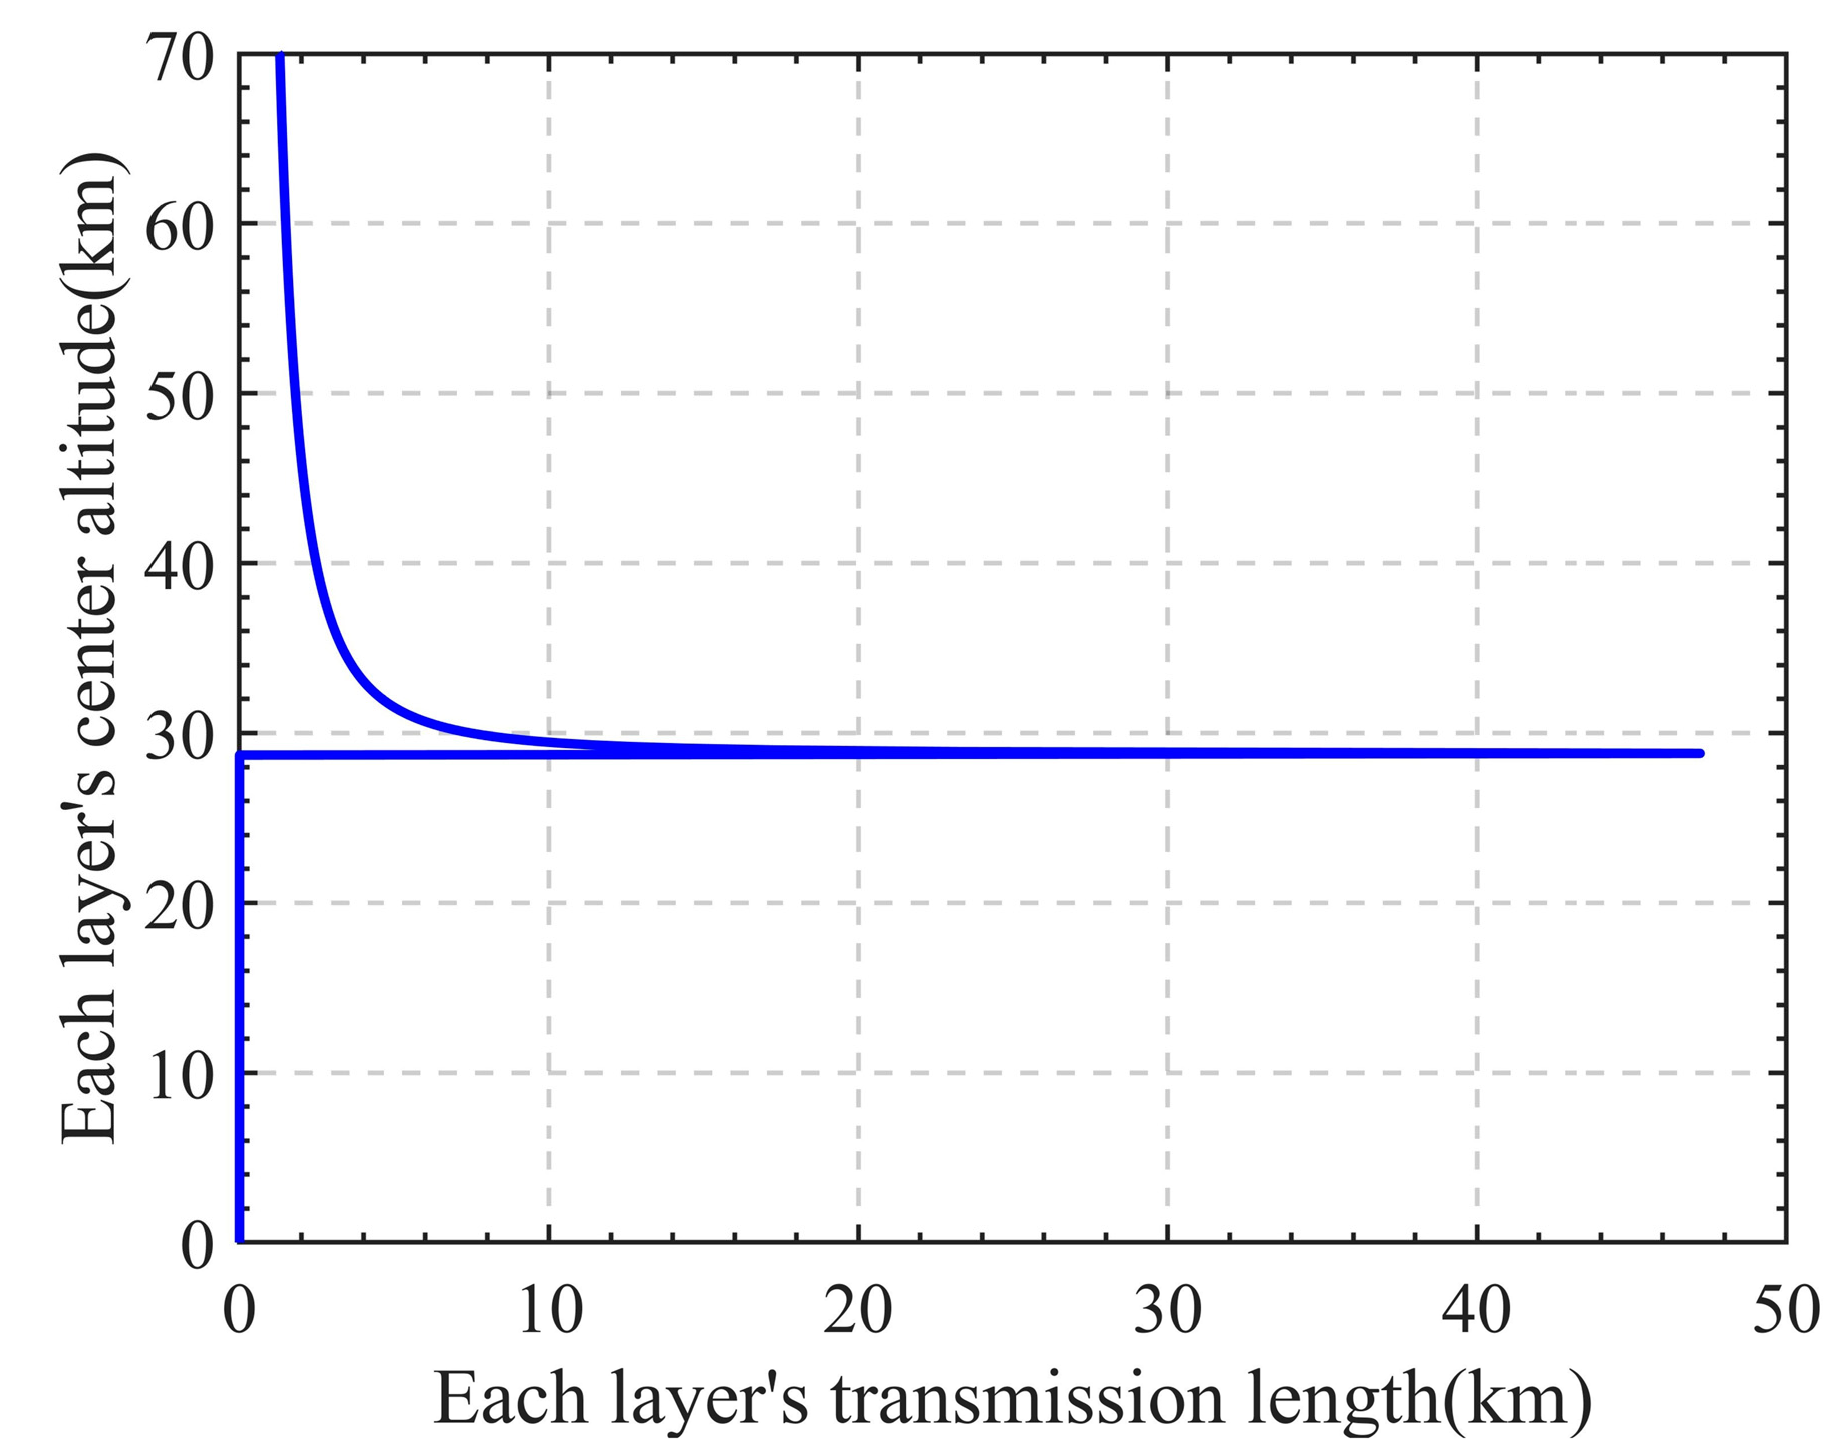
To more conveniently calculate the vertical distribution of atmospheric parameters, the Martian atmosphere is divided into several layers according to the vertical resolution of 100 m at equal altitude intervals, as shown in Figure 8. The altitude interval of each layer is represented by each layer’s center altitude . When the laser trajectory passes horizontally through the Martian atmosphere, it will pass through the Martian atmosphere at different altitudes due to the long path. The transmission length of the laser trajectory at each layer is represented by . Figure 9 shows the contribution results of the laser trajectory at each layer at a certain occultation time. It can be seen from the figure that the trajectory transmission length is maximum at the tangent point altitude, and the higher the altitude interval where the trajectory is located, the smaller the transmission length. This result is also used in the calculation of subsequent processes. However, when simulating the laser transmission path, since the atmospheric parameters vary slowly in the horizontal direction, it is reasonable to assume that the temperature and pressure remain homogeneous in this direction [25]. Therefore, the atmospheric conditions at the tangent point of a certain layer can be regarded as the average conditions over a few tens of kilometers of that layer.

Figure 8.
The Martian atmosphere is divided into several layers at equal altitude intervals for the subsequent calculation of the absorption optical thickness, and the length of the laser transmission trajectory at each layer is represented by ΔS.

Figure 9.
The transmission length of laser trajectory in different stratified altitude intervals at a certain occultation time.
The model designed in this study only needs to input the orbital parameters of two satellites. According to the geometric position relationship between the two satellites and Mars, it can judge whether an occultation event occurs. When an occultation event ends, the model can output the satellite positions at each moment and provide detailed information for each trajectory, including the tangent point altitude and the transmission length through each atmospheric layer.
3.3. The Signal Radiation Intensity Calculation Model
During the laser occultation process, the beam experiences attenuation due to absorption and scattering as it propagates through the Martian atmosphere. The signal intensity received at the receiving end after this attenuation is given by the following formula:
where is the laser pulse energy at the transmissing end, and is the laser transmission frequency. The second term on the right side denotes the link loss in a vacuum, where and are the efficiencies of the transmission and reception systems, respectively, is the area of the receiving telescope, is the divergence angle of the laser, and is the optical path between the two satellites. In the process of the occultation event, the satellite at the receiving end will receive laser occultation signals at different altitudes due to the continuous motion of the two satellites. At the same time, a series of time-varying trajectories will be generated, and each trajectory is represented by a different tangent point altitude . The last two terms are the absorption transmittance and scattering transmittance of atmospheric molecules and aerosols, where is the optical thickness. It is the integral of the extinction coefficient along the atmospheric transmission path, including the absorption extinction optical thickness and the scattering extinction optical thickness . The calculation formula is as follows:
The absorption extinction coefficient can be calculated using the HITRAN database under certain temperature and pressure conditions. Due to the extremely small variation range of laser scanning frequency, the frequency difference of the scattering extinction optical thickness is negligible. Then, this term only affects the intensity of the laser signal and does not show any differences with the absorption spectrum of carbon dioxide. In contrast, only the absorption extinction optical thickness of carbon dioxide molecules shows a frequency correlation with the laser scanning frequency. According to Equations (2) and (3), the absorption extinction coefficient at that time can be obtained by measuring the signals at different occultation times, and the atmospheric temperature and pressure can be further retrieved.
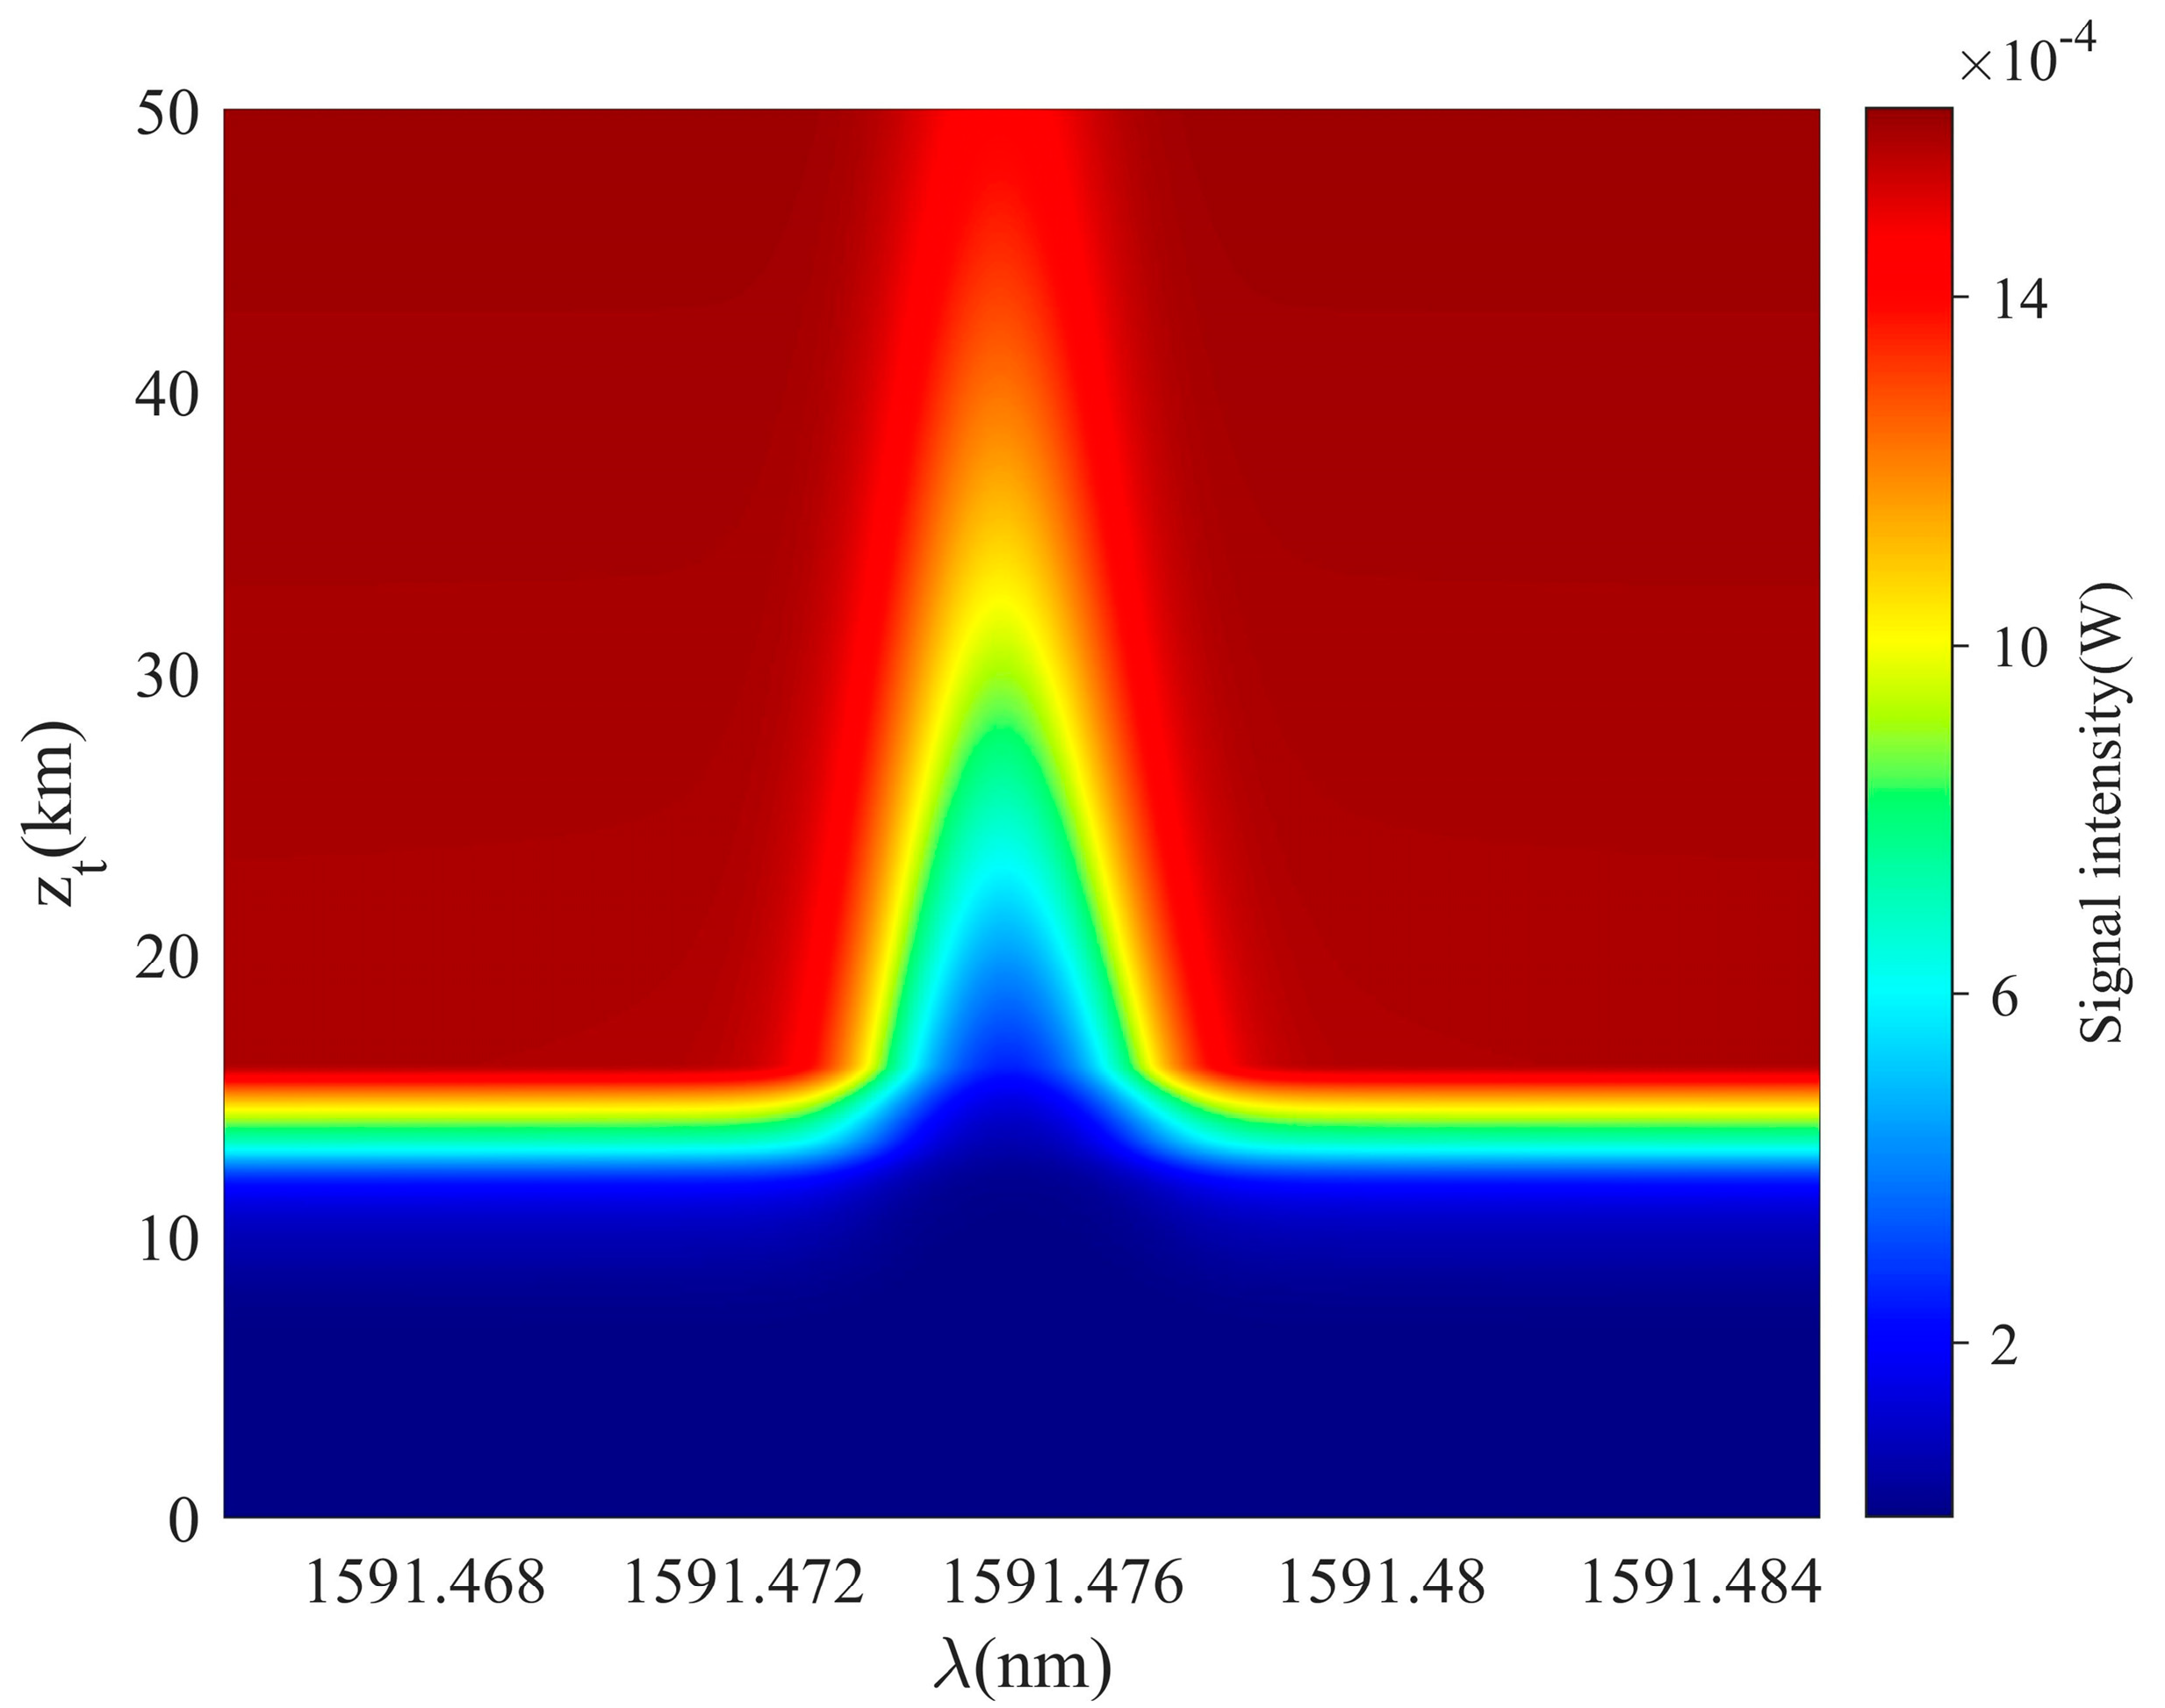
To ensure the measurement of laser occultation signal with high vertical resolution, high precision, and high SNR, it is necessary to design the parameters of the satellite load system according to the existing technical level. For the laser, an EDFA fiber laser is chosen, which is technologically mature and relatively easy to achieve. Its operating wavelength range is between 1500 nm and 1600 nm to better match the absorption spectrum of carbon dioxide. Moreover, its laser beam is highly focused, can maintain a narrow beam for the long-distance case, and can output a high-power, high-quality pulsed laser. The laser transmission power is designed to be 1 kW, and the laser divergence angle is designed to be 10 μrad. The reference of the detector is A-CUBE series avalanche diode parameters by Laser Components Company, which is conducive to improving data quality and expanding the detection range. Thus, the detection of weak signals with high sensitivity and high SNR can be achieved. The overall design parameter process refers to our previous research work [26], and the specific parameters of the system are shown in Table 1 below. Using the parameters in the table and the simulation model previously, the spectral lines of laser occultation signals at different tangent point altitudes can be calculated, as shown in Figure 10. As can be seen from the figure, the signal intensity decreases as the tangent point altitude decreases, which is the result of the stronger absorption and scattering effects of atmospheric components at lower altitudes.

Table 1.
Satellite payload parameters.

Figure 10.
The variation in laser occultation signals with different tangent point altitudes and wavelengths in the process of a descending occultation event.
4. Analysis of the Inversion Method and Simulation Results
Due to the long distance between the two satellites, the laser beam will pass through the Martian atmosphere at different altitudes. The atmospheric parameters of these different layers will vary with different altitudes, so it is essential to measure these atmospheric parameters. In this chapter, the simulated laser occultation signals and the trajectory transmission lengths at each layer are used as inputs, and the absorption extinction coefficient profiles are calculated according to the signal spectral lines of different tangent point altitudes. Subsequently, the temperature and pressure profiles of the Martian atmosphere are retrieved by the spectral fitting method, and the inversion results are analyzed. In the error analysis, the temperature and pressure data from the Mars atmosphere model provided by NASA are used as the truth values. Absolute error is used to evaluate the accuracy of temperature Inversion; that is, the difference between the inversion value and the true value. For the inversion accuracy of pressure, the relative error is used to evaluate the difference between the inversion value and the true value divided by the true value.
4.1. The Inversion Method of Martian Atmospheric Temperature and Pressure Profiles Based on Carbon Dioxide Absorption Spectrum
In the actual occultation process, the satellite transmitter emits a series of pulses with equal frequency intervals, and the frequency of the pulse sequence covers a certain absorption spectral line of carbon dioxide. The satellite receiver receives the laser pulse signals after attenuation by the Martian atmosphere. Therefore, it is necessary to measure the energies at both the transmitting and receiving ends. Using the ratio of these two energies, correcting the square of the distance between the satellites, and then taking the logarithm, the following relationship can be obtained:
where is the system constant, including system efficiency, laser divergence angle, and receiving telescope area. Since the scattering extinction optical thickness is not sensitive to the laser frequency, it can be considered that this scattering term is constant; then, the above formula is rewritten as:
where . In the selected laser scanning frequency range, the energy absorption is strongest at the center frequency. While the energy absorption is weakest at the deviation from the center frequency on both sides of the frequency range, it can be considered that there is no energy absorption at this frequency, which is denoted as . Therefore, the laser occultation signal measured at this frequency yields:
Further transformation yields:
By combining Equations (5) and (7), the expression of the absorption optical thickness can be obtained:
The absorption optical thickness is the integral of the absorption extinction coefficient along the beam transmission path, as shown in Equation (3). In Section 3.3, the Martian atmosphere is divided into several layers with equal altitude intervals. Therefore, the absorption optical thickness formula corresponding to the tangent point altitude of each laser trajectory can be rewritten as:
where is the transmission length of the laser trajectory with the tangent point altitude in the altitude interval , which can be calculated by the occultation beam trajectory model. The tangent point altitude of each trajectory is interpolated to each layer’s center altitude and then the above formula is expanded into a matrix form:
The absorption extinction coefficient at each layer’s center altitude can be obtained by solving the matrix equation. However, the matrix requires the laser trajectory transmission length from the tangent point altitude to the top of the atmosphere. Considering that the carbon dioxide density of the Martian atmosphere decreases exponentially with altitude, then the absorption of the laser is also weakened. Therefore, the atmospheric absorption beyond a certain altitude is negligible. In this study, the upper limit of the tangent point altitude is set to 70 km. A lookup table is constructed based on the combination of temperature, pressure, and absorption extinction coefficient using the HITRAN database. Then, the results of the absorption extinction coefficient are fitted using the least squares method, which can retrieve the corresponding temperature and pressure for each absorption extinction coefficient to obtain the temperature and pressure profiles of the Martian atmosphere.
4.2. Inversion Results and Error Analysis
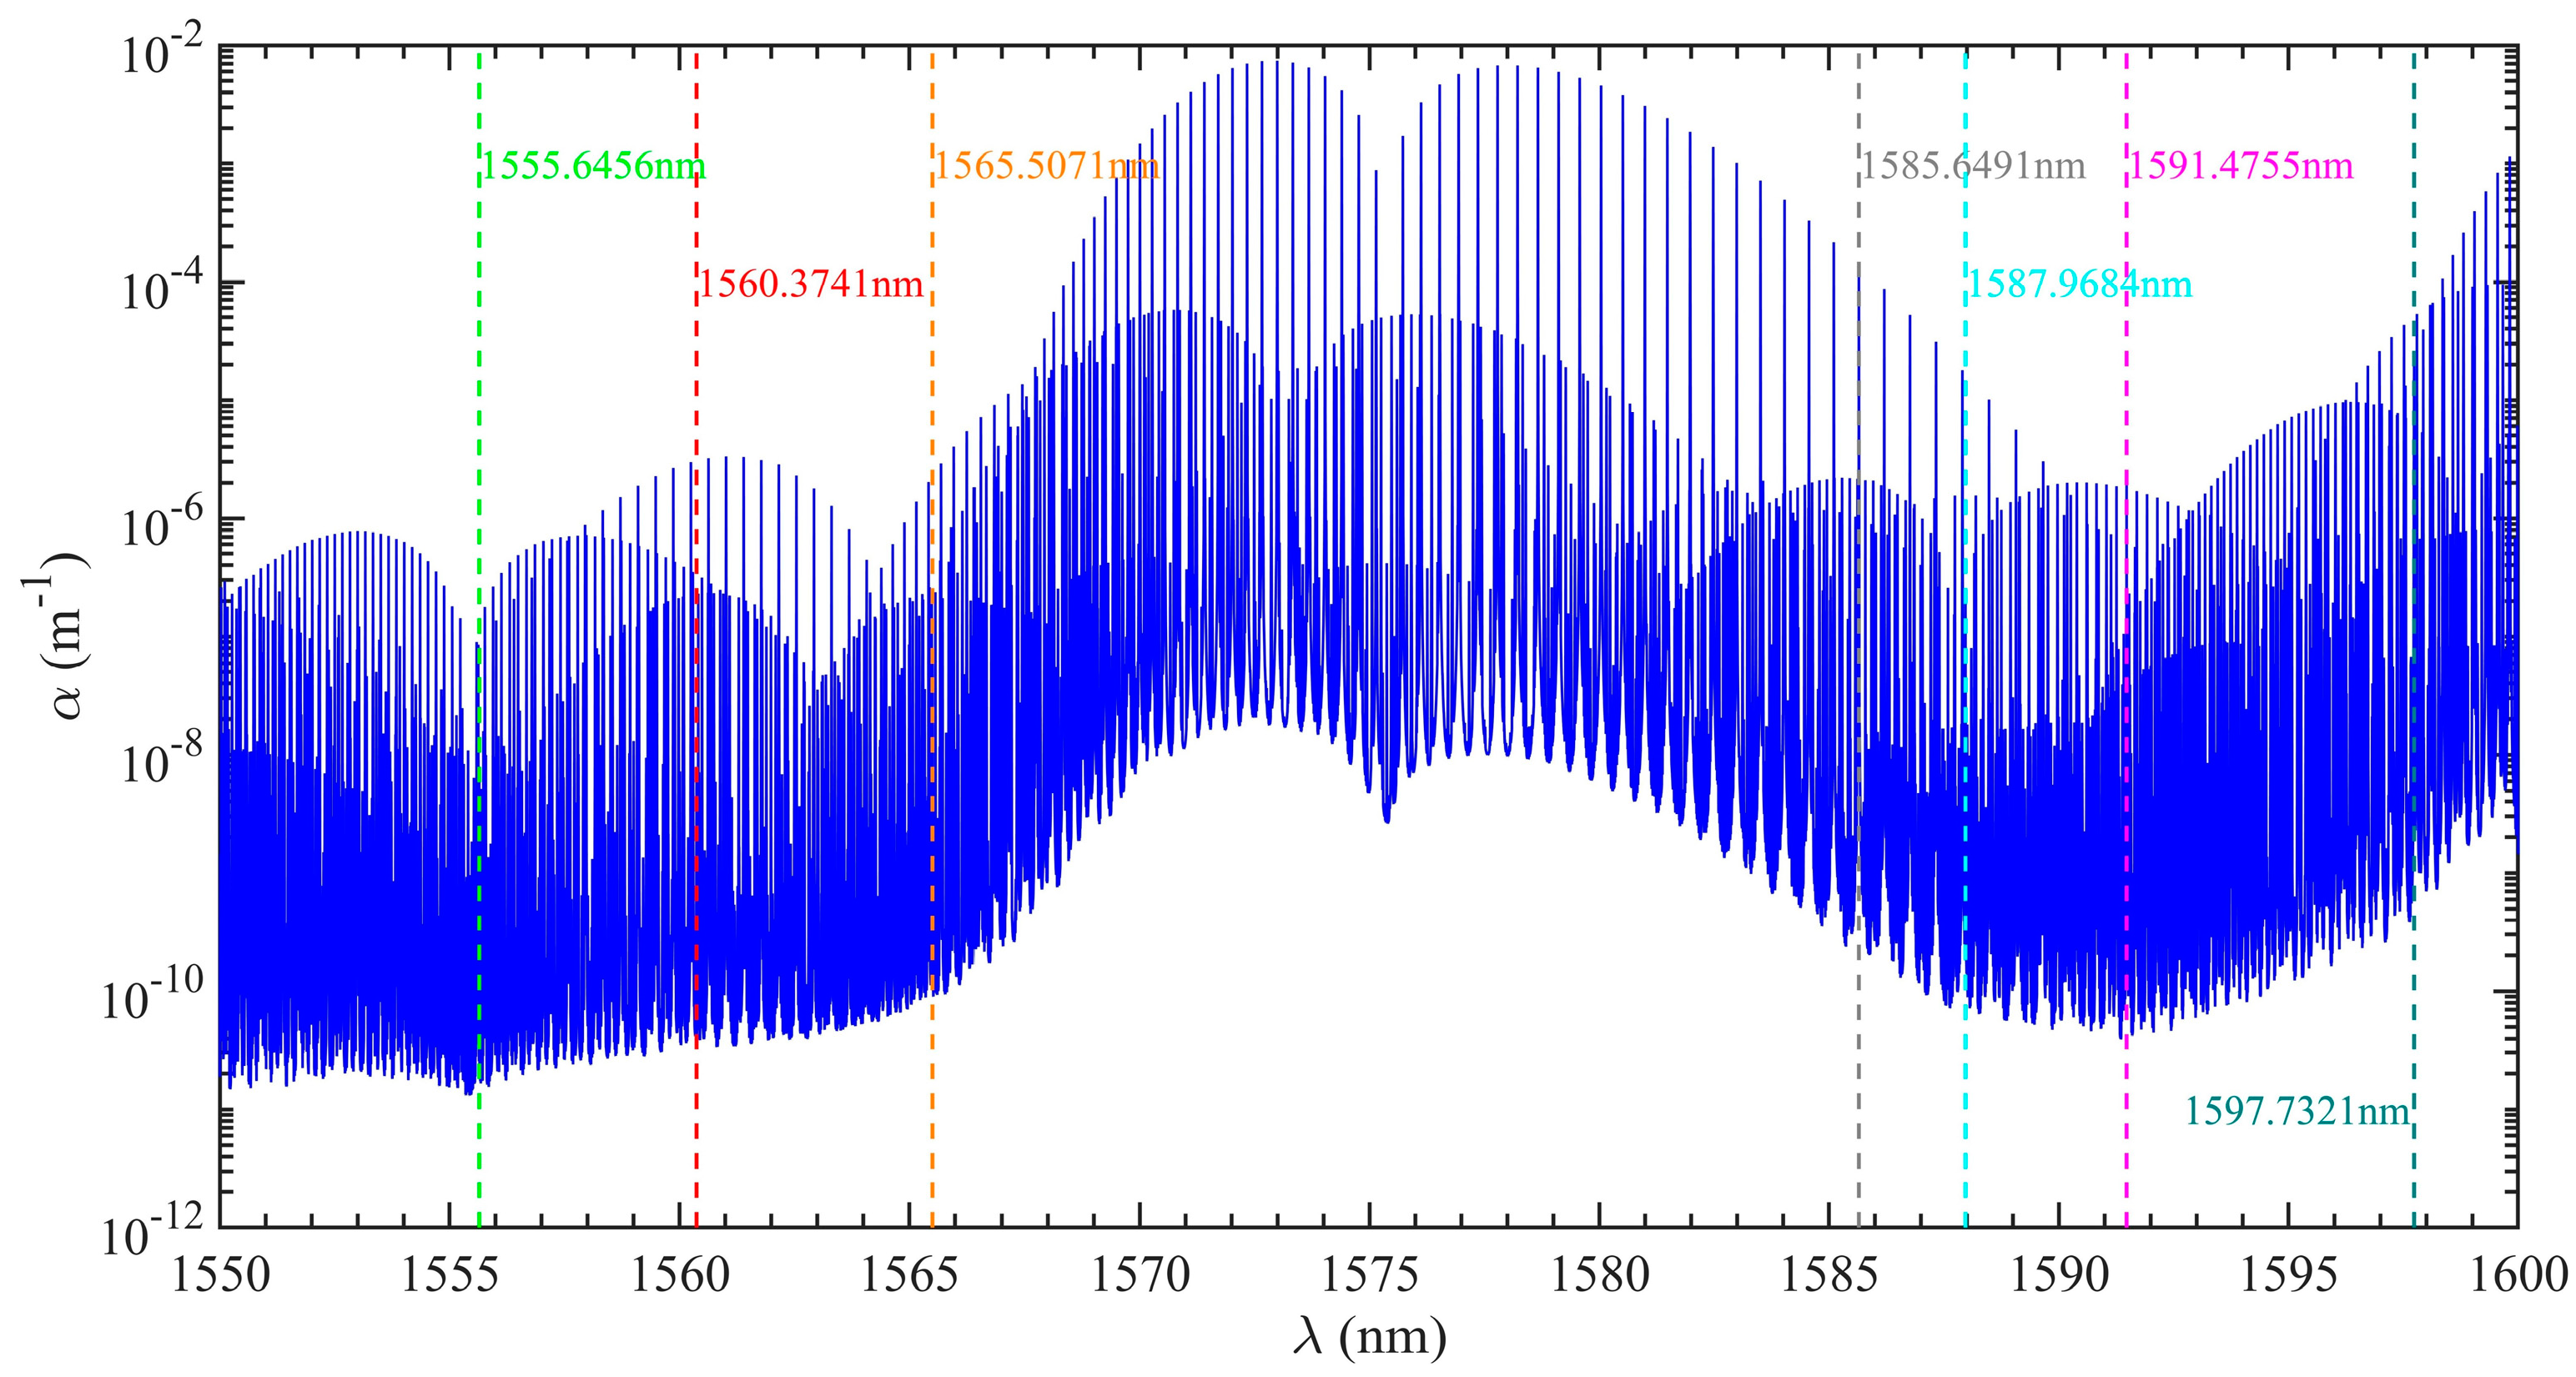
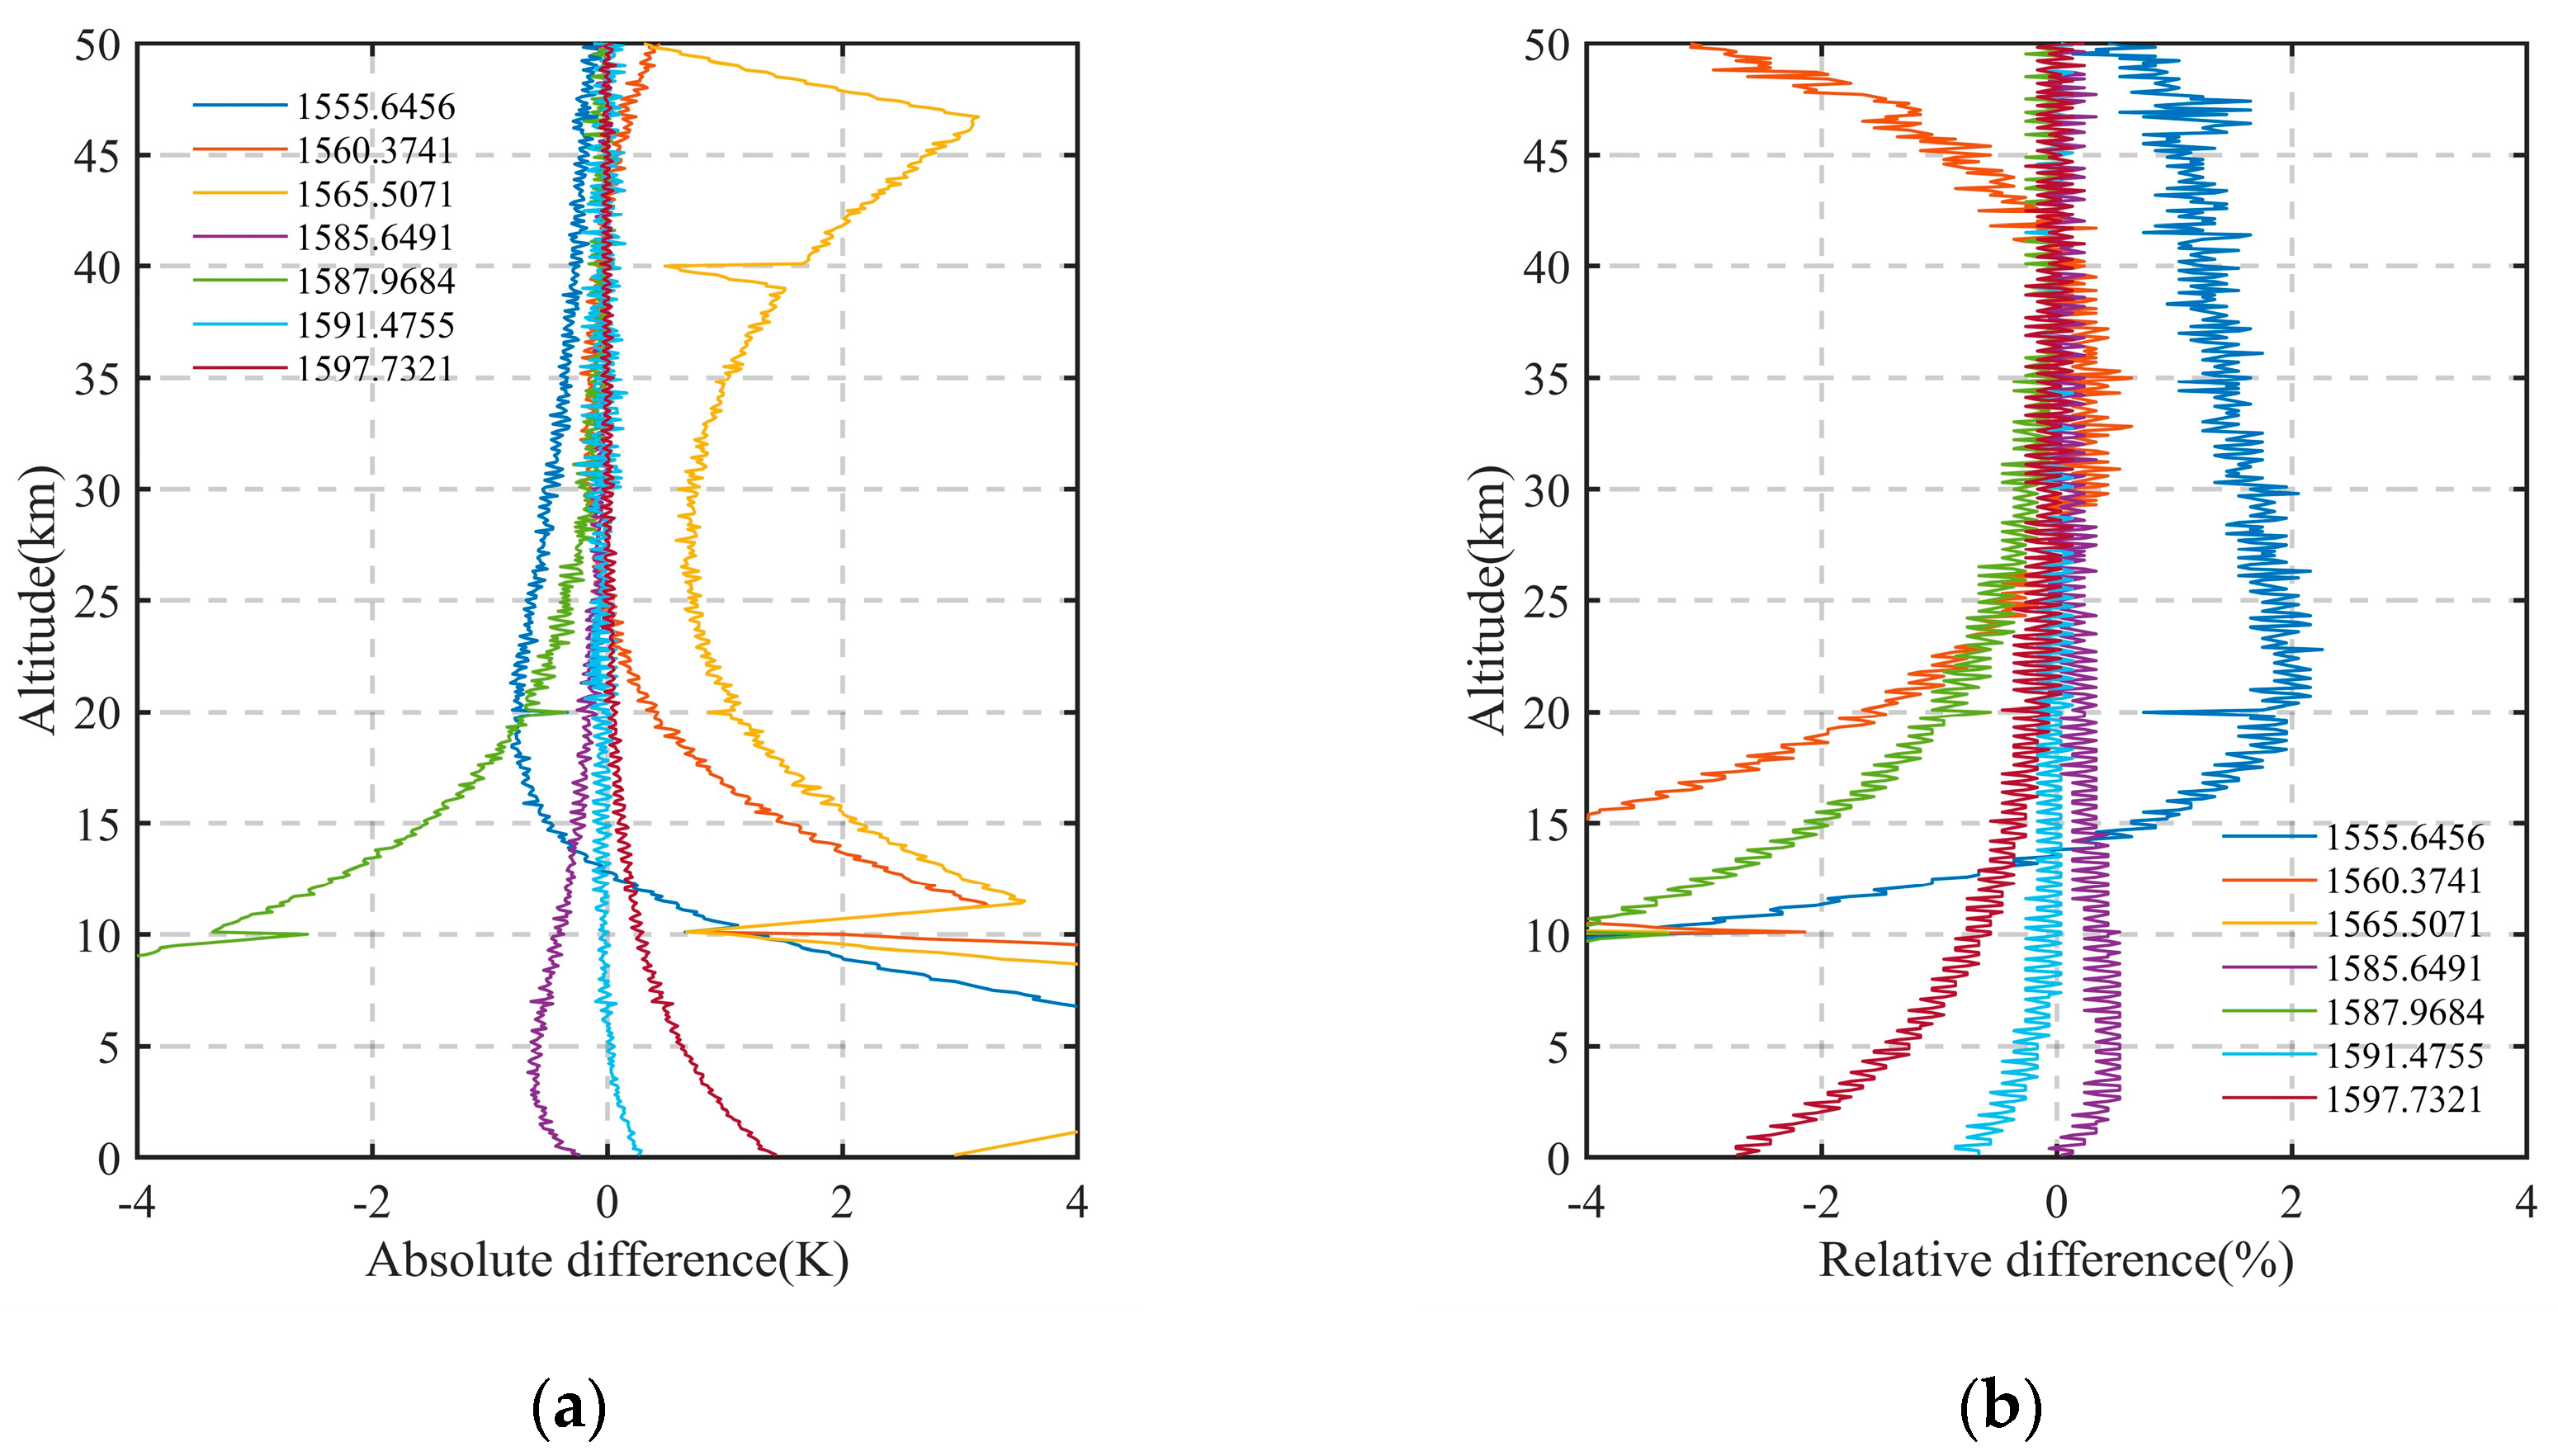
Firstly, seven wavelengths are selected in the carbon dioxide absorption spectrum range of 1550–1600 nm, as shown in Figure 11. Next, each wavelength is simulated and calculated, and the above inversion method is used for the simulation data without noise. Finally, the obtained temperature and pressure results are compared with the actual results, as shown in Figure 12. The results show that the inversion accuracy of temperature and pressure is the highest at the wavelength of 1591.4755 nm, and the range of ±0.01 nm centered on this wavelength can satisfy a complete spectral line. Therefore, this wavelength is selected as the optimal wavelength for a series of subsequent calculations.
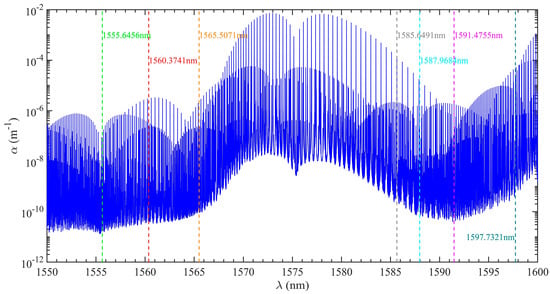
Figure 11.
Carbon dioxide absorption coefficient spectrum from 1550 nm to 1600 nm when the atmospheric temperature is 200 K and atmospheric pressure is 1 hPa.

Figure 12.
The inversion results in signals without noise at seven different wavelengths. (a) Absolute deviation of temperature; (b) relative deviation of pressure.
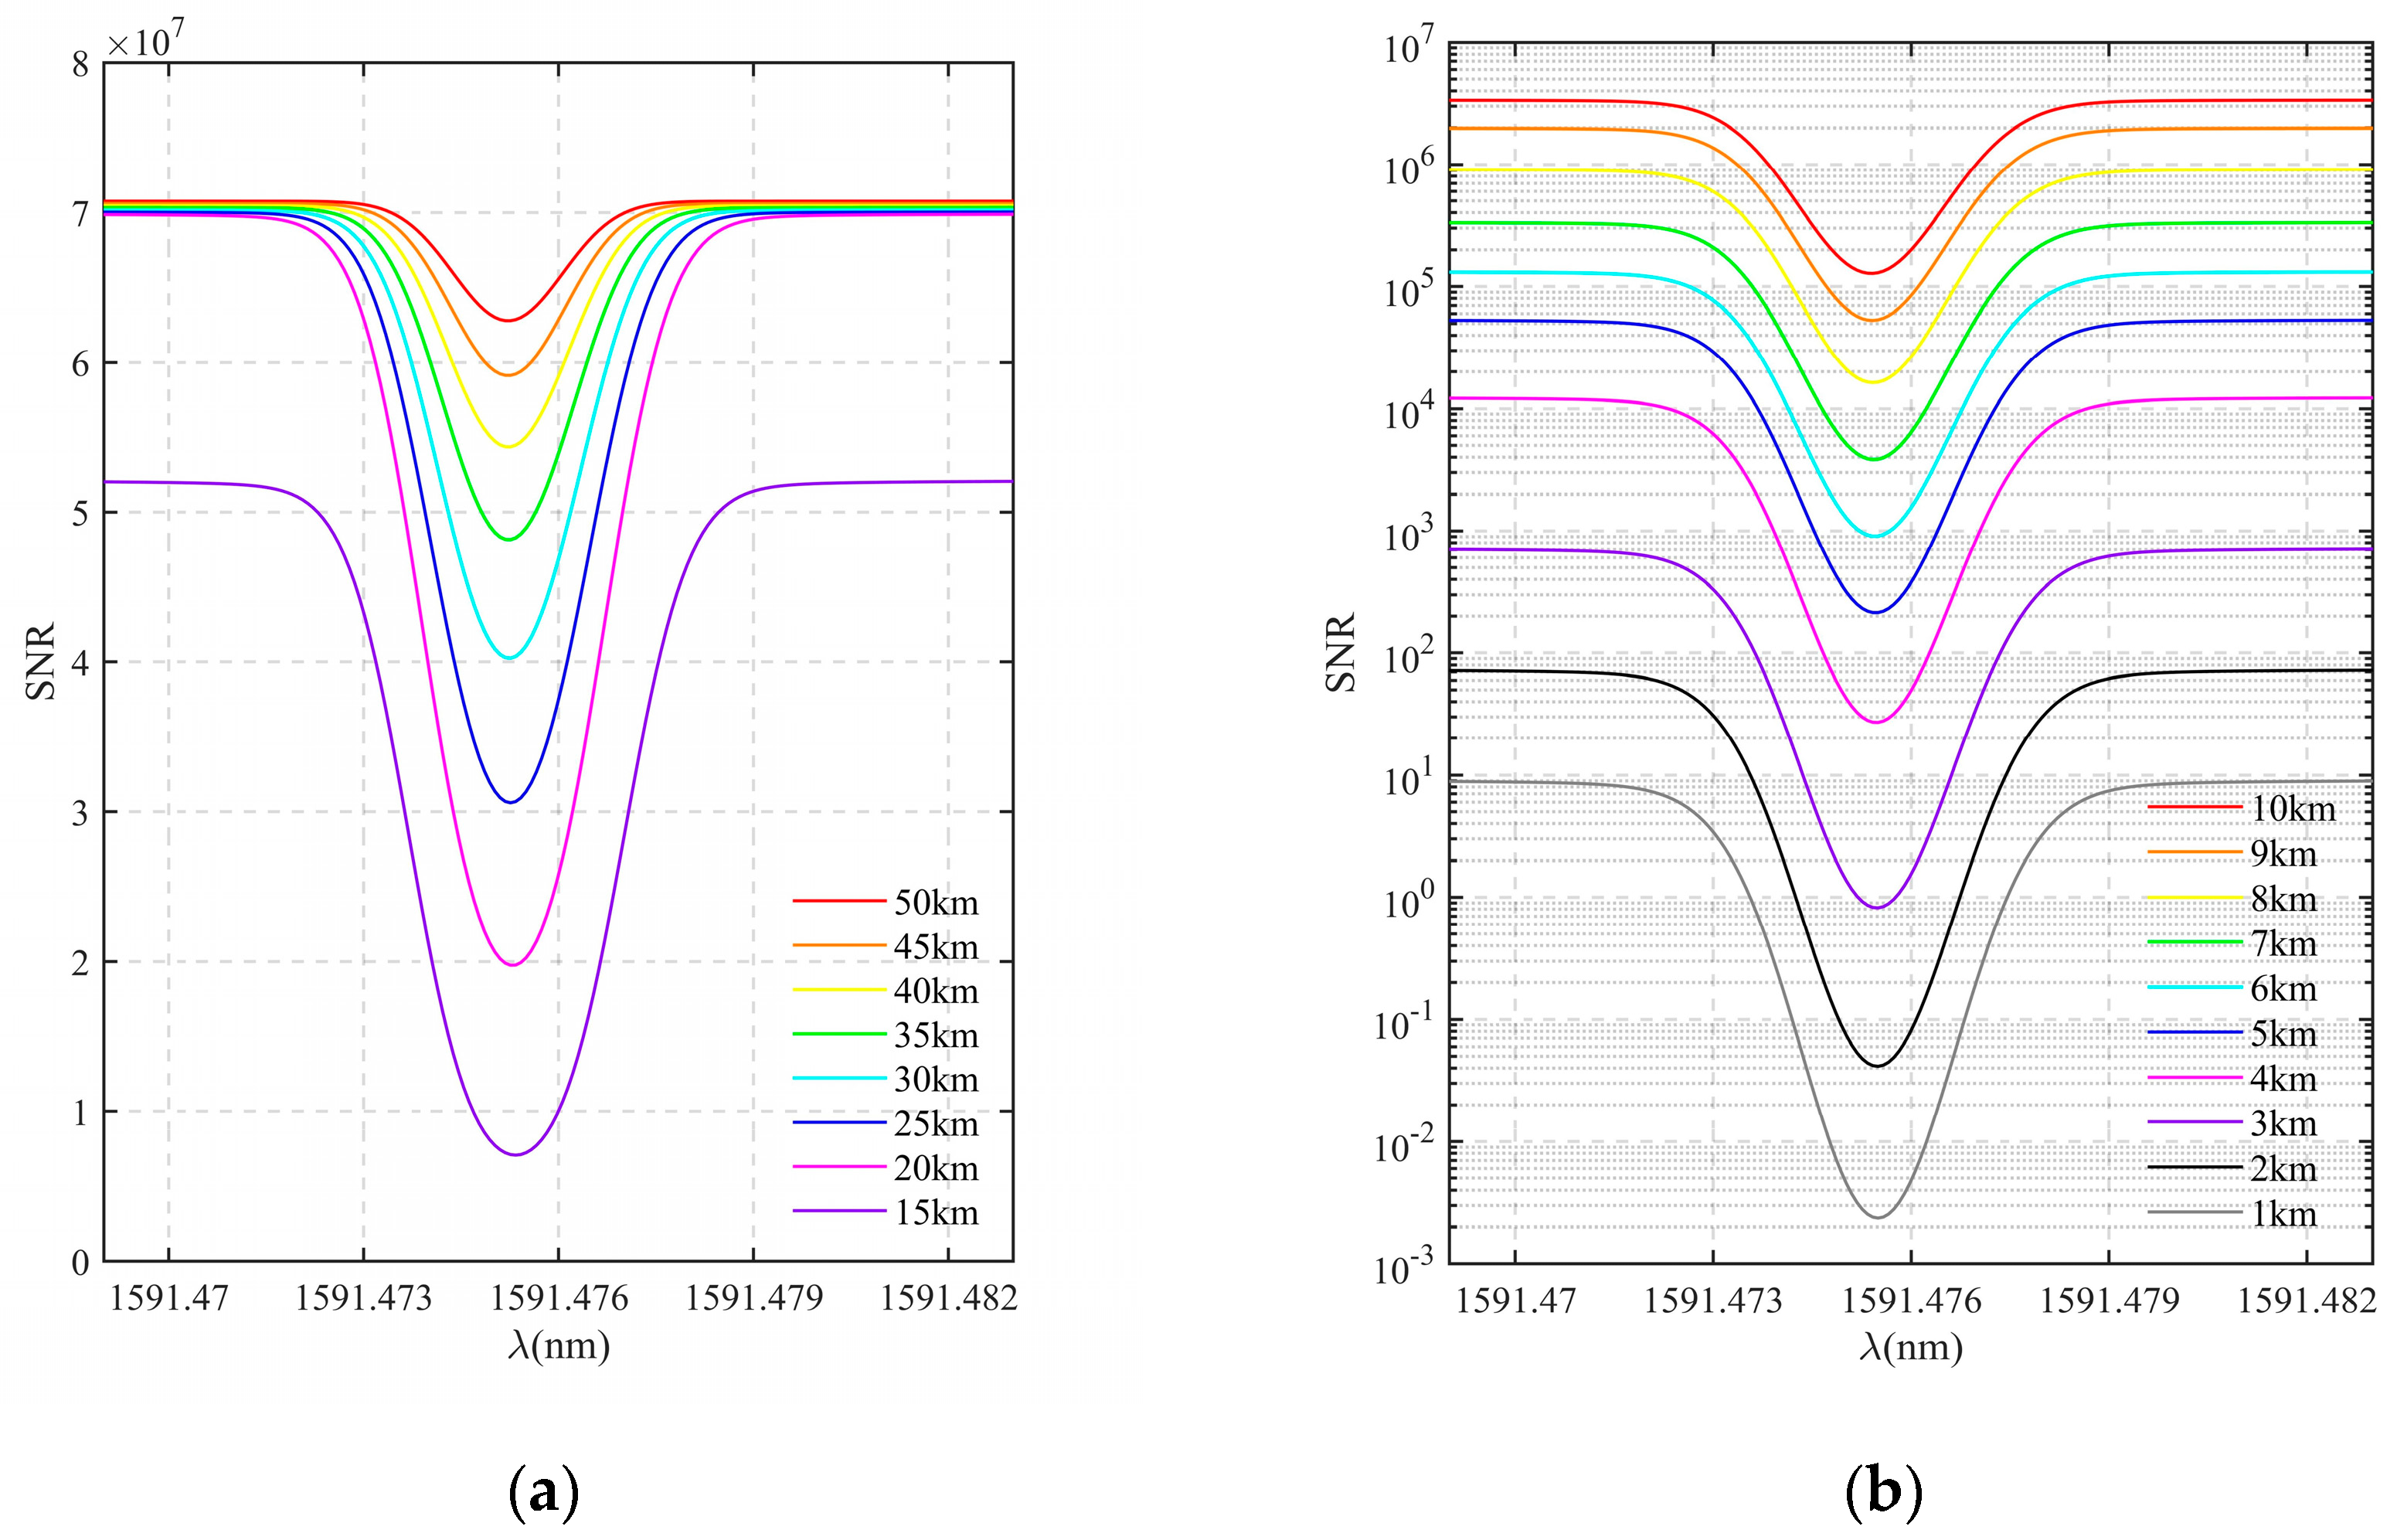
According to the actual situation, it is necessary to introduce the influence of noise. This study considers measuring at night, while background noises such as sunlight can be mostly eliminated with precisely matched filters and field stops. Therefore, the influence of background photon noise is negligible, and the main source of noise is the dark current noise of the detector, as shown in Table 1. The detector noise given in Table 1 is added to the occultation signal. Figure 13a shows the variations of detection SNR with wavelength at the altitude interval of 5 km in the altitude range of 15–50 km after introducing noise. Figure 13b shows the SNR results at the altitude interval of 1 km in the range of 1–10 km. The results show that the SNR does not change much in the altitude range of 20–50 km, and the signal integrity is less disturbed by noise. However, when the detection altitude drops below 15 km, the SNR begins to change significantly, and the influence of noise on the signal gradually increases. Specifically, at altitudes below 10 km, the SNR decreases by orders of magnitude, and the noise interferes with the signal more seriously.

Figure 13.
Detection SNR results at different tangent point altitudes after introducing noise. (a) Variations of SNR in the altitude range of 15–50 km (ΔH = 5 km); (b) variations of SNR in the altitude range of 1–10 km (ΔH = 1 km).
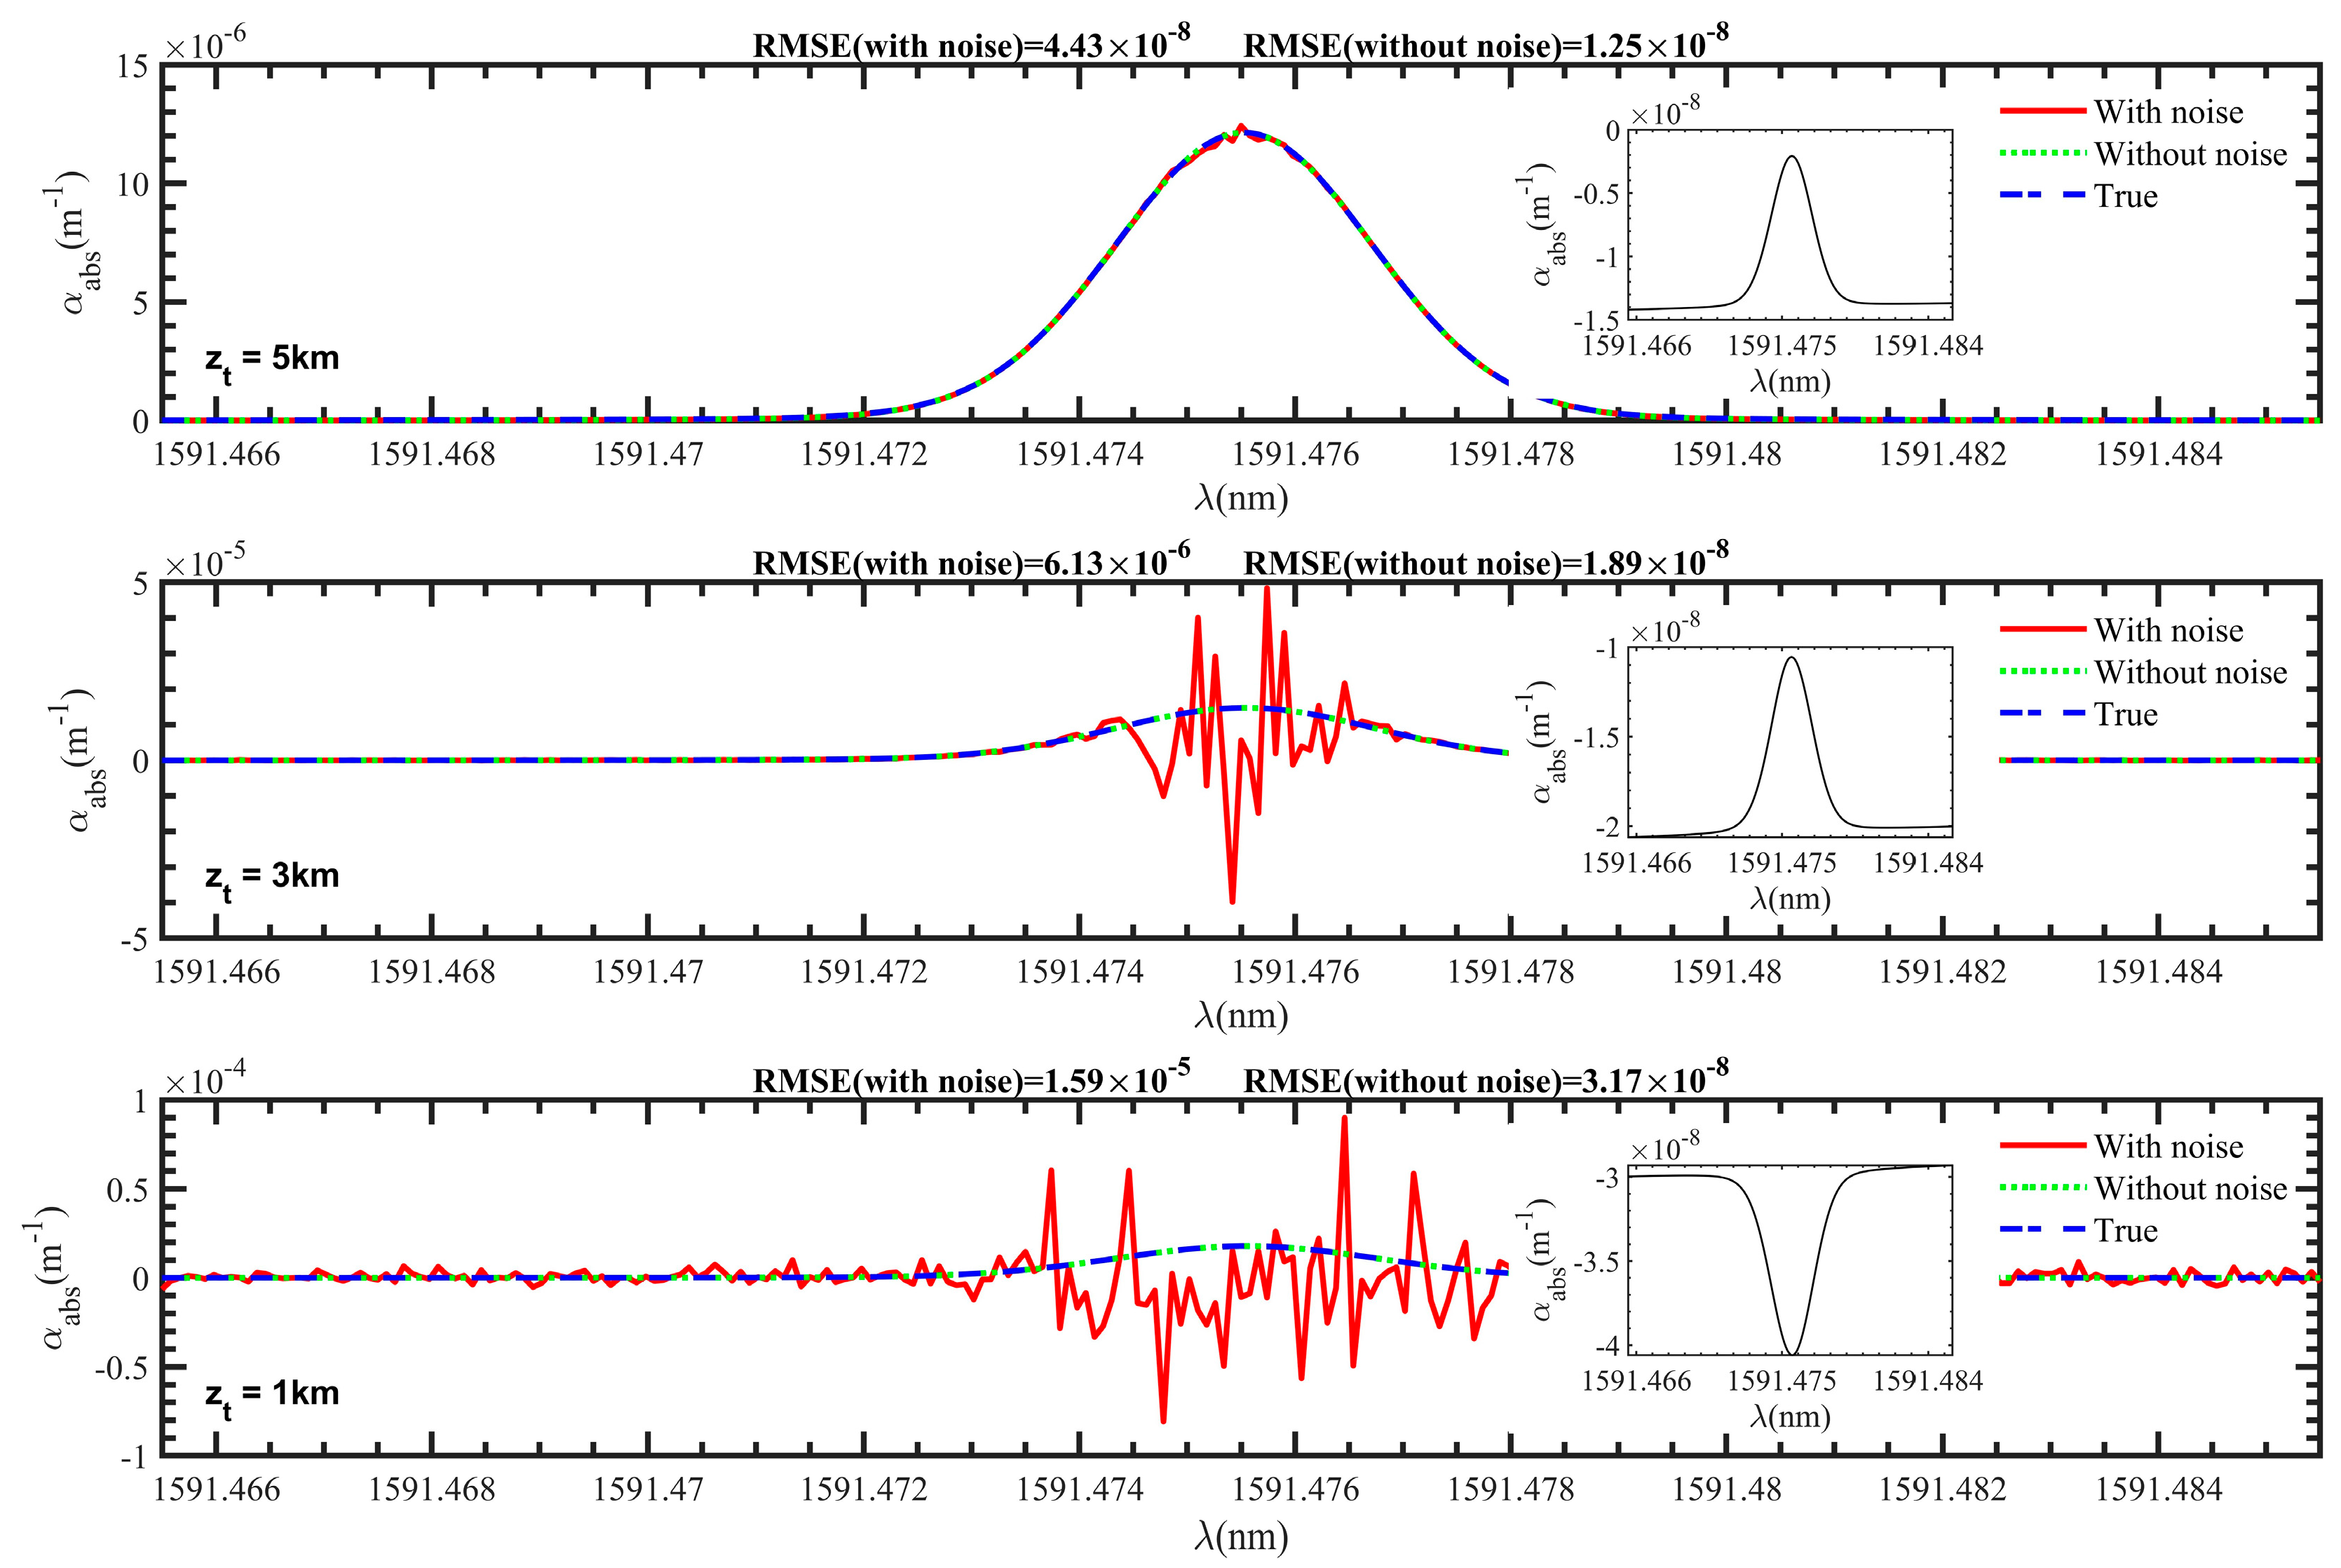
The absorption extinction coefficients at different tangent point altitudes can be calculated by using the occultation signals, and the results are shown in Figure 14. Since the detection SNR above 5 km is better, only the results of the signals with noise, the signals without noise, and the truth values of the model are compared within 5 km. The results show that the noise has a certain influence on the inversion results. It can be seen from the partial figure that the result of the signals without noise has a small deviation from the true values. The reason is that when calculating the absorption optical thickness using the signal intensity, the scattering optical thickness is taken as a constant term, which can lead to a certain approximation error. In addition, setting the upper limit altitude when calculating the absorption extinction coefficient can also lead to a certain numerical integration error. Therefore, the cumulative effect of errors in the calculation process results in the final deviation. Comparing the results of different tangent point altitudes, it can be seen that as the tangent point altitude increases, the inversion error decreases, and the inversion result at 5 km is in good agreement with the smallest root mean square error (RMSE). For the laser trajectory with the high tangent point altitude, noise has no obvious effect on the signal due to relatively weak atmospheric absorption. However, for the laser trajectory with the low tangent point altitude, the combined action of atmospheric molecules and dust aerosols leads to significant attenuation of the signal. Then, these factors will have a greater impact on the signal and ultimately affect the inversion results of temperature and pressure.

Figure 14.
The comparison of inversion results of absorption extinction coefficients at different tangent point altitudes after introducing noise, including the results with noise, without noise, and true value.
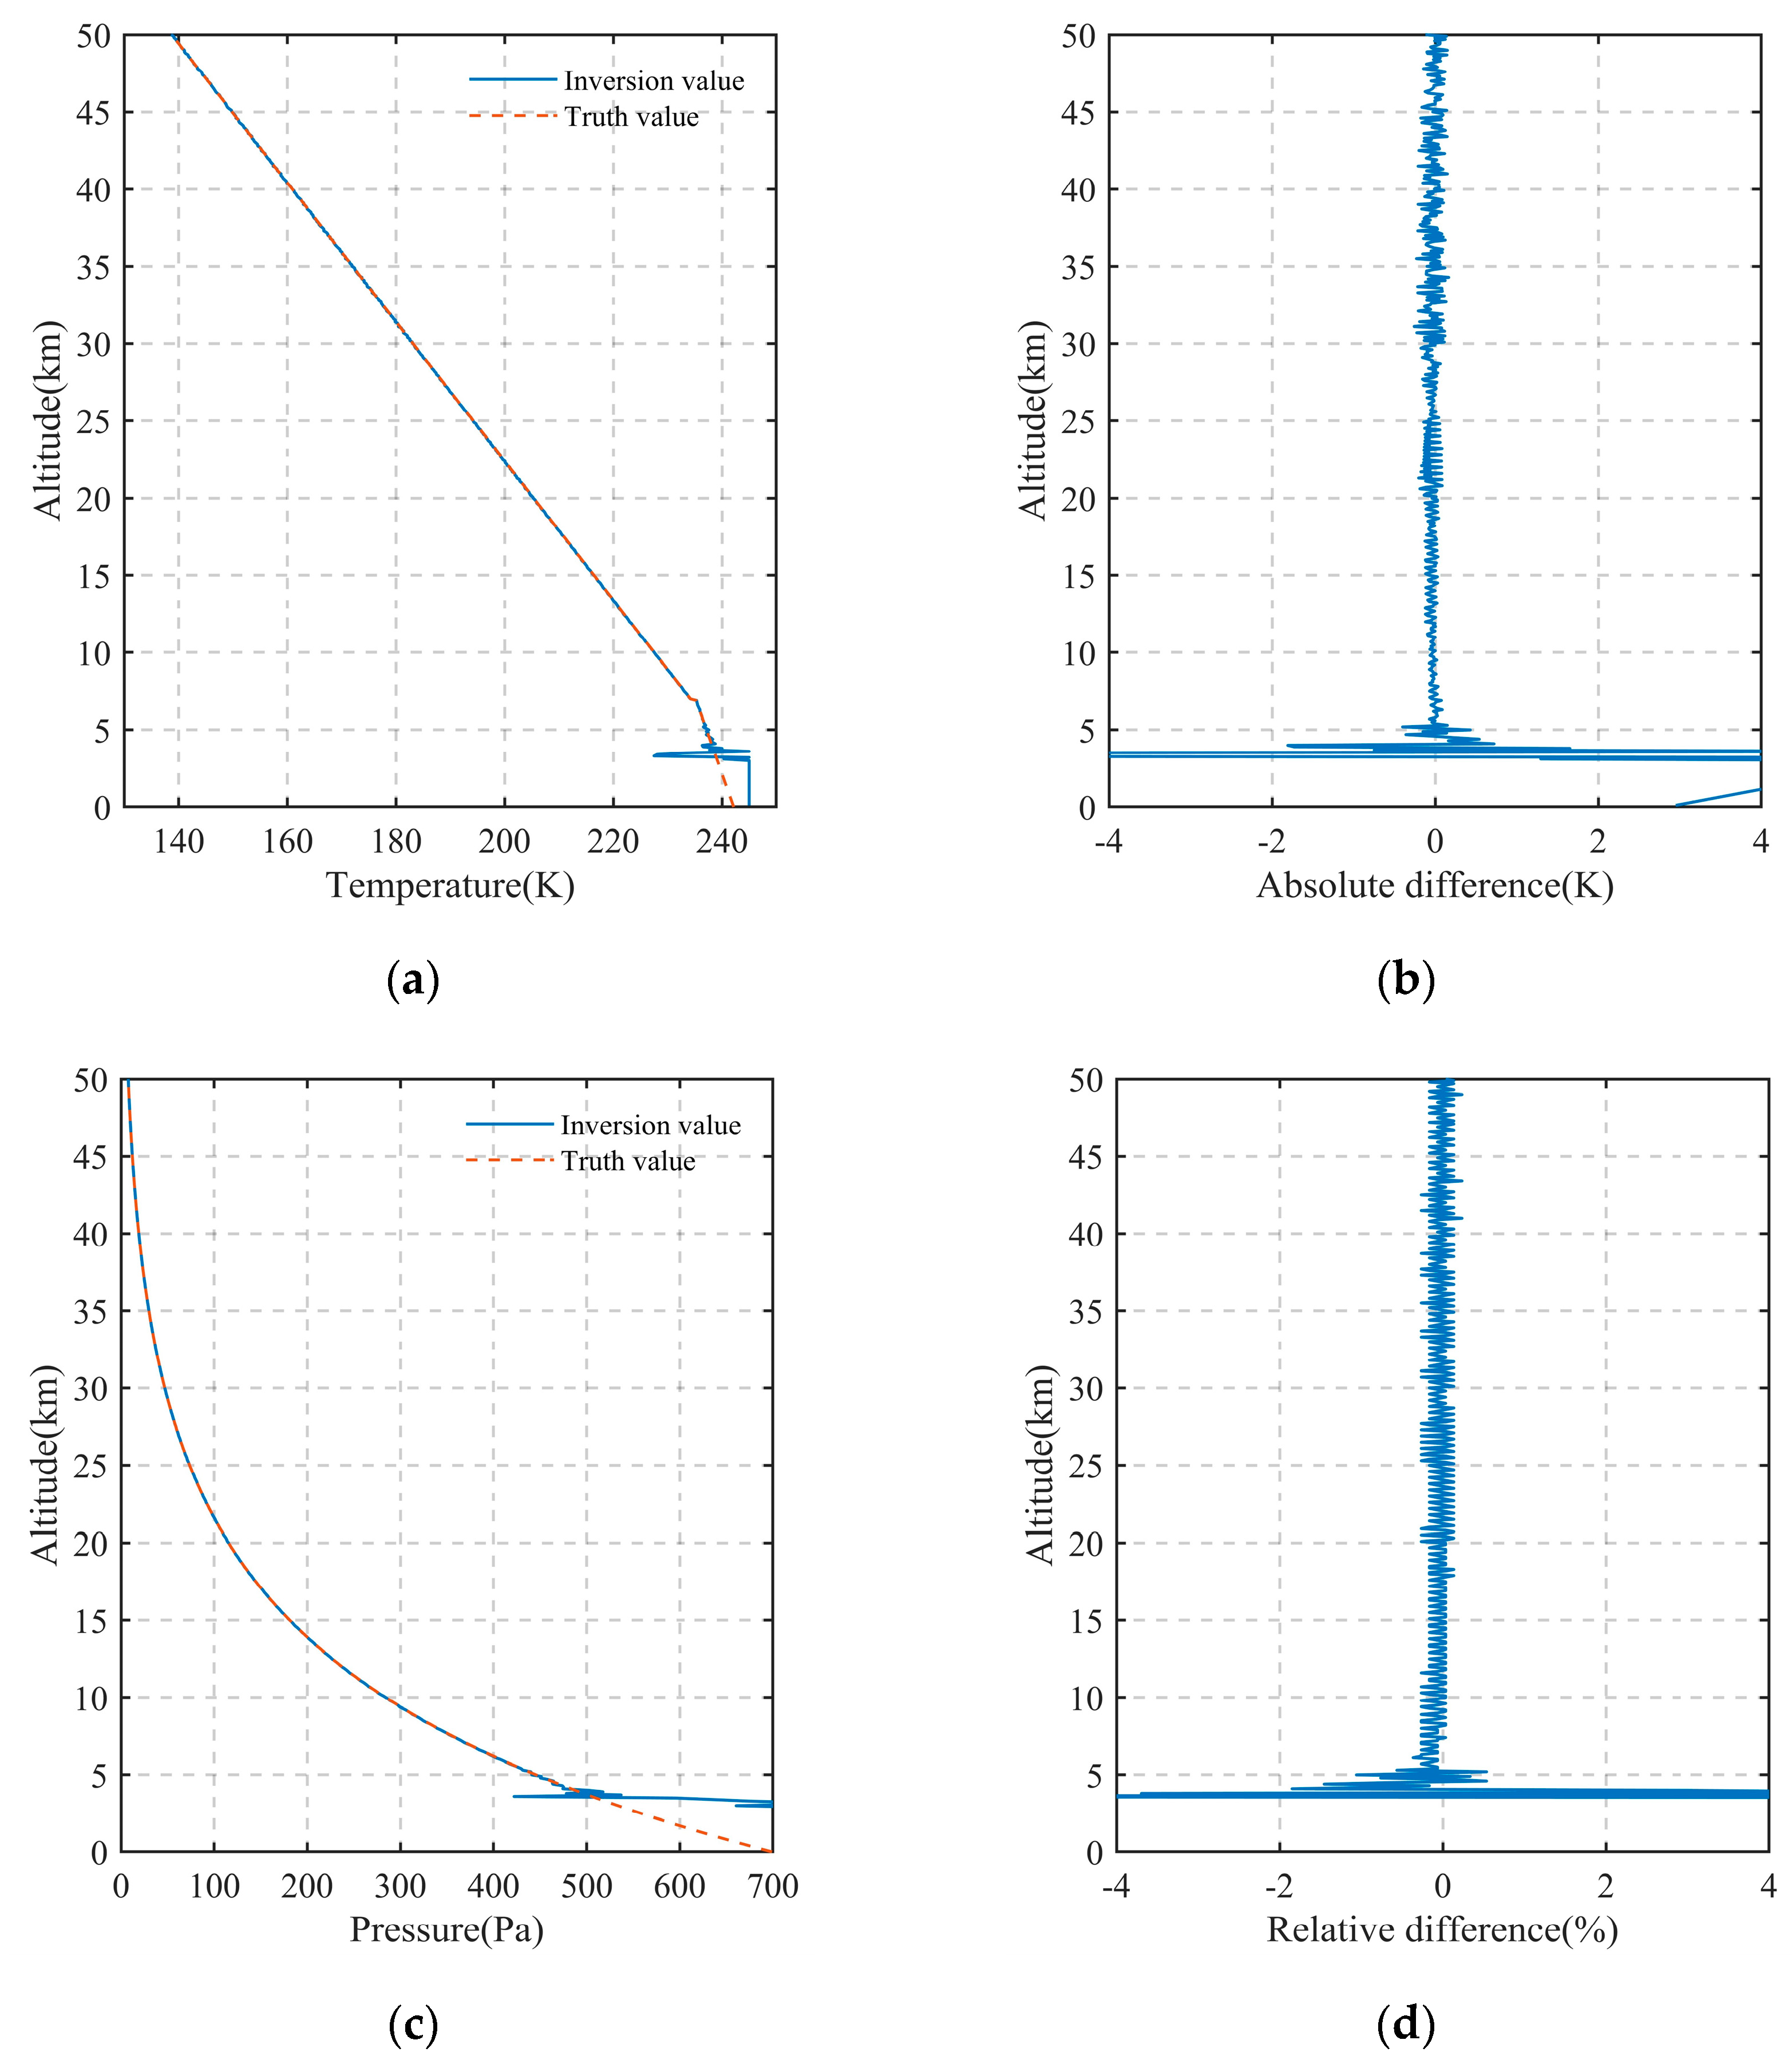
The inversion results and error results of atmospheric temperature and pressure in the altitude range of 0–50 km after introducing noise are shown in Figure 15. Analysis of the temperature results from the figure shows that the temperature has significant errors and deviates greatly from the true value below 5 km. In the altitude range of 5–50 km, the maximum error occurs at 5 km with an error of 0.43 K, and the average error is less than 0.07 K. Similarly, the pressure inversion results show that there are also significant errors in pressure below 5 km. In the altitude range of 5–50 km, the maximum relative error of pressure is 1.06% at 5 km. The average error is less than 0.11%, and the error is smaller at higher altitudes. From the above inversion results of temperature and pressure, it is found that noise has a slight influence on the inversion accuracy of temperature and pressure in the upper atmosphere of Mars. The inversion accuracy of temperature and pressure in the lower atmosphere of Mars is poor; the reason is the abundant atmospheric molecules and dust aerosols in the lower atmosphere of Mars significantly attenuate the signal, and finally, it is difficult to retrieve data accurately due to the poor detection SNR.
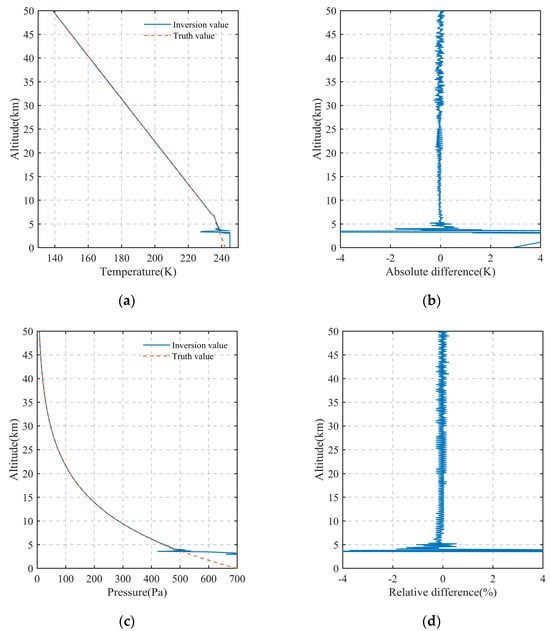
Figure 15.
The inversion results of atmospheric temperature and pressure profiles and deviation from the true value of the model in the altitude range of 0 km to 50 km after introducing noise (the central wavelength is 1591.4755 nm). (a) The inversion results of atmospheric temperature; (b) the absolute error results of atmospheric temperature; (c) the inversion results of atmospheric pressure; (d) the relative error results of atmospheric pressure.
Table 2 compares the detection parameters of three typical occultation techniques. Radio occultation can detect near the surface of Mars and can provide valuable low-altitude atmospheric temperature and pressure data. Its vertical resolution is relatively high, but the detection accuracy has certain limitations. Stellar occultation has a wide detection range, covering up to 160 km of the upper atmosphere. However, its vertical resolution is relatively low, which limits its ability to detect the fine structure of the atmosphere. In contrast, laser occultation significantly surpasses the other two techniques with its high vertical resolution of 100 m and high detection accuracy for temperature and pressure. It will be able to provide more precise and detailed data on the Martian atmosphere, which is crucial to understanding the complex dynamics of the Martian atmosphere. At the same time, these characteristics indicate that laser occultation technology shows significant application potential in the fields of Mars atmospheric research, climate model construction, and future Mars exploration mission planning.
Table 2.
Comparison of temperature and pressure of the Martian atmosphere detected by three typical occultation techniques.
In this study, the laser occultation signal data are accurately simulated without any processing operations. However, in practical applications, smoothing, filtering, and other pre-processing operations are required on the received original signal to improve the inversion accuracy of data. This method is based on the assumption that the temperature and pressure in the atmosphere are homogeneous within a certain horizontal range so that the atmospheric conditions at a certain point in the region can represent the average level of the region. However, this assumption may lead to biased results in regions with frequent sandstorms or significant seasonal variations. In the future, it is planned to adopt more refined models to consider the spatial variations of the Martian atmosphere to more accurately describe the state of the atmosphere at different locations.
5. Conclusions
This paper presents a detection method for the Martian atmospheric temperature and pressure using laser occultation technology based on a network of high-orbit and low-orbit satellites around Mars and conducts theoretical research and simulation analysis on this method. The model is established according to the actual Martian atmospheric environment, and the occultation signals received by the receiving satellite during the occultation event are simulated and calculated. Then the simulated signals are used to retrieve the atmospheric temperature and pressure, and the inversion errors are analyzed at last. The inversion results show that the temperature error is less than 0.43 K in the altitude range of 5–50 km. For the pressure inversion, in the same altitude range of 5–50 km, the error is less than 1.06%. For below 5 km, the inversion accuracy is low due to the influence of the strong absorption of Martian atmospheric molecules and the abundant dust aerosols, resulting in the inability to achieve effective detection. Therefore, the method proposed in this paper can achieve the detection of temperature and pressure profiles with a vertical resolution of 100 m from 5 km to 50 km above the Martian surface.
Based on the above results, it is shown that the laser occultation detection technology has the advantages of high precision and high vertical resolution and can achieve long-distance occultation detection of the Martian atmosphere. It is crucial for the further study of the spaceborne Mars atmospheric profiling detection system and holds great potential for wide-ranging applications.
Author Contributions
Conceptualization, Y.L., W.K. and X.S.; methodology, Y.L., W.K. and X.S.; software, Y.L.; validation, Y.L., X.S. and T.C.; formal analysis, Y.L. and X.S.; investigation, Y.L.; resources, W.K.; data curation, Y.L.; writing—original draft preparation, Y.L.; writing—review and editing, X.S.; visualization, T.C.; supervision, W.K.; project administration, G.H.; funding acquisition, W.K. and G.H. All authors have read and agreed to the published version of the manuscript.
Funding
This research was funded by the National Natural Science Foundation of China (42241169, 62205361), the Shanghai Sailing Program (23YF1455100), the Youth Innovation Promotion Association, Chinese Academy of Sciences (2021234), the Shanghai Rising-Star Program (22QA1410500), the Shanghai Municipal Science and Technology Major Project of Science and Technology Commission of Shanghai Municipality (2019SHZDZX01) and the Innovation Program for Quantum Science and Technology (2021ZD0300304).
Data Availability Statement
The data presented in this study are available on request from the corresponding author. The data are not publicly available due to privacy.
Conflicts of Interest
The authors declare no conflicts of interest.
References
- Fonseca, R.M.; Zorzano, M.P.; Martín-Torres, J. MARSWRF Prediction of Entry Descent Landing Profiles: Applications to Mars Exploration. Earth Space Sci. 2019, 6, 1440–1459. [Google Scholar] [CrossRef]
- Broadfoot, A.L.; Sandel, B.R.; Shemansky, D.E.; Atreya, S.K.; Donahue, T.M.; Moos, H.W.; Bertaux, J.L.; Blamont, J.E.; Ajello, J.M.; Strobel, D.F.; et al. Ultraviolet spectrometer experiment for the Voyager mission. Space Sci. Rev. 1977, 21, 183–205. [Google Scholar] [CrossRef]
- Wickert, J.; Reigber, C.; Beyerle, G.; König, R.; Marquardt, C.; Schmidt, T.; Grunwaldt, L.; Galas, R.; Meehan, T.K.; Melbourne, W.G.; et al. Atmosphere sounding by GPS radio occultation: First results from CHAMP. Geophys. Res. Lett. 2001, 28, 3263–3266. [Google Scholar] [CrossRef]
- Bertaux, J.L.; Vandaele, A.C.; Korablev, O.; Villard, E.; Fedorova, A.; Fussen, D.; Quemerais, E.; Belyaev, D.; Mahieux, A.; Montmessin, F.; et al. A warm layer in Venus’ cryosphere and high-altitude measurements of HF, HCl, H2O, and HDO. Nature 2007, 450, 646–649. [Google Scholar] [CrossRef]
- Liao, M.; Zhang, P.; Yang, G.-L.; Bi, Y.-M.; Liu, Y.; Bai, W.-H.; Meng, X.-G.; Du, Q.-F.; Sun, Y.-Q. Preliminary validation of the refractivity from the new radio occultation sounder GNOS/FY-3C. Atmos. Meas. Technol. 2016, 9, 781–792. [Google Scholar] [CrossRef]
- Fjeldbo, G.; Eshleman, V.R.; Garriott, O.K.; Smith, F.L. The two-frequency bistatic radar-occultation method for the study of planetary ionospheres. J. Geophys. Res. 1965, 70, 3701–3710. [Google Scholar] [CrossRef]
- Kliore, A.; Cain, D.L.; Levy, G.S.; Eshleman, V.R.; Fjeldbo, G.; Drake, F.D. Occultation Experiment: Results of the First Direct Measurement of Mars’s Atmosphere and Ionosphere. Science 1965, 149, 1243–1248. [Google Scholar] [CrossRef]
- Fjeldbo, G.; Fjeldbo, W.C.; Eshleman, V.R. Models for the Atmosphere of Mars based on the Mariner 4 Occultation Experiment. J. Geophys. Res. 1966, 71, 2307–2316. [Google Scholar] [CrossRef]
- Kliore, A.J. Radio Occultation Exploration of Mars. Symp. Int. Astron. Union 2015, 65, 295–316. [Google Scholar] [CrossRef]
- Hinson, D.P.; Simpson, R.A.; Twicken, J.D.; Tyler, G.L.; Flasar, F.M. Initial results from radio occultation measurements with Mars Global Surveyor. J. Geophys. Res. Planets 1999, 104, 26997–27012. [Google Scholar] [CrossRef]
- Tyler, G.L.; Balmino, G.; Hinson, D.P.; Sjogren, W.L.; Smith, D.E.; Simpson, R.A.; Asmar, S.W.; Priest, P.; Twicken, J.D. Radio science observations with Mars Global Surveyor: Orbit insertion through one Mars year in mapping orbit. J. Geophys. Res. Planets 2001, 106, 23327–23348. [Google Scholar] [CrossRef]
- Hinson, D.P.; Smith, M.D.; Conrath, B.J. Comparison of atmospheric temperatures obtained through infrared sounding and radio occultation by Mars Global Surveyor. J. Geophys. Res. Planets 2004, 109, E12002. [Google Scholar] [CrossRef]
- McCleese, D.J.; Haskins, R.D.; Schofield, J.T.; Zurek, R.W.; Leovy, C.B.; Paige, D.A.; Taylor, F.W. Atmosphere and climate studies of Mars using the Mars Observer pressure modulator infrared radiometer. J. Geophys. Res. Planets 1992, 97, 7735–7757. [Google Scholar] [CrossRef]
- Zurek, R.W.; Smrekar, S.E. An overview of the Mars Reconnaissance Orbiter (MRO) science mission. J. Geophys. Res. Planets 2007, 112, E05S01. [Google Scholar] [CrossRef]
- Ao, C.O.; Edwards, C.D.; Kahan, D.S.; Pi, X.; Asmar, S.W.; Mannucci, A.J. A first demonstration of Mars crosslink occultation measurements. Radio Sci. 2015, 50, 997–1007. [Google Scholar] [CrossRef]
- Hu, X.; Wu, X.C.; Song, S.L.; Ma, M.L.; Zhou, W.L.; Xu, Q.C.; Li, L.; Xiao, C.Y.; Li, X.; Wang, C.; et al. First Observations of Mars Atmosphere and Ionosphere with Tianwen-1 Radio-Occultation Technique on 5 August 2021. Remote Sens. 2022, 14, 2718. [Google Scholar] [CrossRef]
- Gröller, H.; Montmessin, F.; Yelle, R.V.; Lefèvre, F.; Forget, F.; Schneider, N.M.; Koskinen, T.T.; Deighan, J.; Jain, S.K. MAVEN/IUVS Stellar Occultation Measurements of Mars Atmospheric Structure and Composition. J. Geophys. Res. Planets 2018, 123, 1449–1483. [Google Scholar] [CrossRef]
- Kirchengast, G.; Bernath, P.; Buehler, S. ACCURATE–climate benchmark profiling of greenhouse gases and thermodynamic variables and wind from space (ESA Earth Explorer opportunity mission EE-8 proposal). In Proceedings of the ESA Earth Explorer Opportunity Mission EE8 Proposal, Scientific Report 36–2010, Graz, Austria, 6–11 September 2010; Available online: https://wegccon.uni-graz.at/opac2010/pdf_presentation/opac_2010_kirchengast_gottfried_presentation57.pdf (accessed on 29 October 2024).
- Trainer, M.G.; Wong, M.H.; McConnochie, T.H.; Franz, H.B.; Atreya, S.K.; Conrad, P.G.; Lefèvre, F.; Mahaffy, P.R.; Malespin, C.A.; Manning, H.L.K.; et al. Seasonal Variations in Atmospheric Composition as Measured in Gale Crater, Mars. J. Geophys. Res. Planets 2019, 124, 3000–3024. [Google Scholar] [CrossRef]
- Mars Atmosphere Model. Available online: https://www.grc.nasa.gov/WWW/K-12/airplane/atmosmrm.html (accessed on 29 October 2024).
- Rothman, L.S.; Jacquemart, D.; Barbe, A.; Chris Benner, D.; Birk, M.; Brown, L.R.; Carleer, M.R.; Chackerian, C.; Chance, K.; Coudert, L.H.; et al. The HITRAN 2004 molecular spectroscopic database. J. Quant. Spectrosc. Radiat. Transf. 2005, 96, 139–204. [Google Scholar] [CrossRef]
- Langford, J.I. A rapid method for analysing the breadths of diffraction and spectral lines using the Voigt function. J. Appl. Crystallogr. 1978, 11, 10–14. [Google Scholar] [CrossRef]
- Dickinson, C.; Whiteway, J.A.; Komguem, L.; Moores, J.E.; Lemmon, M.T. Lidar measurements of clouds in the planetary boundary layer on Mars. Geophys. Res. Lett. 2010, 37, L18203. [Google Scholar] [CrossRef]
- Komguem, L.; Whiteway, J.A.; Dickinson, C.; Daly, M.; Lemmon, M.T. Phoenix LIDAR measurements of Mars atmospheric dust. Icarus 2013, 223, 649–653. [Google Scholar] [CrossRef]
- Jiang, P.; Yuan, J.; Wu, K.; Wang, L.; Xia, H. Turbulence Detection in the Atmospheric Boundary Layer Using Coherent Doppler Wind Lidar and Microwave Radiometer. Remote Sens. 2022, 14, 2951. [Google Scholar] [CrossRef]
- Shen, X.; Kong, W.; Chen, T.; Liu, Y.; Huang, G.; Shu, R. An inter-satellite laser occultation method profiling atmospheric temperature and pressure from troposphere to lower mesosphere. J. Quant. Spectrosc. Radiat. Transf. 2024, 328, 109174. [Google Scholar] [CrossRef]
- Bertaux, J.-L.; Fonteyn, D.; Korablev, O.; Chassefière, E.; Dimarellis, E.; Dubois, J.P.; Hauchecorne, A.; Cabane, M.; Rannou, P.; Levasseur-Regourd, A.C.; et al. The study of the Martian atmosphere from top to bottom with SPICAM light on Mars Express. Planet. Space Sci. 2000, 48, 1303–1320. [Google Scholar] [CrossRef]
- López-Valverde, M.A.; Funke, B.; Brines, A.; Stolzenbach, A.; Modak, A.; Hill, B.; González-Galindo, F.; Thomas, I.; Trompet, L.; Aoki, S.; et al. Martian Atmospheric Temperature and Density Profiles During the First Year of NOMAD/TGO Solar Occultation Measurements. J. Geophys. Res. Planets 2023, 128, e2022JE007278. [Google Scholar] [CrossRef]

Disclaimer/Publisher’s Note: The statements, opinions and data contained in all publications are solely those of the individual author(s) and contributor(s) and not of MDPI and/or the editor(s). MDPI and/or the editor(s) disclaim responsibility for any injury to people or property resulting from any ideas, methods, instructions or products referred to in the content. |
© 2024 by the authors. Licensee MDPI, Basel, Switzerland. This article is an open access article distributed under the terms and conditions of the Creative Commons Attribution (CC BY) license (https://creativecommons.org/licenses/by/4.0/).