Article

Detection of Invasive Species (Siam Weed) Using Drone-Based Imaging and YOLO Deep Learning Model

1
Geospatial Science, School of Science, RMIT University, Melbourne, VIC 3000, Australia
2
Department of Lands, Planning and Environment, NT Government, Palmerston, NT 0831, Australia
3
EcOz Environmental Consulting, Darwin, NT 0800, Australia
4
Department of Climate Change, Energy, the Environment and Water, Supervising Scientist Branch, Darwin, NT 0820, Australia
5
Biosecurity Queensland, Department of Agriculture and Fisheries, Townsville, QLD 4820, Australia
*
Author to whom correspondence should be addressed.
Remote Sens. 2025, 17(1), 120; https://doi.org/10.3390/rs17010120
Submission received: 31 October 2024 / Revised: 6 December 2024 / Accepted: 26 December 2024 / Published: 2 January 2025
(This article belongs to the Special Issue Remote Sensing for Management of Invasive Species)

Abstract

:
This study explores the efficacy of drone-acquired RGB images and the YOLO model in detecting the invasive species Siam weed (Chromolaena odorata) in natural environments. Siam weed is a perennial scrambling shrub from tropical and sub-tropical America that is invasive outside its native range, causing substantial environmental and economic impacts across Asia, Africa, and Oceania. First detected in Australia in northern Queensland in 1994 and later in the Northern Territory in 2019, there is an urgent need to determine the extent of its incursion across vast, rugged areas of both jurisdictions and a need for distribution mapping at a catchment scale. This study tests drone-based RGB imaging to train a deep learning model that contributes to the goal of surveying non-native vegetation at a catchment scale. We specifically examined the effects of input training images, solar illumination, and model complexity on the model’s detection performance and investigated the sources of false positives. Drone-based RGB images were acquired from four sites in the Townsville region of Queensland to train and test a deep learning model (YOLOv5). Validation was performed through expert visual interpretation of the detection results in image tiles. The YOLOv5 model demonstrated over 0.85 in its F1-Score, which improved to over 0.95 with improved exposure to the images. A reliable detection model was found to be sufficiently trained with approximately 1000 image tiles, with additional images offering marginal improvement. Increased model complexity did not notably enhance model performance, indicating that a smaller model was adequate. False positives often originated from foliage and bark under high solar illumination, and low exposure images reduced these errors considerably. The study demonstrates the feasibility of using YOLO models to detect invasive species in natural landscapes, providing a safe alternative to the current method involving human spotters in helicopters. Future research will focus on developing tools to merge duplicates, gather georeference data, and report detections from large image datasets more efficiently, providing valuable insights for practical applications in environmental management at the catchment scale.

1. Introduction

Invasive plant incursions threaten ecosystems, agricultural production, and human livelihoods, particularly where they alter ecosystem dynamics and displace native flora and fauna [1,2,3]. If left unchecked, invasive plant species can reduce environmental biodiversity, agricultural crop yields, and pose risks to human and animal health. A key component of effective weed management is conducting delimiting surveys to accurately assess the extent of the weed species. In recent years, remote sensing methods have gained popularity as efficient survey techniques, offering extensive area coverage in a short period [4,5,6]. These methods often involve airborne imaging with various types of cameras. Compared to traditional ground-based surveys, aerial surveys offer significant advantages in terms of time and cost [7,8].
Chromolaena odorata, commonly known as Siam weed, is a perennial plant species native to the Americas that is recognised as invasive throughout many parts of Asia, Africa, Oceania, and the Pacific Islands [9,10]. Siam weed was first detected in Queensland, Australia, in 1994 and later in the Northern Territory in 2019 [9,11,12]. Rapid spread, within and between catchments, states, countries, islands, and continents reflect the invasive capacity of the species through a combination of rapid growth [13] and high seed production (up to 87,000 seeds per plant). Seeds can be dispersed easily by wind, water, and by human, animal, and mechanical vectors [14]. Studies based on the climate simulation model CLIMEX show the potential distribution of Siam weed to be across much of the vegetated areas of northern and eastern Australia [15]. Issues with delimiting the extent of the incursion and controlling that known extent on a fixed budget contributed to the end of the eradication program in Queensland in 2012 [9]. However, due to the considerable threat Siam weed poses, there remains a need for survey methods capable of detecting this weed across the large and rugged areas of northern Australia.
Remote sensing with drones and aircraft has increasingly been used in both academic research and industry application settings. These methods enable surveying extensive and often inaccessible landscapes while capturing high-resolution data due to sensor proximity to the surface [8,16]. Aerial platforms can be equipped with various payloads, including RGB, multispectral, hyperspectral cameras, and Light Detection and Ranging (LiDAR) sensors, to collect detailed surface information about invasive species. Data from hyperspectral sensors allow for the detection of specific plant species based on the unique spectra of biophysical features spanning a full range of wavelengths at each pixel [4,17,18]. In contrast, conventional RGB data analysis relies on distinct visible features, such as flowers, to differentiate weeds from their surrounding vegetation [4,19]. In the practical implementation of weed detection across large spatial scales, hyperspectral imaging may lead to excessive computational demand arising from many redundant bands [20,21]. Multispectral cameras, capturing more spectral information per pixel than standard three-band RGB cameras, show promise as tools for detecting Siam weed despite offering lower data density than hyperspectral images [22,23]. This suggests the potential for multispectral and even RGB images to detect Siam weed, with the RGB imagery representing the lowest volume of data at a low cost and being better suited for conducting surveys across large spatial scales.
Nevertheless, broadscale aerial RGB flights still capture large volumes of images, posing challenges in image processing, classification, and analysis to extract meaningful information [18,24]. Artificial intelligence, particularly machine learning (ML) and deep learning (DL), can play a crucial role in the efficient processing of these images to extract specific information, such as detecting specific weed species. ML algorithms generally require manual engineering of input features, whereby experts design and extract relevant features from images—a time-consuming process that may not capture all relevant information [25,26,27]. In contrast, DL models, such as Convolutional Neural Networks (CNNs), learn features directly from raw data, excelling at handling large volumes of images and automatically discovering intricate patterns of complex structures. For weed detection, DL is preferred due to its scalability and superior accuracy, albeit it requires a substantially large training dataset [24,28,29,30]. The YOLO (You Only Look Once), a popular CNN model, can adapt to variations in weed appearance, lighting conditions, and background clutter, achieving accuracy rates exceeding 90% in weed classification [28,31,32,33]. While further investigation is necessary to optimise DL models for weed species detection in natural environments, their ability to handle large datasets and deliver high accuracy makes them promising tools for invasive weed detection.
Weed detection using remotely sensed imagery is well established, primarily in agricultural settings [34], where distinct spectral or visual differences between the homogenous agricultural background and the weed can aid in detection. However, methods effective in monocultural backgrounds often struggle in complex natural environments [35], where diverse vegetation poses significant challenges. Detecting weeds in such settings using high-resolution images is an emerging research topic, with recent advancements in the remote detection of species like Siam weed, Orange Hawkweed, Bitou bush, and Serrated Tussock [8,36,37,38]. Recent investigations into Siam weed distribution have demonstrated the utility of the K-Means clustering algorithm for detection in open fields. However, scaling this approach for catchment-level mapping presents challenges, particularly due to the requirement for orthomosaic image creation [39]. In another study, multiple endmember spectral mixture analysis applied to hyperspectral imagery (AVIRIS-NG) was used to map the distribution of understory invasive plant species at a regional scale. However, as noted by the authors, the processing inefficiencies caused by the high number of spectral bands in hyperspectral data remain a limitation for scaling the approach to a catchment-level mapping [40]. While deep learning models have been successfully employed for high-speed weed detection, including Siam weed detection using the publicly available DeepWeeds dataset [30,41,42], adapting these ground-level models for aerial imagery has yet to be explored. Mawardi et al. [36] and Rodriguez et al. [6] presented an algorithm to georeference image-level weed detections to geographic coordinates. In particular, Mawardi et al. [36] demonstrated the use of the YoloV5 model, emphasising that solar illumination may impact Siam weed detection—one of the key focuses of this study.
This study aims to develop a Siam weed detection model with the potential of scalability and implementation for use in remote sensing surveys at a catchment scale. We explore the detection of Siam weed during its flowering stage using high-resolution drone imagery and a custom-trained YOLOv5 model. We assess the model’s performance against varying number of input training images (100, 300, 500, 1000, 2000, and 5000), solar illumination (sunny and overcast), and model complexity (small, medium, large, and extra-large). The findings may guide future weed detection surveys and support land managers and organisations to make informed decisions for effective weed management.

2. Materials and Methods
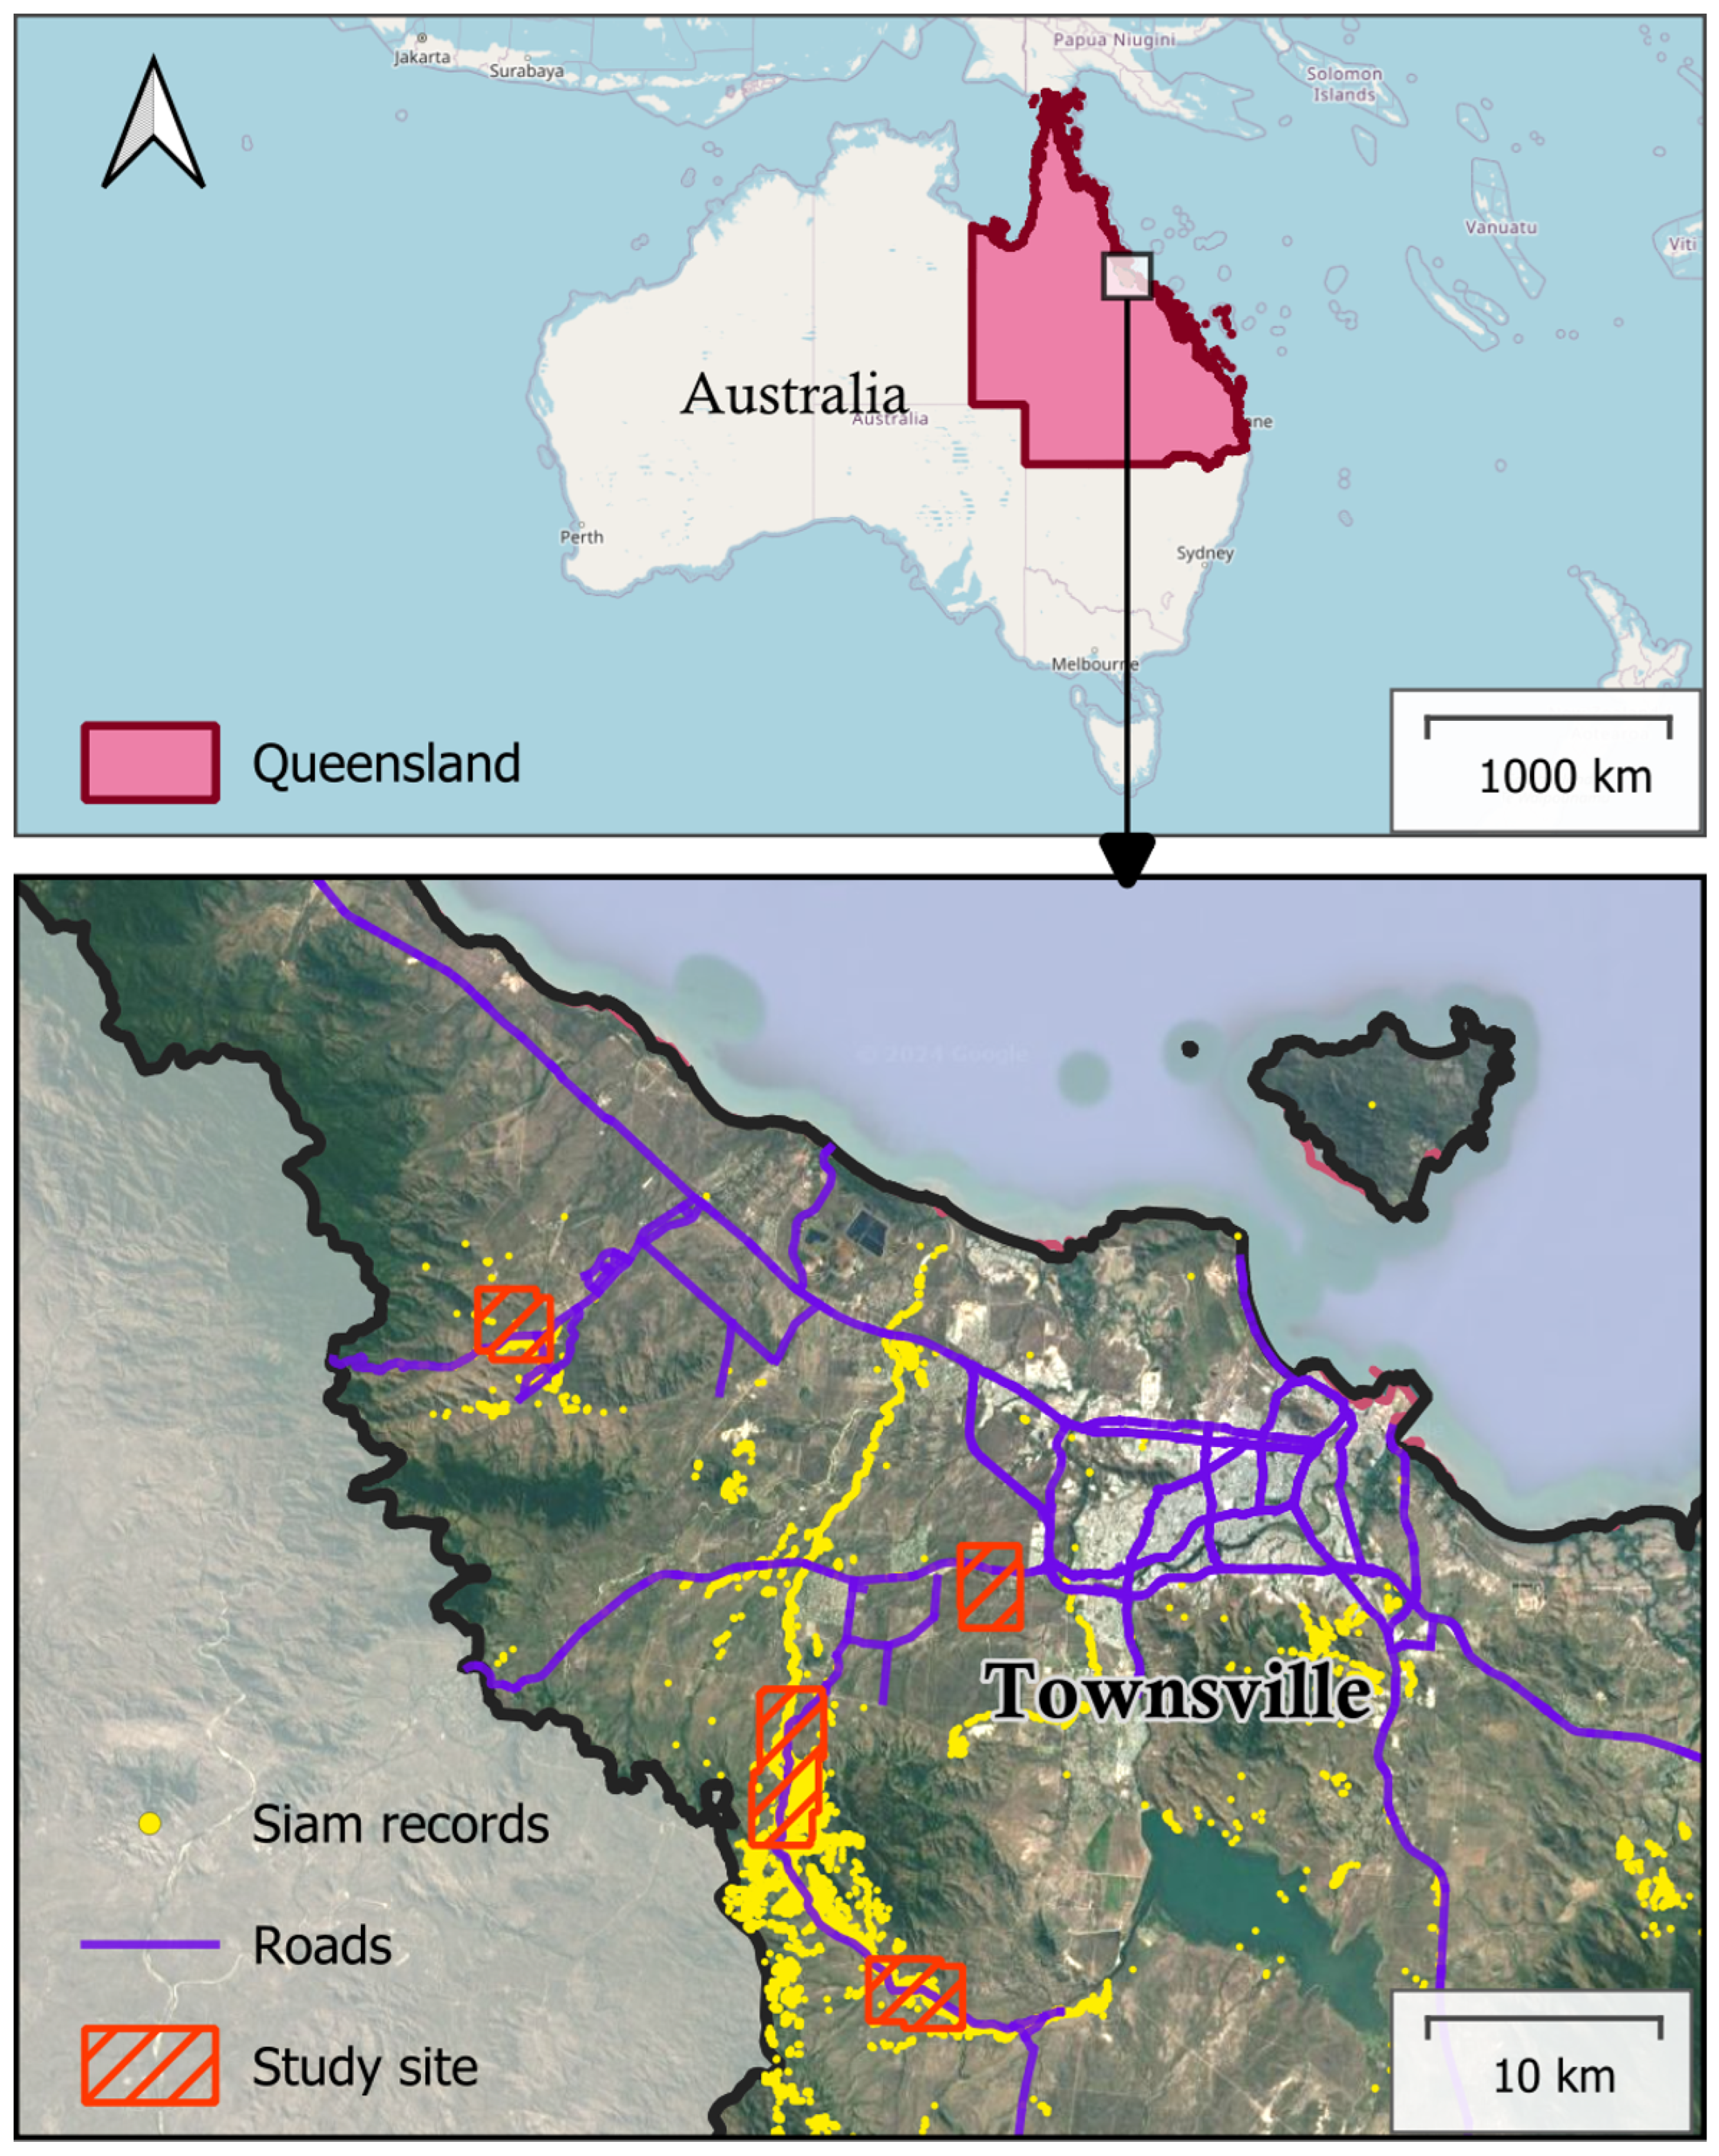
2.1. Study Area

This study focuses on the Townsville local government area, Queensland, Australia, a seasonally dry area of Australia with summer-dominated rainfall. Siam weed was reported in the Townsville area in 2003 [9], with the ongoing discovery of infestations across large areas and in multiple river catchments [14,43] (Figure 1). The species is presently classified as a category 3 restricted invasive plant under the Biosecurity Act 2014 in Queensland.
Four study sites with records of Siam weed were selected for the project’s field campaign (Figure 1). Site selections considered various operational factors, including (i) the proximity to Townsville, (ii) permission from landowners, (iii) road access to the sites, (iv) the presence of flowering plants, (v) the diversity of the vegetation at each site, and (vi) the local topography.

2.2. Data Capture

The field data collection campaign used a consumer-grade DJI Mavic Pro 2 (Shenzhen, China) drone to capture images across the survey sites. The DJI Mavic Pro 2 captured nadir-pointing RGB images with its integrated Hasselblad L1D-20C camera. The camera features 10 m m focal length and a 1-inch 20 MP CMOS sensor, enabling a high-resolution RGB image capture. Additionally, the drone has a built-in navigation-grade GPS unit and a MEMS-grade IMU, which are essential for georeferencing [6,36].
In the Townsville region, Siam weed typically germinates between November and February. This is followed by a period of vegetative growth and then flowering, which occurs from late May to early July. During the flowering period and the vegetative growth period, Siam weed can be distinguished from surrounding vegetation by specific phenological characteristics observable from the ground and the air. During vegetative growth, the weed appears lighter green than the native vegetation. The weed becomes especially distinct in the landscape during flowering due to its characteristic white flowers with a purple hue. Consequently, both ground and aerial surveys typically focus on the flowering period when the Siam weed is visually more distinct from other vegetation types [9]. This study also focuses on the flowering phase of the Siam weed to facilitate its detection within the surrounding green vegetation.
The RGB images were captured from the four study sites coinciding with the peak flowering of the Siam weed. The field data capture campaign was carried out between 20 and 24 June 2021, capturing images at 2 c m or better spatial resolution, which was considered sufficient given the flower cluster size. The flower heads are 1–2 c m in diameter and contain 10–35 flowers. Flowerheads are borne as clusters ranging from 10–15 c m in size depending on development and number. During the five days of data acquisition, over 5000 images were captured, forming an image dataset consisting of Siam weeds in the landscape among diverse native vegetation types and different illumination. Each image was geotagged with the drone onboard navigation-grade GPS location and the gimbal MEMS-grade inertial measurement unit (IMU) orientation (i.e., roll, pitch, and yaw). The image capture conditions were variables regarding illumination, i.e., some days were sunny, others were partially or fully overcast, and others where conditions changed during flight (Table 1).

2.3. Detection Model

The Siam weed detection model was trained using the YOLOv5 object detection model. The YOLO is a state-of-the-art real-time object detection framework known for its high speed and accuracy. Its architecture employs a single convolutional neural network to process entire images in a single evaluation, making it faster than traditional multistage detection methods [44,45]. The model’s grid-based detection approach enhances its ability to capture contextual information [44], such as Siam flowers within a green vegetation background. This balance of speed and accuracy, coupled with its demonstrated success in vegetation detection tasks [46,47,48,49], was the reason to adopt YOLO model in this study.
The image dataset consisted of over 5000 RGB images at resolution of 5472 × 3648 pixels at 2 cm resolution. The images consisted of patches of Siam weed among other vegetation types in the landscape. Figure 2 shows the representative image dataset captured in sunny and overcast conditions roughly annotated for visualisation purpose. The full-resolution images were sliced into smaller tiles of 512 × 512 pixels using a custom-developed Python script. The image slicing aims to retain the full spatial resolution of the image for annotation, subsequent training, and validation of the YOLOv5 model. The sliced images were then used to annotate the presence of the Siam weed through the visible flowers using the online annotation Roboflow tool [50].
The annotated image tiles were randomly divided into training and testing datasets in a ratio of 4:1. The detection model was developed using a range of random input image tiles for training and validation (100, 200, 300, 500, 1000, 2000, and 5000 image tiles) to identify an optimal model that can later be used to deploy on new sites and new images. The model was also developed for a range of complexity. YOLOv5 has four model formulations (YOLOv5s, YOLOv5m, YOLOv5x, YOLOv5l) that can be employed depending upon the complexity of the object detection task. This resulted in the development of 28 detection models (7 sets of image tiles × 4 sets of model complexity).

2.4. Validation of the Model

In aerial imagery, Siam weed often lacks distinct boundaries that fit neatly within an image tile. For weed management purposes, both fragmented and continuous detection of flowers within a Siam weed patch are considered correct. Consequently, this study used manual expert verification, instead of traditional metrics such as intersection of union (IoU) and mean average precision (mAP), to ensure contextually relevant validation.
The validation dataset was drawn from a pool of 5000 images and comprised 960 unique image tiles that were not used in earlier training or testing. These tiles represented a mix of conditions, including dense Siam weed, sparse to moderate densities, and areas with no Siam weed, captured under both sunny and overcast conditions. The developed Siam weed detection models were applied to these validation tiles, generating post-detection results. These results were then evaluated by five independent teams of field officers experienced in identifying Siam weed. Each team assessed the post-detection tiles to determine whether the model’s detection for each tile was correct (true positive or true negative) or incorrect (false positive or false negative).
For the purpose of this study, true/false positive/negative are defined in the context of image tile and not individual bounding box or individual flowers. This is primarily due to the nature of the plant which often overlaps with adjacent plants and form a complex scene where the plant boundary is not distinct. So, quantifying accuracies at the individual flower or individual bounding box levels were considered less important. There were cases where the model made both correct and incorrect detections (bounding boxes) within a single tile. In such cases, the result was scored based on whether the model had more correct or incorrect detections for that image tile. For example, in Figure 3d, the model made several false positive detections over a patch of non-Siam weed vegetation and at the same time made a true positive detection on a patch of Siam weed; in this case, the model is considered to have made a false positive detection because, on the image tile level, the model has made more incorrect detections (Figure 3). The five independent validations were then averaged to derive accuracy metrics to minimise observer bias.

2.5. Accuracy Metrics
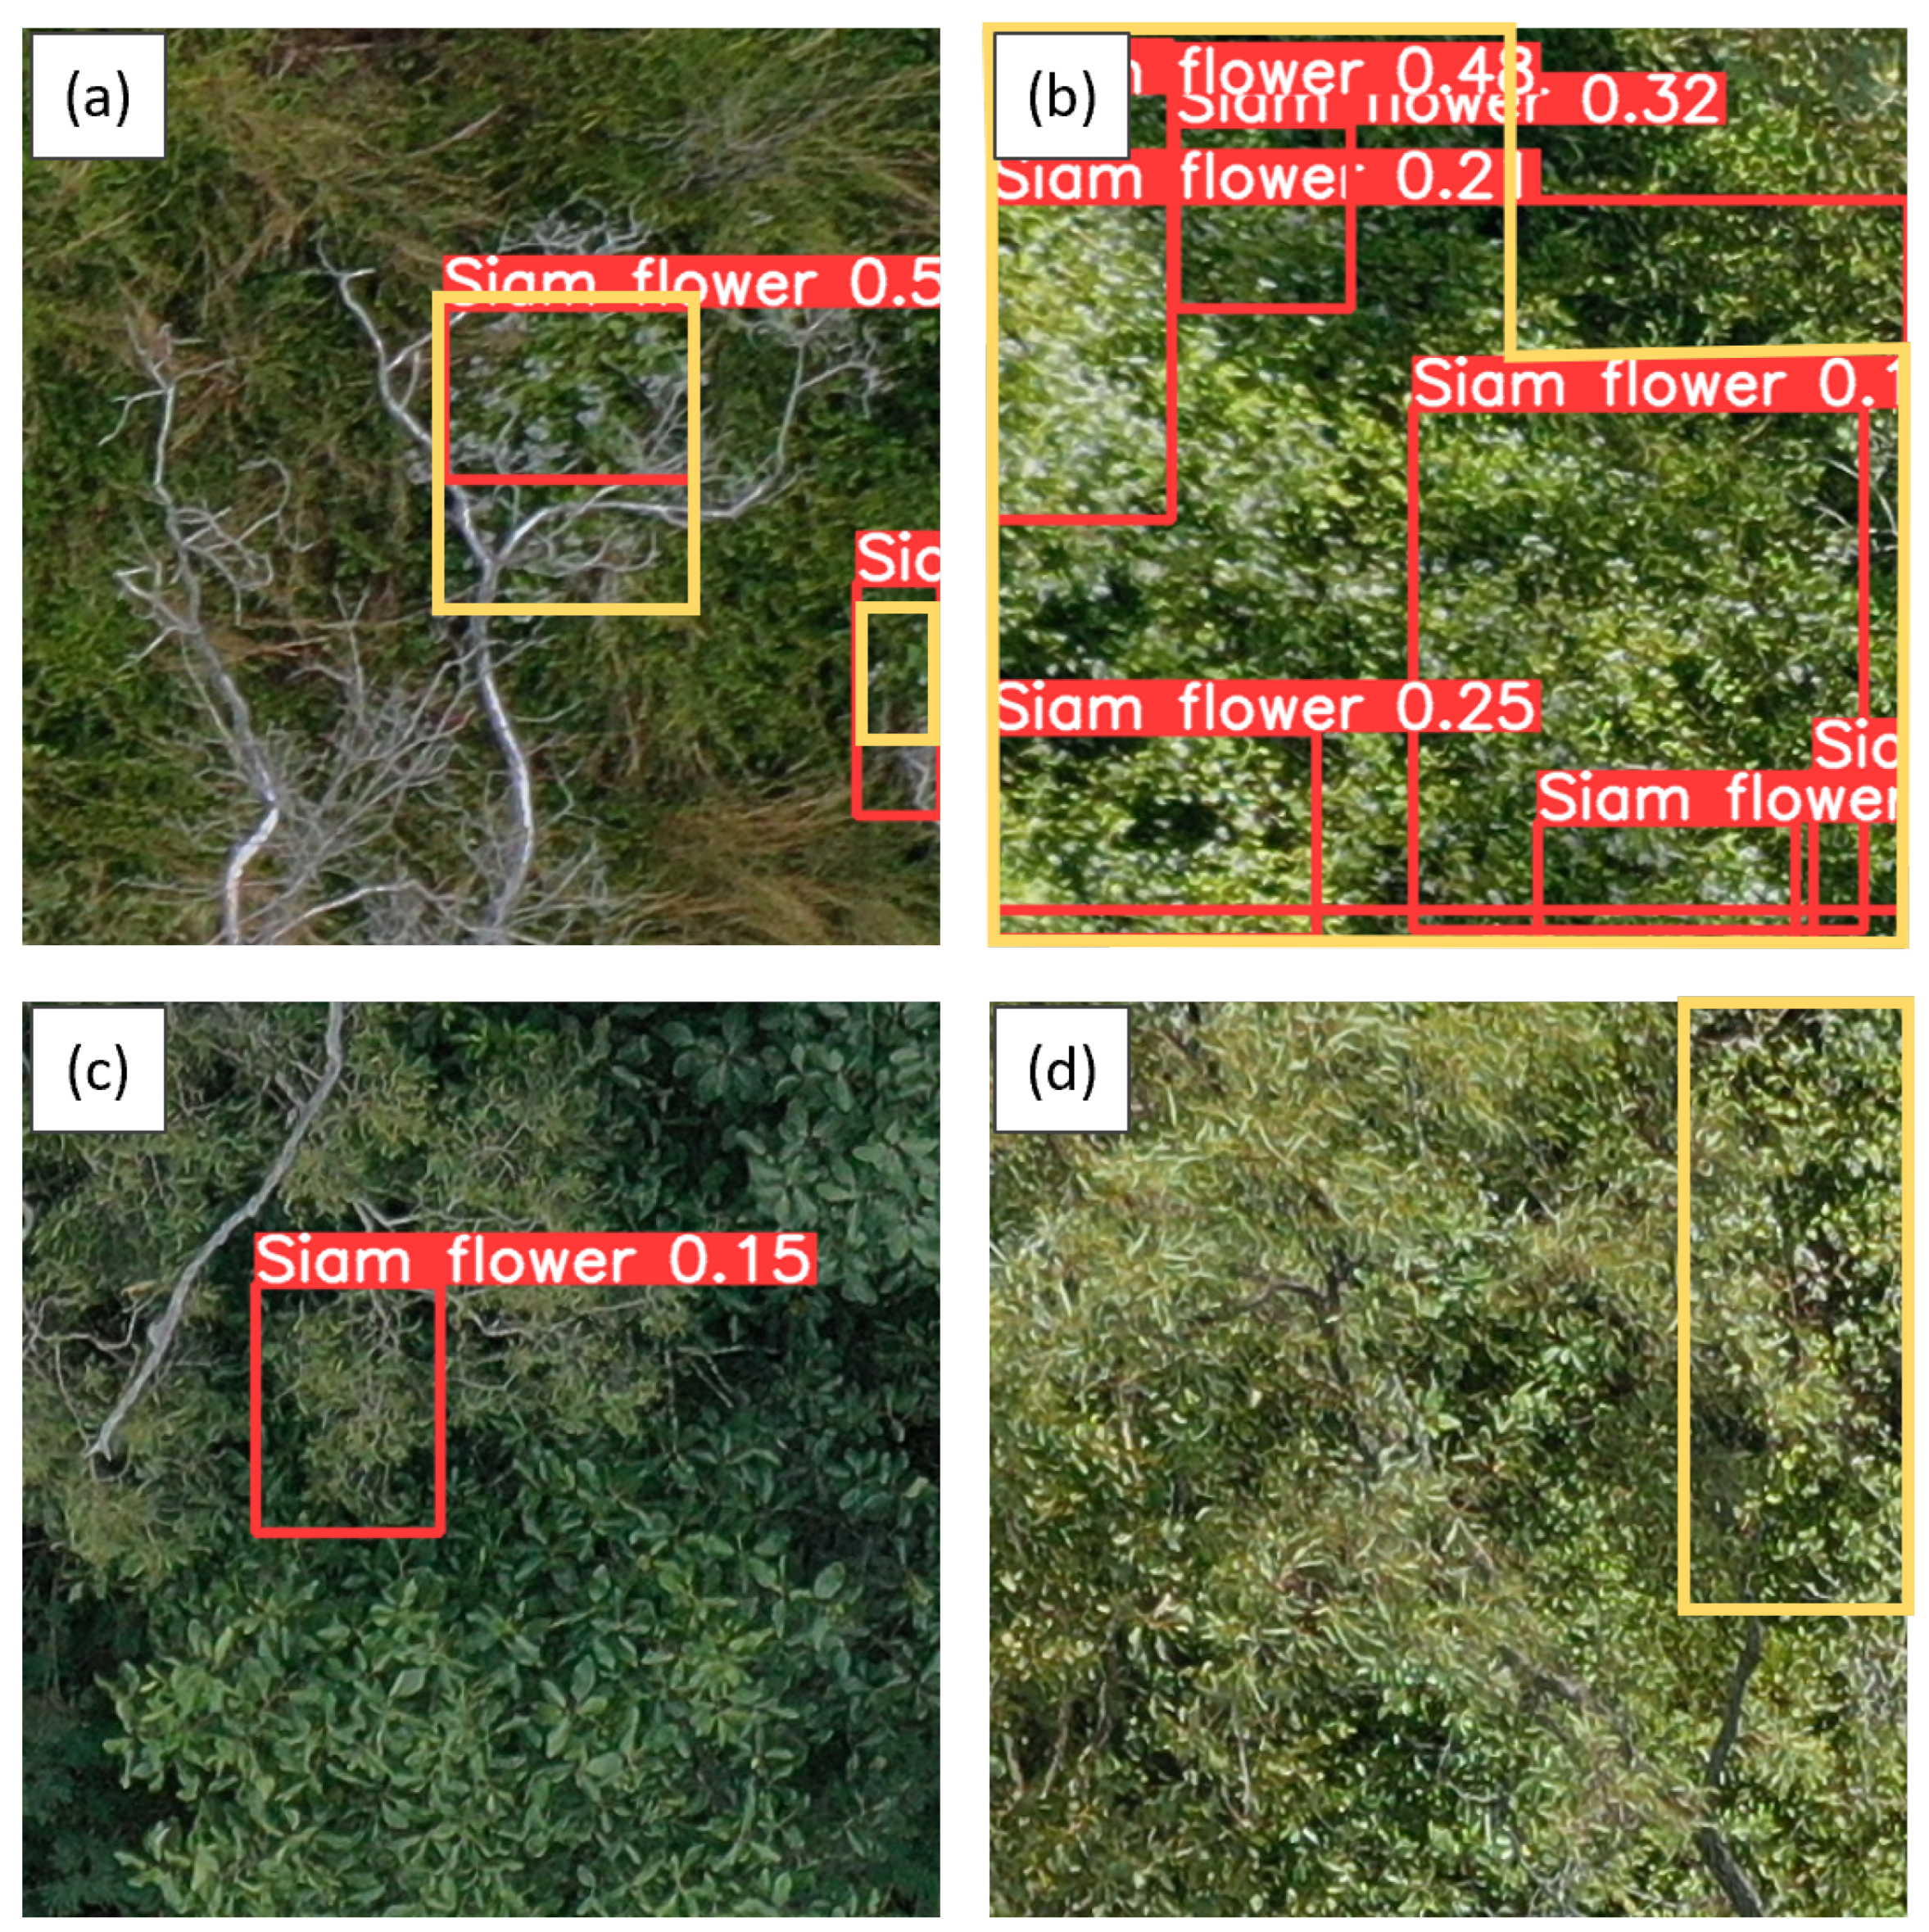
The custom-trained YOLOv5 models’ ability to detect Siam weed was assessed using three accuracy metrics—Precision, Recall, and F1-Score. Precision measures the correctly predicted proportion of the positive Siam weed detections among all the detections considered Siam. Recall measures the correctly predicted proportion of positive Siam weed detections among all actual positive and actual negative detections. The precision or recall alone can result in a biased view of the model performance. For example, precision penalises false positive detection of Siam weed; however, a model could also have high precision by underestimating the true positives. Similarly, a high recall means most of the true positives are Siam weed; however, the metrics do not penalise the false positives. For this reason, the third accuracy metric, the F1-Score, was used to measure the overall model performance based on both precision and recall.

3. Results

The YOLOv5 Siam weed detection model detected Siam weed on the aerial images of natural landscapes and delineated them using bounding boxes (Figure 4). Each bounding box represents a detection of Siam weed. The boxes are accompanied by a score indicating the model’s detection confidence. These bounding boxes also delineate the approximate spatial extent of the weed within the image. For most image tiles, the Siam weed was detected correctly—more so in the overcast images (e.g., Figure 4a) compared to under sunny conditions (e.g., Figure 3b). Many false positives originated from a range of highly reflective targets, such as the bark of eucalypt trees, reflective foliage, and twigs. (e.g., Figure 4c). There were also rare cases of false negatives where the presence of Siam was missed entirely (e.g., Figure 4d).

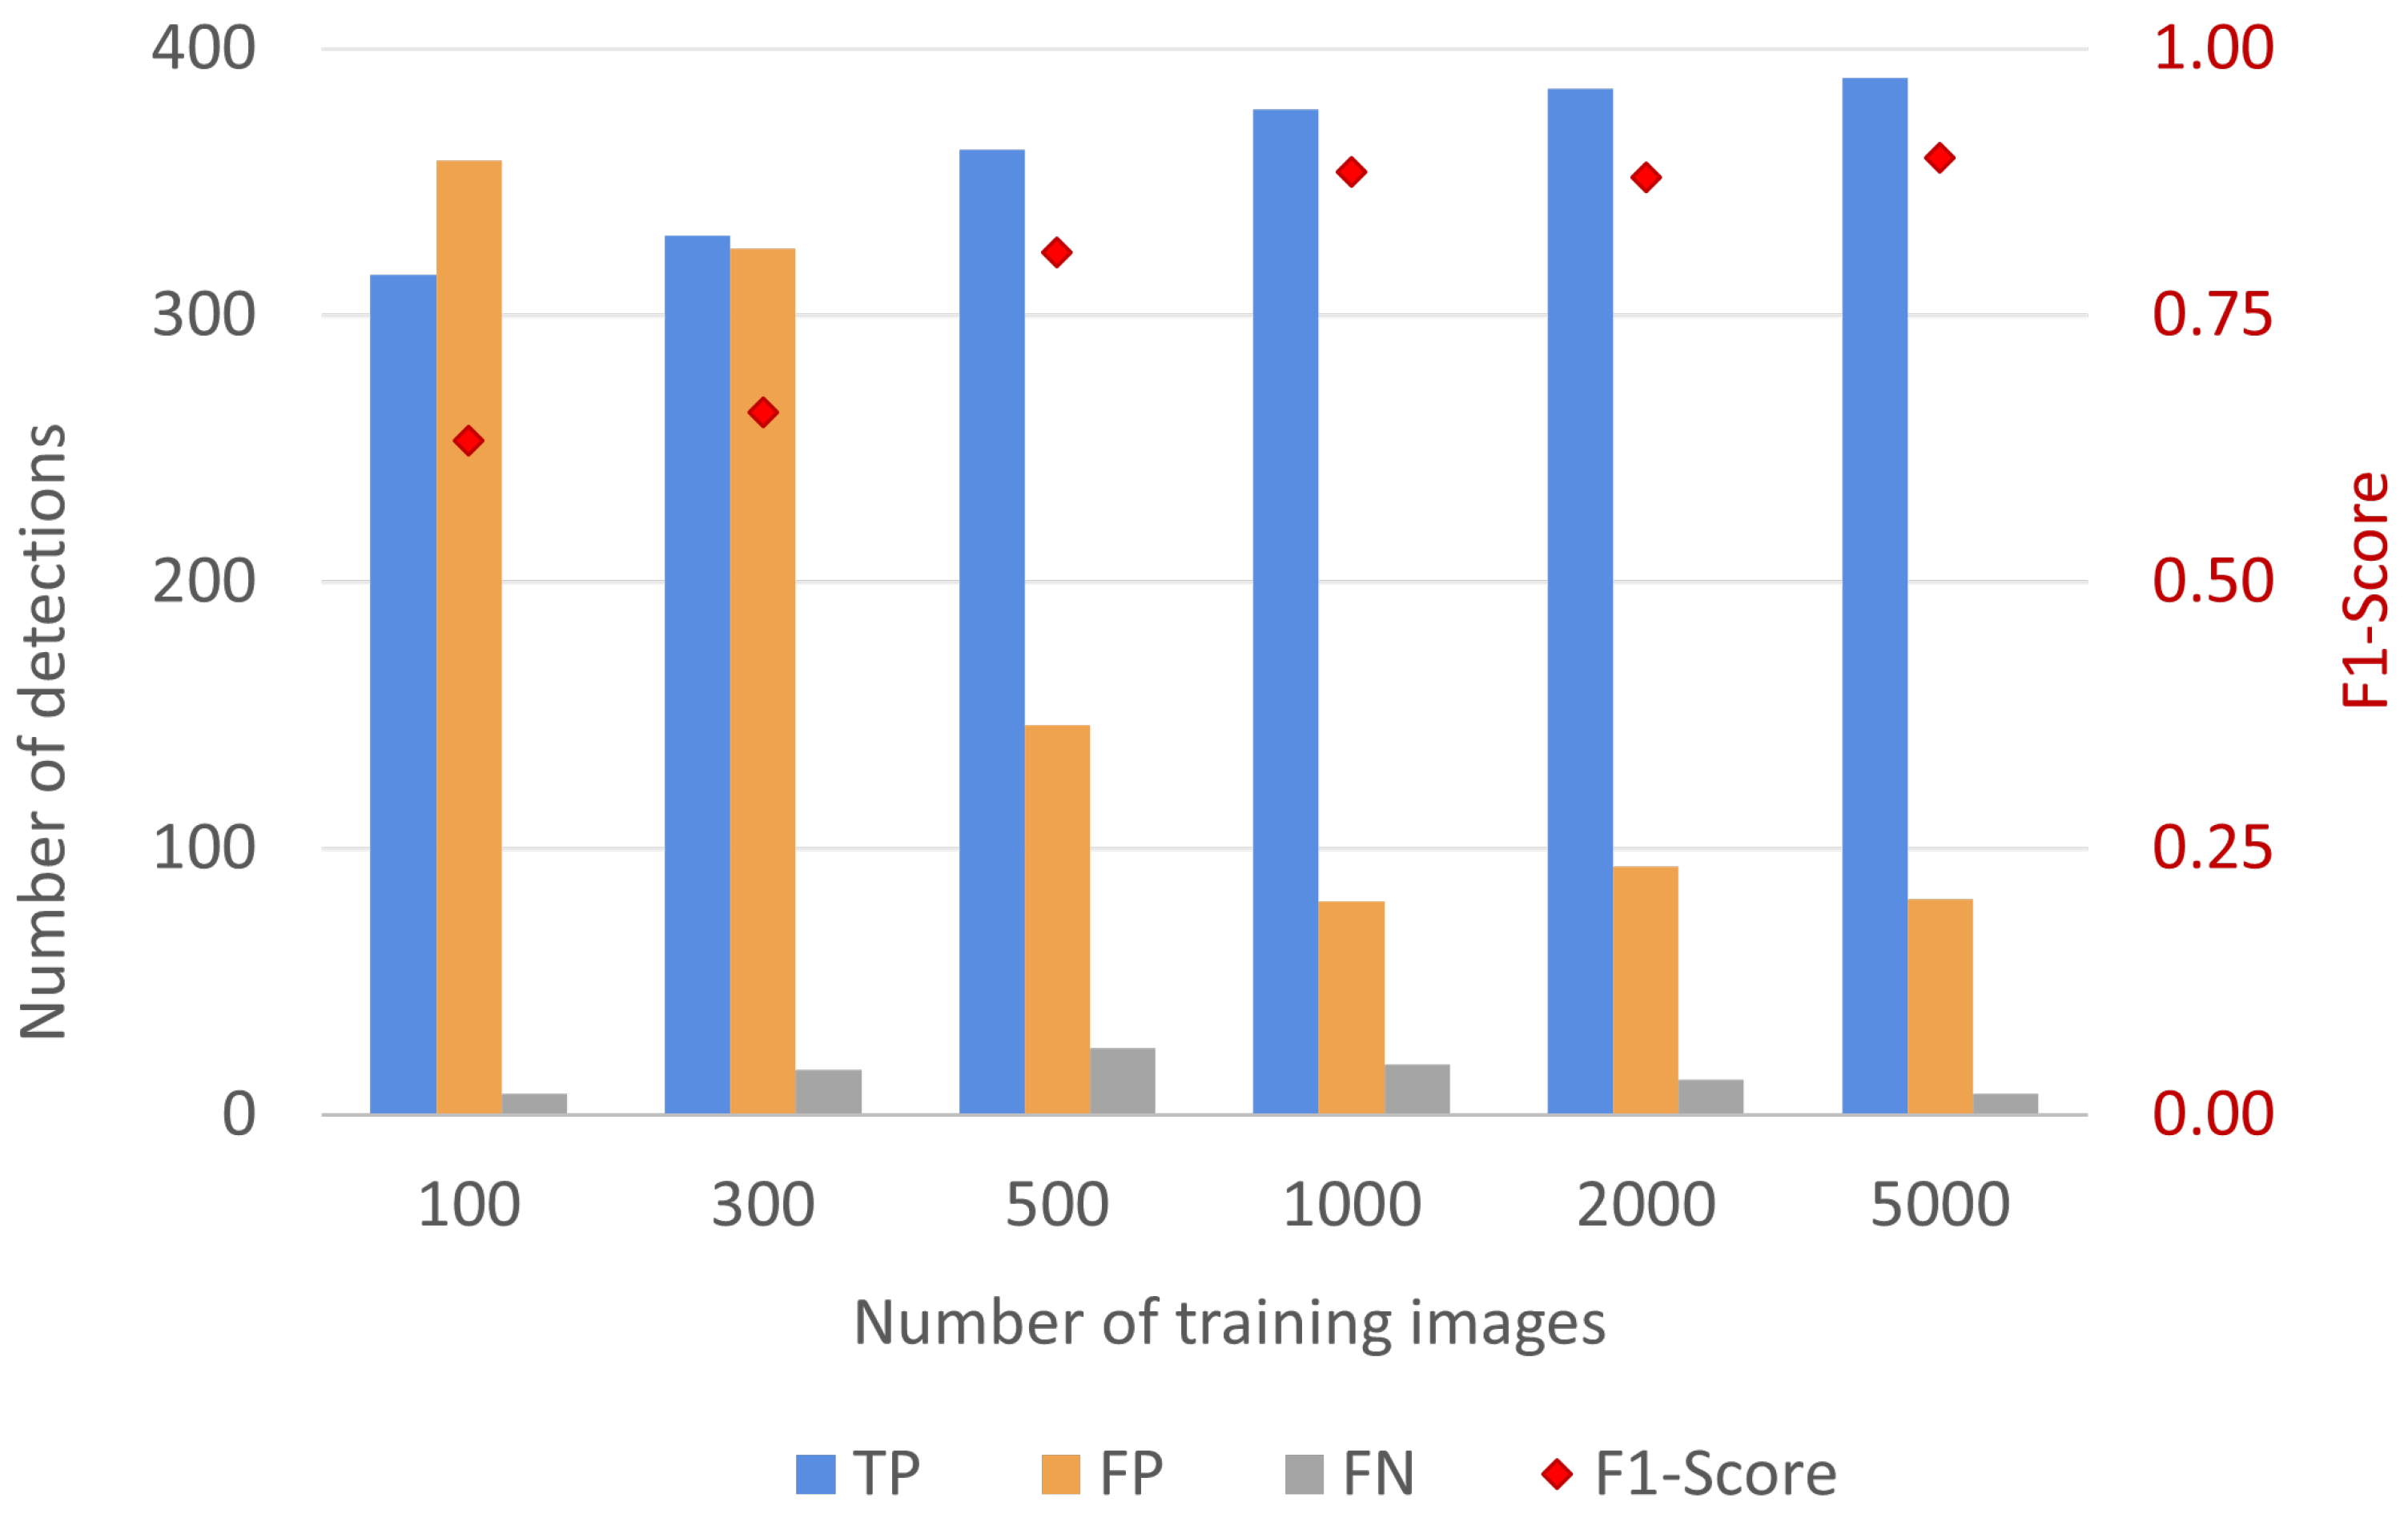
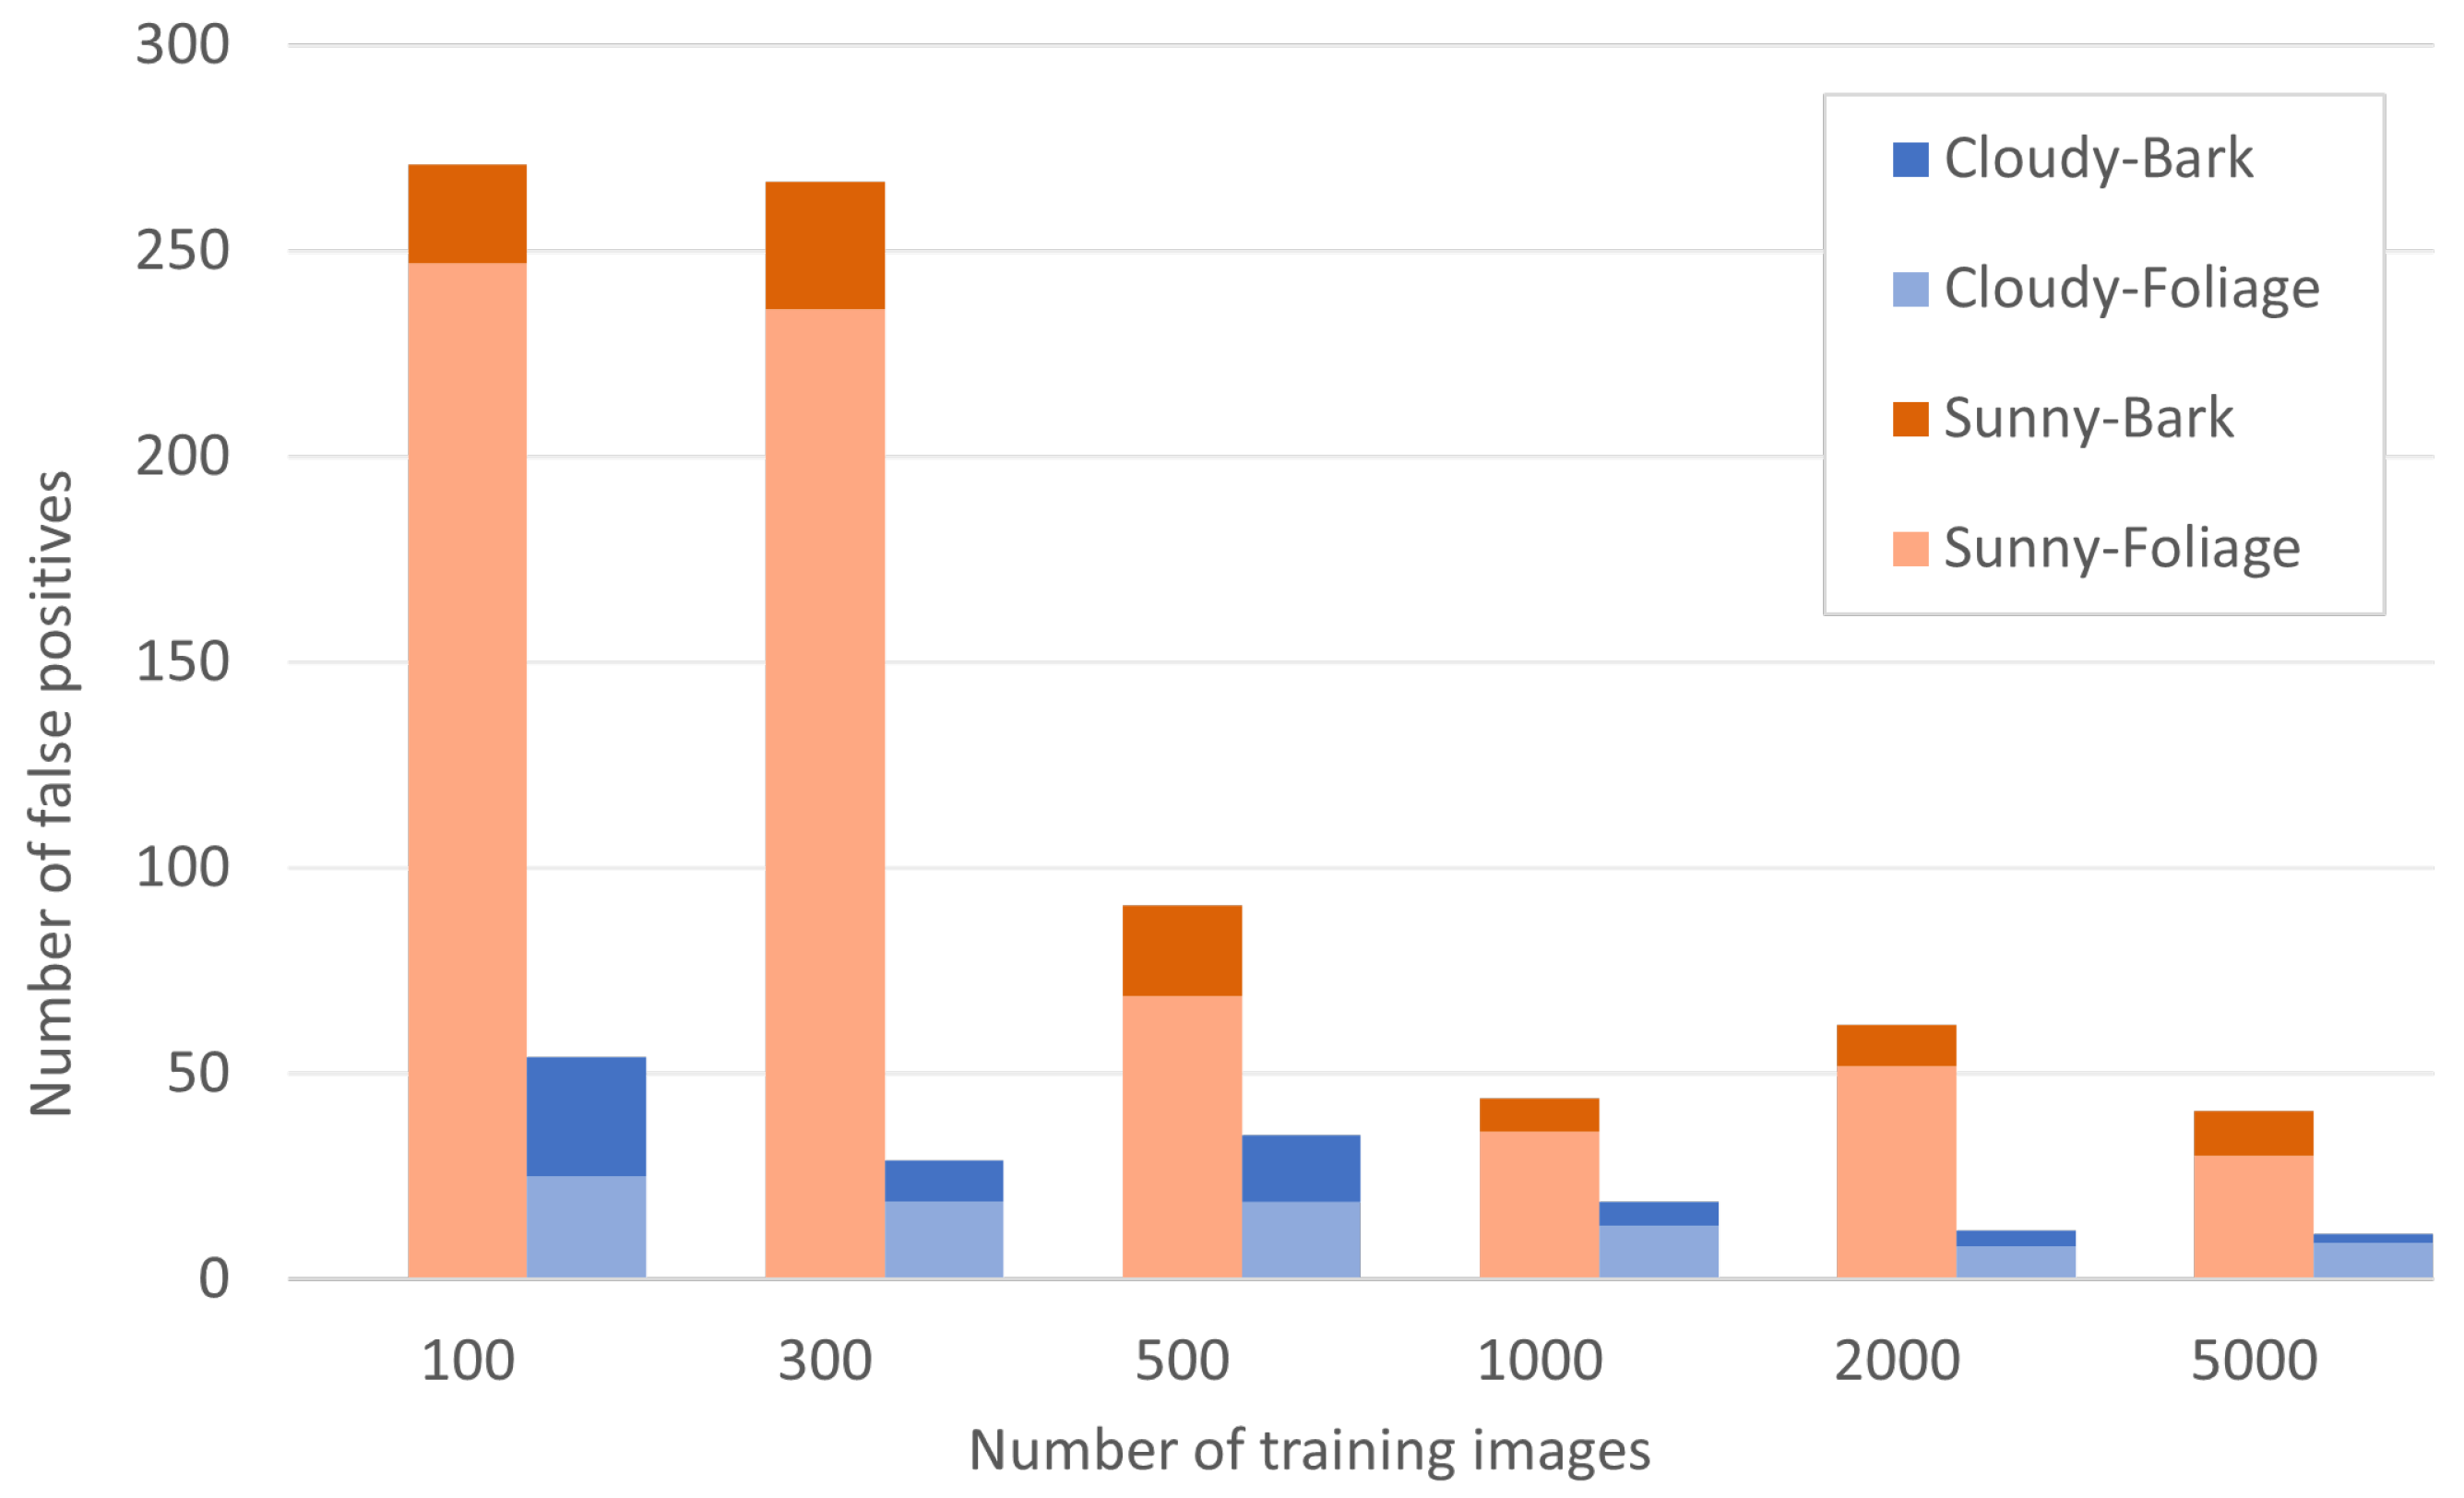
3.1. Effect of the Number of Input Training Images

The number of training images was a crucial parameter for an accurate detection model. The comparison in Figure 5 demonstrates the improvement in the model accuracy (F1-Score) with the increasing number of input training images. When the number of input training images was increased in steps from 100 to 5000, the model accuracy revealed a trend of rapid improvement in accuracy initially, followed by an inflection point and saturation of accuracy. With fewer than 1000 images, the model had a reduced F1-Score and an increase in false positives, indicating insufficient input training images to develop a robust model. When the model was trained with over 1000 training images, the model again showed marginal to no improvement in accuracy (F1-Score of 0.88, 0.88, and 0.90 for 1000, 2000, and 5000 training images, respectively), indicating that perhaps the model had been trained on sufficient images. The model trained with 1000 training images was of particular interest, as it indicated an optimal balance between model performance, the requisite amount of training data, and the computational burden to train the model with a larger number of images. This inflection point at 1000 input training images was also associated with a drastic decrease in false positive detections and an increase in true positive detections compared to the lower number of input images (Figure 5).

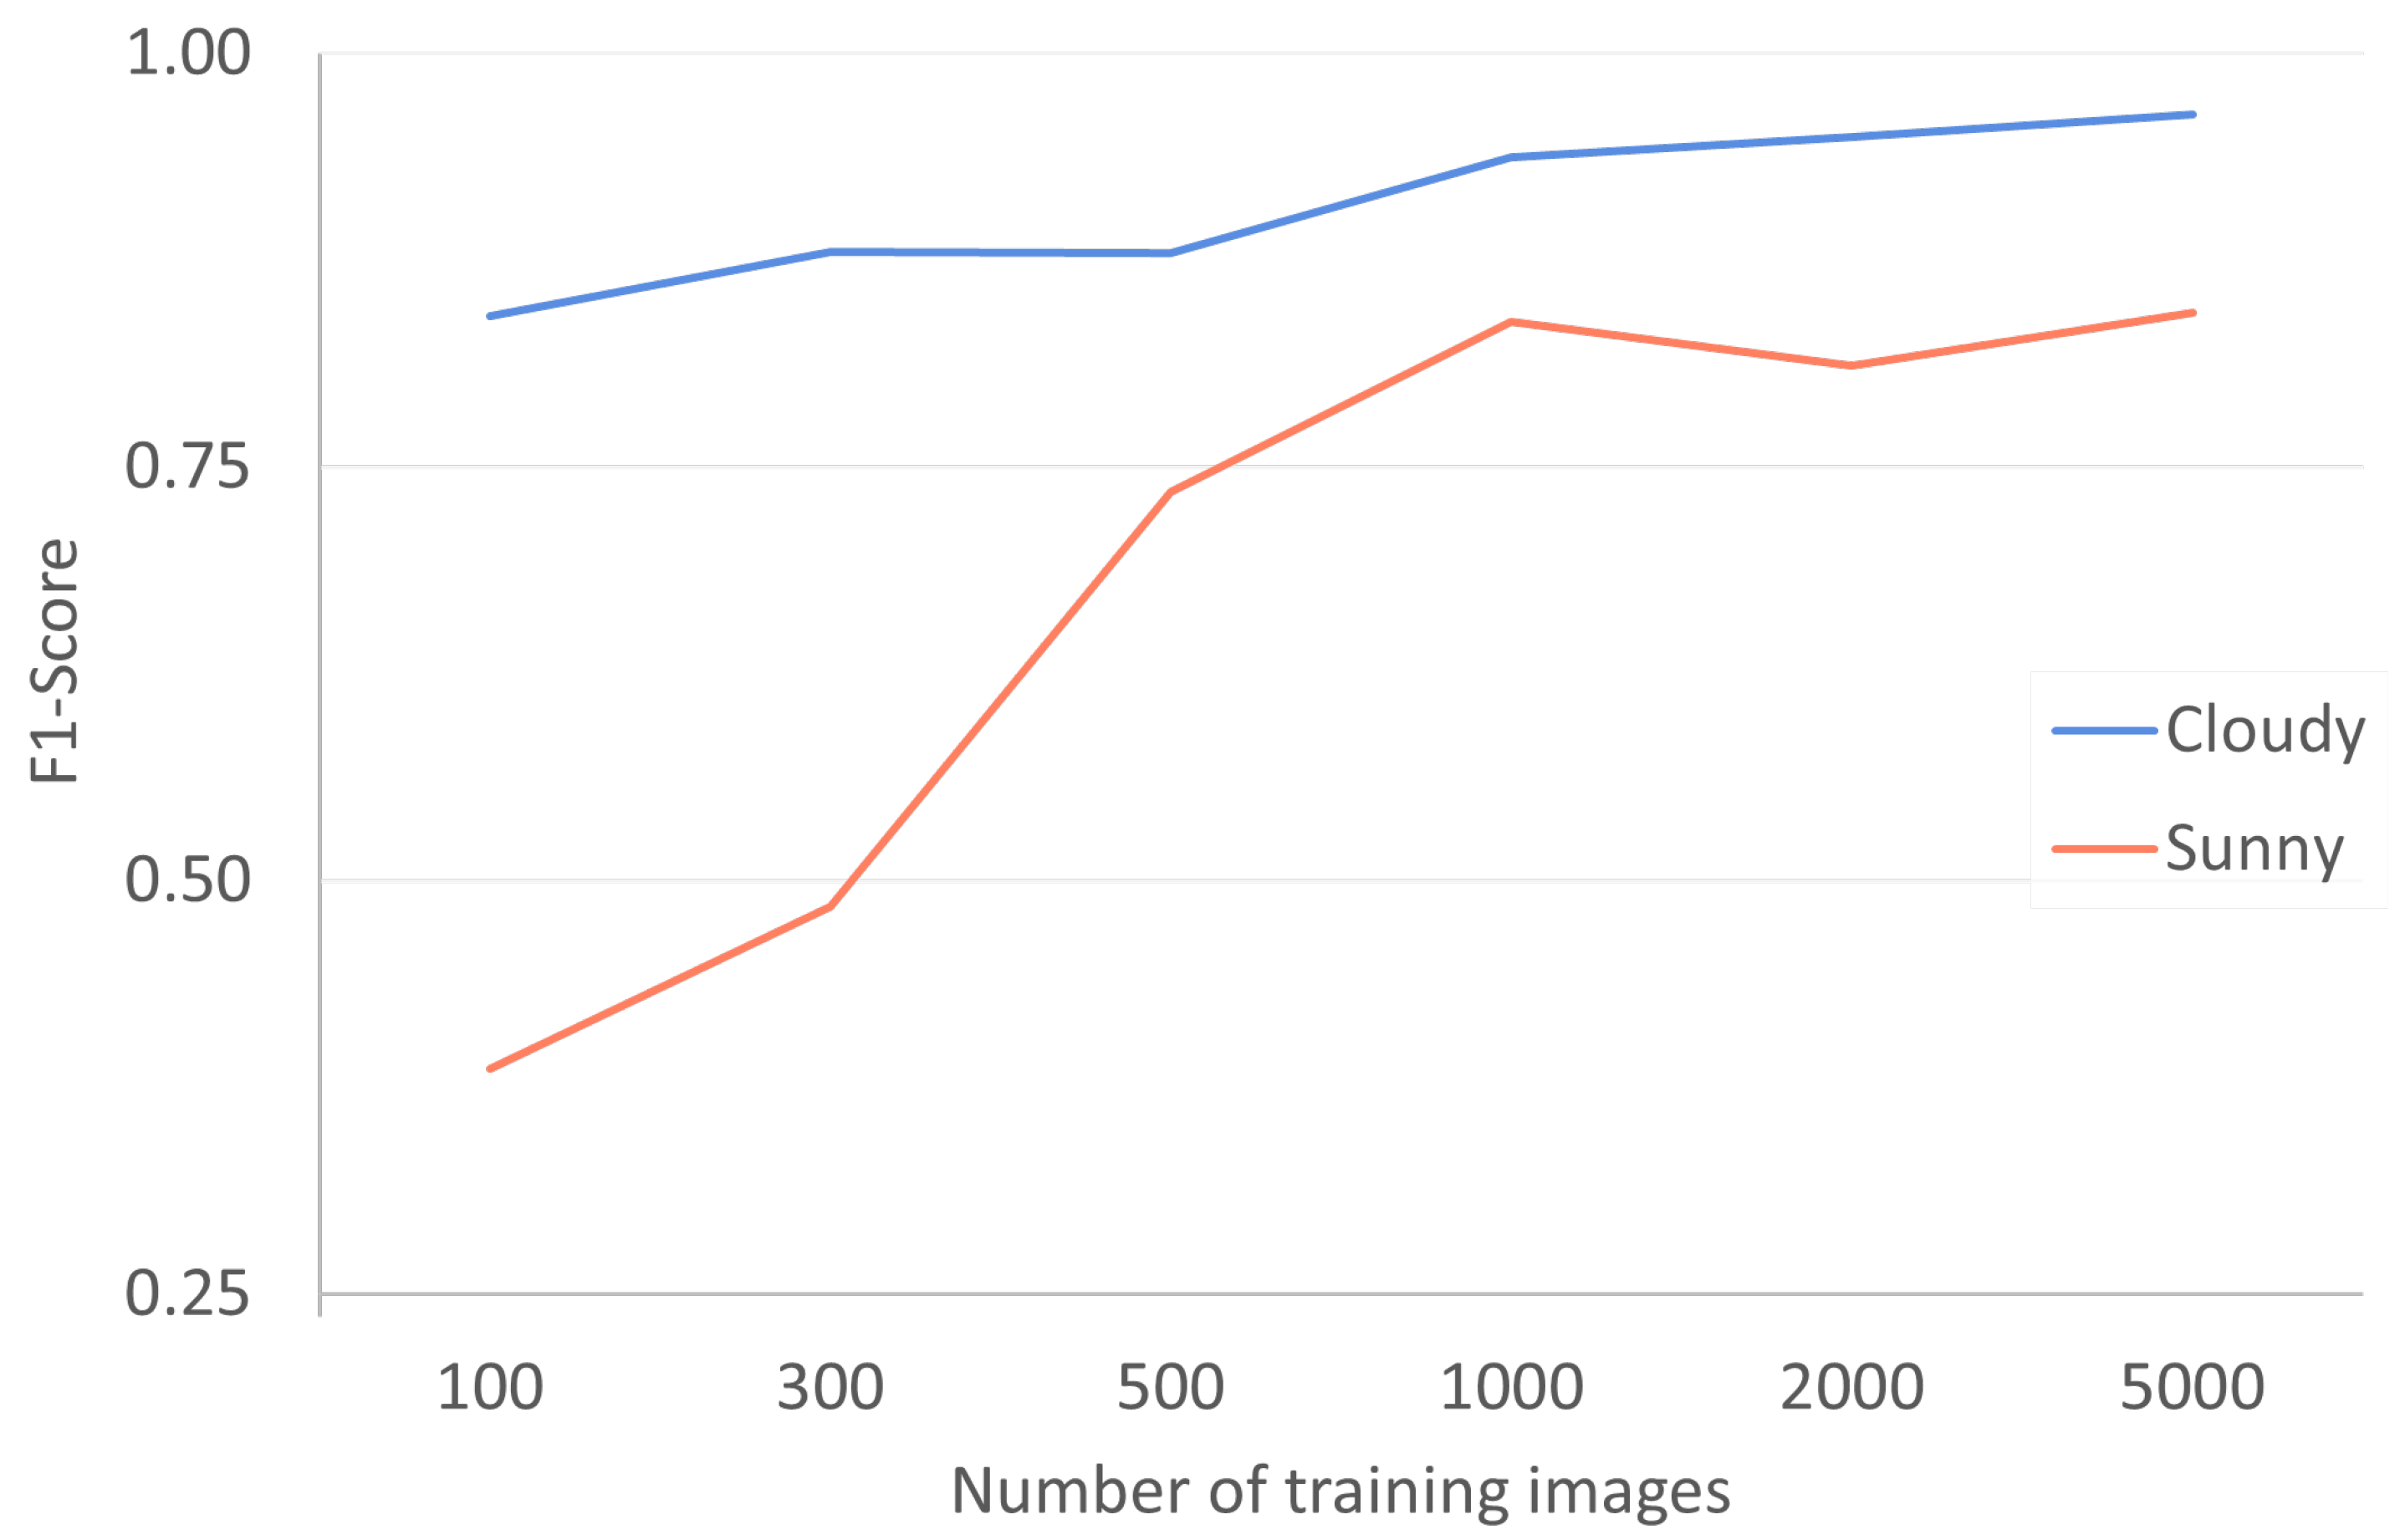
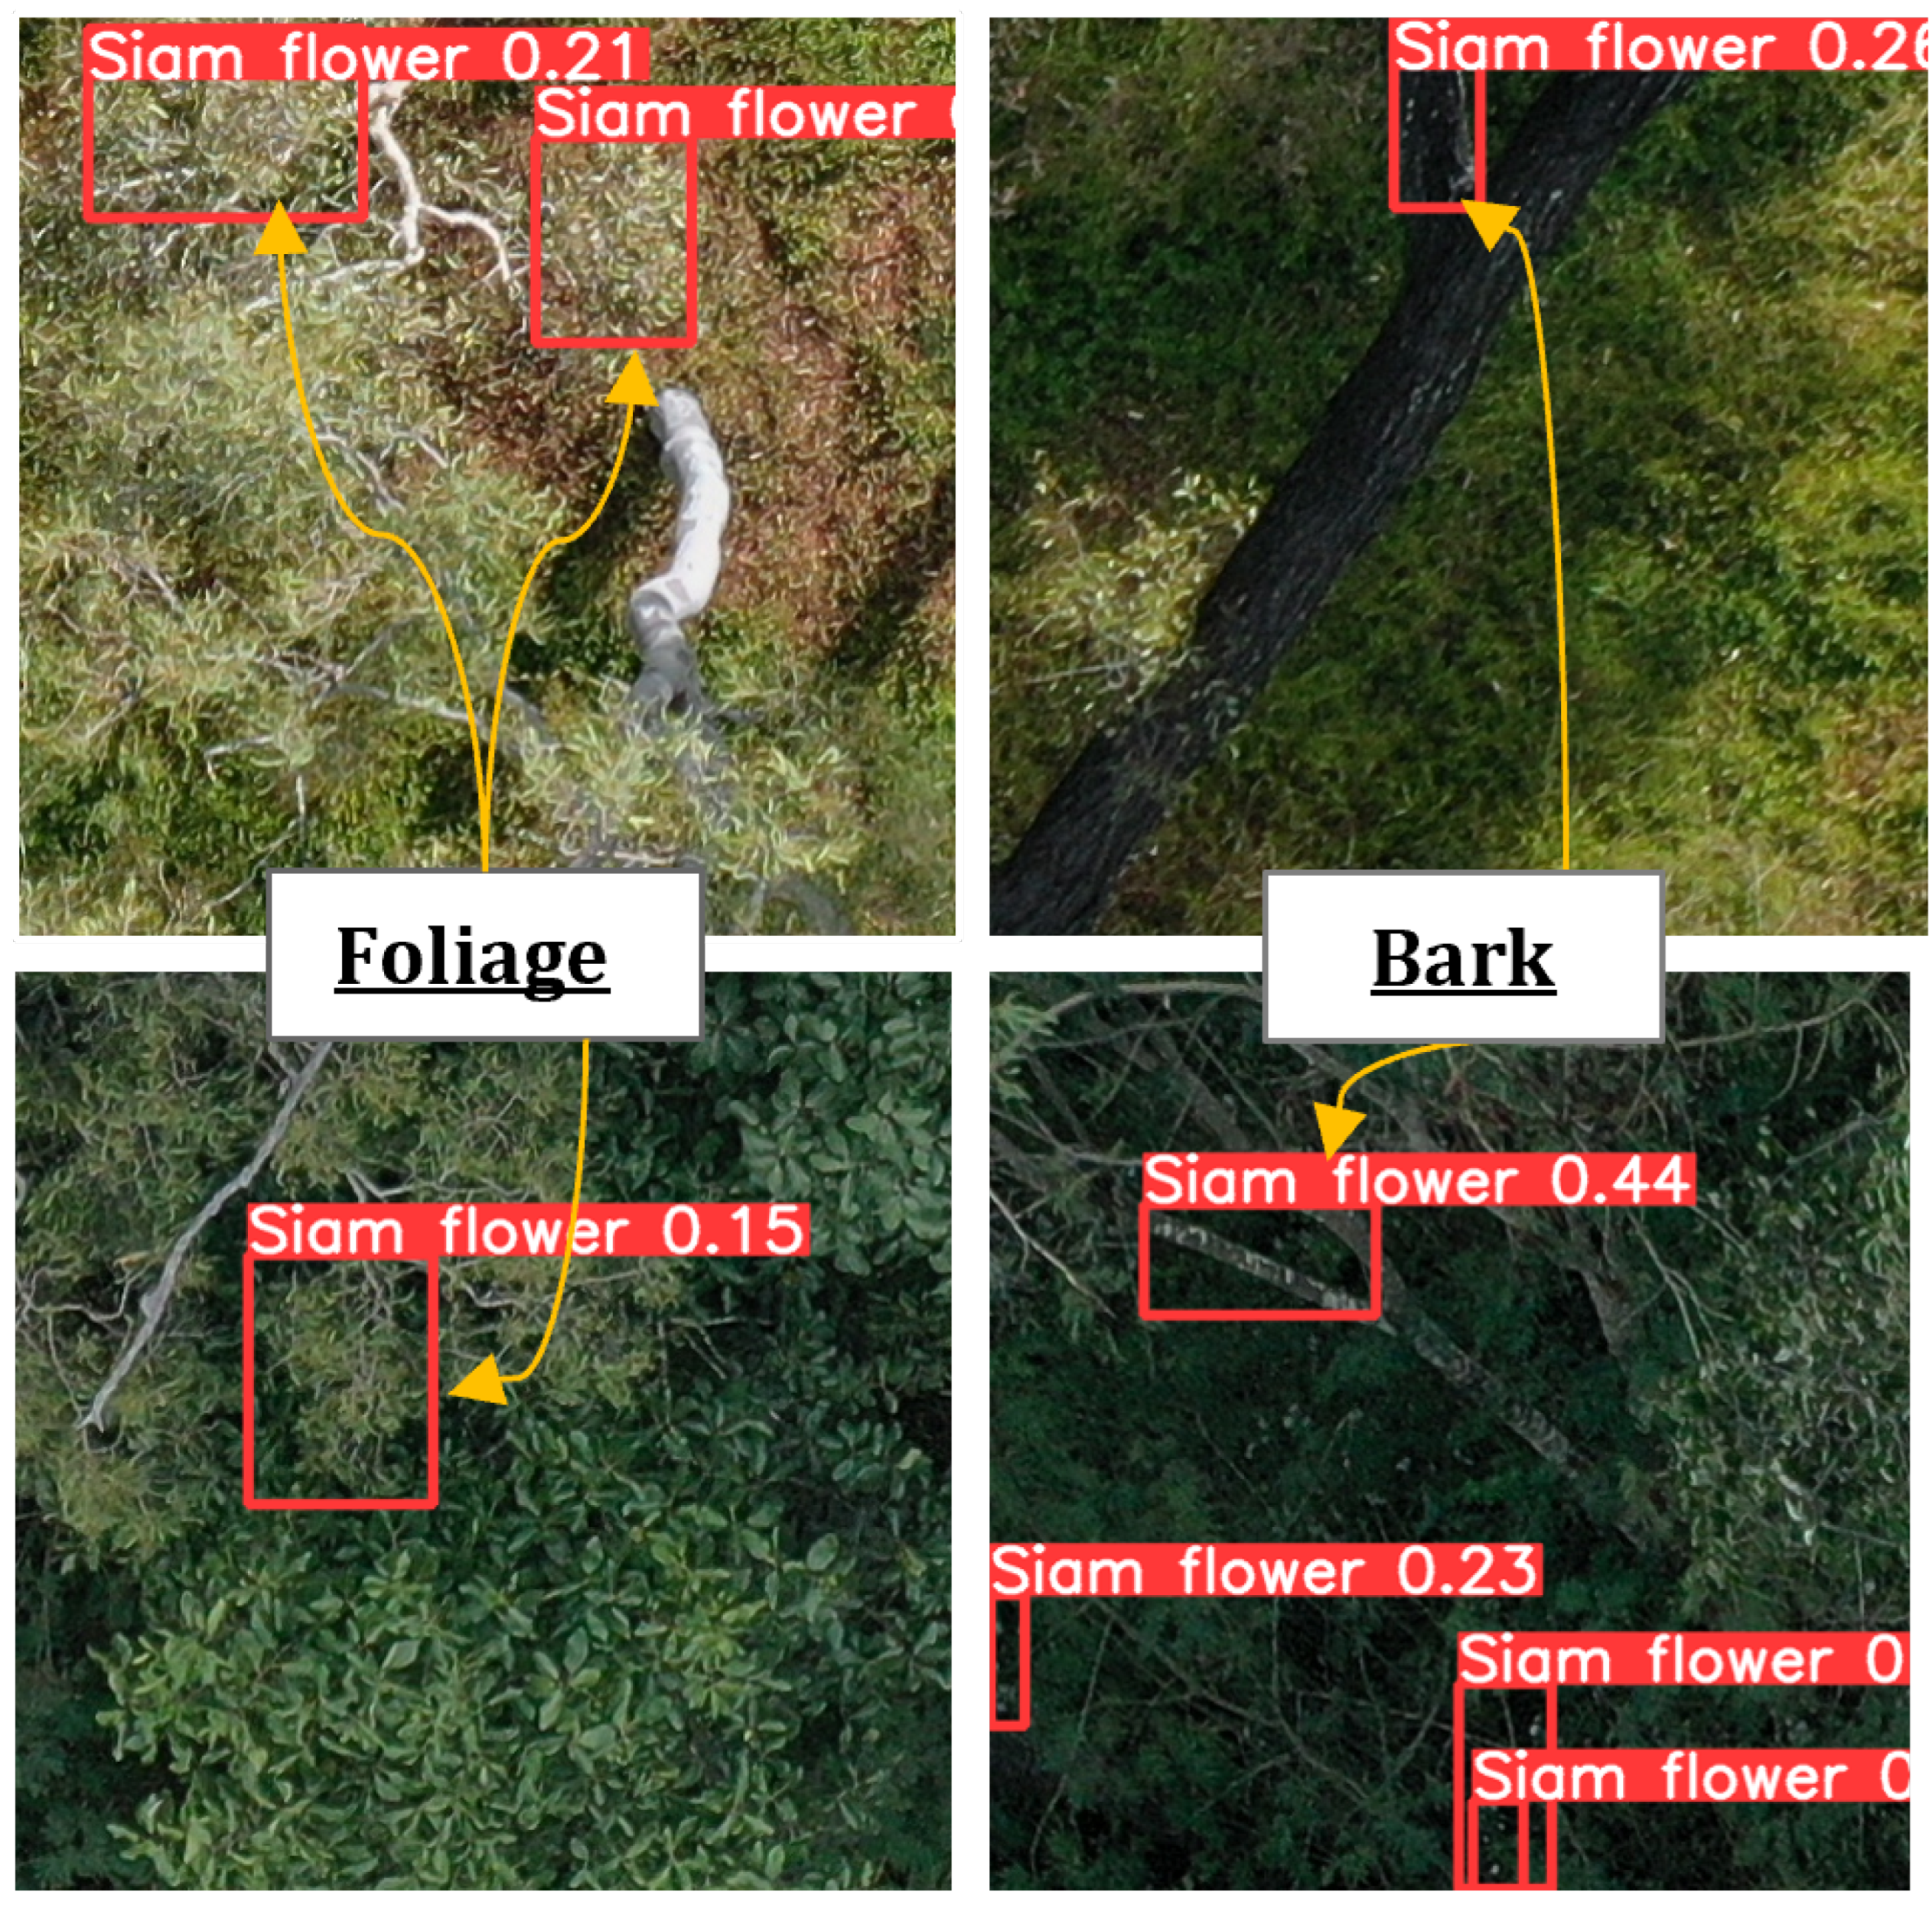
3.2. Effect of Solar Illumination

The YOLOv5s Siam weed detections were compared using images captured under sunny and overcast conditions. The validation image tiles (960 tiles) consisted of an equal proportion of images under sunny conditions (480 tiles) and overcast conditions (480 tiles). The effect of solar illumination was tested for all the models developed for the range of input training images, i.e., 100, 300, 500, 1000, 2000, and 5000. The models performed with relatively lower accuracy (F1-Score) when the images were captured under sunny conditions compared to the overcast conditions. In sunny conditions, the models performed relatively poorly, albeit with a performance improvement when the number of images increased from 100 to 1000. The F1-Score started from 0.39 for 100 input images and improved sharply to 0.84 with 1000 training images. Further increasing the number of training images did not further improve model performance; the highest F1-Score of 0.84 was reached with 1000 training images. Meanwhile, in cloudy conditions, the model performed with better accuracy even with a low number of training images (F1-Score of 0.84 for 100 images). The performance increased to an F1-Score of 0.90 for 1000 images and reached 0.96 when the input training images were increased to 5000 (Figure 6).
Under sunny conditions, the images generally had many more bright pixels, making it harder to separate Siam weed flowers from the highly reflective background features, potentially resulting in false positives. Under cloudy conditions, the Siam weed flowers appear in distinct contrast to the surrounding vegetation, enhancing detectability and reducing the rate of false positives (Figure 7). The sources of false positives in the detection model were primarily glints from foliage, followed by the white bark of some eucalypt trees, and occasional occurrences of twigs and sometimes white specks. There were also some false negatives where the detection model was unable to detect Siam weed flowers (see Figure 7 for some examples). It was frequently the case that when Siam weed was not detected, the images were overexposed, resulting in decreased contrast between the Siam weed flowers and the surrounding foliage.
The sources of false positives were classified as foliage (which mainly contained leaves in trees and grass) and bark (which contained bare branches and twigs), as illustrated in Figure 7. The false positives were also classified by image capture conditions—sunny or overcast. There was a notable reduction in false positives when the image capture conditions were overcast. In fact, false positives dropped by 80% from 271 to 54 for the worst model (a model developed using 100 image tiles as input training images) and by 73% from 41 to 11 for the best model (a model developed using 5000 image tiles as input training images) (see Figure 8). There were also some false positives originating from irregular pixels, which included a high reflection from pebbles, water, rocks, etc. However, the number of these irregularities was minor, accounting for less than 10% of total false positives. Foliage was the largest source of false positives for images under sunny conditions (82% on average), followed by bark (18% on average). It appears that sun glints and reflection from foliage can be confused with Siam weed flowers by the detection model in sunny conditions. Under cloudy conditions, the proportion of false positives from foliage was lower but remained the primary source of false positives (64% on average), being sometimes on par with the false positives from bark.

3.3. The Effect of Model Complexity

YOLOv5 offers different models based on complexity and size–small, medium, large, and extra-large. All results presented thus far have utilised the small model. Here, we investigate if switching to a larger model improves the model’s performance. We tested the performance of small, medium, large, and extra-large models when trained using 1000, 2000, and 5000 images to determine the effect of model size on Siam weed detection. The performance of each model was tested on the 960 image tiles using the same methods in the previous analyses.
In most cases, the larger models performed better than the smaller models, but there were exceptions to this trend (such as with the 1000 training image model). For the models trained using 1000 images, there was no improvement in model performance when switching to a larger model, as all models performed within an F1-Score of 0.88–0.89. For the models developed using 2000 input training images, there was a clear benefit in using a larger model, with consistent improvement in the F1-Score (0.87 for the small model and 0.91 for the extra-large model). The larger models performed better when trained with 5000 images, although there was a reversal trend for the medium model, which performed more poorly than the small model. Model accuracy was very consistent across all models investigated—with an accuracy (F1-Score) ranging from 0.86 to 0.92 (Figure 9). The YOLOv5X model trained with 5000 and 2000 images and the YOLOV5L model trained with 5000 images had the highest performance accuracy, with an F1-score of 0.91–0.92. While there was a benefit in using the YOLOv5X model trained with 5000 images, these findings also provide confidence that the YOLOV5S model trained on 1000 images performed relatively well compared to larger models with many more training images.

4. Discussion

In this study, we used drone-acquired RGB images to train a YOLOv5 model to detect Siam weed, an invasive species found in many warmer regions of the world. Our investigation focused on the importance of the number of input training images, the exposure of images due to of sunlight, and model complexity to develop an accurate model, with an overarching goal of practical deployment in the future. The results demonstrated that the YOLOv5 model can detect Siam weed with an accuracy (F1-Score is referred to as accuracy) exceeding 0.85. Notably, this accuracy was improved to over 0.95 by underexposing the images during data capture. These findings highlight the critical role that image quality, particularly exposure levels, plays in model performance.
The study also examined the effect of the number of training images on the model’s detection accuracy. As expected, the YOLOv5 model’s ability to detect Siam weed improved as the number of training images increased, which aligns with typical deep learning principles. However, this improvement plateaued beyond approximately 1000 image tiles, where additional images resulted in marginal gains. This plateau suggests that, beyond a certain point, the model has sufficiently learned the features necessary for accurate detection, making further training data less beneficial compared to the increased computational costs. The ability to achieve high accuracy with a relatively small number of images (in this case, approximately 1000) underscores the feasibility of using YOLO-type deep learning models to detect invasive species like Siam weed in natural landscapes. This efficiency is critical for practical applications where collecting and training detection models with large datasets can be resource intensive.
One of the key findings of this study is the substantial impact of image exposure on detection accuracy. False positives were identified as a major source of error, often resulting from small bright features in the images, such as reflections or brightly illuminated foliage being misclassified as Siam weed. These errors were particularly common in images captured under high solar illumination, which introduced numerous high-intensity bright spots. By reducing the image exposure during data capture, we minimised the occurrence of these false positives and improved the model’s accuracy. However, the reliance on overcast conditions for optimal image capture poses a potential limitation for real-world deployment, as consistent weather conditions cannot be guaranteed. This challenge could be mitigated through a combination of (a) capturing images during stable conditions, such as early morning or late afternoon—though further testing is needed to validate this approach—(b) adjusting the camera settings to capture underexposed images, and (c) applying image preprocessing techniques such as histogram equilisation or illumination correction to normalise image brightness. Saturated images severely hinder Siam weed detection, whereas underexposed images can be enhanced through contrast stretching to optimise detectability. Ensuring appropriate image capture conditions or exposure settings will help minimise false positives. Nonetheless, there will always be cases where canopy foliage may appear brighter than Siam weed flowers—such as when Siam weed flowers are in the shadow under the canopy of a large, fully illuminated tree. Implementing preprocessing techniques, such as visual or textural analysis to mask problematic areas, could also reduce false positives and enhance the model’s performance for large-scale landscape applications.
YOLO offers models at different complexity levels: small, medium, large, and extra-large. Our validation of YOLOv5 model variants revealed, as expected, an improvement in accuracy with the increase in model complexity, although there were some outliers. The accuracy (F1-Scores) remained within a narrow range of 0.86–0.92 for all model variants. For large-scale applications, such as catchment-scale surveys, deploying a smaller model with slightly lower accuracy may be more practical, reducing computational costs while still providing sufficient performance. Further accuracy gains could potentially be achieved by incorporating other factors, such as hyperparameter optimisation, image augmentation, ensemble learning, and other advanced training techniques [51,52]. Nevertheless, we found that a small model, combined with underexposed images, achieved an F1-score of 0.96, which we deemed sufficient for detecting Siam weed. While incorporating all possible optimisations, such as a large model, image augmentation, and underexposure, might further improve performance, this would increase computational demands.
The YOLOv5 models developed in this study focused on detecting Siam weed flowers, making them applicable primarily during the weed’s peak flowering period. Images captured outside the peak flowering period could result in poor performance, likely due to the high rate of false negatives, as the model is trained to detect the flowering weed. A model capable of detecting Siam weed in various phenological stages would be an ideal solution for land managers, allowing them to conduct surveys at a time of their choice. However, the detection of Siam weed outside of the flowering season was not explored in this study due to the time and resource constraints of conducting multitimepoint aerial and ground surveys. Developing such a model would be valuable for industry applications, enabling more flexible and timely weed management and encouraging wider adoption.
Our model trained using aerial images from the Townsville region, Australia, during the peak flowering period demonstrated detection across different landscapes (four study sites in close proximity). However, the model’s transferability to an entirely new bioregion with different environmental conditions remains unknown. Preliminary applications of the model to datasets from Magnetic Island, QLD and Darwin, NT revealed errors associated with specific landscape features, such as rocky terrain or dry vegetation, that differed notably from the training environment. While this study has not numerically quantified the cost of accuracy when transferring the model to a new geographic region, we would expect to see some drop in model performance. These results underscore the importance of developing robust models across various environmental conditions. To achieve this, future research should incorporate training data from a variety of landscapes to ensure that the model can recognise Siam weed in different backgrounds and ecological settings. Similarly, scalability to larger spatial extents, such as using aerial or satellite images, will require addressing challenges related to image resolution and computational capabilities. While drone-based imaging is practical for proof-of-concept studies, large-scale monitoring will benefit from integrating data from multiple sources, including higher-altitude aerial and satellite platforms. The detection model is hypothesised to lose some accuracy with the degradation in spatial resolution. Identifying an optimal compromise between the image resolution and model performance would help make the model broadly adoptable and deployable across large landscapes.
The YOLOv5 model was the state of the art (SOTA) in the YOLO family at the inception of this research. Since then, newer versions, such as YOLOv10, have been released, with more advanced models expected in the future. While upgrading to the latest SOTA model would likely enhance accuracy and inference performance, YOLOv5 was considered sufficient for this study, which primarily focused on the effects of the number of training images, solar illumination, and sources of false positives. It is important to note that other deep learning architectures, such as EfficientDet and Faster R-CNN, as well as traditional machine learning models like Random Forest, Support Vector Machines, and object-based image analysis, have also been successfully applied in vegetation and object detection tasks. These approaches could be explored in future studies for Siam weed detection, particularly in cases with specific feature requirements or limited computational resources. Additionally, few-shot learning offers a promising alternative to train model with limited number of images. By leveraging a small number of labelled examples, few-shot learning could enable rapid model training and adaptability to new contexts, which could be relevant specifically during transferability of the model to different geolocations or environments. The insights gained in this study—regarding image quantity, false positives, image exposure, and model complexity—are expected to be transferable to both future SOTA models and alternative detection methods, which will be considered during deployment of the technology.
Future research could explore incorporating training images from diverse geographic regions, optimising georeferencing techniques, and integrating aerial and satellite imagery—each essential for large-scale deployment of detection models for invasive species like Siam weed. The growing availability of aerial images, combined with advancements in computational power and machine learning, offers potential for expanding remote detection technologies, enabling more efficient detection, monitoring, and management of invasive species. Given the vast and often rugged landscapes across which Siam weed could spread, particularly in northern Australia, a multiscale approach is essential. Integrating data from drones, aerial and satellite imagery, ground observations, and potential seed dispersal models could greatly enhance predictive capabilities, enabling effective detection and management across large areas. Furthermore, the weed has the potential to affect vast landscapes across multiple jurisdictions, including Queensland, Northern Territory, and Western Australia. Adopting a FAIR (findable, accessible, interoperable, and reusable) framework for data and models could foster more robust collaboration between land managers, industry stakeholders, and research institutions towards co-developing a scalable model. Over time, integrating advanced technologies like artificial intelligence, cloud-based processing, and autonomous systems could transform invasive species monitoring and management across diverse ecosystems, presenting a more resilient, scalable solution to manage invasive species, including Siam weed.

5. Conclusions

In conclusion, our study demonstrates the effectiveness of utilising drone-acquired RGB images and the YOLO model for detecting invasive Siam weed in natural environments. We found that a model trained with approximately 1000 image tiles can achieve reliable detection with 0.88 F1-Score, which improved to over 0.95 with underexposed images. The analysis reveals that increasing the complexity of the YOLO model does not notably enhance detection performance. Key findings highlight the critical role of input training image quantity and quality, particularly the benefits of underexposed images to mitigate false positives caused by high solar illumination. These insights provide practical guidance for optimising training datasets and image capture conditions, contributing to a feasible and efficient tool for land managers to detect invasive species in natural landscapes. Despite the promising results, challenges remain in model transferability and scalability across diverse landscapes and larger spatial areas. Overall, our findings support the potential for widespread adoption of YOLO-based detection models in invasive species management, offering a cost-effective and accurate solution to aid land managers in controlling and mitigating the spread of Siam weed and similar invasive species. Future research should focus on enhancing model accuracy, transferability, and scalability, paving the way for more effective and widespread use of this technology in environmental management.

Author Contributions

Conceptualisation, D.G., L.E., D.L., T.W. and S.B.; Methodology development, D.G.; Processing and Validation, D.G.; Graphics, Z.M.; writing—original draft preparation, Z.M. and D.G.; writing—review and editing, D.G., Z.M., L.E., D.L., T.W. and S.B.; funding acquisition, D.G., L.E. and S.B. All authors have read and agreed to the published version of the manuscript.

Funding

This research was funded through a grant awarded to the Northern Territory Government, in collaboration with the Queensland Government, to ‘Advance the detection and management of Siam weed (Chromolaena odorata) in northern Australia’. Source funding provided by the Australian Government’s ‘Enhancing National Pest Animal and Weed Management–Federation Funding Agreement’.

Data Availability Statement

The datasets presented in this article are available on request via Deepak Gautam. Restrictions apply to the availability and use of some of these data for privacy reasons.

Acknowledgments

The authors would like to thank Linda Luck and Sasmita Ranabhat for research assistance in the early stage of the project, as well as Natalie Rossiter-Rachor, Phil Hickey, Renee Bartolo, David Green, Thomas Price, Shelley Inglis, Joshua Maeer, James Curie, Michelle Franklin, Roshna Rijal, Rob Cobon, Tony Salisbury, and Matt Tunstill for their involvement and contribution at various stages of the project. The authors also wish to extend their gratitude to the reviewers and editors for their invaluable time, comments and suggestions, which helped enhance the quality of this work.

Conflicts of Interest

Author David Loewensteiner was employed by the company EcOz Environmental Consulting. The remaining authors declare that the research was conducted in the absence of any commercial or financial relationships that could be construed as a potential conflict of interest.

References

  1. Panetta, F.D.; James, R.F. Weed control thresholds: A useful concept in natural ecosystems? Plant Prot. Q. 1999, 14, 68–76. [Google Scholar]
  2. Williams, J.A.; West, C.J. Environmental weeds in Australia and New Zealand: Issues and approaches to management. Austral Ecol. 2000, 25, 425–444. [Google Scholar] [CrossRef]
  3. Hulme, P.E. Beyond control: Wider implications for the management of biological invasions. J. Appl. Ecol. 2006, 43, 835–847. [Google Scholar] [CrossRef]
  4. Roslim, M.H.M.; Juraimi, A.S.; Che’Ya, N.N.; Sulaiman, N.; Manaf, M.N.H.A.; Ramli, Z.; Motmainna, M. Using Remote Sensing and an Unmanned Aerial System for Weed Management in Agricultural Crops: A Review. Agronomy 2021, 11, 1809. [Google Scholar] [CrossRef]
  5. Gašparović, M.; Zrinjski, M.; Barković, Đ.; Radočaj, D. An automatic method for weed mapping in oat fields based on UAV imagery. Comput. Electron. Agric. 2020, 173, 105385. [Google Scholar] [CrossRef]
  6. Rodriguez, R., III; Jenkins, D.; Leary, J.; Perroy, R. A direct geolocation method for aerial imaging surveys of invasive plants. Int. J. Environ. Sci. Technol. 2024, 21, 8375–8390. [Google Scholar] [CrossRef]
  7. Göktoǧan, A.H.; Sukkarieh, S.; Bryson, M.; Randle, J.; Lupton, T.; Hung, C. A Rotary-wing Unmanned Air Vehicle for Aquatic Weed Surveillance and Management. J. Intell. Robot. Syst. 2010, 57, 467–484. [Google Scholar] [CrossRef]
  8. Hamilton, M.; Matthews, R.; Caldwell, J. Needle in a haystack-detecting hawkweeds using drones. In Proceedings of the 21st Australasian Weeds Conference, Sydney, Australia, 9–13 September 2018; pp. 9–13. [Google Scholar]
  9. Jeffery, M. Eradication: Lessons learnt from 17 years of the National Siam Weed Eradication Program. In Proceedings of the Developing Solutions to Evolving Weed Problems—18th Australasian Weeds Conference, Melbourne, VIC, Australia, 8–11 October 2012; pp. 92–93. [Google Scholar]
  10. Zachariades, C.; Day, M.; Muniappan, R.; Reddy, G. Chromolaena odorata (L.) king and robinson (Asteraceae). In Biological Control of Tropical Weeds Using Arthropods; Cambridge University Press: Cambridge, UK, 2009; pp. 130–162. [Google Scholar]
  11. Price, T. Siam weed and the dust devils: Managing Chromolaena odorata in the Northern Territory. In Proceedings of the 22nd Australasian Weeds Conference (2022)—CAWS—Council of Australasian Weed Societies, North Adelaide, Australia, 25–29 September 2022. [Google Scholar]
  12. Waterhouse, B. Discovery of Chromolaena odorata in northern Queensland, Australia. Chromolaena odorata Newsl. 1994, 9, 1–2. [Google Scholar]
  13. te Beest, M.; Esler, K.J.; Richardson, D.M. Linking functional traits to impacts of invasive plant species: A case study. Plant Ecol. 2015, 216, 293–305. [Google Scholar] [CrossRef]
  14. Brooks, S.J.; Setter, S.D.; Gough, K.L. Siam weed disperal mechanisms. In Proceedings of the 14th Queensland Weed Symposium, Port Douglas, Australia, 4–7 December 2017. [Google Scholar]
  15. Kriticos, D.J.; Yonow, T.; McFadyen, R.E. The potential distribution of Chromolaena odorata (Siam weed) in relation to climate. Weed Res. 2005, 45, 246–254. [Google Scholar] [CrossRef]
  16. Torres-Sánchez, J.; López-Granados, F.; De Castro, A.I.; Peña-Barragán, J.M. Configuration and specifications of an unmanned aerial vehicle (UAV) for early site specific weed management. PLoS ONE 2013, 8, e58210. [Google Scholar] [CrossRef] [PubMed]
  17. Tamminga, A.; Hugenholtz, C.; Eaton, B.; Lapointe, M. Hyperspatial Remote Sensing of Channel Reach Morphology and Hydraulic Fish Habitat Using an Unmanned Aerial Vehicle (UAV): A First Assessment in the Context of River Research and Management. River Res. Appl. 2015, 31, 379–391. [Google Scholar] [CrossRef]
  18. Hassler, S.C.; Baysal-Gurel, F. Unmanned Aircraft System (UAS) Technology and Applications in Agriculture. Agronomy 2019, 9, 618. [Google Scholar] [CrossRef]
  19. Gautam, D.; Elliott, L.; Loewensteiner, D.; Whiteside, T.; Brooks, S.; Price, T.; Luck, L.; Inglis, S.; Maeer, J.A.; Green, D.; et al. Optimising methods to detect invasive Siam weed using drone-based image capture and machine learning in northern Australia. In Proceedings of the Locate Conference, Adelaide, Australia, 10–12 May 2023. [Google Scholar]
  20. Zhang, Y.; Gao, J.; Cen, H.; Lu, Y.; Yu, X.; He, Y.; Pieters, J.G. Automated spectral feature extraction from hyperspectral images to differentiate weedy rice and barnyard grass from a rice crop. Comput. Electron. Agric. 2019, 159, 42–49. [Google Scholar] [CrossRef]
  21. Su, W.H. Advanced Machine Learning in Point Spectroscopy, RGB- and Hyperspectral-Imaging for Automatic Discriminations of Crops and Weeds: A Review. Smart Cities 2020, 3, 767–792. [Google Scholar] [CrossRef]
  22. Zheng, H.; Cheng, T.; Li, D.; Zhou, X.; Yao, X.; Tian, Y.; Cao, W.; Zhu, Y. Evaluation of RGB, Color-Infrared and Multispectral Images Acquired from Unmanned Aerial Systems for the Estimation of Nitrogen Accumulation in Rice. Remote Sens. 2018, 10, 824. [Google Scholar] [CrossRef]
  23. Agarwal, R.; Hariharan, S.; Nagabhushana Rao, M.; Agarwal, A. Weed Identification using K-Means Clustering with Color Spaces Features in Multi-Spectral Images Taken by UAV. In Proceedings of the 2021 IEEE International Geoscience and Remote Sensing Symposium IGARSS, Brussels, Belgium, 11–16 July 2021; pp. 7047–7050. [Google Scholar] [CrossRef]
  24. Wu, H.; Liu, Q.; Liu, X. A Review on Deep Learning Approaches to Image Classification and Object Segmentation. Comput. Mater. Contin. 2019, 60, 575–597. [Google Scholar] [CrossRef]
  25. Al-Badri, A.H.; Ismail, N.A.; Al-Dulaimi, K.; Salman, G.A.; Khan, A.R.; Al-Sabaawi, A.; Salam, M.S.H. Classification of weed using machine learning techniques: A review—Challenges, current and future potential techniques. J. Plant Dis. Prot. 2022, 129, 745–768. [Google Scholar] [CrossRef]
  26. Pérez-Ortiz, M.; Gutiérrez, P.; Peña, J.; Torres-Sánchez, J.; López-Granados, F.; Hervás-Martínez, C. Machine learning paradigms for weed mapping via unmanned aerial vehicles. In Proceedings of the 2016 IEEE Symposium Series on Computational Intelligence (SSCI), Athens, Greece, 6–9 December 2016; pp. 1–8. [Google Scholar] [CrossRef]
  27. Alam, M.; Alam, M.S.; Roman, M.; Tufail, M.; Khan, M.U.; Khan, M.T. Real-Time Machine-Learning Based Crop/Weed Detection and Classification for Variable-Rate Spraying in Precision Agriculture. In Proceedings of the 2020 7th International Conference on Electrical and Electronics Engineering (ICEEE), Virtual, 14–16 April 2020; pp. 273–280. [Google Scholar] [CrossRef]
  28. Li, H.; Guo, C.; Yang, Z.; Chai, J.; Shi, Y.; Liu, J.; Zhang, K.; Liu, D.; Xu, Y. Design of field real-time target spraying system based on improved YOLOv5. Front. Plant Sci. 2022, 13, 1072631. [Google Scholar] [CrossRef]
  29. Wang, A.; Xu, Y.; Wei, X.; Cui, B. Semantic Segmentation of Crop and Weed using an Encoder-Decoder Network and Image Enhancement Method under Uncontrolled Outdoor Illumination. IEEE Access 2020, 8, 81724–81734. [Google Scholar] [CrossRef]
  30. Olsen, A.; Konovalov, D.A.; Philippa, B.; Ridd, P.; Wood, J.C.; Johns, J.; Banks, W.; Girgenti, B.; Kenny, O.; Whinney, J.; et al. DeepWeeds: A Multiclass Weed Species Image Dataset for Deep Learning. Sci. Rep. 2019, 9, 2058. [Google Scholar] [CrossRef]
  31. Jocher, G. YOLOv5 by Ultralytics. 2020. Available online: https://github.com/ultralytics/yolov5/blob/master/CITATION.cff (accessed on 25 December 2024).
  32. Kıvrak, O.; Gürbüz, M.Z. Performance Comparison of YOLOv3,YOLOv4 and YOLOv5 algorithms: A Case Study for Poultry Recognition. Avrupa Bilim Teknol. Derg. 2022, 38, 392–397. [Google Scholar] [CrossRef]
  33. Ammar, A.; Koubaa, A.; Benjdira, B. Deep-Learning-Based Automated Palm Tree Counting and Geolocation in Large Farms from Aerial Geotagged Images. Agronomy 2021, 11, 1458. [Google Scholar] [CrossRef]
  34. Murad, N.Y.; Mahmood, T.; Forkan, A.R.M.; Morshed, A.; Jayaraman, P.P.; Siddiqui, M.S. Weed detection using deep learning: A systematic literature review. Sensors 2023, 23, 3670. [Google Scholar] [CrossRef]
  35. Wu, Z.; Chen, Y.; Zhao, B.; Kang, X.; Ding, Y. Review of weed detection methods based on computer vision. Sensors 2021, 21, 3647. [Google Scholar] [CrossRef]
  36. Mawardi, Z.; Gautam, D.; Whiteside, T.G. Utilization of Remote Sensing Dataset and a Deep Learning Object Detection Model to Map Siam Weed Infestations. IEEE J. Sel. Top. Appl. Earth Obs. Remote Sens. 2024, 17, 18939–18948. [Google Scholar] [CrossRef]
  37. Amarasingam, N.; Kelly, J.E.; Sandino, J.; Hamilton, M.; Gonzalez, F.; Dehaan, R.L.; Zheng, L.; Cherry, H. Bitou bush detection and mapping using UAV-based multispectral and hyperspectral imagery and artificial intelligence. Remote Sens. Appl. Soc. Environ. 2024, 34, 101151. [Google Scholar] [CrossRef]
  38. Pham, D.; Gautam, D.; Sheffield, K. Classifying Serrated Tussock Cover from Aerial Imagery Using RGB Bands, RGB Indices, and Texture Features. Remote Sens. 2024, 16, 4538. [Google Scholar] [CrossRef]
  39. Elfatma, O.; Santi, I.S.; Kurniawan, I.; Setyawan, H.; Aji, W.A.; Mahendra; Syahputra, B.; Febrianti, I.; Ratmallah, D. Small Format Aerial Photography to Control Chromolaena odorata Weed. In Proceedings of the International Conference on Innovations in Social Sciences Education and Engineering, Bandung, Indonesia, 8 July 2023; Volume 3, p. 077. [Google Scholar]
  40. Kishore, B.S.P.C.; Kumar, A.; Saikia, P.; Lele, N.; Srivastava, P.; Pulla, S.; Suresh, H.; Kumar Bhattarcharya, B.; Latif Khan, M.; Sukumar, R. Mapping of understorey invasive plant species clusters of Lantana camara and Chromolaena odorata using airborne hyperspectral remote sensing. Adv. Space Res. 2024, 73, 1379–1396. [Google Scholar] [CrossRef]
  41. Saleem, M.H.; Potgieter, J.; Arif, K.M. Weed Detection by Faster RCNN Model: An Enhanced Anchor Box Approach. Agronomy 2022, 12, 1580. [Google Scholar] [CrossRef]
  42. Hasan, A.S.M.M.; Diepeveen, D.; Laga, H.; Jones, M.G.K.; Sohel, F. Image patch-based deep learning approach for crop and weed recognition. Ecol. Inform. 2023, 78, 102361. [Google Scholar] [CrossRef]
  43. Maher, P.; Vanderwoude, C.; Scanlan, J.; Davis, B.; Funkhouser, S. Planning and undertaking a national delimiting survey for Chromolaena odorata. In Proceedings of the Fifteenth Australasian Weeds Conference, Adelaide, Australia, 24–28 September 2006. [Google Scholar]
  44. Redmon, J. You only look once: Unified, real-time object detection. In Proceedings of the IEEE Conference on Computer Vision and Pattern Recognition, Las Vegas, NV, USA, 27–30 June 2016. [Google Scholar]
  45. Jiang, P.; Ergu, D.; Liu, F.; Cai, Y.; Ma, B. A Review of Yolo algorithm developments. Procedia Comput. Sci. 2022, 199, 1066–1073. [Google Scholar] [CrossRef]
  46. Jin, X.; Sun, Y.; Che, J.; Bagavathiannan, M.; Yu, J.; Chen, Y. A novel deep learning-based method for detection of weeds in vegetables. Pest Manag. Sci. 2022, 78, 1861–1869. [Google Scholar] [CrossRef]
  47. Dang, F.; Chen, D.; Lu, Y.; Li, Z. YOLOWeeds: A novel benchmark of YOLO object detectors for weed detection in cotton production systems. Comput. Electron. Agric. 2022, 205, 107655. [Google Scholar] [CrossRef]
  48. Chen, J.; Wang, H.; Zhang, H.; Luo, T.; Wei, D.; Long, T.; Wang, Z. Weed detection in sesame fields using a YOLO model with an enhanced attention mechanism and feature fusion. Comput. Electron. Agric. 2022, 202, 107412. [Google Scholar] [CrossRef]
  49. Pei, H.; Sun, Y.; Huang, H.; Zhang, W.; Sheng, J.; Zhang, Z. Weed detection in maize fields by UAV images based on crop row preprocessing and improved YOLOv4. Agriculture 2022, 12, 975. [Google Scholar] [CrossRef]
  50. Alexandrova, S.; Tatlock, Z.; Cakmak, M. RoboFlow: A flow-based visual programming language for mobile manipulation tasks. In Proceedings of the 2015 IEEE International Conference on Robotics and Automation (ICRA), Seattle, WA, USA, 26–30 May 2015; pp. 5537–5544. [Google Scholar] [CrossRef]
  51. Czymmek, V.; Harders, L.O.; Knoll, F.J.; Hussmann, S. Vision-based deep learning approach for real-time detection of weeds in organic farming. In Proceedings of the 2019 IEEE International Instrumentation and Measurement Technology Conference (I2MTC), Auckland, New Zealand, 20–23 May 2019; pp. 1–5. [Google Scholar]
  52. Su, D.; Kong, H.; Qiao, Y.; Sukkarieh, S. Data augmentation for deep learning based semantic segmentation and crop-weed classification in agricultural robotics. Comput. Electron. Agric. 2021, 190, 106418. [Google Scholar] [CrossRef]
Figure 1. The project investigates four sites with known Siam weed records. These sites are located within the Townsville region of Queensland, Australia.
Remotesensing 17 00120 g001
Figure 2. An example of representative image dataset captured during the overcast (a) and sunny conditions (b). The images were roughly annotated using red ovals to highlight presense of Siam weed.
Remotesensing 17 00120 g002
Figure 3. The conceptualisation of true positives and false positives at image tile level during the independent validation. Examples show scenarios of four image tiles: (a) a true positive detection tile, (b) false positive detection tile, (c) detection tile classified as true positive by majority despite some true negatives, and (d) detection tile classified as false positive by majority despite a true positive detection.
Remotesensing 17 00120 g003
Figure 4. YOLOv5 Siam weed detections from the UAV images. The red bounding box represents the extent, the values represent the model’s confidence for each detection, and yellow bounding box represents authors’ annotation for comparison. The panels show (a) true positive tile in overcast conditions, (b) true positive tile in sunny conditions, (c) false positive tile, and (d) false negative tile.
Remotesensing 17 00120 g004
Figure 5. The YOLOv5s model performance based on the detection counts and accuracy metric against the training size. The detection counts comprise the TP, FP and FN, whereas the F1-Score is used as a balanced metric to measure the models’ performances.
Remotesensing 17 00120 g005
Figure 6. Graph showing the YOLOv5s detection performance on a sunny image dataset (red) and an overcast image dataset (blue). The model performance is illustrated with the accuracy metric F1-Score.
Remotesensing 17 00120 g006
Figure 7. Example image tiles showing the most common sources of false positives: foliage on left column and bark on right column. The red boxes are Siam weed detections by YOLOv5, and the yellow arrows indicate the false positives validated by the authors.
Remotesensing 17 00120 g007
Figure 8. A bar chart showing the identified landscape features contributing to the false positive detections of the YOLOv5s models under the influence of solar illumination.
Remotesensing 17 00120 g008
Figure 9. YOLOv5 models’ performances against model complexities at different sizes of training images. Training sizes 1000, 2000, and 5000 are used where training size no longer affects the model’s detections to demonstrate the underlying effect of model complexity on the model’s detections [y axis start at 0.75].
Remotesensing 17 00120 g009
Table 1. The cloud cover (okta) and wind speed (m/s) from the Townsville Aero station (032040) during the data capture campaign. Note the value presented is for 9 AM–3 PM observation.
DateCloud Cover [okta]Wind Speed [m/s]
21 June0–07–19
22 June0–10–28
23 June1–015–30
24 June8–811–13
25 June0–57–22
Disclaimer/Publisher’s Note: The statements, opinions and data contained in all publications are solely those of the individual author(s) and contributor(s) and not of MDPI and/or the editor(s). MDPI and/or the editor(s) disclaim responsibility for any injury to people or property resulting from any ideas, methods, instructions or products referred to in the content.

