Abstract
This work investigates the ionospheric response to the March 2023 geomagnetic storm over American and Asian sectors from total electron content (TEC), rate of TEC index, ionospheric heights, Swarm plasma density, radio occultation profiles of Formosat-7/Cosmic-2 (F7/C2), Fabry-Perot interferometer driven neutral winds, and E region electric field. During the storm’s main phase, post-sunset equatorial plasma bubbles (EPBs) extend to higher latitudes in the western American longitudes, showing significant longitudinal differences in the American sector. Over the Indian longitudes, suppression of post-sunset irregularities is observed, attributed to the westward prompt penetration electric field (PPEF). At the early recovery phase, the presence of post-midnight/near-sunrise EPBs till post-sunrise hours in the American sector is associated with the disturbance of dynamo-electric fields (DDEF). Additionally, a strong consistency between F7/C2 derived amplitude scintillation (S4) ≥ 0.5 and EPB occurrences is observed. Furthermore, a strong eastward electric field induced an increase in daytime TEC beyond the equatorial ionization anomaly crest in the American region, which occurred during the storm’s main phase. Both the Asian and American sectors exhibit negative ionospheric storms and inhibition of ionospheric irregularities at the recovery phase, which is dominated by the disturbance dynamo effect due to equatorward neutral winds. A slight increase in TEC in the Asian sector during the recovery phase could be explained by the combined effect of DDEF and thermospheric composition change. Overall, storm-time ionospheric variations are controlled by the combined effects of PPEF and DDEF. This study may further contribute to understanding the ionospheric responses under the influence of storm-phase and LT-dependent electric fields.
1. Introduction
Ionospheric responses to a geomagnetic storm are discussed in terms of various effects and drivers. Strong geomagnetic storms (−200 nT < Dst < −100 nT) [1] associated with coronal Mass Ejections (CMEs) cause massive perturbations in the Earth’s magnetosphere due to the interaction of energetic solar wind particles and Earth’s magnetic field. In response to the increased geomagnetic activity, ionospheric irregularities/disturbances are observed at different latitudes and longitudes. Storm-time ionospheric variations are significantly controlled by the distinct geomagnetic storm-induced electric fields [2]. During the southward orientation of the interplanetary magnetic field north–south component (IMF-Bz), prompt penetration electric field (PPEF) injected to high latitudes from interplanetary medium penetrates to equatorial latitudes causing ionospheric changes [3,4]. The PPEF is eastward/westward during day/night hours and more dominant during the initial and early main phases of the storm [5,6]. Later, a few hours after the commencement of the main phase, both PPEF and DDEF are observed to be coexistent at the equatorial latitudes [7]; however, DDEF has a prevailing role in the later stages of the storm. The polarity of DDEF is opposite to PPEF; nonetheless, in the presence of northward IMF-Bz (over-shielding) conditions, prompt electric fields reverse their polarity to align with DDEF [8]. Moreover, DDEF is often associated with the disturbed neutral winds that emerged as a result of enhanced energy deposition due to high latitude heating [9,10].
One of the most important pre-requisites to regulate low-latitude ionospheric irregularities is the variation in the growth rate of Rayleigh–Taylor (R-T) instability [11]. Abdu [12] reported that the growth rate of R-T instability is enhanced/decreased due to the variations in equatorial E region electric fields during different phases of the geomagnetic storms. The enhanced pre-sunset eastward electric fields play a major role in the uplifting of ionospheric plasma, instigating (increasing ionospheric heights, hmF2) the formation of post-sunset equatorial plasma bubbles (EPBs) reaching up to higher latitudes ([13], and references therein). Although, during the high solar activity periods and equinox season, post-sunset EPBs are common in the American and Asian sectors [14,15,16], nevertheless, the irregularity is confined to equatorial latitudes under normal conditions [13]. Similarly, the post-sunset irregularities can be suppressed or inhibited during the geomagnetic storms owing to the westward PPEF and DDEF acting at night and daytime, respectively [12,17]. Moreover, the formation of post-midnight or near-sunrise equatorial spread-F (ESF) or EPBs during geomagnetic storms is not common [13]. Several studies suggested that the EPBs observed at dawn or post-sunrise periods are the remnant of post-sunset EPBs [18,19,20]. Contrary to this, it is also reported that the pre-reversal enhancement (PRE) of the ionospheric F layer peak under the influence of nighttime eastward DDEF triggered the generation/enhancement of irregularities [12,21,22,23]. The ionospheric irregularities (or EPBs/ESF) during geomagnetic storms cause massive phase fluctuations and amplitude scintillations impacting satellite signals [24,25]. The cycle slip and loss-of-lock to the Global Navigation Satellite System (GNSS) severely affect the positioning and navigation services (ref. [13], and references therein).
The negative or positive ionospheric storm-time variations are also documented during different phases of geomagnetic storms. The dayside dominant PPEF shifts the equatorial ionization anomaly (EIA) crests to higher latitude; conversely, DDEF or prompt electric field under over-shielding conditions ceases the fountain effect due to downward drifts [26,27,28]. Moreover, positive storm effect at equatorial and negative ionospheric disturbances at low-mid latitudes are also attributed to the variations in thermospheric O/N2 [29,30]. Enhanced particle precipitation at polar latitudes due to auroral heating creates a pressure gradient from pole to equator with a neutral density uplift [31].
Recent studies have incorporated multi-instrument observations to analyze the ionospheric irregularities induced by geomagnetic storms. The use of ground- and space-based observables can cross-validate the results from various atmospheric layers [13,21,32]. In addition, electron density measurements of F-layer, assimilation of magnetometer data, satellite-derived thermospheric O/N2 and the neutral wind observations from Fabry–Perot interferometers (FPIs) have enabled to study the ionospheric–thermospheric coupling in detail [33,34].
Longitudinal variations in ionospheric irregularities during geomagnetic storms have been reported as east–west dissimilarity in the American sector [12,35] triggered by PPEF and DDEF dominance over the eastern and western coast of America, respectively [36]. Moreover, the small angles between the sunset terminator and magnetic declination could increase the ESF development, whereas perfect alignment between the two could reduce the ESF occurrences [37]. Also, the huge difference in magnetic declination of the eastern and western coasts of America is suggested to be a plausible reason for the contrasting longitudinal response [38]. Carmo et al. [21] observed a direct relation of post-sunrise plasma bubbles to the delay in the development of the E layer during the March 2015 storm. Tariq et al. [30] reported a contrasting ionosphere response from east to west during the April 2023 storm in the Asian sector.
The effects of each geomagnetic storm are discrete due to the coexistence of complex physical mechanisms such as particle deposition, precipitation, high latitude heating, penetration electric fields, disturbance dynamo currents, neutral winds, and thermospheric density variations [29]. Similarly, the storm impacts on the ionosphere vary from small-scale disturbances (EPBs) to large-scale variations, which affect the satellites’ health, GNSS positioning and navigation accuracy, and high-frequency communication. Foregoing in view, it is vital to build a strong understanding of the ionospheric response to distinct geomagnetic storms. Further, several key factors, including the strength of geomagnetic storms, solar flux levels, season and local time of occurrence, geographical location, and the changes in interplanetary electromagnetic field components, impact the ionosphere differently. Therefore, a simultaneous observation of the independent and dependent parameters is of key significance utilizing the multi-instrument observables. The strong longitudinal ionospheric variations in the American sector during geomagnetic storms, as discussed earlier, need further analysis in addition to the conjugate Asian longitude sector.
Solar cycle 25 is expected to reach peak levels earlier than estimated at the beginning of the cycle [26]. Severe geomagnetic storms have already been reported in the ascending phase of the solar cycle, causing significant ionospheric disturbances. As solar activity is on the rise, more intense geomagnetic storms are expected. Hence, a detailed understating of ionospheric variations helps researchers to make predictions for the rest of the solar cycle. Recent studies have reported results from February and April 2023 events [13,26,30,33,39]. Oyama et al. [40] investigated the thermospheric winds in the European sector and Rajana et al. [26] reported the ionospheric response over the Indian longitude sector during the March 2023 storm, respectively. To our understanding, the analysis results of the ionospheric response in the American and East Asian sectors during the March 2023 storm have not been reported before. Hence, this study analyzes the ionospheric irregularity and disturbances in the American and Asian sectors during the March 2023 geomagnetic storm using multi-instrument data. The subsequent sections introduce data and analysis method, results from multi-instrument data, plausible explanation of the observed variations, and concluding remarks.
2. Data and Methods
2.1. Space Weather Indices
Geomagnetic storms are categorized by the variations in interplanetary magnetic and electric field components (IMF-Bz and Ey), SYM-H, and the geomagnetic Kp index. The auroral electrojet (AE) index describes the auroral latitude disturbances, while ASY-H signifies the partial ring current intensity as well as high latitude disturbances. Space weather parameters are widely used in research to determine the strength, duration, and phases of a geomagnetic storm. For this work, a 1 min averaged IMF-Bz, Ey, AE, and ASY-H data along with a 3 hourly Kp index were utilized. The data have been acquired from OMNI Web (https://omniweb.gsfc.nasa.gov/, accessed on 8 January 2024), SuperMag (https://supermag.jhuapl.edu/, accessed on 20 February 2024), and World Data Center (WDC) for Geomagnetism, Kyoto (https://wdc.kugi.kyoto-u.ac.jp/, accessed on 8 January 2024), respectively.
2.2. Ionospheric Data
The GNSS observations from 15 stations located in the American and Asian sectors have been acquired from the International GNSS service (IGS) (https://cddis.nasa.gov/archive/gnss/data/, accessed on 10 February 2024). The location of the IGS receivers is presented in Figure 1. The Slant and Vertical Total Electron Content (STEC) and (VTEC or simply TEC) data have been processed from the GNSS observation and navigation files following the method proposed by Seemala and Valladares [41]. The algorithm developed by Seemala and Vallarades is a generally accepted and recognized method for TEC calculation [42]. TEC data have a temporal resolution of 1 min. The average TEC of five quietest days of the month (TECavg), as suggested by the GFZ German Research Centre (https://isdc.gfz-potsdam.de/kp-index/, accessed on 10 February 2024), has been taken as a reference and the deviation from quiet time response (dTEC) has been calculated by subtracting the TECavg from storm-time TEC. Pi et al. [43] proposed the rate of TEC change index (ROTI) to identify the ionospheric irregularities. The rate of change of STEC is defined as ROT, whereas the standard deviation of ROT is known as ROTI [44]. ROTI signifies the ionospheric phase scintillation and is used for the detection of irregularities.
where refers to a specific time and denotes the GNSS satellite. The time interval between consecutive observations is 15 and 30 s for different GNSS station data used in this study. Hence, the unit of ROT and ROTI is TECU/min. The satellites below 30° elevation angle are neglected to avoid multipath errors.
where brackets denote the ROTI calculated over a 5 min running mean. Moreover, the final ROTI values have been normalized to 0–1 for better presentation. Various studies have discussed the threshold of ROTI values in order to be categorized as strong or weak [45,46,47]. In this work, ROTI values from 0.25 to 0.5, 0.5 to 0.8, and above 0.8 have been considered as weak, moderate, and strong phase fluctuations, respectively.
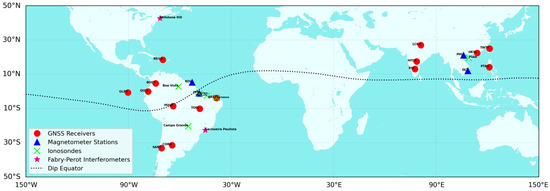
Figure 1.
Geographical locations of the ground-based data stations over American and Asian sectors.
Furthermore, the ROTI maps computed as a result of data contribution by GNSS networks all over the world have been incorporated in this research (https://stdb2.isee.nagoya-u.ac.jp/GPS/GPS-TEC/, accessed on 10 January 2024). Shinbori et al. [48] reported that over 9000 stations contributed data to this network as of 2020.
The ionograms for six stations in the American and Asian sectors (Figure 1) have been obtained from the INPE Embrace network of Brazil (https://www2.inpe.br/climaespacial/portal/en/, accessed on 25 January 2024) and Chinese Meridian Project (https://data.meridianproject.ac.cn/, accessed on 15 February 2024), respectively. The ionograms are presented to identify the range spread-F, whereas the peak ionospheric height (hmF2) is scaled to understand the vertical plasma motion. For all the ionosonde stations under study, ionograms have been manually scaled using SAO explorer version 3.6.1 [49]. The sounding cadence of ionosondes is 10 min, except for Fuke (5 min). The quiet time hmF2 has been calculated by averaging manually scaled data of ten days for five prior and five after days of the geomagnetic storm (23–24 March).
Swarm mission provides electron density (Ne) profiles obtained by the Langmuir probes onboard each Swarm satellite (A, B, and C). Swarm A and C orbit at an altitude of ~450–470 km, while Swarm B has an orbital altitude of ~500–530 km, respectively. Swarm A and C are identical satellites with a longitudinal separation of only 1.4°. In this study, latitudinal Ne profiles over the American sector (~40°–90°W) and over the Asian sector (~65°–130°E) have been obtained to investigate the ionospheric variations and plasma depletions during the storm [50]. The Swarm satellite data are obtained from the VirEs platform (https://vires.services/, accessed on 20 January 2024).
The Formosat-7/COSMIC-2 (F7/C2) six-satellite mission, at an orbital altitude of ~550 km, has the capacity to provide more than 5000 radio occultation (RO) profiles per day [51]. The Tri-GNSS radio occultation system (TGRS) receives RO profiles in low to mid latitudes. F7/C2 reached the final orbits in 2021 after being launched in 2019. The amplitude scintillation index (S4) data in the L1 band of Global Positioning System (GPS) satellites onboard F7/C2 has been assimilated to investigate the ionospheric irregularity effects.
where denotes the signal intensity, and the angle brackets refer to the 1 min average. The F7/C2 daily RO profiles can be obtained from the Taiwan Analysis Center for COSMIC (TACC) website (https://tacc.cwa.gov.tw/v2/, accessed on 20 January 2024) as a level-1 scn1c2 product. The mission’s data, in its early stages, has been used to study ionospheric effects as well as the EPB signatures through S4 profiles [39,52,53].
2.3. E Region Electric Field Data
In order to explore the response of the ionospheric E region, magnetic field horizontal component (H) data () have been retrieved from the INTERMAGNET network (https://intermagnet.org/, accessed on 25 January 2024). The H-component is the magnitude of the north (X) and east (Y) components of the Earth’s magnetic field. The intensity of eastward currents around the magnetic equator at 100–120 km altitude can be estimated by the equatorial electrojet (). The equatorial electrojet can be obtained by subtracting the magnetic fields of an off-equatorial station () from an equatorial station () at the same longitude [54,55].
In Equation (4), equatorial and off-equatorial stations for the American sector refer to TTB and KOU, whereas DLT and PHU are for the Asian region, respectively, as shown in Figure 1. The quiet-time EEJ has been calculated by taking the average of five quietest days of the month. Further, the disturbed ionospheric currents () at the equatorial latitudes during geomagnetic storms can be analyzed by subtracting the background magnetic field, solar quiet current (), magnetic field baseline (), and ring currents () [34,56].
The disturbance dynamo currents can be further broken down to obtain the intensity of prompt electric fields (DP2) and disturbance electric fields (Ddyn) at low latitude E region (DP2 + Ddyn = Diono) [3,57]. DP2 refers to the PPEF, and Ddyn is associated with DDEF.
The prompt penetration electric field model (PPEFM) is a real-time transfer function model between interplanetary Ey and the ionospheric equatorial eastward electric field (EEF), which provides penetration EEF as proposed by Manoj and Maus [58]. In addition, the PPEFM assimilates a climatological model based on ground-based and satellite observations for the representation of quiet time variations [59]. The PPEF intensity is provided in 5 min intervals and the model can be accessed at https://geomag.colorado.edu/real-time-model-of-the-ionospheric-electric-fields (accessed on 12 February 2024).
2.4. Thermospheric Data
Global ultraviolet imager (GUVI) onboard the Thermospheric–Ionosphere–Mesosphere Energetics and dynamics (TIMED) satellite observes column integrated oxygen to molecular nitrogen ratio (O/N2) (https://guvitimed.jhuapl.edu/, accessed on 28 February 2024). The daytime O/N2 measurements are assimilated in the research to understand the response of ionospheric F-layer electron density variations. The O/N2 measurements of the quietest day of the month, i.e., 27 March, have been considered as the reference day, and the difference in O/N2 has been obtained by subtracting the reference O/N2 from storm-time O/N2.
Fabry–Perot Interferometers (FPIs) located at Millstone Hill and Cachoeira Paulista in the American sector (Figure 1) provide nightly observations in 630 nm channels. The FPI at Millstone Hill can also be configured to 557.7 nm simultaneously. The interferometers measure the thermospheric neutral winds in the north–south (meridional) and east–west (zonal) directions at an elevation angle of 45°. The zenith-pointed meridional and zonal winds are computed by taking a mean of the north, south (over 2.5° latitude), and east, west (over 3.5° longitude) directed vectors, respectively. The data can be accessed from the Madrigal Database (http://cedar.openmadrigal.org/list, accessed on 20 February 2024).
3. Results
3.1. Interplanetary and Geophysical Conditions
The March 2023 geomagnetic storms primarily occurred due to the CME that left the sun on 20 March 2023. Initially, a glancing impact of CME was predicted; however, with the peak disturbance storm-time index (Dst) value reaching as low as −163 nT, this storm was termed as ‘Strong’ by the National Oceanic and Space Administration (NOAA). Figure 2 shows that the IMF-Bz turned southward, marking the commencement of the initial phase of the storm around 0700 UT on 23 March 2023 (DOY 82). The main phase of the storm commenced around 1200 UT, and the IMF-Bz fluctuated between the southward and northward orientations before finally turning southward around 1800 UT. The IMF-Bz reached a minimum value of −16.1 nT at 2300 UT on the same day. During the main phase of the storm (the colored patch in Figure 2), SYM-H, representing the intensity of ring currents, turned negative after a few hours of IMF-Bz at around 1100 UT and reached a negative peak of −164 nT at 0200 UT on 24 March 2023 (DOY 83). Similarly, the Kp index elevated to a maximum value of 8 at 0300 UT, as presented in Figure 2f. The variations in Ey were similar to IMF-Bz in the opposite orientation [60] and attained the peak value of 8.13 mV/m at around 1800 UT on March 23. The AE and ASY-H indices showed noticeable variations in all three storm phases. Both AE and ASY-H reached 1540 nT and 192 nT at 1400 UT on 23 March, and later, around the midnight hour of 24 March, AE showed intensification and fluctuated around 2000 nT. ASY-H also reached 167 nT during the same time. The enhancement in the AE index was also observed during the recovery phase of the storm till around 0800 UT, 24 March.
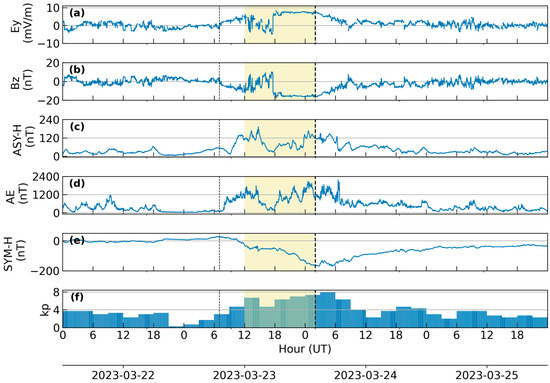
Figure 2.
Variations in geophysical indices from DOY 81 to 84 (March 2023): (a) Interplanetary electric field (Ey), (b) IMF Bz, (c) ASY-H, (d) Auroral electrojet, (e) SYM-H, and (f) Kp index. The first black dotted line is the Initial Phase, the colored patch is the Main Phase, and the second dotted line refers to the time instance of the Dst minimum.
3.2. Ionospheric Irregularities
3.2.1. American Sector
The presence and evolution of post-sunset, midnight, and near-sunrise EPBs are frequently investigated by calculating ROTI [46,47,61]. Figure 3 shows that the post-sunset EPBs are observed on pre-storm days, i.e., 22 and 23 March 2023, which possibly depict the presence of seasonal EPBs [62]. However, no near-sunrise EPBs are observed on these days. During the storm’s main phase at the midnight hours of 24 March, the EPBs appeared to be suppressed near the eastern coast (Brazilian region) as compared to the previous days. On the contrary, strong irregularities (ROTI ≥ 0.8 TECU/min) [46,47] are observed near the western coast (Peruvian longitude sector), reaching up to ±28° magnetic latitudes. Further, strong irregularities can be seen during the near-sunrise hours at around 0900 UT on 24 March in the American region, extending up to low-middle to middle latitudes from east to west (Figure 3k). The EPBs are completely absent on 25 March (post-recovery phase). Figure 4 shows the evolution of post-sunset and near-sunset EPBs during the main (early recovery) phase of the storm. Ionospheric irregularities appeared after 2300 UT on 23 March over the Brazilian longitudes, followed by the Peruvian longitudes after midnight hour. At 0200 UT (2100 LT), when Dst reached its minimum value, the irregularity moved polewards near the western coast (~80°W). Similarly, strong ROTI values are recorded during the pre-sunrise hours, particularly over the western longitudes moving towards higher latitudes at around 1000 UT (0500 LT, Peru time). In addition, ionospheric irregularities are observed even after the sunrise hours, as shown in Figure 4h.
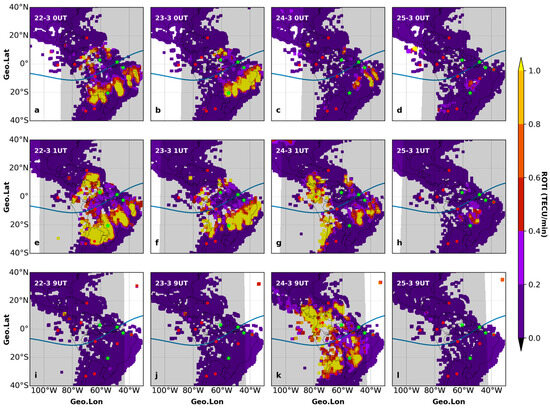
Figure 3.
Series of ROTI maps from 22 to 25 March 2023. The maps show TEC irregularity occurrence rates at sunset, pre-midnight (a–h), and near-sunrise (i–l) hours of the pre-storm and storm days. The shaded portion and blue curve denote the post-sunset hours and dip equator. The superimposed red circles and green stars mark the location of TEC receivers and ionosondes.
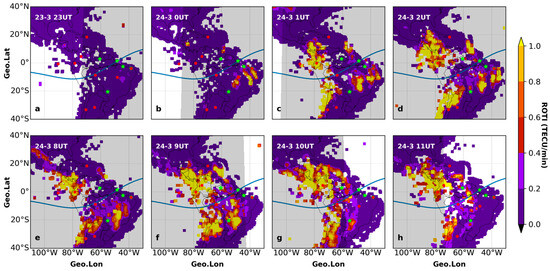
Figure 4.
ROTI maps during the post-sunset hours (a–d) and sunrise hours (e–h) presented in hourly intervals on 23–24 March 2023. The red circles and green stars represent the location of TEC receivers and ionosondes used in this study.
Figure 5 shows the range spread-F observed by the Fortaleza, Sao Luis, Belem, Campo Grande, and Boa Vista (38°–60°W) ionospheric sounders during the post-sunset (top panels) and near-sunrise (bottom panels) hours, respectively. Unfortunately, ionosonde data of the Jicamarca station (11.97°S, 76.93°W) located in the western longitudes were not available during the storm main and recovery phases (source: http://lisn.igp.gob.pe/, accessed on 23 February 2024). The post-sunset and near-sunrise spread-F is more intense at the equatorial stations located on the eastern longitudes (Fortaleza and Sao Luis). At Belem, weak spread-F is observed, although spread-F is present during both time intervals. It may be noticed that the spread-F is only observed over Campo Grande at sunrise hours. During the nighttime, spread-F is absent at the low-middle latitude station of Campo Grande. The results complement the observations of ROTI maps (Figure 3 and Figure 4), where the post-sunset/nighttime EPBs were relatively suppressed at the corresponding longitudes, particularly at the low-middle latitudes.
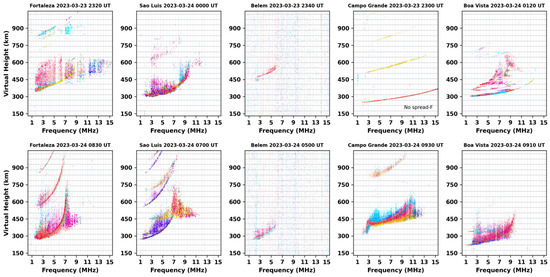
Figure 5.
Range spread-F observed by different ionospheric sounders in the American sector on 23–24 March 2023.
3.2.2. Asian Sector
In order to investigate the ionospheric irregularity in the Asian sector, the GNSS-derived ROTI over equatorial to low-middle latitudes are presented in Figure 6. Figure 6a refers to different latitude GNSS stations over the Indian longitude sector, whereas Figure 6b denotes the East Asian longitude sector. Moderate to strong ROTI variations were observed on quiet days at IISC (dip equator) and HYDE (EIA crest) and persisted till midnight/post-midnight hours. However, moderate ionospheric irregularities (ROTI ≥ 0.5) lasted only a couple of hours during the main phase of the storm (1400–1600 UT, 1700–1900 LT). Post-sunset ROTI values at the LCK4 station, located outside the northern crest of the EIA region, remained at background levels during both quiet and storm periods. At all three stations, the values stayed insignificant (ROTI < 0.1 TECU/min) during the post-sunset hours of the storm recovery day, consistent with Rajana et al. [26]. In the East Asian longitude sector, ionospheric irregularities remained at minimum levels before the storm’s onset, as seen in Figure 6b. Nevertheless, ROTI enhanced to strong levels (over 0.8 TECU/min) during the post-sunset period of the storm’s main phase. The onset of the main phase of the storm occurred around the local sunset hours at 110°–120°E longitude. The variations in ROTI lasted for 4 to 5 h within the EIA latitudes, and the irregularities are more pronounced at near equatorial stations (PTAG). The inhibition of the EPBs is observed during the storm recovery phase with nominal ROTI levels like the Indian longitude stations. Likewise, no significant post-sunset ROTI variations are observed outside the EIA region (TWTF).

Figure 6.
Diurnal variations of ROTI during 22–24 March 2023 at different stations over the Asian sector. (a) Indian, (b) East Asian longitude sector. The dashed lines denote the sunset time at respective longitude sectors. The different colors show the ROTI value of different satellites.
3.3. Topside Plasma Density Fluctuations
3.3.1. American Sector
During the March 2023 geomagnetic storm, Swarm A and B satellites covered the American region in the post-sunset/midnight and morning hours. The availability of satellite-derived plasma profiles at this duration provides an opportunity to recognize the presence of ionospheric irregularities. Figure 7 presents the in situ plasma density (Ne) profiles over the American longitudes (45°–85°W) during the nighttime (top panels) and morning hours (bottom panels) on 23–24 March 2023. It can be noticed that during the night hours (~2300 LT), weak plasma fluctuations are observed over the eastern longitudes (~60°W), Figure 7b. Over the western longitudes (~80°W), the observed plasma density fluctuations were initially weak at around 2000 LT but became much more intense (reaching up to ±30° magnetic latitudes) at around 2300 LT, as shown in Figure 7c,d. The intense depletions over the western longitudes, as shown in Figure 7d, represent the presence of EPBs up to higher latitudes [63], as also depicted by ROTI maps. Furthermore, during the morning hours, weak to moderate plasma depletions can be seen in spite of the fact that the Swarm satellites covered the American sector at least 2 h after sunrise. Figure 7g shows that the Ne fluctuations could be seen even ~4 h after sunrise. A double peak structure, at around ±20° magnetic latitudes, is observed for post-sunset plasma density profiles. The findings of satellite-derived plasma densities are consistent with the observation of ROTI maps (Figure 4). The quick fluctuations and depletions in plasma density, particularly at the geomagnetic conjugate latitudes simultaneously, are considered a distinctive signature of EPBs [13,63].
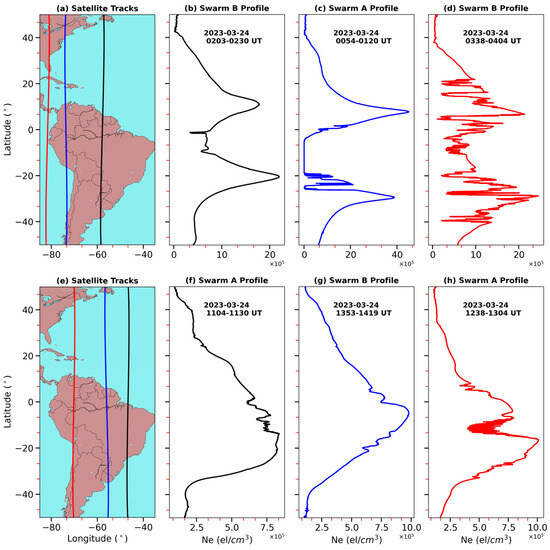
Figure 7.
Swarm (A and B) derived plasma density profiles over the American sector during 0054–UT0404 UT (b–d) and 1104–1419 UT on 24 March (f–h). The black, blue, and red curves in the left panels (a,e) denote the tracks of Swarm (A and B) satellites. From left to right, plasma density profiles are plotted in the increasing order of longitudes from east to west.
3.3.2. Asian Sector
Similar to the American sector, the Swarm A satellite flew over the Asian sector during the post-sunset hours from 22 to 24 March 2023. Figure 8 (top panel) presents the Ne variations in the Indian sector at around ~2000–2100 LT. Ne fluctuations are observed on 22 March (a day before the storm) with a double peak structure at around 14–15° geomagnetic conjugate latitudes. Conversely, a single peak was observed at about the same time on 23 March (main phase), along with weak plasma depletions, as shown in Figure 8c. The plasma density values were observed to be very low during the recovery phase with the absence of a double peak EIA structure. Similar results are obtained by Rajana et al. [26] using level 2 Swarm TEC data. In the East Asian longitudes, rapid plasma fluctuations can be seen at the conjugate EIA crest latitudes during the main phase in contrast to the insignificant fluctuations on 22 March, as shown in Figure 8f,g. Moreover, the double peak structure disappeared with strong plasma depletions (peak ΔNe ~ 15 × 105 el/cm3) on 24 March (storm recovery day), indicating the influence of downward ExB drifts.
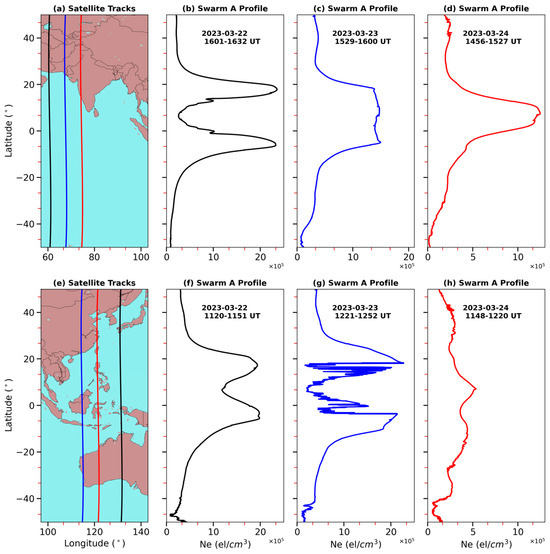
Figure 8.
Swarm A plasma density profiles over the Indian sector (b–d) and East Asian sector (f–h) at post-sunset hours during 22–24 March. The left panels (a,e) denote the corresponding satellite tracks of the observed latitudinal profiles.
3.4. GNSS-Derived TEC Disturbances
3.4.1. American Sector
TEC variations in the American sector have been investigated by employing six low latitude stations (Figure 9a,c) and three low-middle/beyond EIA crest latitude stations (Figure 9b,d) spread over different longitudes. During the initial phase of the storm (~0700–1200 UT) on 23 March, no TEC variations are observed at all the stations. At the onset of the main phase of the storm (~1300 UT), positive enhancement is observed at stations located over ±20° magnetic latitude (RDSD, CORD, and SANT). Moreover, low latitude stations exhibited negative dTEC at around local noon. Later, at around ~2200–2300 UT on 23 March, all stations showed positive enhancements. The enhancement took place at the time of sunset over the eastern longitude (~38°–48°W) stations. The maximum enhancement of about ~30 and ~45 TECU is observed at the station just inside the northern EIA crest (BOGT) and the stations just outside the southern EIA crest (CORD and SANT) at around 2300 UT, respectively. Moreover, sudden TEC depletions can be seen at all equatorial and low latitude stations around the midnight UT hours on 24 March, which persisted for several hours. The depletion is more pronounced over the western longitudes, with a maximum difference at the QUI3 station (~−50 TECU). During the night of 23–24 March, fluctuations in TEC were observed at all the stations. At around the local sunrise on 24 March, no TEC variations were observed. On 24 March, negative TEC variations were recorded at all the stations throughout the day, marking the presence of a negative ionospheric storm effect.
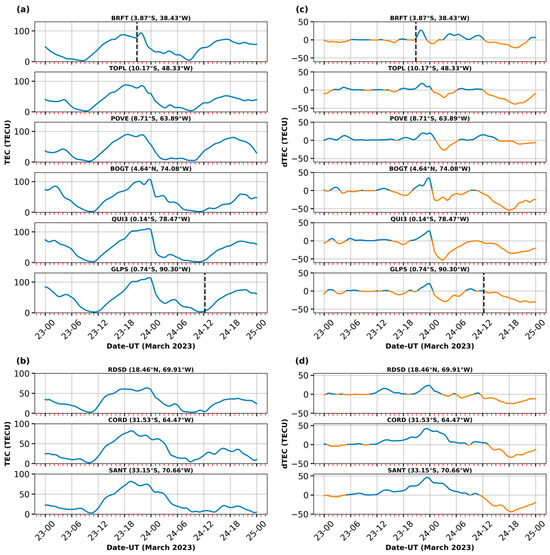
Figure 9.
Diurnal TEC variations on 23–24 March over the American sector. Panels (a,c) refer to the low latitude while (b,d) correspond to middle latitude stations within 38°–90°W. Blue solid lines denote enhanced TEC, whereas orange lines refer to a decrease in TEC values (c,d). The dashed line in BRFT and GLPS plots represents the sunset beginning and final sunrise time in the sector.
3.4.2. Asian Sector
To understand the TEC disturbances in the Asian sector, GNSS-derived TEC has been presented for the Indian longitude sector and East Asian sector in Figure 10a,c, and Figure 10b,d, respectively. The TEC and dTEC are presented for dip-equatorial, low latitude (within EIA), and low-middle latitude (above northern EIA crest) stations from top to bottom in the respective panels. No significant TEC variations are observed during the initial and early main phase (0700 UT–1400 UT, 23 March) of the storm over the Indian stations, as shown in Figure 10a,c. An increase of ~15 TECU is seen at the equatorial station (IISC) around 2100 LT (UT + 5), followed by a TEC depletion of ~20–22 TECU over the equatorial and low latitude stations (IISC and HYDE) at the local midnight on 24 March (2000 UT, 23 March). The LCK4 station, located beyond the EIA crest, did not observe any TEC changes during the aforementioned period. An enhanced TEC is observed after midnight UT hours on 23–24 March, mainly at the low latitude stations, with slight enhancement over the higher latitude station, LCK4. Moreover, the positive TEC persisted till 1000 UT on 24 March over the equatorial station. On 24 March, negative TEC variations transferred from north to south, initiating at 0500 UT, 0800 UT, and 1000 UT over LCK4, HYDE, and IISC, respectively. Similarly, the reduction in TEC was more pronounced at LCK4 with peak depletion of ~60 TECU at 0900 UT, followed by HYDE (~55 TECU) at 1100 UT and IISC (~20 TECU) at 1200 UT. Overall, TEC remained depleted throughout the UT day of 24 March [26].
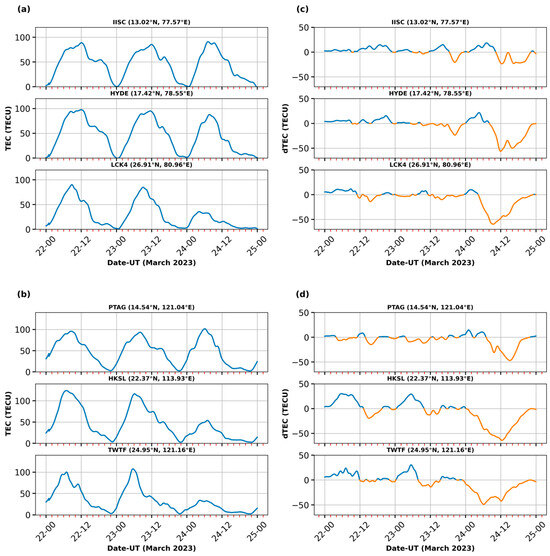
Figure 10.
TEC variation during 22–24 March over the Indian longitude sector (a,c) and East Asian longitude sector (b,d) at the equatorial to beyond northern EIA crest stations.
In the East Asian sector, the daytime TEC values remained enhanced during the pre-storm period at HKSL and TWTF; however, a depletion was observed during the initial phase of the storm, as shown in Figure 10b,d. TEC fluctuations, centered at the background levels, are observed during the main phase at all three stations, with slight positive variations at HKSL and TWTF. During the early hours of 24 March, an increase in TEC is seen at the dip-equatorial station, PTAG, and later at 0400 UT–0700 UT, respectively. A negative ionospheric storm was seen on 24 March, and the reductions commenced over the higher latitude station, TWTF, at around 0700 LT (UT + 8) on 24 March. Moreover, two troughs can be noticed at all three stations on 24 March (one each in the afternoon and post-sunset hours), with disturbances appearing to move from beyond EIA to the dip equator.
3.5. Variations in Ionospheric Heights
3.5.1. American Sector
The ionospheric real heights (hmF2) over the American sector during the March 2023 geomagnetic storm are shown in Figure 11. From top to bottom, the manually scaled hmF2 of the ionosondes located from 38° to 60°W is presented. The hmF2 values remained near background levels during the initial and early main phases at all the stations. Significant enhancements are observed at the near dip-equatorial/low latitude stations, Sao Luis (~1700–2000 UT), Belem (~1800–2100 UT), and Boa Vista (~1900–2200 UT) with peak ΔhmF2 of ~120 km, ~110 km, and ~80 km, respectively. Since the geomagnetic latitude of Sao Luis, Belem, and Boa Vista is 5.6°, 7.0°N, and 11.8°N, respectively, the ΔhmF2 peak moved northwest during the above-mentioned hmF2 increase. A slight increase in hmF2 can be seen at Fortaleza (dip-equatorial station) and at Campo Grande (southern hemisphere low latitude station) almost two hours before sunset. After sunset on 23 March, the three stations located in the eastern longitudes exhibited an increase in hmF2. The gray dashed line suggests the presence of quiet time evening PRE at all the stations except Campo Grande, with hmF2 reaching over 500–550 km. However, the hmF2 elevated to more than 600 km over Sao Luis and Belem within ~2 h of the sunset on 23 March. At Boa Vista, the increased rate of evening vertical plasma drift was less than the quiet time observations (2200–2300 UT), though a significant increase was observed till sunset. No noticeable increase in hmF2 was observed at Campo Grande during both quiet and disturbed periods. Over the western longitudes, hmF2 increased during the post-midnight hours, particularly at Campo Grande, where the positive trend persisted during the night and experienced a peak rise (ΔhmF2 ~ 175 km) prior to the occurrence of EPBs. It is important to note that the upward motion of plasma (sudden hmF2 rise) around sunrise was not observed during the quiet days. The hmF2 was uplifted ~150–160 km at the Fortaleza and Sao Luis at near-sunrise hours. On 24 March, hmF2 values mostly remained lower than the quiet time average.
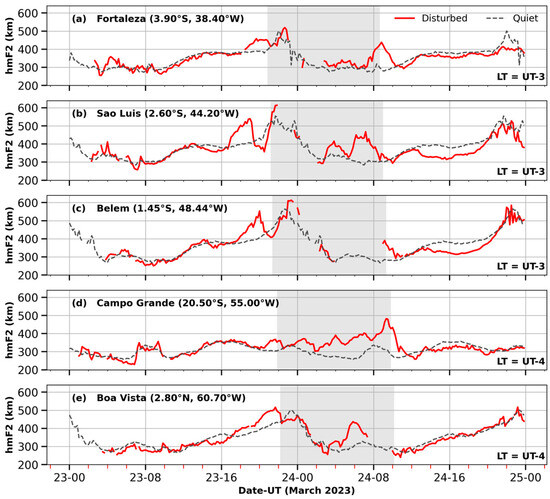
Figure 11.
The variations in hmF2 over the American sector from east to west (~40°–60°W) on 23–24 March 2023. The gray-shaded region denotes sunset to sunrise duration on 23–24 March.
3.5.2. Asian Sector
Figure 12 shows the hmF2 variations at the low latitude East Asian station located within the EIA region. On 23 March, at the start of the storm’s main phase (1200 UT), the observation of upward plasma drift suggests the presence of evening PRE; however, an almost similar drift was observed in quiet time values. The hmF2 slightly enhanced from 1700–1900 UT around ~30 km and later experienced a strong rise to 417 km at 2125 UT. The observation at the near-sunrise hours (2100–2300 UT) suggests a presence of prominent upward plasma drift. Negative hmF2 fluctuations were noticed throughout the daytime on a storm recovery day; however, a pronounced increase was exhibited during the night hours.
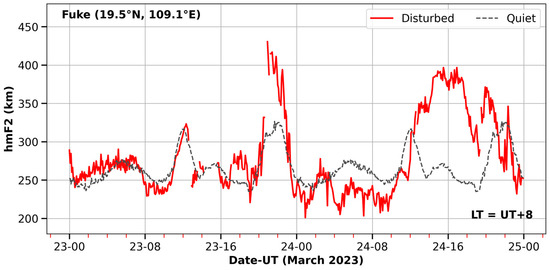
Figure 12.
Ionospheric hmF2 observed at the Fuke station on 23–24 March 2023.
4. Discussion
4.1. On the Enhancement/Suppression of Ionospheric Irregularities
The geomagnetic storm under this study occurred during the equinox season at the ascending phase of the solar cycle 25. The occurrence rate of the EPBs peaks during the solar maximum, with higher occurrence in the East Asian and American sectors [14,15,16]. The evening PRE of the upward plasma drift is increased during the high solar activity periods [64], and increases the R-T instability growth rate, causing EPB generation ([14,65], and references therein). Furthermore, the EPB generation may be increased or suppressed during the geomagnetic storms due to the impact of electric fields on upward plasma drift at sunset and sunrise hours [12].
In the current case, quiet time increase in hmF2 (vertical plasma drift) at post-sunset hours (Figure 11) and the pre-storm EPBs (Figure 3) has been observed. During the storm main phase, the development of post-sunset EPBs over the eastern coast of America (40°–45°W) and the inhibition/suppression at ~60°W (Figure 4b) suggests the respective dominance of PPEF and DDEF. The enhancement in hmF2 over the eastern longitudes (Figure 11a–c) could be due to the presence of a disturbed eastward electric field, whereas the slight decrease in PRE amplitude at Boa Vista (Figure 11d) can be explained by the DDEF influence. It can be noticed that the sunset at the sector began after ~4 h of the second southward turning of IMF-BZ and AE intensification (Figure 2b,d); therefore, the presence of both PPEF and DDEF is expected. Figure 13 suggests that the equatorial electrojet is enhanced from 1700 to 2030 UT on 23 March at ~48°W longitude. The Diono turned negative afterward, indicating the presence of westward DDEF. Thus, the longitudinal difference in EPB development within ~20° longitude is observed owing to the coexistence of PPEF and DDEF [7], which created a balance of electric fields [35]. Further, after sunset, the EPBs presence is restricted to the equatorial latitudes in the eastern sector (~40°–60°W) in contrast to the pre-storm days. The post-sunset suppression could be attributed to the DDEF effect under the presence of southward IMF-Bz [12]. Sobral et al. [17], in a climatological study over the Brazilian low latitude, reported the suppression of post-sunset EPBs due to DDEF when the geomagnetic activity increased ~4 h preceding the sunset.
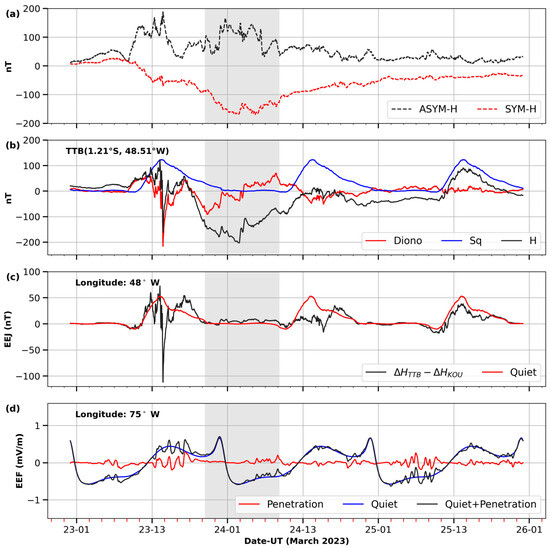
Figure 13.
The variation of ring currents (a), Diono, H, Sq, and EEJ at 48°W (b,c), and equatorial electric field calculated from the PPEFM model at 75°W longitude (d) from 23 to 25 March 2023. The shaded portion denotes the duration from sunset to sunrise on 23–24 March.
Over the western American longitudes (~75°–80°W), post-sunset EPBs developed after 00 UT on 24 March (post-sunset) and moved to ±30° magnetic latitude at around 2100 LT (UT−5), as observed by ROTI maps (Figure 4c,d) and Swarm profiles (Figure 7d). The formation of post-sunset EPBs may be explained by the variations in the eastward electric field, as noticed in Figure 13d. Equatorial EEF exhibited positive fluctuations till near-sunset hours, which may have contributed to the uplift of PRE. Several studies have reported that the eastward PPEF superimposed on PRE is responsible for the increased R-T instability growth rate, which causes strong post-sunset EPBs during geomagnetic storms [13,32,66]. It is relevant to mention that Sreeja et al. [67] and Uemoto et al. [68] studied the relation between pre-sunset EEJ, post-sunset PRE, and EPB development, and it suggested a strong correlation between E and F region dynamics. Here, it is assumed that the DDEF effect is insignificant/absent around the sunset over the western longitudes.
Abdu [12] and Santos et al. [35] have also suggested notable dissimilarity in responses to the storm-induced electric fields within 30° longitude in the American sector. This difference could be due to the varying degrees of PPEF and DDEF dominance over the eastern and western coasts of America [36]. Furthermore, there is a significant difference in the magnetic declination of eastern and western longitudes, and it is another possible reason for the contrasting longitudinal response as proposed by Abdu et al. [38]. Additionally, the poleward extension of EPBs at ~2100 LT can be associated with nighttime eastward DDEF. This explanation is backed by the findings of Abdu [12], who observed the commencement of DDEF eastward polarity around ~2100–2200 LT followed by a hmF2 rise and EPB development at Jicamarca (76°W). The author further explained that the nighttime EPB development due to eastward DDEF could persist till dawn.
Figure 3k demonstrates the presence of near-sunrise ionospheric irregularities that are not observed during the quiet days. Furthermore, the results of ROTI maps (Figure 4e–h), ionograms (Figure 5), and Swarm profiles (Figure 7f–h) suggest the presence of EPBs before sunrise, which persisted even after ~4 h of the sunrise during the storm recovery phase. Under the influence of southward IMF-Bz and enhanced AE during the night hours till ~0800 UT in the morning, the electric field effect may have increased due to the enhanced auroral activity [69,70]. Due to the auroral heating, disturbed equatorward neutral winds cause low latitude DDEF during the late main/early recovery phase of the geomagnetic storm [9,10,31,71]. Significant uplifting of ionospheric hmF2 is noticed at Fortaleza, Sao Luis, and Campo Grande before sunrise and post-midnight at Campo Grande and Boa Vista (Figure 11) on 24 March, which could be associated with the nighttime eastward DDEF [72]. The presence of the prevailing DDEF effect can be confirmed from Figure 13c, as the post-midnight EEJ on 24 March shows enhancements. Similar to the sunset terminator, the rapid increase in vertical plasma during the night and pre-sunrise hours can increase the R-T instability growth rate for EPB generation [21].
Figure 14 illustrates the FPI-driven neutral wind variations over the eastern and western longitude stations in the American sector. The northward disturbances in the meridional wind at the Cachoeira Paulista are observed from ~0300 to 0400 UT and ~0600 to 0700 UT, with a corresponding increase in hmF2 at the same latitude station, Sao Luis. It may be noted that the magnetic latitude of Cachoeira Paulista is 14.20°S; the northward wind refers to the geomagnetically equatorward wind [18]. Further, the exhibition of equatorward meridional wind [73] at mid-latitude station Millstone Hill with two peaks of ~−150 m/s shows the presence of DDEF at both longitudes. The findings are in agreement with previous studies on the triggering of EPBs due to equatorward meridional winds in the American sector [18,21]. It is previously reported that the northward component of meridional wind causes a stabilizing influence on R-T instability by creating a positive latitudinal slope [74,75].
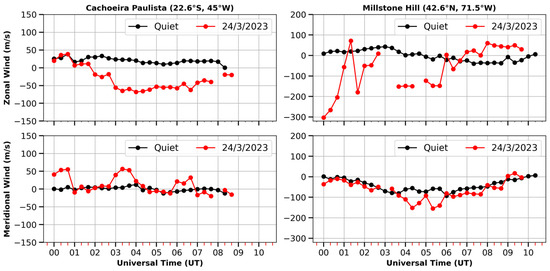
Figure 14.
The zonal and meridional wind component derived from FPI at Cachoeira Paulista and Millstone Hill on 24 March superimposed on the quiet time average.
As depicted by Figure 14, the zonal component of horizontal winds exhibited negative variations throughout the night, representing westward drift. The middle latitude westward transition of neutral wind due to the Coriolis force effect is well known [9]. Oyama et al. [40] also observed strong westward zonal winds at the polar latitudes during the same March 2023 storm. A recent statistical study confirmed a strong correlation between westward winds and the development of EPBs [76]. Further, Loutfi et al. [77] and Malki et al. [78] revealed that the equatorward wind varies between 100 and 200 m/s during the geomagnetic storms at a middle latitude with a time lag in reaching disturbance from middle to low latitudes [79]. The exact time of triggering of R-T instability over the western longitudes (~70°–80°W) is difficult to determine due to the unavailability of hmF2 and neutral winds data at low latitudes.
In the Asian sector, a post-sunset increase in ROTI lasted for only around two hours in the Indian sector, while it could be seen for five to six hours in the East Asian sector. ROTI values and swarm plasma density profiles during the quiet days indicate the presence of seasonal irregularities in the Indian sector; however, the existence could not be confirmed in the East Asian sector as the ROTI remained at background level on 22 March, as seen in Figure 6. The hmF2 rise at the sunset hours at Fuke (Figure 12) during both quiet and disturbed periods may indicate the presence of a moderate seasonal PRE. The inhibition of the EPBs in the Indian sector around ~1530–1600 UT could be associated with the fluctuations in westward PPEF (Figure 6a). Figure 15a demonstrates that the eastward electric field, after turning westward at ~1430 UT (1930 LT), showed fluctuations after ~1545 UT. The single peak structure observed by Swarm at 1530–1600 UT on 23 March also confirms the downward motion of hmF2 (downward ExB drifts), as seen in Figure 8. The results are consistent with Rajana et al. [26]. Similarly, significant westward PPEF disturbances initiated after 1600 UT in the East Asian sector became the reason for irregularity suppression/inhibition (Figure 15b). In addition, the IMF-Bz showed continuous southward/northward fluctuations from 1300 UT onwards with intense AE (substorm) [80], hence, the periodic presence of over-shielding prompt electric fields (PEF) at sunset hours (Indian sector) already suppressed the irregularities [81]. By the time substorms occurred in the East Asian sector, over-shielding PEF already turned eastward, so, PEF effects are only expected over the western longitudes.
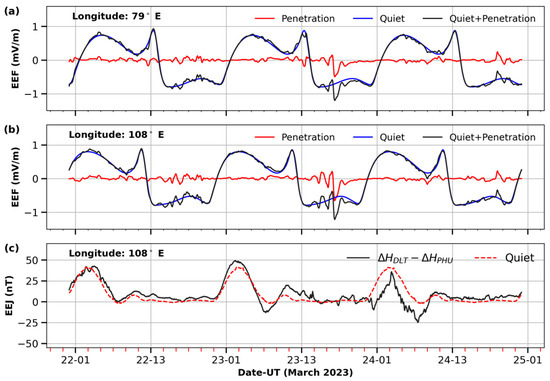
Figure 15.
The variation in equatorial electric fields over the Indian (a) and East Asian (b,c) longitude during 22–24 March.
Huang [71] and Timoçin et al. [82] suggest that the suppression of ionospheric irregularities during the recovery phase is either due to DDEF or over-shielding PEF. In this case, the suppression/inhibition of post-sunset EPBs in the American and Asian longitude during the recovery day could be attributed to DDEF generated by disturbed neutral wind, as indicated by reduced EEJ. The presence of PEF is ruled out as no intensification in AE is seen after ~0700 UT on 24 March, and IMF-Bz also remained at near zero levels.
4.2. On the TEC Response
The American sector, being mainly on the night side during the initial phase, did not vary due to low background TEC [30]. No initial phase TEC enhancements in the Indian sector despite the daytime under southward IMF-Bz could be associated with the insignificant storm impact on the bottom-side ionosphere as compared to the topside, as suggested by Lei et al. [83]. A recent study on the March 2023 geomagnetic storm in the Indian sector discussed the possibility of an increase or recovery of ionization in the ionosphere for unvaried TEC (ref. [26], and references therein). On the other hand, minor negative TEC is observed at the stations located along ~121°E during the early hours of the initial phase. To the authors’ knowledge, the TEC decrease could have been associated with the reduction in EEJ to ~−10 nT just before the southward turning of IMF-Bz. The EEJ negative excursion is followed by a downward motion of hmF2 within ~50 km from ~0700 to 0800 UT on 23 March. Since the EEJ reduction began before the southward turning of IMF-Bz, the decay may possibly be associated with a rise in solar wind velocity around ~0600 UT up to ~30 km/s. Zhang et al. [84] found a positive correlation between abrupt change in solar wind velocity and EEJ under stable IMF-Bz with a response time of 20–40 min. Moreover, the authors mentioned that the role of IMF-Bz orientation cannot be neglected even if the variations in Bz are quite small within ~5 nT. The IMF-Bz mainly remained slightly northward between 0600 and 0700 UT; therefore, an EEJ reduction was observed despite the increase in wind velocity. Furthermore, the depletion in TEC observed during 1000–1600 UT could be attributed to the presence of post-sunset plasma bubbles, which were also observed in Swarm Ne density profiles and ROTI fluctuations.
During the main phase in the American sector, perturbations in EEJ from ~1200 to 1700 UT suggest that the EIA crest enhanced due to the presence of eastward electric fields, while the abrupt reduction in EEJ caused negative dTEC at low latitudes, as shown in Figure 13c,d. Since the westward EEJ lasted for brief periods, the negative storm could not move to higher latitudes. Fluctuations in EEJ occurred due to the rapid southward/northward shifting of IMF-Bz under intense AE from ~1200 to 1700 UT. The under-shielding electric field is balanced or even becomes recessive when IMF-Bz turns northward. The prevailing over-shielding electric field dominates the PPEF, forcing a downward plasma motion due to westward PEF [4,85]. Positive dTEC prevailed during the afternoon hours on 23 March, peaking around the local sunset at all the stations in the American sector. The variations are aligned with the EEJ magnitudes and PPEF fluctuations at 48°W and 75°W, respectively. Moreover, the rise in hmF2 corresponds well to the electrodynamics at the E region. The increase in TEC beyond the EIA crest latitudes manifests the extension of the EIA crest due to a strong fountain effect [27,28]. Also, during the sunset hours, TEC appears to be more pronounced at ~40°W and 70°–80°W at the equatorial latitudes, depicting the weak PRE at in-between longitudes. The observation is consonant with the observed ROTI.
The main phase coincides with dusk/nighttime hours in the Asian sector, and no prominent TEC variations observed in the East Asian sector are associated with the low background TEC except the depletions at dusk due to irregularities. Variations are more prominent in the Indian sector as the main phase commenced at the pre-sunset hours. The increase in TEC at IISC at sunset hours (~1400 UT) on 23 March represents the pre-reversal enhancement. This increase precedes the TEC decrement at IISC and HYDE owing to the perturbations in westward PPEF (Figure 15a) around ~2000 UT on 23 March.
The early UT hours of 24 March refer to the post-sunset time in the American sector, and the significant TEC depletion during the pre-midnight/midnight hours indicates the presence of ionospheric irregularities. EPBs are small-scale structures and may drift across the line of sight of the satellite and receiver, causing depletion in TEC [86]. However, no significant variations at the sunrise hours at the low latitude are possibly due to the low background values [13]. The nighttime TEC is increased at the beyond EIA crest stations located along ~65°–70°W longitudes. Due to the LT time difference in the Asian region, the early UT hours of 24 March witnessed an enhancement in TEC at the low latitude stations. The positive variation in the recovery phase could be attributed to the near-sunrise upward plasma drift under the influence of disturbance electric fields. Vertical plasma drift can be seen by hmF2 rise at Fuke at ~0600 LT on 24 March (Figure 12).
On 24 March, negative daytime TEC variations are recorded in the American and Asian sectors throughout the day, marking the presence of a negative ionospheric storm effect. Furthermore, the negative disturbances moved from beyond EIA to dip-equatorial latitude station in the Asian sector, showing the presence of daytime westward DDEF [26]. A significant reduction in EEJ strength during the local daytime in America (Figure 13c) and Asia (Figure 15c) confirms the influence of DDEF [85]. Figure 16 presents the GUVI/TIMED derived thermospheric composition (O/N2) on 24 March and the difference from quiet day variations at ~1630 LT globally. Although northern hemispheric data are not available, it can be seen that the equatorial latitude in the American and Asian sectors show enhancements ~0.2–0.5, while the low-middle latitude in the southern hemisphere demonstrates relatively lower values. Positive TEC variations in the Asian sector during the morning hours on 24 March could also be explained by increased atomic oxygen. However, it is proposed that a dominant role is played by DDEF in all regions.

Figure 16.
GUVI thermospheric O/N2 on 24 March 2023 and O/N2 difference from a quiet day. The red circles denote the locations of GNSS stations.
4.3. On the Amplitude Scintillation
F7/C2 global RO profiles provide the S4 index within ±40° latitudes. Figure 17 illustrates the occurrence percentage of S4 ≥ 0.5 within 150 km to 550 km altitude. The binning of data were performed as the ionospheric F-layer is present within this altitude. The F-layer constitutes a major portion of the ionosphere, whereas the sporadic-E (Es) layer accounts for irregular disturbances at 90–130 km; for that reason, low altitude anomalies are removed [39]. Chen et al. [52], in a climatology study of F7/C2 derived S4, reported that the percent occurrence of S4 over 0.5 is well correlated with the presence of EPBs in the F-layer peak.
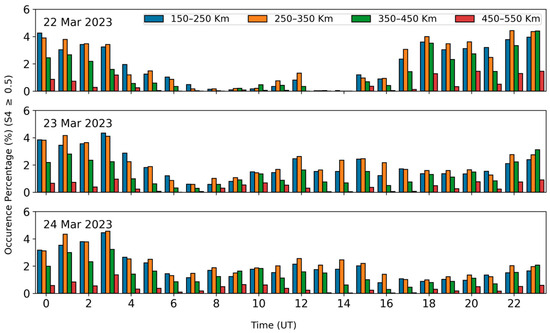
Figure 17.
FORMOSAT-7/COSMIC-2 derived global amplitude scintillation (S4) index percentage for S4 ≥ 0.5 during 22–24 March 2023.
Focusing on the different periods of EPB occurrence during the storm and by considering 22 March as a quiet day, S4 variations at different altitudes are discussed. The percentage of S4 ≥ 0.5 showed a significant increase from 1000 UT to 1500 UT, especially from 250 to 450 km altitude on 23 March, compared to the quiet day. This time period corresponds to the sunset/post-sunset period in the Asian region during the early phases of the storm. The uplift of the strong scintillation might be due to the presence of post-sunset EPBs in East Asia that were not seen on 22 March. The decrease in occurrence from 1700 UT onwards probably corresponds to the suppression of EPBs in the Asian sector, as discussed above. At sunset time in America, i.e., 2100 UT and onwards on 23 March, the S4 ≥ 0.5 first showed decrement and later (0200 UT, 24 March onwards) increased at all altitudes. The number exhibited a notable enhancement from the post-midnight to post-sunrise periods (1300 UT) in the American sector as compared to the reference day. The number reduced significantly during the recovery period on 24 March. The above analysis not only explains the strong amplitude scintillation caused by EPBs but also a strong correlation between the irregularity occurrence and F7/C2 driven S4 ≥ 0.5 percentage [39,52,53]. There could be a possibility of irregularity occurrence at the longitudes not covered in this study; nevertheless, that contribution may be insignificant during the sunset/sunrise hours at longitudinally conjugate Asian and American sectors (covered in this study).
The irregularity occurrences cause significant ionospheric scintillation due to amplitude (S4) and phase fluctuations (as seen in the ROTI map), adversely affecting satellite signals [24,25]. The amplitude fading during the occurrence of EPBs impacts positioning and navigation, especially during strong geomagnetic storms [13,87]. The strong consistency between S4 ≥ 0.5 percentage occurrence and EPB occurrence rate discussed above suggests a strong impact of storm-induced electric fields on amplitude scintillation. For instance, strong DDEF effects are prevalent on S4 during the recovery/post-recovery phase of the storm, as seen in Figure 17. Similar findings have been reported by Duann et al. [53] regarding the role of storm-time electric fields on S4 scintillation during the loss of SpaceX Starlink satellites. The authors, utilizing the F7/C2 profiles, observed a complete disappearance of strong S4 during the post-storm conditions. Moreover, the rise in the F-layer peak during the storm main phase was positively related to S4 occurrences. A detailed study in this regard will aid in establishing a better understanding of the correlation.
5. Conclusions
Ionospheric irregularities and disturbances during the March 2023 geomagnetic storm have been investigated over the American and Asian sectors in this work by employing multi-instrument observations. The main conclusions are presented as follows:
- The formation of post-sunset EPBs during the main phase in eastern Brazil (~40°W) and inhibition in western Brazil (~60°W) are associated with the coexistence of PPEF and DDEF and their LT dependence;
- Enhancement in post-sunset EPBs indicates an absence of westward DDEF on the western coast of America; however, a poleward shift at ~2100 LT suggests the presence of eastward DDEF;
- The observation of EPBs during near-sunrise to post-sunrise periods in the American sector is associated with the eastward DDEF at the storm recovery phase;
- In the Indian sector, the suppression of post-sunset irregularities during the main phase is due to the effect of over-shielding PEF followed by the westward turning of PPEF. In the East Asian sector, EPBs persisted for a long time, and this longitudinal difference is due to the LT dependence on storm-induced electric fields;
- At the initial phase, a decrease in TEC values in the East Asian sector could have been associated with the sudden increase in solar wind velocity. However, no TEC change was observed in the Indian sector;
- The main phase was on the dayside in the American sector; therefore, a strong fountain effect was observed, reaching beyond EIA crest latitudes. No TEC variations were observed in the Asian sector due to low background TEC values at night, except for some depletions due to EPBs;
- In the early recovery phase, TEC depletions suggested the presence of EPBs in the American sector. However, on the dayside, TEC in the Asian sector exhibited negative storms except for an increase at equatorial latitudes. This increase at dip-equatorial stations is associated with the ceasing of double peak EIA structure and downward motion of plasma from higher to lower latitudes owing to the strong DDEF. The thermospheric O/N2 change also played a role;
- The observation of negative ionospheric storms after ~1000 UT on 24 March at both sectors suggests a strong influence of westward DDEF due to disturbed neutral winds. The inhibition of ionospheric irregularity during the recovery phase is due to the same reason;
- F7/C2 RO profiles show that the amplitude scintillation (S4) ≥ 0.5 is consistent with the EPB occurrence at the F-layer peak.
The use of simultaneous multi-instrument observations has provided an opportunity to assess and cross-validate magnetospheric–ionospheric–thermospheric coupling in detail. Moreover, this study may further contribute to understanding the ionospheric responses under the influence of storm-phase and LT-dependent complex electric fields. As the solar cycle 25 is on the rise, more intense geomagnetic storms are expected; hence, a detailed understating of ionospheric variations may help researchers make predictions for the rest of the solar cycle.
Author Contributions
Conceptualization, A.T. and F.W.; methodology, software A.T.; validation, M.S., C.A.-M., P.J. and T.G.W.V.; formal analysis and investigation, A.T. and T.G.W.V.; writing—original draft preparation, A.T.; writing—review and editing, A.T., F.W., M.S., C.A.-M., P.J. and M.A.A.; supervision, F.W. and M.A.A. All authors have read and agreed to the published version of the manuscript.
Funding
This research received no external funding.
Data Availability Statement
Data source links have been mentioned in the methodology section.
Acknowledgments
The authors acknowledge the use of data from the Chinese Meridian Project and Embrace/INPE program. Robert Kerr of CPI and Jonas Souza of INPE are acknowledged for the provision of neutral wind data via the Madrigal database. A.T. is grateful to the China Scholarship Council (CSC) and the Asia-Pacific Space Cooperation Organization (APSCO).
Conflicts of Interest
The authors declare no conflicts of interest.
References
- Kärhä, O.; Tanskanen, E.I.; Vanhamäki, H. Large regional variability in geomagnetic storm effects in the auroral zone. Sci. Rep. 2023, 13, 18888. [Google Scholar] [CrossRef] [PubMed]
- Astafyeva, E.; Zakharenkova, I.; Huba, J.D.; Doornbos, E.; Van den IJssel, J. Global Ionospheric and Thermospheric Effects of the June 2015 Geomagnetic Disturbances: Multi-Instrumental Observations and Modeling. J. Geophys. Res. Space Phys. 2017, 122, 11–716. [Google Scholar] [CrossRef] [PubMed]
- Nishida, A. Geomagnetic Dp 2 fluctuations and associated magnetospheric phenomena. J. Geophys. Res. 1968, 73, 1795–1803. [Google Scholar] [CrossRef]
- Kelley, M.C.; Fejer, B.G.; Gonzales, C.A. An explanation for anomalous equatorial ionospheric electric fields associated with a northward turning of the interplanetary magnetic field. Geophys. Res. Lett. 1979, 6, 301–304. [Google Scholar] [CrossRef]
- Fejer, B.G.; Gonzales, C.A.; Farley, D.T.; Kelley, M.C.; Woodman, R.F. Equatorial electric fields during magnetically disturbed conditions 1. The effect of the interplanetary magnetic field. J. Geophys. Res. Space Phys. 1979, 84, 5797–5802. [Google Scholar] [CrossRef]
- Bulusu, J.; Archana, R.K.; Arora, K.; Chandrasekhar, N.P.; Nagarajan, N. Effect of Disturbance Electric Fields on Equatorial Electrojet Over Indian Longitudes. J. Geophys. Res. Space Phys. 2018, 123, 5894–5916. [Google Scholar] [CrossRef]
- Tulasi Ram, S.; Nilam, B.; Balan, N.; Zhang, Q.; Shiokawa, K.; Chakrabarty, D.; Xing, Z.; Venkatesh, K.; Veenadhari, B.; Yoshikawa, A. Three Different Episodes of Prompt Equatorial Electric Field Perturbations Under Steady Southward IMF Bz During St. Patrick’s Day Storm. J. Geophys. Res. Space Phys. 2019, 124, 10428–10443. [Google Scholar] [CrossRef]
- Hashimoto, K.K.; Kikuchi, T.; Tomizawa, I.; Nagatsuma, T. Substorm Overshielding Electric Field at Low Latitude on the Nightside as Observed by the HF Doppler Sounder and Magnetometers. J. Geophys. Res. Space Phys. 2017, 122, 10–851. [Google Scholar] [CrossRef]
- Blanc, M.; Richmond, A.D. The ionospheric disturbance dynamo. J. Geophys. Res. Space Phys. 1980, 85, 1669–1686. [Google Scholar] [CrossRef]
- Mazaudier, C.; Venkateswaran, S.V. Delayed ionospheric effects of the geomagnetic storms of March 22, 1979 studied by the sixth co-ordinated data analysis workshop (CDAW-6). Ann. Geophys. 1990, 8, 511–518. [Google Scholar]
- Sultan, P.J. Linear theory and modeling of the Rayleigh-Taylor instability leading to the occurrence of equatorial spread F. J. Geophys. Res. Space Phys. 1996, 101, 26875–26891. [Google Scholar] [CrossRef]
- Abdu, M.A. Equatorial spread F/plasma bubble irregularities under storm time disturbance electric fields. J. Atmos. Sol. Terr. Phys. 2012, 75–76, 44–56. [Google Scholar] [CrossRef]
- Sun, W.; Li, G.; Lei, J.; Zhao, B.; Hu, L.; Zhao, X.; Li, Y.; Xie, H.; Li, Y.; Ning, B.; et al. Ionospheric Super Bubbles Near Sunset and Sunrise During the 26–28 February 2023 Geomagnetic Storm. J. Geophys. Res. Space Phys. 2023, 128, e2023JA031864. [Google Scholar] [CrossRef]
- Patil, A.S.; Nade, D.P.; Taori, A.; Pawar, R.P.; Pawar, S.M.; Nikte, S.S.; Pawar, S.D. A Brief Review of Equatorial Plasma Bubbles. Space Sci. Rev. 2023, 219, 16. [Google Scholar] [CrossRef]
- Burke, W.J.; Gentile, L.C.; Huang, C.Y.; Valladares, C.E.; Su, S.Y. Longitudinal variability of equatorial plasma bubbles observed by DMSP and ROCSAT-1. J. Geophys. Res. Space Phys. 2004, 109, A12301. [Google Scholar] [CrossRef]
- Zhao, X.; Xie, H.; Hu, L.; Sun, W.; Hao, X.; Ning, B.; Takahashi, H.; Li, G. Climatology of equatorial and low-latitude F region kilometer-scale irregularities over the meridian circle around 120°E/60°W. GPS Solut. 2020, 25, 20. [Google Scholar] [CrossRef]
- Sobral, J.H.A.; Abdu, M.A.; Takahashi, H.; Taylor, M.J.; De Paula, E.R.; Zamlutti, C.J.; De Aquino, M.G.; Borba, G.L. Ionospheric plasma bubble climatology over Brazil based on 22 years (1977–1998) of 630nm airglow observations. J. Atmos. Sol. Terr. Phys. 2002, 64, 1517–1524. [Google Scholar] [CrossRef]
- Dao, T.; Otsuka, Y.; Shiokawa, K.; Nishioka, M.; Yamamoto, M.; Buhari, S.M.; Abdullah, M.; Husin, A. Coordinated observations of postmidnight irregularities and thermospheric neutral winds and temperatures at low latitudes. J. Geophys. Res. Space Phys. 2017, 122, 7504–7518. [Google Scholar] [CrossRef]
- Otsuka, Y. Review of the generation mechanisms of post-midnight irregularities in the equatorial and low-latitude ionosphere. Prog. Earth Planet. Sci. 2018, 5, 57. [Google Scholar] [CrossRef]
- Zhan, W.; Rodrigues, F.S.; Milla, M.A. On the Genesis of Postmidnight Equatorial Spread F: Results for the American/Peruvian Sector. Geophys. Res. Lett. 2018, 45, 7354–7361. [Google Scholar] [CrossRef]
- Carmo, C.S.; Pi, X.; Denardini, C.M.; Figueiredo, C.A.O.B.; Verkhoglyadova, O.P.; Picanço, G.A.S. Equatorial Plasma Bubbles Observed at Dawn and After Sunrise Over South America During the 2015 St. Patrick’s Day Storm. J. Geophys. Res. Space Phys. 2022, 127, e2021JA029934. [Google Scholar] [CrossRef]
- Otsuka, Y.; Shinbori, A.; Sori, T.; Tsugawa, T.; Nishioka, M.; Huba, J.D. Plasma depletions lasting into daytime during the recovery phase of a geomagnetic storm in May 2017: Analysis and simulation of GPS total electron content observations. Earth Planet Phys. 2021, 5, 427–434. [Google Scholar] [CrossRef]
- Sripathi, S.; Abdu, M.A.; Patra, A.K.; Ghodpage, R.N. Unusual Generation of Localized EPB in the Dawn Sector Triggered by a Moderate Geomagnetic Storm. J. Geophys. Res. Space Phys. 2018, 123, 9697–9710. [Google Scholar] [CrossRef]
- Otsuka, Y.; Spogli, L.; Tulasi Ram, S.; Li, G. Preface to the Special Issue on recent advances in the study of Equatorial Plasma Bubbles and Ionospheric Scintillation. Earth Planet. Phys. 2021, 5, eepp2021050. [Google Scholar] [CrossRef]
- Li, G.; Ning, B.; Otsuka, Y.; Abdu, M.A.; Abadi, P.; Liu, Z.; Spogli, L.; Wan, W. Challenges to Equatorial Plasma Bubble and Ionospheric Scintillation Short-Term Forecasting and Future Aspects in East and Southeast Asia. Surv. Geophys. 2021, 42, 201–238. [Google Scholar] [CrossRef]
- Rajana, S.S.K.; Panda, S.K.; Jade, S.; Vivek, C.G.; Upadhayaya, A.K.; Bhardwaj, A.; Jorphail, S.; Seemala, G.K. Impact of two severe geomagnetic storms on the ionosphere over Indian longitude sector during March–April 2023. Astrophys. Space Sci. 2024, 369, 3. [Google Scholar] [CrossRef]
- Astafyeva, E.; Zakharenkova, I.; Förster, M. Ionospheric response to the 2015 St. Patrick’s Day storm: A global multi-instrumental overview. J. Geophys. Res. Space Phys. 2015, 120, 9023–9037. [Google Scholar] [CrossRef]
- Venkatesh, K.; Patra, A.K.; Balan, N.; Fagundes, P.R.; Tulasi Ram, S.; Batista, I.S.; Reinisch, B.W. Superfountain Effect Linked With 17 March 2015 Geomagnetic Storm Manifesting Distinct F3 Layer. J. Geophys. Res. Space Phys. 2019, 124, 6127–6137. [Google Scholar] [CrossRef]
- Mansilla, G.A.; Zossi, M.M. Ionospheric response to the 26 August 2018 geomagnetic storm along 280°E and 316°E in the South American sector. Adv. Space Res. 2022, 69, 48–58. [Google Scholar] [CrossRef]
- Tariq, M.A.; Liu, L.; Shah, M.; Yang, Y.; Sun, W.; Shah, M.; Zhang, R.; Yoshikawa, A. Longitudinal variations of ionospheric responses to the February and April 2023 geomagnetic storms over American and Asian sectors. Adv. Space Res. 2024, 73, 3033–3049. [Google Scholar] [CrossRef]
- Buonsanto, M.J. Ionospheric Storms—A Review. Space Sci. Rev. 1999, 88, 563–601. [Google Scholar] [CrossRef]
- Li, G.; Ning, B.; Wang, C.; Abdu, M.A.; Otsuka, Y.; Yamamoto, M.; Wu, J.; Chen, J. Storm-Enhanced Development of Postsunset Equatorial Plasma Bubbles Around the Meridian 120°E/60°W on 7–8 September 2017. J. Geophys. Res. Space Phys. 2018, 123, 7985–7998. [Google Scholar] [CrossRef]
- Li, W.; Liu, L.; Chen, Y.; Yang, Y.; Han, T.; Ding, F.; Le, H.; Zhang, R. Multi-Instruments Observation of Ionospheric-Thermospheric Dynamic Coupling Over Mohe (53.5°N, 122.3°E) During the April 2023 Geomagnetic Storm. J. Geophys. Res. Space Phys. 2023, 128, e2023JA032141. [Google Scholar] [CrossRef]
- Shahzad, R.; Shah, M.; Tariq, M.A.; Calabia, A.; Melgarejo-Morales, A.; Jamjareegulgarn, P.; Liu, L. Ionospheric-Thermospheric Responses to Geomagnetic Storms from Multi-Instrument Space Weather Data. Remote Sens. 2023, 15, 2687. [Google Scholar] [CrossRef]
- Santos, A.M.; Abdu, M.A.; Sobral, J.H.A.; Koga, D.; Nogueira, P.A.B.; Candido, C.M.N. Strong longitudinal difference in ionospheric responses over Fortaleza (Brazil) and Jicamarca (Peru) during the January 2005 magnetic storm, dominated by northward IMF. J. Geophys. Res. Space Phys. 2012, 117, A08333. [Google Scholar] [CrossRef]
- Abdu, M.A.; De Paula, E.R.; Batista, I.S.; Reinisch, B.W.; Matsuoka, M.T.; Camargo, P.O.; Veliz, O.; Denardini, C.M.; Sobral, J.H.A.; Kherani, E.A.; et al. Abnormal evening vertical plasma drift and effects on ESF and EIA over Brazil-South Atlantic sector during the 30 October 2003 superstorm. J. Geophys. Res. Space Phys. 2008, 113, A07313. [Google Scholar] [CrossRef]
- Abdu, M.A.; Batista, I.S.; Sobral, J.H.A. A new aspect of magnetic declination control of equatorial spread F and F region dynamo. J. Geophys. Res. Space Phys. 1992, 97, 14897–14904. [Google Scholar] [CrossRef]
- Abdu, M.A.; Bittencourt, J.A.; Batista, I.S. Magnetic declination control of the equatorial F region dynamo electric field development and spread F. J. Geophys. Res. Space Phys. 1981, 86, 11443–11446. [Google Scholar] [CrossRef]
- Wang, Y.; Yuan, Y.; Li, M.; Zhang, T.; Geng, H.; Wang, G.; Wen, G. Effects of Strong Geomagnetic Storms on the Ionosphere and Degradation of Precise Point Positioning Accuracy during the 25th Solar Cycle Rising Phase: A Case Study. Remote Sens. 2023, 15, 5512. [Google Scholar] [CrossRef]
- Oyama, S.; Vanhamäki, H.; Cai, L.; Shinbori, A.; Hosokawa, K.; Sakanoi, T.; Shiokawa, K.; Aikio, A.; Virtanen, I.I.; Ogawa, Y.; et al. Thermospheric Wind Response to March 2023 Storm: Largest Wind Ever Observed With a Fabry-Perot Interferometer in Tromsø, Norway Since 2009. Space Weather 2024, 22, e2023SW003728. [Google Scholar] [CrossRef]
- Seemala, G.K.; Valladares, C.E. Statistics of total electron content depletions observed over the South American continent for the year 2008. Radio Sci. 2011, 46, 1–14. [Google Scholar] [CrossRef]
- Carmo, C.S.; Denardini, C.M.; Figueiredo, C.A.O.B.; Resende, L.C.A.; Picanço, G.A.D.S.; Neto, P.F.B.; Nogueira, P.A.B.; Moro, J.; Chen, S.S. Evaluation of Different Methods for Calculating the ROTI Index Over the Brazilian Sector. Radio. Sci. 2021, 56, e2020RS007140. [Google Scholar] [CrossRef]
- Pi, X.; Mannucci, A.J.; Lindqwister, U.J.; Ho, C.M. Monitoring of global ionospheric irregularities using the Worldwide GPS Network. Geophys. Res. Lett. 1997, 24, 2283–2286. [Google Scholar] [CrossRef]
- Cherniak, I.; Krankowski, A.; Zakharenkova, I. ROTI Maps: A new IGS ionospheric product characterizing the ionospheric irregularities occurrence. GPS Solut. 2018, 22, 69. [Google Scholar] [CrossRef]
- Liu, X.; Yuan, Y.; Tan, B.; Li, M. Observational Analysis of Variation Characteristics of GPS-Based TEC Fluctuation over China. ISPRS Int. J. Geoinf. 2016, 5, 237. [Google Scholar] [CrossRef]
- Oladipo, O.A.; Schüler, T. Equatorial ionospheric irregularities using GPS TEC derived index. J. Atmos. Sol. Terr. Phys. 2013, 92, 78–82. [Google Scholar] [CrossRef]
- Atıcı, R.; Sağır, S. Global investigation of the ionospheric irregularities during the severe geomagnetic storm on September 7–8, 2017. Geod. Geodyn. 2020, 11, 211–221. [Google Scholar] [CrossRef]
- Shinbori, A.; Otsuka, Y.; Tsugawa, T.; Nishioka, M.; Kumamoto, A.; Tsuchiya, F.; Matsuda, S.; Kasahara, Y.; Matsuoka, A. Relationship Between the Locations of the Midlatitude Trough and Plasmapause Using GNSS-TEC and Arase Satellite Observation Data. J. Geophys. Res. Space Phys. 2021, 126, e2020JA028943. [Google Scholar] [CrossRef]
- Khmyrov, G.M.; Galkin, I.A.; Kozlov, A.V.; Reinisch, B.W.; McElroy, J.; Dozois, C. Exploring Digisonde Ionogram Data with SAO-X and DIDBase. AIP Conf. Proc. 2008, 974, 175–185. [Google Scholar] [CrossRef]
- Astafyeva, E.; Yasyukevich, Y.V.; Maletckii, B.; Oinats, A.; Vesnin, A.; Yasyukevich, A.S.; Syrovatskii, S.; Guendouz, N. Ionospheric Disturbances and Irregularities During the 25–26 August 2018 Geomagnetic Storm. J. Geophys. Res. Space Phys. 2022, 127, e2021JA029843. [Google Scholar] [CrossRef]
- Schreiner, W.S.; Weiss, J.P.; Anthes, R.A.; Braun, J.; Chu, V.; Fong, J.; Hunt, D.; Kuo, Y.H.; Meehan, T.; Serafino, W.; et al. COSMIC-2 Radio Occultation Constellation: First Results. Geophys. Res. Lett. 2020, 47, e2019GL086841. [Google Scholar] [CrossRef]
- Chen, S.P.; Lin, C.; Rajesh, P.K.; Liu, J.Y.; Eastes, R.; Chou, M.Y.; Choi, J.M. Near Real-Time Global Plasma Irregularity Monitoring by FORMOSAT-7/COSMIC-2. J. Geophys. Res. Space Phys. 2021, 126, e2020JA028339. [Google Scholar] [CrossRef]
- Duann, Y.; Chang, L.C.; Liu, J.Y. Impact of the February 3–4, 2022 geomagnetic storm on ionospheric S4 amplitude scintillation index: Observations and implications. Adv. Space Res. 2023, 72, 4379–4391. [Google Scholar] [CrossRef]
- Rastogi, R.G. The equatorial electrojet: Magnetic and ionsopheric effects. Geomagentism 1989, 3, 461–525. [Google Scholar]
- Anderson, D.; Anghel, A.; Chau, J.; Veliz, O. Daytime vertical E × B drift velocities inferred from ground-based magnetometer observations at low latitudes. Space Weather 2004, 2, 1–9. [Google Scholar] [CrossRef]
- Shimeis, A.; Fathy, I.; Amory-Mazaudier, C.; Fleury, R.; Mahrous, A.M.; Yumoto, K.; Groves, K. Signature of the coronal hole near the north crest equatorial anomaly over Egypt during the strong geomagnetic storm 5 April 2010. J. Geophys. Res. Space Phys. 2012, 117, A07309. [Google Scholar] [CrossRef]
- Le Huy, M.; Amory-Mazaudier, C. Magnetic signature of the ionospheric disturbance dynamo at equatorial latitudes: “Ddyn”. J. Geophys. Res. Space Phys. 2005, 110, A10301. [Google Scholar] [CrossRef]
- Manoj, C.; Maus, S. A real-time forecast service for the ionospheric equatorial zonal electric field. Space Weather 2012, 10, S09002. [Google Scholar] [CrossRef]
- Scherliess, L.; Fejer, B.G. Radar and satellite global equatorial F region vertical drift model. J. Geophys. Res. Space Phys. 1999, 104, 6829–6842. [Google Scholar] [CrossRef]
- Archana, R.K.; Arora, K.; Nagarajan, N. Prompt penetration effects on Equatorial Electrojet from the Indian sector. Earth Planets Space 2023, 75, 122. [Google Scholar] [CrossRef]
- Ren, X.; Le, X.; Mei, D.; Liu, H.; Zhang, X. IROTI: A new index to detect and identify traveling ionospheric disturbances and equatorial plasma bubbles. GPS Solut. 2023, 28, 7. [Google Scholar] [CrossRef]
- Kepkar, A.; Arras, C.; Wickert, J.; Schuh, H.; Alizadeh, M.; Tsai, L.C. Occurrence climatology of equatorial plasma bubbles derived using FormoSat-3/COSMIC GPS radio occultation data. Ann. Geophys. 2020, 38, 611–623. [Google Scholar] [CrossRef]
- Huang, F.; Lei, J.; Xiong, C.; Zhong, J.; Li, G. Observations of equatorial plasma bubbles during the geomagnetic storm of October 2016. Earth Planet Phys. 2021, 5, eepp2021043. [Google Scholar] [CrossRef]
- Batista, I.S.; de Medeiros, R.T.; Abdu, M.A.; de Souza, J.R.; Bailey, G.J.; de Paula, E.R. Equatorial ionospheric vertical plasma drift model over the Brazilian region. J. Geophys. Res. Space Phys. 1996, 101, 10887–10892. [Google Scholar] [CrossRef]
- Abdu, M.A. Outstanding problems in the equatorial ionosphere–thermosphere electrodynamics relevant to spread F. J. Atmos. Sol. Terr. Phys. 2001, 63, 869–884. [Google Scholar] [CrossRef]
- Tsurutani, B.T.; Verkhoglyadova, O.P.; Mannucci, A.J.; Saito, A.; Araki, T.; Yumoto, K.; Tsuda, T.; Abdu, M.A.; Sobral, J.H.A.; Gonzalez, W.D.; et al. Prompt penetration electric fields (PPEFs) and their ionospheric effects during the great magnetic storm of 30–31 October 2003. J. Geophys. Res. Space Phys. 2008, 113, A05311. [Google Scholar] [CrossRef]
- Sreeja, V.; Devasia, C.V.; Ravindran, S.; Pant, T.K. Observational evidence for the plausible linkage of Equatorial Electrojet (EEJ) electric field variations with the post sunset F-region electrodynamics. Ann. Geophys. 2009, 27, 4229–4238. [Google Scholar] [CrossRef][Green Version]
- Uemoto, J.; Maruyama, T.; Saito, S.; Ishii, M.; Yoshimura, R. Relationships between pre-sunset electrojet strength, pre-reversal enhancement and equatorial spread-F onset. Ann. Geophys. 2010, 28, 449–454. [Google Scholar] [CrossRef]
- Fejer, B.G. The electrodynamics of the low-latitude ionosphere: Recent results and future challenges. J. Atmos. Sol. Terr. Phys. 1997, 59, 1465–1482. [Google Scholar] [CrossRef]
- Fejer, B.G.; Scherliess, L. Empirical models of storm time equatorial zonal electric fields. J. Geophys. Res. Space Phys. 1997, 102, 24047–24056. [Google Scholar] [CrossRef]
- Huang, C.M. Disturbance dynamo electric fields in response to geomagnetic storms occurring at different universal times. J. Geophys. Res. Space Phys. 2013, 118, 496–501. [Google Scholar] [CrossRef]
- Adekoya, B.J.; Adebesin, B.O. Hemispheric, seasonal and latitudinal dependence of storm-time ionosphere during low solar activity period. Adv. Space Res. 2014, 54, 2184–2193. [Google Scholar] [CrossRef]
- Mendillo, M. Storms in the ionosphere: Patterns and processes for total electron content. Rev. Geophys. 2006, 44, RG4001. [Google Scholar] [CrossRef]
- Huba, J.D.; Krall, J. Impact of meridional winds on equatorial spread F: Revisited. Geophys. Res. Lett. 2013, 40, 1268–1272. [Google Scholar] [CrossRef]
- González, G.D.L. Ionospheric irregularities during disturbed geomagnetic conditions over Argentinian EIA region. Acta Geod. Geophys. 2022, 57, 129–155. [Google Scholar] [CrossRef]
- Sidorova, L.N. Equatorial Plasma Bubbles: Zonal Thermosphere Wind Influence. Geomagn. Aeron. 2023, 63, 780–787. [Google Scholar] [CrossRef]
- Loutfi, A.; Bounhir, A.; Pitout, F.; Benkhaldoun, Z.; Makela, J.J. Thermospheric Neutral Winds Above the Oukaimeden Observatory: Effects of Geomagnetic Activity. J. Geophys. Res. Space Phys. 2020, 125, e2019JA027383. [Google Scholar] [CrossRef]
- Malki, K.; Bounhir, A.; Benkhaldoun, Z.; Makela, J.J.; Vilmer, N.; Fisher, D.J.; Kaab, M.; Elbouyahyaoui, K.; Harding, B.J.; Laghriyeb, A.; et al. Ionospheric and thermospheric response to the 27–28 February 2014 geomagnetic storm over north Africa. Ann. Geophys. 2018, 36, 987–998. [Google Scholar] [CrossRef]
- Kim, J.; Kwak, Y.S.; Lee, C.; Lee, J.; Kam, H.; Yang, T.Y.; Jee, G.; Kim, Y. Observational evidence of thermospheric wind and composition changes and the resulting ionospheric disturbances in the European sector during extreme geomagnetic storms. J. Space Weather Space Clim. 2023, 13, 24. [Google Scholar] [CrossRef]
- Hashimoto, K.K.; Kikuchi, T.; Watari, S.; Abdu, M.A. Polar-equatorial ionospheric currents driven by the region 2 field-aligned currents at the onset of substorms. J. Geophys. Res. Space Phys. 2011, 116, A09217. [Google Scholar] [CrossRef]
- Jin, H.; Zou, S.; Chen, G.; Yan, C.; Zhang, S.; Yang, G. Formation and Evolution of Low-Latitude F Region Field-Aligned Irregularities During the 7–8 September 2017 Storm: Hainan Coherent Scatter Phased Array Radar and Digisonde Observations. Space Weather 2018, 16, 648–659. [Google Scholar] [CrossRef]
- Timoçin, E.; Inyurt, S.; Temuçin, H.; Ansari, K.; Jamjareegulgarn, P. Investigation of equatorial plasma bubble irregularities under different geomagnetic conditions during the equinoxes and the occurrence of plasma bubble suppression. Acta Astronaut. 2020, 177, 341–350. [Google Scholar] [CrossRef]
- Lei, J.; Zhu, Q.; Wang, W.; Burns, A.G.; Zhao, B.; Luan, X.; Zhong, J.; Dou, X. Response of the topside and bottomside ionosphere at low and middle latitudes to the October 2003 superstorms. J. Geophys. Res. Space Phys. 2015, 120, 6974–6986. [Google Scholar] [CrossRef]
- Zhang, J.; Li, Q.; Li, S.; Liu, J. Statistical analysis of equatorial electrojet responses to the transient changes of solar wind conditions. Front. Astron. Space Sci. 2023, 10, 1306279. [Google Scholar] [CrossRef]
- Deng, K.; Wang, S.; Deng, B.; Ma, Y.; Guo, Z. Disturbance electric fields and their effect on ionospheric TEC and scintillations over south China. Adv. Space Res. 2023, 72, 1266–1276. [Google Scholar] [CrossRef]
- Deng, B.; Huang, J.; Kong, D.; Xu, J.; Wan, D.; Lin, G. Temporal and spatial distributions of TEC depletions with scintillations and ROTI over south China. Adv. Space Res. 2015, 55, 259–268. [Google Scholar] [CrossRef]
- Salles, L.A.; Vani, B.C.; Moraes, A.; Costa, E.; de Paula, E.R. Investigating Ionospheric Scintillation Effects on Multifrequency GPS Signals. Surv. Geophys. 2021, 42, 999–1025. [Google Scholar] [CrossRef]
Disclaimer/Publisher’s Note: The statements, opinions and data contained in all publications are solely those of the individual author(s) and contributor(s) and not of MDPI and/or the editor(s). MDPI and/or the editor(s) disclaim responsibility for any injury to people or property resulting from any ideas, methods, instructions or products referred to in the content. |
© 2024 by the authors. Licensee MDPI, Basel, Switzerland. This article is an open access article distributed under the terms and conditions of the Creative Commons Attribution (CC BY) license (https://creativecommons.org/licenses/by/4.0/).