Article

Trajectory Deviation Estimation Method for UAV-Borne Through-Wall Radar

1
School of Information and Electronics, Beijing Institute of Technology, Beijing 100081, China
2
Yangtze Delta Region Academy of Beijing Institute of Technology, Jiaxing 314019, China
3
Beijing Institute of Technology Chongqing Innovation Center, Chongqing 401120, China
*
Author to whom correspondence should be addressed.
Remote Sens. 2024, 16(9), 1593; https://doi.org/10.3390/rs16091593
Submission received: 27 February 2024 / Revised: 27 April 2024 / Accepted: 28 April 2024 / Published: 30 April 2024
(This article belongs to the Topic Radar Signal and Data Processing with Applications)

Abstract

:
Mini–unmanned aerial vehicles (mini-UAVs) are emerging as a promising platform for through-wall radar to sense the enclosed space in cities, especially high-rise buildings, due to their excellent maneuverability. However, due to unavoidable environmental interference such as airflow, mini-UAVs are prone to trajectory deviation thus degrading their sensing accuracy. Most of the existing approaches model the impact of trajectory deviation into a polynomial phase error on the received signal, which cannot fit the space-variant motion error well. Moreover, the large trajectory deviations of UAVs introduce the unavoidable envelope error. This article proposes an autofocusing algorithm based on the back projection (BP) image, which directly estimates the trajectory deviations between the actual and measured track. Thus, the problem of the 2D space variability of the motion error can be circumvented. The proposed method mainly consists of two steps. First, we estimate the trajectory deviation in the line-of-sight (LOS) direction by exploring the underlying linear property of the wall embedded in the BP imaging result. Then, the estimated trajectory deviation in the LOS direction is compensated for to obtain an updated BP image, followed by a Particle Swarm Optimization (PSO) approach to estimate the trajectory deviation along the track through focusing targets behind the wall. Simulations and practical experiments show that the proposed algorithm can accurately estimate the serious trajectory deviations larger than the range resolution, improving the sensing robustness of UAV-borne through-wall radar greatly.

1. Introduction

Mini-UAVs equipped with lightweight frequency modulation continuous wave (FMCW) radar are becoming promising candidates for near-range sensing [1,2] and high-rise building [3,4] detection thanks to their maneuverability and flexibility. However, many factors such as ambient airflow disturb the trajectory of mini-UAVs severely, preventing them from sampling the data uniformly along a straight line. Therefore, the disturbance of the airflow on the trajectory has to be estimated and compensated prior to imaging, tracking, etc. Otherwise, the trajectory deviation will induce extra errors in the envelope and phase of the received signal, defocusing the imaging results to different extents [5,6].
Many efforts have been made to estimate and compensate for the motion errors of synthetic aperture radar (SAR). Technically, the existing work can be classified into two categories, i.e., parametric and non-parametric methods. A parametric algorithm mainly converts the estimation of phase error caused by trajectory deviations into solving the parameters embedded in different phase error models such as limited polynomial coefficients [7,8,9,10,11] and discrete cosine transform (DCT) coefficients [12,13]. For example, the map drift (MD) algorithm [7] first constructs a second-order polynomial phase error model. Then, it divides the aperture into two subapertures and transforms each subaperture into the image domain via Fourier transform (FT). Finally, the quadratic phase error (QPE) coefficients are estimated from the drifts between the subimages. Similarly, the phase difference autofocus (PDA) [8] algorithm obtains the QPE coefficients from the FT of the phase difference function built from the subaperture data. While MD [7] and PDA [8] consider the second-order polynomial error only, the performance degrades in practice when there are more complex errors with higher orders. To improve the accuracy, the N subaperture-based methods are studied to estimate the coefficients of an Nth-order polynomial error model. For example, the multiple aperture mapdrift (MAM) algorithm [7,9,10] divides the range-compressed data into N subapertures and estimates the Nth-order polynomial error coefficient through the drift between N ( N 1 ) / 2 pairs of the subapertures. A pseudo-inverse matrix of N ( N 1 ) 2 × ( N 1 ) dimension is calculated to obtain the coefficients. In this way, the complexity increases with the number of subapertures. In addition, for these algorithms utilizing the drift between subapertures, a small subaperture would cause poor azimuth resolution and a low signal-to-clutter-noise ratio (SCNR). They also require range bins containing strong scatterers with high SNR to enable high correlation between subapertures. The contrast optimization autofocus (COA) algorithm [11] employs image contrast as the optimization function to estimate quadratic phase error coefficients, which can greatly deal with the scenario lacking strong scatterers. As introduced, the parameter-based algorithms need to specify the highest order of the phase error model. Otherwise, it will induce a wrong estimation. When there exists a complex form of motion errors, parameter-based algorithms can not fit it well. In addition, the calculation complexity increases with the number of error orders as well.
Instead of modeling the error and solving the related coefficients, non-parametric algorithms do not rely on the phase error model. They are applicable for estimating and eliminating arbitrary-order phase errors higher than one. In 1994, a robust phase gradient autofocusing (PGA) algorithm [14] was proposed for spotlight SAR. It reduces the phase error during multiple iterations by exploring its statistical property. However, the maximum likelihood (ML) estimator in PGA is derived based on the assumption that the clutter in each range bin can be assumed to follow the white Gaussian distribution, which does not always hold in many practical scenarios. The weighted least squares (WLS) [15] algorithm requires no assumption on the clutter model. It estimates phase error from multiple range bins through weighted least squares criteria. Both PGA and WLS autofocus algorithms are developed based on isolated strong scatterers with a high signal-to-clutter-noise ratio (SCNR). More autofocus algorithms [16,17,18] are also studied by maximizing the image sharpness without special requirements on strong scatterers.
Although a great deal of research has been devoted to estimating the space-invariant phase error, the estimation of 2D space variant motion error should be studied for near-range detection using wide-beam radar. Towards this end, many approaches have been proposed to estimate the motion errors under the wide-beam assumption [19,20,21,22,23,24]. In [19], the geometric error is reconstructed using six parameters and solved by the maximum intensity correlation criterion, which results in a huge computational burden. There are algorithms with less computation complexity. By subdividing an image or aperture, the MD algorithm is applied to realize local autofocusing and estimate the space invariant local phase errors [20]. Then, the local phase errors are concatenated into a full space variant phase error vector. In [21], an improved weighted-phase gradient autofocus (WPGA) is firstly applied for local autofocusing to obtain an estimation of the phase errors in the azimuth-time domain. Subsequently, the estimated phase errors are converted into a trajectory deviation of a subaperture through the WLS method. Finally, trajectory deviations of multiple subapertures are fused into trajectory deviations corresponding to the full aperture. Different from [21], autofocusing of local BP images is explored to estimate the 2D space variant motion error in [22,23]. However, BP-based autofocusing algorithms suffer from the phase wrapping problem. Reference [24] presents an algorithm for estimating the jointly 2D space variant motion error in three steps: estimating the space-invariant motion error, estimating the azimuth-variant motion error in one range block, and estimating the range-variant motion error. Due to the variation in the Doppler centroid frequency in mini-UAV-borne radar with respect to the azimuth time, the imaging scenarios for different subapertures in the azimuthal frequency domain are different. As a result, the errors corresponding to different subapertures do not ideally match with the azimuthal space-variant errors. To conclude, for the algorithms utilizing local autofocus, the process of fusing multiple local phase errors into the ultimate phase error may induce additional errors in practice. Moreover, the block size of the images or subapertures should be well designed. A small block or aperture results in poor azimuth resolution, low SNR, heavy calculation complexity, etc. On the contrary, a large block or subaperture can increase residual space-variant phase errors since the motion error does not meet the assumption of local 2D space invariability.
The 2D space variability of the motion error becomes more obvious when it comes to through-wall detection by UAV-borne radar. The main reason is that through-wall radar usually works at a low center frequency (L/S band) with the wavelength ranging from 7.5 cm to 30 cm to maintain the penetrating ability. Moreover, subject to the load capacity of UAVs, the size of the antenna is limited for UAV-borne radar. The small size and low center frequency of the antenna result in a wide beam width [25,26,27,28]. In this case, multiple targets may distribute in different locations in one beam width. Moreover, the trajectory deviation of UAVs can be larger than the range resolution, rendering severe envelope error. To the best of our knowledge, most of the conventional motion estimation and compensation algorithms are not applicable in this case.
This article proposes an autofocus algorithm for estimating the trajectory deviation of mini-UAV-borne through-wall radar, which can estimate both the envelope and phase error. The optimization algorithm is based on BP imaging results with both the wall and targets behind. Given the linear characteristic of the wall in the BP image, it behaves like a peak after Radon transformation (aka. R f domain). In this sense, by optimizing the entropy of the image in the R f domain, the trajectory deviation in the line-of-sight direction is estimated through the Particle Swarm Optimization (PSO) method. Following the compensation for the line-of-sight direction, the trajectory deviation along the track is estimated based on the entropy of the new BP image of targets without line-of-sight deviation. The proposed algorithm can deal with both the envelope error and the phase error, suitable for estimation and compensation when the trajectory deviation is much larger than the range resolution. Consequently, the algorithm can achieve estimation accuracy at the level of range resolution. The performance of the algorithm is validated by simulation and experimental results.
This article is organized as follows. Section 2 illustrates the theoretical foundations and mathematical models of motion error estimation. Section 3 elaborates on the trajectory deviation estimation algorithm. In Section 4, the simulation and experimental results are analyzed to validate the proposed algorithm.  Section 5 offers additional insight into the proposed algorithm. Finally, Section 6 concludes the paper.

2. UAV-Based Signal Model for Through-Wall Radar

2.1. Propagation Model of Electromagnetic Waves in a Through-Wall Scenario

After being transmitted by radar, electromagnetic waves refract as they propagate through the wall. The approximate path after refraction can be obtained by calculating the approximate refraction point on the wall surface. As shown in Figure 1a, the radar T x is located at coordinates X 1 , Y 1 , while the target T r behind the wall is positioned at X 2 , Y 2 . The solid rectangle denotes the actual position of the wall, while the dashed rectangle represents the equivalent wall position, closely adjacent to the radar. The refraction points for electromagnetic waves incident into the wall from free space and transmitted from the rear surface of the wall are denoted as points A and B, respectively. Relatively, regarding the equivalent wall position, consideration only needs to be given to the equivalent refraction point C for electromagnetic waves transmitted from the rear surface of the wall. θ i and θ t are the incidence angle and refraction angle, respectively. The slant range of the target remains constant regardless of the distance between the radar and the wall [29], i.e., A T x + A B + B T r = C T x + C T r . Therefore, the slant range can be calculated under the assumption that the antenna is in proximity to the dashed wall. From Snell’s law, we have
sin θ i sin θ t = ε .
The one-way propagation path is
R = ε C T x + C T r .
From the geometric approximation [29], we obtain
R = T x T r + d ε sin 2 θ i cos θ i ,
where ε and d are the dielectric constant and the thickness of the wall, respectively. The calculation of the refraction point C on the internal surface of the wall is omitted by replacing the angle θ i with the angle θ q between the straight line T x T r and the normal vector, i.e.,
θ i θ q = arctan X 2 X 1 Y 2 Y 1 .

2.2. Signal Model of Trajectory Deviation

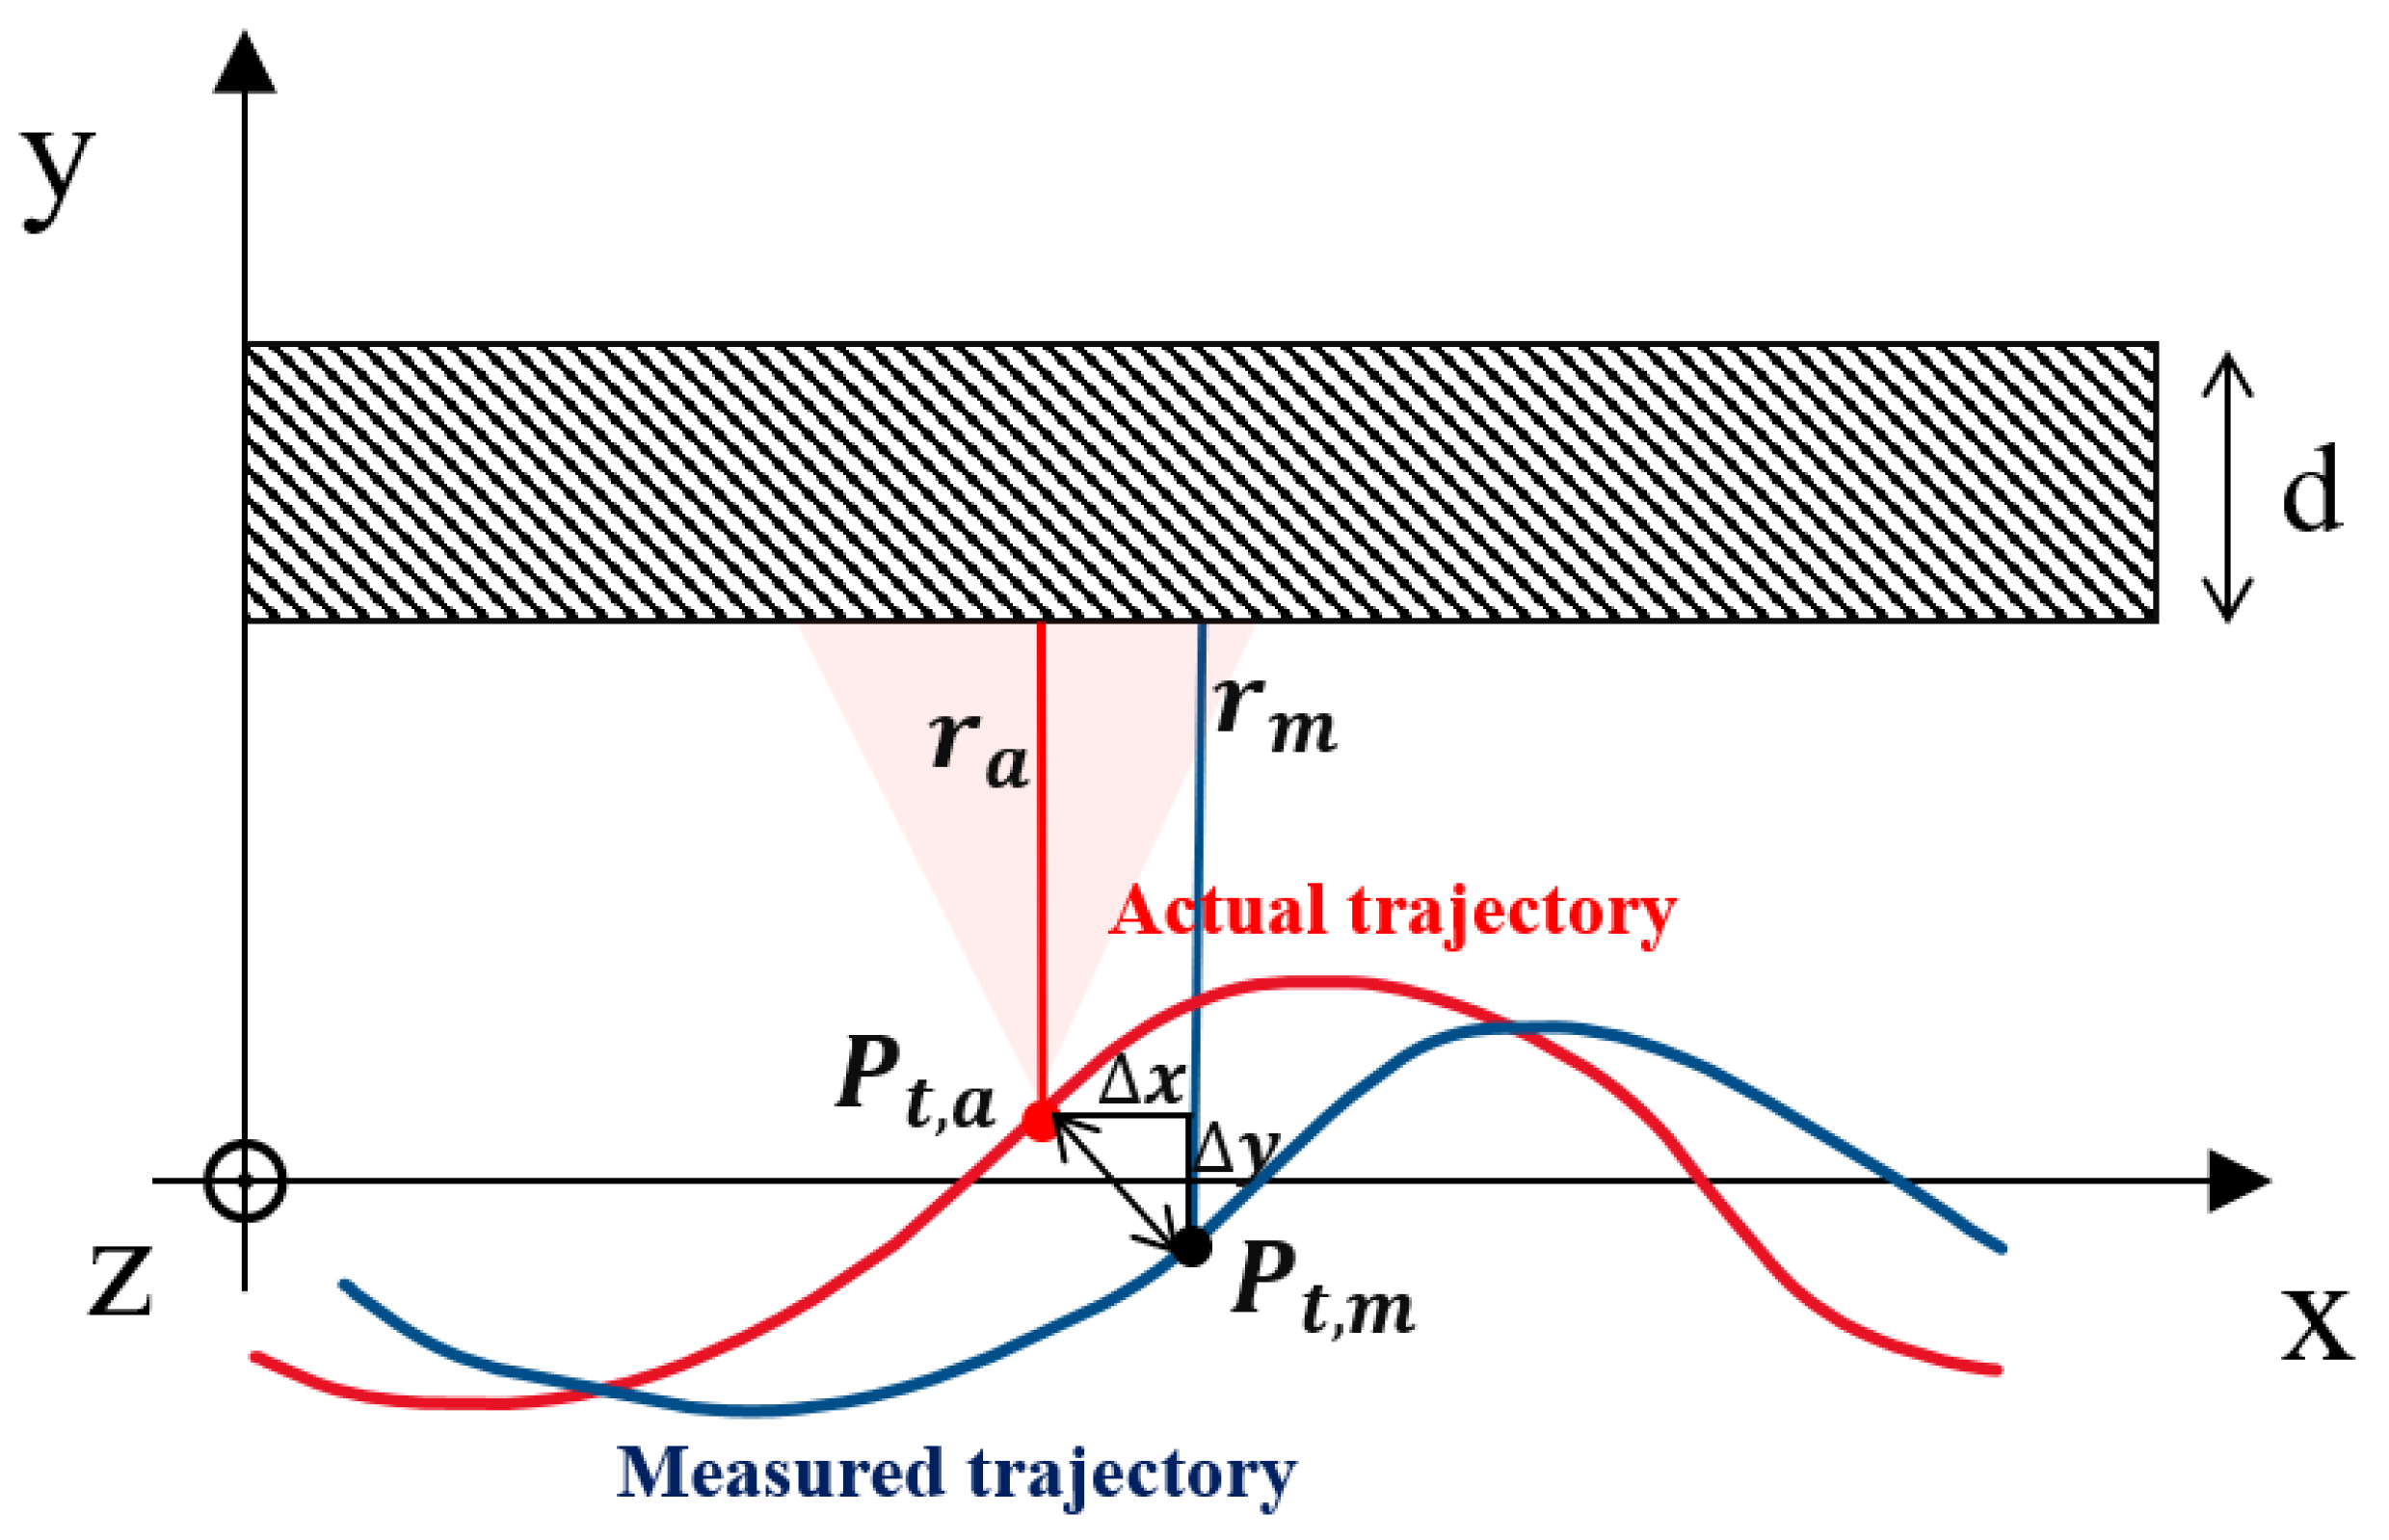
Figure 1b illustrates the trajectory deviation of a mini-UAV. The radar moves along the X-axis with the irradiation direction of the beam perpendicular to the wall. We denote the Y-axis as the line-of-sight (LOS) direction. The red and blue lines represent the actual and measured trajectory, respectively. The Dryden model is employed to generate a turbulent wind field, in which the trajectory deviation of the UAV turns out to follow a sinusoid-like pattern in the presence of wind disturbance [30]. As a result, the trajectory deviation of the UAV is mimicked by a sinusoidal curve.
At a given azimuth sampling time, the measured radar position is P t , m x m , y m , z m , while the actual position is P t , a x a , y a , z a = x m + Δ x , y m + Δ y , z m + Δ z , where Δ x , Δ y , and Δ z are the deviations between the actual and measured trajectory in the X, Y, and Z directions. The measured and actual slant range of target T 2 x t , y t , z t are r m and r a , respectively. The slant range error of T 2 is Δ R = r a r m x m x t Δ x / r m + y m y t Δ y / r m + z m z t Δ z / r m , as shown in Equation (5). The slant range error varies for targets at different azimuth and range bins within the beam illumination area, which is called the 2D space variant error.
Δ R = r a r m = x m + Δ x x t 2 + y m + Δ y y t 2 + z m + Δ z z t 2 x m x t 2 + y m y t 2 + z m z t 2 = r m 2 + Δ x Δ x + 2 x m 2 x t + Δ y Δ y + 2 y m 2 y t + Δ z Δ z + 2 z m 2 z t r m = r m 1 + Δ x Δ x + 2 x m 2 x t + Δ y Δ y + 2 y m 2 y t + Δ z Δ z + 2 z m 2 z t r m 2 r m r m 1 + Δ x Δ x + 2 x m 2 x t + Δ y Δ y + 2 y m 2 y t + Δ z Δ z + 2 z m 2 z t 2 r m 2 r m = Δ x Δ x + 2 x m 2 x t + Δ y Δ y + 2 y m 2 y t + Δ z Δ z + 2 z m 2 z t 2 r m x m x t r m Δ x + y m y t r m Δ y + z m z t r m Δ z
Assuming that the radar transmits the FMCW signal, the actual echo of target T 2 is
s r t = rect t 2 r a / c T p × exp j 2 π f c t 2 r a c + 1 2 k t 2 r a c 2 .
The range compressed signal is obtained by applying dechirp and Fast Fourier Transformation (FFT) on the echo (6) with a range frequency instantaneous value f r = 2 k r a / c , i.e.,
s if f r = sinc T p f r + 2 k r a c exp j 4 π λ r a .
Considering that the trajectory is a curve with large deviations, the BP algorithm is applied to imaging in this situation because it is effective under an arbitrary array configuration. In the presence of the slant range error caused by the trajectory deviation, the pixel value I T 2 , P t , m corresponding to target T 2 at sampling point P t , m is
I T 2 , P t , m = s if f m · H = sinc T p f m + 2 k r a c · exp j 4 π r a λ · exp j 4 π r m λ = sinc T p 2 k r a r m c · exp j 4 π r a r m λ ,
where H represents the phase compensation function
H = exp j 4 π R λ .
According to Equation (8), the envelope and phase error arising from the slant range error Δ R lead to a bias when the range-compressed signal is projected to the image domain. The imaging result is defocused correspondingly.

3. Trajectory Deviation Estimation Algorithm

3.1. Estimation of Trajectory Deviation in the Line-of-Sight Direction

As depicted in Figure 2, the imaging result of the wall relies on the closest slant range perpendicular to the wall. At sampling point P t , a , the slant range error is also the trajectory deviation in the LOS direction, i.e., Δ R = r a r m = Δ y . The Radon transformation can integrate a straight line into peaks. Subsequently, it is employed to evaluate the linear characteristics of the wall. For a function f x , y , the Radon transform R f ρ , θ is defined as the line integral along the line determined by ρ and θ
R f ρ , θ = f x , y d l .
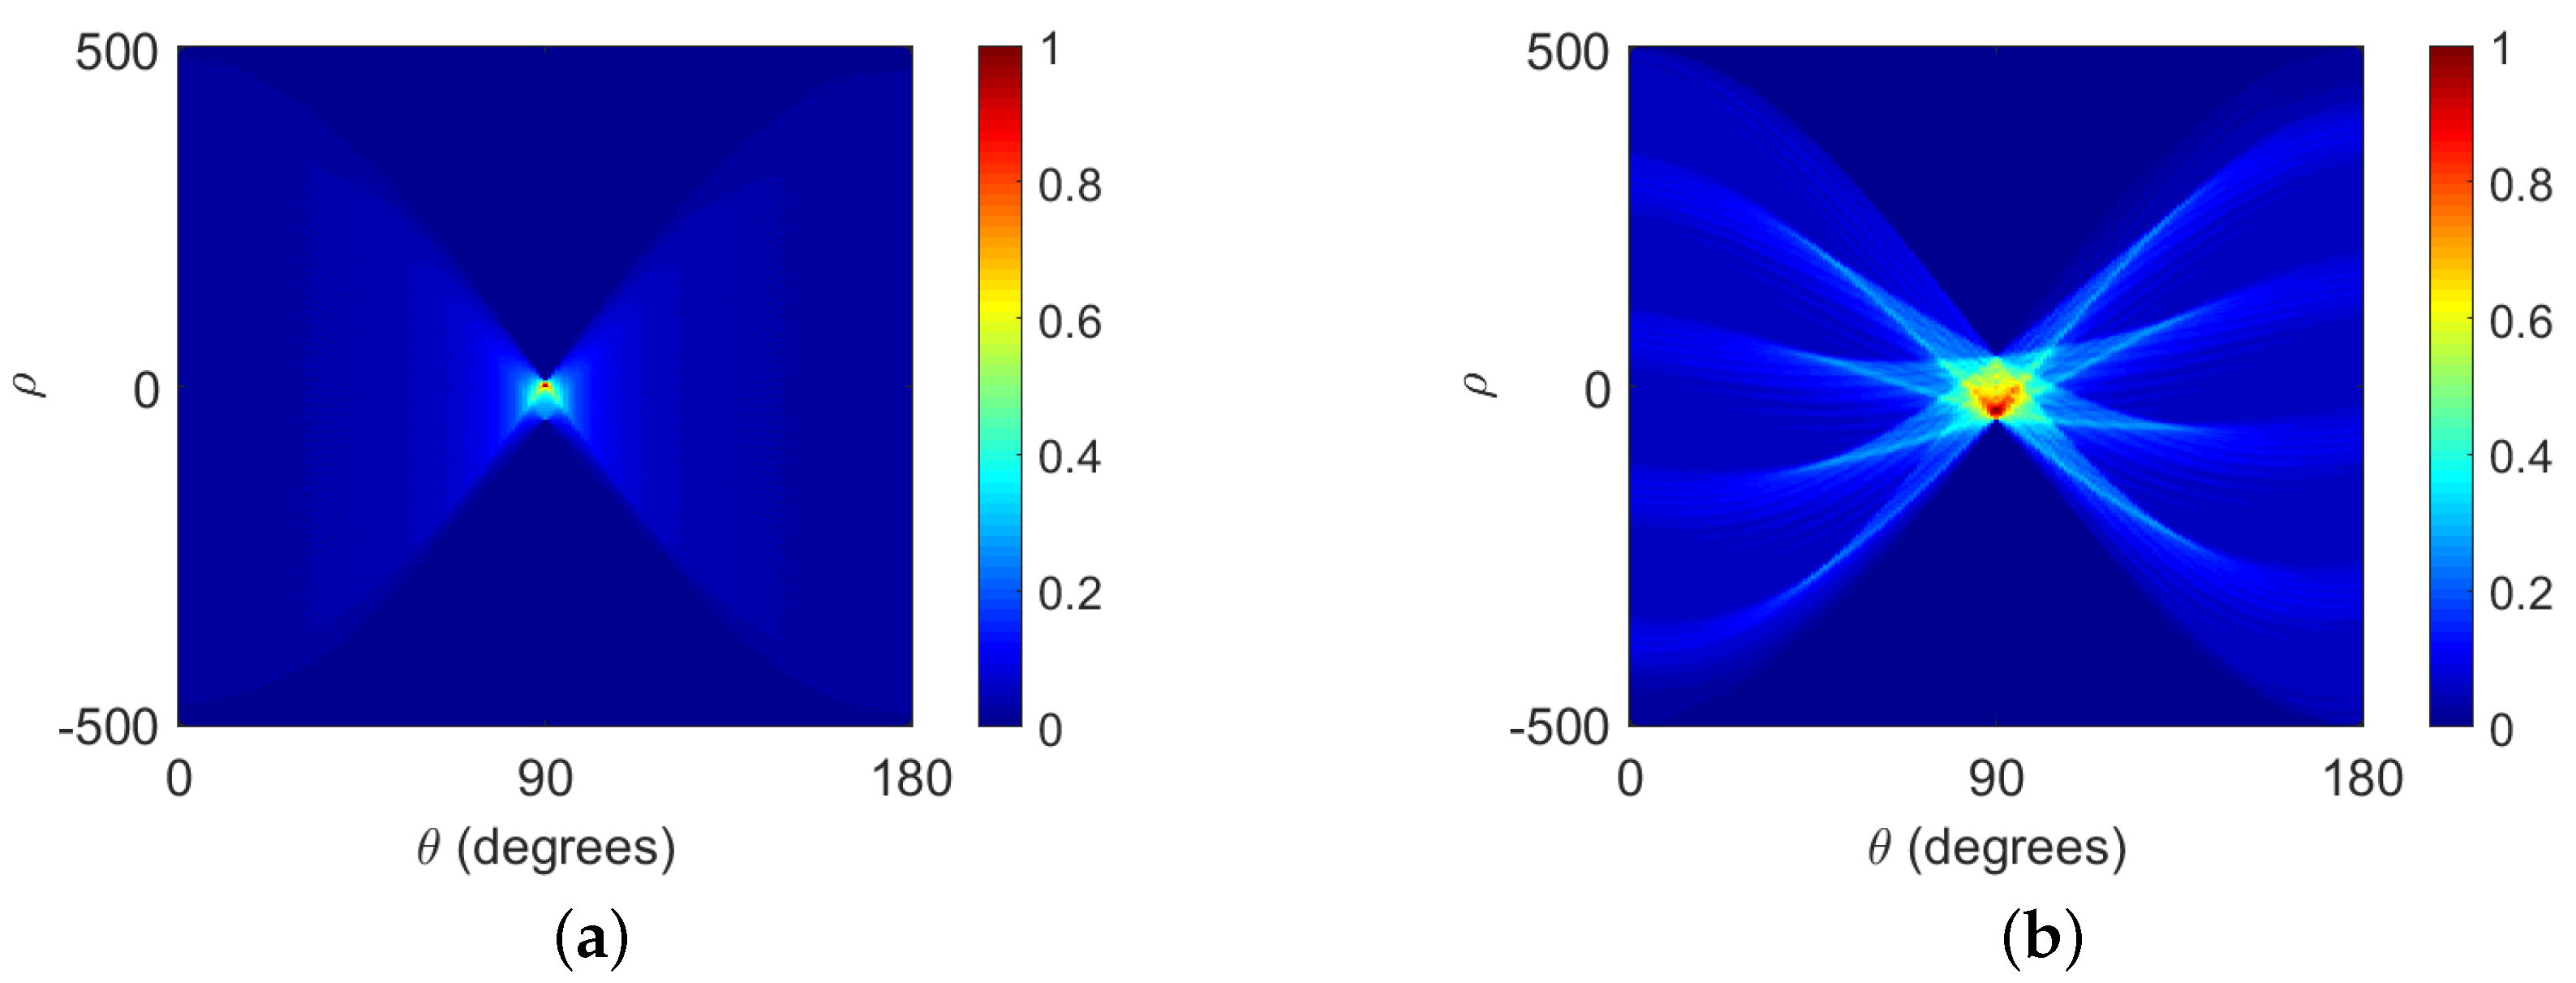
The value of each pixel in the R f domain corresponds to a specific linear integration of the original BP imaging result. If there is a deviation in the trajectory, the wall in the BP image becomes defocused and twisted. The corresponding image in the R f domain degrades from a desirable peak to a defocused spot, as depicted in Figure 3. The image contrast in the R f domain is designed as the objective function for autofocus optimization. A higher contrast in the R f domain indicates that the wall in the BP image is more approximate to a straight line, which means the trajectory position in the LOS direction is more accurate.
C = σ I ρ , θ 2 E I ρ , θ 2 = E I ρ , θ 2 E I ρ , θ 2 2 E I ρ , θ 2
C e q = I ( ρ , θ ) 4
The Equation (11) is equivalent to (12) [31]. I ρ , θ represents the value of the pixel at point ρ , θ in the R f domain. The image contrast is defined as the ratio of the standard deviation of the image intensity to the mean value.
We sample the trajectory deviation values of UAV at L azimuth time points during a pass along the wall and obtain the deviation curve of the entire trajectory by estimating Δ y ,
Δ y = Δ y 1 , Δ y 2 , , Δ y l .
Assuming a low frequency of deviation in the UAV trajectory curve, the number of sampling points L just needs to satisfy Nyquist’s theorem. The estimation dimension and computation increase with the number of sampling points.
The Particle Swarm Optimization (PSO) method is utilized to search for a set of optimal solutions to Δ y .
Each feasible solution Δ y to the optimization problem is considered to be a location (i.e., a particle) in the search space. The dimension of Δ y is L, and each particle denotes a combination of Δ y corresponding to these L sampling points. The process of the PSO algorithm is shown as Algorithm 1. Initially, a group of randomly distributed particles are initialized. In each iteration, the particles update both their velocity direction and magnitude by searching for and pursuing the global and individual extreme values of the current iteration, i.e., G b e s t k and P b e s t k . Each particle moves towards the potentially optimal value. Concurrently, both the individual and the global extreme values are updated in each iteration. The optimal solution of the objective function is considered to have been found when the difference between the global extremes found by the population is less than a set threshold over multiple rounds of iterations.
After obtaining the optimal solution through iterations, the deviation curves can be obtained by interpolating the Δ y to N a azimuthal sampling points using the linear interpolation method, and the actual trajectory can be obtained by y a = y m + Δ y .
Algorithm 1 PSO
for each particle i do
      for each dimension d do
            Initialize velocity V i d and position X i d
      end for
end for
Initialize P b e s t and G b e s t
k = 1
while not stop do
      for each particle i do
            Update the velocity and position of particle i:
             v i d k + 1 = w v i d k + c 1 r 1 P b e s t i d k x i d k + c 2 r 2 G b e s t i d k x i d k
             x i d k + 1 = x i d k + v i d k + 1
            Calculate fitness value of X i
            if  f i t X i < f i t P b e s t i  then
                    P b e s t i = X i ;
            end if
            if  f i t ( P b e s t i ) < f i t ( G b e s t )  then
                    G b e s t = P b e s t i ;
            end if
      end for
      k = k + 1
end while
print G b e s t

3.2. Estimation of the Trajectory Deviation along the Track

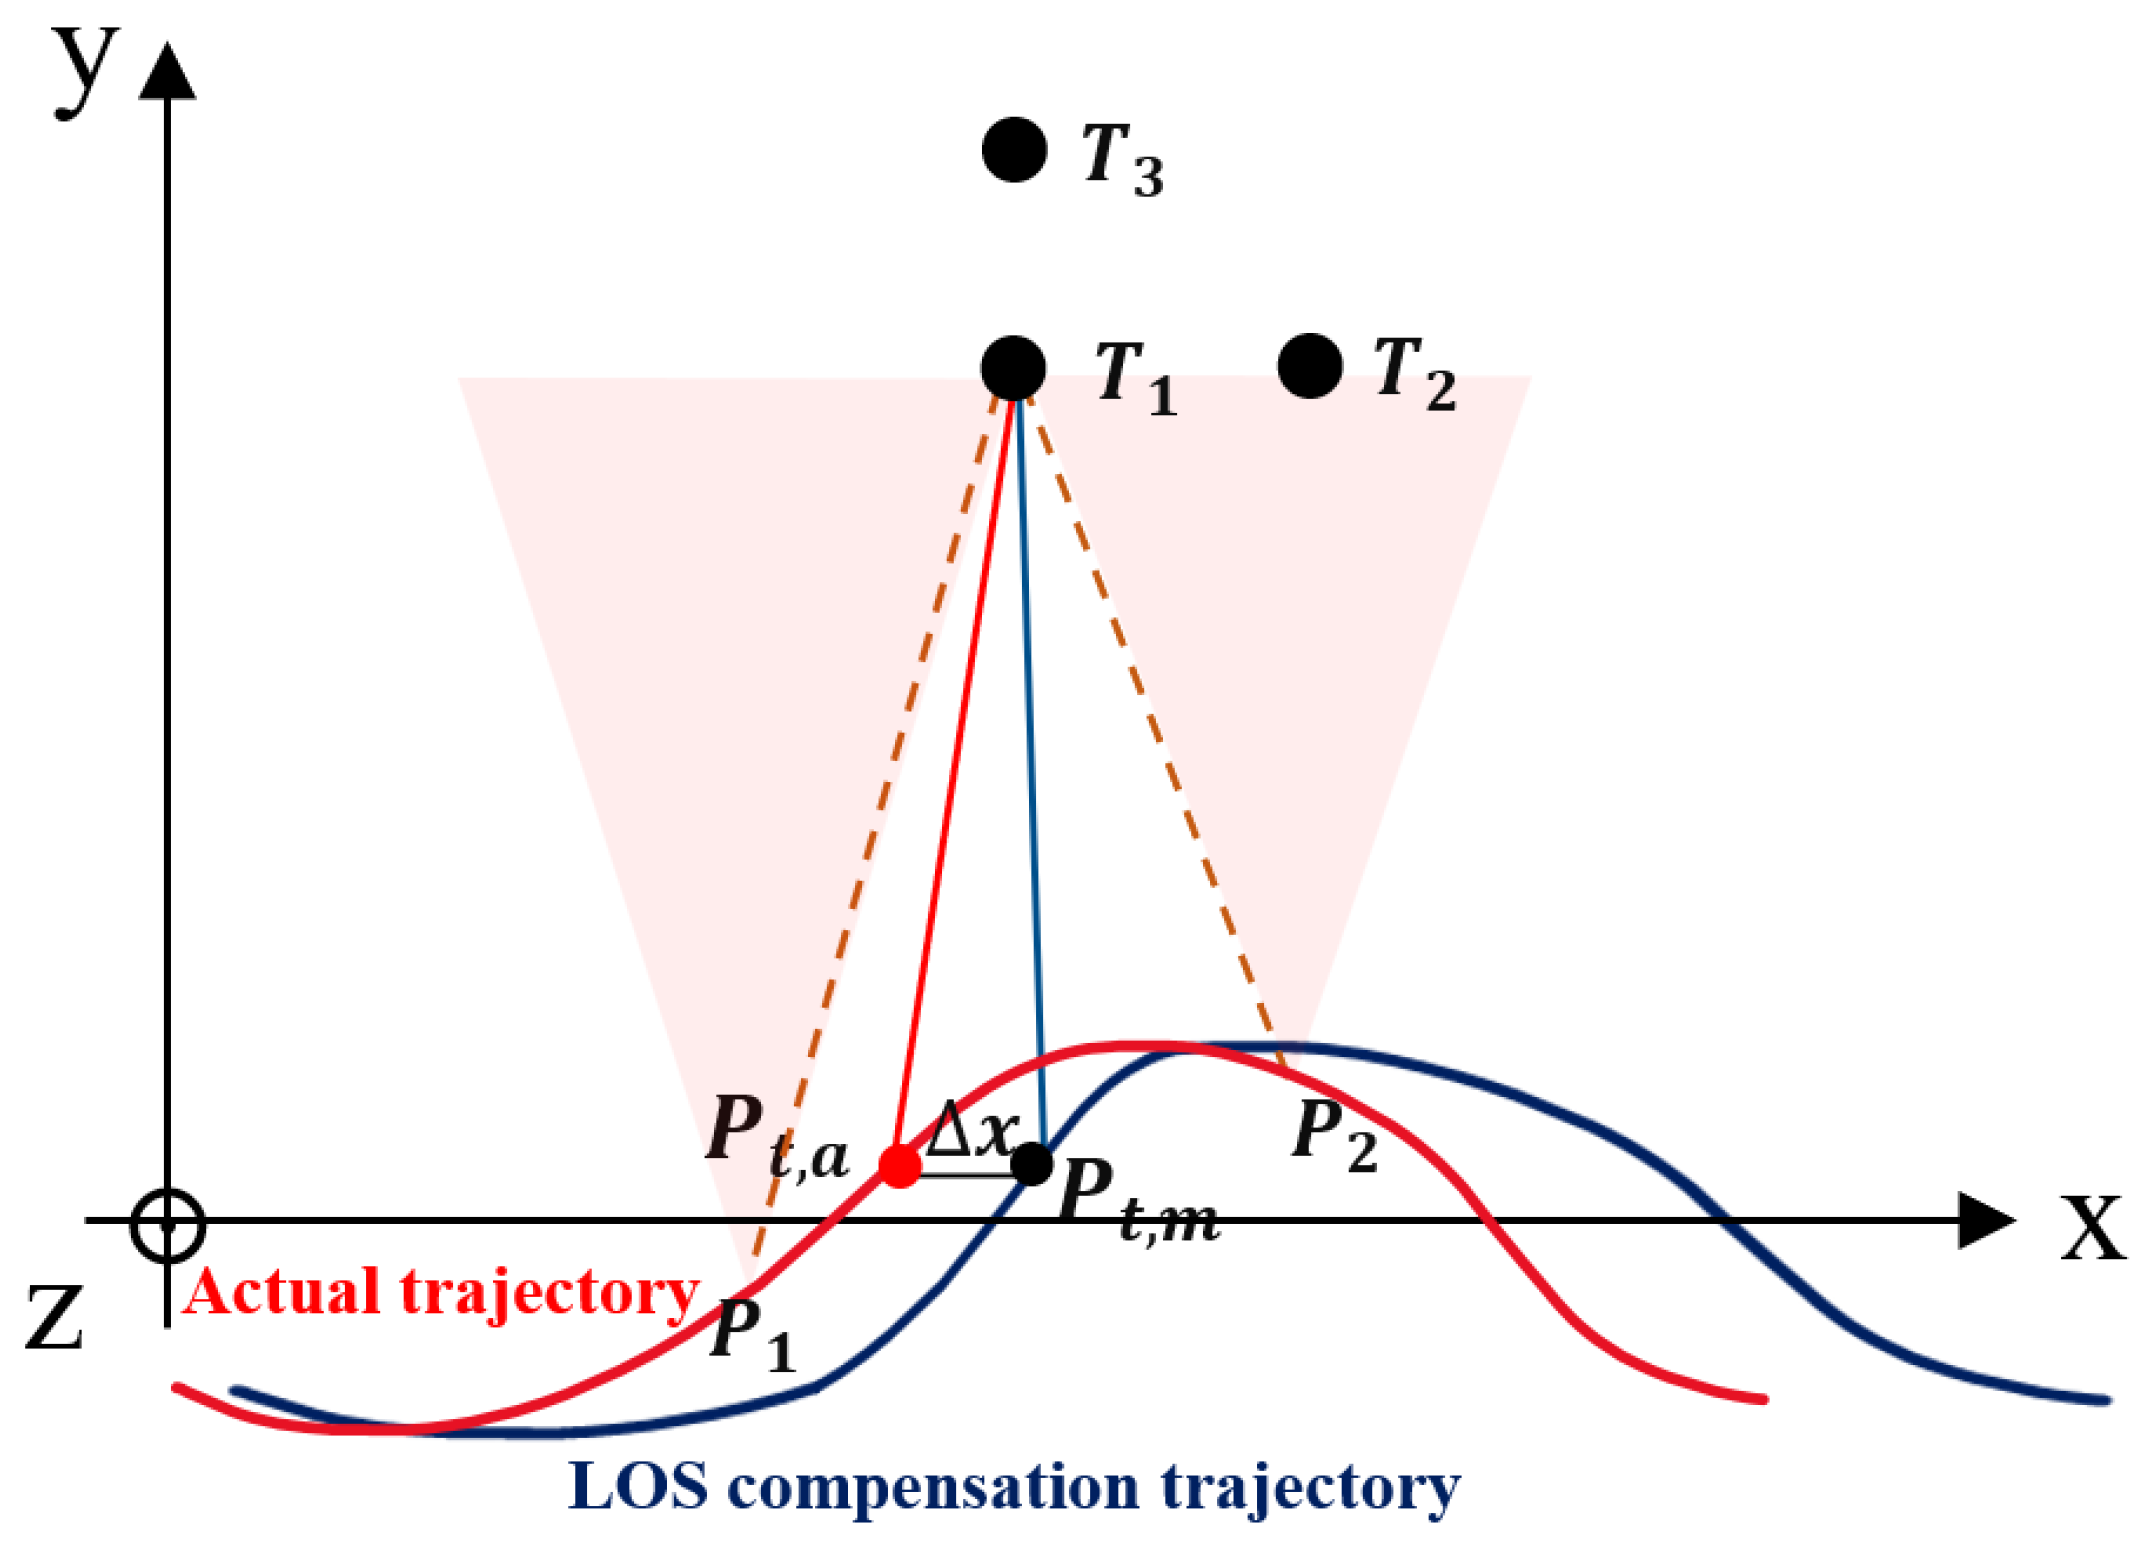
After estimating and correcting the deviation in the LOS direction, the deviation along the track is estimated by autofocusing on targets behind the wall, as shown in Figure 4. Similar to Figure 2, the red line depicts the actual radar trajectory curve, while the blue line represents the measured trajectory curve, wherein corrections for the trajectory deviation in the line-of-sight direction have been applied. P 1 and P 2 denote the synthetic aperture edges corresponding to the target T 1 . In this situation, ideally, there exists only a deviation Δ x in the along-the-track direction between the actual radar position P t , a and the measured position P t , m . It should be noted that the primary objective of this figure is to elucidate the second stage of the algorithm, specifically the estimation of the deviation along the track through the autofocus of targets. As a result, Figure 4 excludes the refraction of the electromagnetic wave.
Before the estimation of trajectory deviation along the track, it is worth noting that the energy of target echoes is inversely proportional to the distance. To prevent targets at long distances from contributing too little to the optimization process and missing important information regarding the space-variant error, we multiply each range-compressed signal by a compensation factor β , which balances the energy of targets at different distances.
β k = k 2 α + 1 k = 1 , 2 , , N
N represents the number of range FFT points. The value of α , a hyperparameter, is chosen to scale the energies of the targets at different distances as similar as possible after compensation.
Similar to the estimation of the trajectory deviation in the line-of-sight direction as introduced in Section 3.1, the trajectory deviation vector along the track Δ x = Δ x 1 , Δ x 2 , , Δ x l is optimized with the PSO algorithm with image contrast as the objective function. It is unnecessary to be aware of the precise location of the target. However, to precisely calculate the slant range of each grid point behind the wall using Equation (3), it is necessary to identify both the dielectric constant and thickness parameters of the wall priorly. The flowchart of the algorithm is displayed in Figure 5.

4. Simulation and Experimental Results

4.1. Simulation Results

The thickness of the wall in typical concrete frame structures ranges from 120 mm to 300 mm [32]. External walls of brick and concrete buildings are usually 240 mm or more, while internal walls are approximately 120 mm. Overall, the thickness of a wall depends on various factors such as the material, bearing capacity, and insulation requirements. Table 1 lists the electromagnetic parameters of typical building materials. To maintain the penetration capacity, electromagnetic waves in the L or S band should be selected. Note that the attenuation of electromagnetic waves increases with the thickness and dielectric constant of the wall [33,34,35].
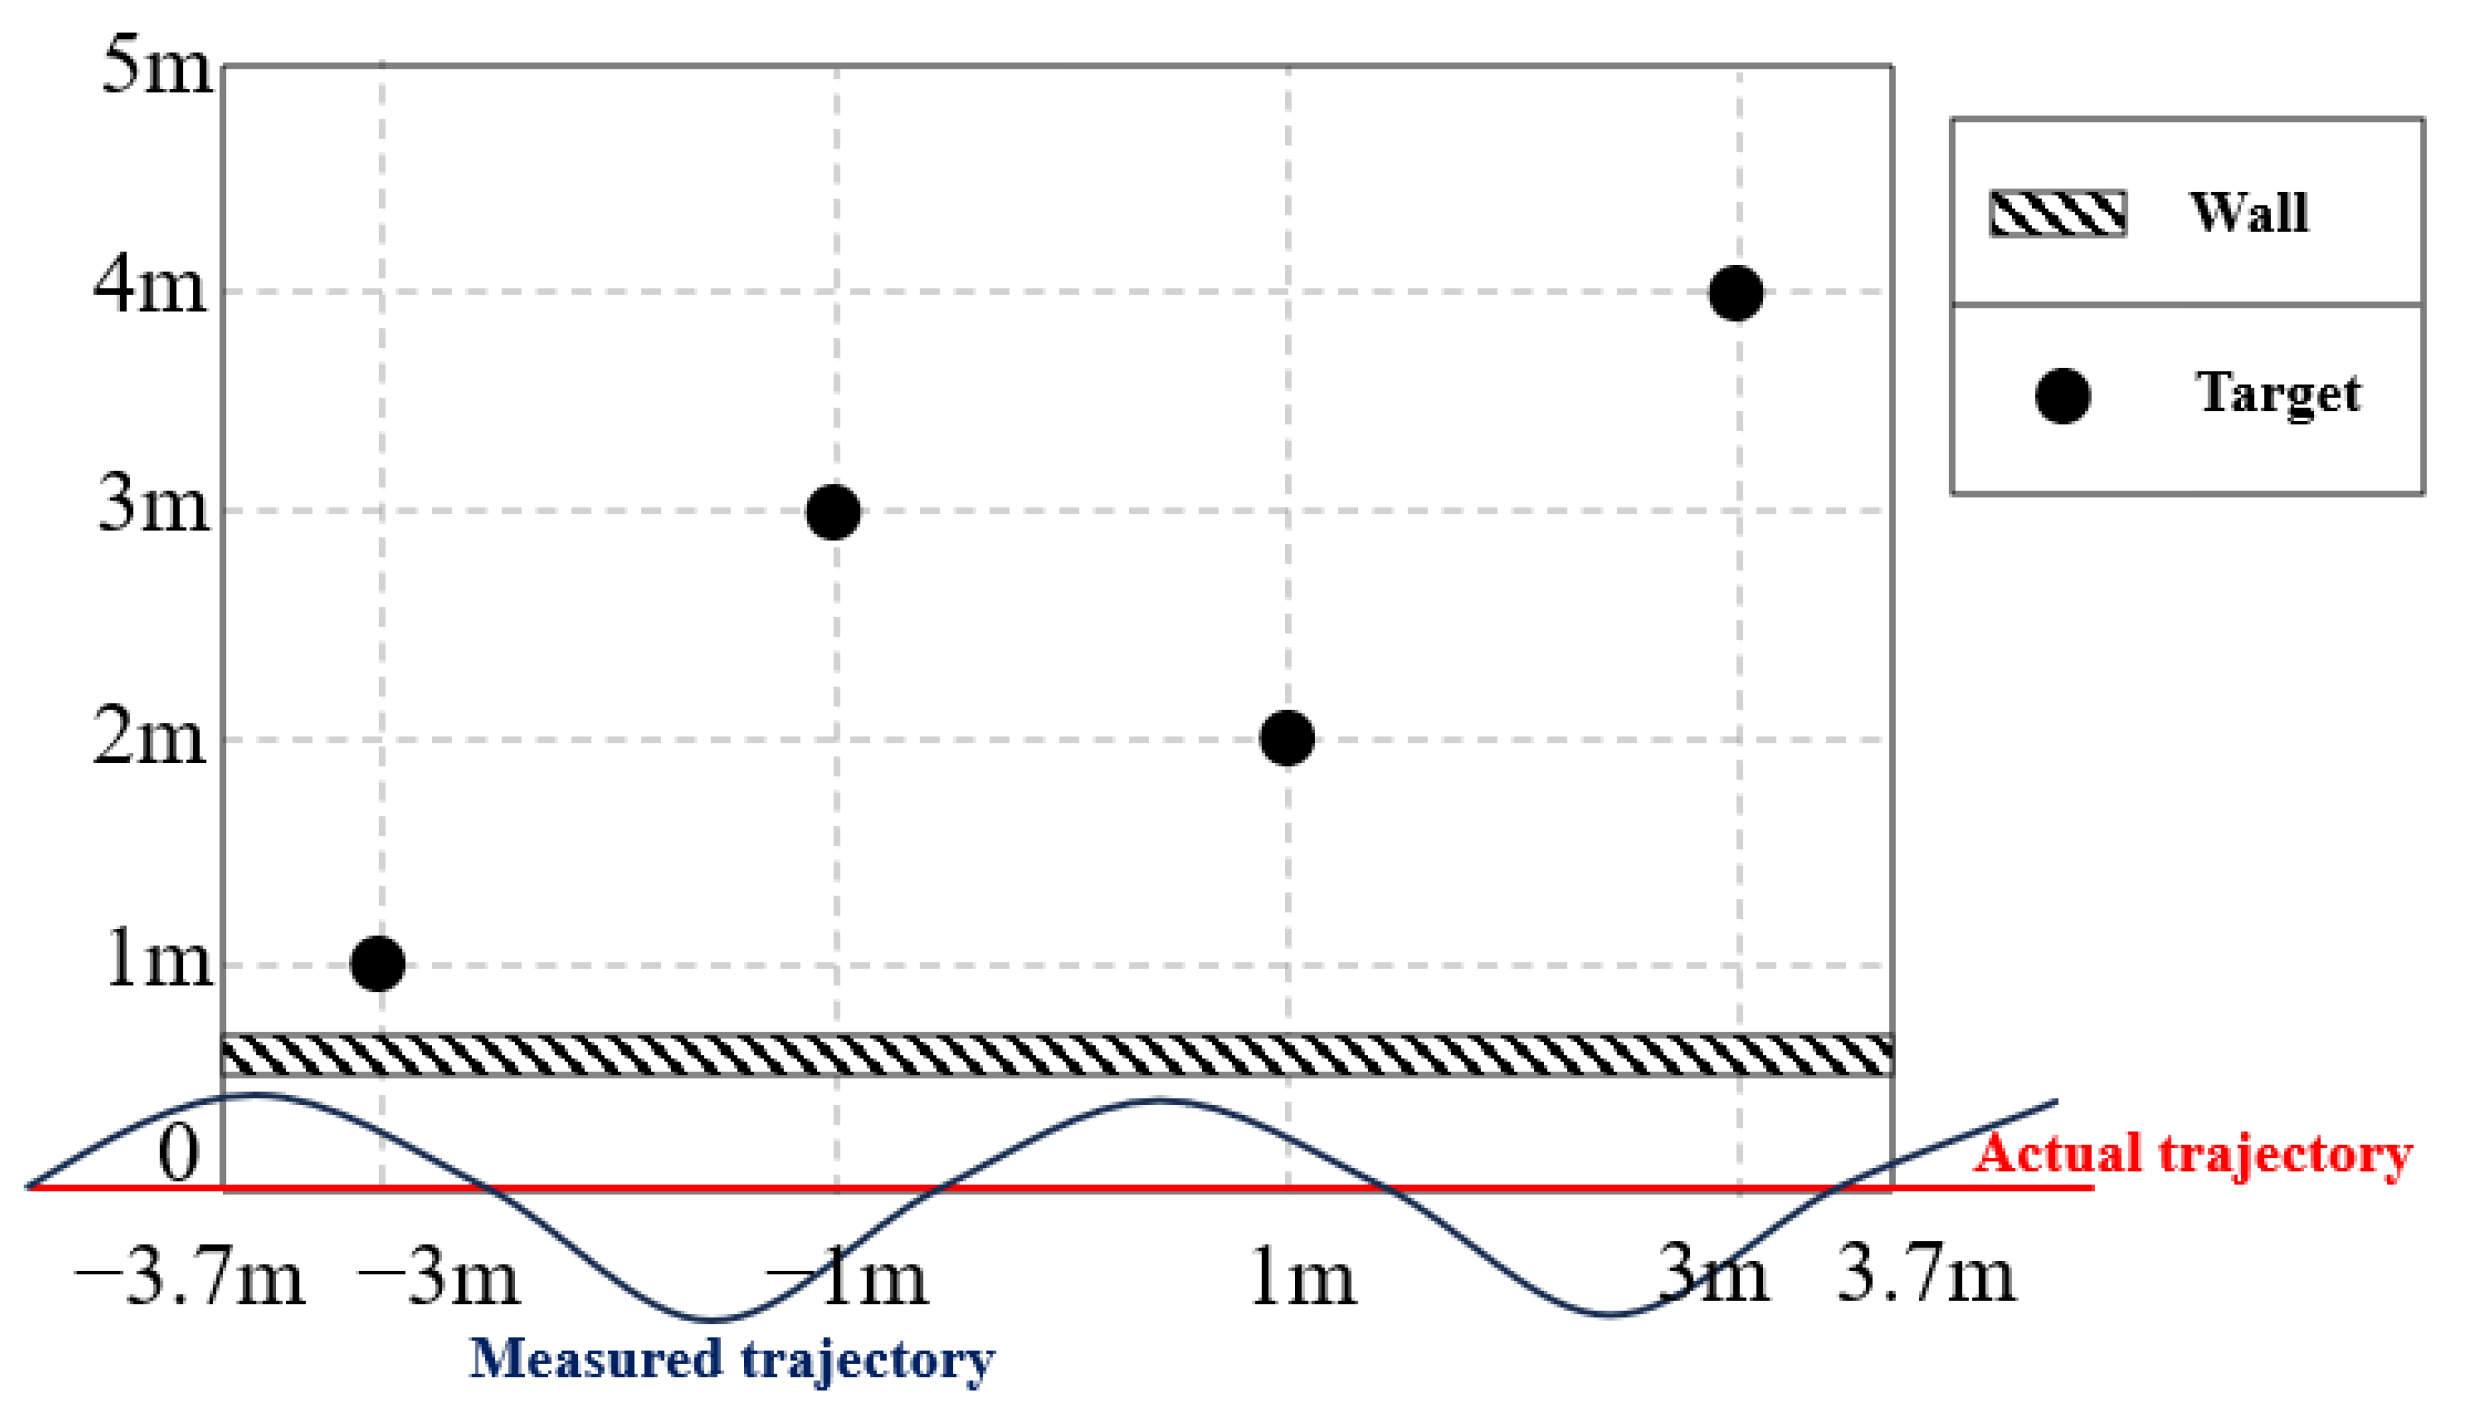
As shown in Figure 6, the trajectory is designed as a straight line, which is similar to the one in conventional SAR imaging algorithms. Trajectory deviation is in the form of a sinusoid with a maximum magnitude of 0.4 m, larger than twice the range resolution. The wall thickness is 120 mm, and the relative dielectric constant is 4.5. There are four point targets distributed behind the wall. Table 2 lists the key parameters of the FMCW radar. In this section, the minimum-entropy autofocus (MEA) algorithm [36] with range segmentation is adopted as the comparison algorithm.
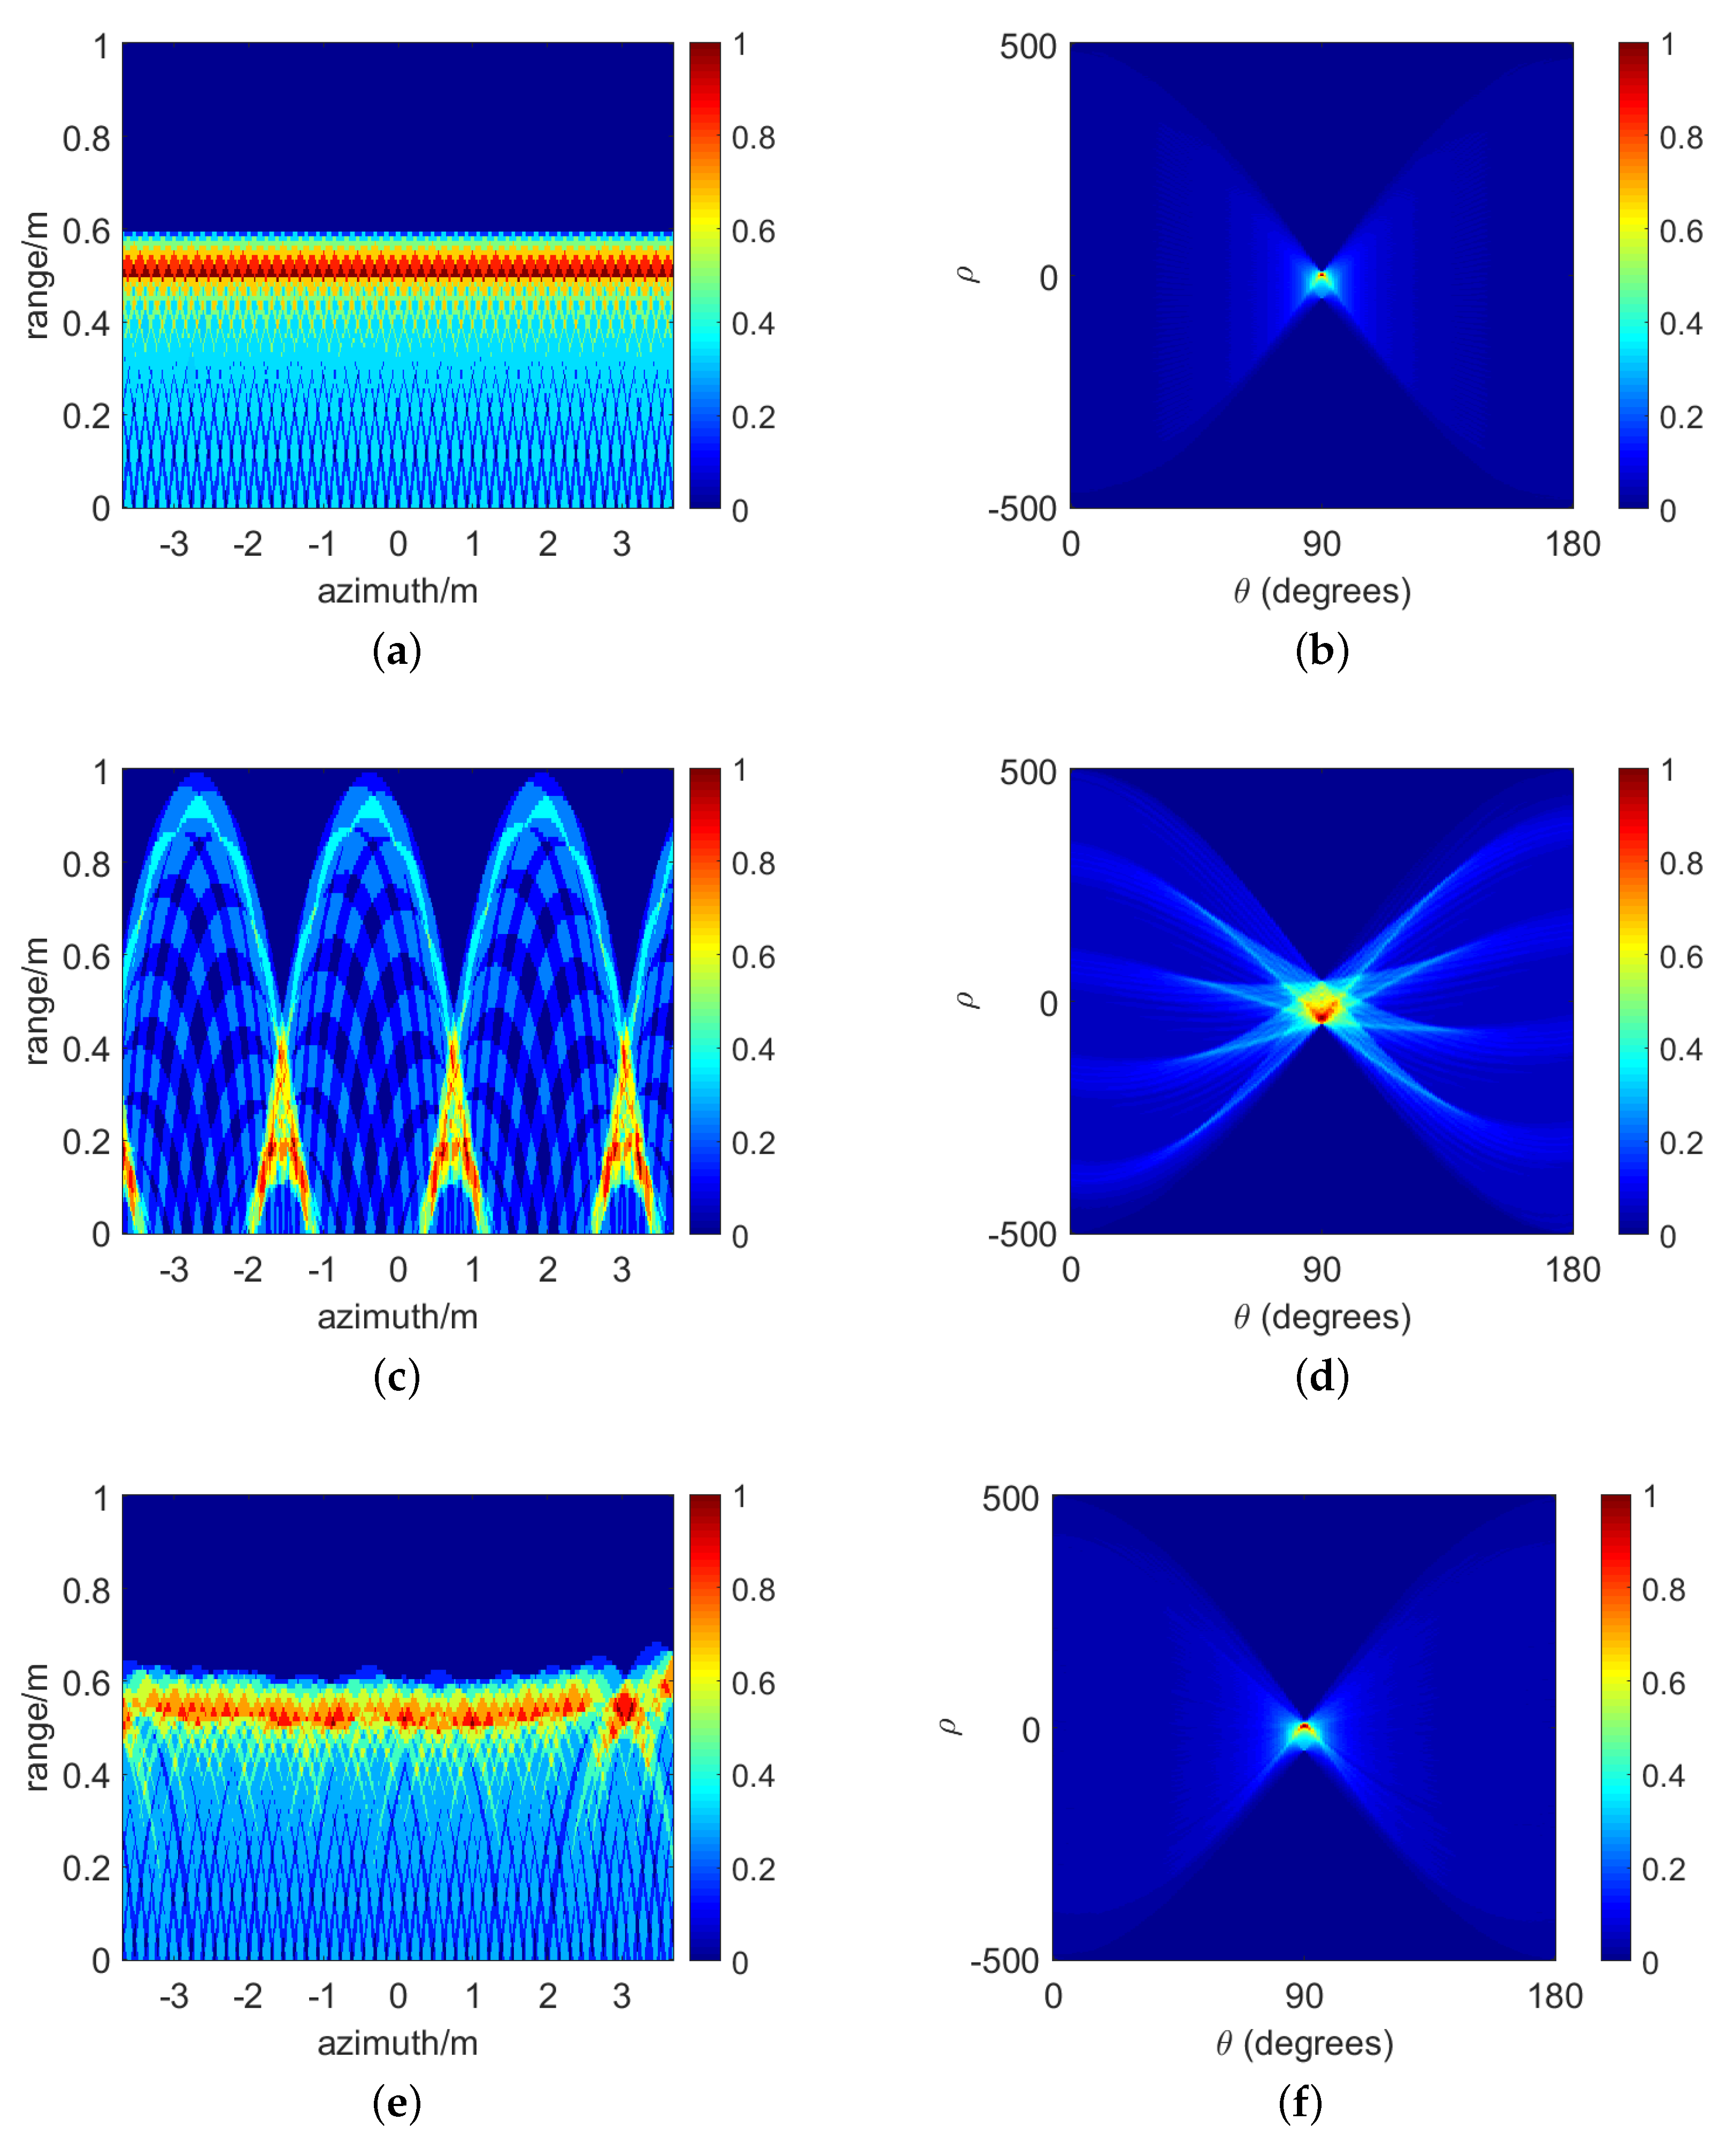
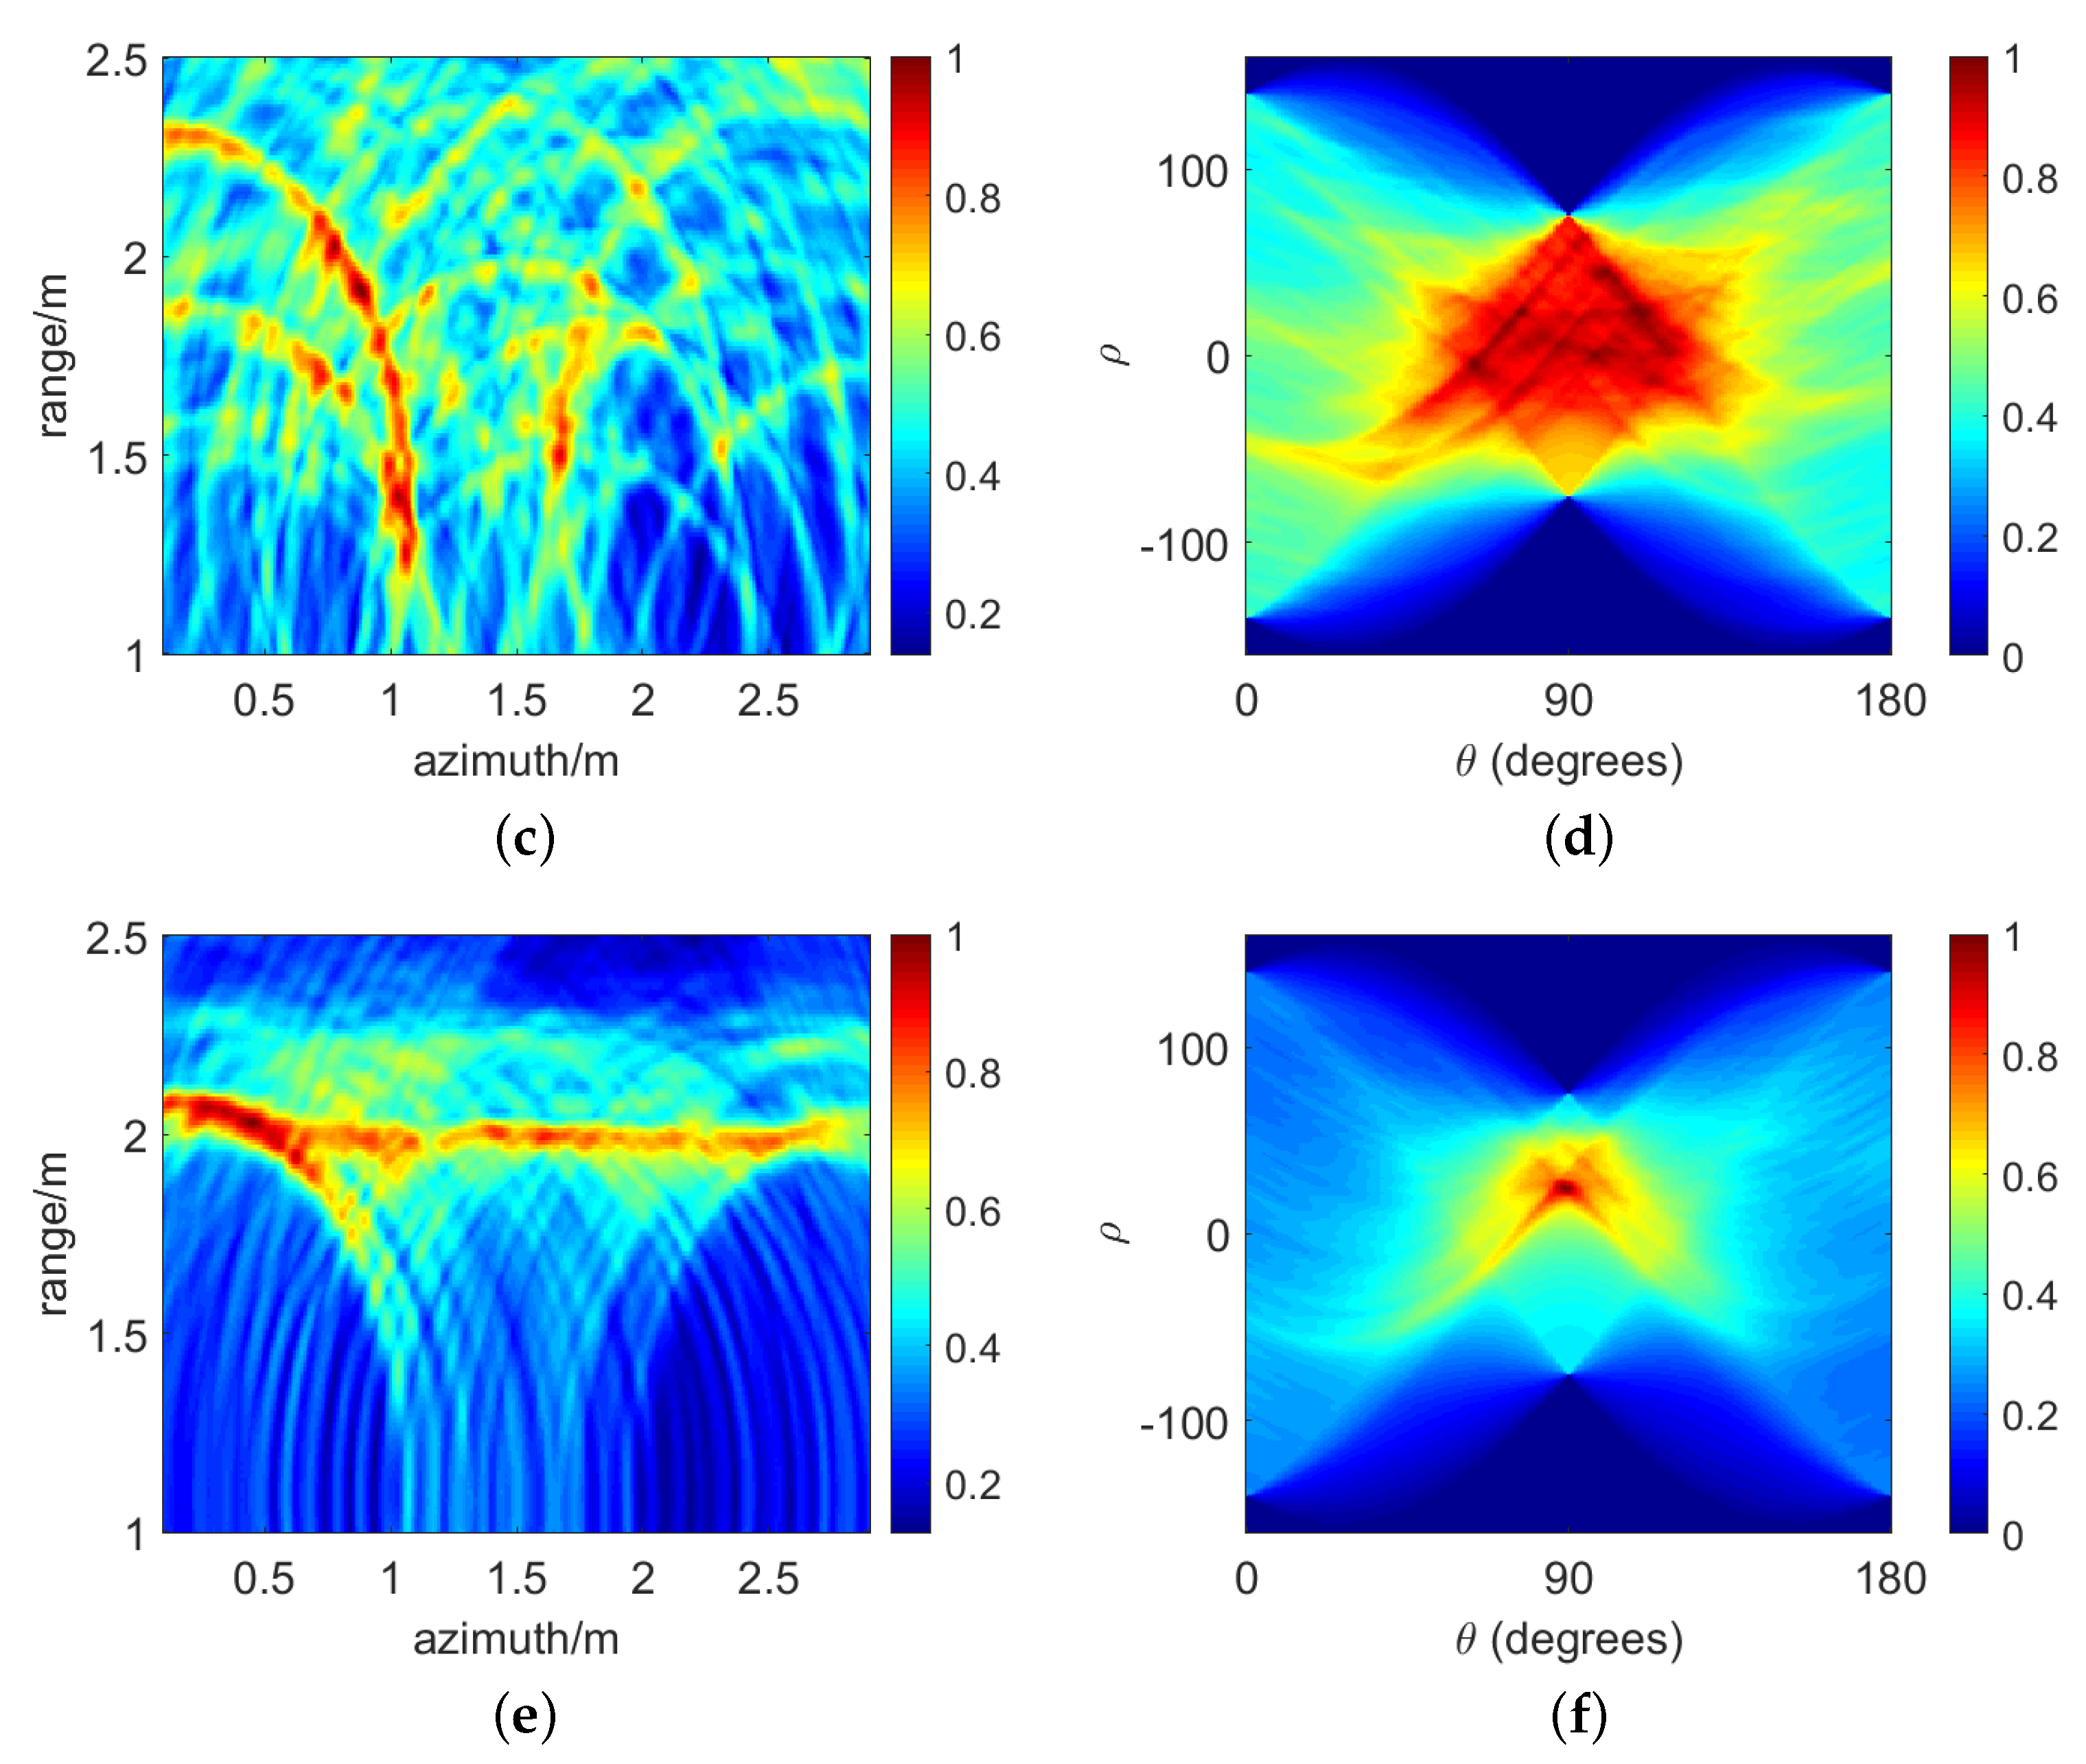
Figure 7 shows the autofocus result of the wall. The BP imaging results are shown in Figure 7a, Figure 7c, and Figure 7e for the cases of no LOS direction trajectory deviation, with sinusoidal trajectory deviation, and when the trajectory deviation has been estimated and compensated for by the proposed algorithm, respectively. The corresponding Radon transform results are shown in Figure 7b,d,f.
According to Figure 7a,b, the wall is considered straight when there is no deviation in the LOS direction trajectory, which corresponds to the ideal peak in the R f domain. When a trajectory deviation exists, Figure 7c shows that the linear properties of the wall are destroyed. Correspondingly, the peak in the R f domain diffuses either, as shown in Figure 7d. After the estimation and compensation for LOS deviation, the BP image of the wall is restored to a straight line, and the peak in R f domain is also focused correspondingly, as shown in Figure 7e and Figure 7f, respectively. As illustrated, the imaging results of the wall are well recovered after estimating and compensating for the LOS deviation.
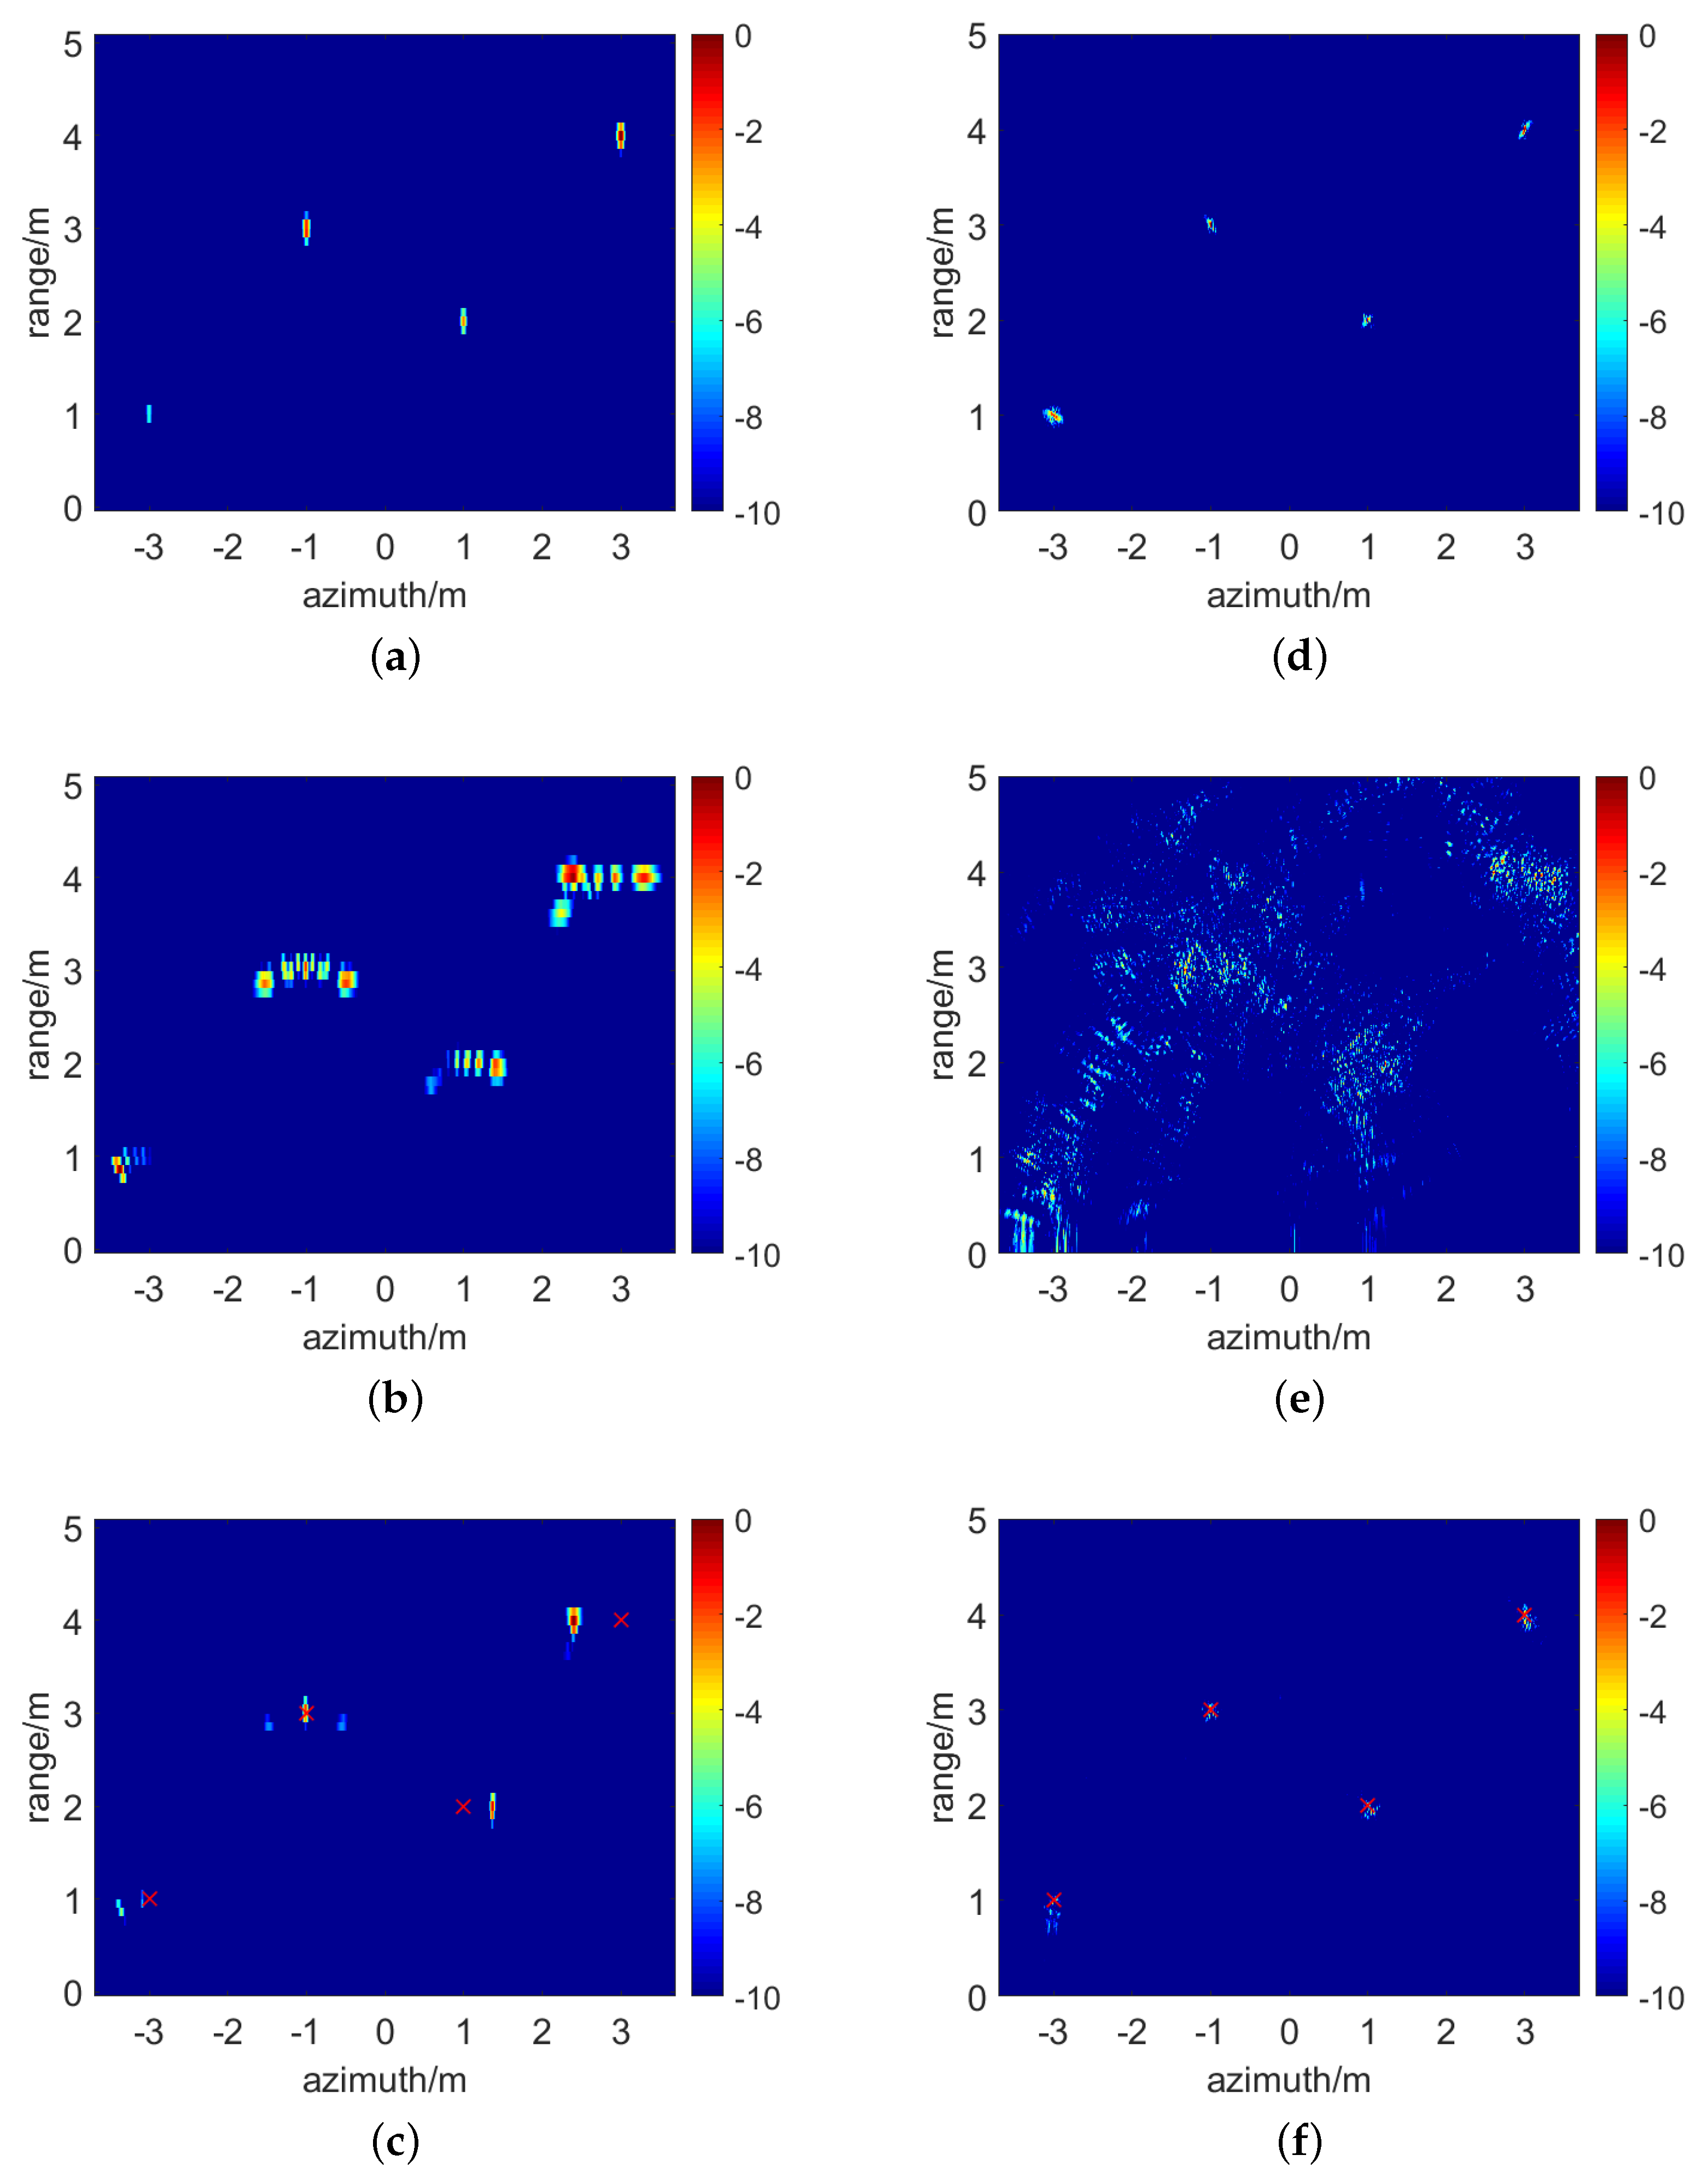
Figure 8 shows the autofocus result of targets behind the wall. The RD images using the comparison algorithm in the absence of along-the-track deviation, in the presence of deviation and after autofocus processing are represented by Figure 8a, Figure 8b, and Figure 8c, respectively. The BP images of the proposed algorithm in the absence of trajectory deviation, in the presence of deviation, and after autofocusing processment are represented by Figure 8d, Figure 8e, and Figure 8f, respectively.
As demonstrated in Figure 8a, the targets are well-focused and located accurately when there is no deviation along the track. Figure 8b shows the diffusion when there is a trajectory deviation. Figure 8c demonstrates the focusing effect of the comparison algorithm [36]. In Figure 8c, the true positions of targets are marked by the symbol red ×. As shown, there exists fake targets and position deviations in the imaging result.
Remark 1. 
Notably, as the 2D space variability of the error becomes non-negligible in the through-wall scenario with wide-beam radar, the performance of the algorithm [36] degrades. As a result, we divide the raw data into more range segments to maintain the effectiveness of the algorithm.
As shown in Figure 8d, when there is no deviation along the track, the target positions are accurate and well-focused. Figure 8e shows that trajectory deviations result in severe defocus, nearly impossible to identify the position of the targets. According to Figure 8f, point targets are refocused correctly after being compensated for with the proposed algorithm.
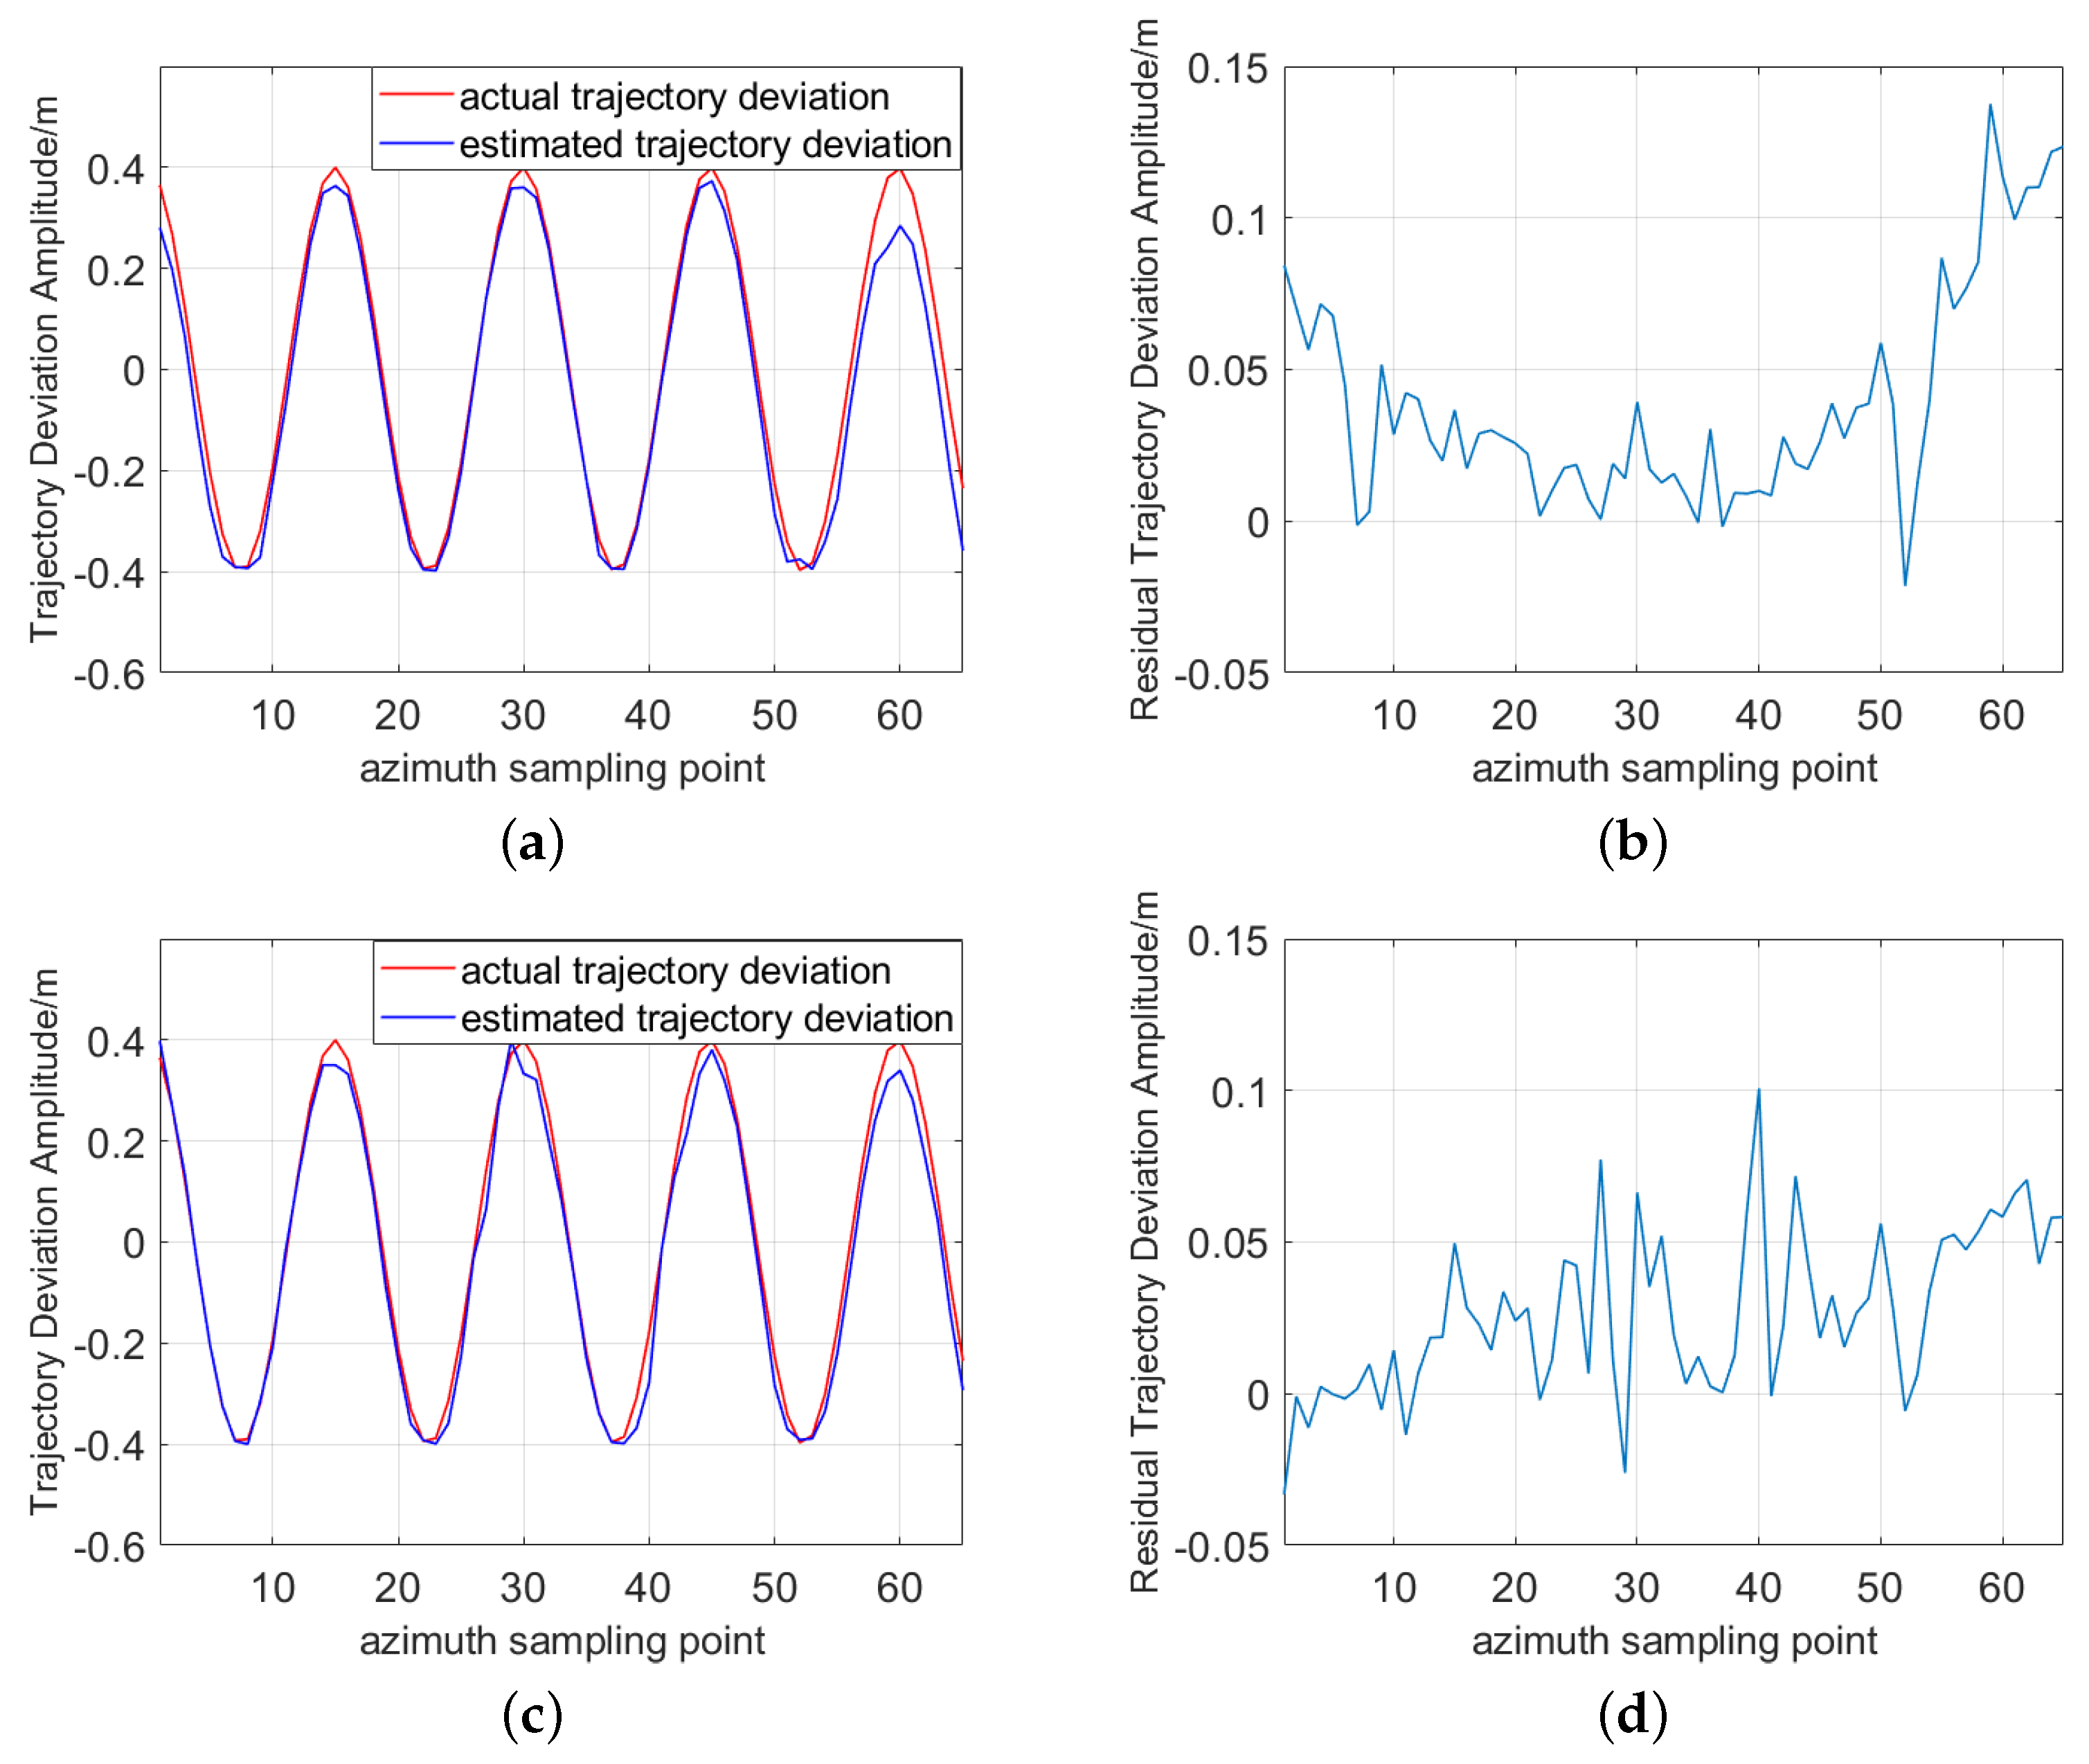
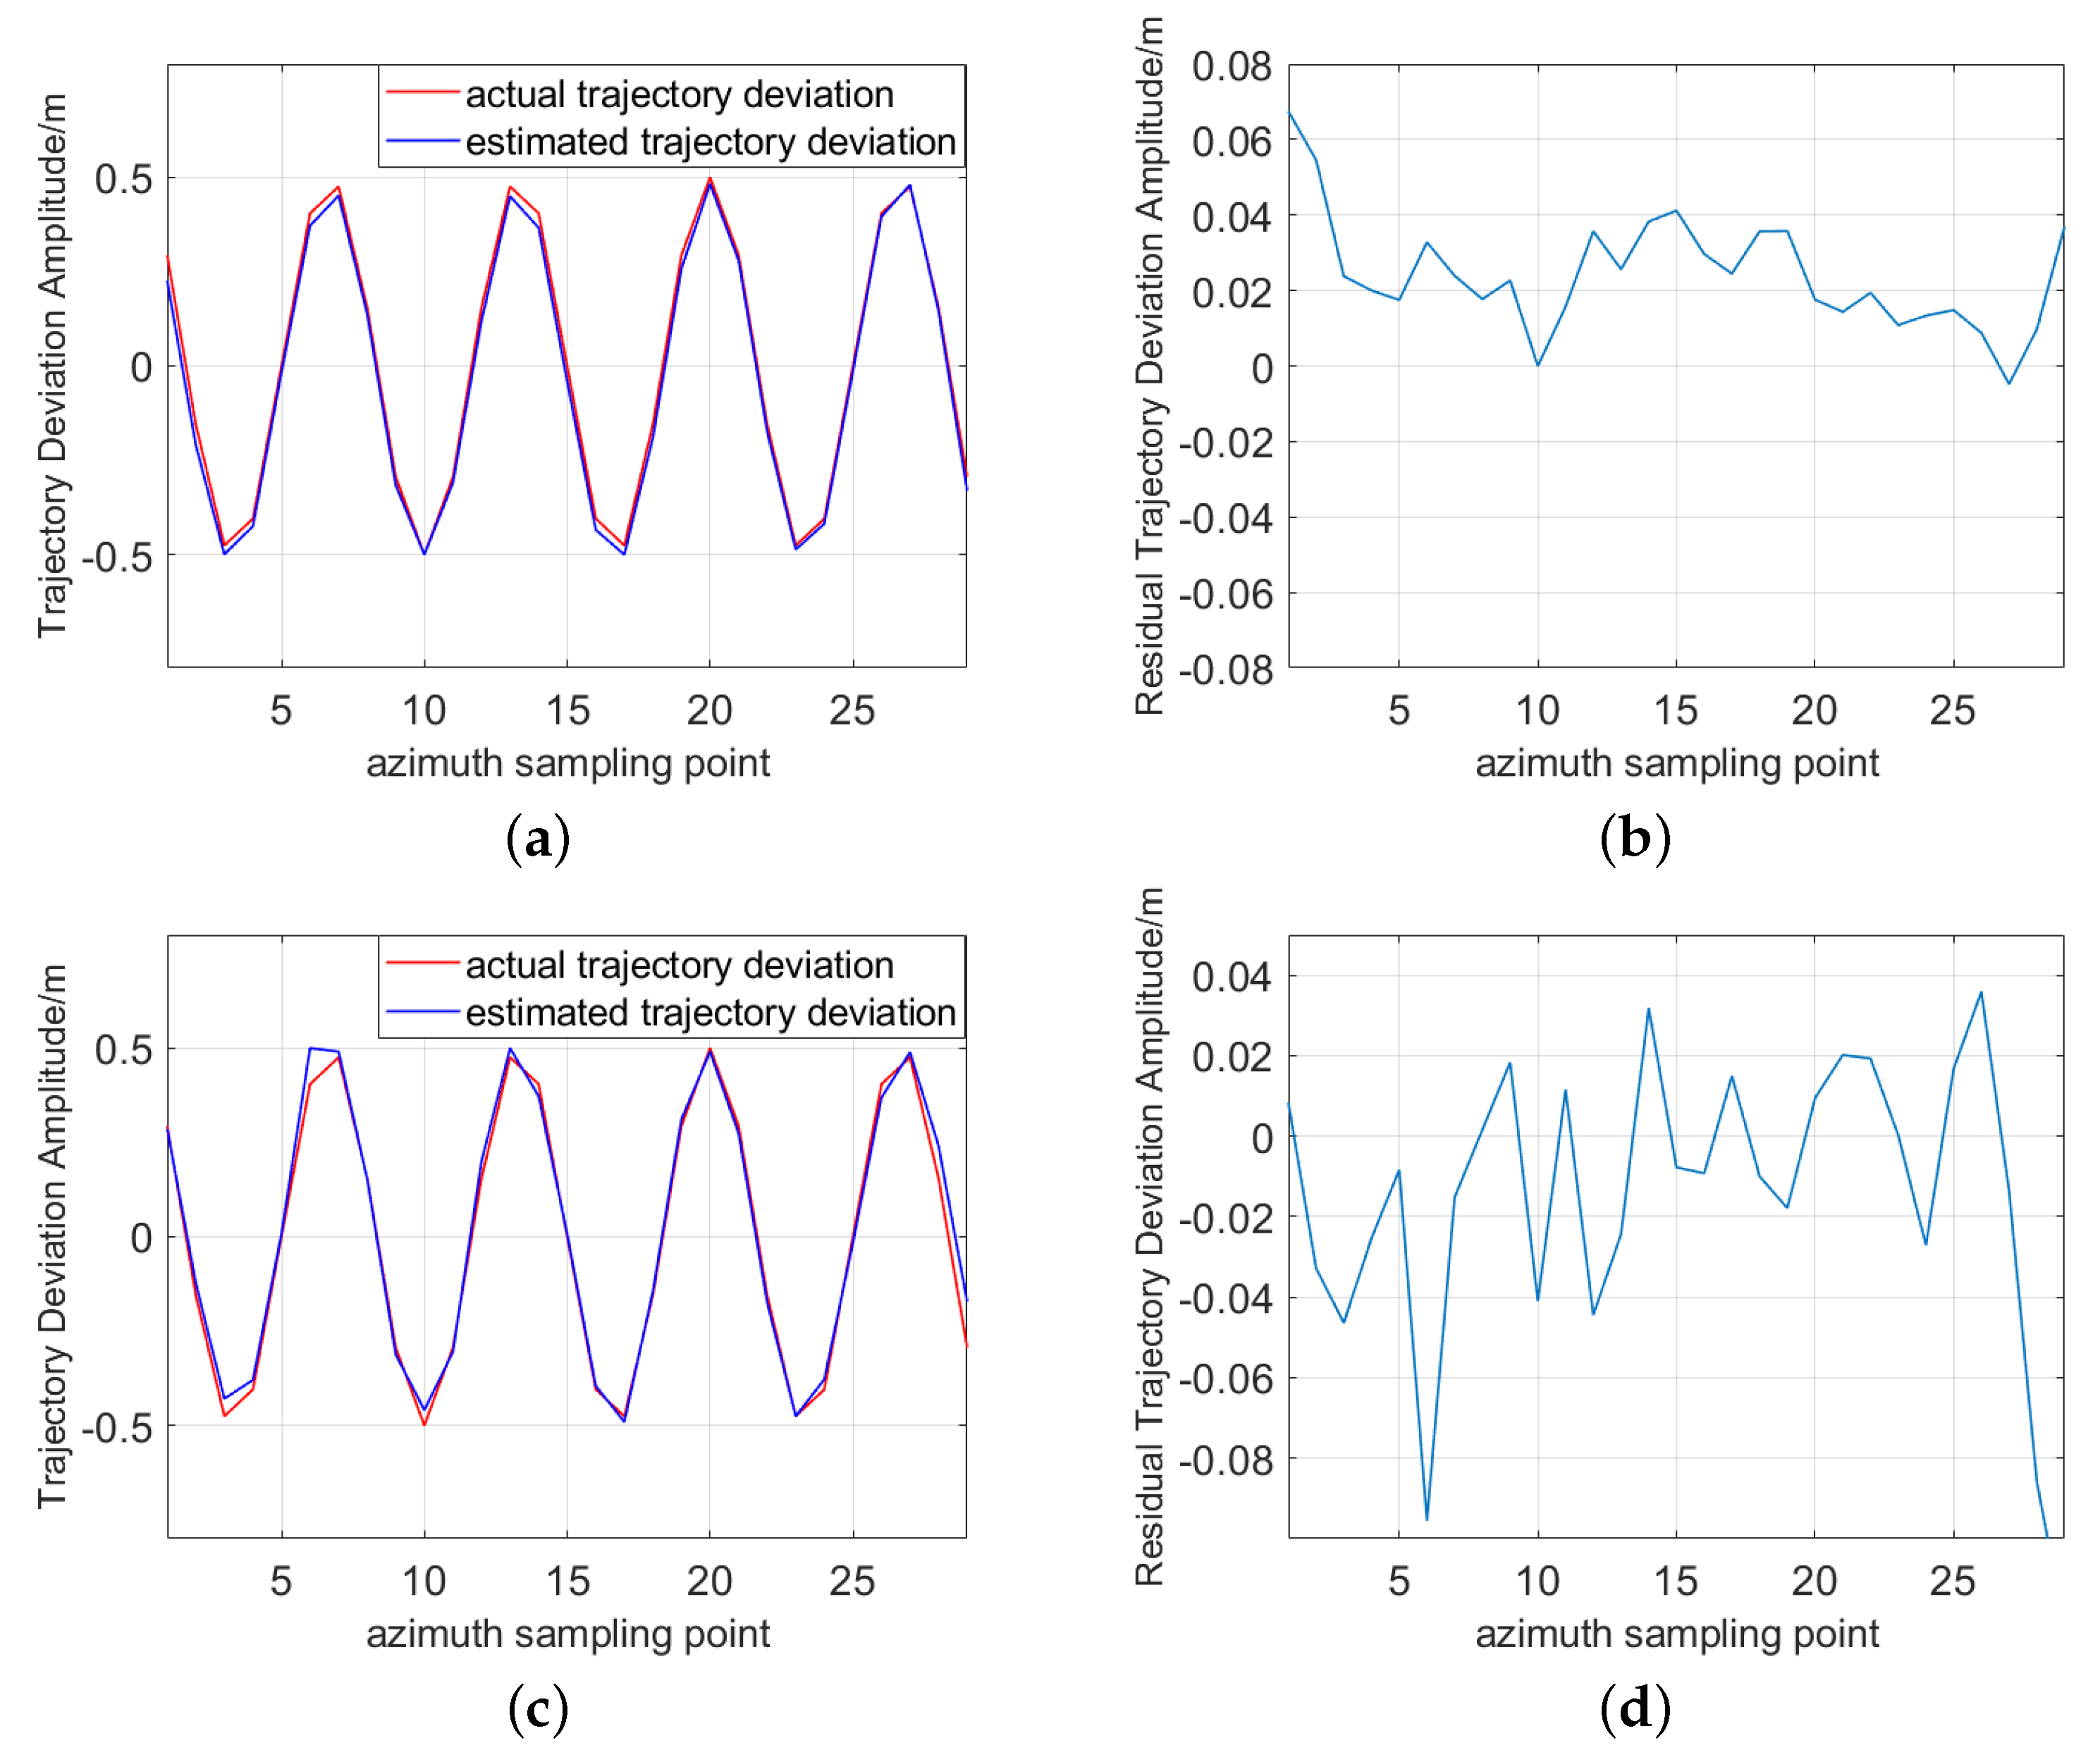
The estimations of the trajectory deviation are shown in Figure 9. The estimated results and residuals of the LOS direction deviation are represented by Figure 9a and Figure 9b, respectively. It is evident that the estimated value is consistent with the true value, and the residuals fall in the range of 0.15 m. The accuracy reaches the range resolution level, and the Root Mean Square Error (RMSE) is 0.0528 m. The estimated results of the along-the-track deviation are shown in Figure 9c and Figure 9d, respectively. The accuracy is also at the level of range resolution, with an RMSE of 0.038 m.

4.2. Experimental Results

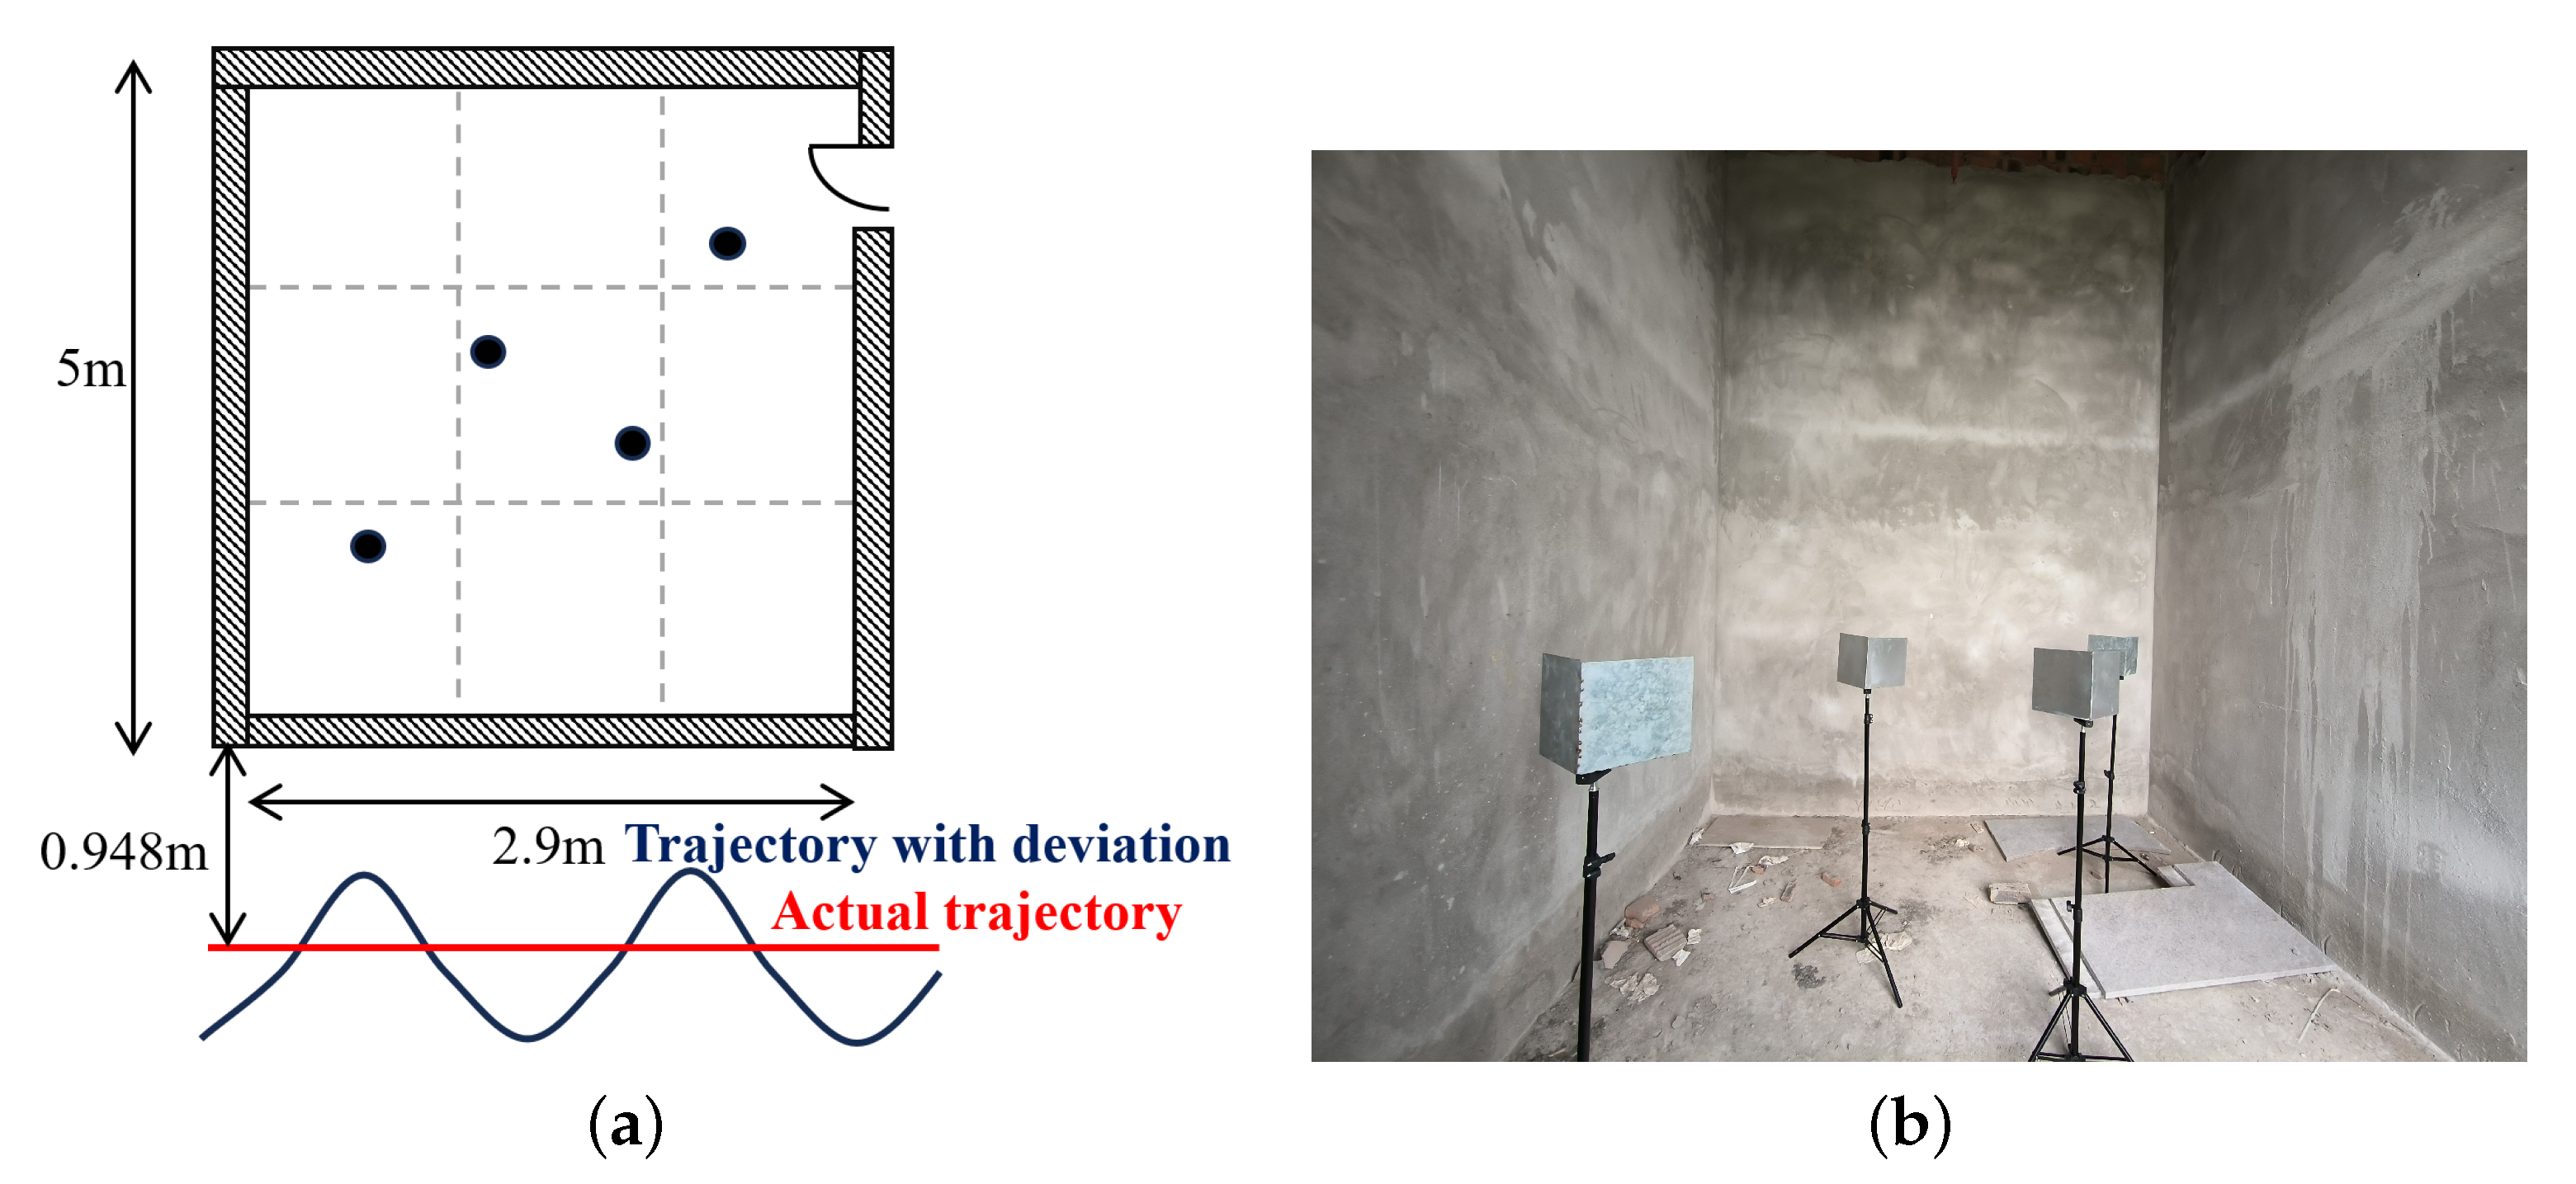
Figure 10 shows the experimental environment. Four angle reflectors with side lengths of 20 cm are placed inside a room of size 2.9 × 5 m as detection targets. The radar moves along the wall outside the room, following a straight line trajectory. The wall is composed of brick and concrete, with a thickness of 120 mm and a relative dielectric constant of 4.5. A vector network analyzer of Keysight Technologies N9923A is used to transmit the step frequency signal during the experiment. The actual position of the radar is unknowable due to the unavoidable measurement error regardless of the experimental method in practice. To determine the actual trajectory of the radar in the experiment, the radar is projected on the ground. We calibrate the projection of the radar on the ground to minimize measurement errors. A total of 29 sampling points are calibrated.
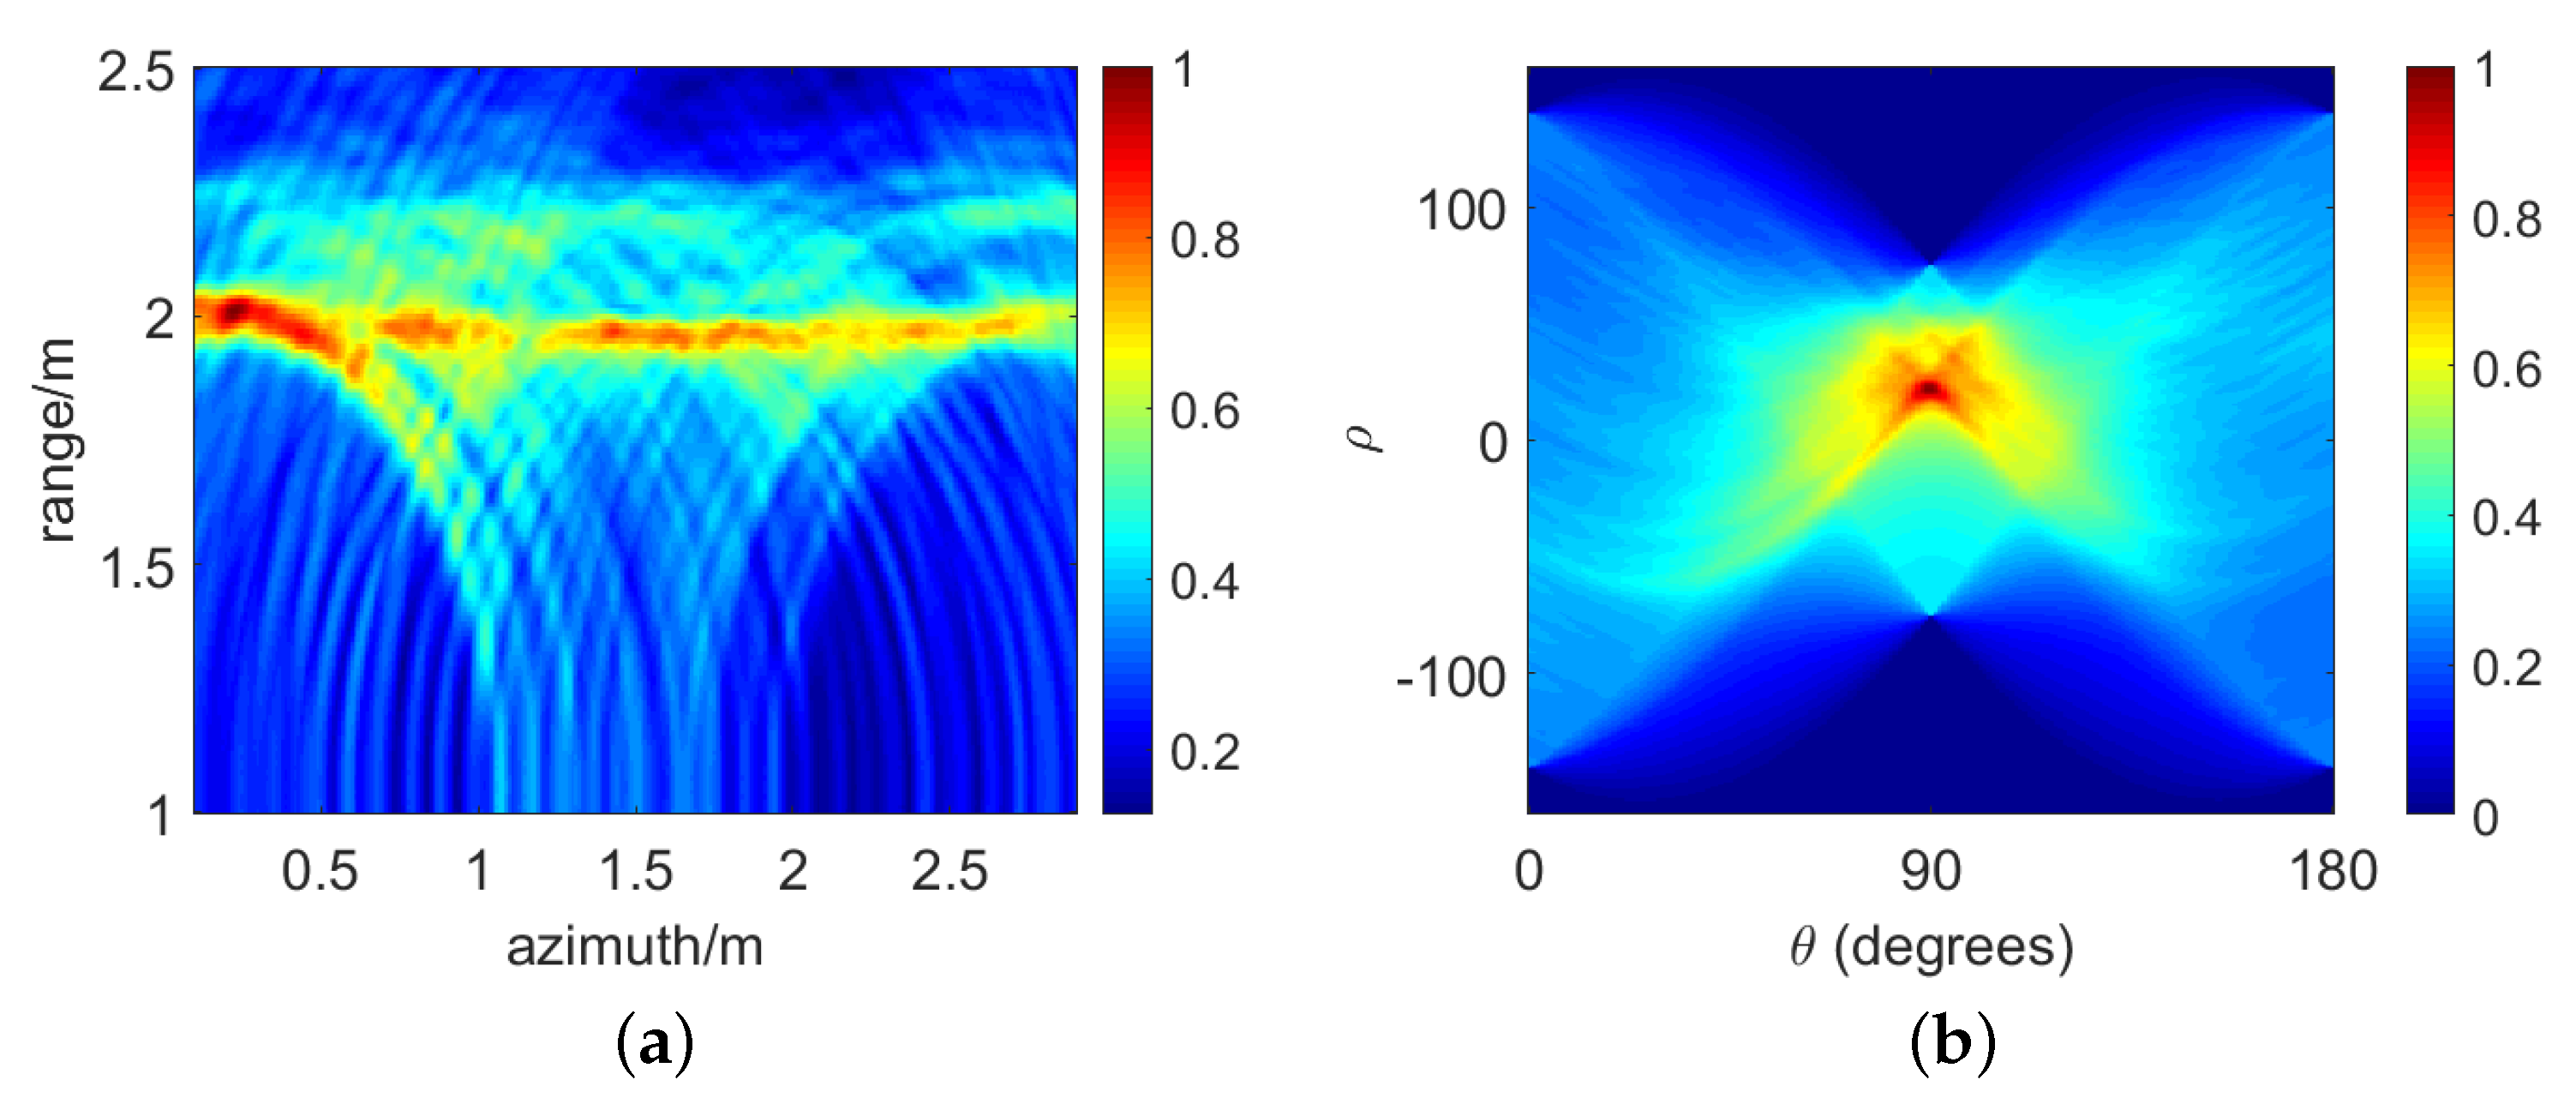
The experimental parameters are listed in Table 3, and the experimental results for the wall are presented in Figure 11. Overall, the results are consistent with the simulation results. From Figure 11a,b, it can be seen that the BP image of the wall, in the absence of trajectory deviation, exhibits a desirable straight line that yields a focused peak in the R f domain. When there are trajectory deviations in the LOS direction, as shown in Figure 11c,d, the BP imaging result is severely corrupted and the wall becomes unrecognizable. As a result, the peak energy corresponding to the wall in the R f domain diffuses severely. After compensation with the proposed algorithm, Figure 11e,f show that the wall in the BP image is restored to an ideal straight line, with the peak in the R f domain refocused as well. The restored results are comparable to Figure 11a,b in the absence of trajectory deviation in the LOS direction, which indicates that the trajectory deviations in the line-of-sight direction are corrected greatly.
The experimental results for the targets are presented in Figure 12. Notably, the arc-like shadow around the point targets is the result of the coherent summation of the range compressed data in the BP algorithm. The compensation of the along-the-track deviation is carried out after the compensation of the LOS direction deviation. Due to the residuals in the LOS direction deviation estimation, the point target is defocused to some extent even when there is no along-the-track deviation, which is demonstrated by the farthest target in Figure 12a. After applying the along-the-track deviation as shown in Figure 12b, the energy of the point targets is scattered severely, and the target positions cannot be recognized. Figure 12c depicts the result when the along-the-track deviation is compensated for with the proposed algorithm. As seen, the point targets are refocused and comparable to the case without along-the-track deviation in Figure 12a.
The experimental results of the trajectory deviation estimation are illustrated in Figure 13. The estimated LOS direction trajectory deviation curve in Figure 13a matches with the true curve. Figure 13b shows that the estimation errors for the LOS direction trajectory deviation fall in a range varying from −0.01 m to 0.07 m. The RMSE of estimation is 0.0285 m. Figure 13c,d represent the estimated curve and residuals of along-the-track deviation, respectively. The residuals fall in a range of −0.1 m to 0.04 m with the RMSE equal to 0.0396 m. The RMSE of along-the-track deviation is slightly larger than the line-of-sight deviation. This is because the accuracy of the along-the-track deviation estimation is affected by the error residuals in the LOS deviation estimation.

5. Discussion

The algorithm presented in this article is appropriate for situations where the trajectory deviation is significantly greater than the range resolution. Specifically, in the simulation, the magnitude of the trajectory deviation is approximately three times the range resolution, while in the experiment, it is approximately 20 times the range resolution. In such cases, the envelope error of the echo has a notable impact on the BP imaging. However, the phase error has a great impact on imaging when the compensated residuals are within the range resolution level. Therefore, other phase error estimation and compensation algorithms based on range Doppler-domain data can be applied after processing the proposed algorithm to further improve the estimation accuracy and focusing effect of the image.

6. Conclusions

In this article, we proposed an autofocus algorithm for estimating the trajectory deviation of UAV through-wall radar. By optimizing the objective function of image contrast, the algorithm estimates the trajectory deviation of UAV-borne radar in the LOS direction utilizing the linear characteristic of the wall and the deviation along the track by the targets behind the wall, respectively. Thus, it circumvents the problem of serious 2D space-variant error and refocuses the imaging result. The simulation and experimental results show that the proposed algorithm works well in cases where the trajectory deviation exceeds the range resolution, which can greatly serve UAV-borne through-wall radar detection applications. The algorithm is capable of achieving maximum estimation accuracy at the level of range resolution. In the future, we will strive to improve the estimation accuracy and estimate UAV posture and vibration error.

Author Contributions

Conceptualization, L.C. and X.Z.; methodology, L.C., X.Z. and S.Z.; software, L.C.; validation, L.C., X.Z., S.Z. and J.G.; formal analysis, L.C., X.Z. and S.Z.; investigation, L.C.; resources, L.C., X.Z. and X.Y.; data curation, L.C.; writing—original draft preparation, L.C.; writing—review and editing, L.C. and X.Z.; visualization, L.C.; supervision, L.C., X.Z. and X.Y.; project administration, L.C., X.Z. and S.Z.; funding acquisition, X.Z. and X.Y. All authors have read and agreed to the published version of the manuscript.

Funding

This work is supported financially by the National Natural Science Foundation of China under Grant No. 62301042, the Fundamental Research Funds for the Central Universities (No. 3050012222315) of the Beijing Institute of Technology, and funds of National Key Lab of Microwave Imaging Technology.

Data Availability Statement

The data pertaining to this scientific research are currently unavailable for public access due to confidentiality constraints. For inquiries regarding access to the data, please get in touch with the corresponding author.

Acknowledgments

The authors acknowledge the above funds for supporting this research and all editors and reviewers for their comments and suggestions.

Conflicts of Interest

The authors declare no conflicts of interest.

References

  1. Chaves, C.S.; Geschke, R.H.; Shargorodskyy, M.; Brauns, R.; Herschel, R.; Krebs, C. Polarimetric UAV-deployed FMCW Radar for Buried People Detection in Rescue Scenarios. In Proceedings of the 2021 18th European Radar Conference (EuRAD), London, UK, 5–7 April 2022; pp. 5–8. [Google Scholar] [CrossRef]
  2. Stockel, P.; Wallrath, P.; Herschel, R.; Pohl, N. Detection and Monitoring of People in Collapsed Buildings Using a Rotating Radar on a UAV. IEEE Trans. Radar Syst. 2024, 2, 13–23. [Google Scholar] [CrossRef]
  3. Li, Z.; Li, Y. The best way to promote efficiency and precision of laser scanning for ancient architectures mapping—An ideal rotary-UAV with minimum vibration for LIDAR. In Proceedings of the 2011 International Conference on Remote Sensing, Environment and Transportation Engineering, Nanjing, China, 24–26 June 2011; pp. 1761–1766. [Google Scholar] [CrossRef]
  4. Qu, J.; Huang, Y.; Li, H. Research on UAV Image Detection Method in Urban Low-altitude Complex Background. In Proceedings of the 2023 International Conference on Cyber-Physical Social Intelligence (ICCSI), Xi’an, China, 20–23 October 2023; pp. 26–31. [Google Scholar] [CrossRef]
  5. Wang, Z.; Liu, F.; Zeng, T.; Wang, C. A Novel Motion Compensation Algorithm Based on Motion Sensitivity Analysis for Mini-UAV-Based BiSAR System. IEEE Trans. Geosci. Remote Sens. 2022, 60, 1–13. [Google Scholar] [CrossRef]
  6. Joyo, M.K.; Hazry, D.; Faiz Ahmed, S.; Tanveer, M.H.; Warsi, F.A.; Hussain, A.T. Altitude and horizontal motion control of quadrotor UAV in the presence of air turbulence. In Proceedings of the 2013 IEEE Conference on Systems, Process and Control (ICSPC), Kuala Lumpur, Malaysia, 13–15 December 2013; pp. 16–20. [Google Scholar] [CrossRef]
  7. Quegan, S. Spotlight Synthetic Aperture Radar: Signal Processing Algorithms. J. Atmos. Sol.-Terr. Phys. 1995, 59, 246–260. [Google Scholar] [CrossRef]
  8. Niho, Y.G.; Day, E.W.; Flanders, T.L. Fast Phase Difference Autofocus. 1993. Available online: http://patents.google.com/patent/CA2083906A1 (accessed on 14 April 2024).
  9. Zhang, L.; Li, H.l.; Qiao, Z.j.; Xing, M.d.; Bao, Z. Integrating Autofocus Techniques with Fast Factorized Back-Projection for High-Resolution Spotlight SAR Imaging. IEEE Geosci. Remote Sens. Lett. 2013, 10, 1394–1398. [Google Scholar] [CrossRef]
  10. Mancill, C.E.; Swiger, J.M. A Map Drift Autofocus Technique for Correcting Higher Order SAR Phase Errors. In Proceedings of the 27th Annual Tri-service Radar Symposium Record, Monterey, Monterey, CA, USA, 23–25 June 1981; pp. 391–400. [Google Scholar]
  11. Berizzi, F.; Corsini, G.; Diani, M.; Veltroni, M. Autofocus of wide azimuth angle SAR images by contrast optimisation. In Proceedings of the IGARSS ’96, 1996 International Geoscience and Remote Sensing Symposium, Lincoln, NE, USA, 31–31 May 1996; Volume 2, pp. 1230–1232. [Google Scholar] [CrossRef]
  12. Ahmed, N.; Natarajan, T.; Rao, K. Discrete Cosine Transform. IEEE Trans. Comput. 1974, C-23, 90–93. [Google Scholar] [CrossRef]
  13. Azouz, A.; Li, Z. Improved phase gradient autofocus algorithm based on segments of variable lengths and minimum entropy phase correction. In Proceedings of the 2014 IEEE China Summit and International Conference on Signal and Information Processing (ChinaSIP), Xi’an, China, 9–13 July 2014; pp. 194–198. [Google Scholar] [CrossRef]
  14. Wahl, D.; Eichel, P.; Ghiglia, D.; Jakowatz, C. Phase gradient autofocus-a robust tool for high resolution SAR phase correction. IEEE Trans. Aerosp. Electron. Syst. 1994, 30, 827–835. [Google Scholar] [CrossRef]
  15. Ye, W.; Yeo, T.S.; Bao, Z. Weighted least-squares estimation of phase errors for SAR/ISAR autofocus. IEEE Trans. Geosci. Remote Sens. 1999, 37, 2487–2494. [Google Scholar] [CrossRef]
  16. Ash, J.N. An Autofocus Method for Backprojection Imagery in Synthetic Aperture Radar. IEEE Geosci. Remote Sens. Lett. 2012, 9, 104–108. [Google Scholar] [CrossRef]
  17. Li, Y.; Wu, J.; Pu, W.; Yang, J.; Huang, Y.; Li, W.; Yang, H.; Huo, W. An autofocus method based on maximum image sharpness for Fast Factorized Back-projection. In Proceedings of the 2017 IEEE Radar Conference (RadarConf), Seattle, WA, USA, 8–12 May 2017; pp. 1201–1204. [Google Scholar] [CrossRef]
  18. Wei, S.J.; Zhang, X.L.; Hu, K.B.; Wu, W.J. LASAR autofocus imaging using maximum sharpness back projection via semidefinite programming. In Proceedings of the 2015 IEEE Radar Conference (RadarCon), Arlington, VA, USA, 10–15 May 2015; pp. 1311–1315. [Google Scholar] [CrossRef]
  19. Torgrimsson, J.; Dammert, P.; Hellsten, H.; Ulander, L.M.H. Factorized Geometrical Autofocus for Synthetic Aperture Radar Processing. IEEE Trans. Geosci. Remote Sens. 2014, 52, 6674–6687. [Google Scholar] [CrossRef]
  20. Xing, M.; Jiang, X.; Wu, R.; Zhou, F.; Bao, Z. Motion Compensation for UAV SAR Based on Raw Radar Data. IEEE Trans. Geosci. Remote Sens. 2009, 47, 2870–2883. [Google Scholar] [CrossRef]
  21. Ding, Z.; Li, L.; Wang, Y.; Zhang, T.; Gao, W.; Zhu, K.; Zeng, T.; Yao, D. An Autofocus Approach for UAV-Based Ultrawideband Ultrawidebeam SAR Data With Frequency-Dependent and 2-D Space-Variant Motion Errors. IEEE Trans. Geosci. Remote Sens. 2022, 60, 1–18. [Google Scholar] [CrossRef]
  22. Hu, K.; Zhang, X.; He, S.; Zhao, H.; Shi, J. A Less-Memory and High-Efficiency Autofocus Back Projection Algorithm for SAR Imaging. IEEE Geosci. Remote Sens. Lett. 2015, 12, 890–894. [Google Scholar] [CrossRef]
  23. Ran, L.; Liu, Z.; Zhang, L.; Li, T.; Xie, R. An Autofocus Algorithm for Estimating Residual Trajectory Deviations in Synthetic Aperture Radar. IEEE Trans. Geosci. Remote Sens. 2017, 55, 3408–3425. [Google Scholar] [CrossRef]
  24. Chen, J.; Xing, M.; Sun, G.C.; Li, Z. A 2-D Space-Variant Motion Estimation and Compensation Method for Ultrahigh-Resolution Airborne Stepped-Frequency SAR With Long Integration Time. IEEE Trans. Geosci. Remote Sens. 2017, 55, 6390–6401. [Google Scholar] [CrossRef]
  25. Kraus, J.D.; Marhefka, R.J. Antennas for All Applications, 3rd ed.; Publishing House of Electronics Industry: Beijing, China, 2008; pp. 21–22. [Google Scholar]
  26. Zeng, X.; Yang, M.; Chen, B.; Jin, Y. Estimation of Direction of Arrival by Time Reversal for Low-Angle Targets. IEEE Trans. Aerosp. Electron. Syst. 2018, 54, 2675–2694. [Google Scholar] [CrossRef]
  27. Wang, F.; Zeng, X.; Wu, C.; Wang, B.; Liu, K.J.R. Driver Vital Signs Monitoring Using Millimeter Wave Radio. IEEE Internet Things J. 2022, 9, 11283–11298. [Google Scholar] [CrossRef]
  28. Wang, F.; Zhang, F.; Wu, C.; Wang, B.; Liu, K.J.R. ViMo: Multiperson Vital Sign Monitoring Using Commodity Millimeter-Wave Radio. IEEE Internet Things J. 2021, 8, 1294–1307. [Google Scholar] [CrossRef]
  29. Jin, T.; Chen, B.; Zhou, Z. Image-Domain Estimation of Wall Parameters for Autofocusing of Through-the-Wall SAR Imagery. IEEE Trans. Geosci. Remote Sens. 2013, 51, 1836–1843. [Google Scholar] [CrossRef]
  30. Zhang, C.; Zhou, X.; Zhao, H.; Dai, A.; Zhou, H. Three-dimensional fuzzy control of mini quadrotor UAV trajectory tracking under impact of wind disturbance. In Proceedings of the 2016 International Conference on Advanced Mechatronic Systems (ICAMechS), Melbourne, VIC, Australia, 30 November–3 December 2016; pp. 372–377. [Google Scholar] [CrossRef]
  31. Berizzi, F.; Corsini, G. Autofocusing of inverse synthetic aperture radar images using contrast optimization. IEEE Trans. Aerosp. Electron. Syst. 1996, 32, 1185–1191. [Google Scholar] [CrossRef]
  32. GB 50003-2011; Ministry of Housing and Urban-Rural Development of the People’s Republic of China. China Architecture and Building Press: Beijing, China, 2011.
  33. Giri, D.V.; Tesche, F.M. Electromagnetic attenuation through various types of buildings. In Proceedings of the 2013 Asia-Pacific Symposium on Electromagnetic Compatibility (APEMC), Melbourne, VIC, Australia, 20–23 May 2013; pp. 1–4. [Google Scholar] [CrossRef]
  34. Ali-Rantala, P.; Ukkonen, L.; Sydanheimo, L.; Keskilammi, M.; Kivikoski, M. Different kinds of walls and their effect on the attenuation of radiowaves indoors. In Proceedings of the IEEE Antennas and Propagation Society International Symposium. Digest. Held in conjunction with: USNC/CNC/URSI North American Radio Sci. Meeting (Cat. No.03CH37450), Columbus, OH, USA, 22–27 June 2003; Volume 3, pp. 1020–1023. [Google Scholar] [CrossRef]
  35. Ferreira, D.; Fernandes, T.R.; Caldeirinha, R.F.S.; Cuinas, I. Characterization of wireless propagation through traditional Iberian brick walls. In Proceedings of the 2017 11th European Conference on Antennas and Propagation (EUCAP), Paris, France, 19–24 March 2017; pp. 2454–2458. [Google Scholar] [CrossRef]
  36. Yu, L.; Zhang, Y.; Zhang, Q.; Dong, Z.; Ji, Y.; Qin, B. A Novel Ionospheric Scintillation Mitigation Method Based on Minimum-Entropy Autofocus in P-band SAR Imaging. In Proceedings of the 2019 IEEE 4th International Conference on Signal and Image Processing (ICSIP), Wuxi, China, 19–21 July 2019; pp. 198–202. [Google Scholar] [CrossRef]
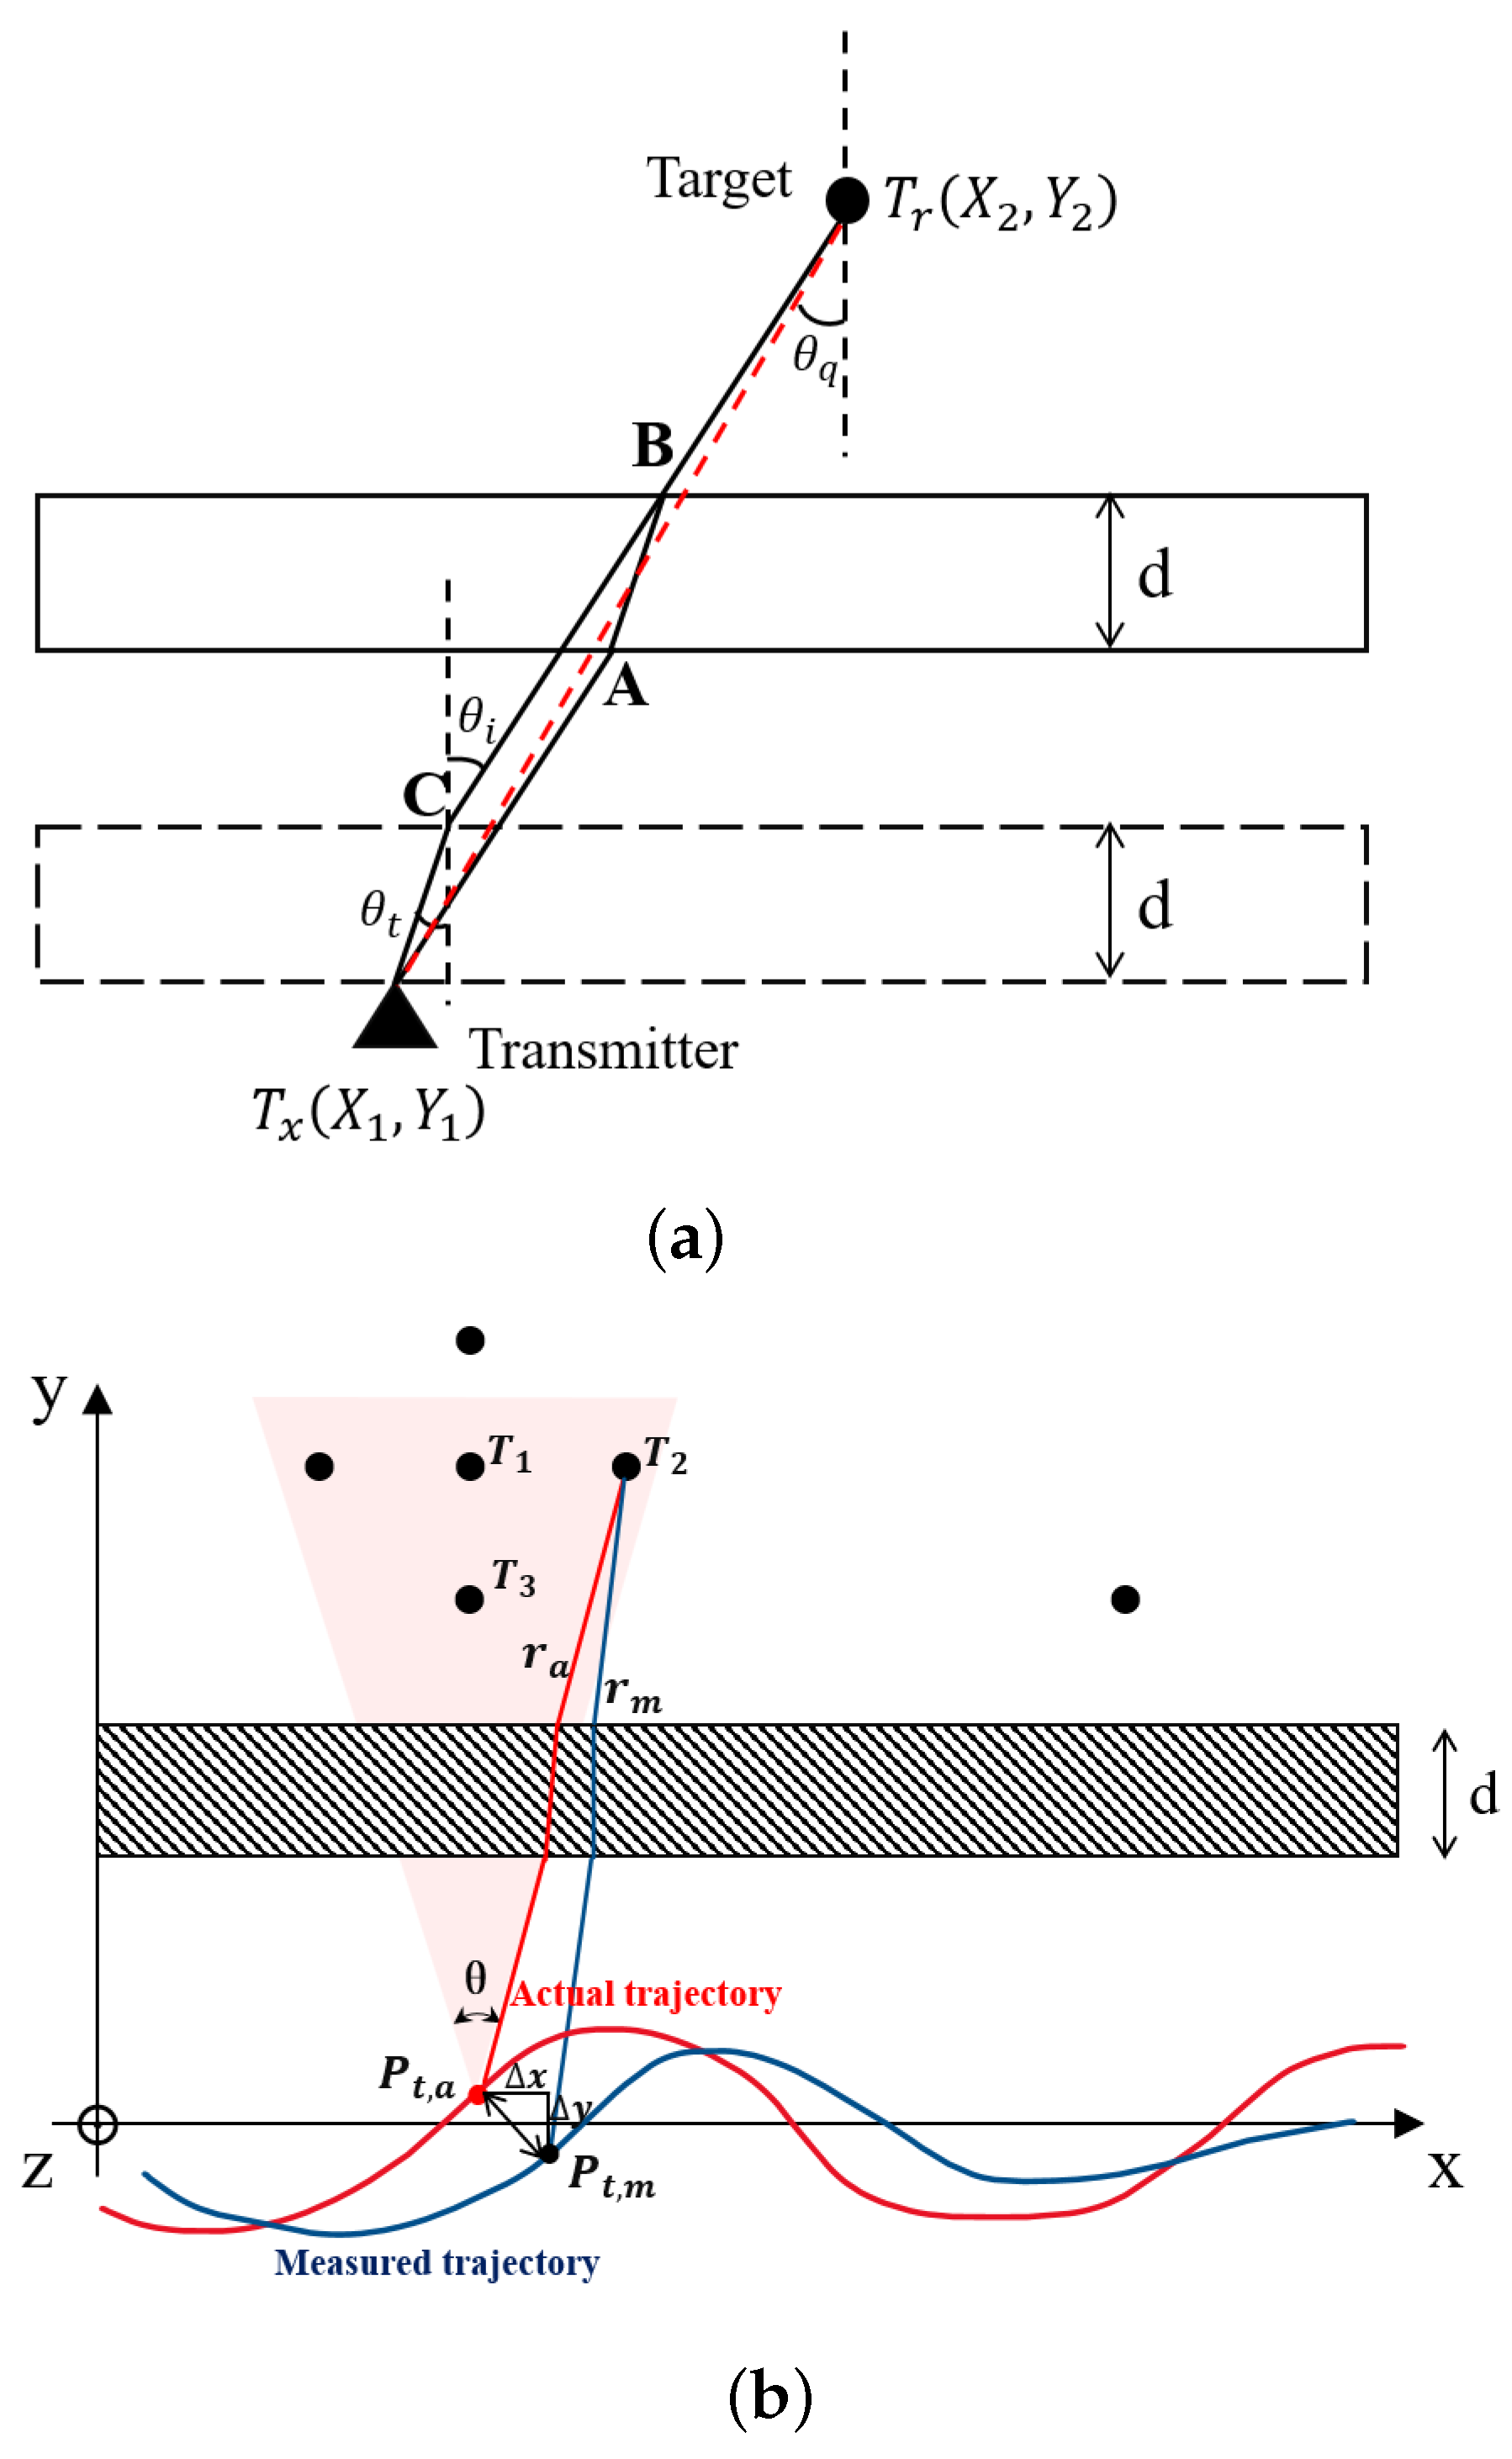
Figure 1. (a) Through-wall signal propagation path model, (b) through-wall detection model in the presence of trajectory deviation.
Remotesensing 16 01593 g001
Figure 2. Illustration of wall echoes.
Remotesensing 16 01593 g002
Figure 3. The R f domain result under the actual and measured trajectory. (a) Actual trajectory, (b) measured trajectory.
Remotesensing 16 01593 g003
Figure 4. Illustration of target echoes.
Remotesensing 16 01593 g004
Figure 5. Flowchart of the proposed algorithm.
Remotesensing 16 01593 g005
Figure 6. Simulation scene for through-wall detection.
Remotesensing 16 01593 g006
Figure 7. (a) BP image of the wall without LOS direction deviation, (b) Radon transform result of (a), (c) BP image of the wall with LOS direction deviation, (d) Radon transform result of (c), (e) BP image of the wall after estimation and compensation for LOS direction deviation, and (f) Radon transform result of (e).
Remotesensing 16 01593 g007
Figure 8. (a) RD image of targets without along-the-track deviation, (b) RD image of targets with along-the-track deviation, (c) RD image of targets after autofocusing by [36], (d) BP image of targets without along-the-track deviation, (e) BP image of targets with along-the-track deviation, and (f) BP image of targets after estimating and compensating for the deviations with the proposed algorithm.
Remotesensing 16 01593 g008
Figure 9. (a) Estimation of the trajectory deviation in the line-of-sight direction, (b) estimation residual of the trajectory deviation in the line-of-sight direction, (c) estimation of the trajectory deviation along the track, and (d) estimation residual of the trajectory deviation along the track.
Remotesensing 16 01593 g009
Figure 10. (a) Experimental scene, (b) experimental environment.
Remotesensing 16 01593 g010
Figure 11. Experimental results for the (a) BP image of the wall without LOS direction deviation, (b) Radon transform result of (a), (c) BP image of the wall with LOS direction deviation, (d) Radon transform result of (c), (e) BP image of the wall after estimation and compensation for LOS direction deviation, and (f) Radon transform result of (e).
Remotesensing 16 01593 g011aRemotesensing 16 01593 g011b
Figure 12. Experimental results after the compensation of deviation in the LOS direction. (a) BP image of targets without along-the-track deviation, (b) BP image of targets with along-the-track deviation, (c) BP image of targets after compensation for both LOS and along-the-track deviations.
Remotesensing 16 01593 g012
Figure 13. Experimental estimation results. (a) Estimation of trajectory deviation in the line-of-sight direction, (b) estimation residual of trajectory deviation in the line-of-sight direction, (c) estimation of trajectory deviation along the track, (d) and estimation residual of trajectory deviation along the track.
Remotesensing 16 01593 g013
Table 1. Electromagnetic parameters of typical building materials.
MaterialRelative PermittivityConductivity (S/m)
Brick4∼7 10 5 10 4
Cement6∼7 10 4 10 3
Concrete5∼7 10 5 10 3
Wood1.5∼2.5 10 7 10 4
Glass3∼7 10 10 10 6
Table 2. Simulation parameters of UAV-borne FMCW radar.
ParameterValue
Carrier frequency3 GHz
Signal band1 GHz
PRT1300 μ s
Sampling rate2 MHz
Beam width in azimuth 30
Length of synthetic aperture10 m
Squint angle 0
Range resolution0.15 m
Table 3. Experimental parameters.
ParameterValue
Minimum frequency0.1 GHz
Maximum frequency6 GHz
Frequency step0.1 GHz
Measurement speed0.36 ms/point
Beam width in azimuth 60
Antenna typeVivaldi
Antenna distance8 cm
Height1.1 m
Range resolution0.025 m
Disclaimer/Publisher’s Note: The statements, opinions and data contained in all publications are solely those of the individual author(s) and contributor(s) and not of MDPI and/or the editor(s). MDPI and/or the editor(s) disclaim responsibility for any injury to people or property resulting from any ideas, methods, instructions or products referred to in the content.