Article

GNSS and Sentinel-1 InSAR Integrated Long-Term Subsidence Monitoring in Quetta and Mastung Districts, Balochistan, Pakistan

by
Najeebullah Kakar
1,2,
Chaoying Zhao
1,3,*,
Guangrong Li
1 and
Haolin Zhao
1
1
School of Geological Engineering and Geomatics, Chang’an University, Xi’an 710054, China
2
Department of Geology, University of Balochistan, Quetta 08770, Pakistan
3
Key Laboratory of Western China’s Mineral Resource and Geological Engineering, Ministry of Education, Xi’an 710054, China
*
Author to whom correspondence should be addressed.
Remote Sens. 2024, 16(9), 1521; https://doi.org/10.3390/rs16091521
Submission received: 15 February 2024 / Revised: 2 April 2024 / Accepted: 22 April 2024 / Published: 25 April 2024

Abstract

:
Land subsidence (LS) is a global phenomenon that has affected several urban centres around the world such as Jakarta (Indonesia), Mexico City (Mexico), Xi’an (China), and Iron County (US). It has mainly been attributed to anthropogenic activities such as groundwater exploitation, especially in unconsolidated aquifer systems rich in highly compressible clay and silt. The platy clay minerals rearrange into horizontal stacks after dewatering, leading to a volume change due to overburden. In this study, land subsidence is investigated in the Quetta and Mastung districts, Balochistan, Pakistan, by employing Small Baseline Subset (SBAS) Interferometric Synthetic Aperture Radar (InSAR), Global Navigation Satellite System (GNSS), and groundwater level (GWL) variations. This study represents the first attempt in Pakistan to measure the long-term land subsidence by fusing GNSS and InSAR data for improved validity. InSAR data from the Sentinel-1 satellite in the Ascending (195 scenes) and Descending (183 scenes) tracks were used to analyse LS from December 2015 to December 2022. High-accuracy Trimble NetRS GNSS receivers were used in five locations from October 2006 to December 2022. An average subsidence ranging from 3.2 cm/y to 16 cm/y was recorded in the valley mainly due to the GWL decline and clay-rich sediments, which are prone to compaction due to dewatering. An accumulative LS of 2 m was recorded by the permanent GNSS station in central Quetta from October 2008 to January 2023 (14.2 years). An acceleration in the subsidence from 12 cm/y to 16.6 cm/y after 2016 was recorded by the continuous GNSS. Additionally, the InSAR and GNSS values were compared for validation, resulting in a good correlation between both techniques. A GWL decline ranging from 1.7 m to 6 m was recorded by the piezometers in Quetta during the period 1987–2022. Large- and small-scale fissures were observed in the study area during the surveys. These fissures are responsible for damage to the city’s infrastructure and aquifer contamination. The subsidence profile also agrees with the subsurface lithology. Our assessment concludes that Quetta may be the fastest-sinking metropolitan city in Pakistan. The overexploitation of groundwater and the population explosion may be the main contributing factors for the land subsidence.

1. Introduction

Globally, land subsidence (LS) is one of the major geological hazards that has been extensively studied in recent decades [1]. It is caused by natural phenomena such as sediment compaction and tectonics or anthropogenic activities such as groundwater abstraction, underground mining, and oil extraction [2]. Fissures caused by LS in urban areas can pose serious economic threats to local communities, including damage to infrastructure, canal systems, and bridges. LS can have adverse consequences for the health and safety of residing communities due to the penetration of sewerage water into the aquifer system through fissures, resulting in groundwater contamination. Land subsidence due to human activities, notably groundwater extraction, is identified as the primary factor in numerous urban centres.
Aquifer systems worldwide are under stress due to the increased demand for freshwater driven by population growth. Globally, around 982 billion cubic meters of groundwater are extracted annually [3]. The large-scale extraction of groundwater from aquifers leads to the collapse of pore spaces, which results in subsidence. LS occurs when there is a substantial imbalance between the recharge and discharge within the aquifer system.
Developing countries such as Pakistan are particularly affected by groundwater over-extraction due to the inadequate implementation of environmental regulations. Around 60–70% of Pakistan’s population of 241 million directly or indirectly relies on groundwater [4]. Pakistan surpassed the sustainable limit of safe yield after extracting 61 billion cubic meters of groundwater from its aquifers [5]. The Indus Basin aquifer system is now the second most stressed reservoir in the world after its groundwater utilization increased from 5.2 to 9.7 million acres [6]. In Pakistan, groundwater supports 100% of the industrial needs, 90% of the municipal water supply, and 60% of the agricultural requirements, which makes it one of its crucial entities [4].
The groundwater level (GWL) in Quetta City has been declining at an alarming rate. In the late 18th century, Oldham reported the first artesian well in Quetta, which released 75,000 litres of water per hour after the impermeable layer was drilled through by the first steam engine [7]. By the 1980s, the GWL was approximately −30 m [8], but by 2022, it had plummeted to as low as −170 m in certain areas.
The Global Navigation Satellite System (GNSS) is one of the most precise and reliable instruments employed for decades to monitor land displacement in 3D space and time. GNSS has a very high temporal resolution; however, its spatial resolution is not adequate enough due to point-based measurements [9,10,11]. In contrast, the Interferometric Synthetic Aperture Radar (InSAR) technique provides high-precision displacement information along the line of sight (LOS), covering thousands of square kilometres in all weather conditions. It is precise enough to measure the deformation ranging from an accuracy of centimetres to millimetres by analysing the phase information of the radar backscatters [12,13,14]. The InSAR technique has evolved into an essential tool for remote sensing and geodetic applications [15,16,17]. This technique can be applied to both urban and rural areas [18,19,20].
The differential InSAR (DInSAR) technique is one of the traditional methods used by researchers to study land deformation using two satellite acquisitions. However, this method is prone to several decorrelation errors such as geometric baseline, atmospheric distortion, temporal changes, and topography. To mitigate these errors, advanced remote sensing methods such as Persistent Scattering InSAR (PSInSAR) and Small Baseline Subsets (SBAS-InSAR) have been developed [21,22,23,24]. These techniques are capable of detecting small deformations in ideal conditions with high precision. The PSInSAR technique determines the pixels with a high coherence value of the phase information in space while the SBAS-InSAR technique inspects the entire image, considering scattered targets collectively with a high coherence value [25]. The SBAS-InSAR technique specifically focuses on the baselines between individual interferogram pairs to monitor large-scale, slow deformation. It gives the most accurate results in regions with scarce vegetation. Reference [26] assessed the accuracy between the PSInSAR and SBAS-InSAR techniques over Mexico City. They compared the results of the two methods and calculated 6 mm/y and 4 mm/y of standard deviation in the vertical and horizontal direction. The problems associated with the PSInSAR and SBAS-InSAR techniques include, but are not limited to, the decorrelation of phase information due to ionospheric and atmospheric artefacts [27,28]. LS has been monitored using the SBAS-InSAR technique in several urban regions around the world such as Iran [29], China [30,31], Bangladesh [32], Mexico [11,33,34], Indonesia [35], and Italy [36]. The climate of the Quetta and Mastung region is arid and does not have natural vegetation, which makes the SBAS-InSAR technique an ideal choice for space-borne surveys.
Previous researchers have studied land subsidence in Quetta either by employing GNSS or PSInSAR but not the combination of both techniques. Khan et al. analysed the GNSS data from 2006 to 2009 and revealed that the city was subsiding at 10 cm/y [37]. Kakar et al. studied the subsidence using the GNSS data from 2006 to 2016 and stated that the subsidence rate had increased to 12 cm/y [38]. Ahmed et al. measured LS in the Quetta region using the PSInSAR technique from 2014 to 2016 in the Descending track and revealed that the deformation rate of Quetta is around 12.5 cm/y [39]. No subsidence analysis has been carried out in Quetta Valley since 2016 and no subsidence has ever been studied in the Mastung region. Moreover, the geological perspective and the causes of LS in the study area have barely been discussed previously. To the best of our knowledge, InSAR studies in Pakistan have not been validated by in situ measurements. This study is the first-ever attempt in Pakistan to measure long-term land subsidence by the fusion of GNSS and InSAR data for improved validity. Considering the scope of this study, the following steps were explored.
  • Using the SBAS-InSAR technique, 7 years of time series analysis was performed to measure land subsidence in the Quetta and Mastung districts using Sentinel-1 SAR images. The temporal range of the InSAR analysis ranges from December 2015 to December 2022.
  • Up to 16 years (2006–2022) of campaign and continuous GNSS data were collected and processed over Quetta city from five GNSS stations.
  • Groundwater depletion data from 1988 to 2020 were collected to assess the decline rate in the aquifer system from 37 monitoring wells operated by the Balochistan Irrigation Department (BID).
  • The GNSS and InSAR measurements including the Ascending and Descending values are cross-validated in this study.
  • The causes of LS are revealed by cross-correlation among GWL and InSAR measurements in addition to subsurface lithology. Moreover, the groundwater decline is correlated with the population growth over time.

2. Study Area

Quetta is the administrative capital of the largest province of Pakistan, called Balochistan. It is an elongated north–south, bowl-shaped valley that extends from Mian Ghundi Hill in the southeast to Takatu Hill in the northwest. The valley is flanked in the west and east by the Chiltan and Murdar mountain ranges. Geographically, the city lies between latitude 30°00′ to 30°36′N and longitude 66°50′ to 67°21′E, covering an estimated area of 670 km2. Mastung is an adjacent town that lies to the southwest of Quetta city, as seen in Figure 1.

2.1. Climate and Population

The climate of both Mastung and Quetta is arid to semi-arid. The two districts receive about 210 mm of rainfall annually [40]. The altitude of Quetta and Mastung is 1680 and 1650 m above mean sea level, respectively. Groundwater, which is only recharged by precipitation, is the only source for industrial, agricultural, and domestic use in Quetta and Mastung [41,42]. A total of 18 drought events have occurred in Quetta Valley from 1950 to 2010, with an average interval of 3.3 years. The most recent dry spell occurred from 1997 to 2003 [41]. The aquifer of the study area is under stress due to decades of mismanagement, droughts, and overexploitation of groundwater coupled with the population explosion. Currently, 2444 tube wells are operating in Quetta Valley, of which 494 have dried due to GWL decline [42]. The annual discharge and recharge of Quetta’s aquifer system is 61.15 million m3 and 97.65 million m3, respectively, resulting in a deficit of 36.5 million m3 [43].
The population of Quetta district increased from around 0.7 million in 1998 to 2.2 million in 2017, which translates to an annual growth rate of 5.8%. The population density of Quetta city is 658 per km2. Similarly, the population of Mastung increased from 0.15 million in 1998 to 0.26 million in 2017, with a growth rate of 3% per year [44].

2.2. Geological Settings

Quetta and Mastung are composed mostly of sedimentary rocks from Lower Jurassic to Quaternary deposits [45,46,47]. The study area is located at the northern end of the Kirther fold–thrust belt [48,49]. Both Quetta and Mastung are part of the larger watershed basin called the Pishin Lora Basin, which also extends to southern Afghanistan [50]. The geology of the region is complex due to the existence of the Chaman transform boundary to the east [51]. Several NS strike-slip faults exist in the Kirther fold belt [52]. Primarily, the Quetta and Mastung aquifer system is composed of two main types. The upper part is mainly composed of unconsolidated alluvium with thick silt and clay lithology and gravel and sand patches, while the lower part is made up of limestone bedrock, as shown in Figure 2. These clay and silt sediments, as demonstrated by the wells W1, W2, and W3 in Figure 1c, are mainly responsible for the compaction of the sediments. The Shirnab and Chiltan limestone is from the Upper and Lower Jurassic period, as shown in the lithological cross-section A–A′ developed from seismic, electrical resistivity, and gravity surveys [50,53,54] (Figure 2).

3. Datasets and Methodology

3.1. InSAR Datasets

We utilized the SAR acquisitions from the Sentinel-1 satellite constellations operated by the European Space Agency (ESA) and distributed under the Copernicus program. All the SAR images were downloaded in bulk from the Alaska Satellite Facility Data Search Vortex [55]. The data are available free of cost in a Single Look Complex format (SLC) with level 1 pre-processed. The satellite sensor acquires these images in the C band of the electromagnetic spectrum with 5.6 cm wavelengths. Each pixel has a spatial resolution of 5 m by 20 m in the range and azimuth direction. The Sentinel-1 data are available in the interferometric wide (IW) swath in Ascending and Descending tracks, with VV polarization. The images are taken in Terrain Observation and Progressive Scan (TOPS) mode. In this mode, the satellite antenna is electronically steered for multiple bursts that overlap over the edges [56]. The end user receives the data in three sub-swaths whose ground coverage is 250 km in the slant range. Additionally, the Global 1 arc second, 30 m Shuttle Radar Topography Mission (SRTM) Digital Elevation Model (DEM) was downloaded from the United States Geological Survey (USGS) website to remove the topographic errors from the phase components.
A total of 195 and 183 acquisitions in the Ascending and Descending tracks were processed in GAMMA-2017® software, which was developed by GAMMA Remote Sensing AG, Muri bei Bern, Switzerland [57]. The maximum perpendicular and temporal baseline for both Ascending and Descending tracks were set to 200 m and 40 days. These thresholds were set in order to minimize the decorrelation effects and improve the signal-to-noise ratio in the interferograms. The timeline of Ascending and Descending tracks starts from 2 December 2015 to 25 December 2022 and 28 November 2015 to 9 December 2022, as shown in Figure 3. The incidence angles for Ascending (Frame 490, 491, 492) and Descending (Frame 92, 95) tracks are 39.2 and 33.9 degrees, respectively.

3.2. GNSS Measurements and Methodology

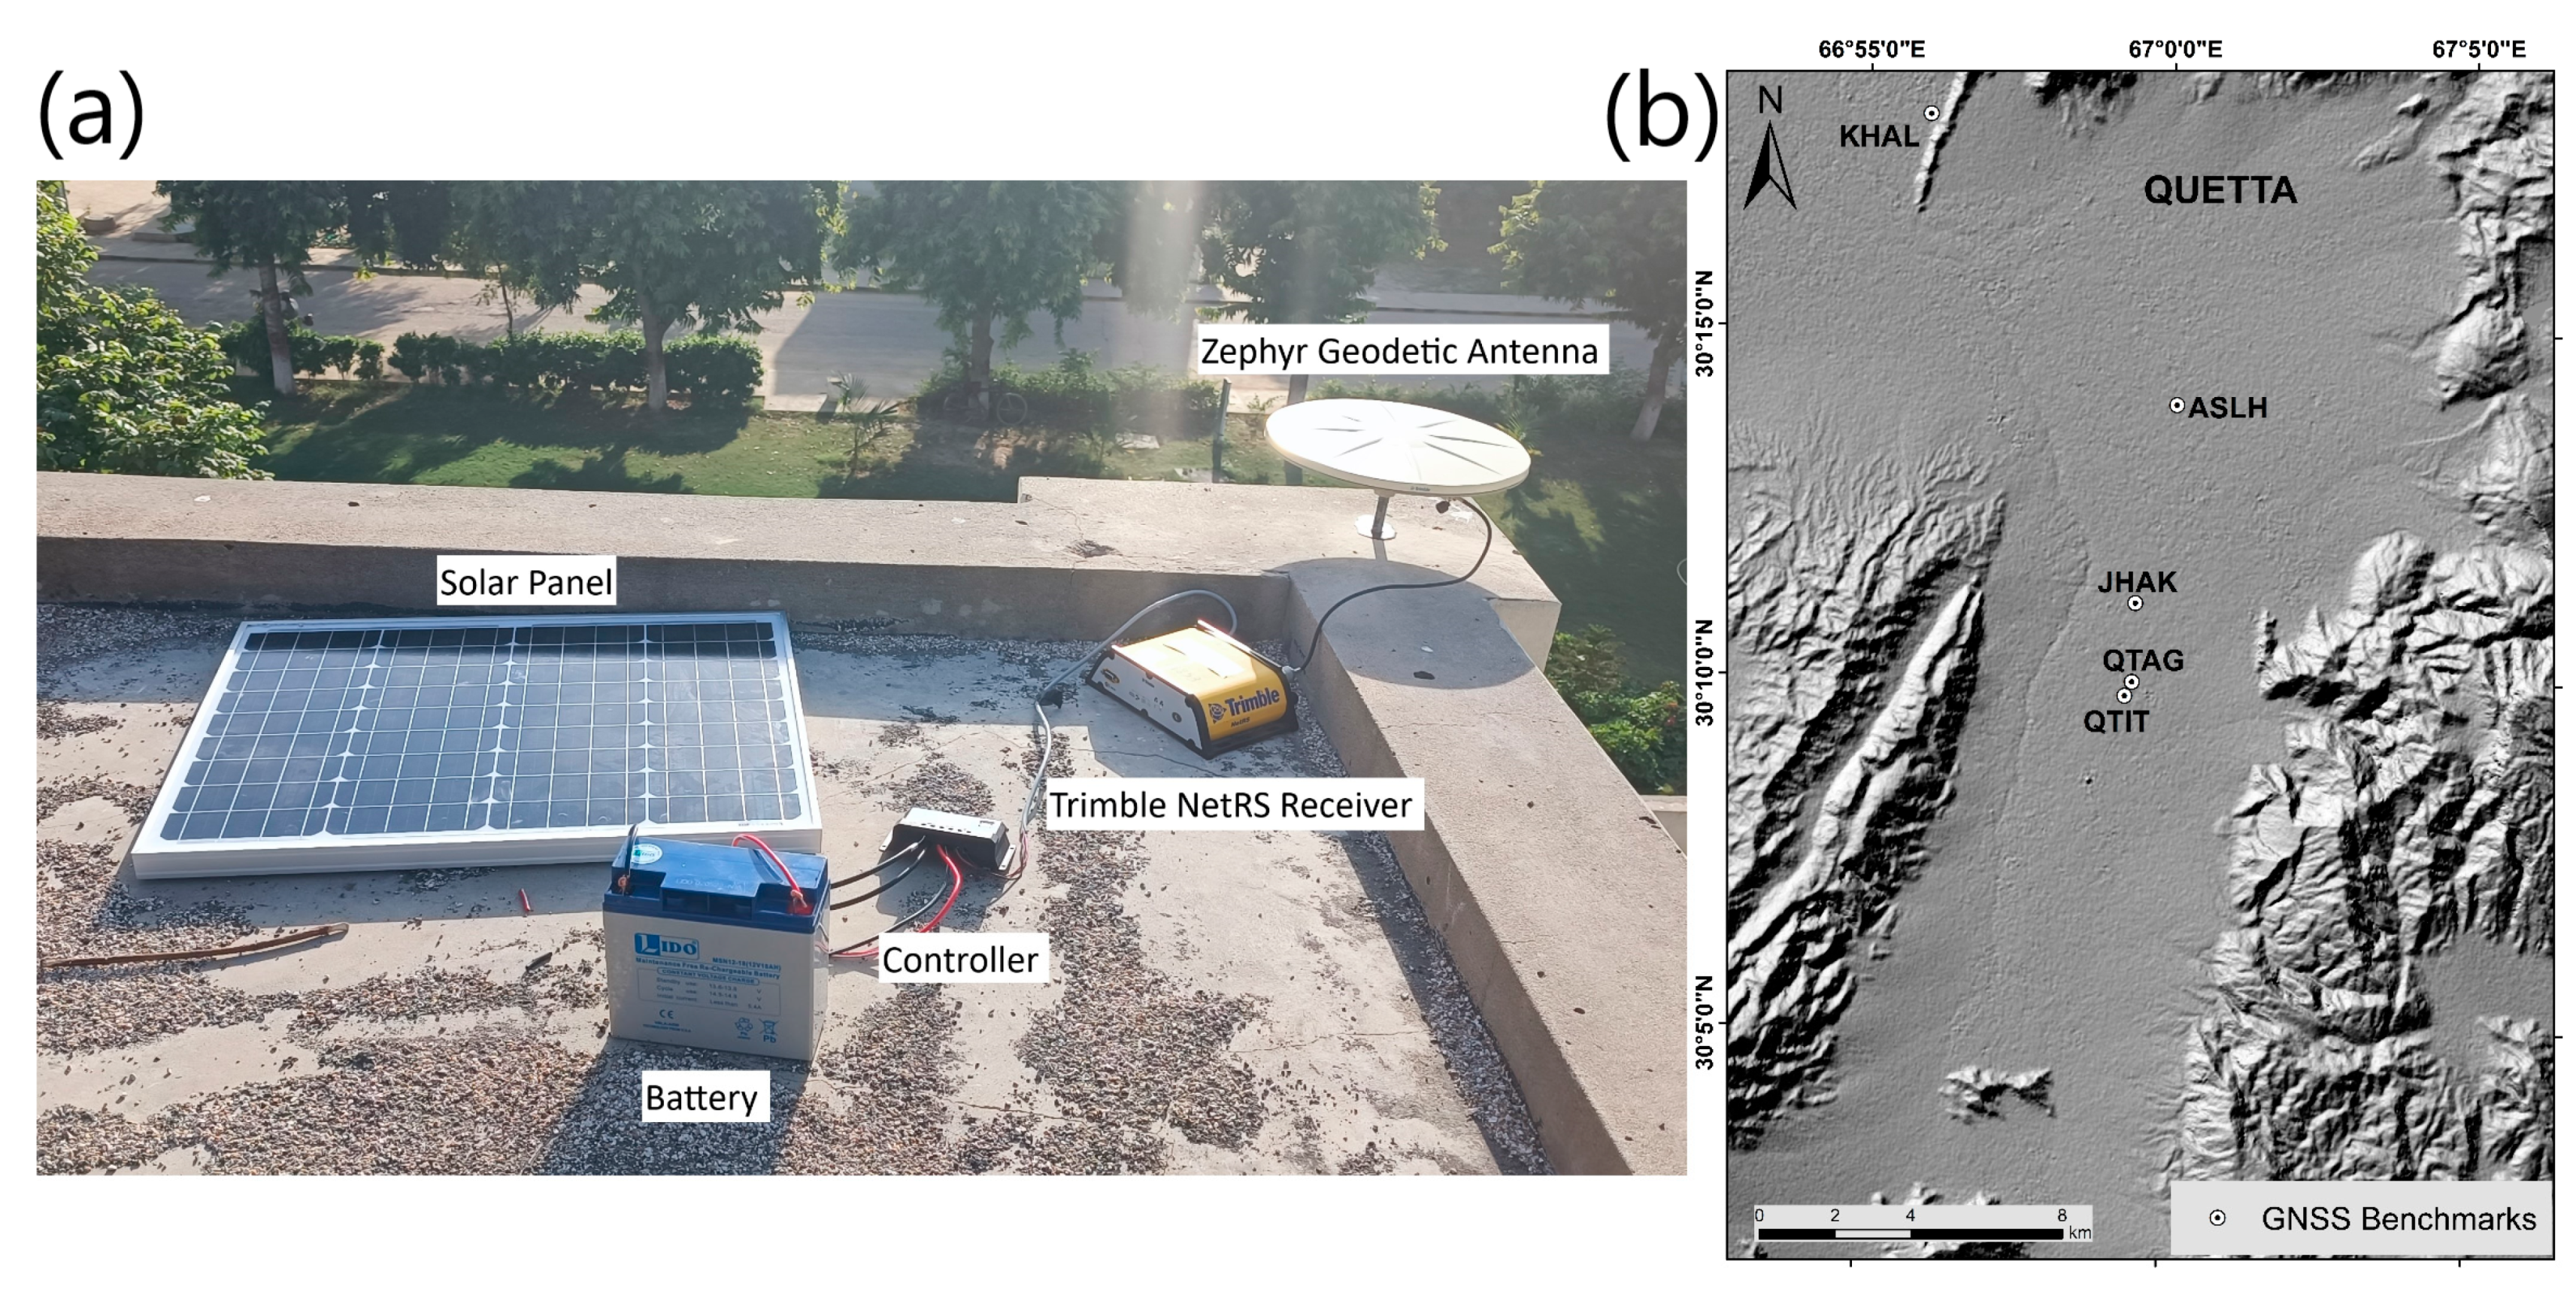
The GNSS deformation analysis was carried out by Trimble NetRS and R7 receivers coupled with a Zephyr Geodetic antenna, which was fixed on the roof of a concrete building using a bolt, as shown in Figure 4a. A total of five GNSS stations were used in Quetta, out of which, four are campaign spots where the unit is installed for one week and then retrieved. The fifth GNSS benchmark is a permanent station that continuously downloads the coordinate data in the x, y, and z axes every 30 s. Their naming convention is as follows. The permanent station was codenamed QTIT (2008–2023) with a two-year data break during the period 2019–2020. It was installed on the roof of the Computer Science Department at the University of Balochistan, Pakistan. Four campaign sites are QTAG (2006–2023), JHAK (2011–2023), ASLH (2007–2022), and KHAL (2009–2023). Figure 4b shows the location of the GNSS network.
The GNSS data were processed using GipsyX software version 1.4 developed by Jet Propulsion Laboratory (JPL) and maintained by the Near-Earth Tracking Applications and Systems groups. A technique called precise point positioning (PPP) was used to process the GPS phase and pseudo-range measurement in Receiver Independent Exchange (RINEX) format [58]. The data were firstly pre-processed to correct for potential errors such as orbital inaccuracies, satellite clock errors, and precise satellite orbits. Then, the Kalman filter was applied to obtain the estimated deformation time series velocity [59].

3.3. Groundwater Level

The groundwater level (GWL) in Quetta City has been declining at an alarming rate since the 1980s [40,41,42,60,61]. Oldham reported the first artesian well in Quetta Valley in 1892. Its yield was 75,000 litres of water per hour after the impermeable layer was drilled through by the first steam engine [7]. Most of the water needs were fulfilled by the ancient Karez water supply system until the 1970s [62]. By the 1980s, the GWL was approximately −30 m [8], but by 2022, it had plummeted to as low as −170 m in certain areas. The rapid groundwater decline is attributed to the unauthorized tube wells operating in the valley. According to estimates, there are about 20 tubewells in every km2 of the city with an illegal-to-legal well ratio of 20:1 [38].
The Water and Power Development Authority (WAPDA) installed 177 monitoring wells in the Quetta region during the 1980s, having depths ranging from 35 m to 150 m; these monitoring wells were later handed over to the Balochistan Irrigation Department (BID) [63]. Due to the GWL decline, 140 monitoring wells have dried over time and only 37 are operational. We collected raw GWL data from BID and analysed 37 wells. An average decline of 1.7 m/y was observed from these monitoring wells during the period 1987–2021, as seen in Figure 5. However, during the period 2011–2012, a substantial decrease has been observed in some wells which are located in the central part of the valley. Well # 64, which was operational during the period 2011–2015 has exhibited a drop of 6.1 m/y of GWL. Well # 57 exhibited a drop of 4.9 m/y during the period 2011–2016. Similarly, well # 3 exhibited a drop of 3.5 m/y during the period 2011–2018. The monitoring well which did not record a substantial decline is well # 45, whose decline rate is 0.6 m/y. This well was operational from 2010 to 2022. Similarly, well # 50, which was also operational from 2010 to 2022, has exhibited a drop of 0.5 m/y. The locations of the monitoring wells are shown in Figure 5.

3.4. InSAR Methodology

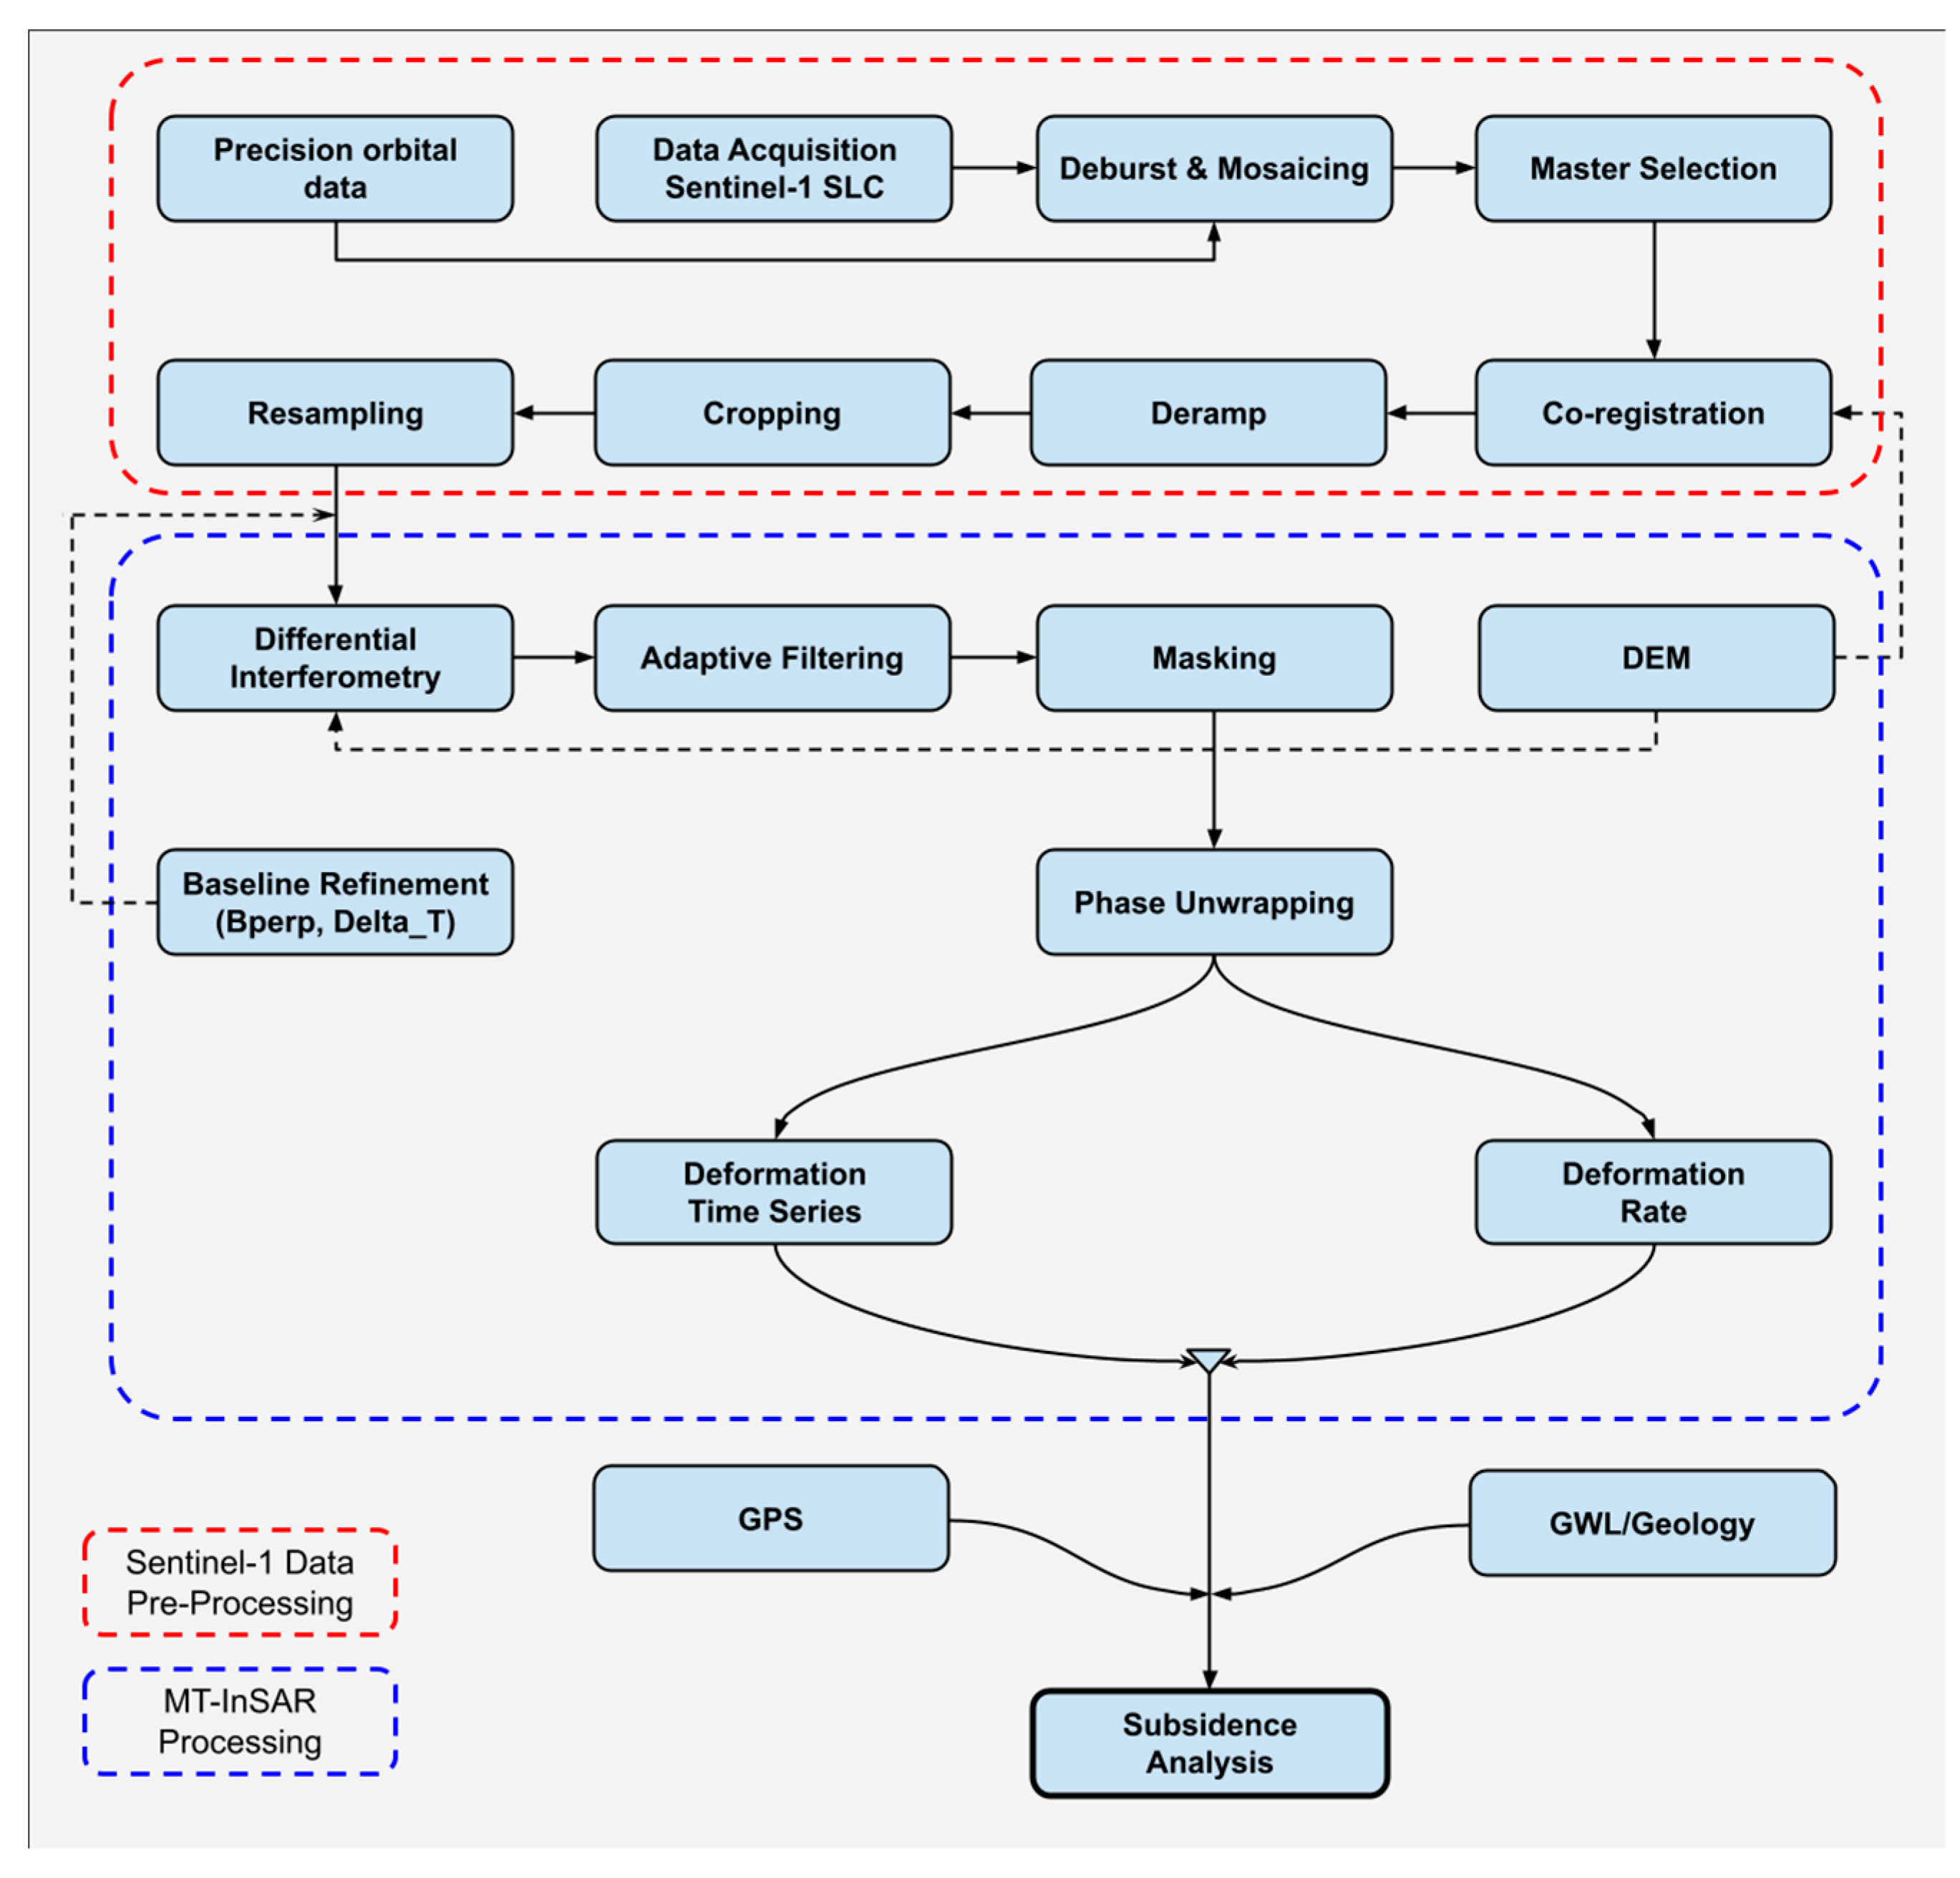
To minimize the decorrelation effects introduced in the conventional DInSAR due to topography and atmospheric artefacts, Ref. [21] developed an algorithm called SBAS-InSAR, in which the data pairs having minimum baselines are considered and then the overall deformation time series of the monitoring area is obtained by the least squares or singular value decomposition (SVD) methods. A commercial software called GAMMA Remote Sensing version 1.4 was used to process the InSAR data, employing the SBAS technique. GAMMA software is famous for extremely accurate co-registration, which minimizes the phase bumps in interferometry [57]. The processing flow diagram is shown in Figure 6.
The study area is located between the Ascending flight direction IW2–IW3 and the Descending flight direction IW1–IW2 (Figure 1). The reference images for the Ascending track (29 December 2019) and Descending track (25 December 2019) were selected. All images were pre-processed using precise orbital determination (POD) data for orbital refinement. A total of 537 and 480 differential interferogram pairs in the Ascending and Descending tracks were generated after the maximum temporal and spatial baseline parameters were set. Then, the highest coherence point was selected after averaging all the stacked interferograms. Subsequently, the adaptive spectral filter was applied to reduce the phase noises. Later, the filtered image pairs were unwrapped using the minimum cost flow algorithm. Then, the unwrapped images were masked considering the coherence and intensity. The coherence threshold of 0.6 was set for the validity mask. Then, the masked images were once again unwrapped. Later, the deformation time series and annual deformation rate were calculated from the stack of the unwrapped interferograms.
The InSAR technique measures ground deformation along the radar line-of-sight (LOS) direction, which is the oblique path between the satellite and the ground target. The InSAR values were projected from the LOS to the vertical direction. To convert the LOS displacement into vertical deformation, the angle between the satellite LOS and the incidence angle is considered while assuming negligible deformation in the horizontal east–west and north–south direction. This conversion is performed using trigonometric principles explained in the following equation [64].
d v e r t i c a l = l o s cos θ
where d v e r t i c a l is the vertical deformation; l o s is the displacements in the LOS direction; and θ is the incidence angle. The conversion is essential because the GNSS deformation is also calculated in the vertical direction. Finally, all the images were converted to geographic geometry from SAR geometry using SRTM DEM.

4. Results

4.1. InSAR Ascending vs. Descending Deformation

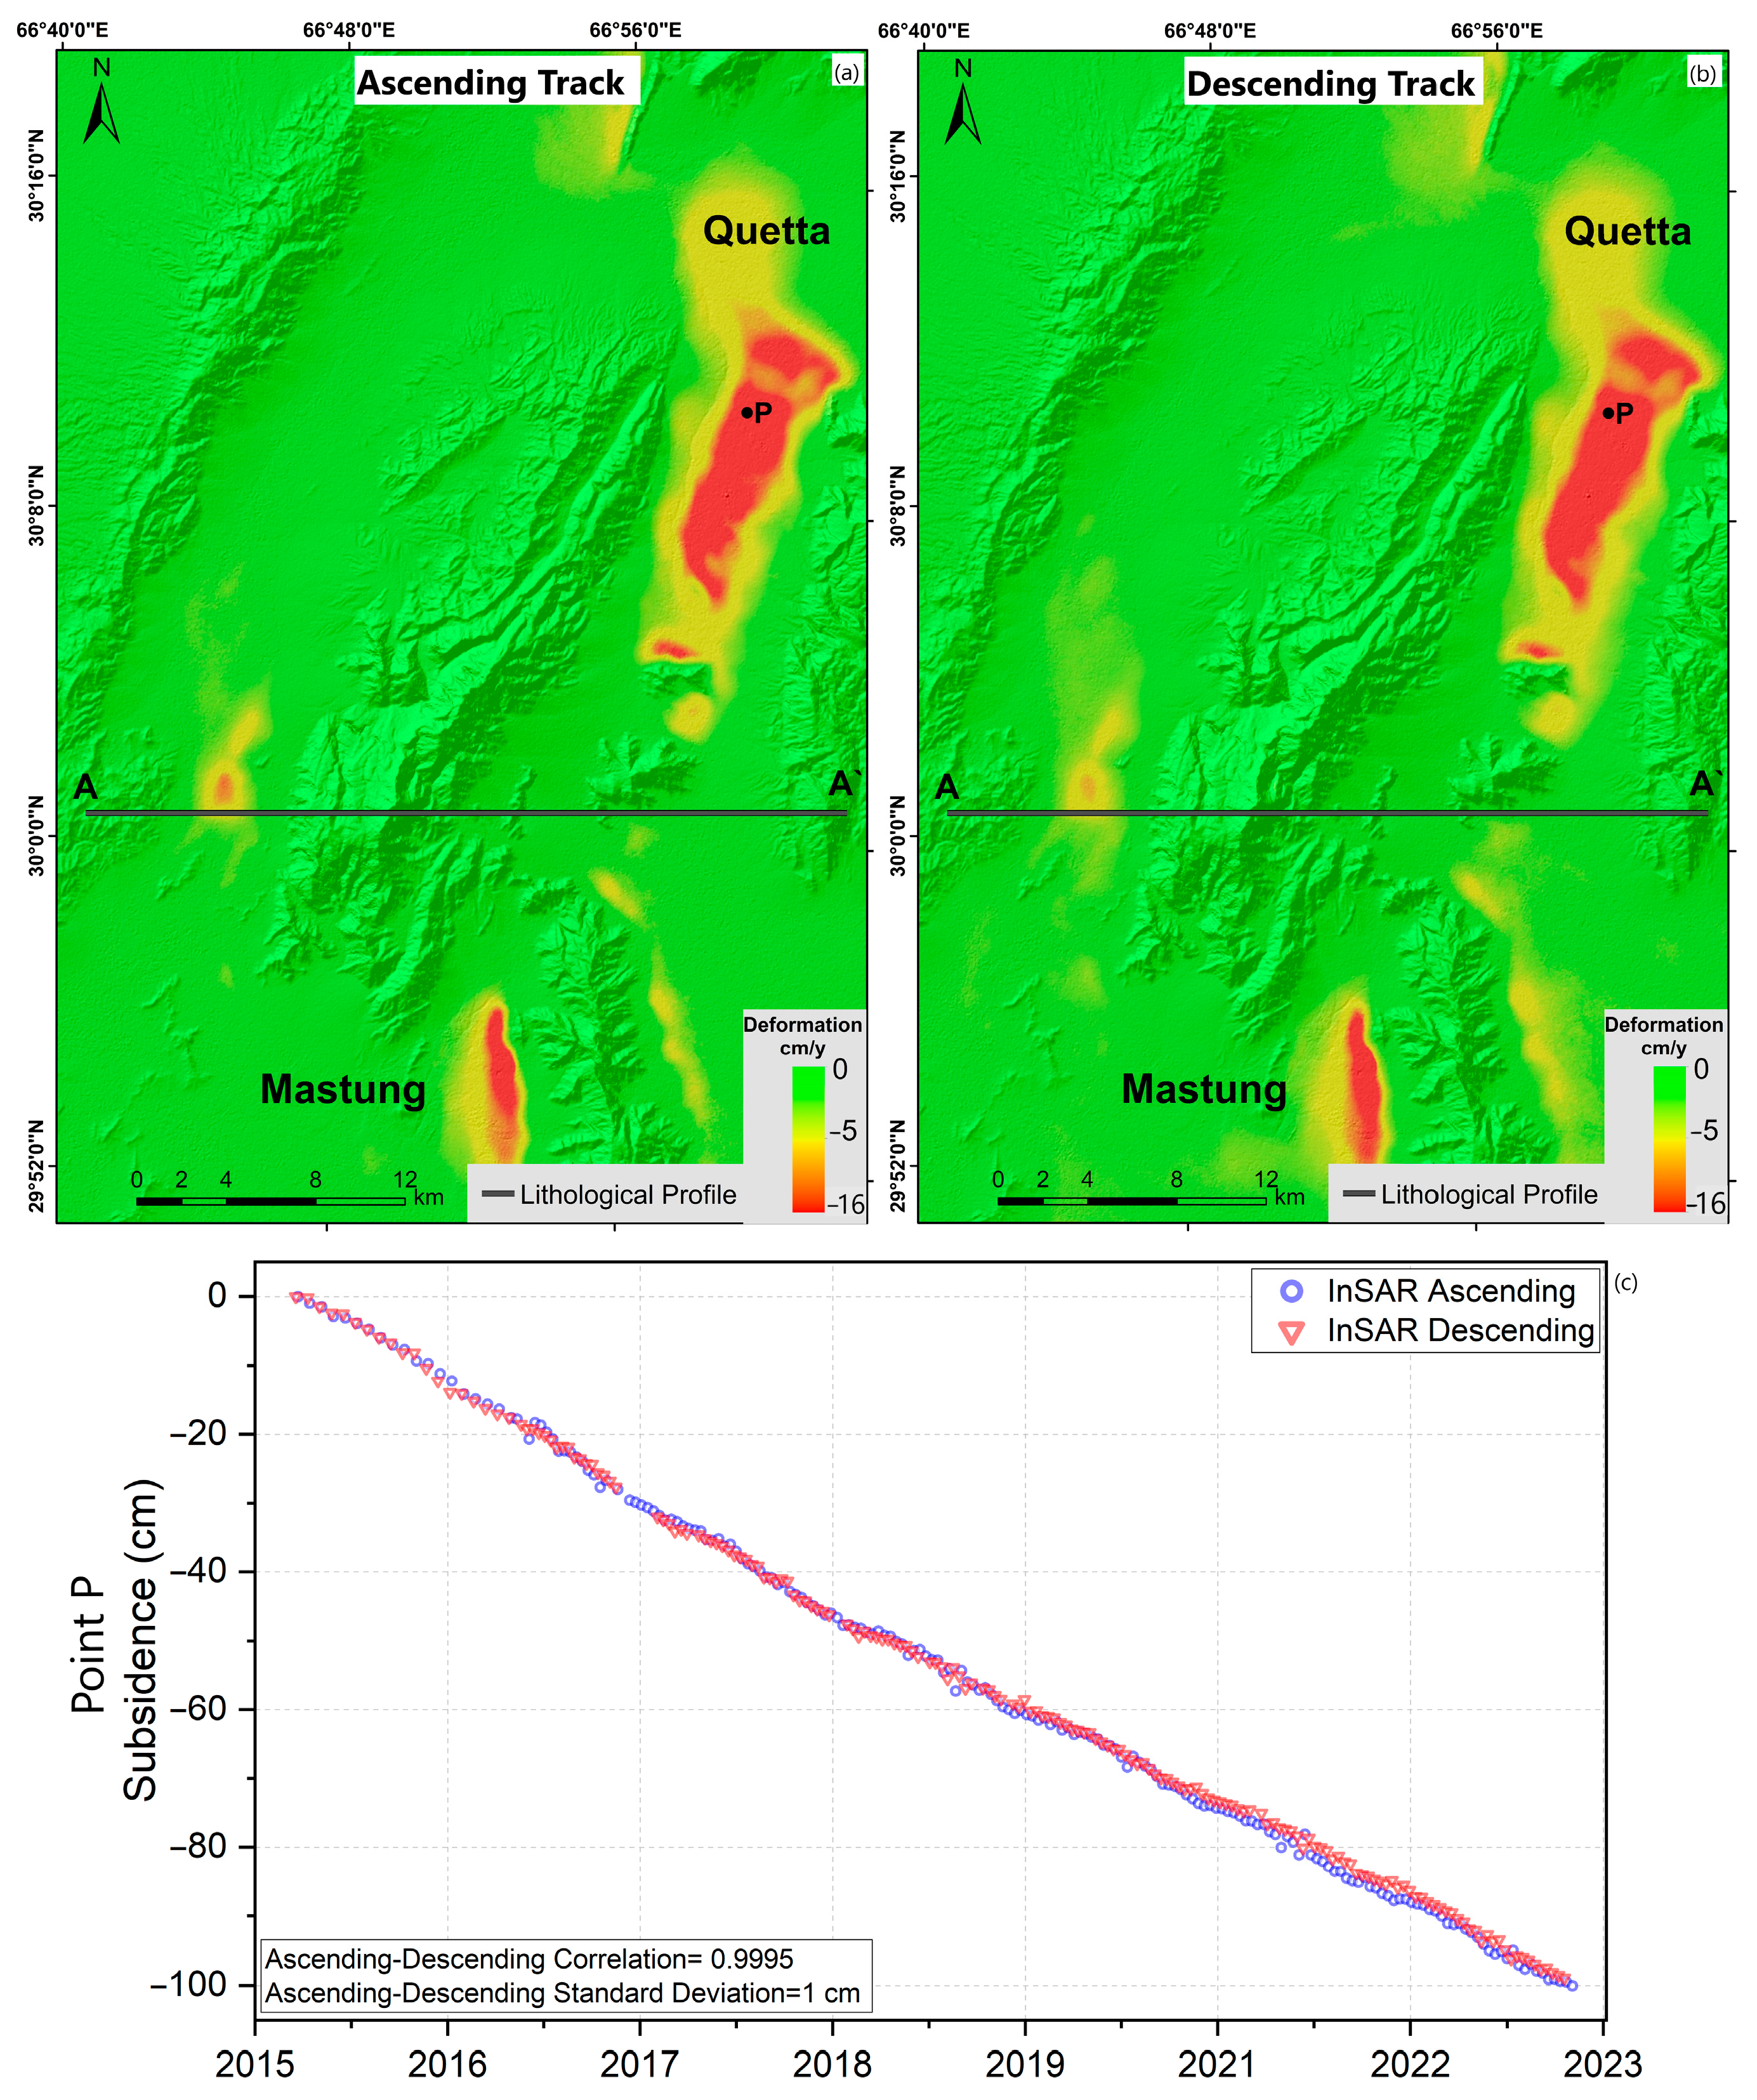
Since the research area has no permanent natural vegetation and the climate is arid, we expect minimum decorrelation in the InSAR results. Figure 7a,b show the average deformation velocity of the Ascending (Left) and Descending track (Right) acquired by the SBAS-InSAR technique. The velocity rate is overlaid on the SRTM shaded relief map, which is geocoded in WGS 84. The red colour represents subsidence while the green colour shows the stable region. The time series graph in Figure 7c displays the Ascending and Descending tracks corresponding to point P in Figure 7a,b. The similar pattern in both images (a) and (b) demonstrates that there is negligible deformation in the E-W direction as compared to the vertical direction. This assumption is confirmed by Figure 7c, which shows the time series of both orbits having similar deformation patterns on point P. The cross-correlation between the two orbits is 0.9995, while the standard deviation is approximately 1 cm.

4.2. Land Subsidence Distribution and Time Series

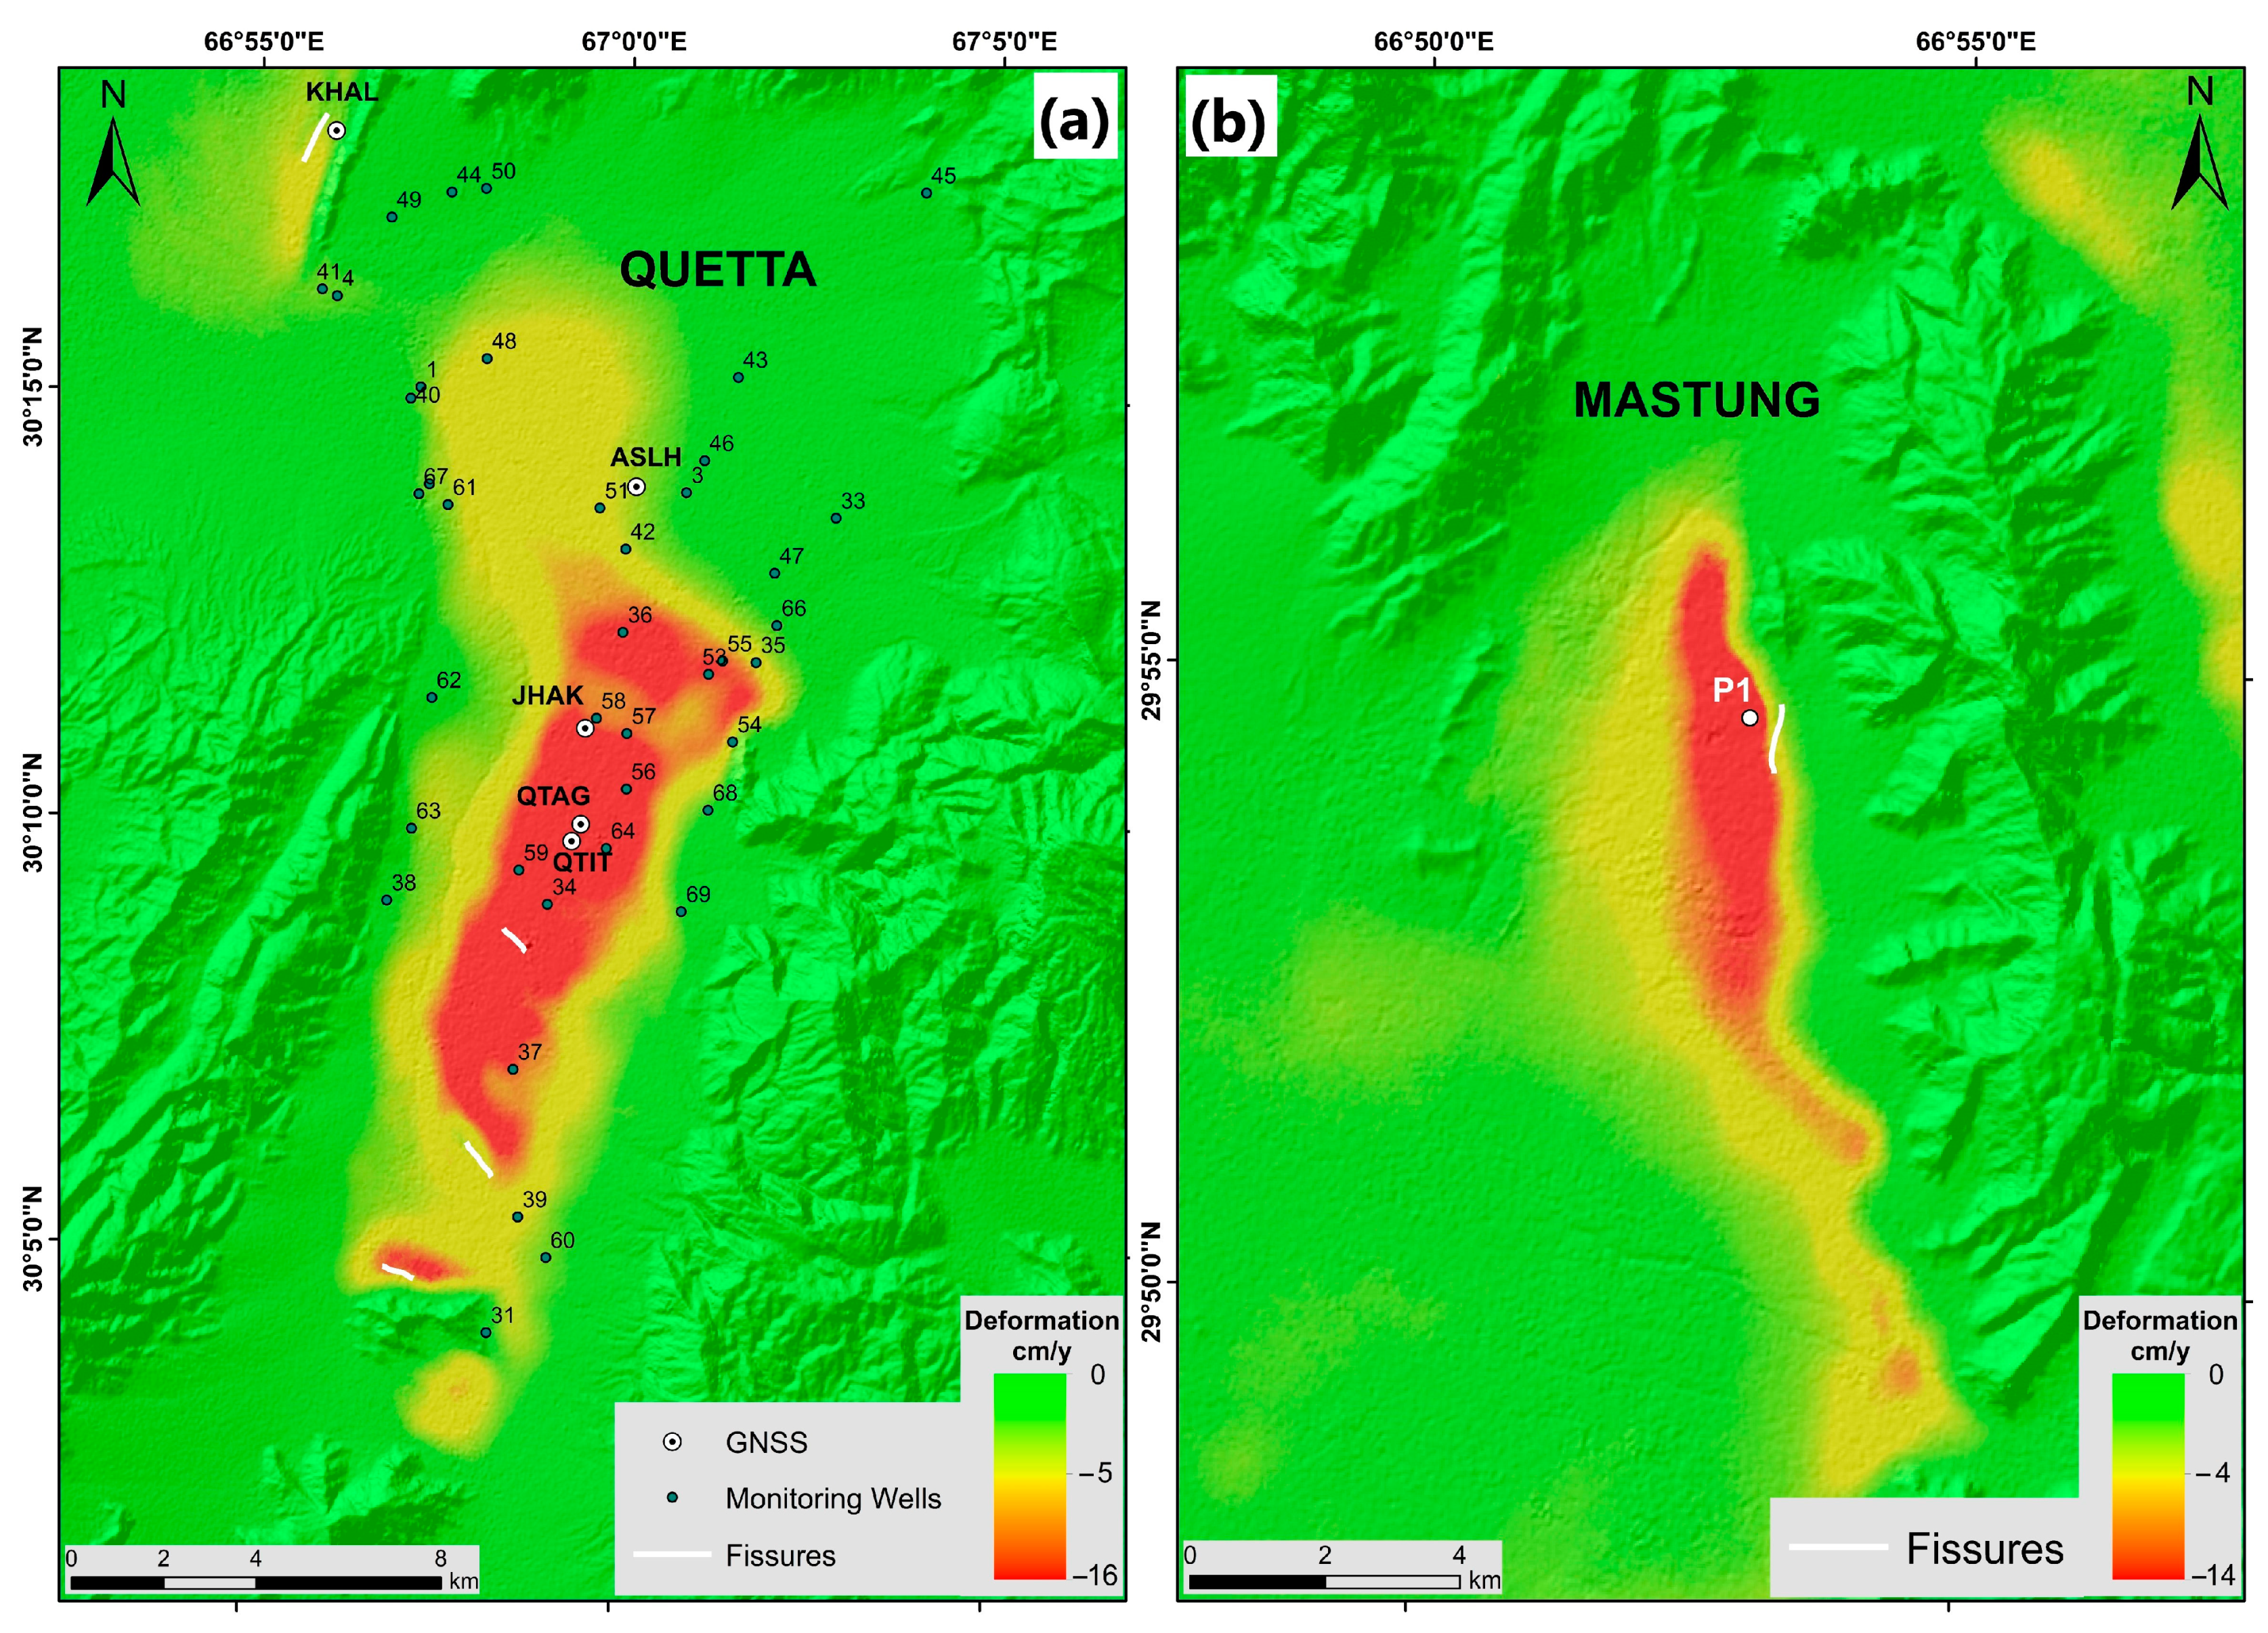
Due to the negligible difference between the Ascending and Descending orbits, as demonstrated previously in Figure 7, we therefore used the deformation rate from the Ascending track due to its higher acquisitions. Figure 8 shows the average deformation rate of Quetta (a) and Mastung (b) from December 2015 to December 2022. The central part of Quetta Valley in Figure 8a shows the maximum subsidence of −16 cm/y, which is shown by the deep red colour. The yellow region shows the subsidence rate of about −5 cm/y, while the green areas show no vertical deformation. Figure 8b from the Mastung region shows the maximum subsidence rate of −14 cm/y, as shown by the red colour, while the yellow colour region shows an average deformation rate of −4 cm/y. Around 96 km2 of land has been subsiding by around −14 to −16 cm/y in both the Mastung (17.4 km2) and Quetta region (76.2 km2).
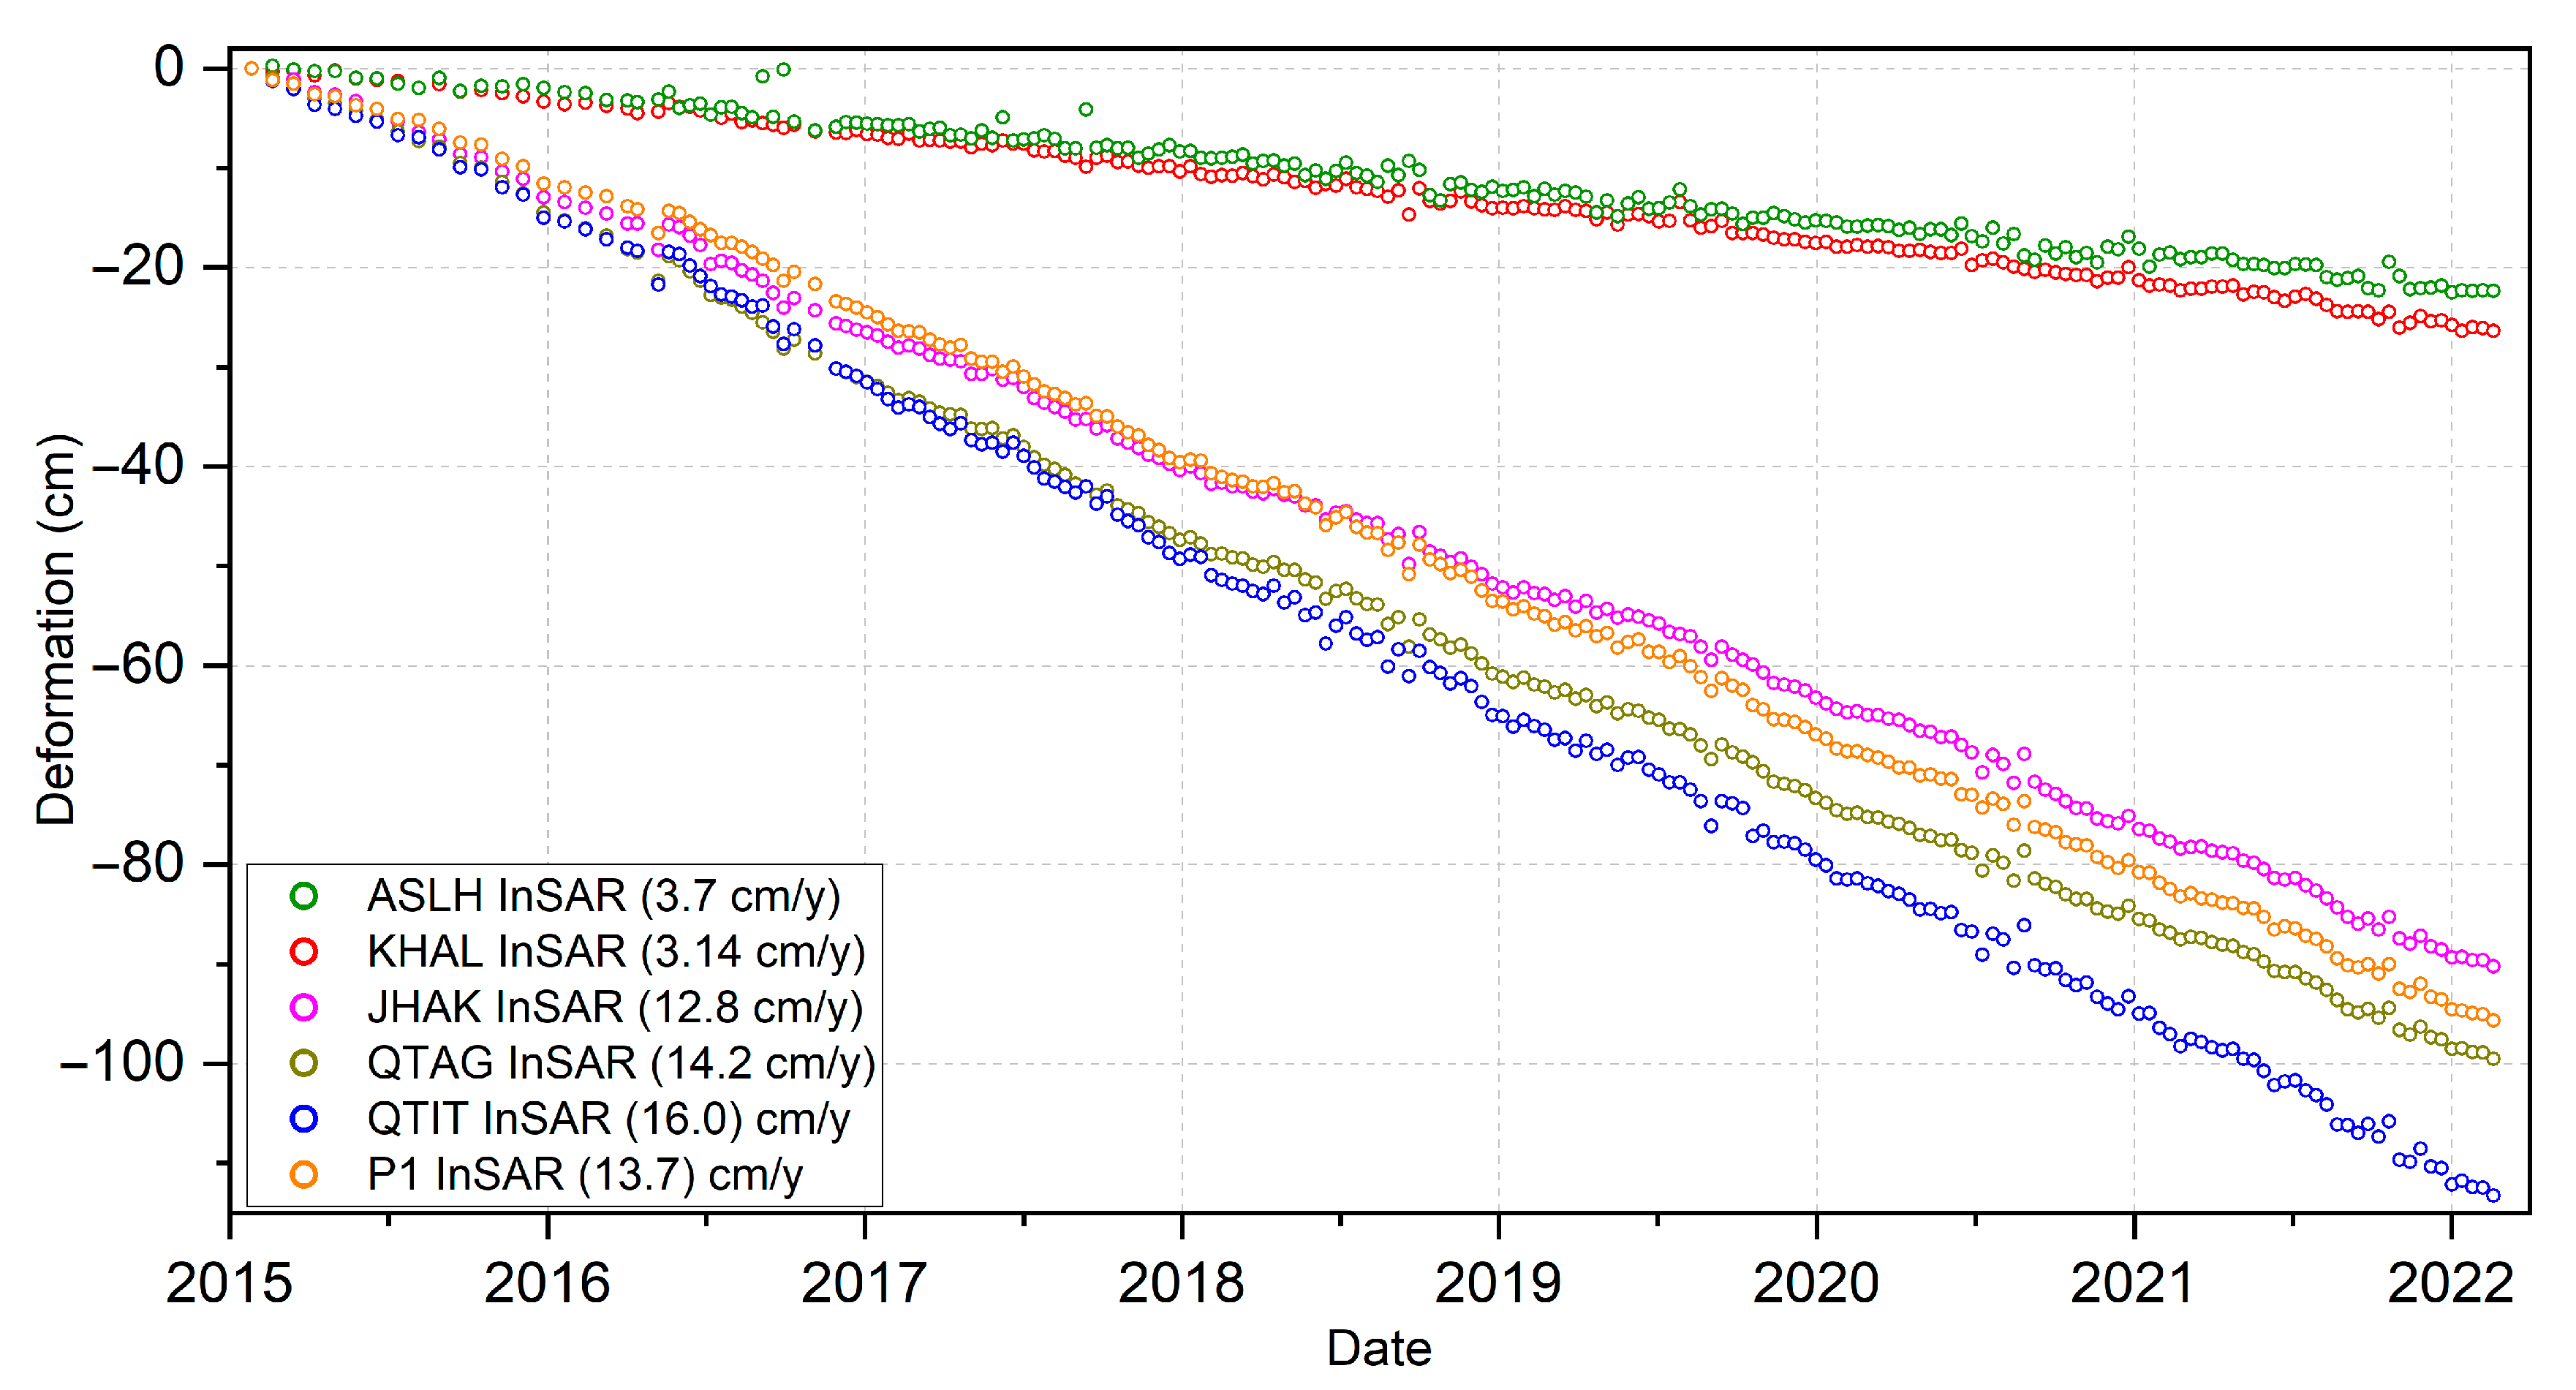
Figure 9 shows the time series plots of the discrete InSAR points, which are located close to the GNSS benchmarks (within a 100 m radius). The discrete InSAR points are named similarly to the GNSS codenames with the addition of the word InSAR to indicate their proximity to the GNSS benchmarks. The QTIT-InSAR recorded −16 cm/y of subsidence. The accumulative deformation from December 2015 to December 2022 recorded on this site is −113 cm over 7 years. The QTAG-InSAR experienced −14.2 cm/y of vertical deformation. The total subsidence from December 2015 to December 2022 recorded over 7 years is −99 cm. The JHAK-InSAR point has a subsidence rate of −12.8 cm/y. The accumulative deformation from December 2015 to December 2022 recorded on this site is −90 cm over 7 years. The ASLH-InSAR and KHAL-InSAR recorded comparatively low subsidence rates of −3.7 cm/y and −3.1 cm/y. The total subsidence on ASLH-InSAR and KHAL-InSAR over 7 years is −26.3 cm and −22.3 cm.
Since the Mastung area does not have a GNSS benchmark, its deformation point is therefore named P1. The P1 registers −13.7 cm/y of subsidence. The accumulative deformation from December 2015 to December 2022 recorded on this site is −96 cm over 7 years, as shown in Figure 9.
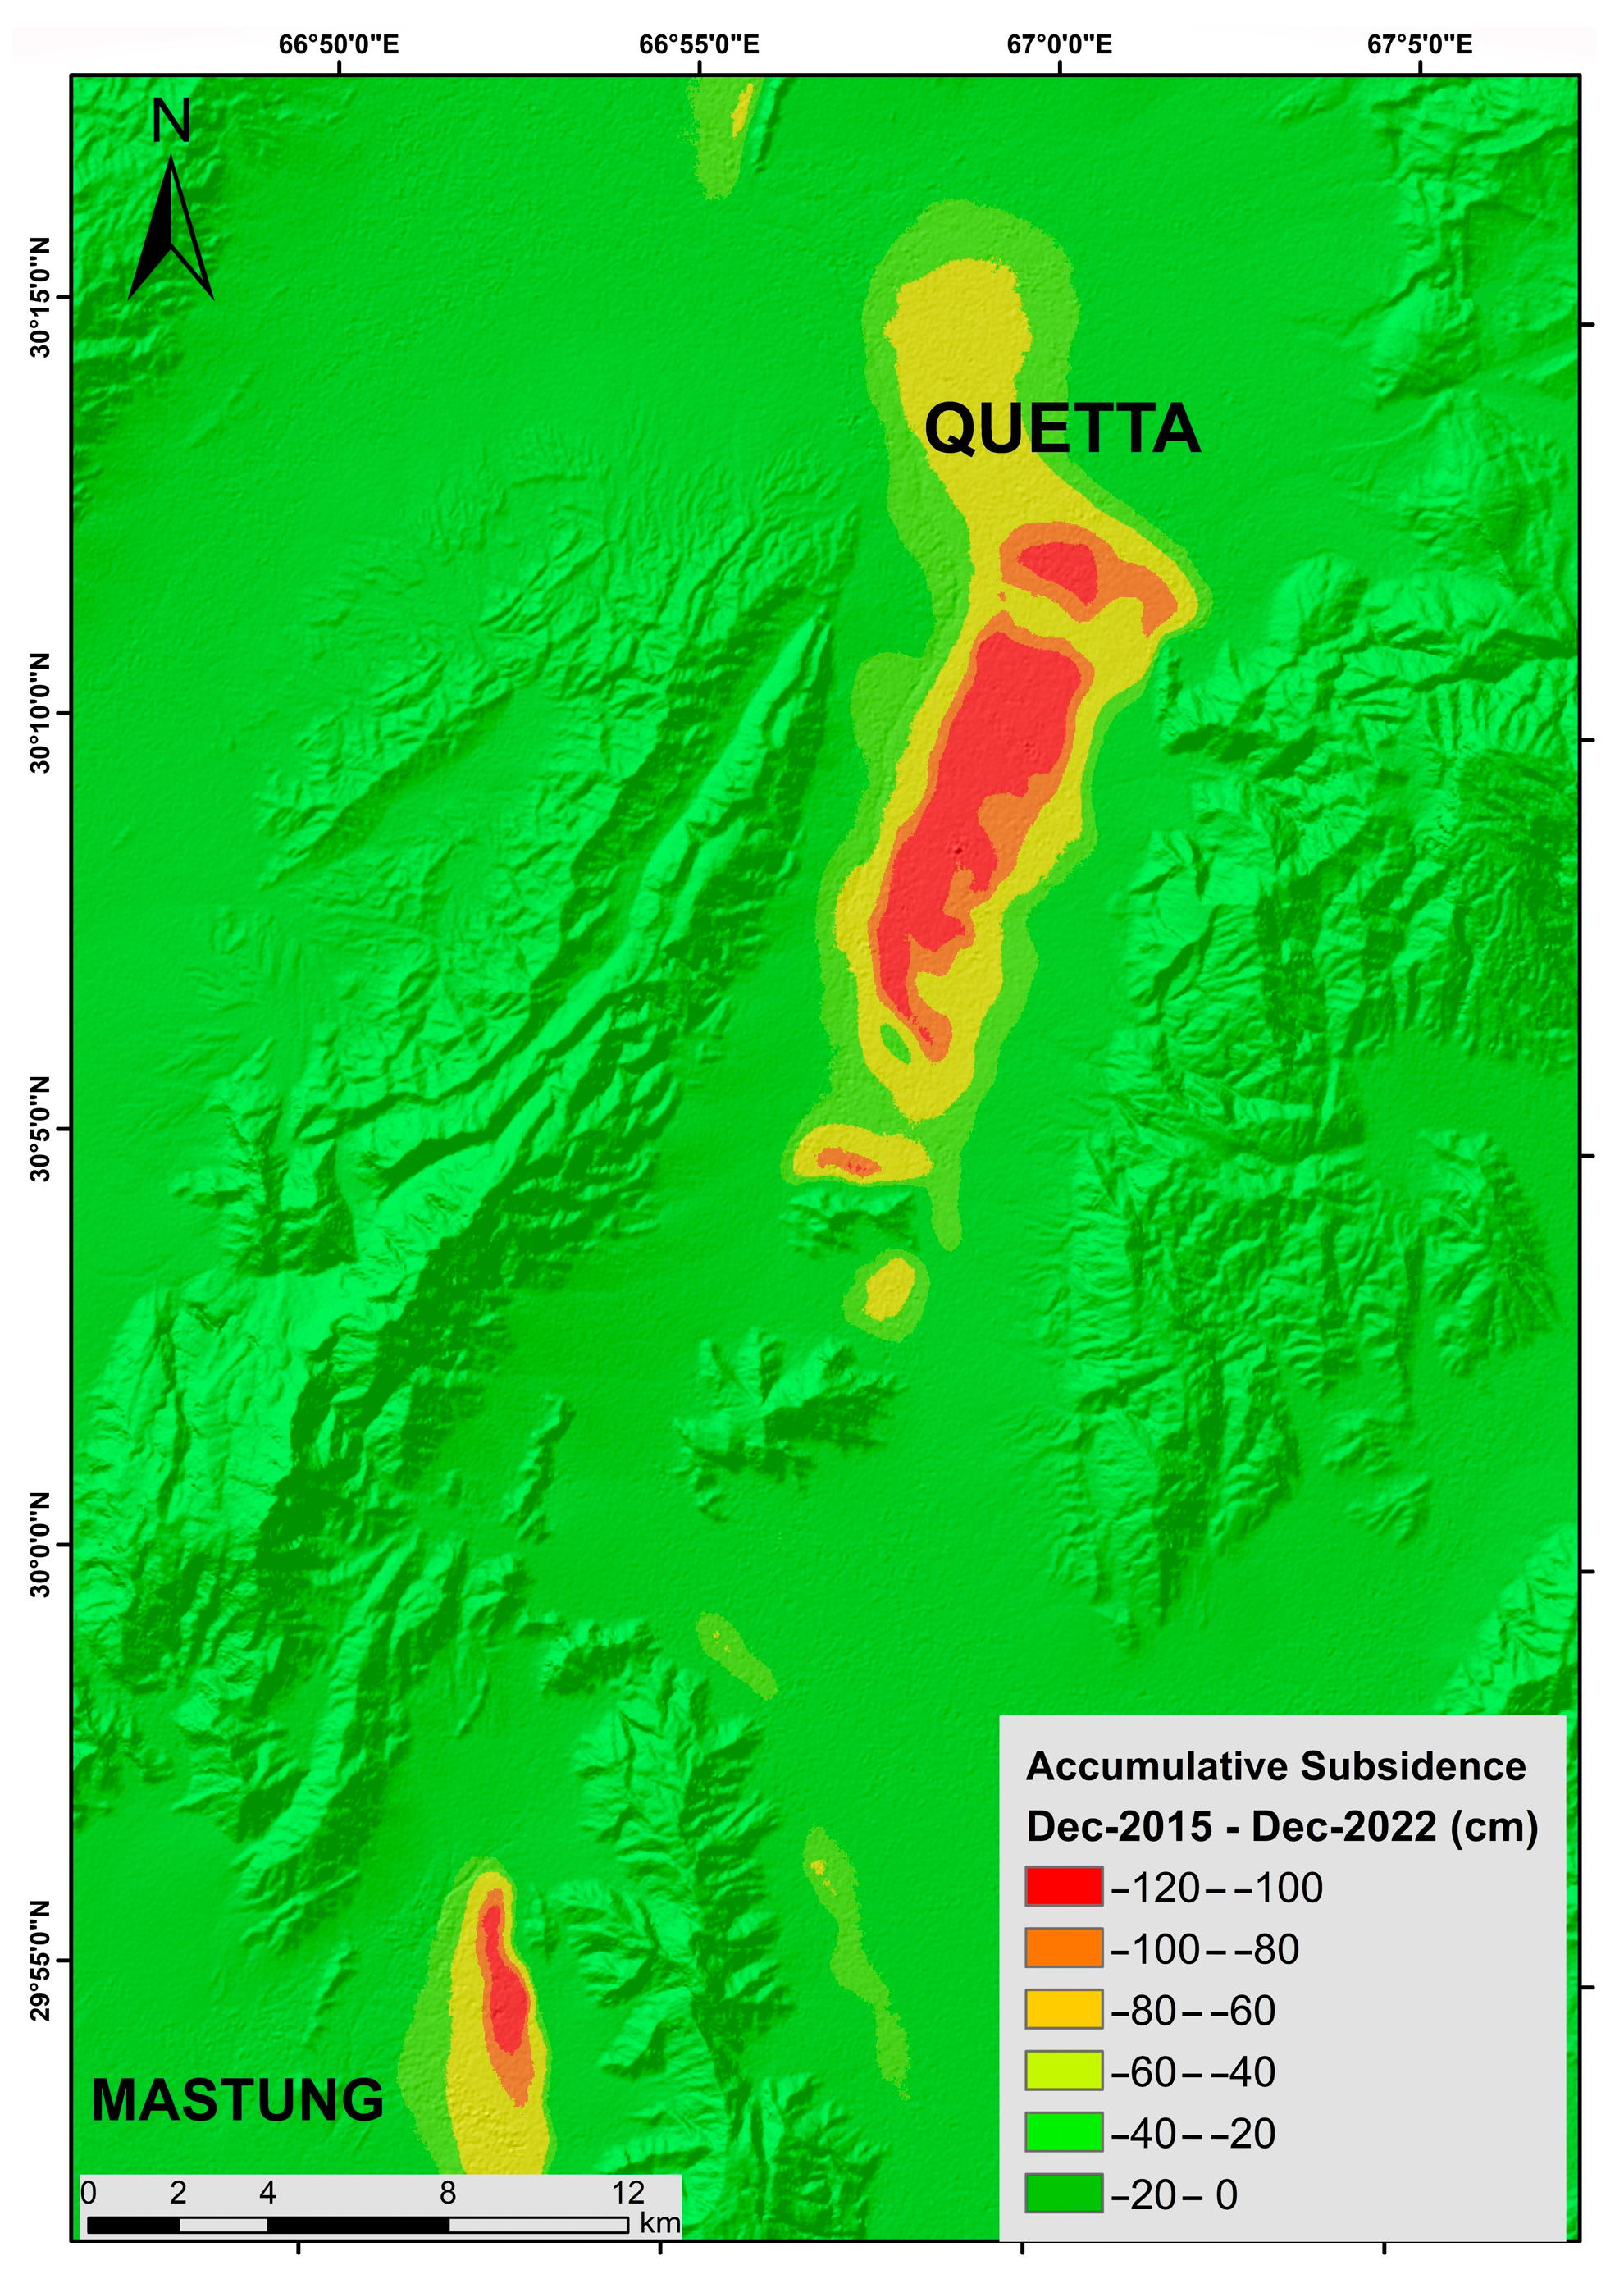
The accumulative subsidence areas calculated by SBAS-InSAR in Quetta and Mastung from 26 December 2015 to 25 December 2022 are shown in Figure 10. The central parts of Quetta and Mastung have experienced maximum subsidence (−120 to −100 cm), shown by the deep red colour. This is the region where the thickness of the alluvium deposits is at its maximum. In contrast, the peripheries, which are close to the mountain ranges, are relatively stable (−60 to −40 cm), depicted by the light green colour. This is attributed to the proximity of the bedrock beneath the unconsolidated material, as shown by the light yellow colour. Further explanation regarding the geological aspects is presented in Section 5.2.

4.3. GNSS Results

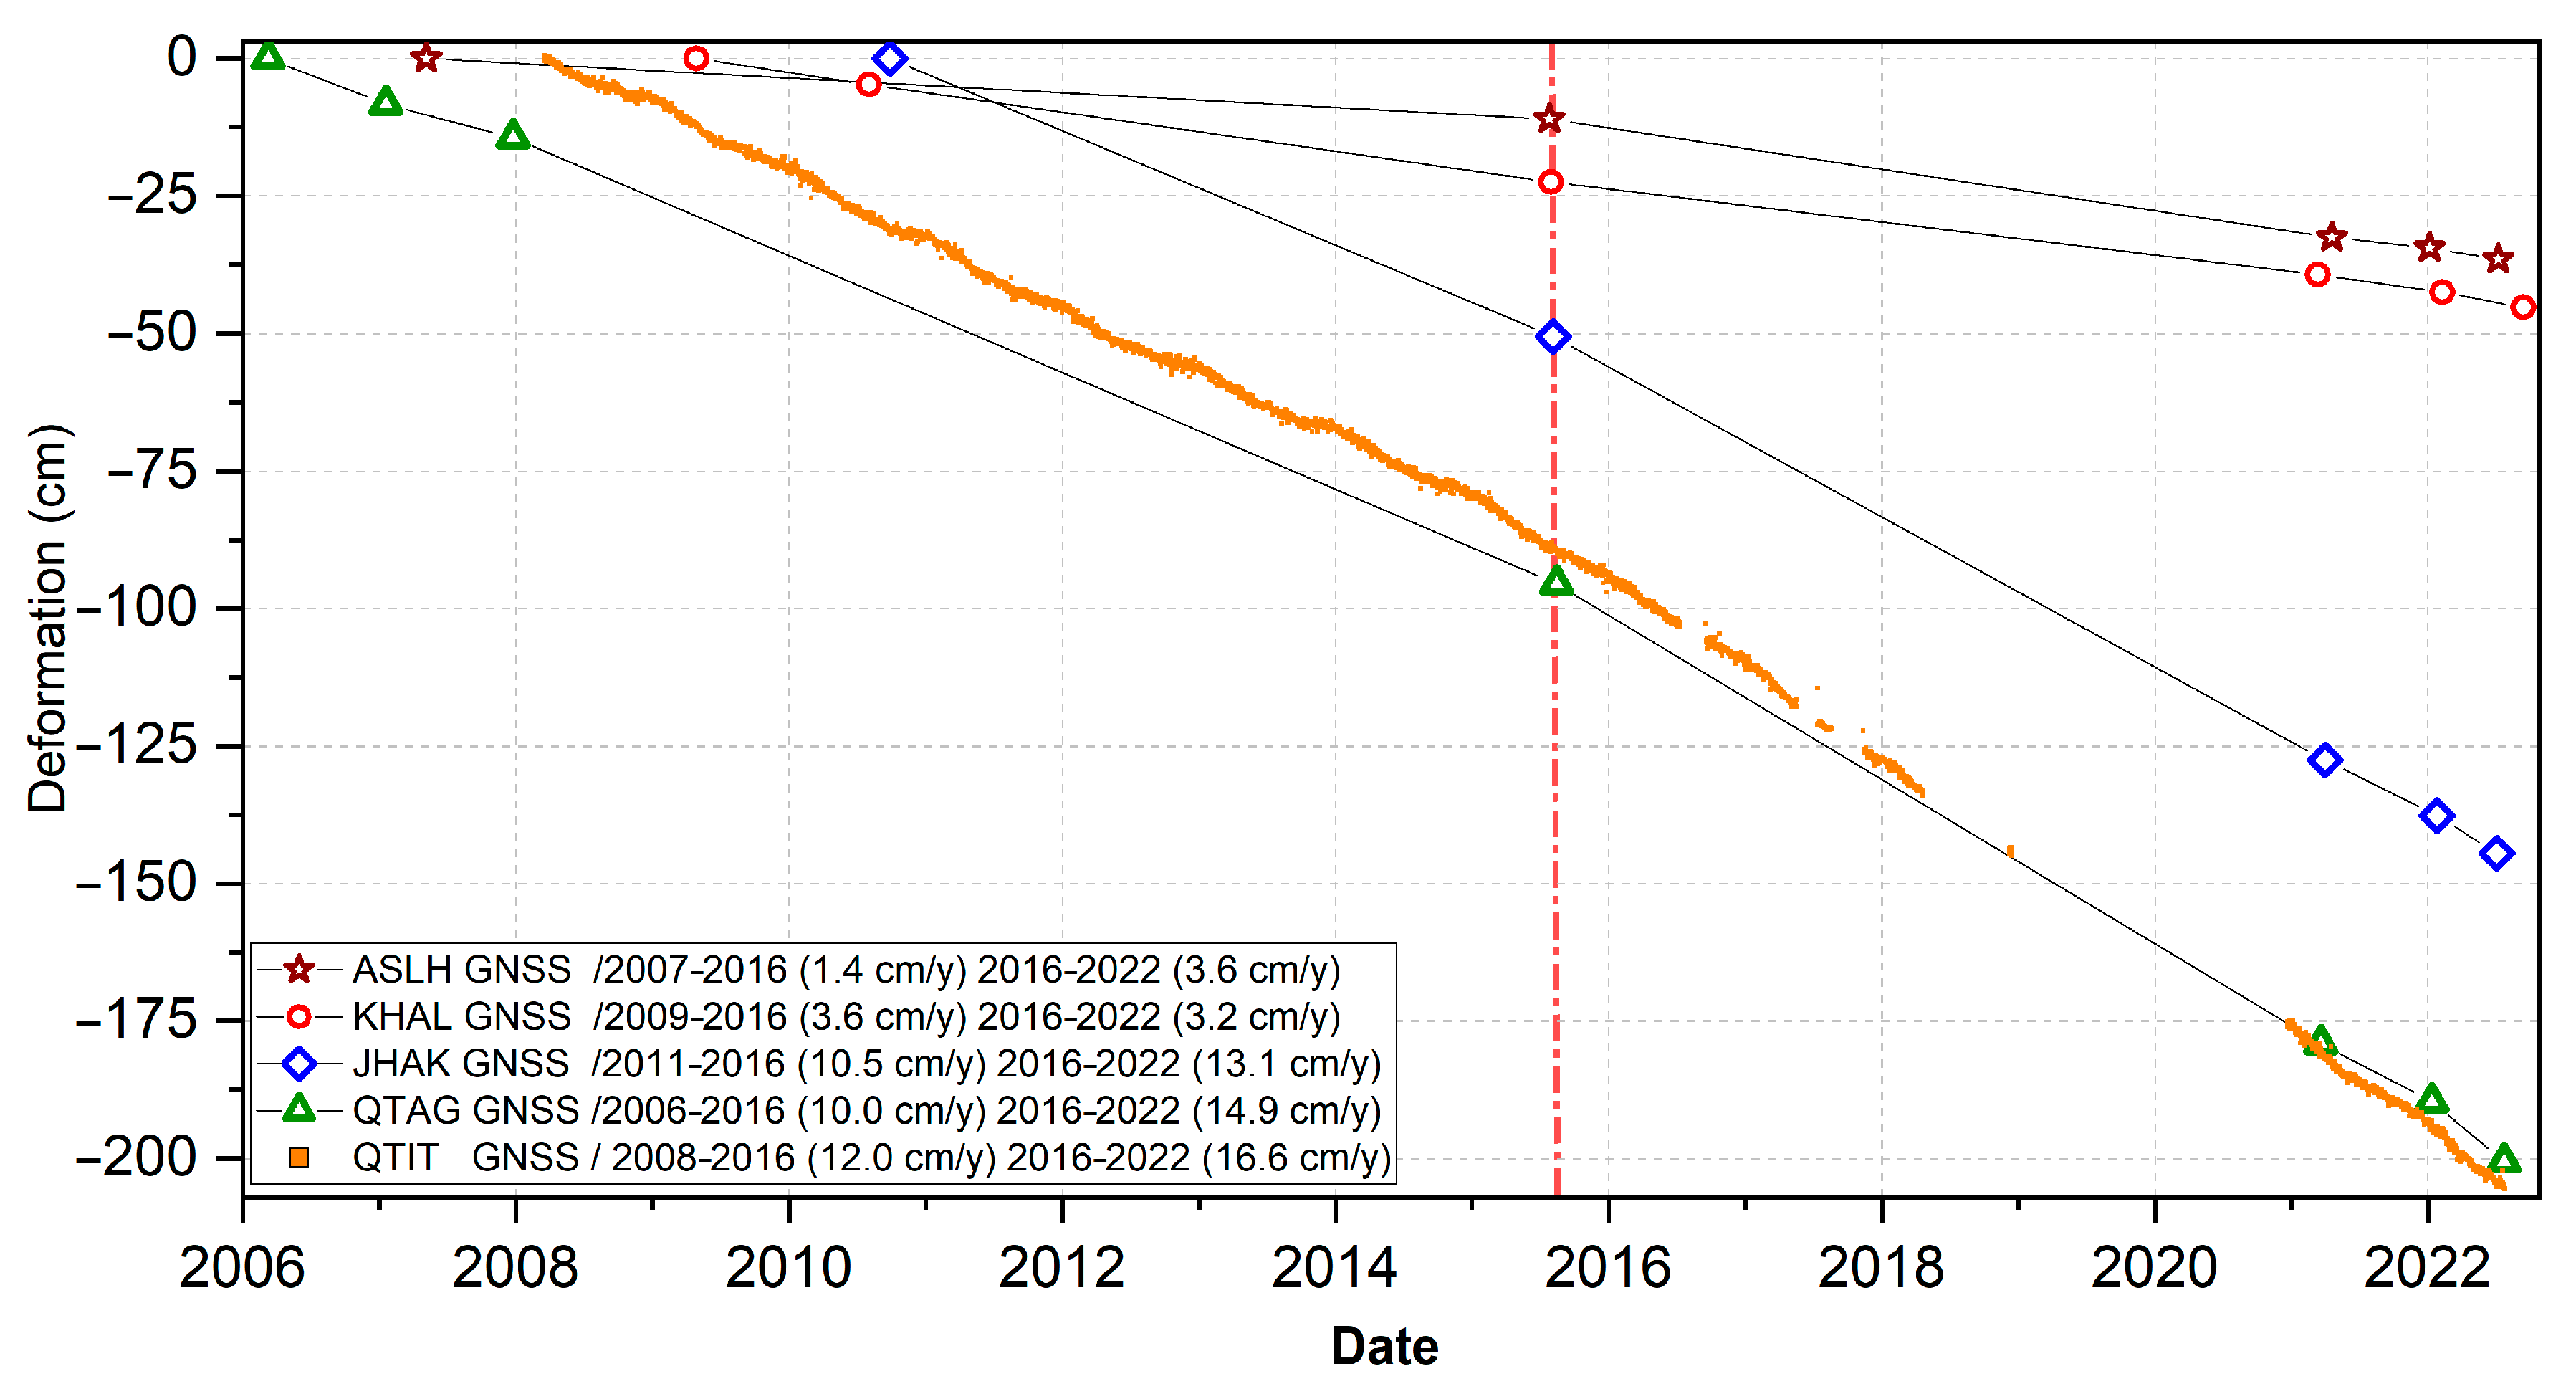
As stated earlier, we used five GNSS benchmarks, out of which, four are campaign sites (ASLH, KHAL, JHAK, and QTAG), while the remaining one is a permanent station (QTIT). The location of the GNSS benchmarks is shown in Figure 8a. We observed an acceleration in subsidence after 2016 on all the GNSS sites, shown by the vertical dashed red line, which is probably due to an increase in GWL drawdown. As seen in Figure 11, the highest subsidence is recorded by QTIT; its subsidence during the period 2008–2016 was −12 cm/y, which increased to −16.6 cm/y during the period 2016–2022. The accumulative subsidence recorded by QTIT from 2008 to 2022 was −205 cm. QTAG’s subsidence was −10 cm/y during the period 2006–2016, which increased to −14.9 cm/y during the period 2006–2022. The total subsidence during the period 2006–2022 was −200 cm. JHAK recorded −10.5 cm/y of subsidence during the period 2011–2016, which increased to −13.1 cm/y during the period 2016–2022. The total deformation recorded by the JHAK GNSS is −144 cm. KHAL and ASLH are comparatively stable regions. KHAL recorded −3.6 cm/y of subsidence during the period 2009–2016 and −3.2 cm/y during the period 2016–2022, while ASLH recorded −1.4 cm/y during the period 2007–2016 and −3.6 cm/y during the period 2016–2022. The total deformation of KHAL and ASLH is −45.3 cm and −36.5 cm.

4.4. GNSS-InSAR Correlation

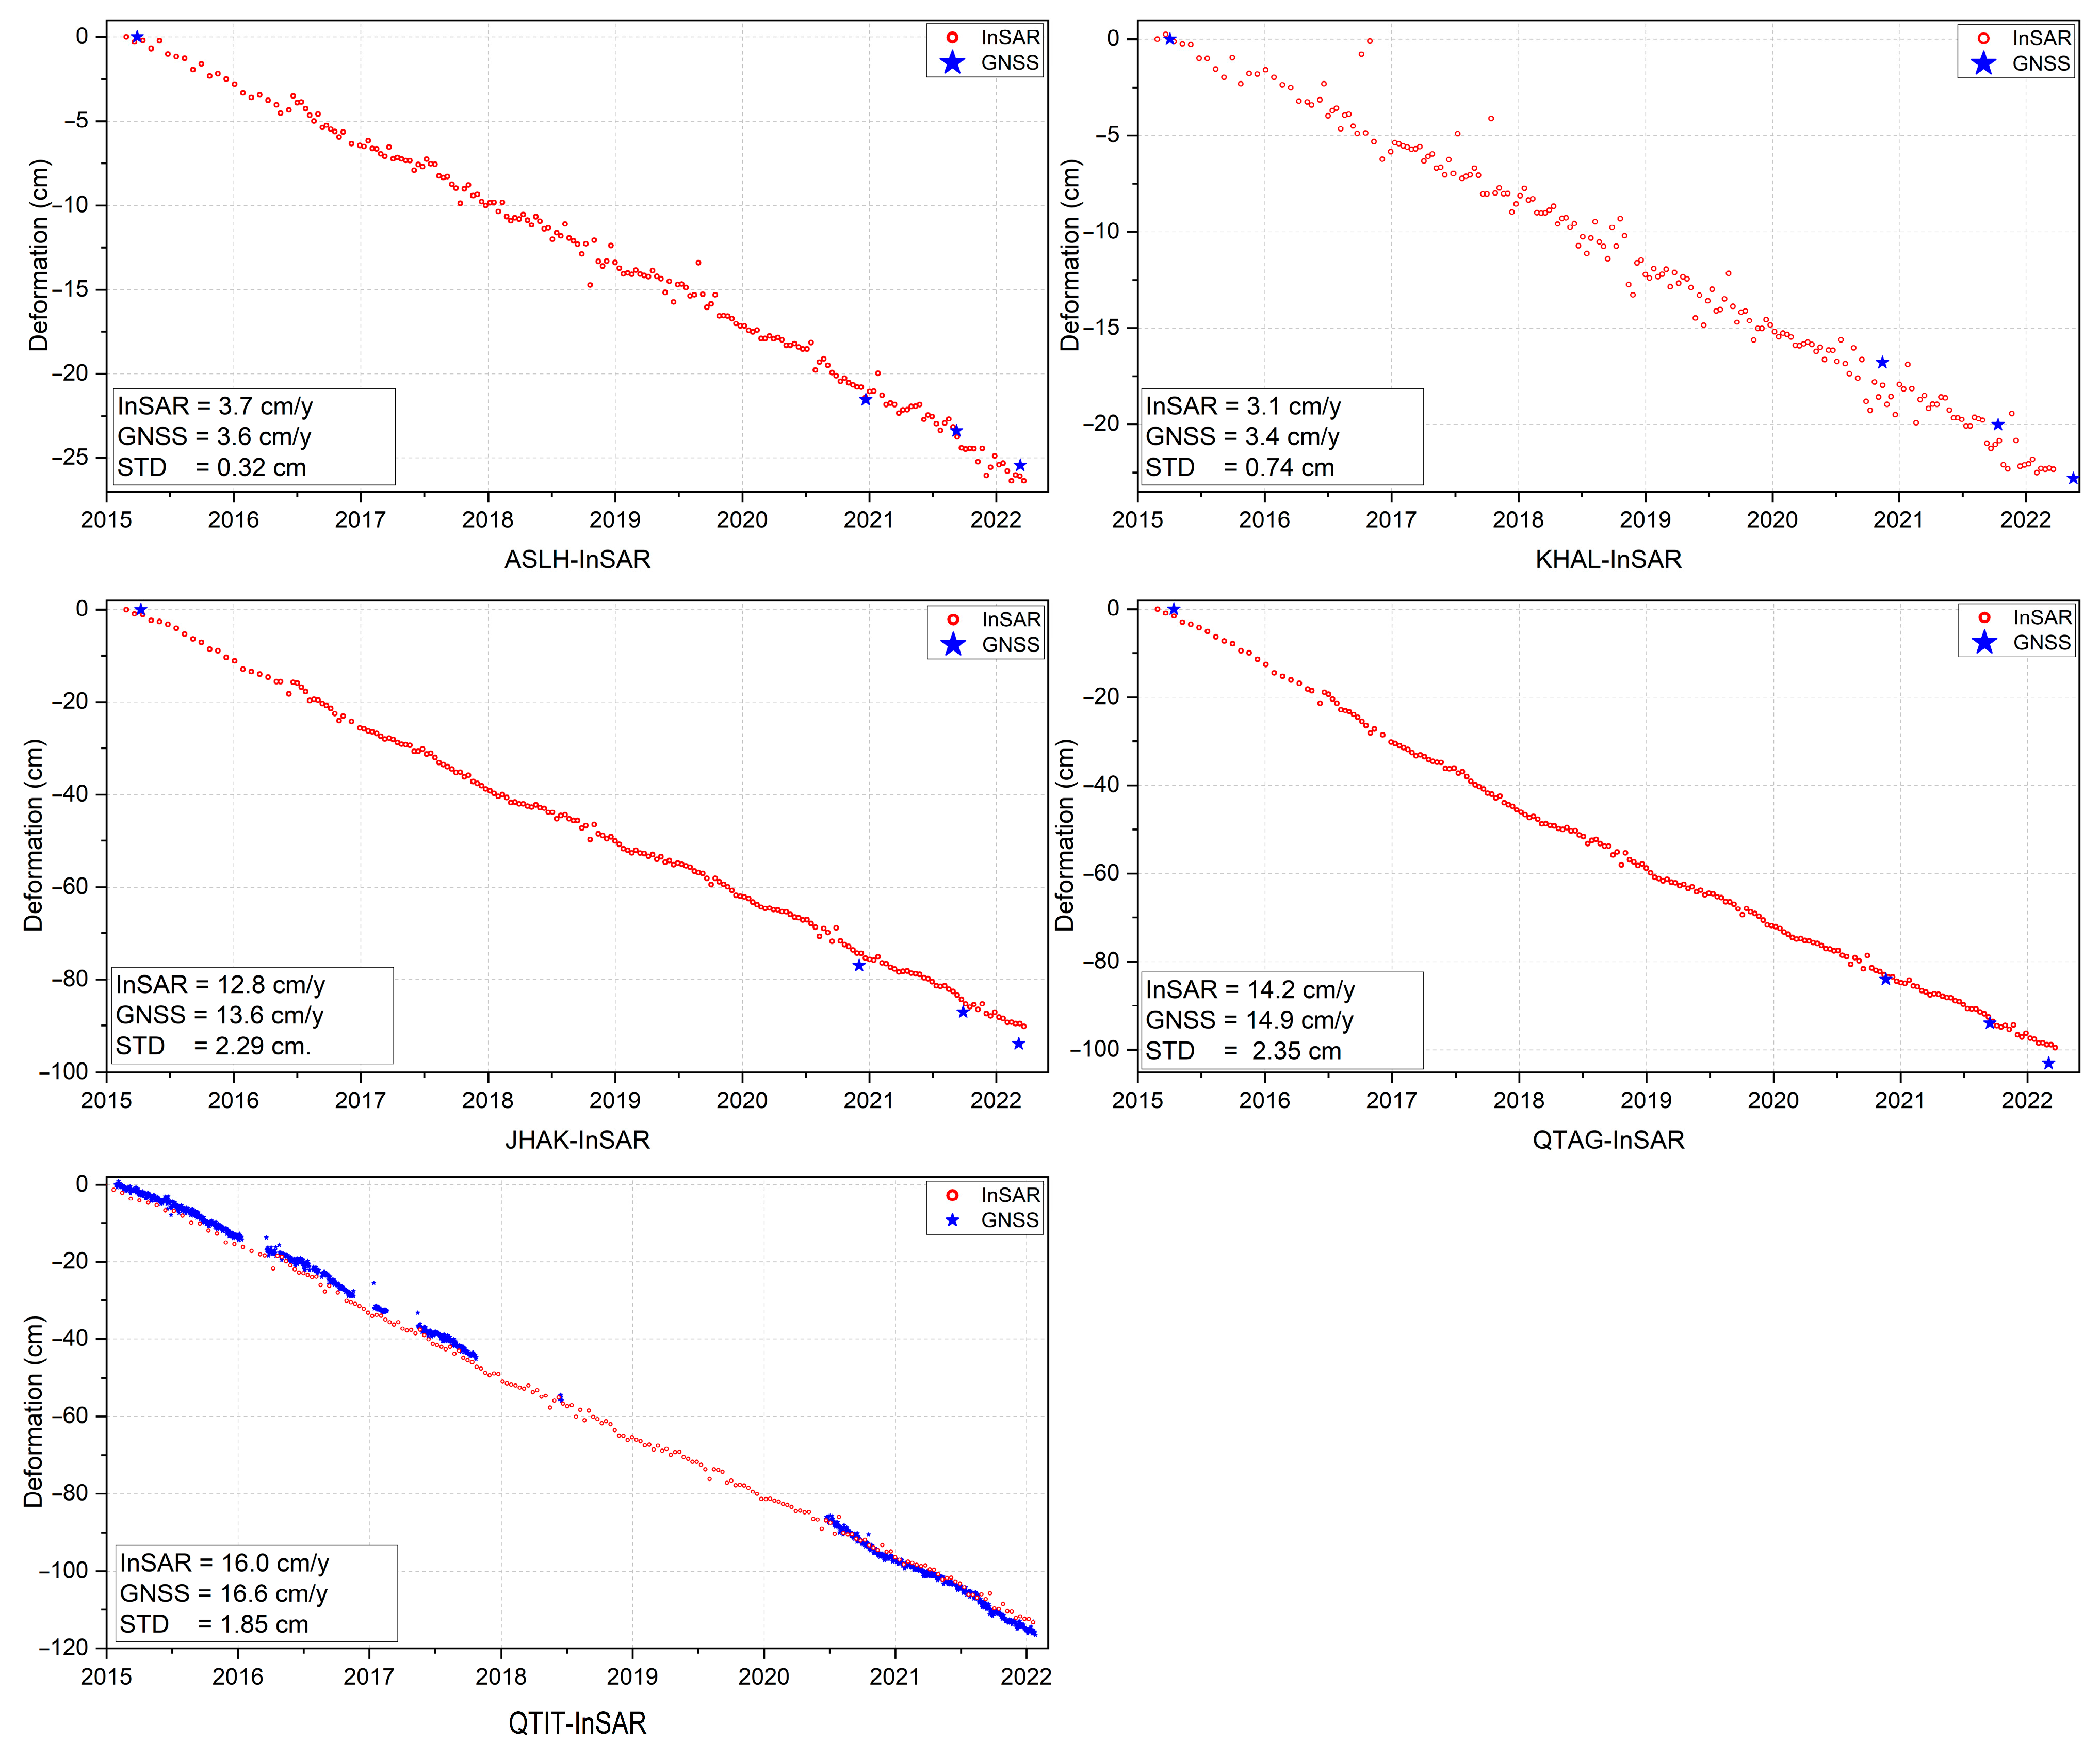
GNSS and SBAS-InSAR have been previously correlated and validated with good results [11]. Figure 12 shows the correlation analysis between the GNSS and InSAR time series results. As stated earlier, the InSAR points are within GNSS’s 100 m radius. The vertical velocity at each point is as follows. On the ASLH benchmark, the InSAR average velocity is 3.7 cm/y, while the GNSS’s average velocity is 3.6 cm/y, with a standard deviation of 0.32 cm. On the KHAL site, the InSAR average velocity is 3.1 cm/y, while the GNSS average velocity is 3.4 cm/y, with a standard deviation of 0.74 cm. The InSAR and GNSS average velocities at the JHAK station are 12.8 cm/y and 13.6 cm/y, respectively, with a standard deviation of 2.29 cm. The average InSAR and GNSS subsidence recorded at the QTAG point is 14.2 cm/y and 14.9 cm/y, with a standard deviation of 2.35 cm. The permanent station’s QTIT average velocity recorded by InSAR and GNSS is 16 cm/y and 16.6 cm/y, with a standard deviation of 1.85 cm. The graphs indicate a strong correlation between the InSAR and GNSS results.

5. Discussion

5.1. Ground Fissures

One of the consequences of subsidence is the development of large- and small-scale fissures. Earth fissures are linear cracks that form at a depth due to the differential vertical displacement in the subsiding region, especially where the subsurface lithology is clay and silt (aquitards). The fissures can occur if the differential displacement is sufficient enough in magnitude to affect the soil’s tensile stress [65]. The fissures are more likely to appear when fine-grained sediments such as clay and silt comprise more than 50% of the basin’s lithology [66]. Fissures due to subsidence have been reported in several countries such as China [67,68], Iran [69], Mexico [70], and the USA [66].
The land fissures started appearing in Quetta Valley in 2011 and their frequency has been increasing ever since. We have identified numerous sites with four major locations in Quetta and one location in the Mastung area where fissure activity has occurred. The fissures usually appear during heavy rainfall and have resulted in significant economic loss for the residents of Quetta and Mastung. The fissures range from a hairline crack to several meters wide and hundreds of meters long. Many buildings in the city have been damaged by them. Figure 13 shows the time sequence of fissure growth over time during the period 2012–2018–2023 in one of the hospitals and adjacent school buildings in southern Quetta. The coordinates of these damaged buildings are 30°5′58.98″N, 66°58′5.25″E.
The fissures are one of the main causes of groundwater contamination because the sewerage water pollutes the aquifer system through these pathways. The Pakistan Council of Research in Water Resources (PCRWR) reported 76% of the groundwater samples from Quetta are unsafe due to bacteriological contaminants, mainly faecal pollutants [71,72].

5.2. Geological Relationship

The three lithological well logs (W1, W2, and W3) obtained from the BID show that most of the alluvium deposits are composed of clay and silt sediments (Figure 14a). These fine-grained sediments are mainly responsible for the compaction of the aquifer system. The clay grains are made up of phyllosilicates that have a platy texture [73]. These platy minerals are rearranged into horizontal stacks after dewatering [74,75]. In the thick unconsolidated deposits, the pore pressure decreases due to the migration of water molecules from fine- to coarse-grained sediments. As a result, the stress increases on the dewatered region due to low pressure, which ultimately leads to overburdening on the entire aquifer matrix and the volume changes in the form of a subsidence [76,77]. In Figure 14b, a time series profile (B–B′) is displayed over Quetta, showcasing the subsidence over time. The blue, green, and red lines in Figure 14b correspond to the years 2015, 2018, and 2022, respectively. This profile line depicts a cumulative vertical deformation of 89 cm. Figure 14d presents a lithological profile (A–A′) indicating the subsurface lithology. The location of the lithological well logs (W1, W2, W3), lithological profile (A–A′), and the time series profile (B–B′) can be seen in Figure 14c.
The V-shaped subsidence areas marked by the two red boxes correlate with each other, as seen in Figure 14b,d. This illustrates that the maximum subsidence in the valley occurs in areas with thick alluvium deposits, meaning regions with thicker alluvium deposits are prone to severe subsidence.

5.3. InSAR–GWL Correlation

The groundwater decline due to anthropogenic activities in Quetta is considered one of the main reasons for land subsidence. The highly compressible clay-rich subsurface lithology exacerbates the subsidence phenomenon in Quetta Valley. In Figure 15, we compared the cross-correlation between the GWL decline and subsidence. Wells that were close to the GNSS-InSAR benchmarks were selected for this analysis. We found a good agreement between the GWL decline and InSAR measurements. The correlation coefficient between well # 51 and the ASLH-InSAR benchmark is 0.76. Well # 41 has a correlation coefficient of 0.91 with the KHAL-InSAR benchmark. A correlation coefficient of 0.87 is calculated when comparing JHAK-InSAR and well # 58. The QTAG-InSAR and well # 56 have a correlation coefficient value of 0.92, while the QTIT InSAR and well # 59 have a correlation coefficient of 0.94. This indicates that areas where there is high groundwater extraction are suffering from significant subsidence.

5.4. Population–GWL Association

The population of Quetta district has constantly increased over time, mainly due to urbanization and migrations from war-torn Afghanistan. According to the Pakistan Bureau of Statistics (PBS) census report, the population of Quetta district during 1998 was 0.76 million, which increased by 194% to 2.2 million in 2017, making it the highest recorded growth in any district of Pakistan. The annual population growth during the period 1998–2017 was 5.8%, while the national average was 2.4%. The latest digital census of 2023 recorded the population of Quetta district as reaching 2.57 million, with an annual growth rate of 2.2% [44].
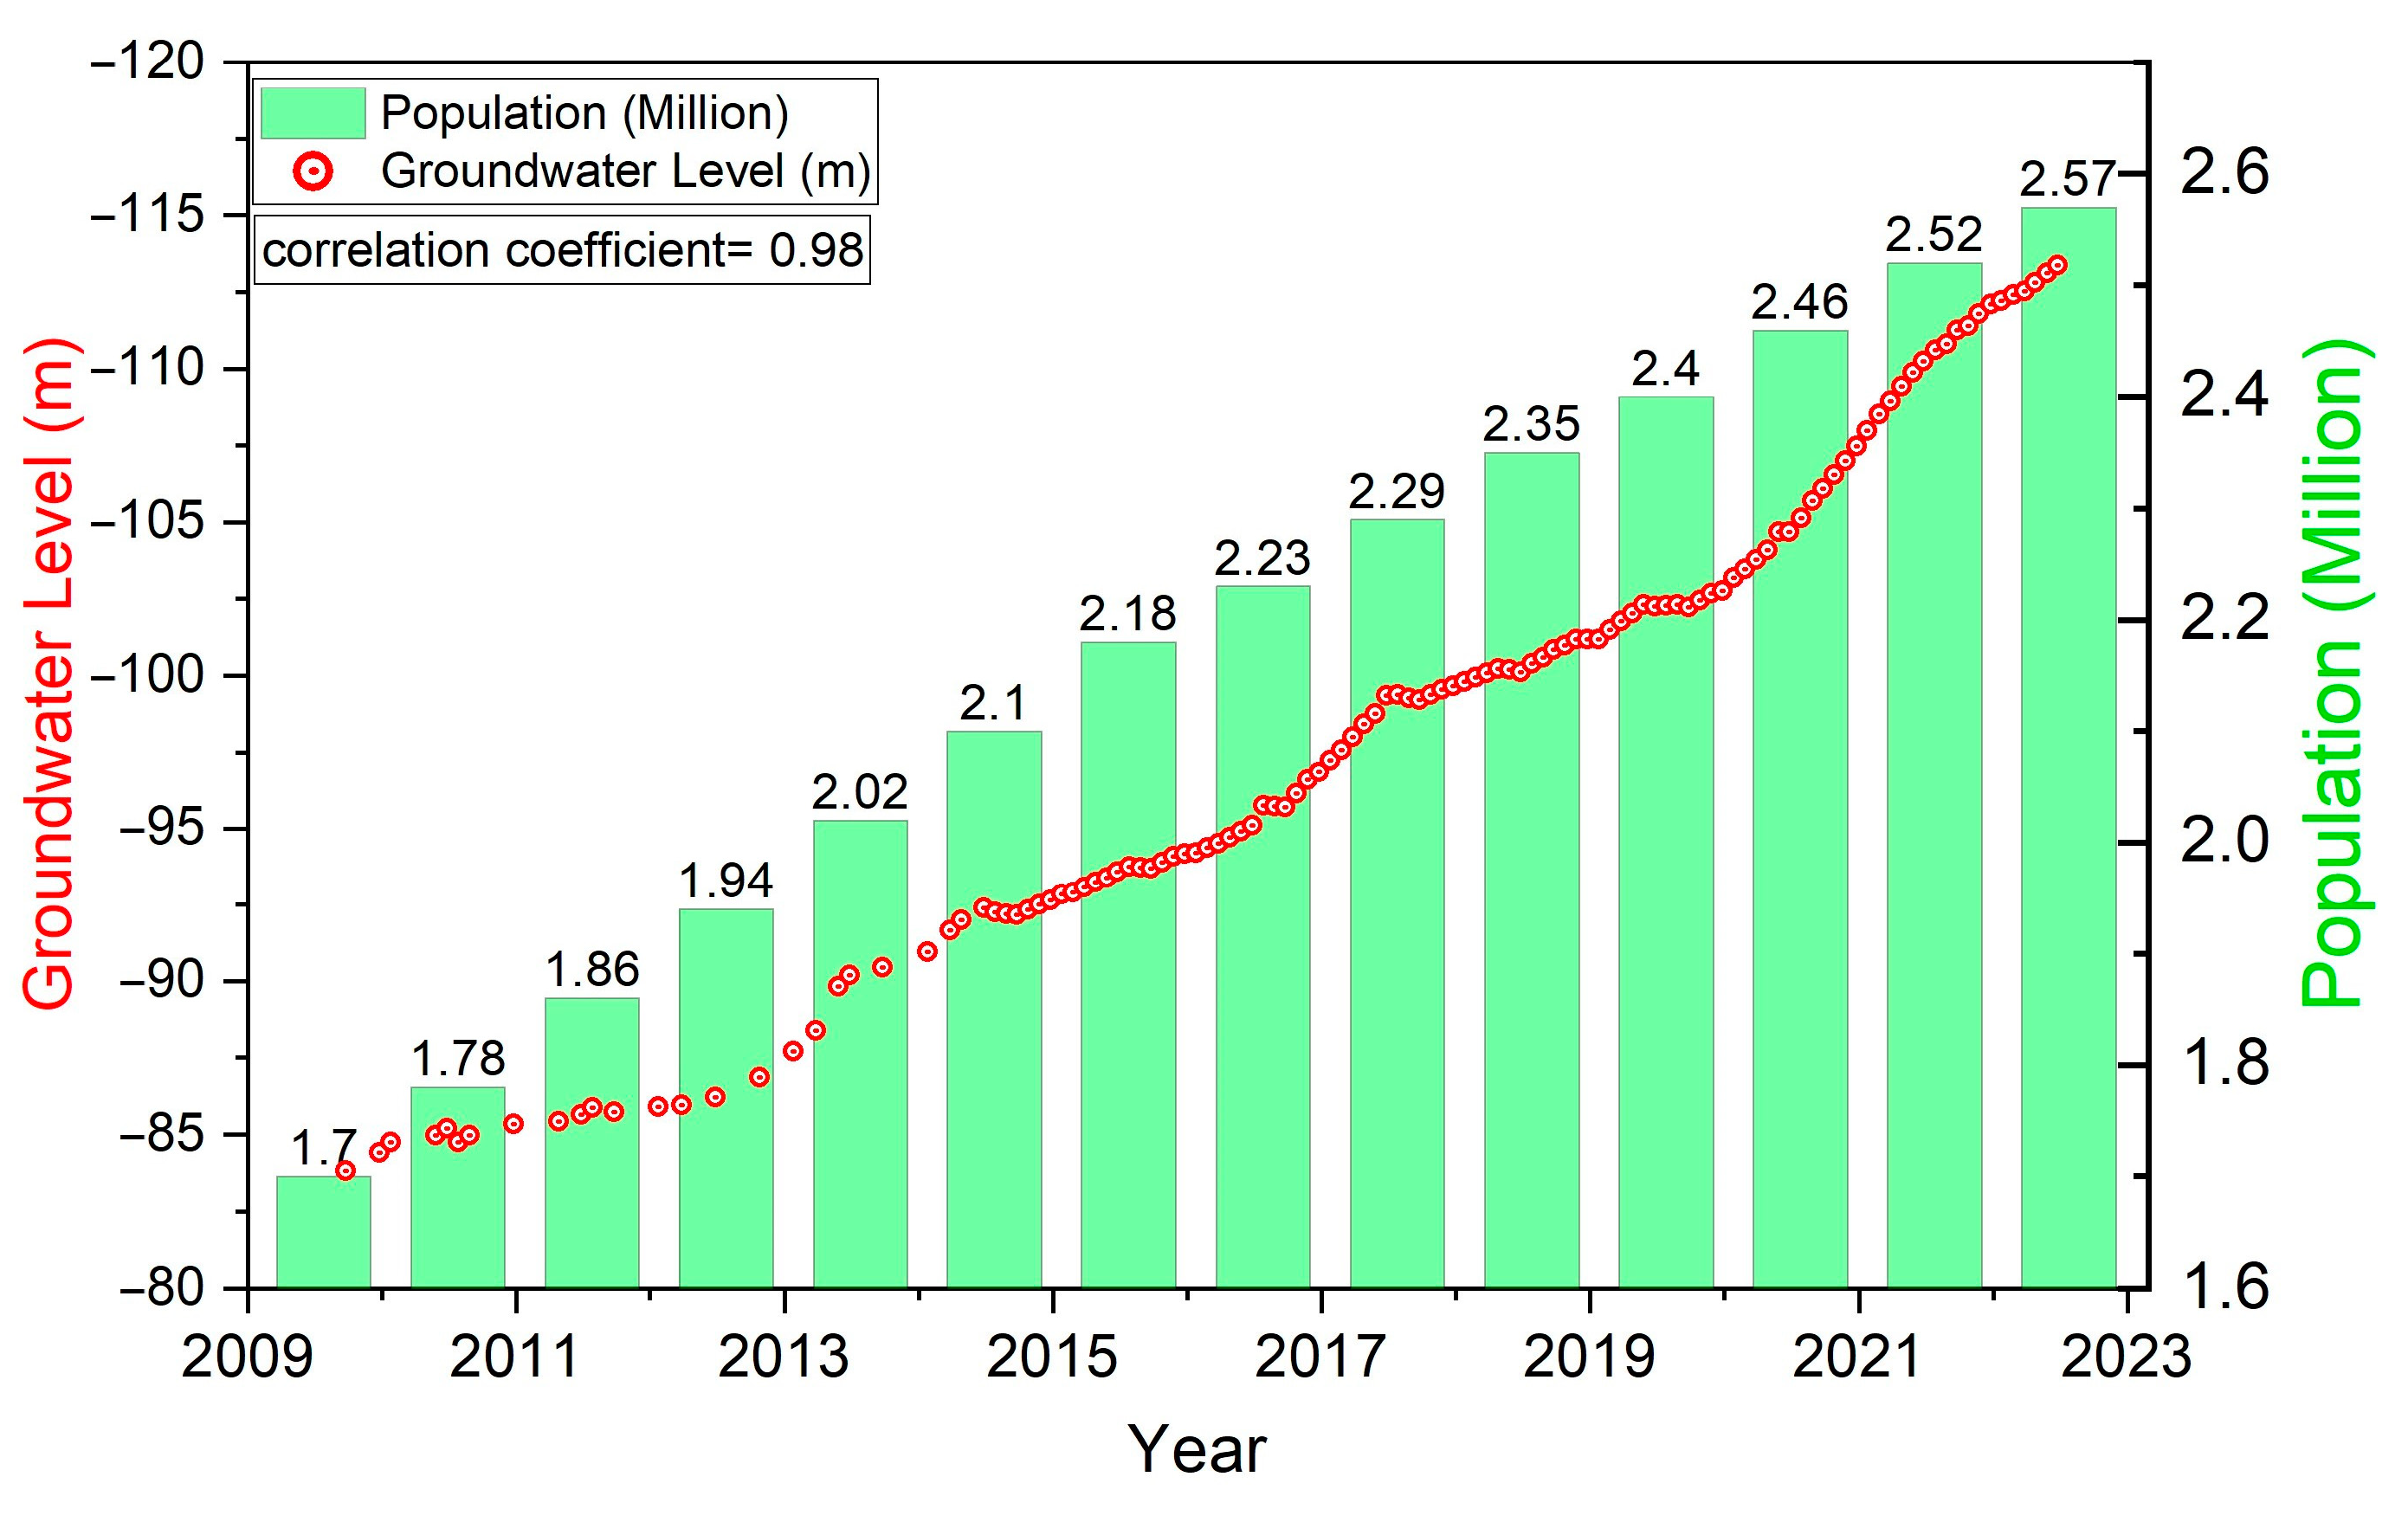
The demand for freshwater has increased over time due to the population growth. The annual discharge and recharge of Quetta’s aquifer system is 61.15 million m3 and 97.65 million m3, respectively, resulting in a deficit of 36.5 million m3 [43]. The continuous decline in the GWL is caused by excessive abstraction. The residents of Quetta City are drilling illegal tubewells in desperation to meet their domestic needs. The exact number of the illegal boreholes is unknown; however, Quetta’s mayor estimates that there are around 11,000 unauthorized pumping wells [78]. According to a survey, there are about 20 tubewells per every km2 of the city, with an illegal-to-legal well ratio of 20:1 [38]. Figure 16 shows the effects of population growth on the groundwater decline during the period 2010–2023. During this period, the population increased from 1.70 million to 2.57 million, while the groundwater was depleted from 83.8 m to 113.3 m. A correlation coefficient of 0.98 is recorded when comparing the GWL with population growth.

6. Conclusion and Future Work

In this study, land subsidence is investigated in the Quetta and Mastung districts using the SBAS-InSAR, GNSS, and GWL decline. This study is the first-ever attempt in Pakistan to measure long-term land subsidence by the fusion of GNSS and InSAR data for improved validity. InSAR data from the Sentinel-1 satellite in the Ascending (195 scenes) and Descending (183 scenes) tracks were used to analyse the LS from December 2015 to December 2022, which shows a correlation value of 0.99. An average subsidence ranging from 3.2 cm/y to 16.6 cm/y was recorded in the valley, mainly due to the GWL decline and clay-rich sediments, which are prone to compaction due to dewatering. Large- and small-scale fissures were observed during the surveys, which are responsible for damage to the city’s infrastructure and aquifer contamination. High-accuracy GNSS measurements at five locations from October 2006 to December 2022 show an increase in subsidence after 2016, which may be due to the population explosion and overexploitation of the GWL. An accumulated vertical subsidence of 2 m was recorded by the permanent GNSS station (QTIT) from October 2008 to January 2023 (14.2 years). Additionally, the InSAR and GNSS (QTAG, QTIT, JHAK, KHAL, and ASLH) values were compared for validation, resulting in a good correlation between both techniques. The GWL data from 1987 to 2022 were collected from the BID to assess the annual decline. A GWL decline ranging from 1.7 to 6 m was recorded by the piezometers in Quetta. Our assessment concludes that Quetta may be the fastest-sinking metropolitan city in Pakistan.
Further studies may be conducted on Quetta’s aquifer system to ascertain the compaction limit of the aquifer, because once the compaction level exceeds the elastic limit of the matrix material, compaction becomes permanent. Extensometers may also be installed in the valley to observe the compaction rates of individual layers at different depths.
Possible strategies to slow down the LS include, but are not limited to, enacting laws to limit the exploitation of the already stressed aquifer system, importing fresh water from other basins, artificially recharging the aquifer by injecting wells and rain harvesting projects, taxing groundwater pumping, limiting drilling permits, recycling fresh water for agricultural purposes, and implementing the water conservation practices to reduce the overconsumption of groundwater.

Author Contributions

Conceptualization, N.K. and C.Z.; methodology, N.K.; software, N.K.; validation, G.L. and H.Z.; writing—original draft, N.K.; writing—review and editing, C.Z., G.L. and H.Z.; visualization, N.K.; supervision, C.Z. All authors have read and agreed to the published version of the manuscript.

Funding

This research received no external funding.

Data Availability Statement

The data presented in the study are available on request from the first and corresponding author. The data are not publicly available due to the thesis that is being prepared from these data.

Acknowledgments

We thank the ESA for providing the Sentinel-1 data. This study was also supported by the Chang’an University High Performance Computing Platform. We want to express our sincere gratitude to both reviewers for their time and expertise. Their feedback has greatly improved our manuscript.

Conflicts of Interest

The authors declare no conflicts of interest.

References

  1. Herrera-García, G.; Ezquerro, P.; Tomás, R.; Béjar-Pizarro, M.; López-Vinielles, J.; Rossi, M.; Mateos, R.M.; Carreón-Freyre, D.; Lambert, J.; Teatini, P.; et al. Mapping the Global Threat of Land Subsidence. Science 2021, 371, 34–36. [Google Scholar] [CrossRef] [PubMed]
  2. Zhou, L.; Guo, J.; Hu, J.; Li, J.; Xu, Y.; Pan, Y.; Shi, M. Wuhan Surface Subsidence Analysis in 2015–2016 Based on Sentinel-1A Data by SBAS-InSAR. Remote Sens. 2017, 9, 982. [Google Scholar] [CrossRef]
  3. Gleeson, T.; Befus, K.; Jasechko, S.; Luijendijk, E.; Cardenas, M. The Global Volume and Distribution of Modern Groundwater. Nat. Geosci. 2015, 9, 161–167. [Google Scholar] [CrossRef]
  4. Qureshi, A. Groundwater Governance in Pakistan: From Colossal Development to Neglected Management. Water 2020, 12, 3017. [Google Scholar] [CrossRef]
  5. Sumra, D.-K.; Mumtaz, M.; Khan, K. National Water Policy of Pakistan: A Critical Analysis. J. Manag. Sci. 2020, 14, 60–70. [Google Scholar]
  6. Iqbal, J.; Su, C.; Rashid, A.; Yang, N.; Baloch, M.Y.J.; Talpur, S.A.; Ullah, Z.; Rahman, G.; Rahman, N.U.; Earjh, E.; et al. Hydrogeochemical Assessment of Groundwater and Suitability Analysis for Domestic and Agricultural Utility in Southern Punjab, Pakistan. Water 2021, 13, 3589. [Google Scholar] [CrossRef]
  7. Oldham, R.D. Records of Geological Survey of India; Forgotten Book: Calcutta, India, 1892. [Google Scholar]
  8. WAPDA Groundwater Level during 1967–1988 in Quetta Valley. Hydrogeology Project, Quetta, Basic Data Release No. 1; Kalat Publishers: Quetta, Pakistan, 1988; p. 96.
  9. Konak, H.; Küreç Nehbit, P.; Karaöz Fendoğlu, A.; Cerit, F. Interpreting Deformation Results of Geodetic Network Points Using the Strain Models Based on Different Estimation Methods. Int. J. Eng. Geosci. 2020, 5, 49–59. [Google Scholar] [CrossRef]
  10. Tuşat, E.; Ozyuksel, F. Comparison of GPS Satellite Coordinates Computed from Broadcast and IGS Final Ephemerides. Int. J. Eng. Geosci. 2018, 3, 12–19. [Google Scholar] [CrossRef]
  11. Yalvaç, S. Validating InSAR-SBAS Results by Means of Different GNSS Analysis Techniques in Medium- and High-Grade Deformation Areas. Environ. Monit. Assess. 2020, 192, 120. [Google Scholar] [CrossRef]
  12. Gabriel, A.K.; Goldstein, R.M.; Zebker, H.A. Mapping Small Elevation Changes over Large Areas: Differential Radar Interferometry. J. Geophys. Res. Solid Earth 1989, 94, 9183–9191. [Google Scholar] [CrossRef]
  13. Rosen, P.; Hensley, S.; Joughin, I.R.; Li, F.K.; Madsen, S.; Rodriguez, E.; Goldstein, R.M. Synthetic Aperture Radar Interferometry. Proc. IEEE 2000, 88, 333–382. [Google Scholar] [CrossRef]
  14. Rosi, A.; Tofani, V.; Agostini, A.; Tanteri, L.; Tacconi Stefanelli, C.; Catani, F.; Casagli, N. Subsidence Mapping at Regional Scale Using Persistent Scatters Interferometry (PSI): The Case of Tuscany Region (Italy). Int. J. Appl. Earth Obs. Geoinf. 2016, 52, 328–337. [Google Scholar] [CrossRef]
  15. Amelung, F.; Galloway, D.; Bell, J.; Zebker, H.; Laczniak, R. Sensing the Ups and Downs of Las Vegas: InSAR Reveals Structural Control of Land Subsidence and Aquifer-System Deformation. Geology 1999, 27, 483–486. [Google Scholar] [CrossRef]
  16. Bawden, G.; Stein, R.; Hudnut, K.; Peltzer, G. Tectonic Contraction across Los Angeles after Removal of Groundwater Pumping Effects. Nature 2001, 412, 812–815. [Google Scholar] [CrossRef] [PubMed]
  17. Lauknes, T.R. Rockslide Mapping in Norway by Means of Interferometric SAR Time Series Analysis. Ph.D. Thesis, The Arctic University of Norway, Tromsø, Norway, 2010. [Google Scholar]
  18. Baer, G.; Schattner, U.; Wachs, D.; Sandwell, D.; Wdowinski, S.; Frydman, S. The Lowest Place on Earth Is Subsiding—An InSAR (Interferometric Synthetic Aperture Radar) Perspective. Geol. Soc. Am. Bull. 2002, 114, 12–23. [Google Scholar] [CrossRef]
  19. Galloway, D.; Hudnut, K.; Ingebritsen, S.; Phillips, S.; Peltzer, G.; Rogez, F.; Rosen, P. Detection of Aquifer System Compaction and Land Subsidence Using Interferometric Synthetic Aperture Radar, Antelope Valley, Mojave Desert, California. Water Resour. Res. 1998, 34, 2573–2585. [Google Scholar] [CrossRef]
  20. Hoffmann, J.; Galloway, D.; Zebker, H. Inverse Modeling of Interbed Storage Parameters Using Land Subsidence Observations, Antelope Valley, California. Water Resour. Res. 2003, 39, SBH 5-1. [Google Scholar] [CrossRef]
  21. Berardino, P.; Fornaro, G.; Lanari, R.; Sansosti, E. A New Algorithm for Surface Deformation Monitoring Based on Small Baseline Differential SAR Interferograms. IEEE Trans. Geosci. Remote. Sens. 2002, 40, 2375–2383. [Google Scholar] [CrossRef]
  22. Ferretti, A.; Prati, C.; Rocca, F. Permanent Scatterers in SAR Interferometry. IEEE Trans. Geosci. Remote Sens. 2001, 39, 8–20. [Google Scholar] [CrossRef]
  23. Lanari, R.; Mora, O.; Manunta, M.; Mallorqui, J.; Berardino, P.; Sansosti, E. A Small Baseline Approach for Investigating Deformation on Full Resolution Differential SAR Interferograms. IEEE Trans. Geosci. Remote. Sens. 2004, 42, 1377–1386. [Google Scholar] [CrossRef]
  24. Osmanoglu, B.; Dixon, T.; Wdowinski, S.; Cabral-Cano, E.; Jiang, Y. Mexico City Subsidence Observed with Persistent Scatterer InSAR. Int. J. Appl. Earth Obs. Geoinf. 2011, 13, 1. [Google Scholar] [CrossRef]
  25. Li, B.; Wang, Z.; An, J.; Zhou, C.; Ma, Y. Time-Series Analysis of Subsidence in Nanning, China, Based on Sentinel-1A Data by the SBAS InSAR Method. PFG J. Photogramm. Remote Sens. Geoinf. Sci. 2020, 88, 291–304. [Google Scholar] [CrossRef]
  26. Cigna, F.; Esquivel, R.; Tapete, D. Accuracy of Sentinel-1 PSI and SBAS InSAR Displacement Velocities against GNSS and Geodetic Leveling Monitoring Data. Remote Sens. 2021, 13, 4800. [Google Scholar] [CrossRef]
  27. Hanssen, R. Radar Interferometry Data Interpretation and Error Analysis; Springer Science & Business Media: Berlin, Germany, 2001; Volume 2, ISBN 978-0-7923-6945-5. [Google Scholar]
  28. Zhang, B.; Ding, X.; Zhu, W.; Wang, C.; Zhang, L.; Liu, Z. Mitigating Ionospheric Artifacts in Coseismic Interferogram Based on Offset Field Derived from ALOS-PALSAR Data. IEEE J. Sel. Top. Appl. Earth Obs. Remote Sens. 2016, 9, 7. [Google Scholar] [CrossRef]
  29. Motagh, M.; Shamshiri, R.; Haghshenas Haghighi, M.; Wetzel, H.-U.; Akbari, B.; Nahavandchi, H.; Roessner, S.; Arabi, S. Quantifying Groundwater Exploitation Induced Subsidence in the Rafsanjan Plain, Southeastern Iran, Using InSAR Time-Series and in Situ Measurements. Eng. Geol. 2017, 218, 134–151. [Google Scholar] [CrossRef]
  30. Dong, S.; Samsonov, S.; Yin, H.; Ye, S.; Cao, Y. Time-Series Analysis of Subsidence Associated with Rapid Urbanization in Shanghai, China Measured with SBAS InSAR Method. Environ. Earth Sci. 2013, 72, 677–691. [Google Scholar] [CrossRef]
  31. Qu, F.; Zhang, Q.; Lu, Z.; Zhao, C.; Yang, C.; Zhang, J. Land Subsidence and Ground Fissures in Xi’an, China 2005–2012 Revealed by Multi-Band InSAR Time-Series Analysis. Remote Sens. Environ. 2014, 155, 366–376. [Google Scholar] [CrossRef]
  32. Higgins, S.A.; Overeem, I.; Steckler, M.S.; Syvitski, J.P.M.; Seeber, L.; Akhter, S.H. InSAR Measurements of Compaction and Subsidence in the Ganges-Brahmaputra Delta, Bangladesh. J. Geophys. Res. Earth Surf. 2014, 119, 1768–1781. [Google Scholar] [CrossRef]
  33. Castellazzi, P.; Arroyo Domínguez, N.; Martel, R.; Calderhead, A.; Normand, J.; Garfias, J.; Rivera, A. Land Subsidence in Major Cities of Central Mexico: Interpreting InSAR-Derived Land Subsidence Mapping with Hydrogeological Data. Int. J. Appl. Earth Obs. Geoinf. 2016, 47, 102–111. [Google Scholar] [CrossRef]
  34. Chaussard, E.; Wdowinski, S.; Cabral-Cano, E.; Amelung, F. Land Subsidence in Central Mexico Detected by ALOS InSAR Time-Series. Remote Sens. Environ. 2014, 140, 94–106. [Google Scholar] [CrossRef]
  35. Chaussard, E.; Amelung, F.; Abidin, H.Z.; Hong, S.-H. Sinking Cities in Indonesia: ALOS PALSAR Detects Rapid Subsidence due to Groundwater and Gas Extraction. Remote Sens. Environ. 2013, 128, 150–161. [Google Scholar] [CrossRef]
  36. Stramondo, S.; Bozzano, F.; Marra, F.; Wegmuller, U.; Cinti, F.; Moro, M.; Saroli, M. Subsidence Induced by Urbanisation in the City of Rome Detected by Advanced InSAR Technique and Geotechnical Investigations. Remote Sens. Environ. 2008, 112, 3160–3172. [Google Scholar] [CrossRef]
  37. Khan, A.; Khan, S.; Kakar, D. Land Subsidence and Declining Water Resources in Quetta Valley, Pakistan. Environ. Earth Sci. 2013, 70, 2719–2727. [Google Scholar] [CrossRef]
  38. Kakar, N.; Khan, A.; Khan, S.; Kakar, D. Land Subsidence Caused by Groundwater Exploitation in Quetta Valley, Pakistan. Int. J. Econ. Environ. Geol. 2016, 7, 10–19. [Google Scholar]
  39. Ahmad, W.; Choi, M.; Kim, S.; Kim, D. Detection of Land Subsidence and Its Relationship with Land Cover Types Using ESA Sentinel Satellite Data: A Case Study of Quetta Valley, Pakistan. Int. J. Remote Sens. 2019, 40, 9572–9603. [Google Scholar] [CrossRef]
  40. Durrani, I.H.; Adnan, S.; Ahmad, M.; Khair, S.M.; Kakar, E. Observed Long-Term Climatic Variability and Its Impacts on the Ground Water Level of Quetta Alluvial. Iran. J. Sci. Technol. Trans. Sci. 2018, 42, 589–600. [Google Scholar] [CrossRef]
  41. Durrani, I.; Adnan, S.; Aftab, S.M. Historical and Future Climatological Drought Projections over Quetta Valley, Balochistan, Pakistan. IOP Conf. Ser. Mater. Sci. Eng. 2018, 414, 012043. [Google Scholar] [CrossRef]
  42. Durrani, I.; Adnan, S.; Aftab, S.M. Daily Climate Extremes of Temperature and Precipitation over Quetta Valley, Pakistan during 1961–2019. Int. J. Environ. 2021, 10, 20–48. [Google Scholar] [CrossRef]
  43. Asian Development Bank. Quetta Water Supply and Environmental Improvement Project; Asian Development Bank: Mandaluyong City, Philippines, 2000. [Google Scholar]
  44. Home|Pakistan Bureau of Statistics. Available online: https://www.pbs.gov.pk/ (accessed on 20 March 2024).
  45. Hunting, S.C. Hunting Survey Corporation. Reconnaissance Geology of Part of West Pakistan, Balochistan, a Colombo Plan Cooperative Project; Photographic survey corporation limited: Toronto, ON, Canda, 1961. [Google Scholar]
  46. Kazmi, A.; Reza, S.Q. Water Supply of Quetta Basin, Balochistan, Pakistan. Geol. Surv. Pak. Rec. 1970, 20, 97–138. [Google Scholar]
  47. Kazmi, S. Geohydrology of Quetta Valley; Hydrogeology Directorate, Reclamation Division, Water and Power Development Authority: Quetta, Pakistan, 1973; Volume 72. [Google Scholar]
  48. Kazmi, A. Geology of Ziarat-Kach-Zardalu Area of Balochistan. DIC Thesis, Imperial College London, London, UK, 1955. Volume 157. [Google Scholar]
  49. Kazmi, A.H.; Hamza, A. The Bibai and Gogai Nappes in the Kach-Ziarat Area of Northeastern Baluchistan; Geodynamics of Pakistan. Geological Survey of Pakistan: Quetta, Pakistan, 1979; pp. 333–340. [Google Scholar]
  50. Sagintayev, Z.; Sultan, M.; Khan, S.D.; Khan, S.A.; Mahmood, K.; Yan, E.; Milewski, A.; Marsala, P. A Remote Sensing Contribution to Hydrologic Modelling in Arid and Inaccessible Watersheds, Pishin Lora Basin, Pakistan. Hydrol. Process. 2012, 26, 85–99. [Google Scholar] [CrossRef]
  51. Bilham, R.; Kakar, N.U.; Kakar, D.M.; Wang, K.; Bürgmann, R.; Barnhart, W.D. The 1892 Chaman, Pakistan, Earthquake. Seismol. Res. Lett. 2019, 90, 2293–2303. [Google Scholar] [CrossRef]
  52. Szeliga, W.; Bilham, R.; Schelling, D.; Din, M.; Kakar, D.; Lodi, S. Fold and Thrust Partitioning in a Contracting Fold Belt: Insights from the 1931 Mach Earthquake in Baluchistan. Tectonics 2009, 28, 5. [Google Scholar] [CrossRef]
  53. Alam, K.; Ahmad, N. Determination of Aquifer Geometry through Geophysical Methods: A Case Study from Quetta Valley, Pakistan. Acta Geophys. 2014, 62, 142–163. [Google Scholar] [CrossRef]
  54. Huang, J.; Khan, S.; Ghulam, A.; Crupa, W.; Abir, I.; Khan, A.; Kakar, D.; Kasi, A.; Kakar, N. Study of Subsidence and Earthquake Swarms in the Western Pakistan. Remote Sens. 2016, 8, 956. [Google Scholar] [CrossRef]
  55. ASF Data Search. Available online: https://search.asf.alaska.edu/#/ (accessed on 20 March 2024).
  56. De Zan, F.; Monti Guarnieri, A. TOPSAR: Terrain Observation by Progressive Scans. IEEE Trans. Geosci. Remote Sens. 2006, 44, 2352–2360. [Google Scholar] [CrossRef]
  57. Wegnüller, U.; Werner, C.; Strozzi, T.; Wiesmann, A.; Frey, O.; Santoro, M. Sentinel-1 Support in the GAMMA Software. Procedia Comput. Sci. 2016, 100, 1305–1312. [Google Scholar] [CrossRef]
  58. GipsyX/RTGx, a New Tool Set for Space Geodetic Operations and Research. Adv. Space Res. 2020, 66, 469–489. [CrossRef]
  59. Characterisation and Mapping of Land Subsidence Based on Geodetic Observations in Lagos, Nigeria. Geod. Geodyn. 2020, 11, 151–162. [CrossRef]
  60. Dawood, F.; Akhtar, M.M.; Ehsan, M. Evaluating Urbanization Impact on Stressed Aquifer of Quetta Valley, Pakistan. Desalination Water Treat. 2021, 222, 103–113. [Google Scholar] [CrossRef]
  61. Ullah, H.; Kassi, A.M.; Aftab, S.M.; Zahir, M. Decline of Static Water Level in Quetta Sub-Basin, Balochistan, Pakistan. J. Geogr. Soc. Sci. 2021, 3, 1. [Google Scholar]
  62. Khan, M.F.K.; Nawaz, M. Karez Irrigation in Pakistan. GeoJournal 1995, 37, 91–100. [Google Scholar] [CrossRef]
  63. Planning & Monitoring Wing Water Resources PD&M Directorate Irrigation Department Quetta “Quarterly Report on Groundwater Monitoring of Quetta Sub-Basin”. “Irrigation Quetta”; Kalat Publishers: Quetta, Pakistan, 2011.
  64. Peng, M.; Zhao, C.; Zhang, Q.; Lu, Z.; Li, Z. Research on Spatiotemporal Land Deformation (2012–2018) over Xi’an, China, with Multi-Sensor SAR Datasets. Remote Sens. 2019, 11, 664. [Google Scholar] [CrossRef]
  65. Panda, B.B.; Rucker, M.L.; Fergason, K.C. Modeling of Earth Fissures Caused by Land Subsidence due to Groundwater Withdrawal. Proc. IAHS 2015, 372, 69–72. [Google Scholar] [CrossRef]
  66. Knudsen, T.; Inkenbrandt, P.; Lund, W.; Lowe, M.; Bowman, S. Investigation of Land Subsidence and Earth Fissures in Cedar Valley, Iron County, Utah; Natural Resources Map & Bookstore; North Temple: Salt Lake City, UT, USA, 2014. [Google Scholar]
  67. Shi, W.; Chen, G.; Meng, X.; Jiang, W.; Chong, Y.; Zhang, Y.; Dong, Y.; Zhang, M. Spatial-Temporal Evolution of Land Subsidence and Rebound over Xi’an in Western China Revealed by SBAS-InSAR Analysis. Remote Sens. 2020, 12, 3756. [Google Scholar] [CrossRef]
  68. Yang, C.; Zhang, F.; Liu, R.; Hou, J.; Zhang, Q.; Zhao, C. Ground Deformation and Fissure Activity of the Yuncheng Basin (China) Revealed by Multiband Time Series InSAR. Adv. Space Res. 2020, 66, 490–504. [Google Scholar] [CrossRef]
  69. Negahdary, M. Shrinking Aquifers and Land Subsidence in Iran. Science 2022, 376, 1279. [Google Scholar] [CrossRef] [PubMed]
  70. Brunori, C.A.; Bignami, C.; Albano, M.; Zucca, F.; Samsonov, S.; Groppelli, G.; Norini, G.; Saroli, M.; Stramondo, S. Land Subsidence, Ground Fissures and Buried Faults: InSAR Monitoring of Ciudad Guzmán (Jalisco, Mexico). Remote Sens. 2015, 7, 8610–8630. [Google Scholar] [CrossRef]
  71. Kahlown, M.A.; Tahir, M.A.; Hifza, R. Fifth Monitoring Report (2005–2006) (No. 133–2007), National Water Quality Monitoring Programme. [WWW Document]; Pakistan Council of Research in Water Resources (PCRWR): Lahore, Pakistan, 2007. [Google Scholar]
  72. Perveen, S. Amar-Ul-Haque Drinking Water Quality Monitoring, Assessment and Management in Pakistan: A Review. Heliyon 2023, 9, e13872. [Google Scholar] [CrossRef]
  73. Brown, G. Structure, Crystal Chemistry, and Origin of the Phyllosilicate Minerals Common in Soil Clays. In Soil Colloids and Their Associations in Aggregates; De Boodt, M.F., Hayes, M.H.B., Herbillon, A., De Strooper, E.B.A., Tuck, J.J., Eds.; NATO ASI Series; Springer US: Boston, MA, USA, 1990; pp. 7–38. ISBN 978-1-4899-2611-1. [Google Scholar]
  74. Ojha, C.; Shirzaei, M.; Werth, S.; Argus, D.F.; Farr, T.G. Sustained Groundwater Loss in California’s Central Valley Exacerbated by Intense Drought Periods. Water Resour. Res. 2018, 54, 4449–4460. [Google Scholar] [CrossRef]
  75. Sneed, M.; Brandt, J. Mitigating Land Subsidence in the Coachella Valley, California, USA: An Emerging Success Story. Proc. Int. Assoc. Hydrol. Sci. 2020, 382, 809–813. [Google Scholar] [CrossRef]
  76. Galloway, D.L.; Jones, D.R.; Ingebritsen, S.E. (Eds.) Land Subsidence in the United States; U.S. Geological Survey Circular; U.S. Geological Survey: Reston, VA, USA, 1999; ISBN 978-0-607-92696-5.
  77. Leake, S.A. Land Subsidence From Ground Water Pumping. Available online: http://www.savethesantacruzaquifer.info/land%20subsidence.htm (accessed on 19 August 2023).
  78. The Incredible Sinking Quetta. Available online: http://www.thefridaytimes.com/2018/02/23/the-incredible-sinking-quetta/ (accessed on 14 March 2024).
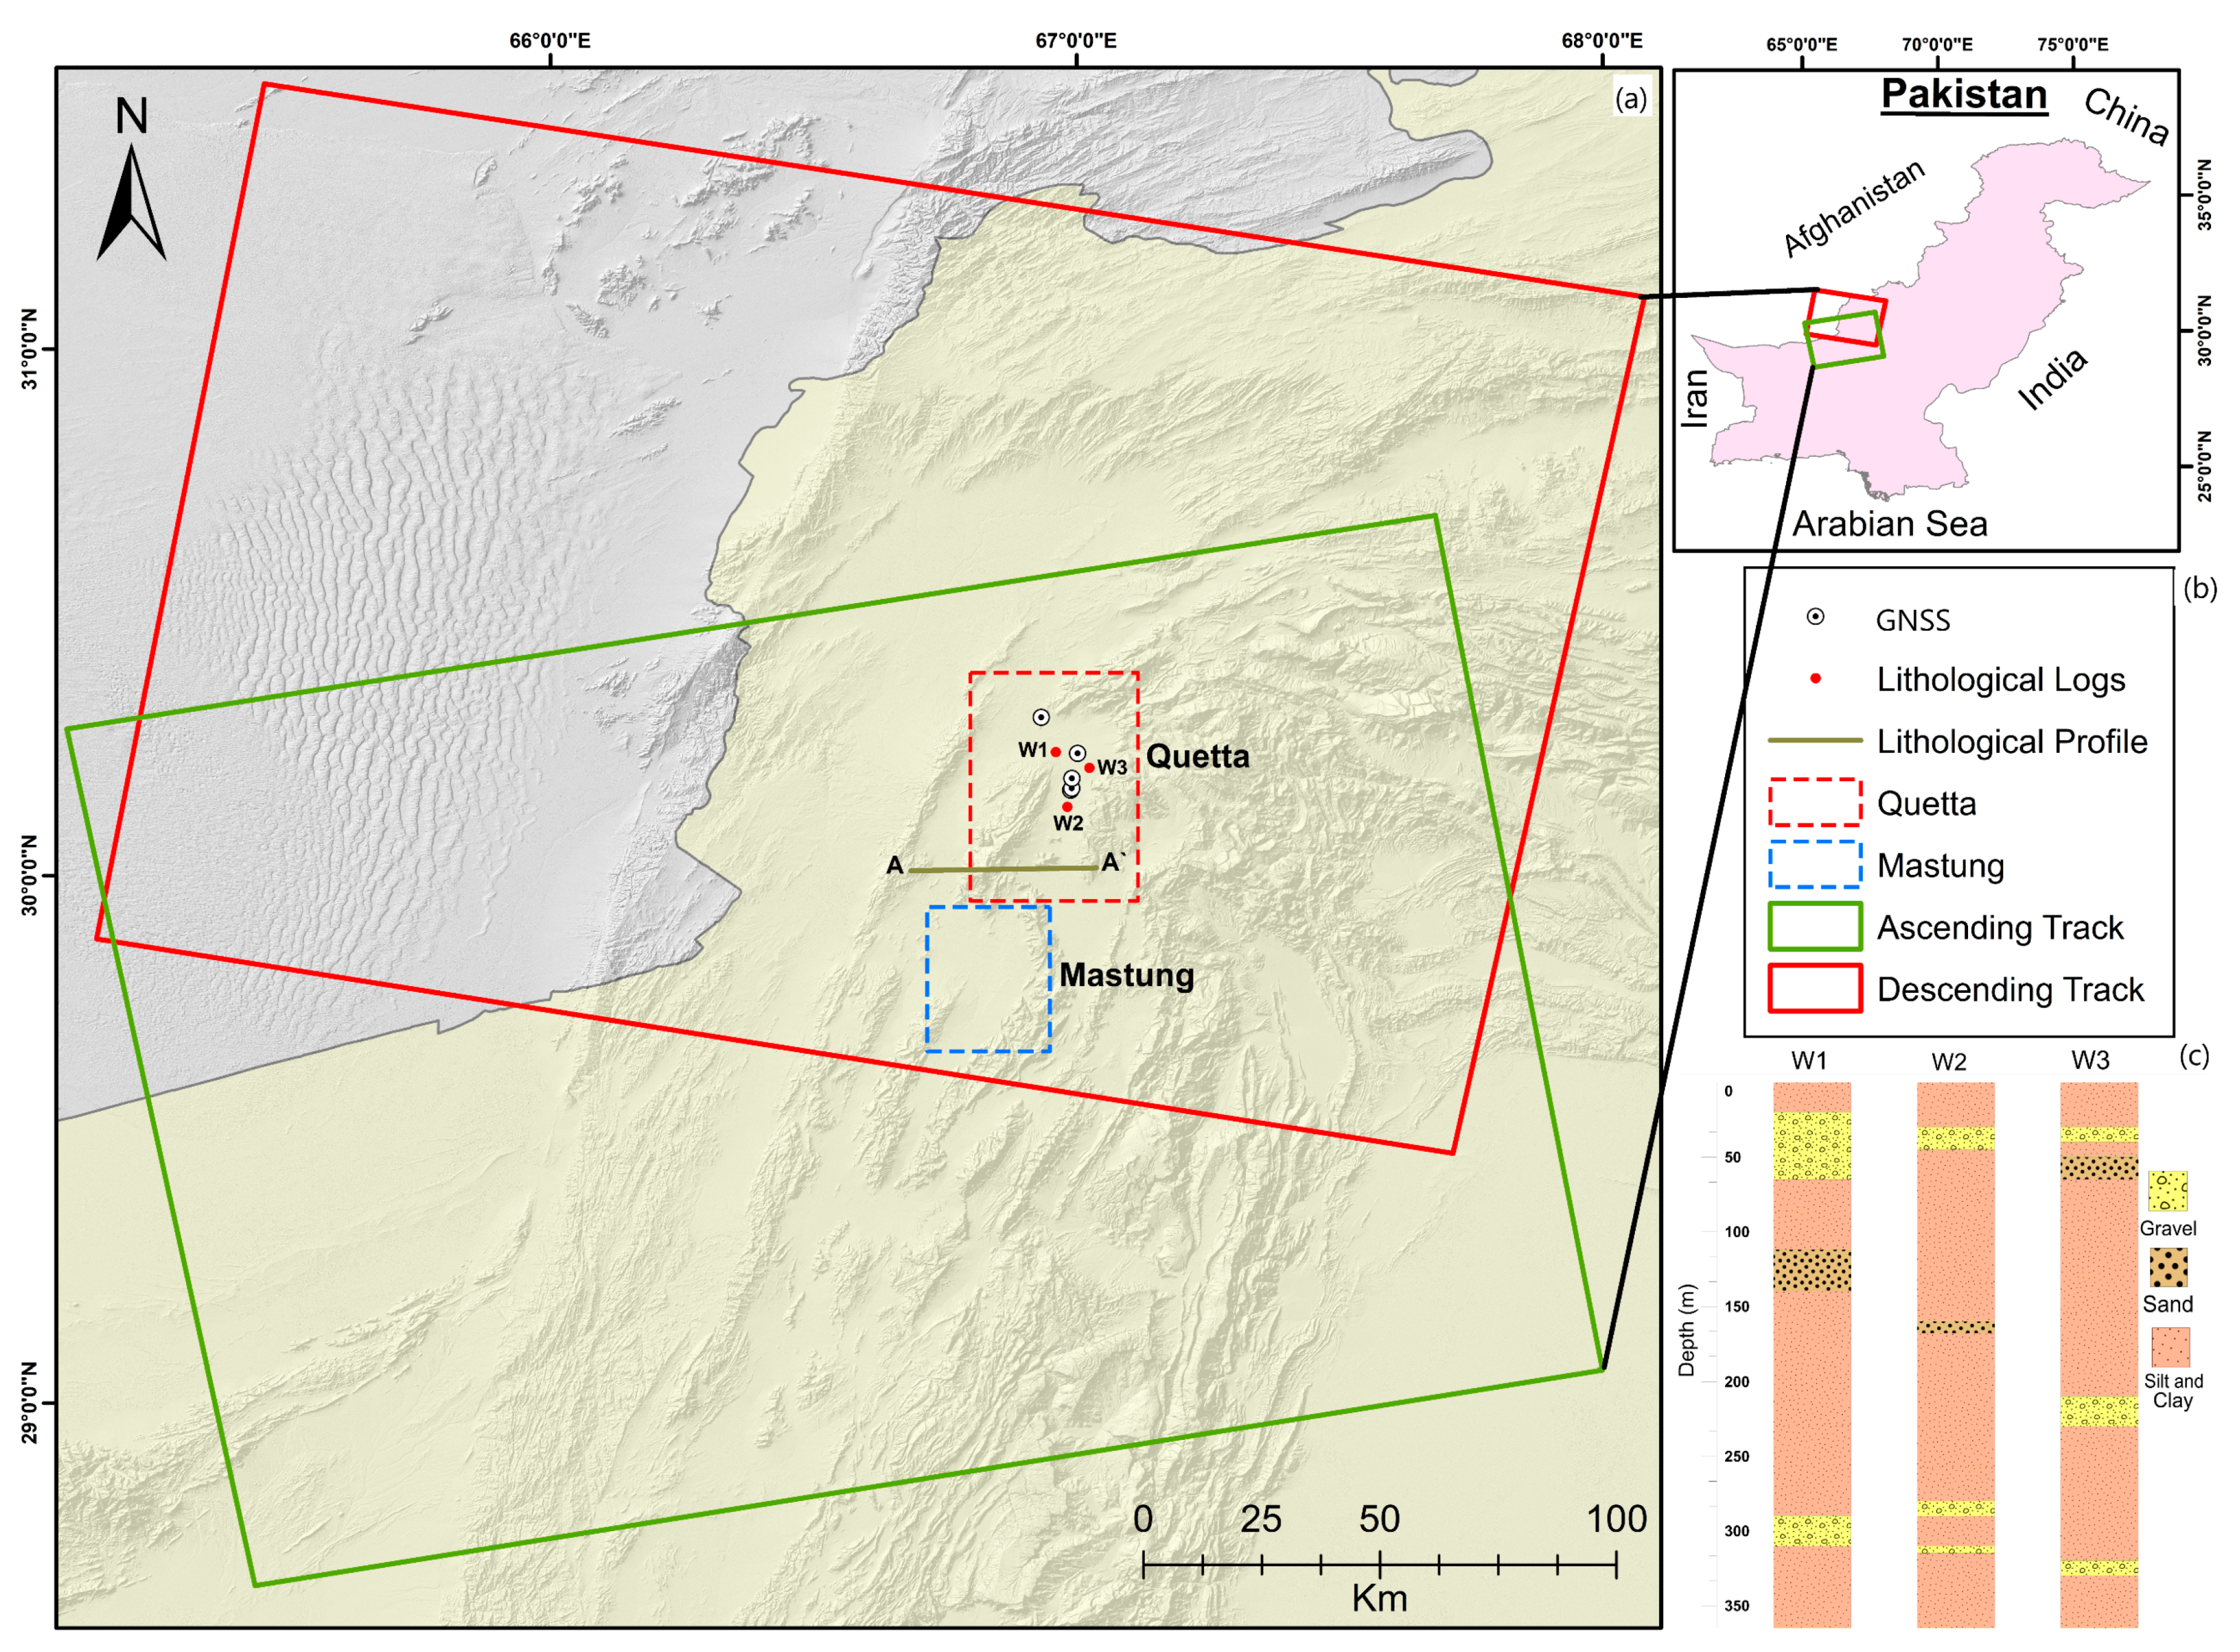
Figure 1. (a) The study area (Quetta and Mastung), Sentinel-1 footprints (Ascending and Descending), and lithological profile line (A–A′). Red dots display the lithological logs W1, W2, and W3 (c). The white dots represent GNSS locations.
Remotesensing 16 01521 g001
Figure 2. Schematic cross-section A–A′ modified from [50,53,54]. The red arrows show blind thrust faults mapped in subsurface using 2D seismic profiles.
Remotesensing 16 01521 g002
Figure 3. Spatial and temporal baseline of Ascending (above) and Descending track (below).
Remotesensing 16 01521 g003
Figure 4. (a) Trimble NetRS receiver coupled with Zephyr Geodetic antenna fixed on the roof of a concrete building. (b) shows the location of the GNSS benchmarks.
Remotesensing 16 01521 g004
Figure 5. Plot of groundwater level variation in Quetta Valley from 1988 to 2021 shown by 37 monitoring wells. The right image shows the location of the monitoring wells. Source: BID.
Remotesensing 16 01521 g005
Figure 6. Processing workflow diagram of Sentinel-1 using SBAS for subsidence analysis.
Remotesensing 16 01521 g006
Figure 7. Average vertical deformation rates of the Ascending (a) and Descending track (b) derived by the SBAS–InSAR technique. Graph (c) demonstrates the deformation time series of Ascending and Descending tracks shown by the blue circle and red triangle of point P, which corresponds to point P in (a,b). AA′ shows the lithological profile.
Remotesensing 16 01521 g007
Figure 8. Average vertical deformation map of Quetta (a) and Mastung region (b) from December 2015 to December 2022. The GNSS benchmarks (QTIT-QTAG-JHAK-KHAL) and InSAR point (P1) are shown as white dots (a,b). The monitoring wells are represented by the green dots whereas the white lines show the fissures, which are explained in Section 5.
Remotesensing 16 01521 g008
Figure 9. Time series InSAR deformation graph of ASLH-InSAR, KHAL-InSAR, JHAK-InSAR, QTAG-InSAR, QTIT-InSAR, and P1 points from December 2015 to December 2022.
Remotesensing 16 01521 g009
Figure 10. The SBAS-InSAR accumulative subsidence in Quetta and Mastung regions is shown by different colour bands. The temporal range of the total vertical deformation is from 26 December 2015 to 25 December 2022.
Remotesensing 16 01521 g010
Figure 11. Time series graph of GNSS benchmarks from 2006 to 2022. Pre- and post-2016 velocity change can also be observed by the vertical red dashed line.
Remotesensing 16 01521 g011
Figure 12. Correlation of vertical deformation between InSAR (red circle) and GNSS (blue star). The standard deviation between InSAR and GNSS at ASLH, KHAL, JHAK, QTAG, and QTIT is 0.23 cm, 0.74 cm, 2.29 cm, 2.35 cm, and 1.85 cm.
Remotesensing 16 01521 g012
Figure 13. Time sequence photos of progressive damage due to fissure growth over time during the period 2012–2018–2023 at a hospital and adjacent school in the Quetta region.
Remotesensing 16 01521 g013
Figure 14. The geological relationship between subsidence and sediment type. Box (a) displays the lithological logs, while box (b) shows the subsidence profile (B–B′). Box (d) represents the lithological profile (A–A′), and panel (c) is the location map that includes the well logs, lithological profile (A–A′), and the time series profile (B–B′). This map also shows the fissures, represented by black lines. The subsidence areas are displayed by the two red boxes in (b) and (c), while the red arrows indicate the blind thrust faults.
Remotesensing 16 01521 g014
Figure 15. Correlation of time series between InSAR (green circle), and groundwater level variation (blue dots).
Remotesensing 16 01521 g015
Figure 16. Groundwater depletion with the population growth over time.
Remotesensing 16 01521 g016
Disclaimer/Publisher’s Note: The statements, opinions and data contained in all publications are solely those of the individual author(s) and contributor(s) and not of MDPI and/or the editor(s). MDPI and/or the editor(s) disclaim responsibility for any injury to people or property resulting from any ideas, methods, instructions or products referred to in the content.