1. Introduction
Smoke haze events, caused by bushfires, biomass burning, and other sources, have significant impacts on air quality, climate, and public health [
1,
2]. These events are particularly prevalent in Australia, where the country’s unique climate and vegetation, combined with the increasing influence of climate change [
3], have led to an increase in the frequency and severity of these events in recent years [
4] and are set to become even more frequent and intense with climate change [
5]. Accurately monitoring and characterizing smoke haze events is crucial for effective policymaking, public health interventions, and climate modeling [
6,
7].
Smoke haze events have substantial impacts on air quality, with the smoke produced during these events containing a mixture of gases and fine particles that can adversely affect air quality, particularly in urban areas [
8,
9,
10]. Exposure to smoke can cause respiratory and cardiovascular problems, exacerbate pre-existing conditions, and have detrimental effects on vulnerable populations, such as the elderly, children, and people with existing issues [
4,
11,
12].
Furthermore, smoke haze events can influence the climate. Aerosols released during biomass burning events can scatter and absorb solar radiation affecting the Earth’s energy balance [
13]. This contributes to regional and global climate effects, like changes in temperature and precipitation patterns. Additionally, the release of greenhouse gases during biomass burning exacerbates climate change [
14].
Satellite-based aerosol optical depth (AOD) data [
11,
15,
16] and chemical transport modeling (CTM) [
17,
18,
19] are two widely used approaches for monitoring smoke haze events. AOD data provide valuable information on atmospheric aerosol levels. However, AOD data suffer from significant data gaps due to cloud cover, high surface reflectance, and lack of measurements at night. These limitations arise because aerosol retrieval algorithms rely on solar/SW bands [
19,
20]. CTMs rely on precise input data, encompassing emission sources, meteorological information, and the detailed consideration of atmospheric chemistry and aerosol dynamics. These elements are fraught with uncertainties that can significantly impact the model’s accuracy and reliability. [
18].
To improve the accuracy and reliability of smoke haze monitoring, this study aims to blend AOD data from multiple satellite sources, including Himawari-8 AOD data provided by the Japan Aerospace Exploration Agency (JAXA), the Copernicus Atmosphere Monitoring Service [
21] (CAMS) [
6,
17,
19,
20], and CTM data from the CSIRO model to monitor smoke haze events in Australia [
22]. We evaluate the performance of the blended dataset [
23] and compare it to individual AOD and CTM datasets.
The objectives of this study are outlined as follows:
Characterize smoke haze events in Australia using AOD data and CTM simulations.
Evaluate the strengths and limitations of both AOD data and CTM simulations in accurately representing smoke haze events.
Propose a hybrid approach combining the strengths of AOD and CTM for a more accurate and reliable representation of smoke haze events.
Building on these objectives,
Section 1.1,
Section 1.2 and
Section 1.3 delve into the methodological backdrop essential for understanding the complexity of monitoring and simulating smoke haze events. These sections are designed not only to present the challenges and existing methodologies but also to set the stage for the introduction of our proposed hybrid approach, directly stemming from the outlined aims.
1.1. Challenges of Monitoring Smoke Haze Events Using AOD and CTM
The accurate monitoring of smoke haze events is a complex endeavor due to the spatiotemporal dynamics of these events, the variety of their sources, and the intricate atmospheric processes influencing aerosol concentrations [
24,
25]. This complexity underscores the necessity for innovative approaches that transcend the limitations of conventional methods, as emphasized by our study’s aims. AOD data from satellite sources can provide valuable information on the amount of aerosols present in the atmosphere. However, AOD data suffer from significant data gaps due to cloud cover, high reflectance, and lack of night-time measurements [
26].
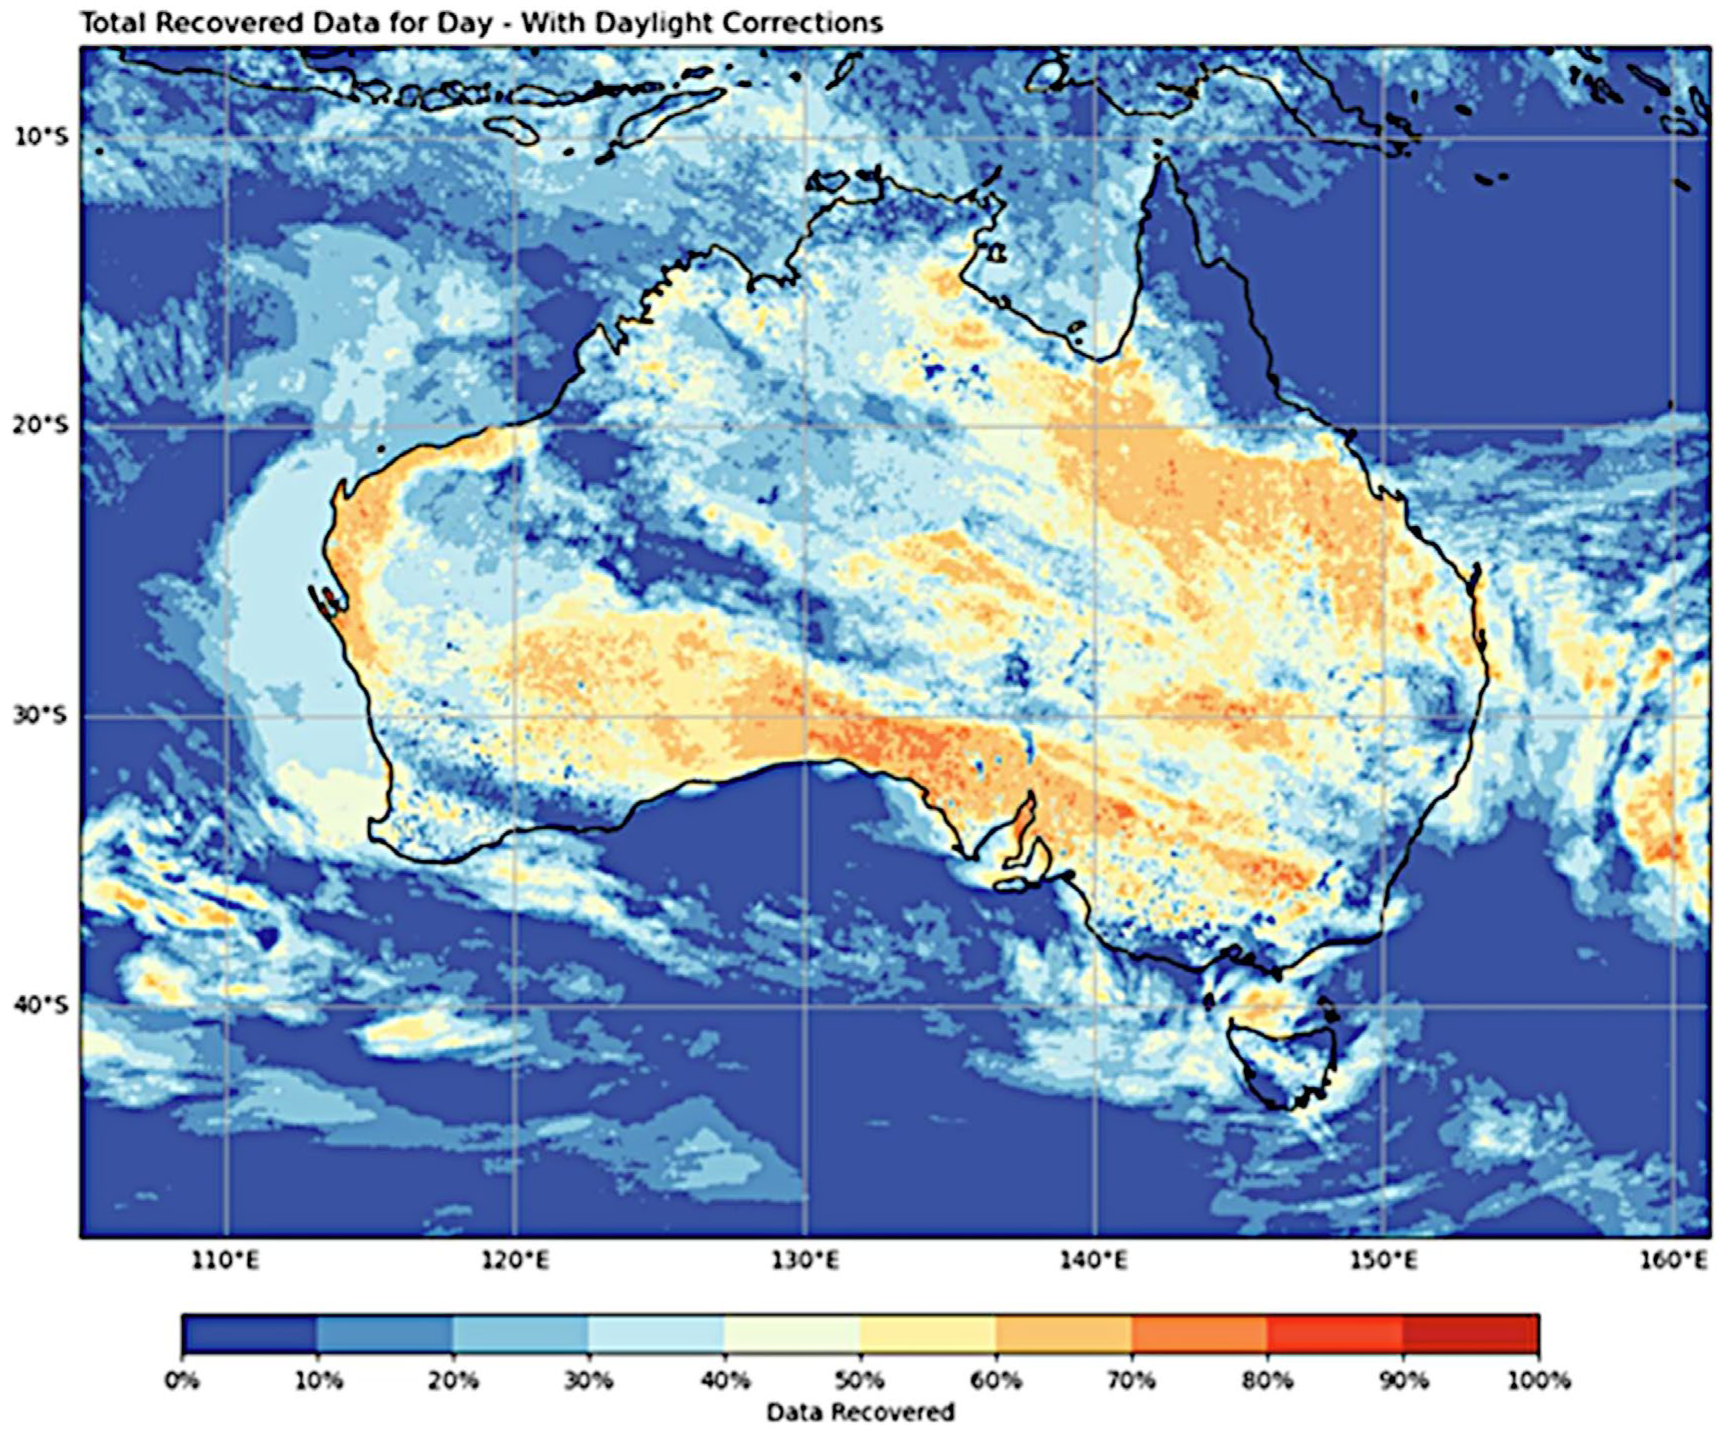
In our analysis of the AOD data provided by the Japanese Aerospace Exploration Agency (JAXA), we calculated a data recovery rate of approximately 32% (
Figure 1) across the study period, during the daytime. This is based on the simple count of non-missing observations in the NetCDF data file during daylight hours, as AOD assessments require visible spectrum reflectance. This low data recovery rate is indicative of the limitations of AOD data in detecting aerosols under certain conditions. The bias due to high reflectance over central Australia, the high incidence of cloud cover and smoke saturation, and the null solar reflectance during night-time measurements all contribute to the lack of data recovery [
27]. These limitations highlight the need for complementary approaches, such as CTM, to monitor smoke haze events accurately [
28,
29].
1.2. CTM Modeling
CTM modeling is a technique that has been developed to simulate the transport and transformation of atmospheric pollutants using mathematical equations that represent atmospheric processes [
30,
31]. CTMs have been widely used to simulate the behavior of air pollutants and their effects on the environment and human health. CTMs use a combination of meteorological data and emission inventories to predict the concentration and distribution of pollutants in the atmosphere. The output of the model is usually a map of pollutant concentrations over a specific period and spatial domain.
In the context of smoke haze events, CTMs can be used to predict the transport and dispersion of smoke particles in the atmosphere, as well as their transformation and removal by atmospheric processes such as dry and wet deposition. CTMs have been used to simulate the behavior of bushfire smoke in Australia, and they have been found to be useful in predicting the transport and dispersion of smoke plumes.
We further elucidate the challenges in employing CTMs, highlighting that their accuracy hinges on multiple factors: the quality and resolution of input data, the model’s complexity, and the precise representation of atmospheric processes including meteorology, atmospheric chemistry, and aerosol behavior. Specifically, in scenarios such as smoke haze events, the model’s precision is especially contingent upon the accuracy of emission inventories—often derived from assumptions and sparse field data—and the comprehensive integration of meteorological data alongside atmospheric chemistry and aerosols, which collectively face uncertainties due to their intricate nature and the limitations of available measurements.
1.3. Hybrid Approaches
Given the limitations of AOD data and CTM modeling, hybrid approaches that combine the strengths of both methods have been proposed to improve the accuracy and reliability of smoke haze monitoring [
32,
33,
34]. These hybrid approaches usually involve the assimilation of AOD data into CTMs to provide more accurate initial conditions for the model, which can then be used to simulate the transport and dispersion of smoke particles in the atmosphere.
One approach has been to use daily statistical summations of AOD values as an estimate of the aerosol plume locations [
28] and then use the CTM to estimate the concentration of smoke particles in the plume [
17]. This approach has been shown to improve the accuracy of smoke plume estimates, particularly in regions where AOD data are sparse or missing [
20]. Another approach is to use data assimilation techniques to integrate AOD data into CTMs, which can improve the accuracy of model predictions by reducing uncertainty in the initial conditions and improving the representation of atmospheric processes [
35,
36,
37].
2. Materials and Methods
2.1. Study Area
The study area for this research was Australia, a region susceptible to frequent smoke haze events due to bushfires, other forms of biomass burning activities, and dust storms. These smoke haze events not only have significant impacts on air quality but also on climate and public health. This makes their monitoring and characterization critical for effective mitigation strategies.
Australia’s diverse topography and vegetation play a crucial role in the occurrence and behavior of smoke haze events. The country’s landscape includes a wide range of ecosystems, such as tropical rainforests in the north, temperate forests in the southeast and southwest, extensive grasslands, and the vast arid interior, which comprises most of the landmass. The vegetation in these areas varies in flammability and potential for fuel load, influencing the likelihood and intensity of fires.
The spring and summer of 2019 were particularly devastating, with widespread dust plumes and drought affecting central and southern Australia. These dust events were primarily driven by strong winds, extended periods of drought, and land-use changes, which mobilized large amounts of dust particles into the atmosphere. The arid landscape of central Australia, characterized by sparse vegetation and vast expanses of loose soil, facilitated the formation and transport of dust plumes during these events.
The wildfires that burned from October 2019 to March 2020, often referred to as the “2019/2020 Black Summer”, were some of the most severe in Australia’s history, leading to significant loss of life, property, and ecosystems [
4]. The fires were particularly intense due to the combination of extreme heat, drought conditions, and strong winds, which allowed the fires to spread rapidly and generate large amounts of smoke. The varied vegetation types across Australia, including eucalypt forests with high oil content in their leaves, contributed to the intensity of the fires and the resulting smoke production.
The smoke from these fires also had regional and global implications, with the transport of smoke particles affecting atmospheric circulation and the Earth’s radiation budget. The resulting impact on climate and public health highlights the need for the accurate monitoring and characterization of smoke haze events in Australia [
4].
2.2. Data Sources
In this study, we employed AOD data from the JAXA, CAMS, and CSIRO datasets to characterize smoke haze events over Australia. The JAXA dataset provides daily AOD data produced from AHI (Himawari) with a spatial resolution of 0.05 degrees (~5.6 km) and is a research product developed by the Japan Aerospace Exploration Agency (JAXA) and the National Institute of Environmental Studies (NIES) [
38]. In contrast, the CAMS dataset provides daily AOD data with a spatial resolution of 0.4 degrees (~40 km) and the CSIRO dataset provides AOD data generated from a global chemistry transport model (CTM) with a spatial resolution of 0.08 degrees (~8 km).
AOD data from JAXA (accessed 8 September 2022) and CAMS (accessed on 22 November 2022) were obtained through data portals from the respective sources, while the CSIRO dataset was provided directly by the CSIRO AQFx modeling team. The AQFx project (Air Quality Forecasting) is a system designed to provide improved air quality forecasts for Australia, using advanced atmospheric chemistry, aerosol modeling, and data assimilation from satellite and ground-based observations.
In response to the catastrophic “Black Summer” wildfires of 2019/2020, our study focused on a critical six-week period from 5 December 2019 to 17 January 2020. This timeframe was selected due to its representation of the peak intensity and widespread impact of the fires, as confirmed by the CSIRO dataset covering the entire Australian continent. Our analysis primarily utilized AOD data to assess smoke haze events and validate our CTM modeling approach, aiming to establish a foundation for future, more extensive applications of our methodology. Despite the brief duration, this period’s significance and the severity of the events it encompasses provide valuable insights into the behavior and impact of smoke haze, supporting the confidence in our results and the methodologies developed.
2.3. Pre-Processing of AOD Data
To ensure uniformity in spatial resolution across the datasets, we employed bilinear interpolation to a common 0.08-degree grid. We assumed that the AOD wavelengths ranging from 550 nm to 532 nm would introduce minimal differences, that the datasets were all pre-processed by the external providers, and that they were assumed to be of a high standard with no cleaning required besides sub-setting the parameters of interest.
2.4. Chemical Transport Model (CTM) Data
The Commonwealth Scientific and Industrial Research Organization (CSIRO) have developed a Chemical Transport Model (CTM), which is used by CSIRO and research partners to model the transport, dispersion, deposition, and chemical transformation of airborne pollutants [
39]. A summary of the science modules is given by the World Meteorological Organization [
40] and can also be compared with other commonly used CTMs.
In this study, the approach involves the use of the Bureau of Meteorology (BoM) Australian Community Climate and Earth-System Simulator (ACCESS) weather forecasts and the CSIRO CTM. ACCESS provides a prediction of meteorological fields including temperature, wind velocity and direction, water vapor mixing ratio (including clouds), radiation, and turbulence [
41]. The CTM is configured with the Carbon Bond V chemical transformation mechanism for gas phase species, the Global Model of Aerosol Processes for aerosol dynamics [
42], the Volatility Basis Set for treating semi-volatile organic aerosol [
43], and ISORROPIA (a thermodynamic equilibrium model) for the treatment of secondary inorganic aerosols. Natural and anthropogenic aerosols (primary and secondary) are included in the simulations. Natural sources include sea salt aerosols, wind-blown dust, primary aerosols from fires, and secondary organic aerosols formed by oxidation of organic compounds emitted from vegetation and ambient fires [
44,
45,
46,
47]. Major sources of anthropogenic emissions include industry, commercial, motor vehicle, and domestic wood heaters.
The CTM has been applied to many applications involving air quality in an Australian context, but its main use is to run short-term forecasts (coupled to the Australian Bureau of Meteorology weather forecasts) for the dispersion of smoke and particulates from bushfires and prescribed burning [
39].
The accuracy of CTMs is subject to several factors. In the case of smoke events, the CTM is particularly sensitive to the fire emission data which are often based on limited field observations. The accuracy of CTMs is also affected by the quality of the meteorological data used to drive the model.
2.5. CAMS Global Modeling from ECMWF
The Copernicus Atmosphere Monitoring Service (CAMS) is a service provided by the European Centre for Medium-Range Weather Forecasts (ECMWF) that offers comprehensive information on the composition and evolution of the Earth’s atmosphere. CAMS uses a global CTM, the Integrated Forecasting System (IFS), which simulates the evolution of chemical species and aerosols in the atmosphere. The IFS model includes detailed representations of atmospheric processes, such as aerosol formation and transport, cloud formation, and precipitation.
The CAMS forecast dataset provides daily AOD data generated from the IFS model with a spatial resolution of 0.4 degrees at a 550 nm wavelength. The data include AOD values and the vertical distribution of aerosols in the atmosphere. The aerosol types considered in the model include sulphate, organic carbon, black carbon, sea salt, and mineral dust. The CAMS dataset is complemented by satellite observations from various sensors, such as MODIS, VIIRS, and the CALIOP lidar, to provide a blended dataset with improved accuracy [
21].
The CAMS dataset has been widely used in various studies to understand the impact of aerosols on air quality, climate change, and public health. The CAMS dataset is freely available through the Copernicus Climate Change Service (C3S) Climate Data Store (CDS) (
https://cds.climate.copernicus.eu/, accessed on 22 November 2022).
2.6. AERONET and Ground-Level Concentrations
The Aerosol Robotic NETwork (AERONET) is a global network of ground-based sun photometers that measure the optical properties of aerosols in the atmosphere, including aerosol optical depth (AOD), at high temporal resolution [
29,
48]. AERONET provides high-quality, well-calibrated data that can be used to validate and improve satellite-based AOD retrievals and CTM simulations.
AERONET provides a ground-based measurement system for aerosols, offering high-quality data that can validate and improve both satellite-based AOD retrievals and CTM simulations. In this study, AERONET data were initially considered for validation but were ultimately not utilized due to insufficient active sites during the study period. We obtained the AERONET data from the AERONET website (
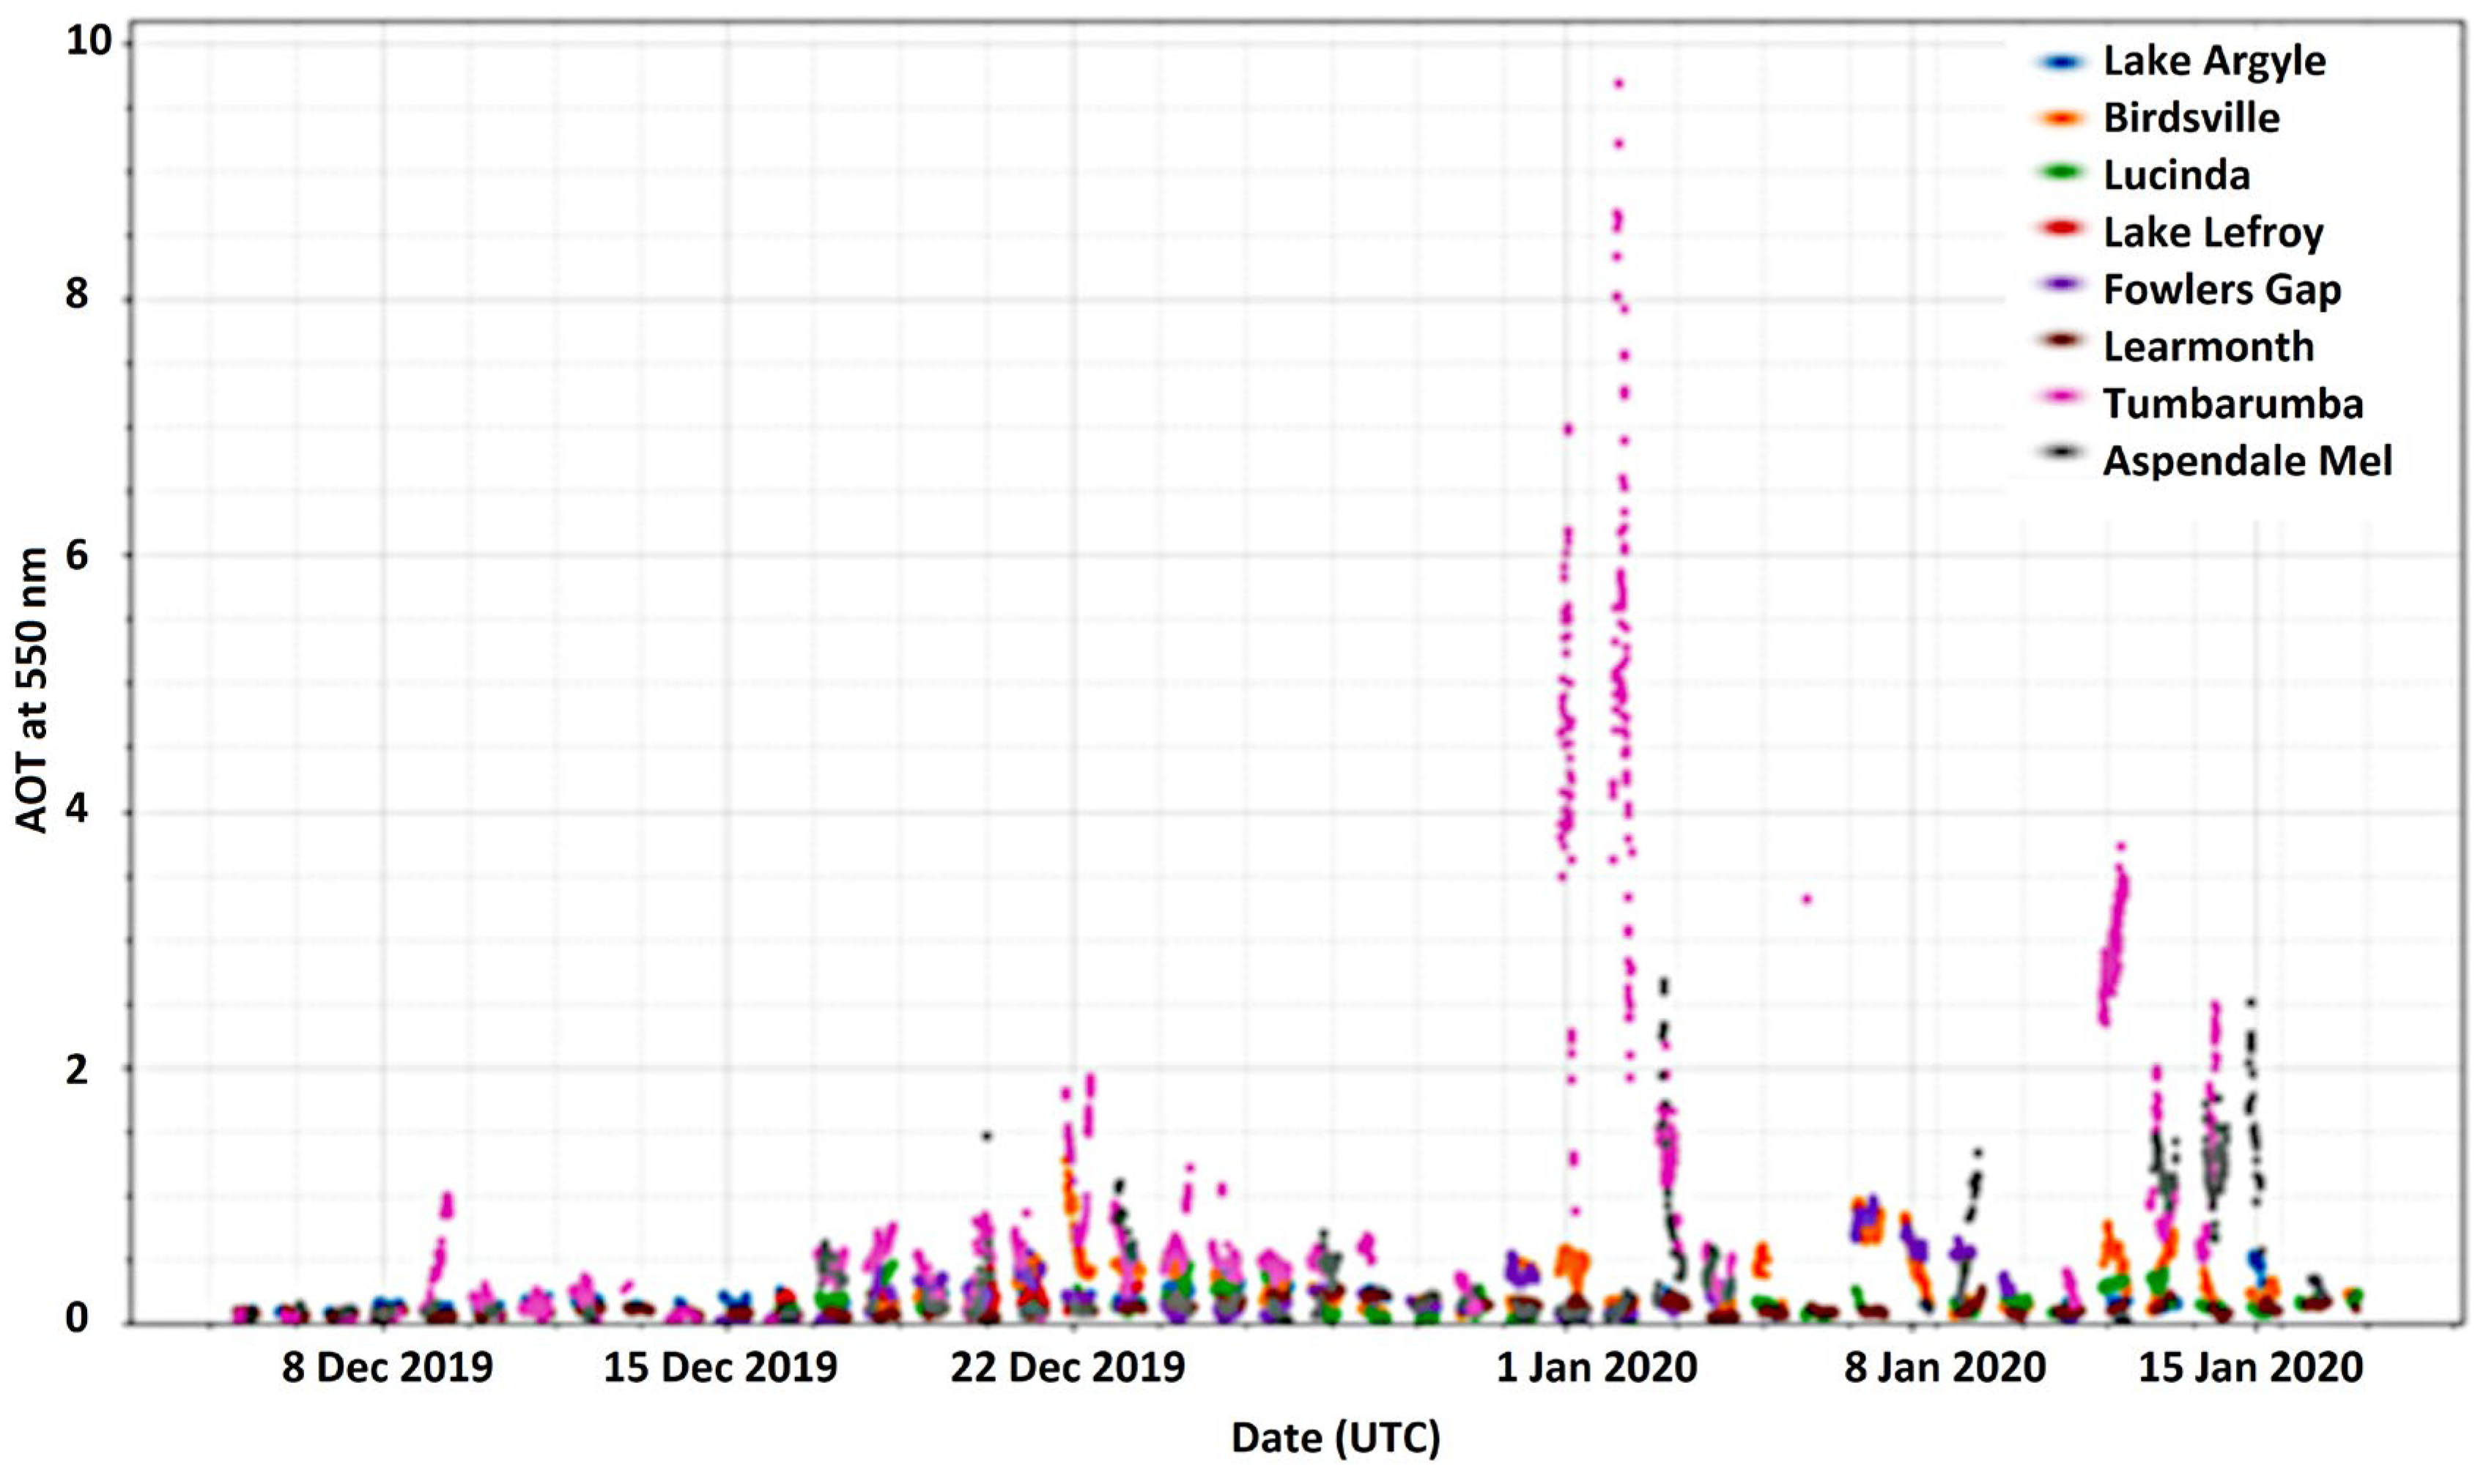
https://aeronet.gsfc.nasa.gov/, accessed 20 January 2023), which covered the period from 5 December 2019 to 17 January 2020. However, most of the AERONET sites in the region were inactive during this period and only one site (Tumbarumba) showed significant AOD levels, and as a result, we did not interpolate the data across the study area.
Similarly, in the study, ground-level concentrations (GLCs) of particulate matter from accredited air quality monitors were considered as a potential source of data. However, GLCs were not used due to the large grid size of 8 × 8 km
2, which makes Kriging an inappropriate method when meteorological and topographic factors are excluded. Kriging is a geostatistical interpolation technique that uses surrounding data points to estimate values at unsampled locations. However, Kriging is not suitable for some situations where the data do not meet certain assumptions. If the data show rapid or non-linear changes over space, such as near a mountain or an emission source, Kriging may not be accurate. Furthermore, Kriging assumes that the data are isotropic, meaning that the spatial relationships between data points are the same in all directions. If the data vary with direction, due to terrain features such as a valley or a river, Kriging may not be reliable. Another assumption of Kriging is that the spatial dependence between data points is only related to their distance and not to other factors. If the covariate assumption changes, such as when other variables affect the distribution of the data, Kriging may not be effective [
49,
50].
Moreover, converting column AOD data to GLCs can be challenging due to the complex relationship between aerosol optical properties and ground-level concentrations. This is because the relationship between AOD and surface concentration depends on a range of factors, including aerosol size distribution, vertical distribution, and chemical composition, which can vary spatially and temporally. In addition, the conversion from column AOD to GLCs involves several assumptions and uncertainties, such as the vertical distribution of aerosols and the aerosol properties used in the conversion algorithm.
Therefore, although GLCs were considered as a potential source of data, their use was deemed inappropriate due to the large grid size and the complexities involved in converting column AOD data to GLCs. The study instead focused on satellite-based AOD data, which provided a more reliable and consistent source of data for characterizing smoke haze events over Australia.
2.7. Assessing Smoke Haze Events in Australia Using Blended AOD Data
This study aimed to assess the recovery of aerosol optical depth (AOD) data for monitoring smoke haze events in Australia during the period from 5 December 2019 to 17 January 2020, using the CSIRO dataset. The average data recovery for the study area was approximately 34%, and several approaches were employed to ensure the accurate characterization of smoke haze events. These approaches included analyzing the total AOD data, dividing the study area into different sub-regions, and using an 80:20 land-based validation approach. However, the field statistics indicated a poor assessment in spatial comparison. For more robust statistical results, it is recommended to employ log-transformations of the data and to exclude background levels of AOD.
Daily statistical metrics were used to evaluate the reliability and accuracy of each dataset in representing smoke haze events. However, the field statistics achieved a poor assessment of the spatial comparison, and potential limitations of the daily statistical metrics were discussed. For robust statistical outcomes, it is advisable to exclude background aerosol optical depth (AOD) levels. This stems from the non-normal distribution of air pollution data, necessitating a log-transformation for normalization. Additionally, a majority of measurements pertain to background levels, rendering models focused solely on these levels notably unreliable. Consequently, for precise detection and quantification of noteworthy occurrences, the log-transformation of data and elimination of background events are imperative in assessing the predictive capacity of the model to discern significant events [
51]. Visual comparison using spatial maps provided a more comprehensive assessment of the dataset’s performance in capturing smoke haze events.
To enhance the accuracy and broaden the coverage of AOD data for the analysis of smoke haze events in Australia, a blending method was adopted that combines the strengths of the JAXA, CAMS, and CSIRO datasets. This method employs a weighted average, where uncertainties associated with each dataset are determined by the square of their field correlation, analyzed on a pixel-by-pixel basis. The weighting formula, 1 − Ri2/Rtotal2, is applied to the CAMS and CTM datasets, where Ri denotes the individual correlation coefficients for CAMS/JAXA and CTM/JAXA. This approach provides a refined and nuanced representation of each dataset’s contribution to the collective AOD analysis, ensuring a more accurate and comprehensive evaluation of aerosol optical depth across different regions.
The frequency, intensity, and duration of smoke haze events were calculated based on the blended AOD dataset to assess the events’ occurrence in Australia. A case study was conducted on 10 December 2019, a day with significant smoke haze events across the country. Additional analyses were conducted focusing on land and sea surfaces, high and low AOD levels, and daily maximum and average AOD values to further validate the blending approach and ensure its applicability across various surface types and AOD levels.
Overall, the methodology used in this study provides a comprehensive approach to assess and characterize smoke haze events in Australia, with a focus on improving the accuracy and coverage of AOD data using a blending approach. The study’s findings provide valuable insights into the monitoring and management of smoke haze events in Australia, particularly in the context of climate change and public health.
3. Results
3.1. AOD Data Recovery
Despite the widespread bushfires that occurred across Australia on 10 December 2019, the study observed a notable discord between high aerosol concentrations and data recovery rates. The analysis of AOD data recovery revealed a maximum data recovery of 44.6% and an average recovery of 15.5% (or 84.5% missing AOD) over the entire grid (
Figure 1). These percentages underscore the inherent limitations in employing AOD metrics to accurately characterize smoke haze events, as incomplete or missing data can lead to inaccurate characterizations. The low recovery of AOD data can be attributed to factors such as cloud cover (≈+30%), night-time measurements (≈50% day/night), and measurements below detection limits or saturation (detected as cloud). The study addressed these challenges by considering daily maxima and average statistics in the evaluation of the blending, rather than relying on ten-minute or hourly analyses with lower data recovery rates.
However, another challenge of validating satellite-based AOD data is the lack of ground-based observations, especially in remote regions. Although this is not technically a data recovery issue, it does contribute to the low data recovery. In Australia, the AErosol ROboTic NETwork (AERONET) provides high-quality, well-calibrated AOD measurements from ground-based sun photometers. However, as
Figure 2 shows, the AERONET sites in Australia are sparse and unevenly distributed, with only one site (Tumbarumba) having significant AOD measurements during the study period. This limits the ability to compare and evaluate the satellite-based AOD data and CTM simulations over Australia.
3.2. Statistical Evaluation of Datasets
To evaluate the performance of AOD data and CTM modeling in characterizing smoke haze events, the daily maximum and average AOD values were analyzed from the JAXA, CAMS, CSIRO, and blended datasets.
Table 1 presents the daily statistical metrics, including mean, standard deviation, root mean square error (RMSE), and correlation, for each dataset and their comparison with the blended dataset.
The daily statistical metrics provide insights into the dependability and precision of individual datasets in capturing occurrences of smoke haze. Nonetheless, the inclusion of smoke plumes exhibiting elevated AOD values can introduce bias to the daily average, maximum, and standard deviation values, complicating the accurate spatial comparison of datasets using field statistics. To tackle this challenge, the data were partitioned into subsets considering land/sea categorization, high and low AOD classifications (as determined by JAXA), and a training–validation arrangement. These measures were intended to neutralize potential biases and facilitate a more accurate dataset comparison. Of these classifications, the most significant was the background/incident classification (i.e., AOD ≥ 1). It was observed that the CSIRO dataset, and thereby the blended dataset, consistently overpredicts AOD during smoke events based on comparing means and RMSE. The overestimates of emissions or inaccurate source profiles may be to compensate for potential lower initial model concentrations, and the blended dataset is thus invaluable for reducing initial concentrations in subsequent CTM runs, i.e., the blended product enhances the next periods’ dataset.
The CSIRO dataset outperforms the other individual datasets in capturing the variability (standard deviation) of the smoke haze events. The variability of the JAXA dataset is comparable to the CAMS dataset for different reasons—the JAXA dataset suffers from missing data, while the coarse resolution of the CAMS data has limited the variability. In this regard, the CSIRO dataset captures the variability of the smoke incidents better, although the magnitude of the estimate is predicted too high.
By incorporating the strengths of each dataset and compensating for their limitations, the combination of AOD data and CTM modeling provides a more accurate and reliable representation of smoke haze events in Australia. Moreover, the visual comparison of AOD data and CTM modeling using spatial maps provides a more comprehensive assessment of the performance of the datasets in capturing smoke haze events, which should be conducted to supplement the daily statistical metrics and provide a more accurate and comprehensive evaluation of the dataset’s reliability and accuracy in characterizing smoke haze events.
3.3. Taylor Plots
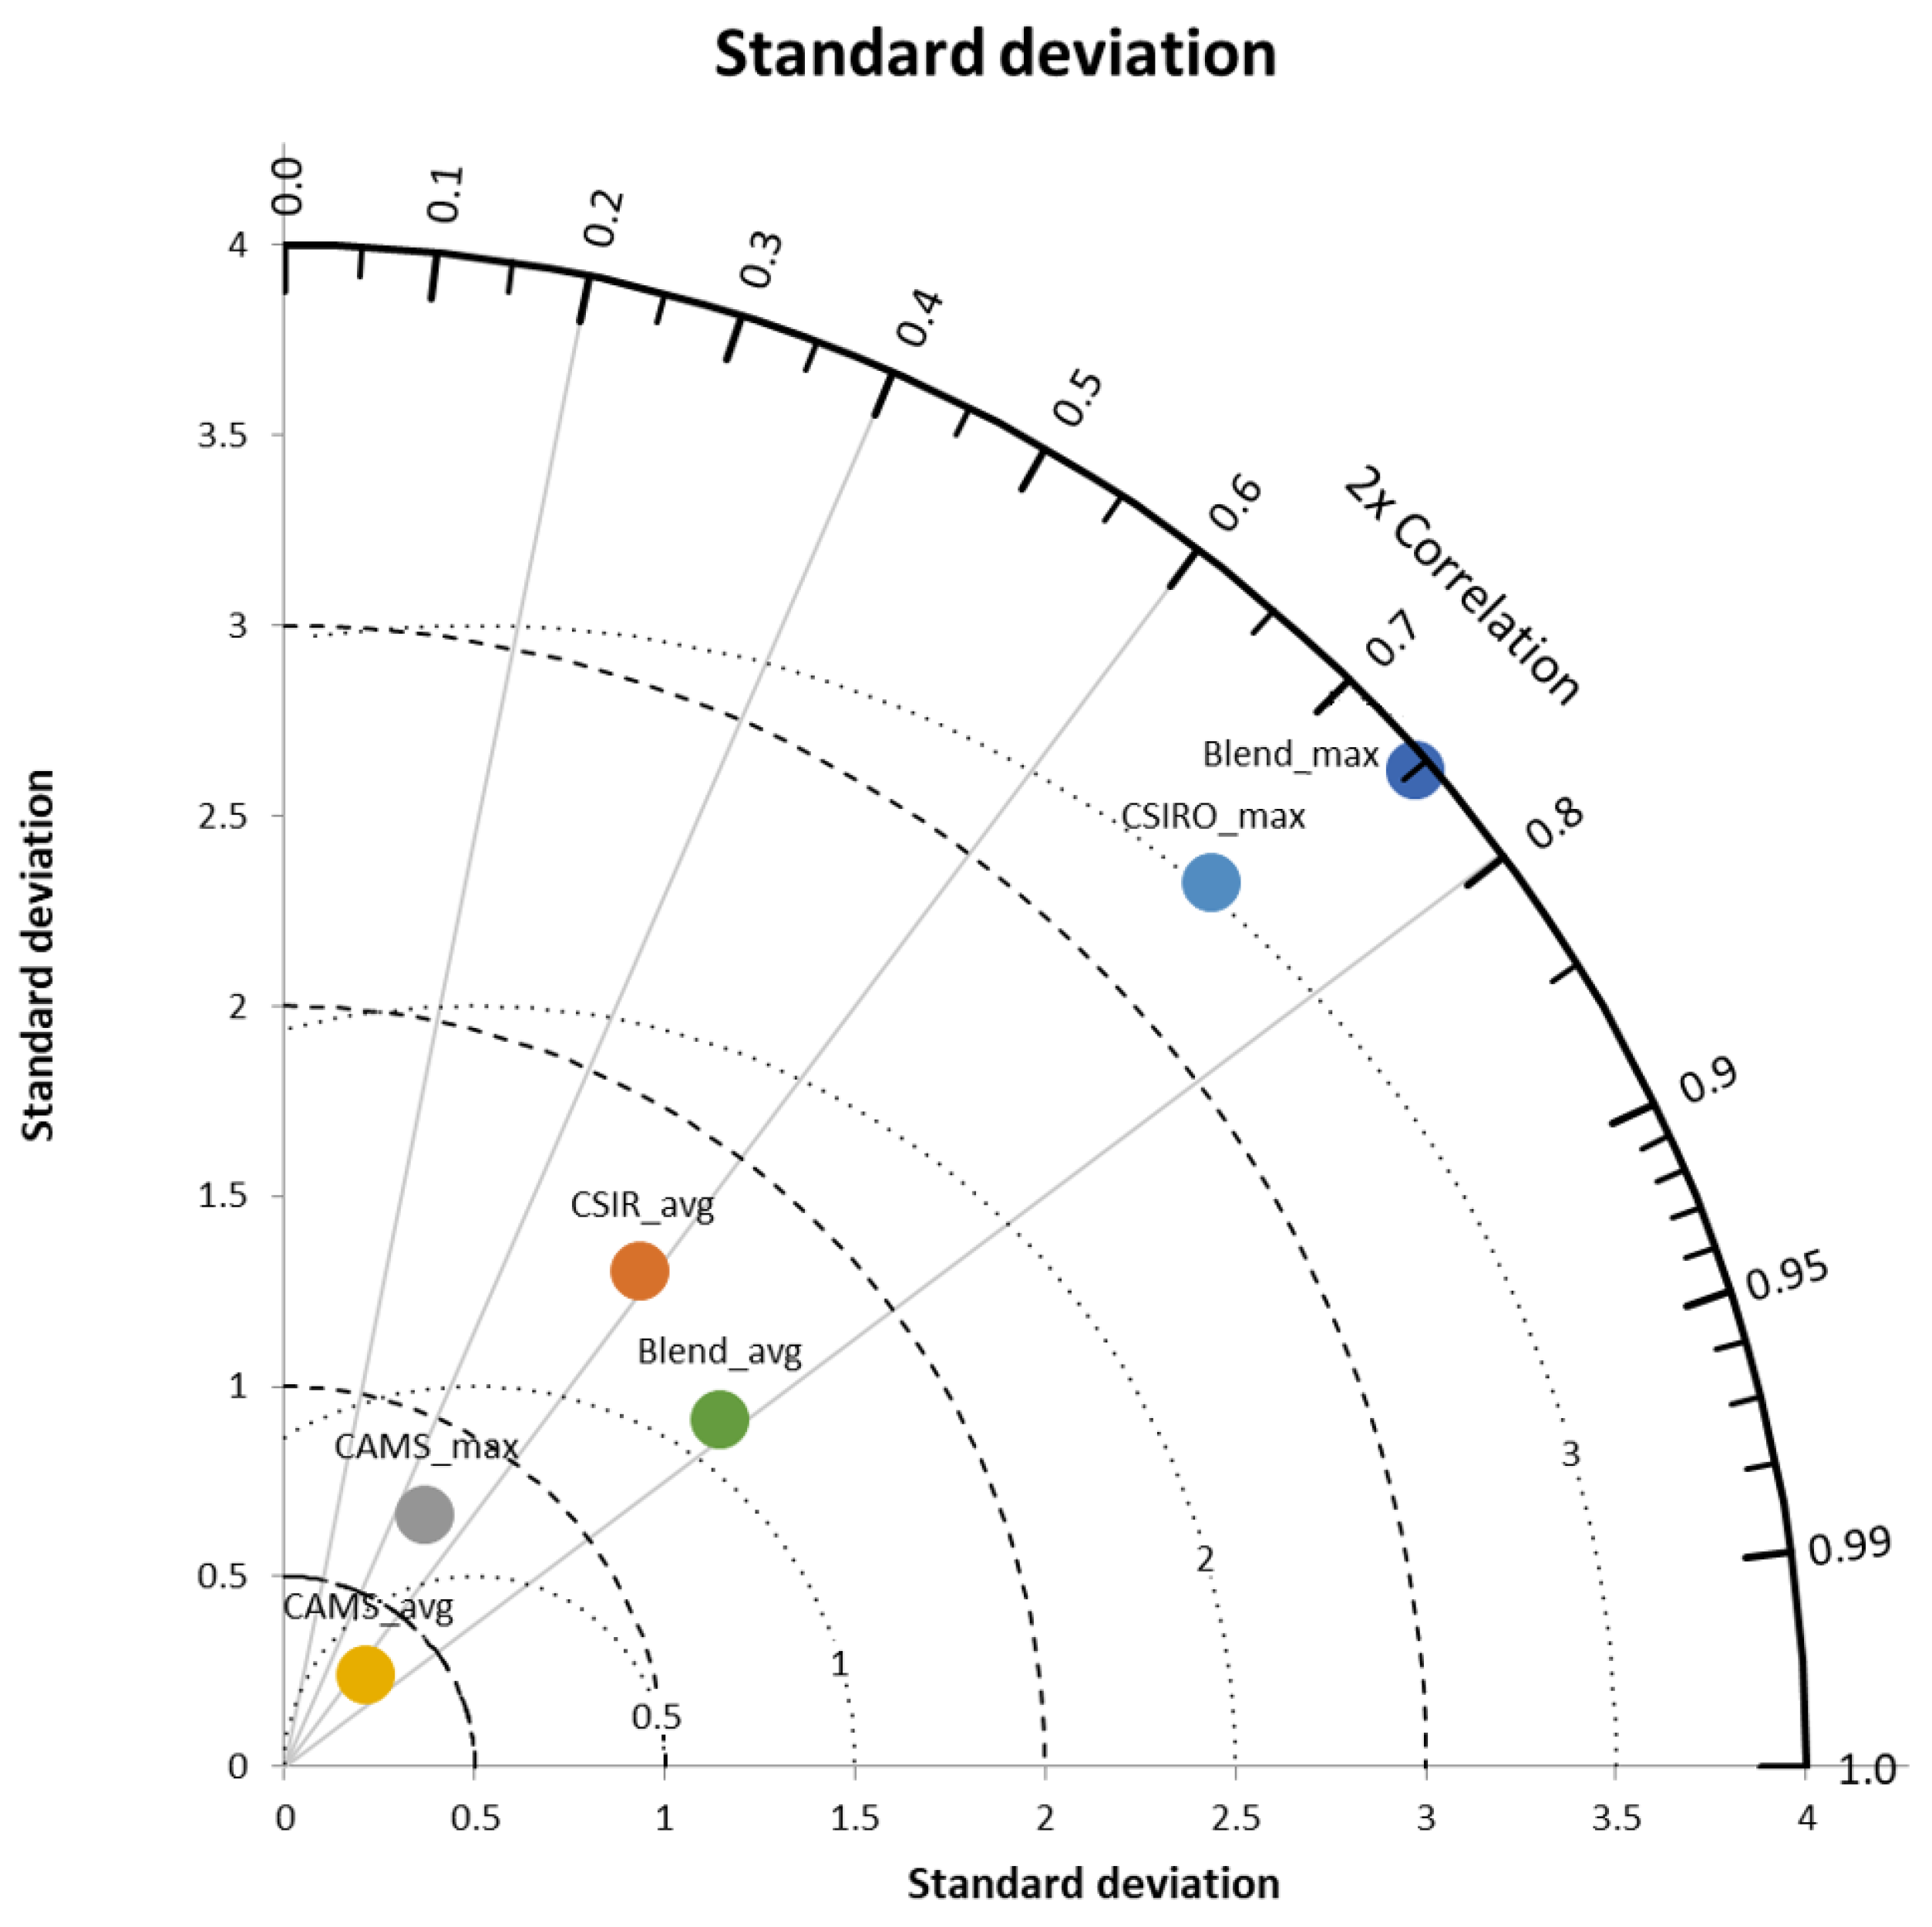
Taylor diagrams were utilized to offer a graphical comparison between the individual and blended datasets. The accuracy of the blended dataset was evaluated by comparing it with three individual datasets (CAMS, CSIRO, and JAXA). A Taylor diagram is a mathematical diagram designed to graphically indicate which of several approximate representations (or models) of a system, process, or phenomenon is most realistic [
52]. The Taylor diagrams for each dataset are shown in
Figure 3, which illustrates the correlation coefficient, root mean square difference (RMSD), and standard deviation of each dataset. The results of the Taylor diagram indicate that the CAMS daily maxima are the best for extrapolating smoke incidents (where AOD ≥ 1), as they exhibit the highest correlation coefficient and lowest RMSD. The CSIRO dataset overpredicts the smoke incidents, resulting in large variability in the data. Both the JAXA and CAMS datasets show relatively little variability and are about 0.75 for the daily maximum and 0.5 for the daily average.
The Taylor plot reveals that CAMS daily maxima are the most appropriate dataset for extrapolating smoke incidents but may not adequately capture the magnitude of severe smoke incidents (saturation). Nonetheless, it is essential to consider the limitations of each individual dataset when interpreting the outcomes and to rescale or normalize the final concentrations as needed. This is because the magnitude of the blended output may be too high despite the increased accuracy in location.
3.4. Spatial Distribution of Aerosols
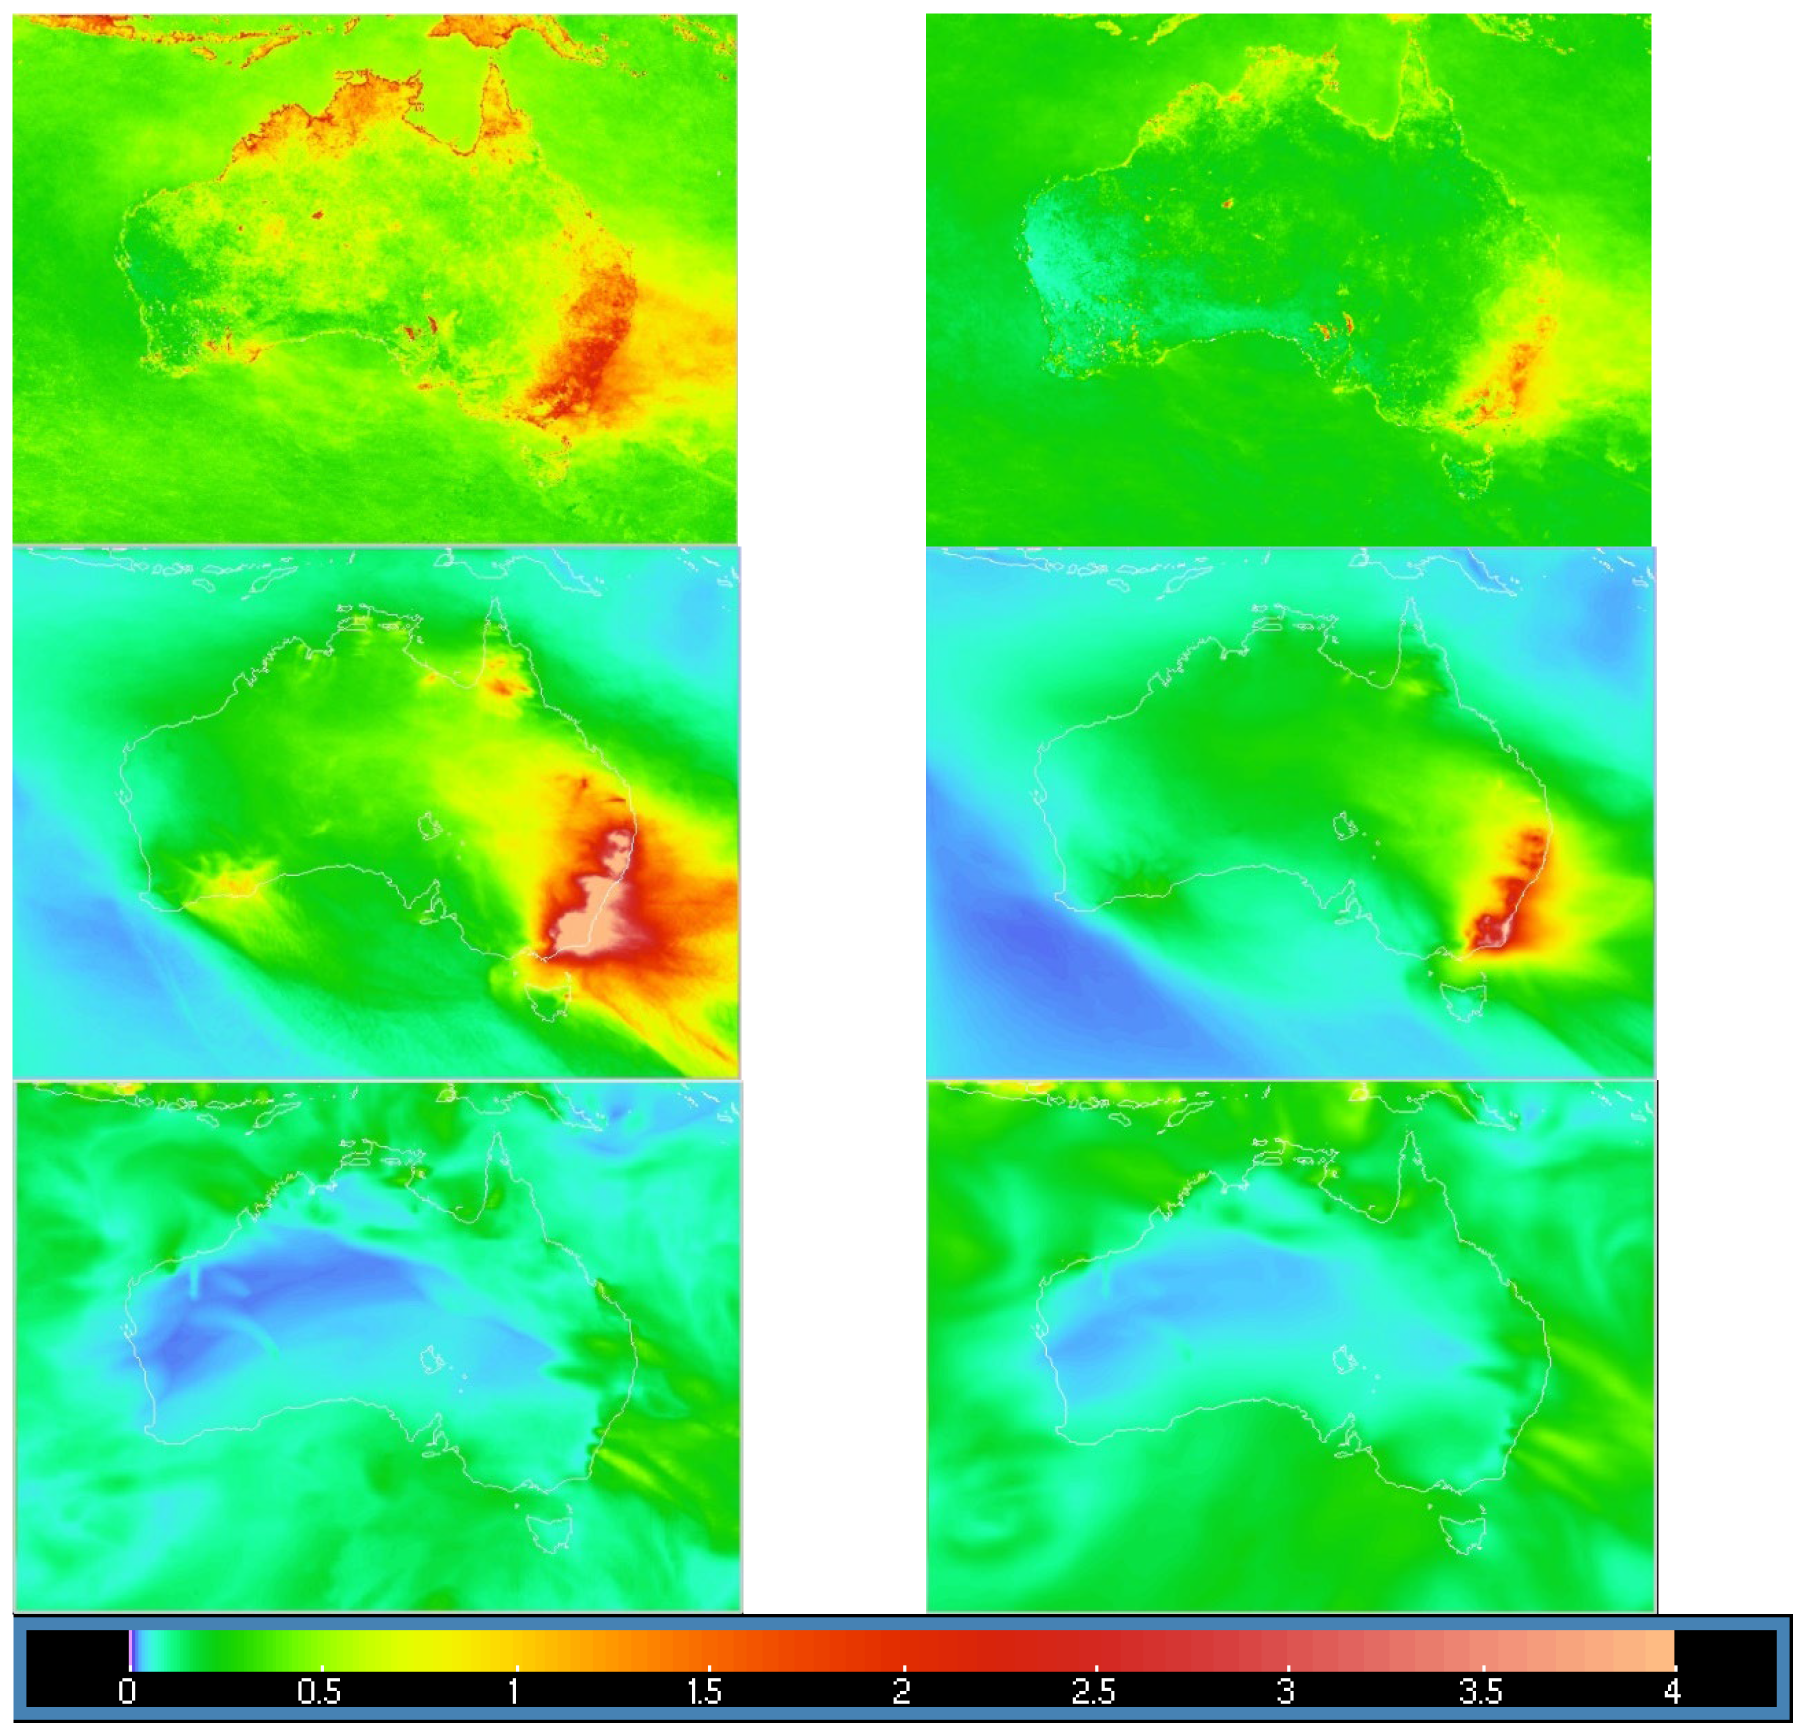
The spatial distribution of aerosol optical depth (AOD) across different datasets was meticulously analyzed to evaluate each dataset’s reliability and accuracy in characterizing smoke haze events. This assessment is crucial, given the absence of a singular “true” AOD dataset for direct comparison. The JAXA dataset, derived from satellite observations, plays a pivotal role in our analysis. Despite its limitations—such as potential inaccuracies due to atmospheric conditions or satellite sensor constraints—it reliably captures the spatial variability of AOD, offering a comparative basis for evaluating other datasets and the efficacy of our blending approach.
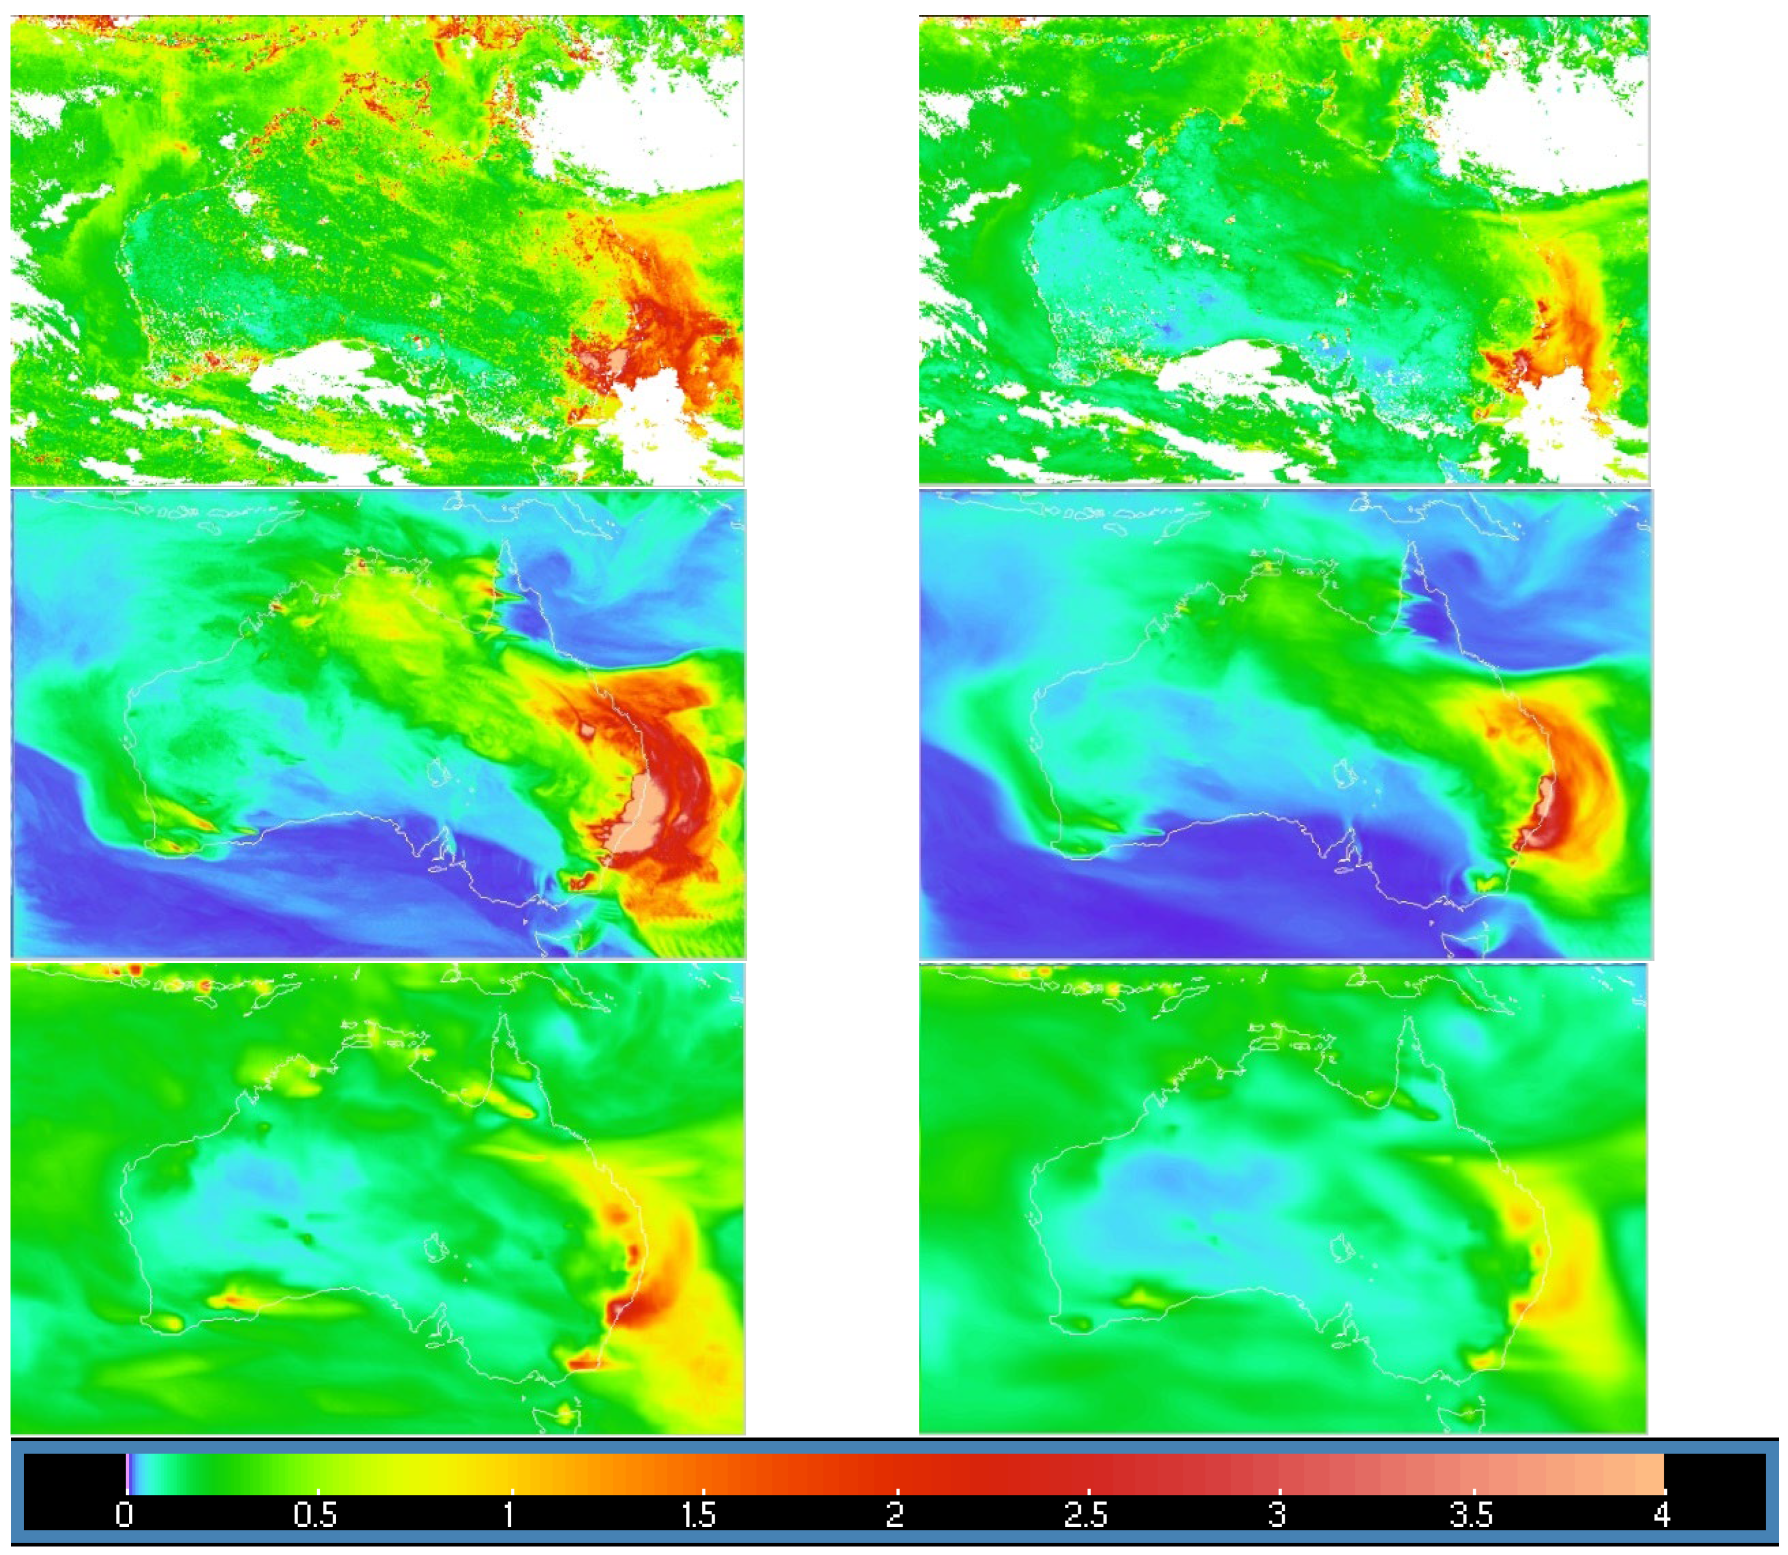
Figure 4 and
Figure 5 elucidate the AOD spatial distribution throughout the study period and on the specific date of 10 December 2019, respectively. These visual aids highlight the CSIRO dataset’s tendency to overestimate AOD in the southeast while underestimating it in the northeast, likely due to an emphasis on densely populated areas in the emissions inventory, where data for validation are more abundant. In contrast, the spatially coarser and globally focused CAMS dataset tends to exhibit lower AOD values across Australia, potentially smoothing over the details of localized smoke plumes. This discrepancy underscores the CSIRO CTM’s calibration towards regions known for significant wildfire smoke, aiming to accurately reflect the high ground-level concentrations recorded during the fire events.
Our blending methodology seeks to amalgamate the strengths of the individual datasets—JAXA’s detailed observational accuracy, CTM’s emission-driven modeling insights, and CAMS’s comprehensive, though coarser, global perspective. This process not only aims to bridge the gap between observational and modeled AOD values but also strives to refine the spatial depiction of aerosols by improving dataset correlation through a weighted average method. The resultant blended dataset is posited to provide a more balanced and detailed portrayal of smoke haze events, capturing the spatial distribution of aerosols with greater fidelity than any single dataset.
However, we acknowledge the inherent challenge in asserting the definitive accuracy of our findings without a universal AOD reference. Therefore, our analysis is predicated on the complementary integration of these diverse datasets, leveraging their collective strengths to surmount individual limitations. This strategy enhances our understanding of smoke haze dynamics, offering a nuanced view that is likely more representative of actual conditions than any standalone dataset.
In conclusion, while direct comparisons with a “true” AOD dataset are not feasible, the relative distribution of high and low AOD values observed in the JAXA dataset, coupled with the analytical depth of the CTM and the broad perspective of CAMS, underpins our confidence in the blended dataset. This approach not only compensates for the individual datasets’ limitations but also contributes to a more comprehensive and accurate assessment of smoke haze events.
This comprehensive visualization elucidates the unique contributions of each dataset towards understanding the smoke haze events.
The JAXA dataset, with its precision in location accuracy, effectively pinpoints areas of significant aerosol concentration, offering vital insights into the spatial extent of smoke coverage.
The CSIRO dataset, finely tuned to reflect the magnitude of AOD, particularly in densely populated areas and regions prone to intense wildfire activity, reveals areas where aerosol levels are markedly high, underscoring the dataset’s sensitivity to capturing severe smoke events.
In contrast, the CAMS dataset, characterized by its coarser spatial resolution, provides a broader perspective on background aerosol amounts, because of the larger domain, yet it is able to distinguish sharply defined plumes to the east which are not discernable due to saturation in the CSIRO dataset.
This tripartite representation affords a nuanced view of the aerosol distribution during the bushfire season, illustrating the diverse capabilities and focal points of each dataset in capturing the dynamics of smoke dispersion across Australia.
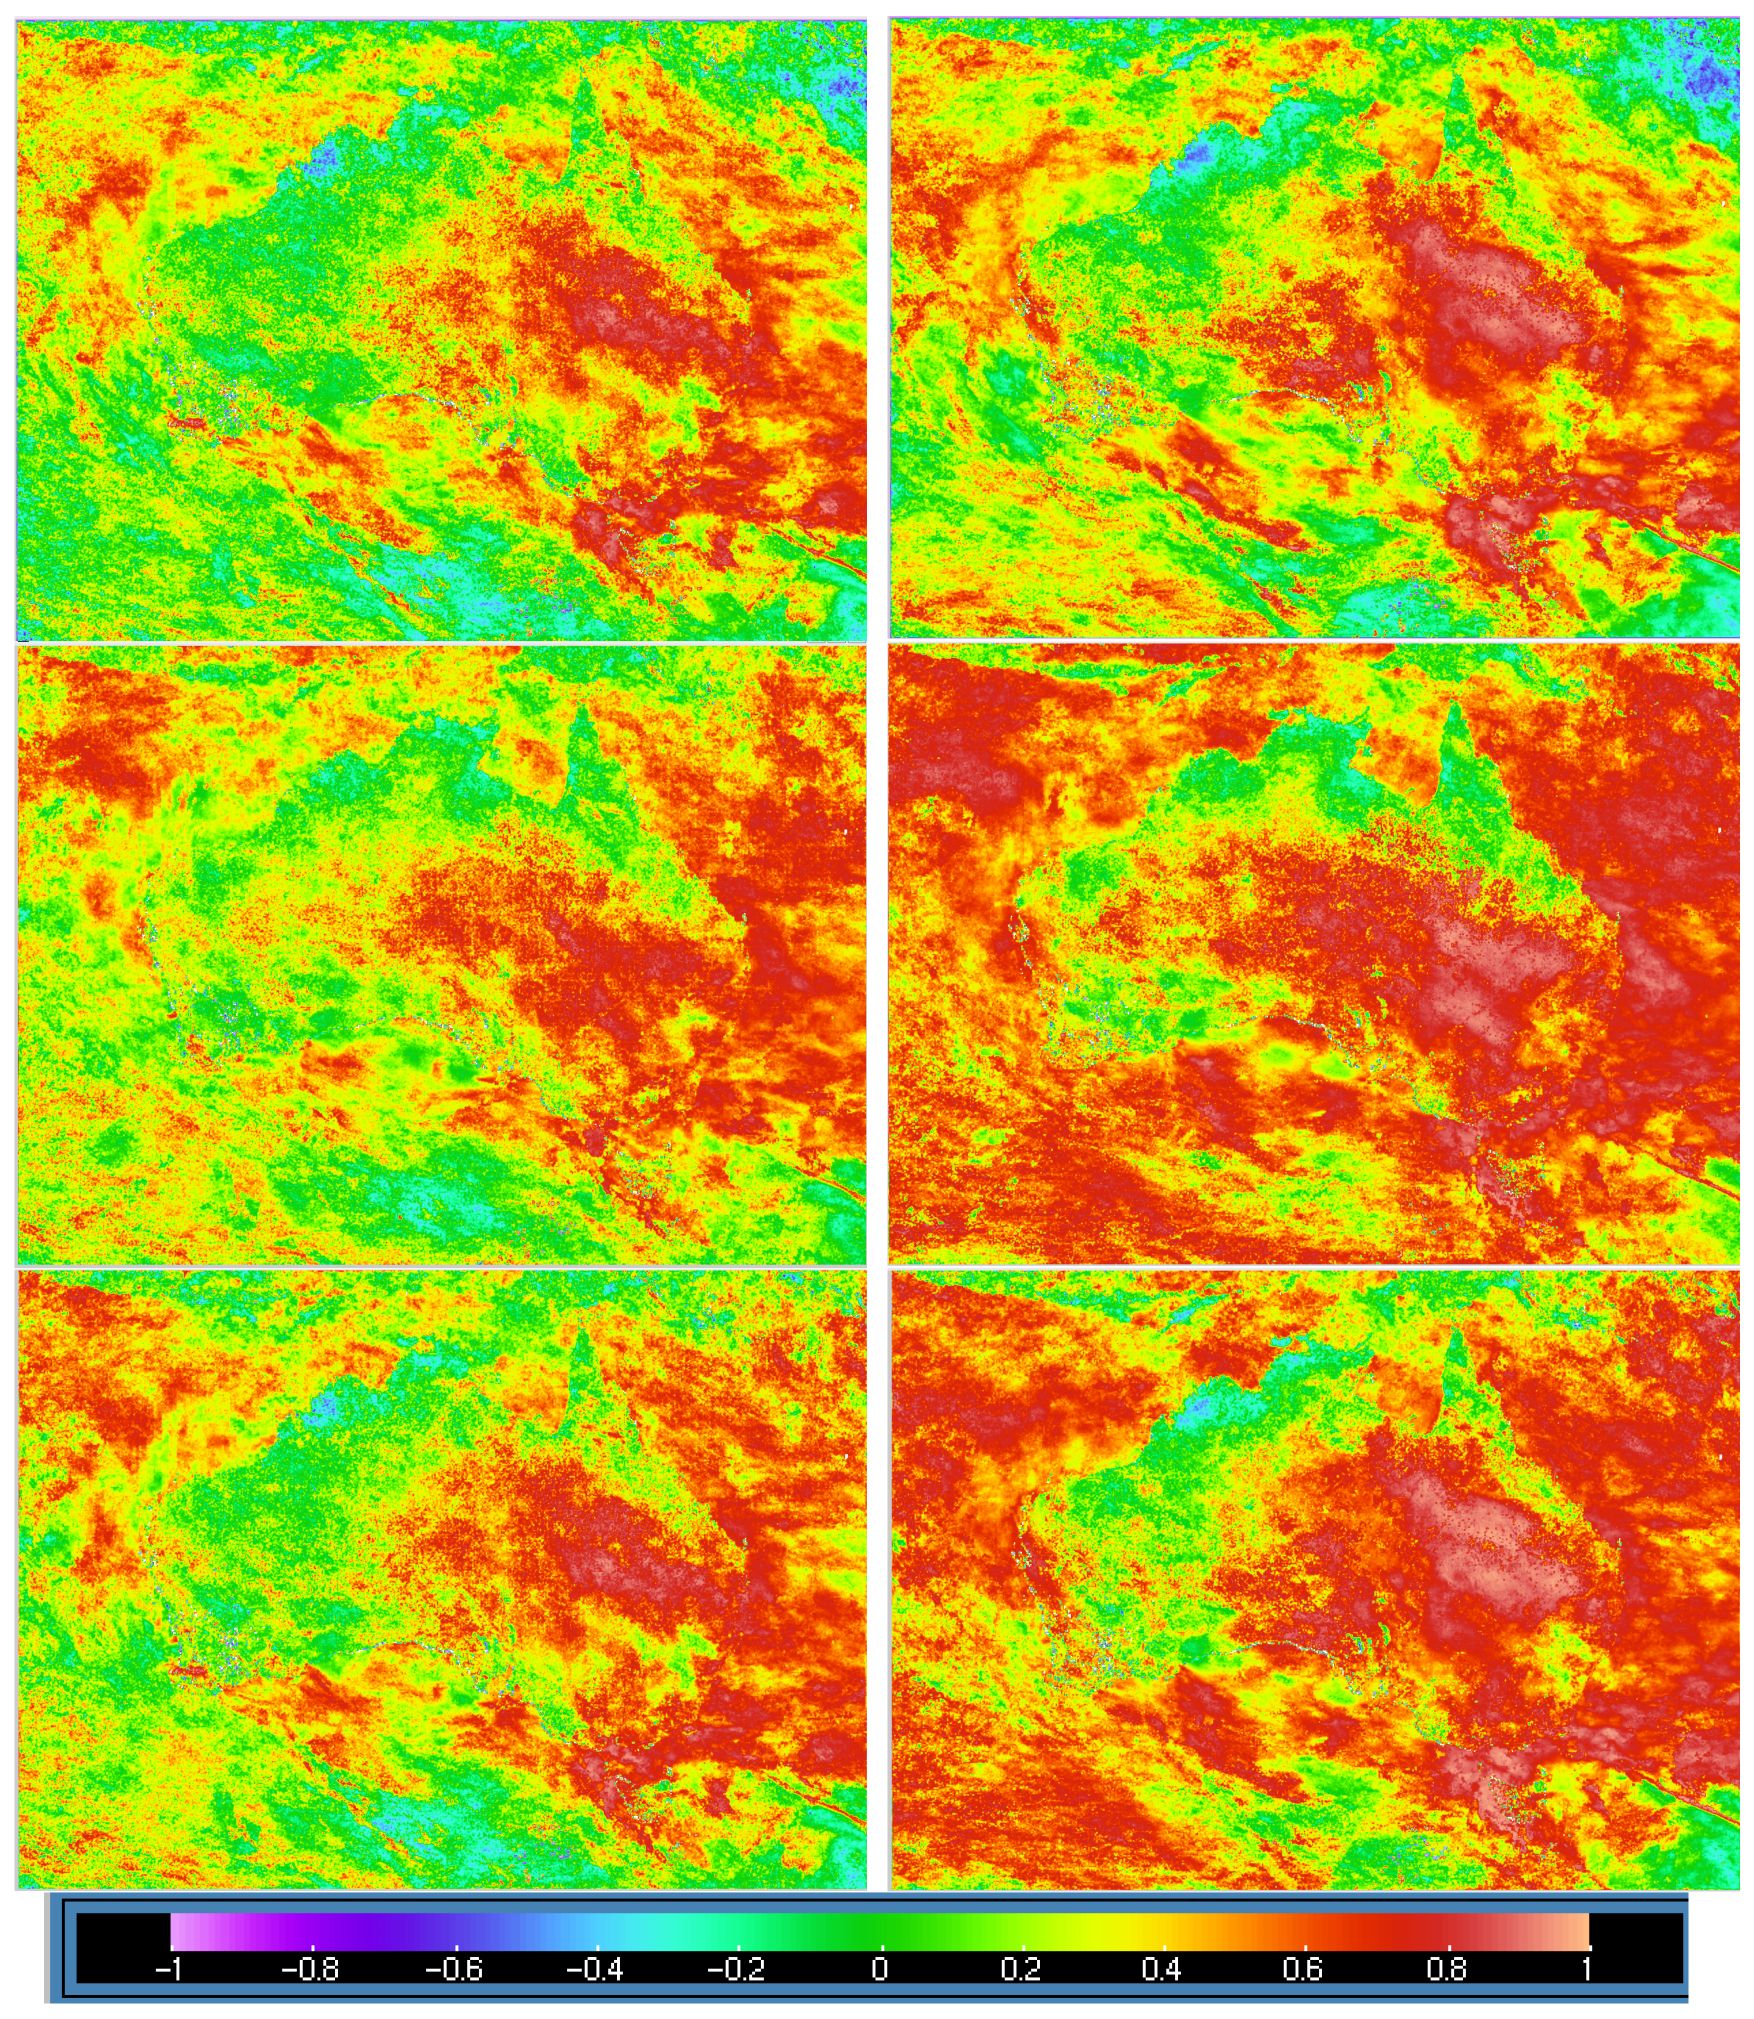
3.5. Distribution of Correlation
To evaluate the accuracy of AOD data and CTM modeling in characterizing smoke haze events in Australia, the spatial distribution of the correlation between the AOD datasets was analyzed. The distribution of the correlation coefficient (R) for each dataset compared to the blended dataset is presented in
Figure 6. The results show that the blended dataset outperforms the individual datasets in terms of correlation (
Table 1) across most regions of Australia, indicating a higher level of agreement in capturing smoke haze events. The higher correlation coefficient values for the blended dataset suggest that it is a more reliable dataset for monitoring smoke haze events and that the blending process enhances the accuracy of AOD data and CTM modeling. This finding highlights the importance of using blended datasets for the comprehensive and accurate representation of smoke haze events in Australia.
4. Discussion
This study presents an innovative approach for the comprehensive analysis of smoke haze events in Australia, combining aerosol optical depth (AOD) data from the Japan Aerospace Exploration Agency (JAXA) with the Chemical Transport Model (CTM) simulations from both the Copernicus Atmosphere Monitoring Service (CAMS) and CSIRO. By merging these datasets, we develop a blended dataset that offers a more detailed understanding of smoke haze events, highlighting the complexity of aerosol distribution and behavior during such events. This method emphasizes the importance of a thorough examination of key aspects that could further enhance our grasp of the methodology’s impact.
In analyzing the data, we employed a strategy similar to that used in land use modeling by categorizing land into specific types such as land/sea and high/low AOD. While this approach facilitated the segmentation of data, it did not address the intricate challenges associated with pinpointing aerosol plume locations, which are significantly affected by factors like the source of emissions and geographical features. These factors interact with the precision of CTMs, particularly in terms of grid resolution and the veracity of input data, underscoring a critical area for methodological refinement.
The application of Taylor plots was instrumental in our comparative analysis of models. These plots visually depict the correlation and accuracy across the various datasets, enabling a nuanced understanding of how each dataset aligns or diverges in terms of aerosol representation. Our findings revealed a notable correlation between the JAXA and CAMS datasets, with the CSIRO dataset demonstrating a heightened ability to capture the intensity of severe smoke haze events. This observation supports the premise that a blended approach, which capitalizes on the strengths of each individual dataset, can significantly improve the accuracy of smoke haze predictions.
Despite the innovative aspects of our approach, we encountered limitations and challenges that warrant attention. Initially, we hypothesized a straightforward correlation between the CTM outputs and satellite-derived AOD measurements. However, this assumption did not account for the inherent discrepancies between the two data types, particularly given the constraints of satellite AOD measurements, such as the influence of daylight reflectance and cloud cover. Furthermore, the complexity of the CTM initial conditions, which encompass a wide array of parameters beyond AOD, highlights the difficulty of relying solely on AOD data to refine model predictions. This insight points to a critical limitation in our methodology, particularly when it comes to filling in gaps in AOD data coverage, and emphasizes the need for a more holistic approach to model initialization and refinement.
5. Conclusions
Reflecting on the study’s findings and integrating insights from previously published research by the team, our comprehensive conclusion encompasses several pivotal lessons learned and delineates a future path for research in the analysis and prediction of smoke haze events from bushfires.
The study underscores the challenge of inadequate AOD data recovery yet emphasizes the crucial role of satellite-derived AOD in the near-real-time detection of air quality incidents, particularly for pinpointing smoke plume locations. A promising approach to enhance data recovery rates could involve the utilization of IR wavelengths, given that IR channels can provide round-the-clock coverage. The merging approach demonstrated in this research suggests that satellite data, despite their limitations, can offer preliminary estimates of the magnitude of aerosol concentrations. When these estimates are integrated with CTMs through correlation-based merging, as conducted in this study, they can significantly improve the accuracy and reliability of smoke haze event characterization.
This study has identified three prevalent errors that can affect the accuracy of modeling efforts. Firstly, the quality of a model’s output is inherently dependent on the completeness of its input data. Missing emissions data lead to unrepresented events, as observed with the CAMS model’s underperformance in central Australia. Secondly, models can exhibit bias towards areas with abundant data, typically near populated regions with real-time monitoring. This issue was evident in the CSIRO model, where outputs were disproportionately influenced by data-rich areas. Lastly, the challenge of spatial resolution becomes apparent when dealing with localized phenomena like smoke plumes, which may occupy a small fraction of a model’s grid. This situation often results in the model averaging the plume’s impact over a large area, diluting the observed concentrations to levels marginally above background, as seen in the CAMS model. Conversely, the acute health impacts of bushfires, marked by brief, intense particulate concentration spikes, necessitate the highest possible spatial resolution for air quality health assessments. This study highlights the critical need for employing the finest resolutions available to accurately assess and mitigate the health risks posed by smoke haze events.
Acknowledging the constraints of AOD data in accurately determining ground-level concentrations, integrating Chemical Transport Model (CTM) simulations with Bayesian analysis presents a promising solution. This method involves utilizing prior predictions and calibration based on temporal changes in model data (dy/dt), with the calibration weighted by their correlation. It builds on the principle that prior measurements often reliably predict current conditions. The goal of this approach is not to achieve flawless AOD values but rather to refine the estimation of ground-level concentrations, which are essential for evaluating health impacts. This study has demonstrated the viability of using this method to scale AOD from models based on their correlation with satellite observations. However, the applicability of this method extends beyond AOD parameters, suggesting its potential for broader use in atmospheric and environmental modeling.
This research recognizes that within most of the study area, aerosol concentrations remain low, highlighting the need for a methodological focus on significant incidents over general background levels. This distinction is crucial for directing analytical efforts towards comprehensively understanding and addressing the impacts of specific smoke haze events. Notably, while AOD values typically range from 0 to 10, air concentrations can vary across three orders of magnitude. Consequently, this study advocates for the use of a logarithmic rather than linear scale in data analysis. This recommendation aims to improve the normalization of statistics and specifically target incidents by effectively minimizing background noise.
Furthermore, this study illuminates the underutilized potential of Taylor plots in model comparisons, especially beneficial in scenarios lacking a clear “correct answer”. Taylor plots provide a refined tool for graphically demonstrating the performance and correlation between different datasets and models. These plots are particularly valuable for their ability to synthesize multiple performance metrics—such as correlation coefficients, standard deviations, and root mean square errors—into a single, coherent visual framework. This capability makes Taylor plots an indispensable asset for evaluating model accuracy and consistency, offering insights into how well models replicate observed phenomena and how variations among models can inform improvements and refinements. By embracing Taylor plots, researchers can gain deeper insights into the comparative strengths and weaknesses of different modeling approaches, fostering a more rigorous and informed dialogue within the scientific community about model performance and reliability.
This study has innovatively merged satellite-based aerosol optical depth (AOD) data with Chemical Transport Model (CTM) simulations, providing a comprehensive characterization of smoke haze events that significantly impact Australia’s air quality, climate, and public health. By integrating AOD data from JAXA, CAMS, and CSIRO, and employing statistical evaluations through mean, standard deviation, and root mean square error (RMSE) metrics, we have demonstrated that a blended dataset offers a more robust representation of smoke haze events compared to individual datasets. Crucially, the study has highlighted the utility of Taylor plots in comparing models where traditional statistics falter due to grid scaling issues or the lack of a definitive result to compare against. It has emphasized the importance of focusing analytical efforts on incidents over background conditions.
Advocating for the merging of locational data with more accurate magnitude estimates based on dataset correlations, this research paves the way for improved analytical techniques. Such advancements are vital for the development of more effective public health management strategies and targeted interventions to mitigate the adverse effects of smoke haze. Overall, this study enhances our understanding of smoke haze’s environmental impacts and underscores the potential of hybrid methodologies in advancing our analytical capabilities and response mechanisms.


 ,
, 


