Article

PointMM: Point Cloud Semantic Segmentation CNN under Multi-Spatial Feature Encoding and Multi-Head Attention Pooling

1
School of Electronic Engineering and Automation, Guilin University of Electronic Technology, Guilin 541000, China
2
Ningbo Institute of Materials Technology and Engineering, Chinese Academy of Sciences, Ningbo 315201, China
*
Author to whom correspondence should be addressed.
Remote Sens. 2024, 16(7), 1246; https://doi.org/10.3390/rs16071246
Submission received: 7 February 2024 / Revised: 29 March 2024 / Accepted: 29 March 2024 / Published: 31 March 2024
(This article belongs to the Special Issue Remote Sensing Image Classification and Semantic Segmentation)

Abstract

:
For the actual collected point cloud data, there are widespread challenges such as semantic inconsistency, density variations, and sparse spatial distribution. A network called PointMM is developed in this study to enhance the accuracy of point cloud semantic segmentation in complex scenes. The main contribution of PointMM involves two aspects: (1) Multi-spatial feature encoding. We leverage a novel feature encoding module to learn multi-spatial features from the neighborhood point set obtained by k-nearest neighbors (KNN) in the feature space. This enhances the network’s ability to learn the spatial structures of various samples more finely and completely. (2) Multi-head attention pooling. We leverage a multi-head attention pooling module to address the limitations of symmetric function-based pooling, such as maximum and average pooling, in terms of losing detailed feature information. This is achieved by aggregating multi-spatial and attribute features of point clouds, thereby enhancing the network’s ability to transmit information more comprehensively and accurately. Experiments on publicly available point cloud datasets S3DIS and ISPRS 3D Vaihingen demonstrate that PointMM effectively learns features at different levels, while improving the semantic segmentation accuracy of various objects. Compared to 12 state-of-the-art methods reported in the literature, PointMM outperforms the runner-up by 2.3% in OA on the ISPRS 3D Vaihingen dataset, and achieves the third best performance in both OA and MioU on the S3DIS dataset. Both achieve a satisfactory balance between OA, F1, and MioU.

1. Introduction

Compared to 2D images, three-dimensional point clouds obtained using 3D scanners and depth sensors (such as LiDAR and RGB-D cameras) can more comprehensively and intuitively express the spatial relationships between various targets in the scene. They have been widely utilized in various industries, including 3D modeling [1], autonomous driving [2], and metaverse [3], and natural resource surveys [4]. Point cloud semantic segmentation is a crucial supporting technology for understanding and analyzing 3D scenes [5]. However, due to the spatiotemporal complexity, the irregular distribution of terrain surfaces, and the non-uniformity and disorder of point clouds themselves, achieving high-precision point cloud semantic segmentation in large-scale complex scenes remains an extremely challenging task. Designing point cloud semantic segmentation convolutional neural networks with end-to-end output capability and adaptability to various scenarios has become a current research focus [6], which can be broadly categorized into two types: indirect and direct methods. Our approach belongs to the latter.
An indirect semantic segmentation network needs to preprocess the original point cloud into a 2D/3D grid structure to leverage mature image-based CNNs for tasks such as object classification and semantic segmentation. For instance, WhuY4 [7] and NANJ2 [8] design CNNs to extract multiscale local features from projection view of point clouds. On this basis, they calculate category probabilities for each point and construct a decision tree to guide subsequent retraining. Individuals such as GERDZHEV [9] utilize convolutional kernels of varying scales to capture contextual information and aggregate feature information at different scales to obtain segmentation results. GFNet [10] employs bidirectional alignment and the propagation of complementary information to learn geometric information between different projection views. AGNet [11] introduces attention pooling on the basis of traditional graph neural network (GNN) to score feature importance. GaIA [12] autonomously learns crucial regions of point clouds based on graphical information gain and applies it to semantic segmentation tasks. However, a considerable amount of geometric structure, orientation, and other spatial relation information of target objects are lost during the point cloud projection process. Therefore, the point cloud semantic segmentation networks under multi-view projection are sensitive to changes in viewpoint and anomalies caused by occlusion. Represented by PVCNN [13], VoxSegNet [14], PVCL [15], and MPVConv [16], voxel-based 3D convolutional neural networks can effectively learn 3D spatial information and context-dependent relationships of point clouds. However, the sparsity and uneven density of point clouds can generate a large number of empty grids, resulting in low computational efficiency and high memory usage.
Direct point cloud semantic segmentation network learns features straightforwardly from 3D point clouds without the need to pre-process them into 2D/3D grids. Remarkable works have been carried out by PointNet [17] and PointNet++ [18] in solving the challenges of large-scale point cloud network computing through farthest point sampling (FPS). However, overly independent point operations in the networks hinder the capture of local spatial structures. To address this issue, PointSIFT [19], inspired by the SIFT operator, encodes the features in eight directions in the XYZ space to overcome the limitation of PointNet++ in restricting its k-nearest neighbor search to the same direction. However, this method is exceptionally sensitive to the orientation information of objects. PointWeb [20] aggregates local point cloud information through an adaptive feature adjustment module. HPRS [21] develops an adaptive spherical query module to simultaneously capture global features and finer-grained local features. MappingConvSeg [22] conducts spherical neighborhood feature learning at each downsampling layer, enhancing the network’s ability to capture complex geometric structures. Zhao et al. [23] introduces dynamic convolution filters (DFConv) and an improved semantic segmentation (JISS) module into JSNet [24]. Overall, these networks aggregate neighborhood information and multiscale features through local feature encoding, resulting in improved segmentation accuracy compared to the original PointNet++. However, the feature encoding methods of such networks primarily consider position and point spacing, with limited attention to the spatial scale information of points.
Different from the PointNet++ series, direct point cloud segmentation networks based on graph convolution treat each point as a node in the graph and form directed edges with neighboring points. The challenge of obtaining such networks lies in how to construct appropriate point-to-point relationships and the advantages lie in their ability to aggregate target structural features while maintaining translation invariance in a three-dimensional space. Representative works in this category include KVGCN [25], GCN-MLP [26], RG-GCN [27], DDGCN [28], and PointCCR [29]. Some researchers attempt to learn fine-grained point cloud features by introducing self-attention mechanisms in networks. For example, Hu et al. [30] combine self-attention mechanisms with a random sampling algorithm to design the RandLA-Net network. Du et al. [31] add a dense convolutional linking layer on the basis of RandLA-Net for a more comprehensive learning of geometric shapes. LG-Net [32] achieves learning of global context information through a global correlation mining (GCM) module. Yin et al. [33], based on geometric structure and object edge integrity, design a local feature encoding network using rapid point random sampling. In order to enhance a network’s ability to learn local features, Deng et al. [34] proposed PointNAC by introducing a point-pair feature encoding pattern and Copula correlation analysis module, and Wu et al. [35] developed PointConv by introducing a novel weight calculation as well. Yan et al. [36] designed an Adaptive Sampling Module and Local-Nonlocal (L-NL) Module based on attention mechanisms to mitigate noise and outliers that could disrupt the network’s learning of local features. Zarzar et al. [37] designed PointRGCN for better extraction of topological structures from point clouds, employing feature encoding and aggregating context information in the form of graphs. Inspired by the breakthroughs of Transformer models in Natural Language Processing (NLP) tasks, Zhao et al. [38] applied Point Transformer and self-attention mechanisms to various point cloud classification and segmentation tasks, achieving excellent performance. Although the aforementioned networks have shown advantages in certain category-targeted segmentation tasks, they still struggle to achieve high overall segmentation accuracy (OA) and average joint intersection (MIoU) scores at the same time.
Generally speaking, compared to indirect point cloud segmentation methods, direct methods are more effective in utilizing information and are easier to capture fine-grained local features for precise segmentation. However, existing feature encoding patterns in networks only utilize relatively independent information, such as point absolute positions, point-to-point distances, and direction vectors, to express spatial structures, making it difficult to effectively extract detailed features from complex scenes. On the other hand, existing networks typically use the maximum pooling process for feature conveying. But this process may discard the local details of point cloud samples, making it difficult for the network to effectively distinguish points in different categories. In response to the above issues, this article developed a network called PointMM for the high-precision semantic segmentation of 3D point clouds. The contributions in the paper lie in two aspects, as outlined below.
Firstly, addressing the limitation of existing network feature encoding methods that only consider one-dimensional features between sampled points and their neighboring points, this paper leverages a multi-spatial feature encoding module by computing angles between point distances and normal vectors, and encoding point coordinates, distances, directional vectors, and point relationships, thereby enhancing the network’s capability to learn the spatial structures of various samples more finely and completely.
Secondly, addressing the drawback of the pooling process based on symmetric functions that may discard a significant amount of detailed feature information, especially the information loss of minority class samples in 3D scene datasets under long-tailed distribution, this paper leverages a multi-head attention pooling module to score and aggregate features at different levels, thereby enhancing the network’s ability to transmit information more comprehensively and accurately.

2. Our Method

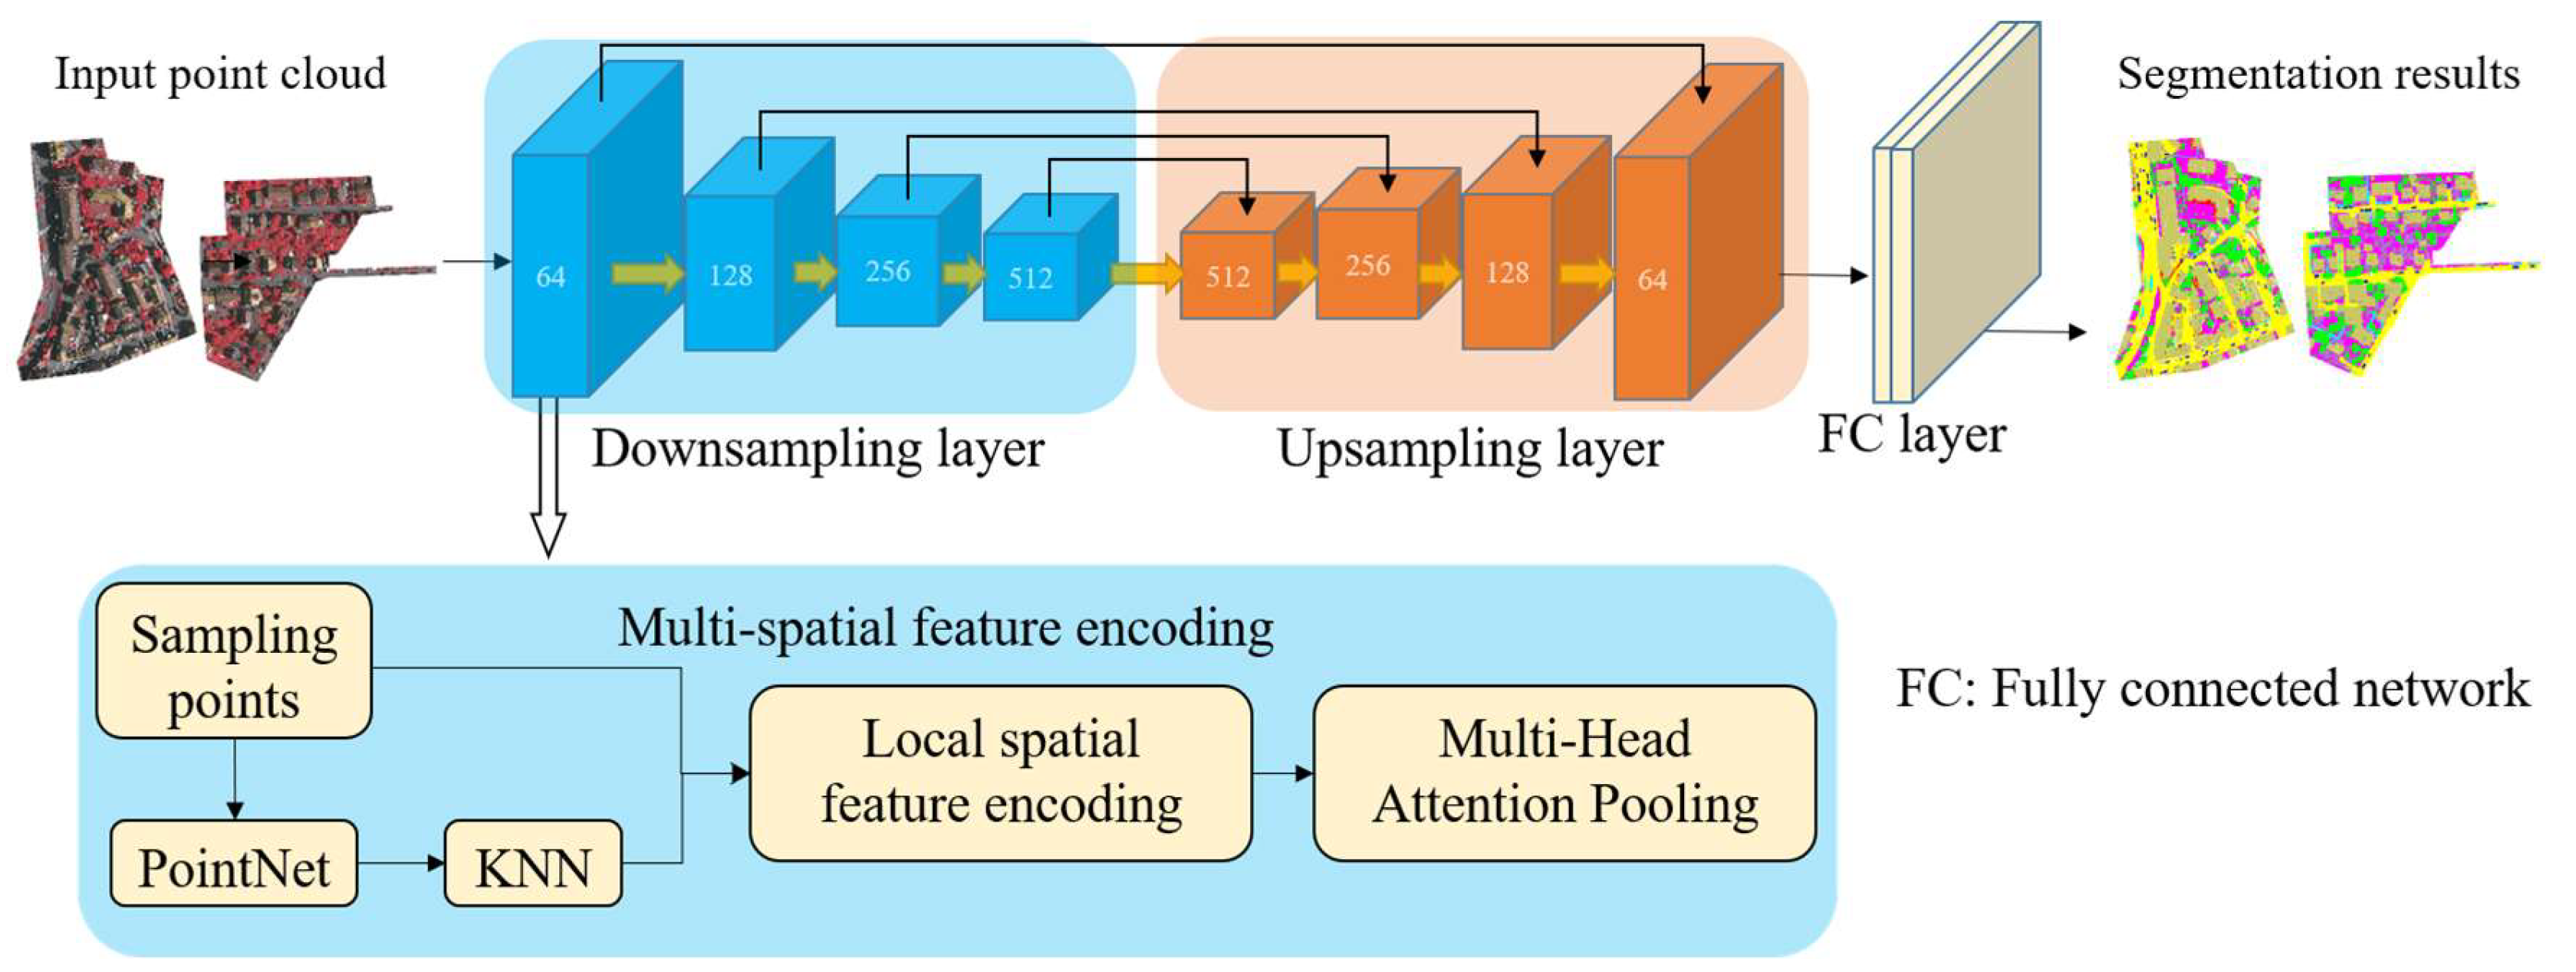
2.1. Network Overview

The FPS typically employed in direct point cloud semantic segmentation networks is a “uniform” point cloud sampling method that can lead to information loss, especially for samples of the minority class. On the other hand, existing point cloud semantic segmentation networks tend to have a “unidirectional” learning process from the sampled central point to its neighboring points, which is not conducive to learning the fine local structures of point clouds. Additionally, the pooling process in existing point cloud semantic segmentation networks tends to retain the maximum values of local features, hindering the transmission of fine spatial information. This not only affects the effective learning of various sample features but also has an impact on overall segmentation accuracy to some extent. To address these issues, we use Balanced Class Sampling (BCS) to perform full sampling of minority class samples and downsampling of majority class samples in sub regions, and assign initial values to the sampled samples. When all points are sampled (given initial values) for learning, we reset all initial value information to zero and cycle this process until the set maximum batch is reached. The BCS module ensures that each class of sample points is learned by the network. Meanwhile, this article combines multi-spatial feature learning and multi-head attention pooling into PointNet++, and builds a network called PointMM, as shown in Figure 1.
PointMM mainly consists of four parts: the Balanced Class Sampling (BCS) module, the downsampling layer incorporating multi-spatial feature encoding and multi-head attention pooling, the up sampling layer, and the fully connected layer. Firstly, the training samples V are obtained using BCS, and each sampling center point vi and its neighborhood points vi,k are extracted based on FPS and feature KNN. At this point, we obtain a point cloud of dimensions N × K × D, where N is the number of sampling center points, K is the number of neighborhood points, and D is the dimensionality of the point cloud containing coordinate and attribute information. Then, the sampling points and their neighborhood points are passed through the multi-spatial feature encoding module to obtain features ηi of dimensions N × K × 13. Subsequently, the features ηi are input into the multi-head attention pooling module, which integrates neighborhood features through pooling operations to generate a larger receptive field and more global feature vector MP(Fi). It is worth noting that we set up four downsampling layers, so the number of attention heads for each layer is 2n (n ∈ [1, 4]). The initial input to the downsampling layer in this paper is a point cloud of dimensions N × K × D, and the number of sampled points in each subsequent layer is multiplied by 4n (n ∈ [1, 4]), where n represents the downsampling layer. Additionally, the output of the downsampling layer is feature maps of dimensions N/4 × 64, N/16 × 128, N/64 × 256, and N/256 × 512. Meanwhile, the upsampling results are cascaded with corresponding downsampling levels using 3D interpolation and skip connections to effectively fuse low-level to high-level features. Finally, a fully connected layer is utilized to establish the transformation relationship between point cloud features and label results. It should be noted that unlike PointNet++ using FPS for the indiscriminate downsampling of large-scale point cloud data, we have designed BCS to perform a complete sampling of minority class samples and downsampling of majority class samples, ensuring that the network learns each class as well as possible through the sampling points.

2.2. Multi-Spatial Feature Encoding

The feature encoding in existing point cloud semantic segmentation networks is often based on point positions and point-to-point distances. However, this relatively independent feature information is insufficient to represent the complex relationships within the neighborhood system. In addition, the use of k-nearest neighbors (KNN) in Euclidean space to extract neighborhood points tends to be limited to the same direction, preventing the comprehensive expression of spatial topological structures for a given point [39]. Inspired by RPM-Net [40] using the PPF encoding method [41] to further enhance the learning of local spatial relationships in point clouds, this article builds a local spatial feature encoding module, as shown in Figure 2, to comprehensively understand and capture spatial relationships in the local context as much as possible.
In Figure 2, the input point cloud is denoted as V = {ni|i = 1, …, N}, where N is the number of points, and ni = [vi, ri] ∈ R3+d represents the combination of coordinate information vi and attribute information ri. To save computational costs, point cloud V is first subjected to feature extraction using the PointNet encoding method [17]. Then, in the feature space, neighborhood point sampling is performed using k-nearest neighbors (KNN). On this basis, the neighboring points vi,k that are searched are more likely to belong to the same object category as the central point vi or are on the edges between categories. Therefore, obtaining neighborhood points through feature space KNN helps the network learn the feature information of the sampled points’ categories while increasing the distinctiveness of inter-class features. However, the feature encoding method of PointNet has limited capabilities in representing point cloud topological structures and spatial scales.
To further enhance the network’s learning capabilities for point clouds, spatial feature encoding is applied to the sampled points and their neighborhood points using the following formula:
ηi = αiβi
αi = Si × (1 + SiT) + ∑Kk = 1, ki (SiSi,k) × [−MLP(Si,kSi)], Si = P(vi), Si,k = P(vi,k)
βi = MLP(vi,k⊕√(vivi,k)2⊕(vivi,k)⊕F(vi, vi,k))
F(vi, vi,k) = (∠(mi,(vivi,k))⊕∠(mi,k,(vivi,k))⊕∠(mi, mi,k))
In Formula (1), αi and βi correspond to the dual-direction feature encoding of the sampling center and neighborhood spatial structure features mentioned in Figure 2. In Formula (2), P(∙) generates the sampling point features Si and neighborhood point features Si,k based on the PointNet encoding method [17] and then incorporates them into αi for enhancing the sampling point features. The calculation formula for αi consists of three parts: 1. Si × (1 + SiT) represents self-enhancement of the sampling point features. 2. (SiSi,k) signifies the mutual relationship between each neighborhood point feature and the sampling point feature. They are multiplied and accumulated together to achieve the learning of enhanced sampling point features. 3. −MLP(Si,kSi) first calculates the impact factors of each neighborhood point feature on the sampling point feature and projects them through a multi-layer perceptron. Formula (1) can be analyzed from a force field perspective, where each Si,k in the local space exerts a force on Si. Gravity attempts to pull Si closer to Si,k while repulsion pushes them apart. The strength of the force is determined by −MLP(Si,kSi), and the direction is determined by (SiSi,k). They adaptively learn through the difference between the two feature vectors. Therefore, αi fully integrates the interrelationship between each neighborhood point and the sampling point, which can better describe the feature of neighborhood correlation. Formula (3) performs feature encoding based on the Euclidean distance √(vivi,k)2 between the sampling point and neighborhood point, the directional vector (vivi,k), the 4D point pair feature F(vi, vi,k)), and the spatial positional information of the neighborhood points. Formula (4) calculates F(vi, vi,k)) using the 4D point pair feature encoding method from RPM-Net [42]. In this context, mi and mi,k represent the normal vectors of the sampling point and neighborhood point, and the inverse trigonometric function ∠(∙,∙) is used to calculate the angles between various vectors. Through Formulas (1) to (4), we not only consider the interactions between points but also describe the scale and topological structure of the sampling point’s spatial environment through point distances, point normal vectors, and their angles.

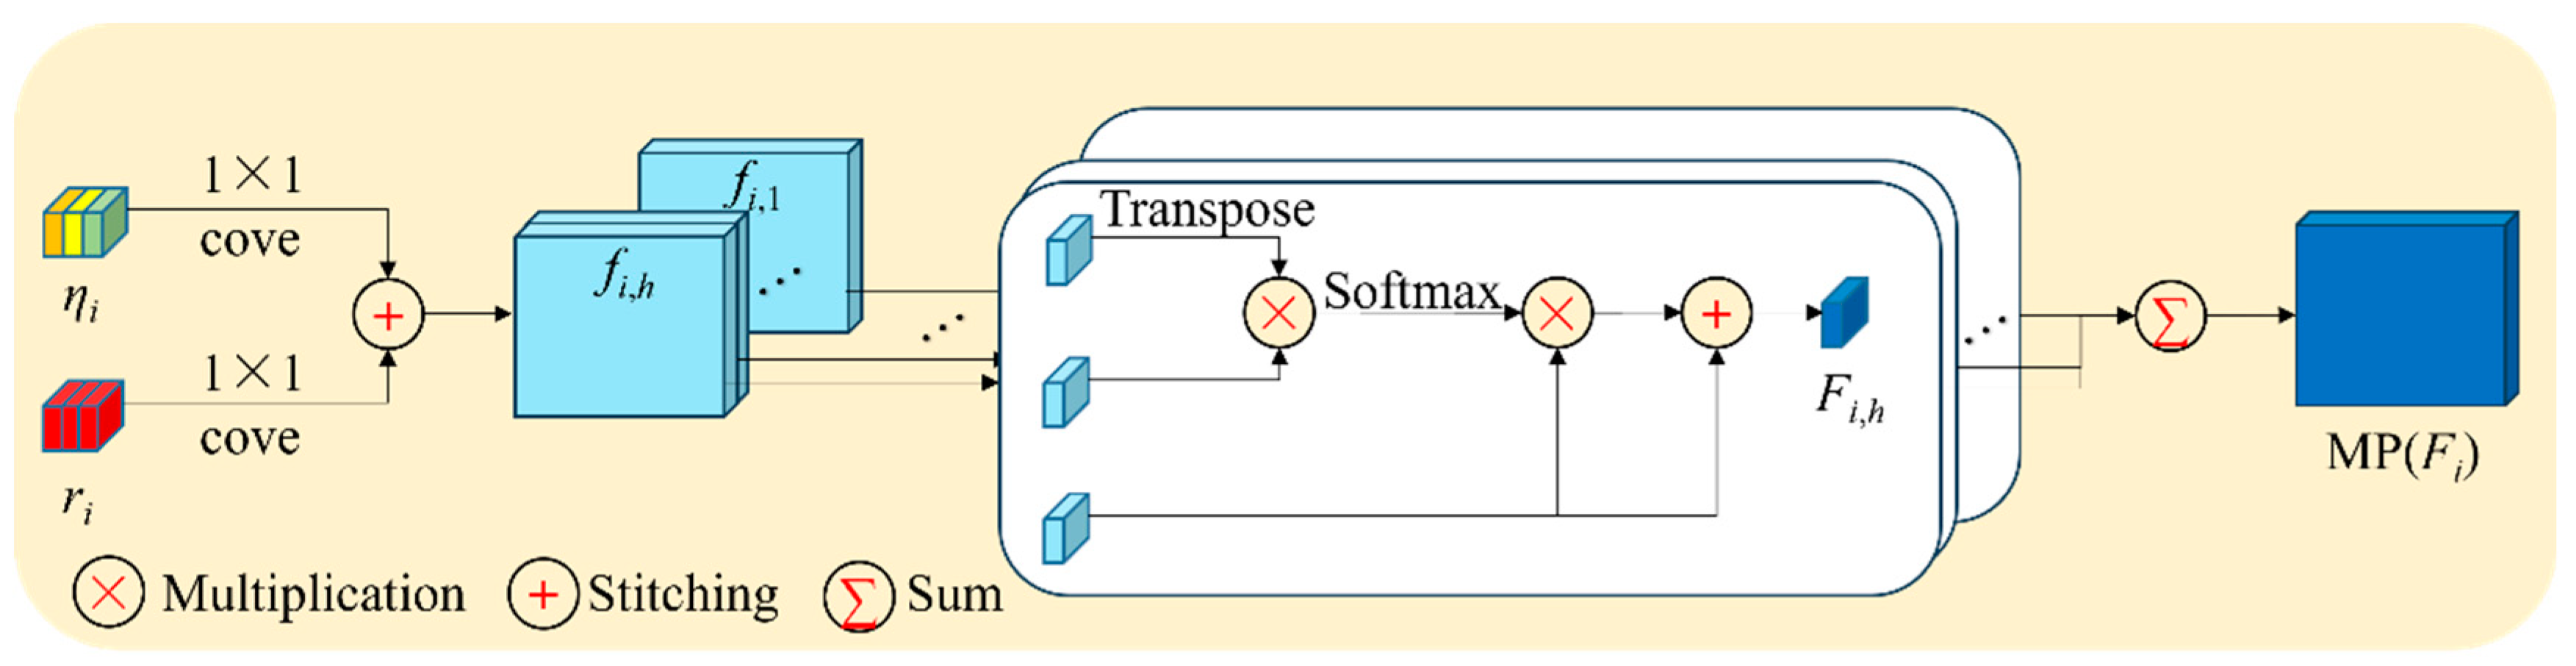
2.3. Multi-Head Attention Pooling

Existing networks commonly utilize max pooling to aggregate neighborhood features for generating global feature vectors with larger receptive fields [18]. It is noteworthy that the information transmission capacity of max pooling is not only limited by the size of the pooling window but also involves a non-parametric downsampling process that results in the loss of a significant amount of information. The literature [43,44] introduces attention mechanisms to score features and aggregates them based on their importance, thereby enhancing the network model’s ability to transmit local fine-grained structural information. Furthermore, the literature [45] embeds the Transformer model into point cloud semantic segmentation networks to improve the network’s ability to capture dependencies between local point clouds and efficiently transmit feature information. Inspired by the above literature, this paper introduces a multi-head attention mechanism during the pooling stage to enhance the network model’s capability to capture local salient structures from various samples. The overall structure is illustrated in Figure 3.
We concatenate multi-spatial features with their corresponding attribute features, and after passing through multiple convolutional layers, we can obtain the following multi-head attention pooling results:
MP(Fi) = ∑(Fi,1, Fi,2, …, Fi,h)∙Hi
In Formula (5), ∑(∙) denotes the concatenation of information Fi,h learned from different heads of attention mechanisms, followed by fusion using the learned parameters Hi from the network. The computation process for each head of attention mechanism is derived from its self-attention scores and self-feature aggregation, expressed by the following formula:
Fi,h = [SoftMax((fi,hT × fi,h)/√C) + 1] × fi,h, fi,h = [g(ηi)⊕g(ri)]h
In Formula (6), SoftMax refers to the normalized exponential function, C is the number of output channels, g(∙) is a 1 × 1 convolution, and [∙]h represents the feature division according to h heads. In comparison to the max-pooling downsampling output pattern that retains predominant features, the pooling method in this paper not only utilizes attention mechanisms to emphasize fine-grained features of the point cloud’s spatial structure but also reduces the loss of various sample features during information transmission through the aggregation of features based on multi-head attention scores.

3. Results

3.1. Experimental Environment and Evaluation

The proposed network is deployed on a deep learning workstation with NVIDIA GPU TiTAN XP 12G, Ubuntu 18.04 operating system and PyTorch1.10.0. The key parameters for the network were set as follows: batch size = 16, momentum = 0.9, decay steps = 300,000, decay rate = 0.5, optimizer: Adam, learning rate = 0.001, max epoch = 100, point number = 4096, the number of KNN = 32, and the radius of KNN = 0.1 × 2n (n ∈ [0, 3]). The performance evaluation of the network in this study was conducted using three metrics: balanced F score (F1 score), mean of class-wise intersection over union (MIoU), and overall point-wise accuracy (OA). The specific formulas for calculating these metrics are as follows:
F1 = 2pii/∑kj=0 (pij + pji), MIoU = (1/k)∑ki=0 pii/(∑kj=0 pij + ∑kj=0 pjipii), OA = pii/p
In the above equations, ‘k’ represents the number of classes in the dataset. ‘pii’ stands for the number of point clouds correctly predicted for class ‘i’; ‘pij’ represents the number of point clouds belonging to class ‘j’ but predicted as class ‘i’, while ‘pij’ represents the number of point clouds belonging to class ‘i’ but predicted as class ‘j’. The F1 and MIoU metrics produce values within the range of 0 to 1, with values closer to 1 indicating better segmentation results for class ‘i’. On the other hand, OA is an overall segmentation evaluation metric for the model. It calculates the ratio of correctly labeled point clouds to the total number of point clouds in the model, where ‘p’ represents the total number of points in the point cloud model. This section may be divided by subheadings. It should provide a concise and precise description of the experimental results, their interpretation, as well as the experimental conclusions that can be drawn.

3.2. Semantic Segmentation of S3DIS Dataset

In this section, we conducted experiments to validate the effectiveness of PointMM using the publicly available 3D point cloud semantic segmentation indoor dataset, S3DIS. The S3DIS dataset comprises six areas from three different buildings, totaling 271 individual rooms. In each scene, every point corresponds to a fixed label, and these labels belong to 13 different categories such as ceiling, floor, wall, door, and others. The distribution of point clouds for each category within areas 1 to 5 is presented in Table 1.
In Table 1, the categories “ceiling”, “floor”, and “wall” constitute the majority class samples, while “clutter” represents the intermediate class samples (just slightly more than the sample mean but less than the majority class samples). The remaining categories belong to the minority class samples. Within the minority class samples, there are five categories “window”, “column”, “beam”, “board”, and “sofa” with an extremely low number of point clouds. Therefore, the segmentation task based on the S3DIS dataset not only faces challenges related to large data volume and high scene complexity but also involves an extremely imbalanced long-tailed distribution issue.

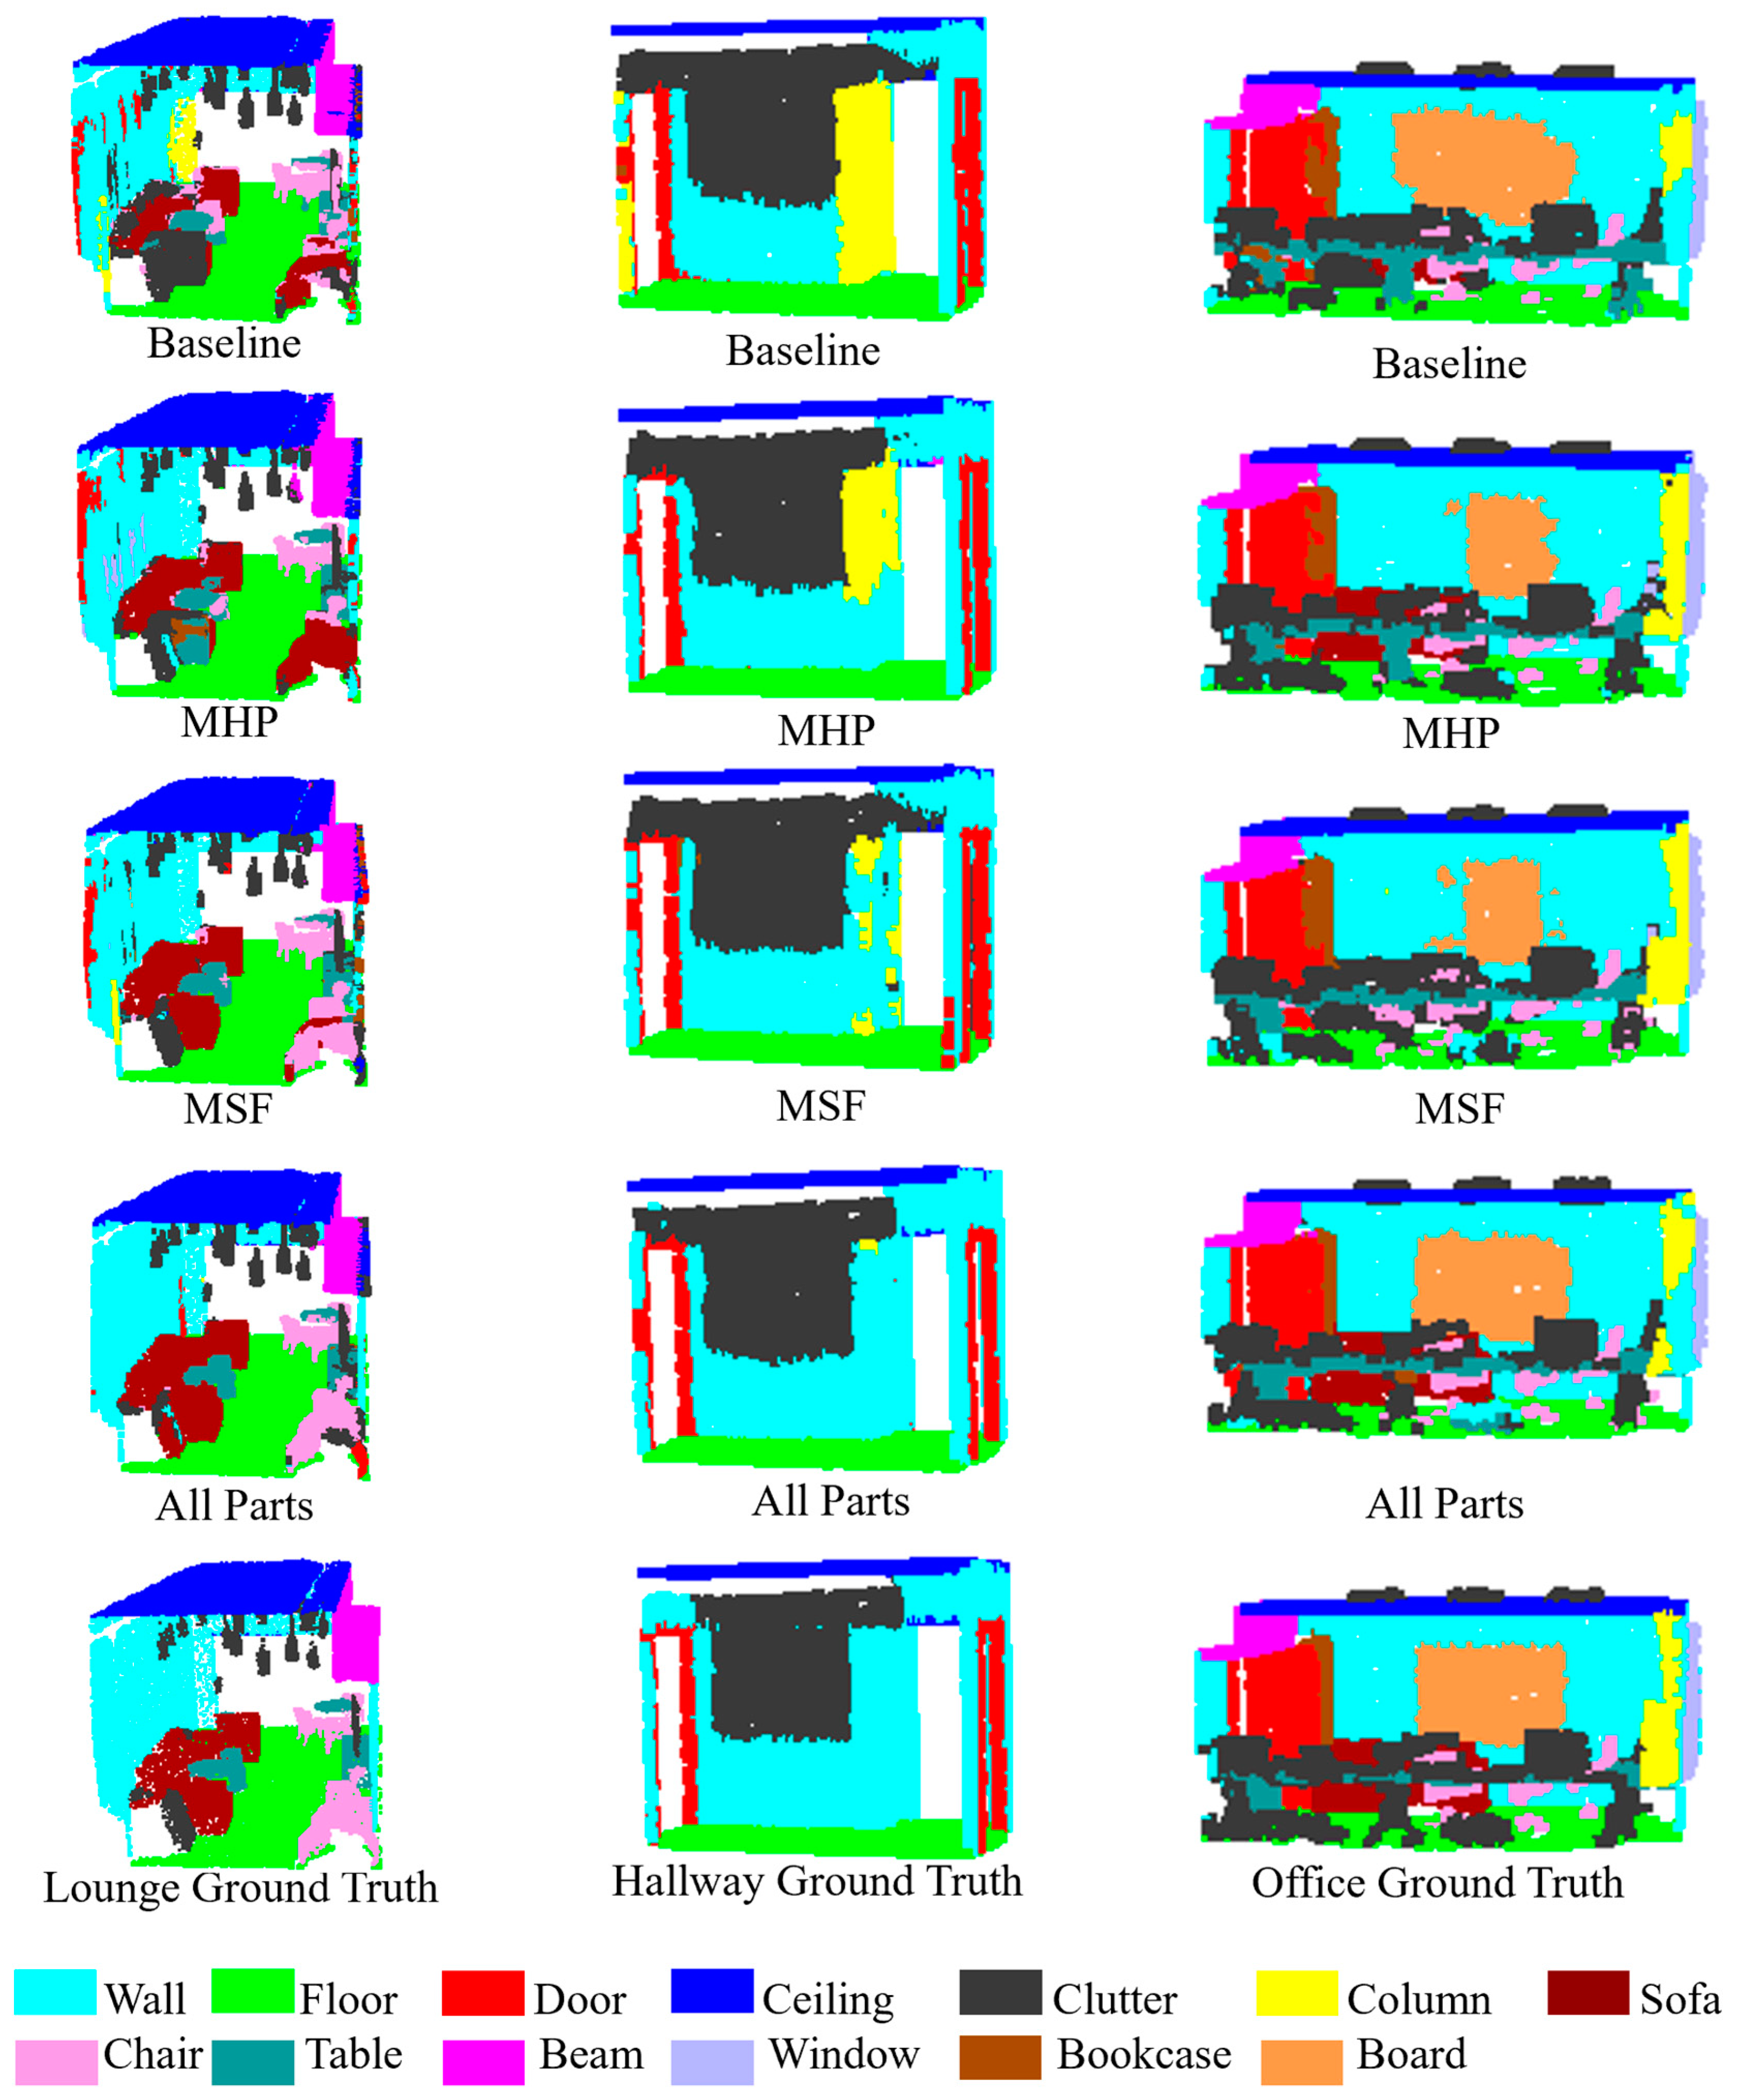
3.2.1. Ablation Experiment

We aim to validate the effectiveness of the modules proposed in this paper. Point spatial coordinates along with their RGB information are used as input features to the network. For training samples, regions 1 to 5 of the dataset are utilized. Specifically, experiments were conducted based on PointNet++ with the addition of multi-head attention pooling (+MHP), multi-spatial feature encoding (+MSF), and a comprehensive evaluation of all modules combined, as shown in Table 2. Additionally, Table 3 presents the segmentation results of these modules in region 6. Meanwhile, the training time of each module during a single epoch is shown in Table 4.
Table 3 indicates that, compared to the baseline MIoU (approximately 70.2%), when the model only considers the MHP, the segmentation accuracy of most categories improves, except for ceiling, beam, board, and window. The reason lies in the fact that the baseline, using max-pooling modules for downsampling and feature transmission, results in the loss of a considerable amount of detailed information during the network training process. As a result, the network tends to sacrifice the segmentation accuracy of minority classes to ensure the overall segmentation accuracy with a majority class bias. The MHP module captures feature information at different levels through a multi-head attention mechanism and aggregates the features extracted by the network through weighted pooling, ensuring the complete preservation of feature information for various samples. On the other hand, the combination of the MSF module with the baseline leads to improvements of 7.9% and 5% in MIoU and OA, respectively. This demonstrates that the MSF module’s ability to search for similar neighborhoods, learn the salient structural features of sampled point neighborhoods, and transmit crucial information is superior to the baseline. When both modules are loaded onto the baseline, except for the beam, column, window, door, and board, which did not achieve the best results, the segmentation accuracy for all other categories is optimal. The overall segmentation accuracy and MIoU also achieve the best results at 94% and 80.4%, respectively. Among the five categories that did not achieve the best results, only the accuracy of the column fluctuates the most, with the differences for the other four categories being only 0.1–0.3% from the optimal accuracy. This is because the column is spatially close to the wall, and their structures and spectral features are highly similar. On the other hand, the column surface is usually relatively smooth and structurally simple, with corresponding point cloud coordinates being relatively regular and a strong spectral feature consistency. The multi-head attention mechanism for modeling the geometric multi-spatial features of the target space does not achieve significant improvement in the accuracy of point clouds with regular arrangement (simple structure). This ultimately leads to confusion between the two in the neighborhood point search and feature learning stages. It should be noted that the wall belongs to the majority of targets, so its accuracy is not easily disturbed by the column, while the column belongs to the minority class targets, so its accuracy fluctuates more significantly. Usually, it is challenging for a semantic segmentation CNN to achieve optimal OA and MIoU simultaneously, as it tends to sacrifice minority class targets to achieve the overall optimal segmentation accuracy (OA). On the other hand, focusing on the learning features of minority class targets may lead to overfitting and limit overall segmentation accuracy. The PointMM in this article achieved an acceptable balance on the IoU of various class samples, while improving overall accuracy by 6.3%.
It is worth noting that the MSF module fully learns the local fine-grained structural features of the diluted point cloud from two aspects: the inter-point relationship αi and the neighborhood spatial topology structure βi. Meanwhile, the MHP module scores and aggregates features based on different heads of attention, allowing the network to consolidate the segmentation accuracy of the majority class targets while also considering learning minority class targets. On the other hand, according to Table 4, the training time for each epoch in the baseline is the shortest, only 233 s. Due to the more complex feature encoding in the MSF module, its duration is almost three times longer than the baseline. At the same time, as the number of downsampling layers increases, the computational complexity of the MHP module increases exponentially, resulting in a duration of 1104 s. When both modules are stacked on the baseline, PointMM shows the maximum duration (1604 s).
To demonstrate the effects of the ablative experiments more intuitively on each module in this paper, segmentation results from three different scenes in region 6 are selected for display, as shown in Figure 4. The three columns of segmentation results in Figure 4, from left to right, correspond to lounge, hallway, and office. The gray boxes in each image indicate areas of segmentation errors for comparison. Each row in Figure 4, from top to bottom, represents the segmentation results of the baseline, baseline with the MHP module, baseline with the MSF module, PointMM, and ground truth. Observing the images on the left side of Figure 4, it can be observed that due to the significant similarities in geometric structure, spatial location, and spectral information between wall and column, door, clutter, and window, the baseline misclassifies wall as door, window, and column. MHP, through multi-head attention pooling, fully preserves the features of various samples, correctly segmenting the wall at the corner of the room, but still missegments some parts of the wall as door and window. This is because MHP can only ensure the effective transmission of various sample information by pooling, but cannot extract significant features of local geometric structures. MSF, based on the original data preprocessing, effectively captures fine-grained structural features of points in space, greatly reducing the phenomenon of missegmenting the wall as other targets. However, MSF still missegments a small portion of the wall as clutter and door. PointMM, which combines the advantages of MHP and MSF, essentially achieves the correct segmentation of the wall, with only a small portion of the point cloud missegmented as a door at the corner of the two wall surfaces. On the other hand, in the left gray box of the baseline, there is also mutual missegmentation between sofa, table, and clutter. With the integration of each module, the segmentation accuracy in this local area gradually improves. For the various types of targets in the right gray box with sparse distribution or extremely low data volume, the baseline can only correctly segment some chairs, while the rest of the categories are segmented incorrectly. MHP, based on the baseline, achieves the correct segmentation of tables and clutter. MSF, based on the baseline, achieves the correct segmentation of chairs as much as possible. PointMM, based on MHP and MSF, completes the correct segmentation of all targets, with only a small amount of missegmentation in the edge area.
In the hallway scene depicted in Figure 4, the wall, door, and clutter exhibit highly similar spectral information, contour structures, and spatial positions. The baseline missegments a significant amount of the wall in the left gray box as column, clutter, and door, while completely missegmenting the wall in the right gray box as column. MHP, employing the original feature encoding approach, learns various sample information, significantly reducing the missegmentation of the wall as column in the left gray box, while correctly segmenting half of the wall in the right gray box. MSF comprehensively learns the geometric relationships between sampled points and their neighboring points, leading to a substantial reduction in the missegmentation of the wall as column in the right gray box. PointMM, on the other hand, is capable of accurately identifying the aforementioned targets, achieving segmentation results highly consistent with the annotated data. PointMM only exhibits a small amount of missegmentation in the region where door, wall, and clutter intersect (left gray box), as well as an extremely small amount of missegmentation as column in the corner formed by the two wall surfaces.
In the third column of Figure 4, an office scene containing 13 categories is depicted. Due to the close connection between the open door and the bookcase, both of which are wooden structures with approximate spectral information, the baseline exhibits missegmentation at the border junction of these two objects. Similarly, the baseline missegments the wall as a board and missegments the column as a wall. MHP and MSF both show varying degrees of missegmentation between the door and bookcase in the left gray box, with both also missegmenting some boards as walls. PointMM achieves segmentation results close to the ground truth in the region where the door meets the bookcase and in the board area, except for missegmenting some columns as walls in the right gray box. The experimental results in Figure 4, combined with the segmentation accuracy from Table 3, reveal that the combination of multi-head attention pooling and the adaptive spatial feature encoding module significantly enhances the model’s ability to describe features of various sample types. Additionally, PointMM proves effective in handling targets with complex local geometric or spectral features. On the other hand, the S3DIS dataset contains instances of objects of the same class sparsely and discretely distributed in the scene. In this context, the introduced neighborhood point search module based on feature KNN demonstrates clear advantages in capturing the ability of the same class point clouds. By integrating various amounts of sample information through feature KNN and thoroughly learning their neighborhood salient structural features, the network model’s semantic segmentation capability is effectively improved under conditions of sparse point cloud density and complex local structures.

3.2.2. Six-Fold Cross-Validation

This section of the experiment aims to demonstrate the learning capability and generalization of the method proposed in this paper on the entire dataset. The proposed method is subjected to a standard six-fold cross-validation experiment on the S3DIS data set, and it is compared with 12 currently popular and classical deep learning methods for point cloud semantic segmentation. The evaluation metrics for each method, including overall accuracy (OA) and mean intersection over union (MIoU), are presented in Table 5.
From Table 5, it can be observed that the proposed method achieves the highest MIoU for ceiling, floor, window, table, chair, and clutter, with values of 95.4%, 97.5%, 66.5%, 73.0%, 84%, and 69.5%, respectively. These values are higher than the second highest by 0.9%, 0.2%, 0.3%, 2.2%, 7.6%, and 9.2%. The MIoU for door and bookcase ranks second, with values of 73.9% and 68.1%, lower than the first by 2.7% and 6.8%, respectively. Wall ranks third in MIoU, while beam’s MIoU ranks fifth, and column, sofa, and board all rank sixth, placing them at a moderate level among the listed literature network models.
GSIP [46] proposed a method based on PointNet that performs downsampling on a per-room basis, significantly reducing computational costs. However, this network loses a considerable amount of detailed information, resulting in an OA and MIoU of only 79.8% and 48.5%, respectively. HPRS [21] has a feature encoding pattern that is too singular, limiting its applicability to large-scale complex indoor scenes, resulting in an OA and MIoU of only 84.7% and 61.3%. MCS [22] introduced MappingConv based on the spherical neighborhood feature learning pattern, showing a noticeable improvement over HPRS in accuracy. However, this method only optimizes the feature encoding of the downsampling layer and does not consider the promoting effect of the self-attention mechanisms in deep learning, resulting in an OA and MIoU of only 86.8% and 66.8%.
KVGCN [25] aggregated local–global context features to achieve a higher OA (87.4%) than GCN. However, it overlooks the impact of minority class features on MIoU (60.9%). The OA (88.0%) of RandLA-Net [30] was only at a moderate level, even if a random sampling strategy was used to increase the chances of capturing minority class samples. Although KPConv [47] achieves the best segmentation accuracy for the two categories of sofa and bookcase with extremely low point cloud counts, it overly focuses on minority class sample features, leading the model into an overfitting state, causing a substantial decline in segmentation accuracy for ceiling and floor. While LG-Net [32] achieved good results in regions with high similarity for features such as column, beam, and wall, like KPConv, it overly focuses on certain features and leads to a loss in overall segmentation accuracy. Instead, RGGCN [27], BSH-Net, PointNAC, and JSNet++ [23] overly emphasize the features of majority class targets and lose competitiveness in MIoU. Point Transformer achieved the best MIoU (73.5%) and ranking fourth in OA (90.2%). Overall, the introduction of MSF in this paper addresses the dilution of majority class samples, thereby improving the feature extraction and learning efficiency of the network model for all samples. MHP assigns attention scores to features extracted by MSF at different levels (heads) and clusters various features based on attention scores. These two components enable PointNAC to achieve impressive performance, ranking third both in OA (90.4%) and MIoU (70.7%).

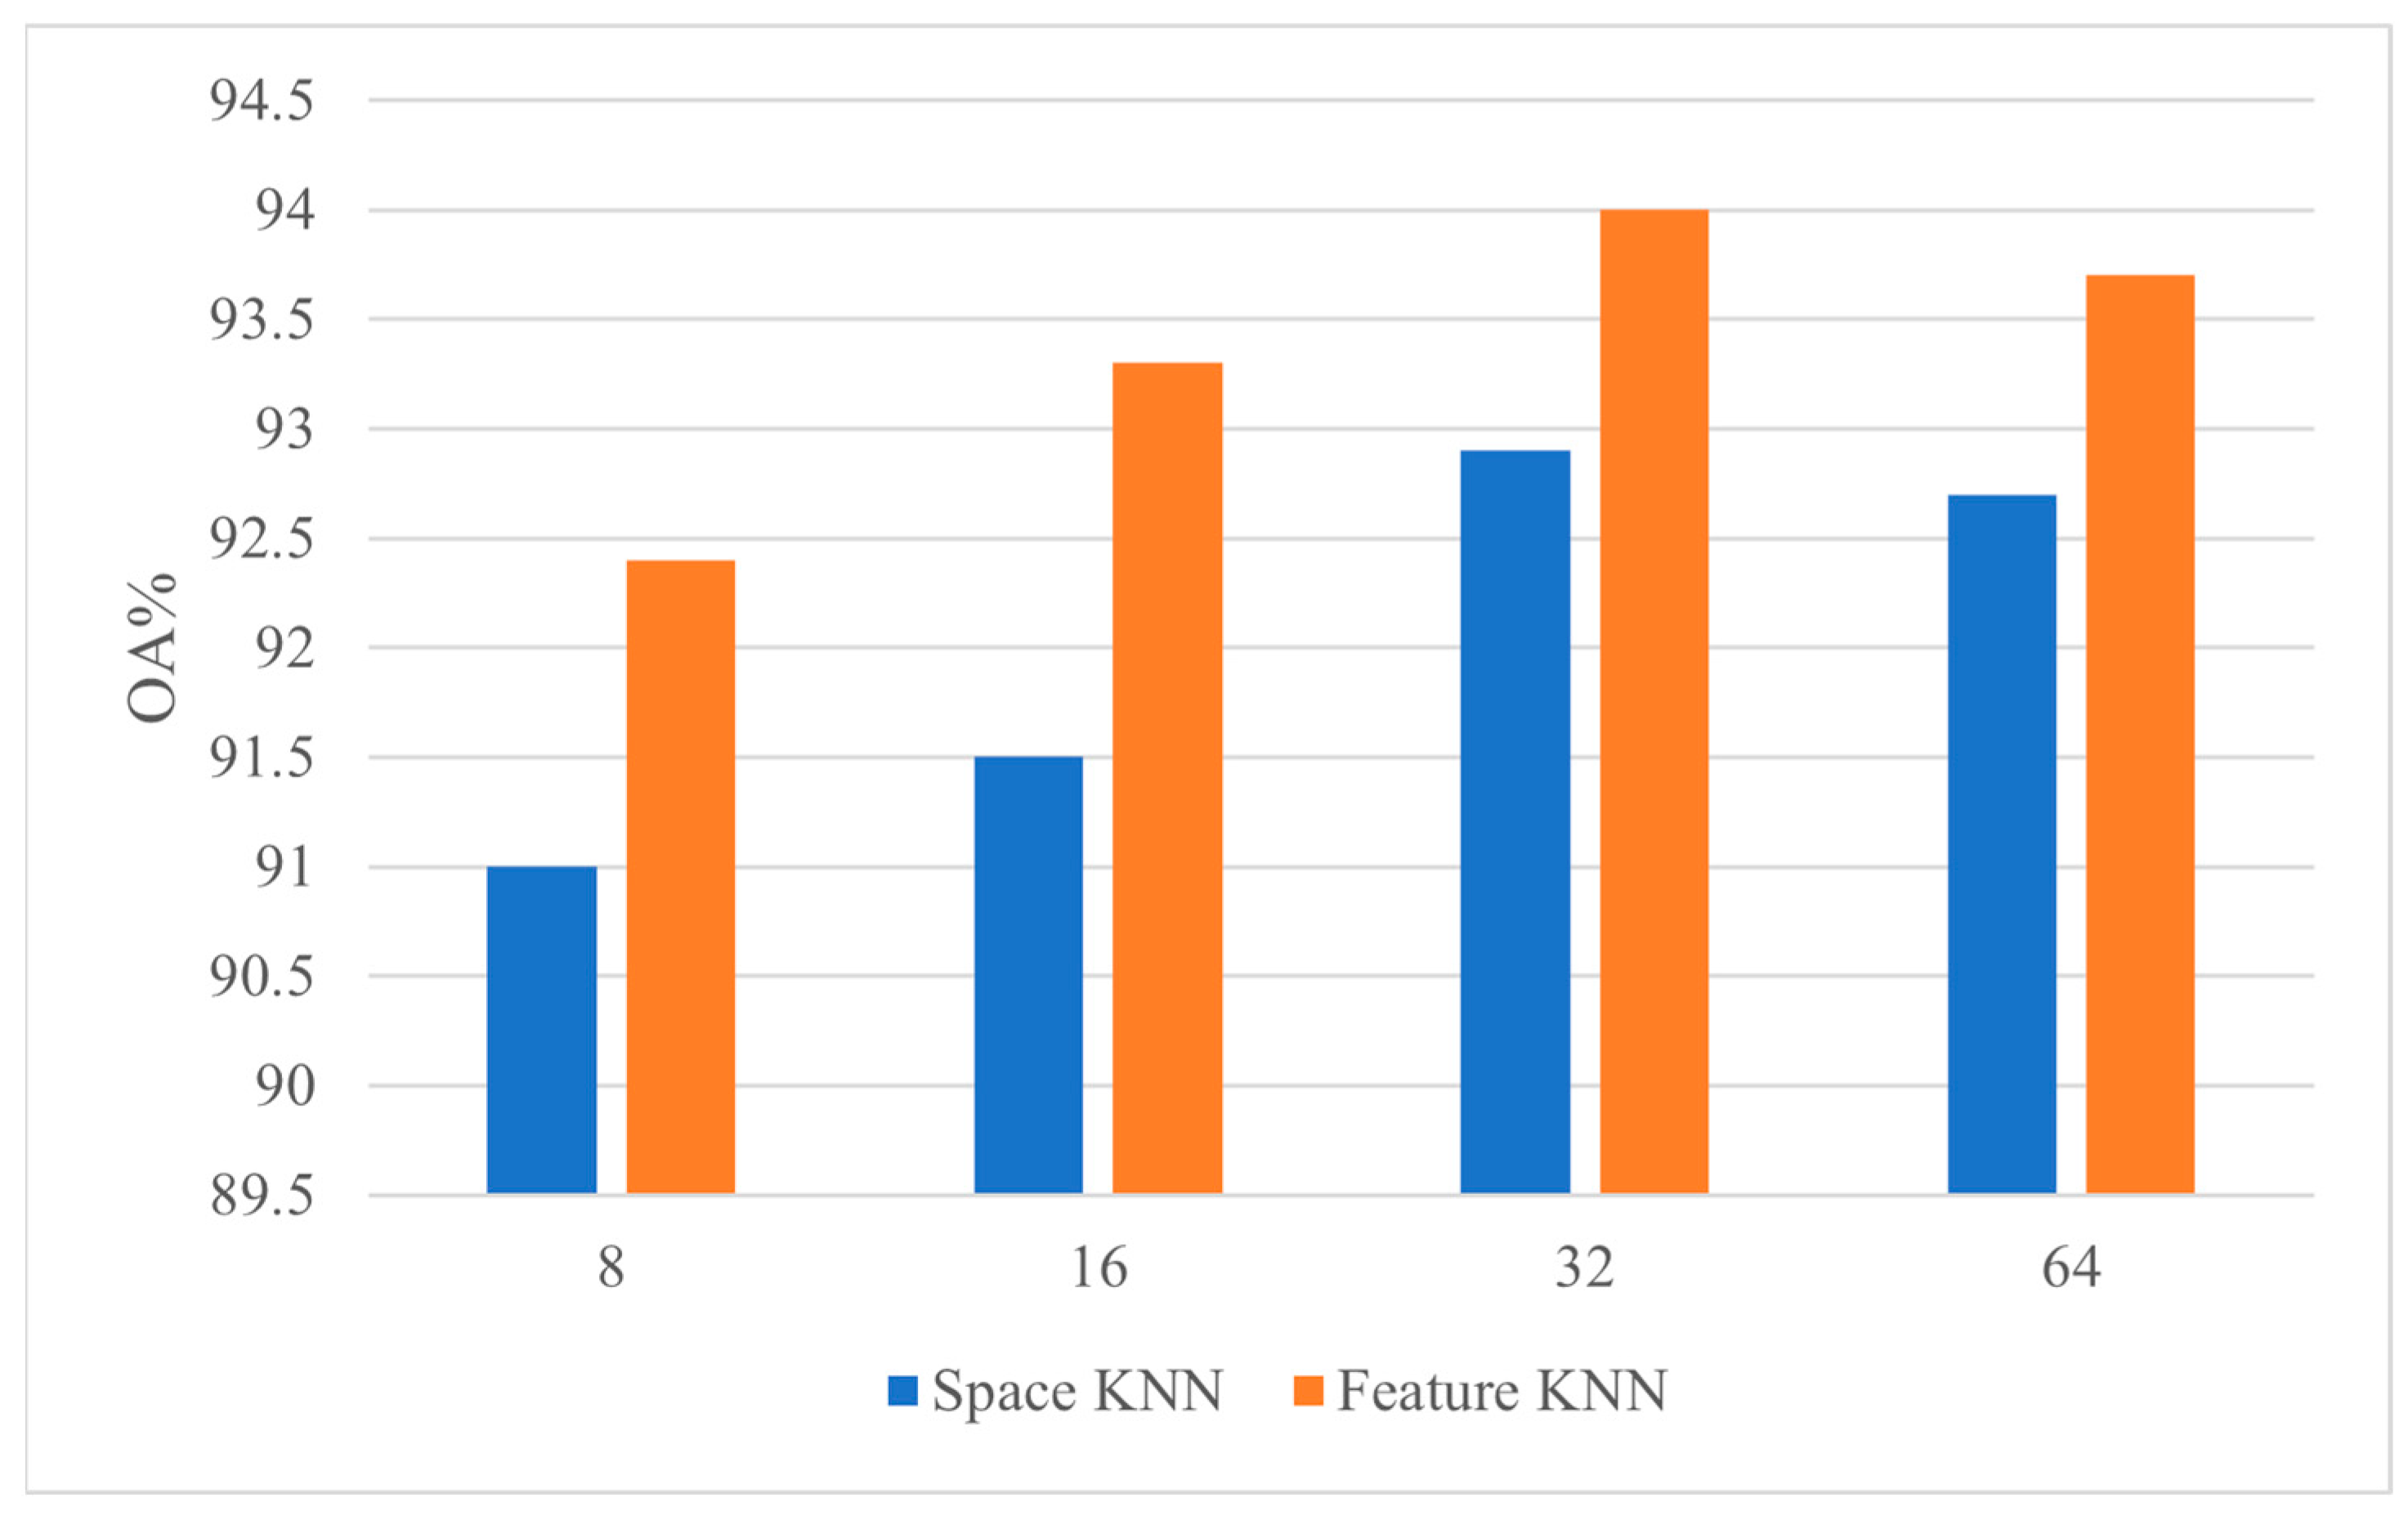
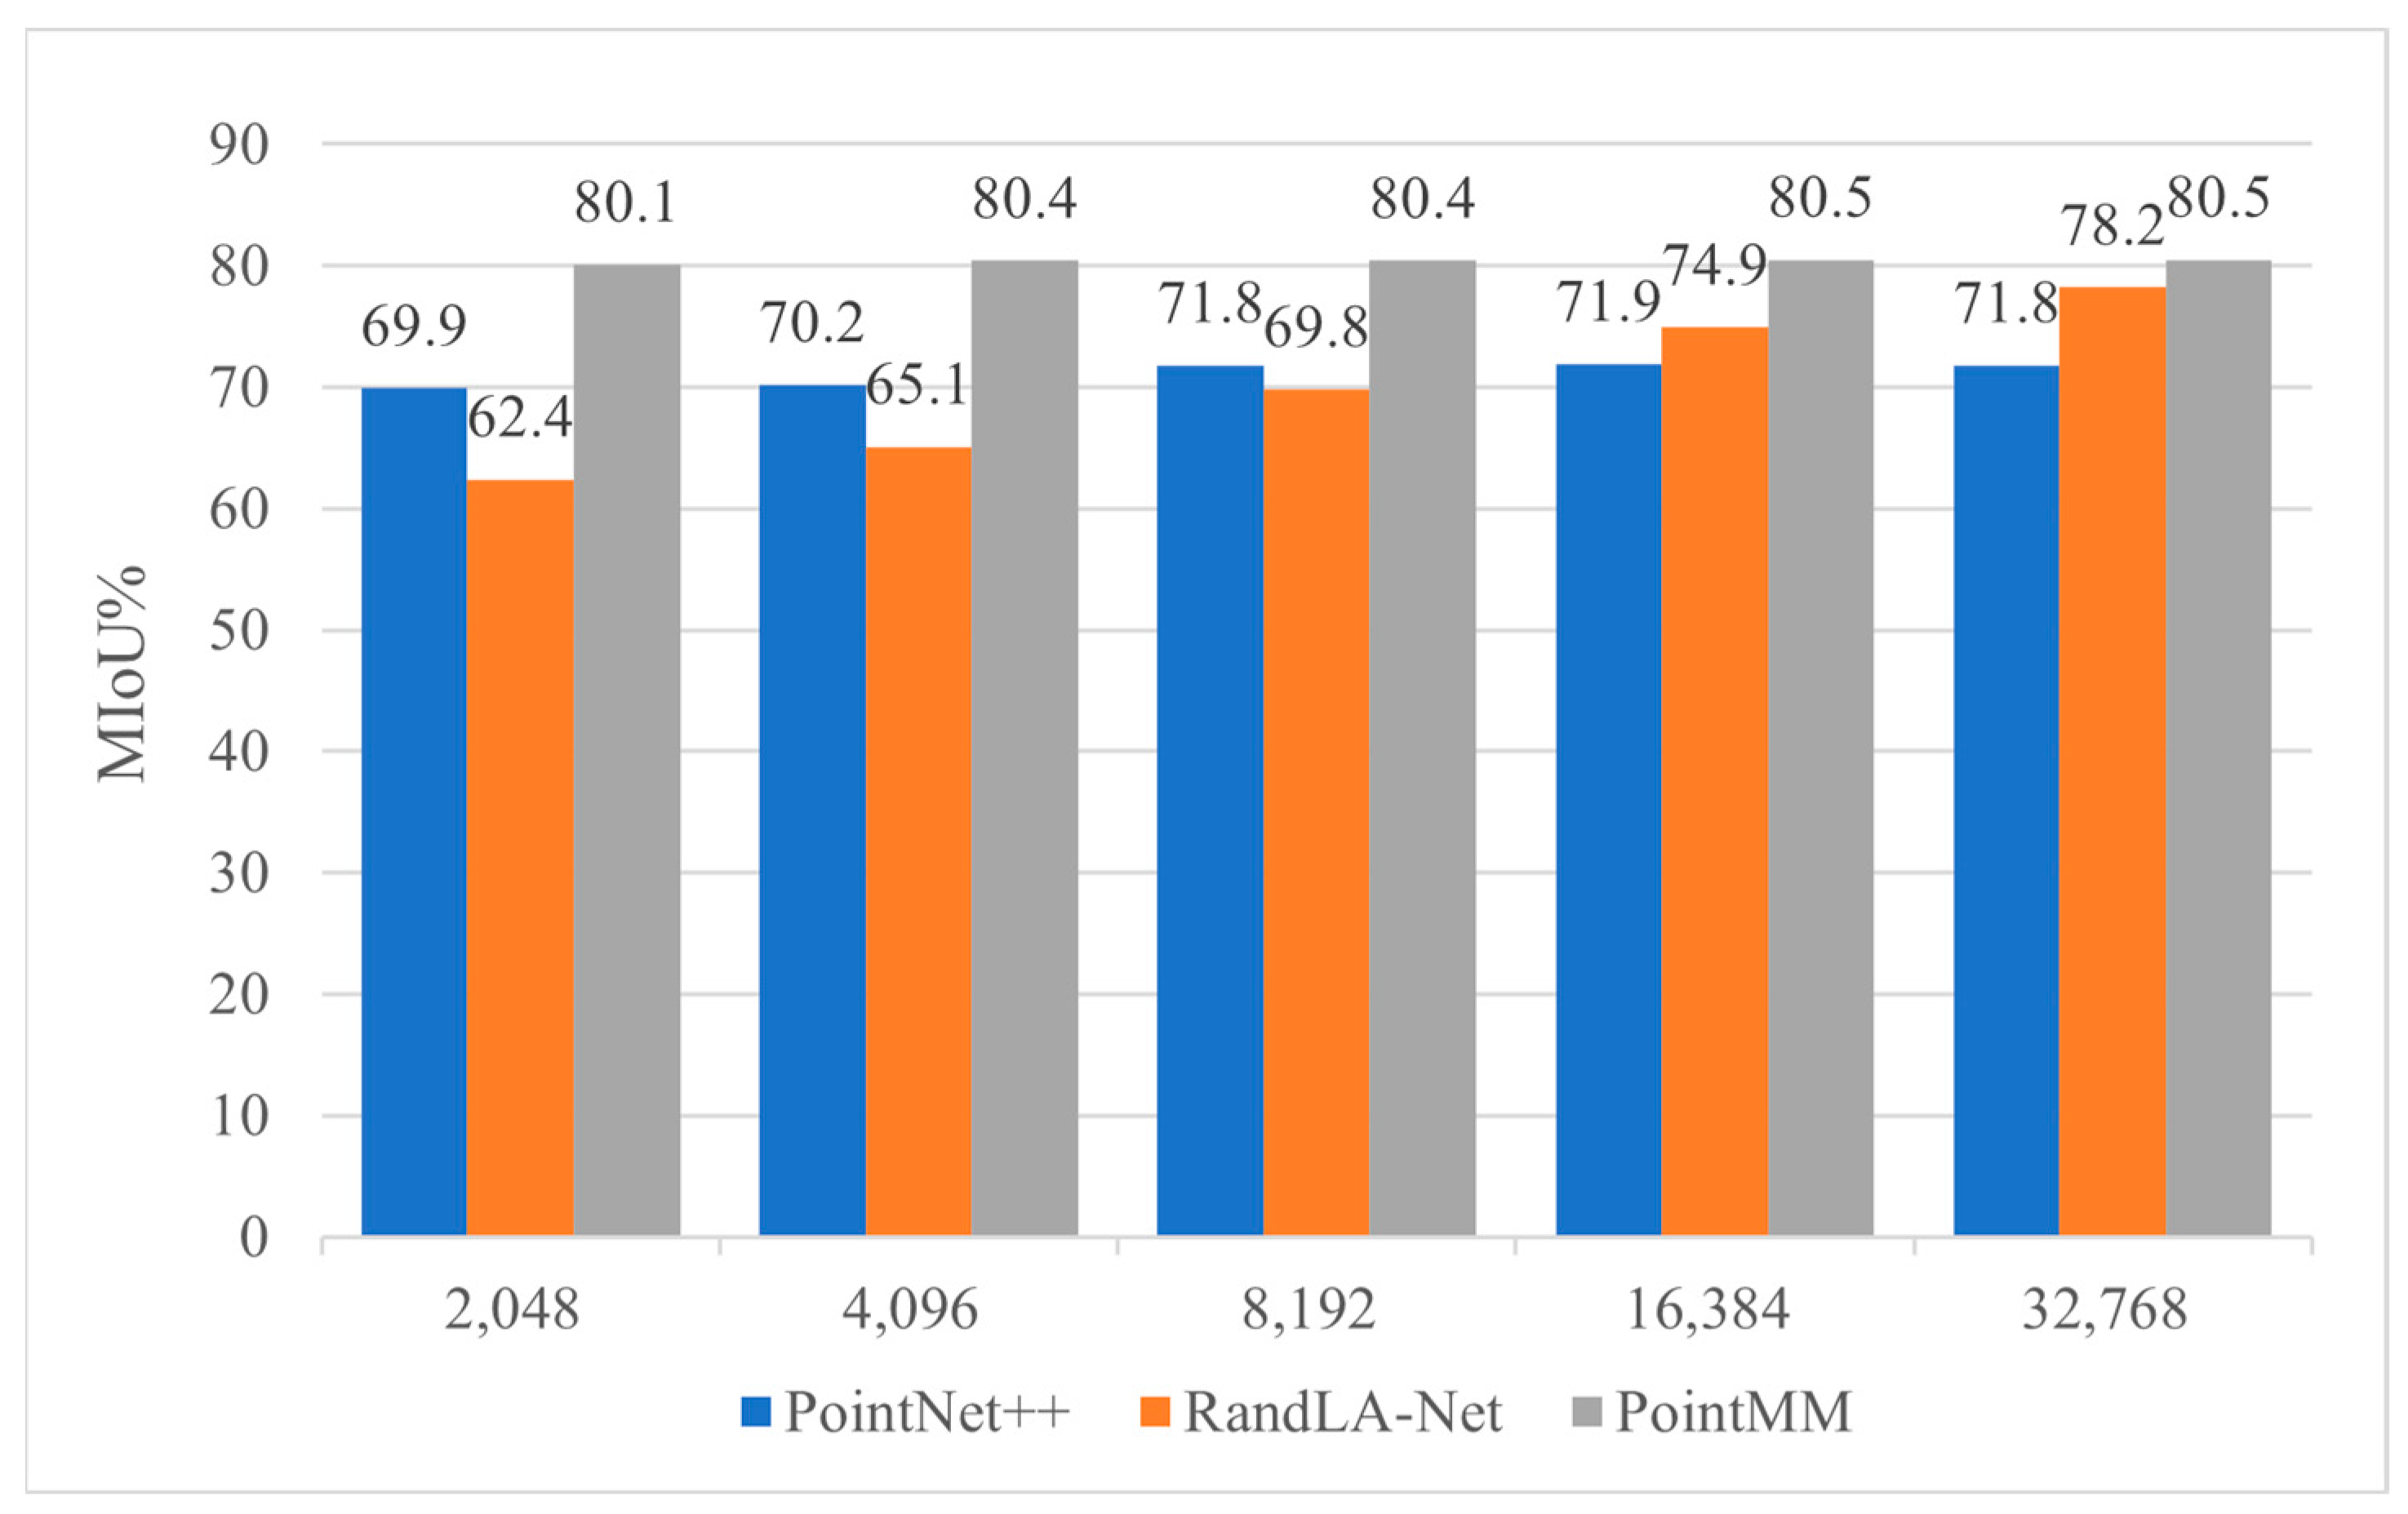
3.2.3. The Experiments of Sampling Points and Neighborhood Points

To further validate the feature learning capabilities of the proposed network at different sampling densities, this section conducts experiments with different numbers of sampled points, specifically 2048, 4096, 8192, 16,384, and 32,768 points. Additionally, we compare our PointNet++, RandLA-Net, and the proposed method, and the MIoU scores for each model are shown in Figure 5.
From Figure 5, it can be observed that the performance of RandLA-Net is entirely dependent on the density of the sampled points. When the point density is not higher than 4096, RandLA-Net’s segmentation performance is significantly inferior to PointNet++ and the approach proposed in this paper, with a maximum MIoU of only 65.1%. In contrast, when the number of sampled points is 2048, the proposed method exhibits a remarkable improvement, surpassing PointNet++ by 10.2%. Even when the number of sampled points is increased to 32,768, the proposed method still achieves an improvement of 8.7%. This indicates that the network model in this paper can effectively learn features from sparse point clouds through the MSF module, while MHP emphasizes the importance of the main features in the feature pooling stage through attention scores. On the other hand, as the number of sampled points in RandLA-Net gradually increases, its network MIoU also grows, eventually reaching 78.5%. However, comparing RandLA-Net with the network proposed in this paper, it is evident that the MIoU difference for RandLA-Net within the sampled point range is 18.1%, while the difference for this paper’s network is only 0.4%. This indicates that the network in this paper has a stronger feature learning capability on point clouds with uneven density distribution compared to RandLA-Net.
To further investigate the influence of different numbers of neighboring points on the network’s feature learning capability, this section conducts experiments using varying numbers of neighboring points, including 8, 16, 32, and 64. Additionally, we compare the OA of Euclidean k-nearest neighbors (KNN) and feature KNN, as shown in Figure 6. From Figure 6, it can be observed that the maximum difference in overall accuracy (OA) for feature KNN is 1.6%, while for spatial KNN it is 1.9%. Moreover, in terms of the segmentation accuracy with 32 neighboring points, feature KNN outperforms spatial KNN by 1.1%. This clearly demonstrates that the neighborhood points extracted by feature KNN are closer in category to their sampling center points, thereby enhancing the network model’s ability to distinguish between points belonging to different classes.

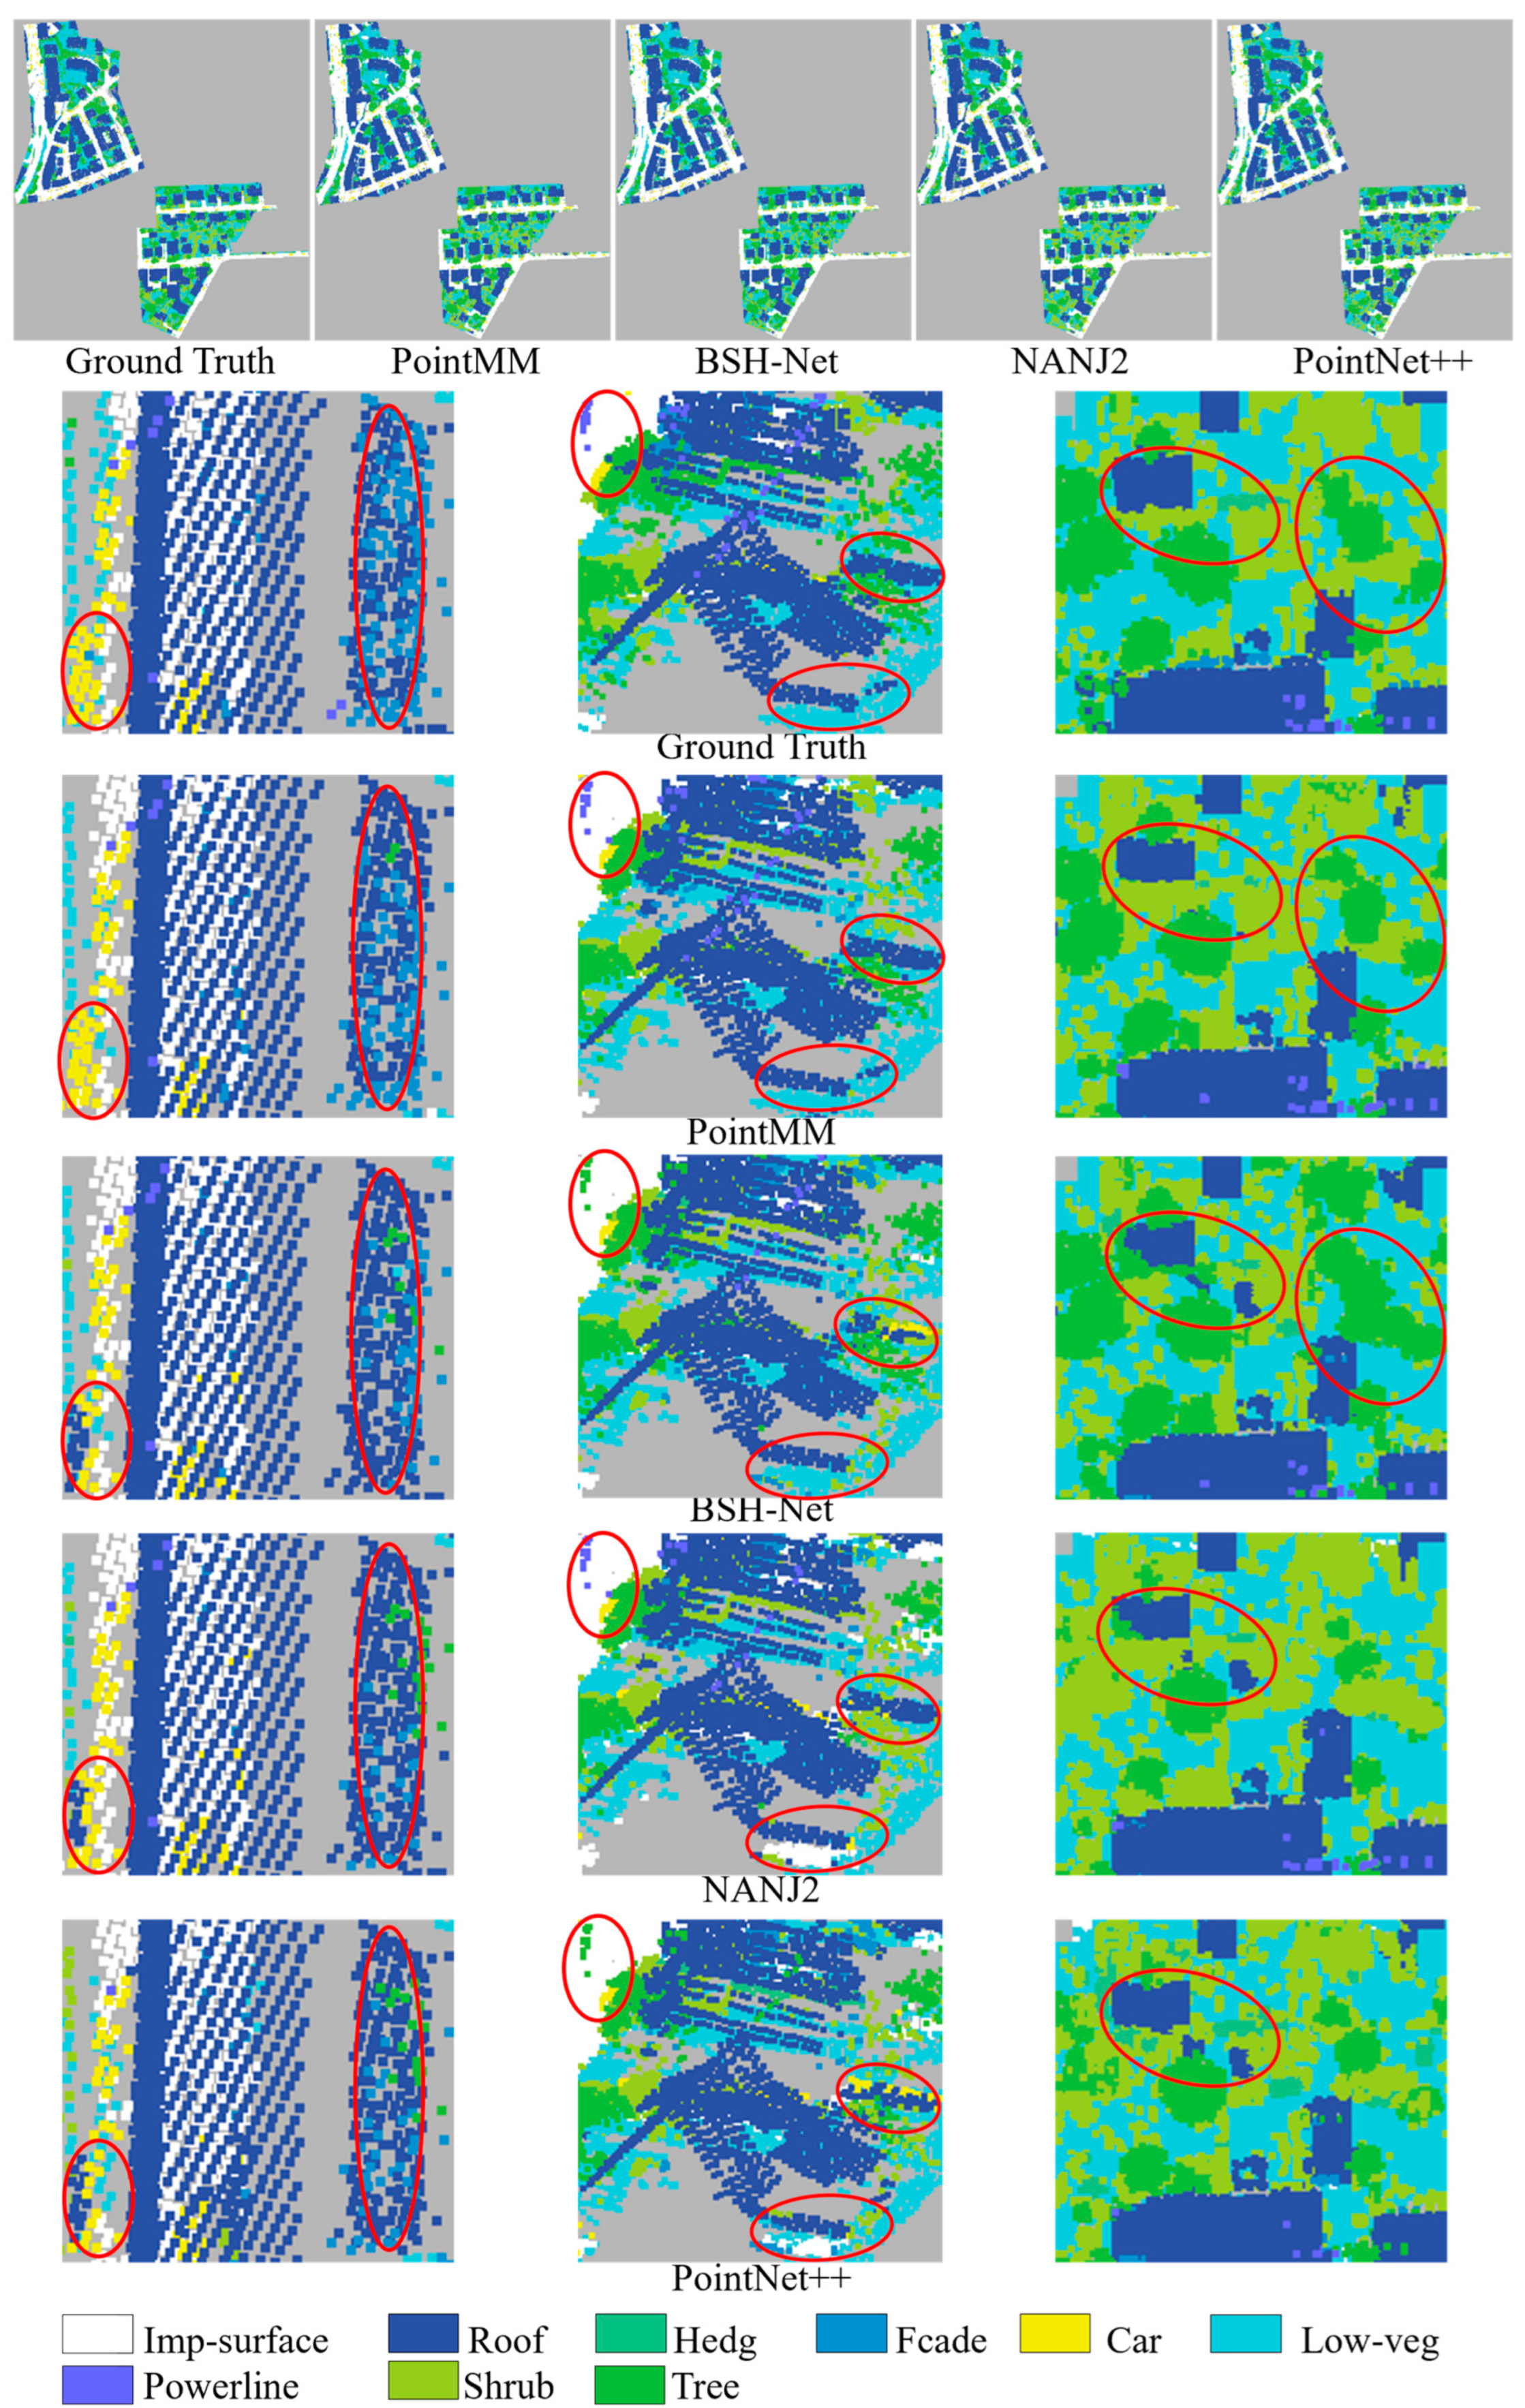
3.3. Semantic Segmentation of Vaihingen Dataset

The International Society for Photogrammetry and Remote Sensing (ISPRS) Vaihingen 3D Semantic Labeling Challenge dataset consists of five training areas and two testing areas. The dataset comprises a total of 1,181,017 points. The original 3D point cloud data is composed of nine categories of objects, including power line, car, facade, and hedge. Each point within the dataset contains both 3D coordinates and RGB information. The distribution of points among these object categories, along with their respective proportions, is presented in Table 6.
From this table, it is evident that, the Vaihingen 3D dataset similar to the S3DIS dataset, it also exhibits a highly imbalanced long-tail distribution. Specifically, objects such as trees, building roofs, low vegetation, and road surfaces represent the majority class samples, while power lines, cars, and hedges are extremely rare minority class samples with very few points. Since the Vaihingen 3D dataset is a large-scale outdoor scene dataset, the minority class samples are highly likely to be lost during sub-area partitioning and FPS sampling. To address this issue, in the training data sampling phase, our network first performs full sampling for minority class point clouds, then downsamples the majority class point clouds, and finally employs the BCS module to assign values to point clouds of various categories. Additionally, in this section, we compare our method with 11 recently published outdoor point cloud semantic segmentation methods, using the F1 score and OA as standard metrics for all categories, as shown in Table 7.
From Table 7, it is evident that, compared to other network models on the Vaihingen 3D dataset, PointMM achieves the best OA, ranks third in average F1 score, with a difference of only 0.9% from the top average F1 score. The proposed method excels in the segmentation accuracy of the façade, roof, shrub, and tree categories, with only a lower segmentation accuracy for power line and hedge. One reason for this is the extremely sparse point cloud count and low geometric feature saliency of these two classes. For instance, the power line consists of sporadic non-continuous line segments distributed on the roof, resembling outliers similar to the roof. As a result, PointMM is likely to confuse power line with the roof during the feature KNN step. However, employing an encoding method with the capability of extracting local fine-grained features in the feature KNN stage, as GACNN [44] does, would not only increase computational costs but also focus too much on extremely scarce minority class targets, restricting the overall OA (83.2%).
Nevertheless, methods such as DPE [48] and HAD [49] sacrifice the segmentation accuracy of other land cover types to enhance the segmentation accuracy of majority classes, particularly impervious surfaces. Their performance in OA and average F1 score needs improvement. NANJ2 [8] projects 3D point clouds onto 2D images and utilizes a mature CNN network to learn target features. This method effectively improves the segmentation accuracy of hedge, low vegetation, and shrub. However, the process of multi-view projection results in the loss of a significant amount of local spatial structure information, making it challenging to further improve the average F1 score (69.3%) and OA (85.2%). D-FCN [50], similar to the former, focuses on learning minority class targets, resulting in an improvement in the average F1 score (70.7%) but a loss in OA (82.2%).
While the random sampling of Randla-Net improves the network’s ability to capture features of minority class samples, it hampers the model’s comprehensive learning of majority class sample features, especially in the scenarios involving spatial overlap and high feature similarity among impervious surface, shrub, tree, and low vegetation. As a result, the overall segmentation accuracy is compromised, reaching only 82.1%. The learning ability of BSH-Net [34] for features of minority class samples is weak, resulting in an unsatisfactory average F1 score (69.5%). PointNAC builds upon the BSH-Net framework by introducing a 4D point pair feature encoding scheme, thereby enhancing the segmentation accuracy of the network. DANCE-Net [51] acknowledges the importance of elevation-remote features but has weak segmentation capabilities for hedge and shrub with overlapping low-level features. Therefore, this method fails to achieve further breakthroughs in OA (83.9%) and average F1 score (71.2%). GANet [52] and GraNet [42] introduce attention mechanisms on top of GCN to enhance the network’s ability to learn local fine-grained structural features, obtaining the second and first average F1 scores, respectively.
Overall, for large-scale outdoor scenes with point cloud data, the proposed method not only effectively learns spatial scale information and intra-class semantic information for various samples through adaptive spatial feature encoding but also achieves a satisfying balance between OA and average F1 score by efficiently transmitting multi-level feature information through multi-head attention pooling. On the other hand, in Figure 7, we present the visualization results of PointNet++, NANJ2, BSH-Net, and the proposed method.
In Figure 7, the first row of images shows the segmentation results of ground truth and the four methods in the testing area. The second to sixth rows display visualizations of local areas, with segmentation errors marked by red circles. Observing the images in the first column of Figure 7, it can be seen that, except for PointMM, the other methods all to some extent misclassify car as roof. Additionally, except for PointMM, the other methods misclassify facade points as tree and roof, while PointMM only misclassifies a small portion of facade points as roof and tree. This strongly indicates that our method outperforms the other three methods in terms of the selection of sampling center points and their neighborhood points, as well as feature learning capabilities.
Comparing the images in the second column of Figure 7 with the data in Table 7, it can be observed that only NANJ2 and PointMM correctly segment the power line within the left red box. The right red box contains roof, low vegetation, and tree. In this context, our method’s segmentation results closely resemble the ground truth dataset. However, BSH-Net misclassifies the roof as a car, NANJ2 misclassifies low vegetation as impervious surface, and PointNet++ exhibits all of the above-mentioned misclassification cases. This demonstrates the effectiveness of our method in learning the spatial scale, positional information, and neighborhood relationships of the point clouds.
Further examination of the images in the third column of Figure 7 reveals that this area is mainly composed of three categories of low-level features: low vegetation, tree, and shrub. These features are similar and spatially close to each other. In the left red box, only PointMM incorrectly classifies a few parts of tree as shrub, while the other methods misclassify some shrub as roof. On the other hand, in the right red box, all four methods misclassify some shrub as roof. However, PointMM correctly segments tree for the most part, while BSH-NET completely misclassifies shrub as tree, and NANJ2 and PointNet++ misclassify half of the tree as shrub. Overall, our method achieves good segmentation performance on the Vaihingen 3D semantic segmentation dataset and maintains consistency with the ground truth in areas with overlapping and stacked features of various land cover types.

4. Conclusions

Although the PointNet++ series of networks consider information about sampled points and their neighborhoods, as well as local–global context information, they often lack attention to the topological structure information of the categories to which the sampled points belong. The proposed PointMM overcomes these limitations by extensively leveraging the topology information of the category to which the sampled points belong through feature KNN. It searches for neighborhood points belonging to the same category as the sampled point, focusing on more detailed spatial relationships, scales, and coordinate information. Additionally, the use of multi-head attention pooling ensures the maximal preservation of features for various sample points. This method effectively enhances the network’s ability to learn fine-grained features of various sample categories from complex scenes. Compared to the literature mentioned in this paper, although PointMM achieved the best OA, the second-best MIoU, and the third-best average F1 score on both the indoor S3DIS dataset and the outdoor Vaihingen 3D dataset, it requires high computation and longer training time. Theoretically, adding the multi-head attention mechanism to the multi-spatial feature encoding module will help extract more accurate features from intra-class neighborhood points, which has not been discussed in this article. Future work will delve into this topic and test the proposed network on a larger scale and in more scenarios.

Author Contributions

Conceptualization, J.W.; methodology, J.W.; software, R.C. and Y.L.; validation, J.W.; formal analysis, Y.L.; investigation, G.X.; resources, R.C.; data curation, R.C.; writing—original draft preparation, R.C. and J.W.; writing—review and editing, R.C. and J.W.; visualization, Y.L.; supervision, J.W.; project administration, R.C. and G.X.; funding acquisition, J.W. and G.X. All authors have read and agreed to the published version of the manuscript.

Funding

The Natural Science Foundation of China under Grant: 42361071 (Funder: Jun Wu); Ningbo Science and Technology Innovation Project under Grant: 2023Z016 (Funder: Gang Xu); Innovation Project of Guangxi Graduate Education under Grant: YCBZ2023136 (Funder: Ying Luo); National Key Research and Development Program of China under Grant: 2023YFB4607000 (Funder: Gang Xu).

Data Availability Statement

The Stanford Large-Scale 3D Indoor Spaces (S3DIS) data set can be found at: http://buildingparser.stanford.edu/dataset.html (accessed on 7 February 2024) The ISPRS Vaihingen data set can be found at: https://www.isprs.org/education/benchmarks/UrbanSemLab/Default.aspx (accessed on 7 February 2024).

Conflicts of Interest

The authors declare no conflicts of interest.

References

  1. Zhang, J.; Xie, H.; Zhang, L.; Lu, Z. Information Extraction and Three-Dimensional Contour Reconstruction of Vehicle Target Based on Multiple Different Pitch-Angle Observation Circular Synthetic Aperture Radar Data. Remote Sens. 2024, 16, 401. [Google Scholar] [CrossRef]
  2. Jiang, Z.; Zhang, Y.; Wang, Z.; Yu, Y.; Zhang, Z.; Zhang, M.; Zhang, L.; Cheng, B. Inter-Domain Invariant Cross-Domain Object Detection Using Style and Content Disentanglement for In-Vehicle Images. Remote Sens. 2024, 16, 304. [Google Scholar] [CrossRef]
  3. Caciora, T.; Jubran, A.; Ilies, D.C.; Hodor, N.; Blaga, L.; Ilies, A.; Grama, V.; Sebesan, B.; Safarov, B.; Ilies, G.; et al. Digitization of the Built Cultural Heritage: An Integrated Methodology for Preservation and Accessibilization of an Art Nouveau Museum. Remote Sens. 2023, 15, 5763. [Google Scholar] [CrossRef]
  4. Muumbe, T.P.; Singh, J.; Baade, J.; Raumonen, P.; Coetsee, C.; Thau, C.; Schmullius, C. Individual Tree-Scale Aboveground Biomass Estimation of Woody Vegetation in a Semi-Arid Savanna Using 3D Data. Remote Sens. 2024, 16, 399. [Google Scholar] [CrossRef]
  5. Yu, H.; Yang, Z.; Tan, L.; Wang, Y.; Sun, W.; Sun, M.; Tang, Y. Methods and datasets on semantic segmentation: A review. Neurocomputing 2018, 304, 82–103. [Google Scholar] [CrossRef]
  6. Guo, Y.; Wang, H.; Hu, Q.; Liu, H.; Liu, L.; Bennamoun, M. Deep learning for 3d point clouds: A survey. IEEE Trans. Pattern Anal. Mach. Intell. 2020, 43, 4338–4364. [Google Scholar] [CrossRef] [PubMed]
  7. Yang, Z.; Tan, B.; Pei, H.; Jiang, W. Segmentation and multi-scale convolutional neural network-based classification of airborne laser scanner data. Sensors 2018, 18, 3347. [Google Scholar] [CrossRef]
  8. Zhao, R.; Pang, M.; Wang, J. Classifying airborne LiDAR point clouds via deep features learned by a multi-scale convolutional neural network. Int. J. Geogr. Inf. Sci. 2018, 32, 960–979. [Google Scholar] [CrossRef]
  9. Gerdzhev, M.; Razani, R.; Taghavi, E.; Bingbing, L. Tornado-net: Multiview total variation semantic segmentation with diamond inception module. In Proceedings of the 2021 IEEE International Conference on Robotics and Automation (ICRA), Xi’an, China, 30 May–5 June 2021; IEEE: Piscataway, NJ, USA, 2021; pp. 9543–9549. [Google Scholar]
  10. Qiu, H.; Yu, B.; Tao, D. GFNet: Geometric Flow Network for 3D Point Cloud Semantic Segmentation. arXiv 2022, arXiv:2207.02605. [Google Scholar]
  11. Jing, W.; Zhang, W.; Li, L.; Di, D.; Chen, G.; Wang, J. AGNet: An attention-based graph network for point cloud classification and segmentation. Remote Sens. 2022, 14, 1036. [Google Scholar] [CrossRef]
  12. Lee, M.S.; Yang, S.W.; Han, S.W. Gaia: Graphical information gain based attention network for weakly supervised point cloud semantic segmentation. In Proceedings of the IEEE/CVF Winter Conference on Applications of Computer Vision, Waikoloa, HI, USA, 2–7 January 2023; pp. 582–591. [Google Scholar]
  13. Liu, Z.; Tang, H.; Lin, Y.; Han, S. Point-voxel cnn for efficient 3d deep learning. Adv. Neural Inf. Process. Syst. 2019, 32. [Google Scholar] [CrossRef]
  14. Wang, Z.; Lu, F. VoxSegNet: Volumetric CNNs for Semantic Part Segmentation of 3D Shapes; Institute of Electrical and Electronics Engineers (IEEE): Piscataway, NJ, USA, 2020. [Google Scholar] [CrossRef]
  15. Liu, M.; Zhou, Q.; Zhao, H.; Li, J.; Du, Y.; Keutzer, K.; Du, L.; Zhang, S. Prototype-Voxel Contrastive Learning for LiDAR Point Cloud Panoptic Segmentation. In Proceedings of the 2022 International Conference on Robotics and Automation (ICRA), Philadelphia, PA, USA, 23–27 May 2022; IEEE: Piscataway, NJ, USA, 2022; pp. 9243–9250. [Google Scholar]
  16. Zhou, W.; Zhang, X.; Hao, X.; Wang, D.; He, Y. Multi point-voxel convolution (MPVConv) for deep learning on point clouds. Comput. Graph. 2023, 112, 72–80. [Google Scholar] [CrossRef]
  17. Qi, C.R.; Su, H.; Mo, K.; Guibas, L.J. PointNet: Deep Learning on Point Sets for 3D Classification and Segmentation. In Proceedings of the 2017 IEEE Conference on Computer Vision and Pattern Recognition (CVPR), Honolulu, HI, USA, 21–26 July 2017; IEEE: Piscataway, NJ, USA, 2017. [Google Scholar]
  18. Qi, C.R.; Yi, L.; Su, H.; Guibas, L.J. PointNet++: Deep Hierarchical Feature Learning on Point Sets in a Metric Space. Adv. Neural Inf. Process. Syst. 2017. [Google Scholar] [CrossRef]
  19. Jiang, M.; Wu, Y.; Zhao, T.; Zhao, Z.; Lu, C. Pointsift: A sift-like network module for 3d point cloud semantic segmentation. arXiv 2018, arXiv:1807.00652. [Google Scholar]
  20. Zhao, H.; Jiang, L.; Fu, C.W.; Jia, J. Pointweb: Enhancing local neighborhood features for point cloud processing. In Proceedings of the IEEE/CVF Conference on Computer Vision and Pattern Recognition, Long Beach, CA, USA, 16–17 June 2019; pp. 5565–5573. [Google Scholar]
  21. Su, Z.; Zhou, G.; Luo, F.; Li, S.; Ma, K.K. Semantic Segmentation of 3D Point Clouds Based on High Precision Range Search Network. Remote Sens. 2022, 14, 5649. [Google Scholar] [CrossRef]
  22. Yan, K.; Hu, Q.; Wang, H.; Huang, X.; Li, L.; Ji, S. Continuous mapping convolution for large-scale point clouds semantic segmentation. IEEE Geosci. Remote Sens. Lett. 2021, 19, 1–5. [Google Scholar] [CrossRef]
  23. Zhao, L.; Tao, W. Jsnet++: Dynamic filters and pointwise correlation for 3d point cloud instance and semantic segmentation. IEEE Trans. Circuits Syst. Video Technol. 2022, 33, 1854–1867. [Google Scholar] [CrossRef]
  24. Zhao, L.; Tao, W. JSNet: Joint instance and semantic segmentation of 3D point clouds. In Proceedings of the AAAI Conference on Artificial Intelligence, New York, NY, USA, 7–12 February 2020; Volume 34, pp. 12951–12958. [Google Scholar]
  25. Luo, N.; Yu, H.; Huo, Z.; Liu, J.; Wang, Q.; Xu, Y.; Gao, Y. KVGCN: A KNN searching and VLAD combined graph convolutional network for point cloud segmentation. Remote Sens. 2021, 13, 1003. [Google Scholar] [CrossRef]
  26. Wang, Y.; Zhang, Z.; Zhong, R.; Sun, L.; Leng, S.; Wang, Q. Densely connected graph convolutional network for joint semantic and instance segmentation of indoor point clouds. ISPRS J. Photogramm. Remote Sens. 2021, 182, 67–77. [Google Scholar] [CrossRef]
  27. Zeng, Z.; Xu, Y.; Xie, Z.; Wan, J.; Wu, W.; Dai, W. RG-GCN: A random graph based on graph convolution network for point cloud semantic segmentation. Remote Sens. 2022, 14, 4055. [Google Scholar] [CrossRef]
  28. Chen, L.; Zhang, Q. DDGCN: Graph convolution network based on direction and distance for point cloud learning. Vis. Comput. 2023, 39, 863–873. [Google Scholar] [CrossRef]
  29. Zhang, F.; Xia, X. Cascaded Contextual Reasoning for Large-Scale Point Cloud Semantic Segmentation. IEEE Access 2023, 11, 20755–20768. [Google Scholar] [CrossRef]
  30. Hu, Q.; Yang, B.; Xie, L.; Rosa, S.; Guo, Y.; Wang, Z.; Trigoni, N.; Markham, A. Randla-net: Efficient semantic segmentation of large-scale point clouds. In Proceedings of the IEEE/CVF Conference on Computer Vision and Pattern Recognition, Seattle, WA, USA, 14–19 June 2020; pp. 11108–11117. [Google Scholar]
  31. Du, J.; Cai, G.; Wang, Z.; Huang, S.; Su, J.; Junior, J.M.; Smit, J.; Li, J. ResDLPS-Net: Joint residual-dense optimization for large-scale point cloud semantic segmentation. ISPRS J. Photogramm. Remote Sens. 2021, 182, 37–51. [Google Scholar] [CrossRef]
  32. Zhao, Y.; Ma, X.; Hu, B.; Zhang, Q.; Ye, M.; Zhou, G. A large-scale point cloud semantic segmentation network via local dual features and global correlations. Comput. Graph. 2023, 111, 133–144. [Google Scholar] [CrossRef]
  33. Yin, F.; Huang, Z.; Chen, T.; Luo, G.; Yu, G.; Fu, B. Dcnet: Large-scale point cloud semantic segmentation with discriminative and efficient feature aggregation. IEEE Trans. Circuits Syst. Video Technol. 2023, 33, 4083–4095. [Google Scholar] [CrossRef]
  34. Deng, C.; Peng, Z.; Chen, Z.; Chen, R. Point Cloud Deep Learning Network Based on Balanced Sampling and Hybrid Pooling. Sensors 2023, 23, 981. [Google Scholar] [CrossRef] [PubMed]
  35. Wu, W.; Qi, Z.; Fuxin, L. Pointconv: Deep convolutional networks on 3d point clouds. In Proceedings of the IEEE/CVF Conference on Computer Vision and Pattern Recognition, Long Beach, CA, USA, 15–20 June 2019; pp. 9621–9630. [Google Scholar]
  36. Yan, X.; Zheng, C.; Li, Z.; Wang, S.; Cui, S. Pointasnl: Robust point clouds processing using nonlocal neural networks with adaptive sampling. In Proceedings of the IEEE/CVF Conference on Computer Vision and Pattern Recognition, Seattle, WA, USA, 13–19 June 2020; pp. 5589–5598. [Google Scholar]
  37. Zarzar, J.; Giancola, S.; Ghanem, B. PointRGCN: Graph convolution networks for 3D vehicles detection refinement. arXiv 2019, arXiv:1911.12236. [Google Scholar]
  38. Zhao, H.; Jiang, L.; Jia, J.; Torr, P.H.; Koltun, V. Point transformer. In Proceedings of the IEEE/CVF International Conference on Computer Vision, Montreal, BC, Canada, 11–17 October 2021; pp. 16259–16268. [Google Scholar]
  39. Bai, X.; Luo, Z.; Zhou, L.; Chen, H.; Li, L.; Hu, Z.; Fu, H.; Tai, C.L. Pointdsc: Robust point cloud registration using deep spatial consistency. In Proceedings of the IEEE/CVF Conference on Computer Vision and Pattern Recognition, Nashville, TN, USA, 20–25 June 2021; pp. 15859–15869. [Google Scholar]
  40. Yew, Z.J.; Lee, G.H. Rpm-net: Robust point matching using learned features. In Proceedings of the IEEE/CVF Conference on Computer Vision and Pattern Recognition, Seattle, WA, USA, 13–19 June 2020; pp. 11824–11833. [Google Scholar]
  41. Deng, H.; Birdal, T.; Ilic, S. Ppfnet: Global context aware local features for robust 3d point matching. In Proceedings of the IEEE Conference on Computer Vision and Pattern Recognition, Salt Lake City, UT, USA, 18–23 June 2018; pp. 195–205. [Google Scholar]
  42. Huang, R.; Xu, Y.; Stilla, U. GraNet: Global relation-aware attentional network for semantic segmentation of ALS point clouds. ISPRS J. Photogramm. Remote Sens. 2021, 177, 1–20. [Google Scholar] [CrossRef]
  43. Wen, C.; Li, X.; Yao, X.; Peng, L.; Chi, T. Airborne LiDAR point cloud classification with global-local graph attention convolution neural network. ISPRS J. Photogramm. Remote Sens. 2021, 173, 181–194. [Google Scholar] [CrossRef]
  44. Gao, Y.; Liu, X.; Li, J.; Fang, Z.; Jiang, X.; Huq, K.M. LFT-Net: Local feature transformer network for point clouds analysis. IEEE Trans. Intell. Transp. Syst. 2022, 24, 2158–2168. [Google Scholar] [CrossRef]
  45. Zhang, M.; Kadam, P.; Liu, S.; Kuo, C.C. GSIP: Green semantic segmentation of large-scale indoor point clouds. Pattern Recognit. Lett. 2022, 164, 9–15. [Google Scholar] [CrossRef]
  46. Thomas, H.; Qi, C.R.; Deschaud, J.E.; Marcotegui, B.; Goulette, F.; Guibas, L.J. Kpconv: Flexible and deformable convolution for point clouds. In Proceedings of the IEEE/CVF International Conference on Computer Vision, Seoul, Republic of Korea, 27 October–2 November 2019; pp. 6411–6420. [Google Scholar]
  47. Huang, R.; Xu, Y.; Hong, D.; Yao, W.; Ghamisi, P.; Stilla, U. Deep point embedding for urban classification using ALS point clouds: A new perspective from local to global. ISPRS J. Photogramm. Remote Sens. 2020, 163, 62–81. [Google Scholar] [CrossRef]
  48. Ye, Z.; Xu, Y.; Huang, R.; Tong, X.; Li, X.; Liu, X.; Luan, K.; Hoegner, L.; Stilla, U. LASDU: A Large-Scale Aerial LiDAR Dataset for Semantic Labeling in Dense Urban Areas. Int. J. Geo-Inf. 2020, 9, 450. [Google Scholar] [CrossRef]
  49. Wen, C.; Yang, L.; Li, X.; Peng, L.; Chi, T. Directionally constrained fully convolutional neural network for airborne LiDAR point cloud classification. ISPRS J. Photogramm. Remote Sens. 2020, 162, 50–62. [Google Scholar] [CrossRef]
  50. Li, X.; Wang, L.; Wang, M.; Wen, C.; Fang, Y. DANCE-NET: Density-aware convolution networks with context encoding for airborne LiDAR point cloud classification. ISPRS J. Photogramm. Remote Sens. 2020, 166, 128–139. [Google Scholar] [CrossRef]
  51. Li, W.; Wang, F.D.; Xia, G.S. A geometry-attentional network for ALS point cloud classification. ISPRS J. Photogramm. Remote Sens. 2020, 164, 26–40. [Google Scholar]
  52. Deng, C.; Chen, R.; Tang, W.; Chu, H.; Xu, G.; Cui, Y.; Peng, Z. PointNAC: Copula-Based Point Cloud Semantic Segmentation Network. Symmetry 2023, 15, 2021. [Google Scholar] [CrossRef]
Figure 1. PointMM network structure. (The thin arrow represents the flowchart of the network framework, while the thick arrow indicates the various components of the downsampling layer).
Remotesensing 16 01246 g001
Figure 2. Multi-Spatial Feature Encoding module.
Remotesensing 16 01246 g002
Figure 3. Multi-head attention pooling module.
Remotesensing 16 01246 g003
Figure 4. Segmentation results of each module.
Remotesensing 16 01246 g004
Figure 5. The MIoU of different sampling densities based on area 6.
Remotesensing 16 01246 g005
Figure 6. The OA of different neighborhood points based on area 6.
Remotesensing 16 01246 g006
Figure 7. Segmentation results of different methods. (The red circle represents the incorrectly segmented area).
Remotesensing 16 01246 g007
Table 1. Aera1~5 dataset introduction (%).
ClassNumberProportionClassNumberProportion
ceiling5,721,63621.6table715,2052.7
floor5,138,87719.4chair953,6063.6
wall6,887,15526.0sofa105,9560.4
beam317,8691.2Bookcase1,456,8985.5
column397,3361.5board264,8901.0
window529,7812.0clutter2,595,9279.8
door1,403,9205.3All26,489,056100
Table 2. Each module introduction.
NameModule
PointNet++Baseline
+MHPMulti-head attention pooling
+MSFMulti-spatial feature encoding
ALLPointMM
Table 3. Segmentation results of each module on the S3DIS dataset (Area-6) (%).
ModuleMIoUOACeilingFloorWallBeamColumnWindowDoorTableChairSofaBookcaseBoardClutter
Baseline70.287.793.097.374.868.743.277.878.972.476.841.958.766.263.2
MHP73.390.791.497.976.968.046.572.679.275.383.663.264.765.367.8
MSF78.092.793.397.280.676.459.573.583.874.583.576.868.577.069.7
ALL80.494.094.697.882.776.252.977.583.677.886.683.779.176.975.8
Table 4. The training of each module per epoch (seconds).
ModuleTraining Duration for One Epoch
Baseline233.3703
+MHP1104.0414
+MSF681.2939
ALL1604.5551
Table 5. Semantic segmentation accuracy on S3DIS dataset.
MethodGSIPHPRSMCSKVGCNRGGCNLG-NetJSNet++KPConvRandLA-NetBSH-NetPointNACPointTrOurs
OA79.884.786.887.488.188.388.7-88.090.590.990.290.4
Miou48.561.366.860.963.770.862.470.670.066.167.473.570.7
Ceiling91.892.792.494.594.093.794.193.693.1---95.4
Floor89.894.595.894.196.296.497.392.496.1---97.5
Wall73.076.379.579.579.181.378.083.180.6---81.1
Beam26.330.155.853.460.465.241.363.962.4---59.5
Column24.025.543.636.344.351.832.254.348.0---38.8
Window44.663.159.656.860.166.252.066.164.4---66.5
Door55.861.863.463.265.969.770.076.669.4---73.9
Table55.565.667.364.370.869.169.957.869.4---73.0
Chair51.169.370.267.564.975.172.764.076.4---84.0
Sofa10.247.063.154.330.863.937.969.360.0---53.3
Bookcase43.856.159.323.651.963.554.174.964.2---68.1
Board21.860.161.843.152.666.051.361.365.9---58.6
Clutter43.255.156.253.256.458.460.260.360.1---69.5
Table 6. Details of Vaihingen 3D dataset.
ModelPower LineCarFacadeHedgeImpervious SurfaceLow VegetationRoofShrubTree
Training-N546461427,25012,070193,723180,850152,04547,605135,173
Training-P0.072%0.612%3.615%1.601%25.697%23.989%20.168%6.315%17.931%
Testing-N600370811,2247422101,98698,690109,04824,81854,226
Testing-P0.146%0.900%2.726%1.803%24.770%23.970%26.486%6.027%13.170%
Table 7. Segmentation effects of different methods (%).
ModelPower LineCarFacadeHedgeImpervious
Surface
Low
Vegetation
RoofShrubTreeOAAverage
F1
HDA64.268.936.519.299.285.188.237.769.281.263.1
DPE68.175.244.219.599.386.591.139.472.683.266.2
NANJ262.066.742.640.791.288.893.655.982.685.269.3
BSH-NET46.577.857.937.992.982.394.848.686.385.469.5
PointNAC52.976.757.541.193.683.294.950.585.285.970.6
Randla-Net68.876.661.943.891.382.191.145.277.482.170.9
D-FCN70.478.160.537.091.480.293.046.079.482.270.7
Dance-Net68.477.260.238.692.881.693.947.281.483.971.2
GACNN76.077.758.937.893.081.893.146.778.983.271.5
GANet75.477.861.544.291.682.094.449.682.684.573.2
GraNet67.780.962.051.191.782.794.549.982.084.573.6
PointMM60.677.362.337.093.584.096.157.886.487.772.7
Disclaimer/Publisher’s Note: The statements, opinions and data contained in all publications are solely those of the individual author(s) and contributor(s) and not of MDPI and/or the editor(s). MDPI and/or the editor(s) disclaim responsibility for any injury to people or property resulting from any ideas, methods, instructions or products referred to in the content.

