Abstract
The Normalized Difference Vegetation Index (NDVI) is widely used for monitoring vegetation status, as accurate and reliable NDVI time series are crucial for understanding the relationship between environmental conditions, vegetation health, and productivity. Ground digital cameras have been recognized as important potential data sources for validating remote-sensing NDVI products. However, differences in the spectral characteristics and imaging methods between sensors onboard satellites and ground digital cameras hinder direct consistency analyses, thereby limiting the quantitative application of camera-based observations. To address this limitation and meet the needs of vegetation monitoring research and remote-sensing NDVI validation, this study implements a novel NDVI camera. The proposed camera incorporates narrowband dual-pass filters designed to precisely separate red and near-infrared (NIR) spectral bands, which are aligned with the configuration of sensors onboard satellites. Through software-controlled imaging parameters, the camera captures the real radiance of vegetation reflection, ensuring the acquisition of accurate NDVI values while preserving the evolving trends of the vegetation status. The performance of this NDVI camera was evaluated using a hyperspectral spectrometer in the Hulunbuir Grassland over a period of 93 days. The results demonstrate distinct seasonal characteristics in the camera-derived NDVI time series using the Green Chromatic Coordinate (GCC) index. Moreover, in comparison to the GCC index, the camera’s NDVI values exhibit greater consistency with those obtained from the hyperspectral spectrometer, with a mean deviation of 0.04, and a relative root mean square error of 9.68%. This indicates that the narrowband NDVI, compared to traditional color indices like the GCC index, has a stronger ability to accurately capture vegetation changes. Cross-validation using the NDVI results from the camera and the PlanetScope satellite further confirms the potential of the camera-derived NDVI data for consistency analyses with remote sensing-based NDVI products, thus highlighting the potential of camera observations for quantitative applications The research findings emphasize that the novel NDVI camera, based on a narrowband spectral design, not only enables the acquisition of real vegetation index (VI) values but also facilitates the direct validation of vegetation remote-sensing NDVI products.
1. Introduction
Vegetation is an important component of the biosphere, and its dynamic changes serve as crucial indicators of climate and environmental conditions. They are also key to understanding the interactions between the atmosphere, biosphere, and hydrosphere [1]. Therefore, accurately monitoring vegetation status is essential for understanding how ecosystems respond to ongoing climate change.
Vegetation monitoring typically relies on spectral indices calculated from vegetation reflectance in multiple spectral regions [2]. The most used index currently is the Normalized Difference Vegetation Index (NDVI) [3]. It effectively utilizes the differences in vegetation reflectance between the red and near-infrared (NIR) wavelengths [4]. By using the NDVI, researchers and monitoring personnel can obtain crucial information about vegetation. The NDVI provides valuable information on vegetation vigor, coverage, biomass, and other characteristics of green vegetation [5,6,7,8,9]. The NDVI is commonly applied in vegetation dynamics monitoring [10], land surface classification and land-use change analysis [11], crop yield estimation [12], and monitoring vegetation responses to climate change [13]. The reliability of the NDVI directly influences the robustness of these applications [14], making long-term NDVI time-series data crucial in vegetation monitoring, climate change research, ecosystem processes, and other related fields.
Remote-sensing NDVI products play a crucial role in vegetation monitoring at various scales, from regional to global [15]. Ensuring the high quality and consistency of NDVI products is essential for their effective utilization in environmental decision making, as it directly influences the reliability of downstream applications, such as phenological assessments. Quantitative evaluation of satellite-derived NDVI products offers insights into their performance, enabling users to assess their suitability for specific purposes and select optimal data for activities such as agricultural monitoring, food security, forest management, numerical weather prediction, and climate modeling [16]. However, assessing remote-sensing NDVI products poses challenges due to the trade-offs between the spatial and temporal resolutions of sensors [17]. Traditional ground observations, serving as reference data, are limited to point-based comparisons in highly homogeneous areas [18], which are not prevalent in terrestrial landscapes, particularly at satellite resolutions. Consequently, evaluating remote-sensing NDVI products necessitates meticulous field measurements to comprehensively capture spatial variations at study sites. These field operations are resource-intensive, time-consuming, and costly, constraining the representation of vegetation dynamics [15]. To address this limitation and bridge the gap between point and landscape observations, digital camera-based observation methods have gained prominence as a valuable data source for evaluating remote-sensing NDVI products [19]. Images captured with digital cameras facilitate qualitative and quantitative analyses, enabling the characterization of vegetation canopy information through vegetation index (VI) computation. Moreover, the wide field of view (FOV) of digital cameras allows for comprehensive coverage of the vegetation canopy, enabling detailed focus on individual plants and integration across views to obtain vegetation information at the community or ecosystem levels [20]. This enhanced spatial integration surpasses traditional field techniques and aligns better with satellite spatial resolutions. Consequently, ground NDVI cameras serve as effective tools for validating remote-sensing NDVI products, contributing to enhanced finer-scale vegetation monitoring.
Conventional digital cameras are an ideal tool for high-accuracy NDVI observations. Compared to multispectral and hyperspectral cameras, a conventional digital camera is not only cost-effective and lightweight but is also easy to operate for image capturing. The past decade has seen the feasibility of using conventional digital cameras to acquire NDVI data [20,21]. A straightforward approach involves employing a dual-sensor system to calculate the NDVI, with two sensors recording information in the visible and NIR bands separately [22]. The results of this show a good linear relationship with NDVI values measured using spectrometers and sensors onboard satellites. However, this approach requires compensation for the pixel position and optical path alignment in the camera system, adding complexity to the data processing [23]. Currently, emerging digital cameras with integrated filters can record visible and NIR light in designated channels, avoiding image-matching issues in dual-camera systems [2]. Petach et al. [24] used this type of digital camera, switching between color and grayscale modes by controlling the camera’s built-in infrared cut filter. They successfully obtained RGB color images and RGB+NIR grayscale images and calculated the “Camera NDVI”. The effectiveness of this method was validated using narrowband radiometers and remote-sensing data. However, this method ignores the mismatch between the spectral band settings of the camera and the band setting of the satellite sensor, resulting in the “Camera NDVI” not representing true measurements of vegetation reflectance radiance [25]. Consequently, the NDVI values in vegetation areas are mostly negative, and the “Camera NDVI” needs to be scaled using a scaling factor to be compared with satellite remote-sensing NDVI products. However, the scale factor itself introduces uncertainty and potential bias, with substantial variations in scaling factors across different locations, requiring additional validation and calibration efforts that elevate the cost of camera applications [20]. Therefore, although this method improves upon standard color camera indices [26] such as the Green Chromatic Coordinate (GCC) index and the Excess Green Index (ExG) by introducing a wideband NIR component, it still cannot directly achieve numerical consistency analyses with remote-sensing data.
Indeed, differences in the spectral characteristics and imaging methods between sensors onboard satellites and ground digital cameras limit their application in quantitative consistency analyses [27]. The spectral response of the red and NIR bands in conventional digital cameras differs significantly from that of sensors onboard satellites. To improve the ability of digital cameras to acquire high-precision NDVI data, it is necessary to ensure that the spectral settings of digital cameras in the red and NIR bands are like those of sensors onboard satellites, such as by matching the center wavelength and FWHM (full width at half maximum). The filter mechanism in digital cameras allows for the adjustment of band settings, thus in a way achieving consistency with sensors onboard satellites [28]. Nijland et al. [2] tested various methods for extracting NIR information from cameras, such as removing the infrared cut-off filter, adding long-pass filters, and adding dual-bandpass filters, and found that dual-bandpass filters could effectively separate red and NIR band information, thus obtaining narrowband data. The imaging method is another factor that should be addressed when comparing ground NDVI observations with remote-sensing observations. It is well known that sensors onboard satellites directly record a scene’s reflected radiance, while the imaging process of conventional digital cameras undergoes internal image signal processing (ISP). ISP involves various adjustments and enhancements to the image, such as gamma correction and automatic gain, which are beyond user control and can adversely affect the separation of band information, thus compromising the results’ accuracy [23]. Ide et al. [29] have shown that the uncertainty introduced by ISP cannot be disregarded when calculating camera-based VI values. Nijland et al. [2] have identified ISP as the primary obstacle to effective radiometric calibration in cameras. Despite acknowledging the limitations of ISP in quantitative camera applications, researchers have relied on Ide et al.’s [29] approach of analyzing images under specific conditions to mitigate the effects of ISP due to the lack of transparency in camera imaging parameters provided by manufacturers. However, this methodology restricts the data availability and compromises the accuracy of long-term vegetation monitoring. Consequently, conventional digital cameras lack the ability to control ISP, which hinders the acquisition of reliable NDVI values that faithfully represent the actual surface reflectance. Therefore, it is imperative to mitigate the impact of ISP through controlled imaging.
NDVI time series can be acquired at various spatial and temporal scales, including through weekly satellite observations or hourly on-site measurements using ground cameras. However, satellite-derived NDVI data are vulnerable to atmospheric and cloud disturbances, resulting in significant uncertainties in the outcomes. For instance, in regions with frequent cloud cover, the discrepancy in phenological extraction may exceed 20 days [30]. Digital cameras offer a high-quality on-site NDVI measurement approach to enhance vegetation monitoring and the evaluation of satellite-derived NDVI values. Ensuring quantitative consistency and reliability in NDVI time-series observations is crucial for accurate multiscale vegetation dynamic monitoring. Therefore, addressing the disparities in spectral characteristics and imaging techniques between NDVI cameras and sensors onboard satellites is imperative to retrieve ground-based NDVI data that align more closely with satellite data. The main objective of this study is to develop a new NDVI camera that can achieve quantitative consistency analysis with satellite remote-sensing data, providing a more accurate solution for on-site NDVI measurements. Therefore, the specific objectives of this study are as follows: (1) Designing a narrowband dual-bandpass filter and controlling the camera’s imaging process to overcome the differences in spectral characteristics and imaging methods between conventional digital cameras and sensors onboard satellites. (2) Quantitatively evaluating the pre-radiometric and post-radiometric calibration NDVI results obtained with the camera based on measurements from a spectrometer to validate the reliability and accuracy of the NDVI camera. (3) Cross-validating the NDVI camera using satellite data to assess its ability to validate remote-sensing NDVI products and further demonstrate the potential of the NDVI camera in quantitative applications.
Section 2 of this paper commences with an introduction to the design methodology and implementation of the NDVI camera. It proceeds to detail the field validation activities and data-processing methods carried out between June 2022 and September 2022. Section 3 focuses on presenting the validation results for the NDVI camera. Section 4 delves into the relevance and limitations of our work. Lastly, Section 5 provides a summary of the study’s results and conclusions.
2. Materials and Methods
2.1. Camera Design Methodology
2.1.1. Principle of NDVI Camera Design
The newly developed NDVI camera is based on a CMOS image sensor that has a maximum effective pixel count of 2592 × 1944 and an imaging area of 1/2.8″. This CMOS sensor is mounted on a Hisilicon chip (HiSilicon, Shenzhen, China) (Figure 1). The CMOS sensor utilizes a Bayer pattern filter placed on top of its mainboard to capture color images [31]. Moreover, the camera incorporates an IR-Cut filter-switching mechanism, enabling the image sensor to selectively record specific wavelengths of light.
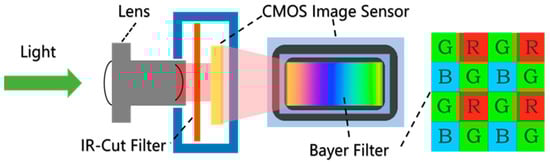
Figure 1.
Conceptual illustration of the camera’s imaging module.
2.1.2. Narrowband Dual-Bandpass Filter Design
When the infrared cut filter is enabled, only the visible bands in the wavelength range of 400–650 nm is allowed to enter the sensor. At this stage, a color RGB image is captured. When the filter is removed, light in the range from visible to NIR can enter the sensor (Figure 2a), resulting in a grayscale image that combines RGB and NIR information. It is important to mention that the camera’s built-in filter can only capture wideband red and NIR information. Therefore, we have designed a narrowband dual-pass filter to accurately separate the narrowband red and NIR information (Figure 2b).
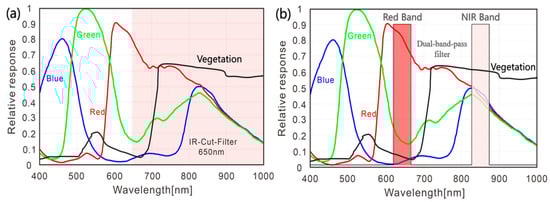
Figure 2.
(a) The CMOS chip, made NIR-sensitive using a low-pass filter; and (b) an ideal narrowband dual-pass filter design concept. The red, green, and blue curves represent the relative responses of various wavelength information in the corresponding channels of the CMOS chip, while the black curve illustrates the spectral reflectance curve of healthy vegetation.
In the design of the NDVI camera, careful attention is given to aligning the spectral characteristics of the narrowband dual-pass filter with the wavelength characteristics of satellite sensors. This ensures consistent center-wavelength and FWHM values, leading to optimal performance (Figure 3 and Table 1). Unlike traditional wideband filters, the narrowband dual-pass filter only permits red light with a center wavelength of 650 nm and NIR light with a center wavelength of 850 nm to pass through. Consequently, it effectively eliminates the transition region between red and NIR light, allowing the camera to directly capture vegetation reflectance information in the red and NIR bands. This simplifies subsequent data-processing tasks. Moreover, this design enables the camera to obtain continuous images from a single sensor, eliminating the need for multiple sensors to acquire different band images [22]. This not only reduces costs but also eliminates issues such as parallax, sensor calibration, and image alignment.
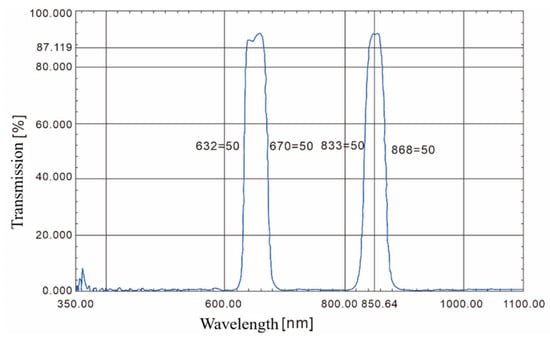
Figure 3.
Bandpass transmittance of the designed narrowband dual-pass filter.

Table 1.
Band configurations of high-resolution sensors in current remote-sensing satellites.
2.1.3. Gamma Control
When a digital camera captures an image, the raw format records the incident sunlight radiation information on the sensor. However, due to the large size of raw-format data, this approach is unsuitable for automatic vegetation monitoring under field conditions with limited computational resources. Sonnentag et al. [26] discovered that compressing raw data into a JPEG format does not significantly compromise the vegetation information. As a result, we save the raw data as JPEG images within the camera for subsequent processing.
In the original digital image, the digital number (DN) of each pixel represents the relative difference in brightness. However, the gamma encoding applied during ISP introduces a nonlinear relationship between the DN values and the intensity of the incident light reflected by the target (Figure 4). The gamma-encoding expression is as follows:
where represents the DN value, represents the intensity of incident light, and represents the gamma value used during camera gamma encoding.
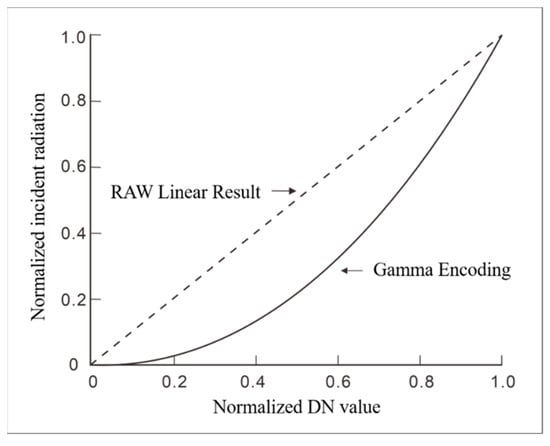
Figure 4.
Illustration of gamma encoding.
In vegetation monitoring and analysis studies, obtaining accurate NDVI calculations relies on acquiring the image’s DN values. Therefore, this study adopts a linear gamma-encoding scheme, where = 1, to simplify the process of calculating actual radiance values from DN values using radiometric calibration methods.
2.2. Study Area and Data
2.2.1. Study Area
The study area is situated at the Hulunbuir Grassland Experimental Station in Inner Mongolia, China (119.421°E, 49.002°N). The experimental station has an elevation of approximately 628 m and experiences a temperate continental monsoon climate. The average annual temperature ranges from −5 °C to 2 °C, and the annual precipitation ranges from 250 to 510 mm, with the majority occurring during the summer. This climatic pattern creates a synchronous water–heat pattern in the region. The grassland in Hulunbuir is characterized by fertile soil resources and a rich diversity of herbaceous plants. The dominant species include Stipa baicalensis, Leymus chinensis, and Filifolium sibiricum [32].
The observation period lasted for 93 days from 26 June to 26 September 2022. Throughout this period, the camera was positioned on a mobile platform and moved above each plot every half an hour to capture nadir-view images (Figure 5). The reliability and accuracy of the NDVI camera were validated by comparing and quantitatively analyzing the temporal trends with synchronous observations from the spectrometer as the ground truth. Additionally, cross-validation was conducted between the camera data and PlanetScope satellite data to assess the camera’s potential for quantitatively validating remote-sensing products.
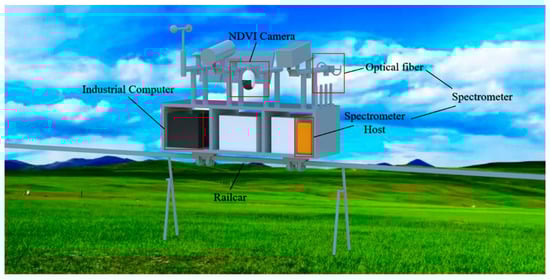
Figure 5.
Conceptual illustration of on-site vegetation observation at the experimental site (observation equipment includes the NDVI camera and spectrometer, both mounted on a railcar and triggered for image capture through an industrial computer).
2.2.2. Data
- NDVI Camera Data
The NDVI camera data comprised wideband visible light (RGB) and narrowband red and near-infrared (RED+NIR) images for each sample plot (Figure 6). These data were collected and uploaded using our automated observation system, which relies on an industrial control computer and an NDVI camera. The automated observation system manages filter switching and captures sequential RGB and RED+NIR images at approximately 30 s intervals. Each image is taken with automatic exposure settings. Subsequently, the images are transmitted to a remote server using FTP every 7 min. During the post-processing phase, the data were filtered based on observation conditions to exclude unsuitable images, including those resulting from abnormal filter switching, periods without sunlight (e.g., before 9:00 and after 16:00), and interference from shadows caused by equipment and track shadows.
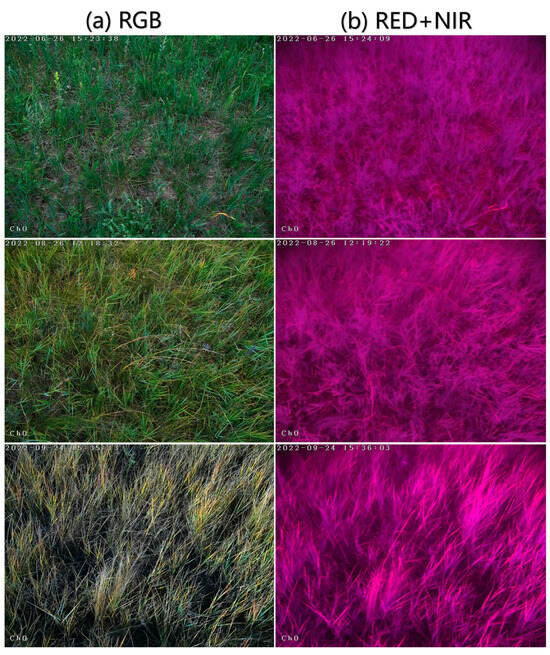
Figure 6.
Examples of the NDVI camera’s time-series images. (a) RGB images, (b) RED+NIR images.
- 2.
- Spectrometer Data
- 3.
- The spectrometer (SpecNet) we used, developed by the company XST (http://www.xingshitu.com (accessed on 20 November 2023)) and calibrated by the National Institute of Metrology, China, has a spectral range of 350–1020 nm and a resolution of 1 nm. It is equipped with a bare fiber-optic sensor (25° FOV) for downward radiance observations (μW/cm2·nm·sr) and a cosine corrector sensor (180° FOV) for upward irradiance observations (μW/cm2·nm).
- 4.
- To ensure accuracy and prevent potential FOV matching issues, this spectrometer was placed near the camera during on-site measurements. The cosine corrector sensor was oriented upwards to measure incident solar radiation, while the bare fiber-optic sensor, with a 25° FOV, was pointed towards the central area of the NDVI camera image to assess canopy reflection radiation. The SpecNet spectrometer and the NDVI camera fields were synchronized in the same triggering and control modes to acquire reflectance data. This synchronization allows for a comparison between the NDVI camera measurements and spectrometer reflectance measurements under consistent conditions.
- 5.
- PlanetScope Satellite Data
The PlanetScope satellite involves a constellation of observation technology comprising around 130 CubeSat 3U (10 × 10 × 30 cm) satellites [33]. All satellites are primarily positioned on sun-synchronous orbits at 475 km, passing the equator between 9:30 and 11:30 (local solar time) [34]. This research utilizes Level 3B surface reflectance (SR) data products from the third-generation PSB.SD sensor, which have undergone sensor calibration, radiometric calibration based on Sentinel-2 remote-sensing images, orthorectification, and atmospheric correction was performed using the 6S radiative transfer model with auxiliary data from MODIS. [35]. The spatial resolution of these products is 3 m, with a positional error of less than 10 m. Data collected with the same generation of PlanetScope sensors exhibit no significant offset. The data comprise multispectral images with 8 bands, covering an area of 32.5 × 19.6 km, with a revisiting period of 1 day. A cross-validation study was conducted using surface reflectance data from the blue band (B2), green band (B4), red band (B6), and NIR band (B8) (Table 2), alongside NDVI camera observations.
Table 2.
Spectral band parameters of the PlanetScope satellite.
To align the camera and satellite pixels accurately, the mean reflectance of a 5 pixel × 5 pixel area centered on the latitude and longitude of the ground stations was chosen for the satellite remote-sensing data corresponding to the ground station locations.
2.3. Methods for Calculating Vegetation Indices
The NDVI camera captures wideband visible and narrowband red and NIR images, providing simplified descriptions of vegetation canopy spectral characteristics. To date, no studies have endeavored to conduct an on-site comparison between narrowband NDVI and camera-based GCC values to evaluate potential variances resulting from differences in spectral characteristics and imaging methods. Therefore, to elucidate the influence of band characteristics and imaging control on real vegetation radiation data, we derived the GCC and NDVI values by extracting band information from the image files. Subsequently, we conducted an in situ comparison of the two indices to ascertain potential variations in the vegetation monitoring data arising from diverse band characteristics and imaging techniques.
One of the VIs is the GCC index. The GCC index is a widely used VI for measuring canopy greenness. It effectively reduces noise from lighting variations and represents seasonal changes in canopy status [36]. It is commonly utilized in studies using wideband digital cameras for vegetation observation. The calculation formula for the index is as follows:
where, for satellite remote-sensing data, R, G, and B represent reflectance values for PlanetScope’s B6, B4, and B2 bands. For the NDVI camera, R, G, and B represent DN values for the red, green, and blue bands in the visible light image.
The NDVI is a commonly used index in vegetation satellite remote sensing, distinguishing healthy green vegetation from soil, buildings, roads, and senescent leaves. Its calculation formula is as follows:
where, for satellite remote-sensing data, and represent reflectance values of PlanetScope’s B6 and B8 bands. In ground cameras, and indicate values of narrowband red and NIR bands calculated from narrowband images obtained using dual-band filters.
Exposure adjustment of raw DN values in the NDVI camera ensures data comparability in different weather conditions [24]. We normalize DN values based on the exposure time for implementing more suitable (in Equation (5)) and (in Equation (6)) algorithms in ground cameras.
Firstly, we normalize the DN values of the red, green, and blue bands in the visible light image, resulting in , , and , respectively. The normalization process is as follows:
where represents the normalized values of the wideband red, green, and blue channels in the visible light image, while t represents the exposure time.
Using dual-band filters, the NDVI camera can capture images containing narrowband red and NIR information. The image also includes three bands, denoted as B1, B2, and B3. Among them, B1 contains most of the information from the red and NIR bands, while B2 primarily captures information from the NIR band with minimal red-band contribution. B3 mainly records NIR information, disregarding the red-band input. We normalize the DN values of each channel in the NIR image. Therefore, the next step is the second stage of processing. The normalized of B3 is , and the difference between the normalized DN of B1 and B3 is . These represent normalized values of the narrowband red and NIR bands. After normalization, the updated formulas for the index and are as follows:
where , , and correspond to the normalized values of the wideband red, green, and blue channels, respectively, in the visible light image;
where represents the normalized value of the narrowband NIR channel, while represents the normalized value of the narrowband red channel.
Equations (2) and (3) calculate average and values within the satellite image’s region of interest. Equations (5) and (6) calculate normalized GCC and NDVI values for our camera. The daily and values for the camera are computed from the effective images captured throughout the day. Additionally, to reduce data noise caused by significant changes in lighting conditions, weather conditions, and other factors, the Savitzky–Golay (SG) filter is applied on the VI time-series data.
2.4. Radiometric Calibration Methods
In the literature, VIs calculated from digital camera DN values are referred to as “camera vegetation indices” [2]. To transform a camera VI into a real VI, radiometric calibration is necessary. This calibration involves establishing a relationship between the DN values and the real radiance or reflectance of the target [37]. Previous studies have used linear relationships based on photon transport principles to successfully convert camera DN values to radiance values, resulting in high calibration with a real VI [38,39]. However, this calibration method does not account for solar irradiance, making it an incomplete representation of the real VI. Petach et al. [24] conducted a field experiment and established a linear model between a digital camera and a radiometer to calibrate the camera for irradiance effects. Although the calibrated NDVI showed improved agreement with the real NDVI in terms of trends, some value differences remained. Therefore, we utilized a spectrometer to calibrate the camera for radiation. To assess the inherent performance of the NDVI camera, we initially confirmed the alignment between the camera and the spectrometer using the raw data. Subsequently, to evaluate the NDVI camera’s capability to capture the actual VI and to quantify the uncertainty associated with the camera’s NDVI measurements, we converted the challenge of the camera’s incapacity to measure solar irradiance into a straightforward calculation of coefficient K based on the spectrometer data (Table 3), followed by conducting radiation correction on the camera. Here, the coefficient K denotes the ratio of solar irradiance from the spectrometer data for the specific bands.
Table 3.
Calculation and transformation of vegetation indices.
2.5. Evaluation Metrics
The coefficient of determination () and the relative root mean square error (rRMSE) are used as metrics to evaluate the consistency and error between the VI values derived from different measurement methods such as cameras, spectrometers, and satellite remote sensing:
where N represents the total number of observations, denotes the NDVI camera data, represents the spectrometer or satellite remote-sensing data, and is the average value of the spectrometer or satellite remote-sensing data. The closer the value is to 1, the smaller the rRMSE, indicating better agreement among the observed results.
Furthermore, to discuss the uncertainty of the NDVI camera data, the signal-to-noise ratio (SNR) and coefficient of variation (CV) are also employed as metrics to measure the fluctuation of the camera’s NDVI data:
where S represents the mean square value of the observed data, N denotes the mean square deviation between the NDVI camera observations and spectrometer reference data, represents the standard deviation of the observed data, and is the mean value of the observed data. A higher signal-to-noise ratio indicates lower data noise and a smaller difference in the coefficient of variation, indicating reduced variability in the data and lower fluctuation levels.
3. Results
3.1. Validation of Camera Vegetation Indices against Spectrometer
3.1.1. Results before Radiometric Calibration
To assess the reliability, accuracy, and monitoring prowess of the NDVI camera in capturing vegetation status information, the data results from the NDVI camera were compared and analyzed with concurrent spectrometer data. The analysis revealed a degree of consistency in the temporal trends of GCC and NDVI values between the spectrometer and NDVI camera. However, discrepancies were observed in the early GCC trend, where the shapes of the camera and spectral data did not align. Specifically, the camera’s GCC data exhibited a less prominent upward trend, whereas the overall NDVI trend from the camera better matched the spectral NDVI trend than the GCC trend. This indicates that the camera-based NDVI outperforms indices relying solely on visible wavelengths in capturing dynamic changes in vegetation canopy trends. Quantitatively, the spectrometer results consistently showed slightly higher values compared to those obtained from the NDVI camera (Figure 7), primarily attributed to the limited dynamic range of DN values in the NDVI camera. As the camera records vegetation reflection as DN values within the range of 0–255, this limits its ability to capture a wider range of signal intensities, resulting in the underestimation or compression of the NDVI values obtained from the camera.
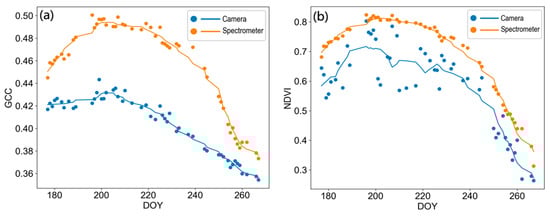
Figure 7.
Comparison of time-series VI data between the NDVI camera and spectrometer. (a) GCC results, (b) NDVI results. The data points represent the VI results, and the curves represent the SG filtering results within a nine-day window.
A linear model was employed to assess the numerical consistency between the NDVI camera and the spectrometer using GCC and NDVI time-series data. Figure 8 shows values for the GCC index and NDVI from both devices surpassing 0.82, with corresponding rRMSE values of 12.32% and 17.88%. These results indicate a good consistency between the NDVI camera and the spectrometer regarding VI outcomes. The results from the NDVI camera can explain over 82% of the actual surface reflectance data, with smaller discrepancies between the NDVI camera and spectrometer data. This result indicates that NDVI cameras can obtain high-quality observational data.
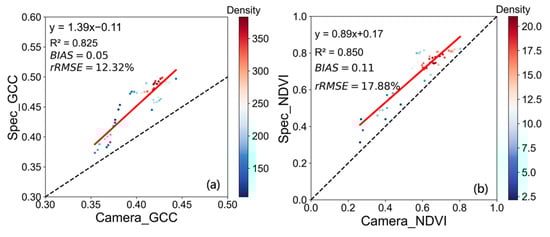
Figure 8.
Scatter density plots of time-series VI data from the NDVI camera and spectrometer. (a) GCC results, (b) NDVI results.
3.1.2. Results after Radiometric Calibration
A spectrometer was utilized for camera calibration. Specifically, based on the spectrometer data, we derived the radiation ratio for the near-infrared (NIR) to red band for NDVI calculations, as well as the ratios for the green band to both the red and blue bands needed for GCC computation. These ratios serve as radiation correction coefficients, denoted as K. Subsequently, we assessed the stability of the coefficient K (Figure 9). It is evident that although some fluctuations exist in the of the NDVI between DOY 180 and DOY 220, the overall trend is gradually stabilizing. The stability of and required for the GCC index is relatively weaker, displaying an increasing trend post DOY 240, yet the overall changes remain within a specific range. Given that the variations in the necessary K values for the VI fluctuate within a limited range with minor differences overall, this suggests the feasibility of selecting a representative K value as the radiation correction coefficient. Further analysis reveals that the variability of K values increases on rainy days, while the K values derived from data around noon on sunny days are closer to the mean K value we adopted. We speculate that weather conditions and the solar altitude angle influenced the spectrometer’s irradiance results. Furthermore, to simplify the calibration process and minimize the need for frequent recalibration, we chose the average value of K as the radiation correction coefficient and applied it in the VI conversion formula (Table 3) for calculating the real VI.
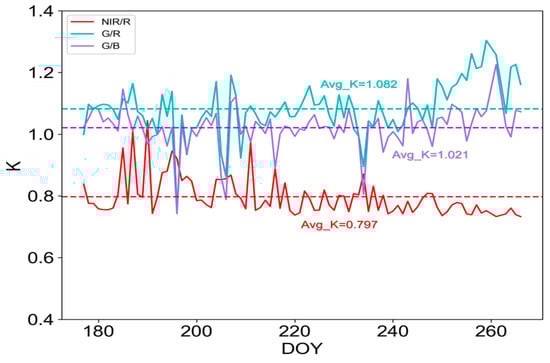
Figure 9.
These curves illustrate the changes in the radiometric calibration coefficients K, with the dashed lines indicating the average K values. The average K values for each color are labeled as Avg_K.
To validate the feasibility of acquiring an accurate VI using the NDVI camera and to evaluate the differences in results before and after radiometric calibration, along with the camera’s quantitative capabilities, Figure 10 presents a comparison of the consistency in the time-series fitting results for the GCC index and NDVI. Overall, significant disparities were observed between the camera’s GCC index and the spectrometer in terms of temporal trends and numerical values, irrespective of whether camera radiometric calibration was conducted. In fact, there are even greater differences after calibration, as indicated by the decrease in R2 and the increase in rRMSE between the two measurements (Figure 8a, Figure 10a, and Figure 11a).
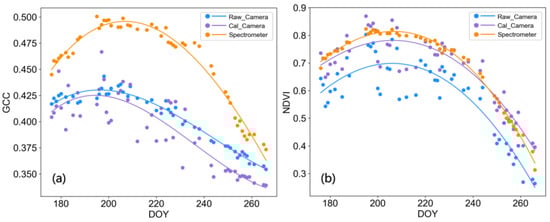
Figure 10.
Consistency comparison of time-series VI results between the camera’s raw VI (Raw_Camera), the radiometrically calibrated real VI (Cal_Camera), and the spectrometer’s index (Spectrometer). (a) GCC results, (b) NDVI results. Data points represent the VI results, and the curves represent the fitting results using the spline function.
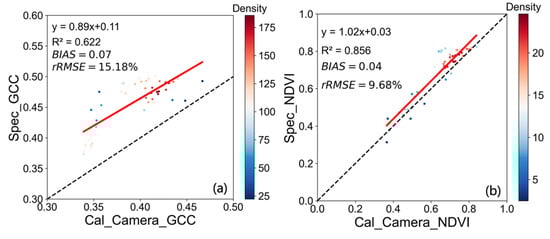
Figure 11.
Scatter density plots of time-series VI data from the NDVI camera and spectrometer for the real VI. (a) GCC results, (b) NDVI results.
In contrast to the camera’s GCC index, the camera NDVI shows consistent temporal trends with the spectrometer’s NDVI (Figure 10b). Post calibration, the agreement between the camera NDVI and the true NDVI improves significantly. The calibrated camera NDVI data demonstrate a more consistent numerical distribution with the spectrometer, fitting closer to the 1:1 line compared to the data before calibration. In addition, the standard deviation of the NDVI data after calibration decreases, with a lower rRMSE (Figure 11b). The average difference decreases from 0.11 to 0.04, with an rRMSE of only 9.68%, indicating quantitative consistency between the calibrated camera NDVI and the real NDVI. This confirms the precision of the NDVI camera in capturing genuine NDVI values. Therefore, a calibrated camera can achieve accurate NDVI measurements, offering a dependable tool for validating NDVI products derived from surface reflectance data and facilitating comprehensive quantitative analyses.
3.2. Results of Remote-Sensing NDVI Products against the Camera NDVI
Temporal trend and quantitative numerical analyses were performed utilizing spectrometer data and PlanetScope satellite data to assess the applicability of PlanetScope. These analyses yielded the following outcomes: Figure 12 illustrates the time-series fitting results of the GCC index and NDVI obtained from the NDVI camera, spectrometer, and satellite remote sensing. The GCC values obtained from the spectrometer and satellite remote sensing demonstrate comparable trends, whereas the NDVI exhibits a high level of consistency. Figure 13 illustrates the consistency of the GCC and NDVI results obtained from the spectrometer and satellite remote sensing. The between the spectrometer and PlanetScope data for the GCC index and the NDVI is 0.747 and 0.908, respectively, with both demonstrating rRMSE values below 9%. These findings indicate consistent representation of VIs from both sources, particularly in terms of their highly aligned NDVI results. The observed consistency among the spectrometer, NDVI camera, and PlanetScope NDVI data suggests that PlanetScope’s NDVI data can effectively cross-validate with the NDVI camera, facilitating the assessment of the camera’s quantitative analysis capability and its consistency with remote-sensing NDVI products.
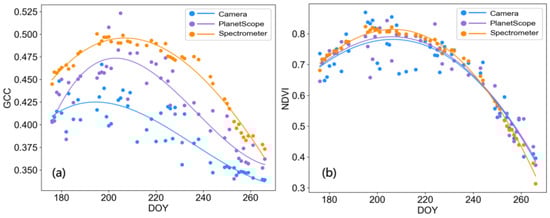
Figure 12.
Consistency comparison of time-series VI results for the real VI from the NDVI camera (Camera), spectrometer (Spectrometer), and satellite remote sensing (PlanetScope). (a) GCC results, (b) NDVI results. Data points represent the VI results, and the curves represent the fitting results using the spline function.
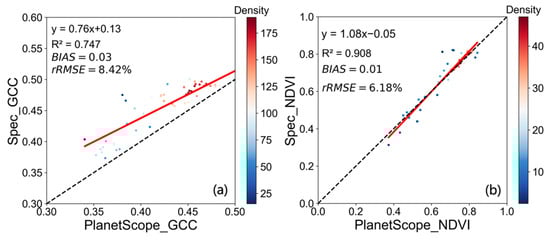
Figure 13.
Scatter density plots of time-series VI data from the spectrometer and satellite remote sensing. (a) GCC results, (b) NDVI results.
The quantitative potential of the NDVI camera was further explored through a comparative analysis with satellite NDVI products. Figure 12 also depicts the time series of the camera’s GCC index and NDVI, along with those of the satellite. The results reveal that the temporal trend of the camera’s GCC index does not align with satellite remote sensing, whereas the temporal trend of the camera’s NDVI closely mirrors that of the satellite remote-sensing NDVI. The fitting trends of the NDVI results from various sources illustrate coherent vegetation canopy change processes, validating the NDVI camera’s capability in characterizing vegetation dynamics.
Figure 14 presents the (= 0.546, = 0.695) and rRMSE ( = 10.56%, = 11.57%) values for the camera and PlanetScope satellite data regarding the GCC index and NDVI. The camera demonstrates good numerical consistency with the remote-sensing satellite data. However, a notable discrepancy exists in the quantitative GCC values (Figure 12a), likely due to divergent spectral characteristics used in the construction of the camera’s GCC index compared to those of the PlanetScope sensor. In contrast, the camera’s NDVI and the PlanetScope sensor’s NDVI exhibit better numerical consistency (Figure 12b), with a consistency level close to 70%. Hence, the NDVI camera serves as a reliable tool for quantitative comparison with remote-sensing NDVI products. It provides a reference standard to validate such products and evaluate associated uncertainties, showcasing its broad application capabilities.
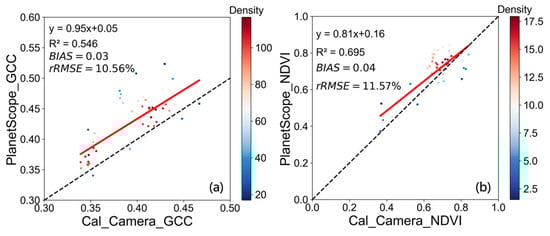
Figure 14.
Scatter density plots of time-series VI data for the real VI from the NDVI camera and satellite remote sensing. (a) GCC results, (b) NDVI results.
3.3. Uncertainty of the Camera’s NDVI
The stability of the NDVI has a significant impact on the reliability of vegetation monitoring [14]. Therefore, to quantify the uncertainty of NDVI camera data and achieve higher precision in NDVI observations for better evaluation of satellite NDVI products, we measured the volatility of the camera NDVI data using the signal-to-noise ratio (SNR) and coefficient of variation (CV). The original camera NDVI had a lower SNR (13.685) compared to the camera’s GCC index (17.135), but radiometric calibration improved the SNR of the camera NDVI to 19.887. Additionally, the CV of the radiometrically calibrated camera NDVI decreased from 0.185 to 0.091, indicating that radiometric calibration effectively reduced variations from external factors, eliminated noise, and improved data stability.
To investigate factors influencing the volatility of the camera NDVI, we focused on the daily data during the period of maximum stability (10 July to 30 July 2022) within the experimental area. Within each day, the camera NDVI displayed higher variability due to rapid changes in the sky conditions, shadow proportions, and solar incidence geometry. Notably, the daily camera NDVI data analyzed during the specified period generally show a consistent pattern of lower values at midday (between 10 am and 2 pm) compared to the morning and evening, with greater stability in the midday values. This suggests that the variation in solar altitude angle influences the daily trend of camera NDVI values. Additionally, the spectrometer exhibits a similar trend to the camera, indicating that this trend is not attributable to the NDVI camera itself. It was observed that under conditions of a stable solar altitude angle and high light intensity, both the camera and spectrometer NDVI values display reduced variability and weaker fluctuations, implying that the fluctuation in the camera NDVI is primarily due to images captured under low-light conditions. Therefore, restricting the time frame of the camera data analysis to periods of high light and around midday can mitigate the uncertainty arising from environmental fluctuations affecting the camera NDVI.
Furthermore, we applied a spline function fitting method to filter the camera NDVI data (Figure 10b and Figure 12b). The filtered camera NDVI data had an SNR of 31.576 and a CV that differed from the spectrometer NDVI data by only 0.098. These results indicate that data filtering can effectively reduce noise, eliminate NDVI fluctuations, and improve the stability of camera NDVI data.
4. Discussion
4.1. Influence of Design Methods on Camera NDVI Measurement
By implementing narrowband dual-pass filters and camera imaging control techniques, we effectively mitigate the discrepancies in spectral characteristics and imaging methods between the NDVI camera and sensors onboard satellites. The camera calculates the NDVI by merging the red and NIR spectral information using narrowband dual-pass filters. The precision of the spectral information directly impacts the accuracy of the camera’s NDVI results, a notion supported by existing research [2,23]. These studies demonstrate that narrowband dual-pass filters offer advantages in accurately separating spectral information and generating better output results with minimal collinearity effects. Figure 2 illustrates a significant overlap in sensitivity among the red, green, and blue channels of the camera. The RGB image is produced using an infrared cut filter, leading to the mixed recording of visible light information and consequently a high level of collinearity within each band. Our implementation of dual-pass filters restricts the recording to narrowband red (650 ± 20 nm) and NIR (850 ± 20 nm) information, successfully reducing band collinearity and providing more refined band data. This distinction is validated by the variance in our GCC and NDVI outcomes (Figure 11 and Figure 13). In addition, the discrepancies in results between the PlanetScope satellite and spectrometer also indirectly suggest that band settings can impact the consistency of the outcomes (Figure 12). A notable variation in GCC values exists between the two, primarily attributed to the distinct visible light band configurations utilized by the satellite and spectrometer for GCC retrieval. While both the PlanetScope satellite and spectrometer can document the rapid growth and full development stages of grasslands, their fluctuating patterns do not align (Figure 12a), with a significant deviation being observed at lower GCC values (Figure 13a). This discrepancy is primarily a result of the disparities in their band settings, leading to the capture of inconsistent spectral data. Conversely, the two instruments exhibit a high level of uniformity in their NDVI values (Figure 12b and Figure 13b), as their configurations for acquiring the NDVI in the red and NIR bands are essentially identical.
In contrast to previous research, our study directly tackles the challenges posed by ISP through direct control of the camera imaging process using a self-designed imaging module. Our findings support previous insights on ISP [2,23,29]. The GCC index of the camera under ISP exhibits significant disparities in temporal trends and values compared to the spectroradiometer (Figure 11a). Conversely, the camera’s NDVI results without ISP align with those of the spectroradiometer (Figure 10b). The divergent GCC index and the strong similarity between the NDVI measurements underscore the pivotal role of precisely controlling the camera imaging process in achieving accurate outcomes. Our results differ from the perspective of Nijland et al. [2], primarily due to our method of regulating the camera imaging process for the NDVI. Nijland et al. argue that capturing images including red and NIR band information is not more valuable for monitoring vegetation status than traditional RGB images. However, our camera-based NDVI offers distinctive vegetation information, exhibiting superior accuracy compared to VIs derived from RGB images, thereby enhancing the precision of monitoring vegetation canopy status. Furthermore, a camera-based NDVI can provide direct and dependable validation data for satellite remote-sensing NDVI products. In contrast to conventional cameras, our NDVI camera holds greater potential for quantitative applications.
4.2. Impact of Radiometric Calibration
Radiometric calibration establishes a correlation between an image’s DN values and the real radiance or reflectance of the target [37]. Accurate VIs require precise calibration. Leveraging the in situ observation capability and high temporal resolution of the NDVI camera, we conducted field experiments and found that a single radiometric calibration coefficient has good applicability in camera calibration. This finding differs slightly from previous research on the radiometric calibration of digital cameras. Berra et al. [40] reported a poor performance of calibration coefficients in field-based temporal observations, suggesting their lack of suitability for varying field lighting conditions. This discrepancy may stem from variations in the definition of radiometric calibration. Berra et al. assumed a linear relationship between the camera’s DN values and reflectance, while principles of photon transport show that DN values primarily represent incident photon quantity [38], which is closer to the concept of radiance. Therefore, directly establishing a linear model between DN values and reflectance overlooks the influence of irradiance. Considering this, it may be more accurate to attempt a linear model that establishes a calibration relationship between DN values and radiance. Although Zhou et al. [41] argued that the response of CMOS sensors to radiance is nonlinear, this is mainly influenced by internal camera ISP, such as gamma encoding. We addressed the limitations of nonlinear factors in NDVI measurements by controlling the camera’s imaging process and performed radiometric calibration of the NDVI camera based on the linear relationship between DN values and radiance. The results demonstrate that the calibrated camera NDVI exhibits a numerical distribution that is consistent with actual surface reflectance data and smaller numerical differences (Figure 11b). Consequently, the calibrated NDVI camera provides physically significant, high-precision NDVI observations that can validate the derived NDVI products from actual surface reflectance data (Figure 11b and Figure 14b).
Radiometric calibration can make the NDVI camera more accurate, but the premise is to adopt an effective calibration method. In contrast to complex approaches [42], we utilize a straightforward calibration method that offers simplicity and ease of implementation. By computing the coefficients K for VI computation using our proposed formula transformation, researchers can obtain accurate VI values through field measurements. Nevertheless, this method is reliant on synchronous solar radiation data, limiting its feasibility. Another straightforward approach involves placing two or more standard reference panels with different reflectance levels within the camera’s field of view and establishing a linear relationship model between the camera’s DN values and solar radiation to calibrate the camera [21]. Although this empirical linear calibration method is useful for complex vegetation types and diverse weather conditions, it disregards nonlinear factors caused by internal camera ISP. Additional challenges arise from weathering effects on standard reference panels, resulting in overestimated camera measurements, significant temporal fluctuations [43], and discrepancies in illumination and sun incidence geometry between the reference panels and the actual vegetation, thus influencing quantitative results [44]. While recent studies have explored machine learning methods for radiometric calibration possibilities [45], these methods still require calibration using reference boards and necessitate retraining when the camera is deployed in different environments to adapt to new lighting conditions and field scenarios, which currently limits their practicality.
Effective radiometric calibration methods are influenced by multiple factors, which constrain the capacity to accurately measure high-precision NDVI values in field conditions. Nonetheless, our NDVI camera exhibits distinct advantages. Analysis of Figure 11 and Figure 13 reveals that, even in the absence of radiometric calibration, our NDVI camera can acquire high-quality NDVI data. Furthermore, our findings demonstrate that radiation correction significantly diminishes the uncertainty associated with the observed data. Consequently, to enhance the precision of NDVI camera measurements and facilitate broader quantitative applications, future research should prioritize improving existing correction schemes and exploring convenient calibration methods suitable for NDVI cameras. One potential approach involves determining the camera sensitivity range and conducting further studies to achieve absolute radiometric calibration for the NDVI camera.
4.3. Consistency of Ground NDVI Camera Values and Differences in GCC Values
The NDVI camera enables the acquisition of spectral information on vegetation in visible light and narrowband NIR wavelengths, facilitating the retrieval of the GCC index and NDVI. Field validation trials have illustrated the potential for quantitative consistency analysis between the camera NDVI and ground-truth reflectance results. Whether pre or post radiometric calibration, there is a strong alignment in the seasonal trajectories of the camera NDVI and spectrometer-measured NDVI (Figure 10). In terms of quantitative values, our results indicate that the camera NDVI can explain around 85% of the spectrometer NDVI measurements, and after radiometric calibration, the slope of the camera NDVI and spectrometer NDVI is close to 1, with an intercept close to 0, indicating that the numerical changes in the camera NDVI are almost consistent with the spectrometer. Moreover, post calibration, while the interpretability of the camera GCC index relative to the spectrometer GCC index diminishes and the numerical disparity increases, the convergence of slopes towards 1 underscores the efficacy of radiometric calibration in reducing measurement variability.
The differences in spectral characteristics and imaging control methods between narrowband NDVI and wideband GCC retrieval methods result in variations in their capabilities to characterize vegetation. The NDVI camera lacks imaging control for RGB images, while ISP optimizes RGB images, adversely impacting the distinguishability of the red, green, and blue channels, leading to less consistency in GCC measurements compared to NDVI measurements. The GCC index assesses vegetation greenness by examining the relationship between the green channel and the sum of the RGB channels. The broad RGB bands lead to mixed spectral information recording, causing a lack of specificity in the outcomes. Wideband imaging captures a broader range of wavelengths, encompassing vegetation reflectance and non-vegetation elements, potentially causing the loss of vegetation signal characteristics, and introducing spectral information overlap, thereby introducing associated errors that compromise the accuracy of the derived GCC index. Due to this interference, we found that the camera’s GCC index was not very sensitive to color differences before and after the grass was fully developed (Figure 10a), with weaker dynamic changes in high-value areas (Figure 8a). In contrast, cameras based on narrowband retrieval like the NDVI camera minimize interference and provide precise measurements within specific spectral ranges, making their results more consistent with spectrometers and more accurately displaying changes in grassland trends (Figure 8b).
The NDVI index is closely associated with vegetation structure [6], enabling the detection of changes in vegetation canopy structure that cannot be detected with the GCC index. Therefore, when the narrowband NDVI is available, we recommend using the NDVI as the indicator for vegetation monitoring. On the one hand, this is because the camera GCC index is limited in capturing multidimensional vegetation information due to broadband collinearity and ISP; on the other hand, the GCC index has a too-low dynamic range to characterize the dynamic evolution of vegetation more accurately. However, for applications that only want to observe overall trends, the GCC index is competent. Our NDVI camera allows simultaneous retrieval of NDVI and GCC indices, providing a more comprehensive dataset than using either index alone. This integration provides additional insights for vegetation research, enhances application diversity, and improves the accuracy of vegetation monitoring.
4.4. Advantages of Ground NDVI Camera for Vegetation Monitoring
Numerous studies on vegetation, such as vegetation phenology, frequently necessitate dependable long-term field observations. Ideally, these observations should span multiple years [46]. Specialized cameras with red and NIR sensitivity have been developed and used in ecological studies for precise vegetation monitoring [47,48]. However, these cameras are expensive, inflexible, and require manual intervention for image collection and functionality checks, making them unsuitable for continuous and long-term vegetation monitoring. Our study’s findings demonstrate that our NDVI camera is an effective tool for achieving high-precision NDVI observations, offering advantages in terms of logical consistency, continuity, objectivity, and usability. As a result, it serves as a vital data source for long-term vegetation monitoring research.
The validation results from our NDVI camera show its ability to accurately represent the seasonal characteristics of grassland ecosystems (Figure 10). Therefore, we suggest that the NDVI camera is suitable for vegetation types with distinct seasonal cycles, like crops or deciduous broadleaf forests. However, due to the relatively stable chlorophyll content and phenology of evergreen vegetation, the effectiveness of the camera in tracking the seasonal characteristics of evergreen vegetation with a high LAI is still uncertain. Further investigation is needed for monitoring evergreen vegetation types and assessing the accuracy of our NDVI camera for representing them.
Compared to non-imaging vegetation monitoring methods such as those based on spectrometers, our NDVI camera can provide high-resolution images. The logical consistency of the camera in the imaging process and data processing, combined with the adherence to the principles of optics and camera design, ensures the generation of accurate and reliable image data. Based on image analysis, we can capture other useful information such as weather conditions. Additionally, we have developed a system for vegetation monitoring based on the NDVI camera, enabling remote automated monitoring to maximize the advantages of the camera in terms of continuity, usability, objectivity, and consistency. This system can automate image capture, facilitate real-time analysis, and store results on cloud servers for convenient access and maintenance. The automated observation system developed based on the NDVI camera simplifies camera observations, ensuring consistent and comparable data, which we have confirmed through field experiments. Furthermore, our automated observation system allows the camera to operate in various ecosystems, integrating not only solar power systems but also supporting a 220 V AC power supply. Through our practical verification, our NDVI camera can operate stably under conditions ranging from −40 °C to 60 °C. This enables the NDVI camera to function properly in remote areas or more extreme environments. The strong scalability and superior performance of the NDVI camera allow it to be deployed on a large scale across multiple platforms, providing high-resolution vegetation monitoring data for different spatial scales. This contributes to supporting a vegetation observation network for scientific research, environmental protection, and decision making.
Although our NDVI camera was primarily developed for continuous measurements of high-precision NDVI values, it can easily be adapted for use in various platforms, including installation in greenhouses, agricultural vehicles, and drones, to acquire vegetation information across entire fields. Furthermore, the approach outlined in this paper can be extended to measure other spectral indices or regions of interest.
The NDVI camera presents significant advantages, serving as a robust and dependable tool for long-term vegetation monitoring research and applications. Nonetheless, certain factors may constrain its potential utilization. Research by Filippa et al. [20] revealed that the calculation outcomes of entire images derived from on-site observation cameras are influenced by non-vegetation factors within the FOV, thereby amplifying result uncertainties. Hence, enhancing the precision of NDVI calculations can be achieved by focusing on vegetation areas of interest during image analysis to mitigate the impact of other elements in the FOV. Furthermore, prior studies have underscored the pivotal role of the observation angle of ground cameras in satellite validation [49], suggesting that the observation angle of NDVI cameras similarly influences analysis outcomes. The disparity between the camera’s FOV and satellite pixels, along with the challenges in aligning spatial scales, pose primary obstacles in validating remote-sensing NDVI products [50]. Consequently, future research efforts should pinpoint the sources of uncertainty in NDVI cameras and assess the magnitude of camera NDVI uncertainty to enhance the precision of NDVI observations. Furthermore, it is essential to validate and enhance the suitability of NDVI cameras across diverse environmental conditions through additional practical applications to progress and innovate vegetation monitoring research. For practical implementation, we suggest deploying NDVI cameras in the field according to standardized and regulated protocols, carefully considering errors arising from angle and radiation effects. Prior to field deployment of the NDVI camera, conducting radiometric calibration is recommended. Typically, employing a vertical downward observation approach is advised to mitigate scene–location discrepancies, ensuring the provision of dependable validation data for pertinent satellite remote-sensing products.
5. Conclusions
This paper presents a method and technology for enhancing the accuracy, usability, and customization of ground NDVI measurements. Our NDVI camera accurately detects red and NIR band information aligned with sensors onboard satellites. By controlling the camera imaging process, we overcome the challenge of representing real vegetation radiation information. The research results emphasize the importance of narrowband configuration (the selection of wavelength and bandwidth) and ISP control in ensuring the accuracy of NDVI values obtained from the camera. Validation against spectrometer data collected during simultaneous observations confirmed the reliability and accuracy of the NDVI camera results, highlighting the superior utility of the narrowband NDVI over the GCC index for vegetation monitoring. Furthermore, this study showcases the substantial utility of the NDVI camera for assessing satellite remote-sensing NDVI products through cross-validation with PlanetScope data. Moreover, it was observed that radiometric calibration has the potential to enhance the quantitative applications of the camera, with the uncorrected NDVI results being suitable for trend analyses but posing challenges in direct quantitative applications. Implementing radiometric calibration can enhance the numerical accuracy of the camera-derived NDVI, facilitating quantitative consistency analysis with actual surface reflectance data.
The developed NDVI camera is a high-precision ground NDVI measurement tool that can obtain real NDVI values through radiometric calibration and can retrieve NDVI data that are more consistent with satellites. It has great potential for quantitative applications, enabling consistent quantitative analyses with actual surface reflectance data. It can be used for the reliable and accurate monitoring of vegetation conditions, which is significant in fields such as agriculture, ecology, and environmental research.
Author Contributions
All authors made significant contributions to the work. Specific contributions include research design (Q.Z. and Y.Q.), data collection and analysis (Q.Z.), manuscript preparation (Q.Z. and Y.Q.), and funding acquisition (Y.Q.). All authors have read and agreed to the published version of the manuscript.
Funding
This research was funded by the National Natural Science Foundation of China (No. 42192580, No. 42192581).
Data Availability Statement
The raw data supporting the conclusions of this article will be made available by the authors on request.
Conflicts of Interest
The authors declare no conflict of interest.
References
- Fu, Y.; Li, X.; Zhou, X.; Geng, X.; Guo, Y.; Zhang, Y. Progress in plant phenology modeling under global climate change. Sci. China Earth Sci. 2020, 63, 1237–1247. [Google Scholar] [CrossRef]
- Nijland, W.; de Jong, R.; de Jong, S.M.; Wulder, M.A.; Bater, C.W.; Coops, N.C. Monitoring plant condition and phenology using infrared sensitive consumer grade digital cameras. Agric. For. Meteorol. 2014, 184, 98–106. [Google Scholar] [CrossRef]
- Tucker, C.J. Red and photographic infrared linear combinations for monitoring vegetation. Remote Sens. Environ. 1979, 8, 127–150. [Google Scholar] [CrossRef]
- Rabatel, G.; Gorretta, N.; Labbé, S. Getting simultaneous red and near-infrared band data from a single digital camera for plant monitoring applications: Theoretical and practical study. Biosyst. Eng. 2014, 117, 2–14. [Google Scholar] [CrossRef]
- Pettorelli, N.; Vik, J.O.; Mysterud, A.; Gaillard, J.; Tucker, C.J.; Stenseth, N.C. Using the satellite-derived NDVI to assess ecological responses to environmental change. Trends Ecol. Evol. 2005, 20, 503–510. [Google Scholar] [CrossRef] [PubMed]
- Tian, J.; Wang, L.; Li, X.; Gong, H.; Shi, C.; Zhong, R.; Liu, X. Comparison of UAV and WorldView-2 imagery for mapping leaf area index of mangrove forest. Int. J. Appl. Earth Obs. 2017, 61, 22–31. [Google Scholar] [CrossRef]
- Zhu, X.; Liu, D. Improving forest aboveground biomass estimation using seasonal Landsat NDVI time-series. ISPRS J. Photogramm. Remote Sens. 2015, 102, 222–231. [Google Scholar] [CrossRef]
- Vicente-Serrano, S.M.; Camarero, J.J.; Olano, J.M.; Martín-Hernández, N.; Peña-Gallardo, M.; Tomás-Burguera, M.; Gazol, A.; Azorin-Molina, C.; Bhuyan, U.; El Kenawy, A. Diverse relationships between forest growth and the Normalized Difference Vegetation Index at a global scale. Remote Sens. Environ. 2016, 187, 14–29. [Google Scholar] [CrossRef]
- Dutrieux, L.P.; Verbesselt, J.; Kooistra, L.; Herold, M. Monitoring forest cover loss using multiple data streams, a case study of a tropical dry forest in Bolivia. ISPRS J. Photogramm. Remote Sens. 2015, 107, 112–125. [Google Scholar] [CrossRef]
- Forkel, M.; Carvalhais, N.; Verbesselt, J.; Mahecha, M.; Neigh, C.; Reichstein, M. Trend Change Detection in NDVI Time Series: Effects of Inter-Annual Variability and Methodology. Remote Sens. 2013, 5, 2113–2144. [Google Scholar] [CrossRef]
- Landmann, T.; Schramm, M.; Huettich, C.; Dech, S. MODIS-based change vector analysis for assessing wetland dynamics in Southern Africa. Remote Sens. Lett. 2013, 4, 104–113. [Google Scholar] [CrossRef]
- Gu, X.; He, X.; Guo, W.; Huang, W.; Yan, R. Maize yield estimation at province scale by interpolation of TM and MODIS time-series images. Trans. Chin. Soc. Agric. Eng. 2010, 26, 53–58. [Google Scholar]
- Soudani, K.; Hmimina, G.; Delpierre, N.; Pontailler, J.Y.; Aubinet, M.; Bonal, D.; Caquet, B.; de Grandcourt, A.; Burban, B.; Flechard, C.; et al. Ground-based Network of NDVI measurements for tracking temporal dynamics of canopy structure and vegetation phenology in different biomes. Remote Sens. Environ. 2012, 123, 234–245. [Google Scholar] [CrossRef]
- Butt, B. Environmental indicators and governance. Curr. Opin. Environ. Sustain. 2018, 32, 84–89. [Google Scholar] [CrossRef]
- Brown, L.A.; Dash, J.; Ogutu, B.O.; Richardson, A.D. On the relationship between continuous measures of canopy greenness derived using near-surface remote sensing and satellite-derived vegetation products. Agric. For. Meteorol. 2017, 247, 280–292. [Google Scholar] [CrossRef]
- Baret, F.; Weiss, M.; Allard, D.; Garrigues, S.; Leroy, M.; Jeanjean, H.; Fernandes, R.; Myneni, R.; Privette, J.; Morisette, J. VALERI: A network of sites and a methodology for the validation of medium spatial resolution land satellite products. Remote Sens. Environ. 2005, 76, 36–39. [Google Scholar]
- Zhang, X.; Friedl, M.A.; Schaaf, C.B. Global vegetation phenology from Moderate Resolution Imaging Spectroradiometer (MODIS): Evaluation of global patterns and comparison with in situ measurements. J. Geophys. Res. Biogeosciences 2006, 111, 1–14. [Google Scholar] [CrossRef]
- Baret, F.; Camacho, F.; Fang, H.; Garrigues, S.; Gobron, N.; Lang, M.; Lacaze, R.; LeBlanc, S.; Meroni, M.; Martinez, B. Global Leaf Area Index Product Validation Good Practices; Academia Press: Cambridge, MA, USA, 2014. [Google Scholar]
- Brown, T.B.; Hultine, K.R.; Steltzer, H.; Denny, E.G.; Denslow, M.W.; Granados, J.; Henderson, S.; Moore, D.; Nagai, S.; SanClements, M. Using phenocams to monitor our changing Earth: Toward a global phenocam network. Front. Ecol. Environ. 2016, 14, 84–93. [Google Scholar] [CrossRef]
- Filippa, G.; Cremonese, E.; Migliavacca, M.; Galvagno, M.; Sonnentag, O.; Humphreys, E.; Hufkens, K.; Ryu, Y.; Verfaillie, J.; Morra Di Cella, U.; et al. NDVI derived from near-infrared-enabled digital cameras: Applicability across different plant functional types. Agric. For. Meteorol. 2018, 249, 275–285. [Google Scholar] [CrossRef]
- Stamford, J.D.; Vialet-Chabrand, S.; Cameron, I.; Lawson, T. Development of an accurate low cost NDVI imaging system for assessing plant health. Plant Methods 2023, 19, 9. [Google Scholar] [CrossRef]
- Sakamoto, T.; Gitelson, A.A.; Nguy-Robertson, A.L.; Arkebauer, T.J.; Wardlow, B.D.; Suyker, A.E.; Verma, S.B.; Shibayama, M. An alternative method using digital cameras for continuous monitoring of crop status. Agric. For. Meteorol. 2012, 154–155, 113–126. [Google Scholar] [CrossRef]
- Dworak, V.; Selbeck, J.; Dammer, K.; Hoffmann, M.; Zarezadeh, A.A.; Bobda, C. Strategy for the development of a smart NDVI camera system for outdoor plant detection and agricultural embedded systems. Sensors 2013, 13, 1523–1538. [Google Scholar] [CrossRef] [PubMed]
- Petach, A.R.; Toomey, M.; Aubrecht, D.M.; Richardson, A.D. Monitoring vegetation phenology using an infrared-enabled security camera. Agric. For. Meteorol. 2014, 195–196, 143–151. [Google Scholar] [CrossRef]
- Piao, S.; Liu, Q.; Chen, A.; Janssens, I.A.; Fu, Y.; Dai, J.; Liu, L.; Lian, X.; Shen, M.; Zhu, X. Plant phenology and global climate change: Current progresses and challenges. Global Chang. Biol. 2019, 25, 1922–1940. [Google Scholar] [CrossRef] [PubMed]
- Sonnentag, O.; Hufkens, K.; Teshera-Sterne, C.; Young, A.M.; Friedl, M.; Braswell, B.H.; Milliman, T.; Keefe, J.O.; Richardson, A.D. Digital repeat photography for phenological research in forest ecosystems. Agric. For. Meteorol. 2012, 152, 159–177. [Google Scholar] [CrossRef]
- Coops, N.C.; Hilker, T.; Bater, C.W.; Wulder, M.A.; Nielsen, S.E.; McDermid, G.; Stenhouse, G. Linking ground-based to satellite-derived phenological metrics in support of habitat assessment. Remote Sens. Lett. 2012, 3, 191–200. [Google Scholar] [CrossRef]
- Graham, B. Introduction to Sensors for Ranging and Imaging; SciTech Publishing: Nugegoda, Sri Lanka, 2009. [Google Scholar]
- Ide, R.; Oguma, H. Use of digital cameras for phenological observations. Ecol. Inform. 2010, 5, 339–347. [Google Scholar] [CrossRef]
- Zhang, X.; Wang, J.; Gao, F.; Liu, Y.; Schaaf, C.; Friedl, M.; Yu, Y.; Jayavelu, S.; Gray, J.; Liu, L. Exploration of scaling effects on coarse resolution land surface phenology. Remote Sens. Environ. 2017, 190, 318–330. [Google Scholar] [CrossRef]
- Jianya, G.; Zhiyong, X. A Bayer CFA demosaicing method suitable for real-time hardware implementation. Instrumentation 2011, 18, 67–71. [Google Scholar] [CrossRef]
- Kaikai, F.; Shuzhen, L.; Jinqiang, C.; Yuchun, Y.; Xiaoping, X.; Xu, W. Spatial Heterogeneity Anslysis of Soil Respiration in Hulunbuir Grassland. Acta Agrestia Sin. 2022, 30, 205–211. [Google Scholar] [CrossRef]
- Aldeghi, A.; Carn, S.; Escobar-Wolf, R.; Groppelli, G. Volcano Monitoring from Space Using High-Cadence Planet CubeSat Images Applied to Fuego Volcano, Guatemala. Remote Sens. 2019, 11, 2151. [Google Scholar] [CrossRef]
- Cheng, Y.; Vrieling, A.; Fava, F.; Meroni, M.; Marshall, M.; Gachoki, S. Phenology of short vegetation cycles in a Kenyan rangeland from PlanetScope and Sentinel-2. Remote Sens. Environ. 2020, 248, 112004. [Google Scholar] [CrossRef]
- Roy, D.P.; Huang, H.; Houborg, R.; Martins, V.S. A global analysis of the temporal availability of PlanetScope high spatial resolution multi-spectral imagery. Remote Sens. Environ. 2021, 264, 112586. [Google Scholar] [CrossRef]
- Richardson, A.D.; Hufkens, K.; Milliman, T.; Aubrecht, D.M.; Chen, M.; Gray, J.M.; Johnston, M.R.; Keenan, T.F.; Klosterman, S.T.; Kosmala, M.; et al. Tracking vegetation phenology across diverse North American biomes using PhenoCam imagery. Sci. Data 2018, 5, 180028. [Google Scholar] [CrossRef] [PubMed]
- King, D.J. Airborne multispectral digital camera and video sensors: A critical review of system designs and applications. Can. J. Remote Sens. 1995, 21, 245–273. [Google Scholar] [CrossRef]
- Janesick, J.R. Photon Transfer: DN → λ; SPIE Press: Bellingham, WA, USA, 2007; Volume 170, pp. 1–258. [Google Scholar]
- Thapa, S.; Garcia Millan, V.E.; Eklundh, L. Assessing Forest Phenology: A Multi-Scale Comparison of Near-Surface (UAV, Spectral Reflectance Sensor, PhenoCam) and Satellite (MODIS, Sentinel-2) Remote Sensing. Remote Sens. 2021, 13, 1597. [Google Scholar] [CrossRef]
- Berra, E.F.; Gaulton, R.; Barr, S. Commercial off-the-shelf digital cameras on unmanned aerial vehicles for multitemporal monitoring of vegetation reflectance and NDVI. IEEE Trans. Geosci. Remote Sens. 2017, 55, 4878–4886. [Google Scholar] [CrossRef]
- Zhou, X.; Liu, C.; Xue, Y.; Akbar, A.; Jia, S.; Zhou, Y.; Zeng, D. Radiometric calibration of a large-array commodity CMOS multispectral camera for UAV-borne remote sensing. Int. J. Appl. Earth Obs. 2022, 112, 102968. [Google Scholar] [CrossRef]
- Ferrier, G.; Trahair, N.S. Evaluation of apparent surface reflectance estimation methodologies. Int. J. Remote Sens. 1995, 16, 2291–2297. [Google Scholar] [CrossRef]
- Cao, S.; Danielson, B.; Clare, S.; Koenig, S.; Campos-Vargas, C.; Sanchez-Azofeifa, A. Radiometric calibration assessments for UAS-borne multispectral cameras: Laboratory and field protocols. ISPRS J. Photogramm. Remote Sens. 2019, 149, 132–145. [Google Scholar] [CrossRef]
- Sonnentag, O.; Detto, M.; Vargas, R.; Ryu, Y.; Runkle, B.R.K.; Kelly, M.; Baldocchi, D.D. Tracking the structural and functional development of a perennial pepperweed (Lepidium latifolium L.) infestation using a multi-year archive of webcam imagery and eddy covariance measurements. Agric. For. Meteorol. 2011, 151, 916–926. [Google Scholar] [CrossRef]
- Minařík, R.; Langhammer, J.; Hanuš, J. Radiometric and Atmospheric Corrections of Multispectral μMCA Camera for UAV Spectroscopy. Remote Sens. 2019, 11, 2428. [Google Scholar] [CrossRef]
- Schleip, C.; Rutishauser, T.; Luterbacher, J.; Menzel, A. Time series modeling and central European temperature impact assessment of phenological records over the last 250 years. J. Geophys. Res. Biogeosciences 2008, 113, G04026. [Google Scholar] [CrossRef]
- Steltzer, H.; Welker, J.M. Modeling the effect of photosynthetic vegetation properties on the NDVI--LAI relationship. Ecology 2006, 87, 2765–2772. [Google Scholar] [CrossRef] [PubMed]
- Higgins, S.I.; Delgado-Cartay, M.D.; February, E.C.; Combrink, H.J. Is there a temporal niche separation in the leaf phenology of savanna trees and grasses? J. Biogeogr. 2011, 38, 2165–2175. [Google Scholar] [CrossRef]
- Lina, X.; Yonghua, Q.; Chenxi, S.; Huawei, W.; Manlike, A.; Shaomin, L. Comparison of vertical and inclined camera observation on the validation results of remote sensing phenological parameters. Natl. Remote Sens. Bull. 2023, 27, 1–17. [Google Scholar] [CrossRef]
- Hufkens, K.; Friedl, M.; Sonnentag, O.; Braswell, B.H.; Milliman, T.; Richardson, A.D. Linking near-surface and satellite remote sensing measurements of deciduous broadleaf forest phenology. Remote Sens. Environ. 2012, 117, 307–321. [Google Scholar] [CrossRef]
Disclaimer/Publisher’s Note: The statements, opinions and data contained in all publications are solely those of the individual author(s) and contributor(s) and not of MDPI and/or the editor(s). MDPI and/or the editor(s) disclaim responsibility for any injury to people or property resulting from any ideas, methods, instructions or products referred to in the content. |
© 2024 by the authors. Licensee MDPI, Basel, Switzerland. This article is an open access article distributed under the terms and conditions of the Creative Commons Attribution (CC BY) license (https://creativecommons.org/licenses/by/4.0/).