Abstract
The incomplete construction of optical image time series caused by cloud contamination is one of the major limitations facing the application of optical satellite images in crop monitoring. Thus, the construction of a complete optical image time series via image reconstruction of cloud-contaminated regions is essential for thematic mapping in croplands. This study investigates the potential of multi-temporal conditional generative adversarial networks (MTcGANs) that use a single synthetic aperture radar (SAR) image acquired on a prediction date and a pair of SAR and optical images acquired on a reference date in the context of early-stage crop monitoring. MTcGAN has an advantage over conventional SAR-to-optical image translation methods as it allows input data of various compositions. As the prediction performance of MTcGAN depends on the input data composition, the variations in the prediction performance should be assessed for different input data combination cases. Such an assessment was performed through experiments using Sentinel-1 and -2 images acquired in the US Corn Belt. MTcGAN outperformed existing SAR-to-optical image translation methods, including Pix2Pix and supervised CycleGAN (S-CycleGAN), in cases representing various input compositions. In particular, MTcGAN was substantially superior when there was little change in crop vitality between the reference and prediction dates. For the SWIR1 band, the root mean square error of MTcGAN (0.021) for corn was significantly improved by 54.4% and 50.0% compared to Pix2Pix (0.046) and S-CycleGAN (0.042), respectively. Even when there were large changes in crop vitality, the prediction accuracy of MTcGAN was more than twice that of Pix2Pix and S-CycleGAN. Without considering the temporal intervals between input image acquisition dates, MTcGAN was found to be beneficial when crops were visually distinct in both SAR and optical images. These experimental results demonstrate the potential of MTcGAN in SAR-to-optical image translation for crop monitoring during the early growth stage and can serve as a guideline for selecting appropriate input images for MTcGAN.
1. Introduction
Effective management of food production is crucial for ensuring food security, in consideration of the increasing global population and changing grain consumption habits [1,2]. However, the vulnerability of agricultural systems is significantly increasing due to droughts, heavy rains, and heat waves caused by extreme weather [3]. Thus, continuous crop monitoring is required to optimize food production by mitigating factors that hinder crop growth and to support decision-making processes such as grain supply regulation and agricultural policy establishment [4,5].
Since each crop has different phenological stages from sowing to harvesting, the target monitoring period varies depending on the cultivation regions and crop types. In particular, crops in their early growth stages (comprising sowing and transplanting periods) are vulnerable to pest infestation, nutrient deficiencies, and environmental stressors, among others [6,7]. Crop progress in the early period of the growing season directly affects crop yield estimation and crop type identification before harvesting. Therefore, early-stage crop monitoring is essential for timely crop yield forecasting as it facilitates rapid responses to grain supply regulation and agricultural disasters [8,9,10].
Unlike other types of land cover, crops usually exhibit variability in physical and chemical characteristics according to their growth cycles. Therefore, periodic observations are necessary to fully account for their growth stages. Remote sensing is regarded as an effective tool for crop monitoring, particularly early-stage monitoring because it can provide periodic thematic information at various spatial scales [9,10,11,12,13]. Since the spectral and scattering responses of crops depend on their specific growth stage, multi-temporal images are required to fully account for their phenological changes [10,12]. However, optical images are often obscured by clouds and shadows. Thus, the occlusion caused by clouds is a major obstacle to constructing a complete optical image time series for crop monitoring [14]. Furthermore, as few images as possible should be obtained before the end of the entire crop growth cycle for early-stage crop monitoring and thematic mapping [10]. Therefore, if any images that provide essential information are contaminated by clouds, they cannot be utilized for further analyses, and the use of an incomplete image time series usually results in performance degradation. Therefore, additional data processing is required to increase the number of available optical images, particularly for early-stage crop monitoring and thematic mapping.
To mitigate the issue of incomplete optical image time series due to cloud contamination, previous studies have focused on reconstructing missing values in cloud regions using cloud-free images typically acquired on earlier dates [15,16]. The predictive performance of this approach may be degraded when rapid land cover changes occur between the data acquisition and prediction dates [17]. An alternative optical image reconstruction method is to utilize synthetic aperture radar (SAR) images that can be acquired regardless of the weather conditions. However, SAR images provide physical information using imaging mechanisms that differ from optical images [18,19]. Furthermore, imaging by side-looking and the speckle noises inherent in SAR images often cause difficulties in visual interpretation, making it challenging to identify objects during crop monitoring.
To fully utilize the advantage of SAR images for optical image reconstruction in terms of data availability, advanced image fusion approaches to translate SAR image-based features to optical imagery have been developed. Central to such SAR-to-optical image translation is the quantification of the relationships between SAR and optical images [20]. To this end, the effective representative learning capability of deep learning can provide great benefits for multi-sensor image fusion. In particular, adversarial learning specialized for image-to-image translation of conditional generative adversarial networks (cGANs) [20,21,22,23,24,25] and cycle-consistency generative adversarial networks (CycleGANs) [26,27,28,29,30] has shown promise in hypothetical optical image generation. State-of-the-art variants of cGAN for SAR-to-optical image translation can be found in [18,25,27].
As mentioned, the performance of SAR-to-optical image translation depends on the effective extraction of key features containing critical information for mapping between the SAR and optical images. From this perspective, several key issues caused by the different imaging mechanisms of SAR and optical images must be resolved for hypothetical optical image generation by SAR-to-optical image translation. The first issue is how to effectively restore objects in the hypothetical optical image. Some objects in the prediction results of cGAN are often indistinguishable due to blurring and distorted textures [17,26]. CycleGAN based on cycle consistency in adversarial learning can be used to effectively preserve texture information [31]. However, the preservation of texture formation may lead to a distortion in reflectance, resulting in a loss of land cover information. Supervised CycleGAN (S-CycleGAN) was proposed as a model in which the complementary aspects of both models are combined to preserve land cover and structural information. However, S-CycleGAN does not always exhibit significant improvements in predictive performance [26]. Other approaches to generate hypothetical optical images that closely resemble real optical images include the consideration of new loss functions representing structural similarity [32] and the modification of the U-Net model structure to alleviate the loss of information for small objects [33,34,35,36,37].
Despite the efforts to improve performance, noticeable visual differences (a loss of textures and spectral distortion) from actual optical images are still observed in the hypothetical optical images. In addition to the discrepancy between SAR and optical images, information deficiency in SAR-based features may result in the generation of a hypothetical optical image that significantly differs from the actual optical image. Therefore, it is necessary to utilize useful information to restore objects and features in the optical image in addition to improving the model structure. A promising approach to improve the performance of SAR-to-optical translation is to extract useful information from various input images. Periodic image acquisition over the area of interest can facilitate the utilization of additional temporal information for SAR-to-optical translation. For example, multi-temporal cGAN (MTcGAN) utilizes SAR and optical image pairs acquired on the same or a similar date (hereafter referred to as a reference date) as well as a single SAR image acquired on a prediction date for extracting temporal change information from multi-temporal images [17,38]. Due to its ability to integrate additional information from an optical image on the reference date, it performed better than conventional SAR-to-optical image translation methods. In particular, the performance of MTcGAN can be further improved by utilizing different input data combinations that can provide rich information for SAR-to-optical image translation. However, such dependency on the input data of MTcGAN implies a need for extensive evaluation. To address this, most previous studies have aimed to utilize an optical image taken on a reference date that is as close as possible to the prediction date to ensure satisfactory prediction performance [17,38]. As the physical conditions of crops change rapidly during the crop growth period, it is essential to analyze the impact of various input cases, such as by considering different image acquisition dates and crop growth stages. However, to the best of our knowledge, the impact of varying input data combinations on the performance of MTcGAN in the context of early-stage crop monitoring has not yet been assessed so far.
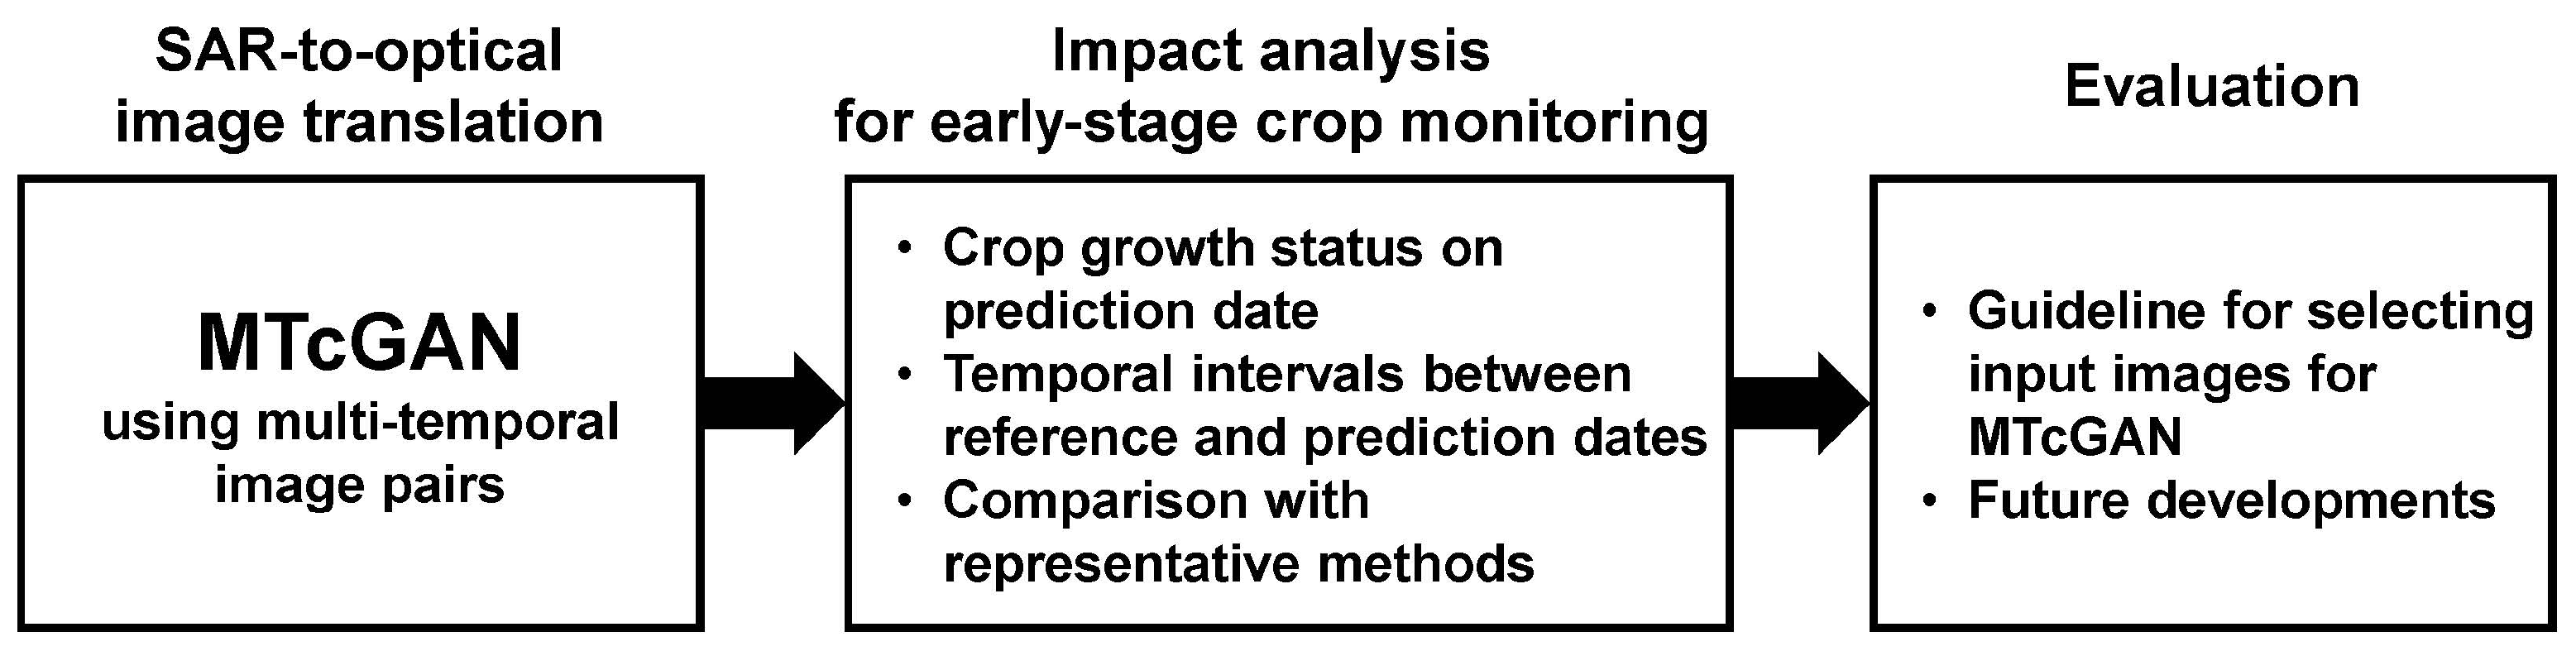
The purpose of this study is to assess the potential of MTcGAN for generating hypothetical optical images during the early growth stages of crops. Specifically, this study comprehensively explores (1) the impact of the crop growth status on the prediction date, (2) the impact of temporal intervals between reference and prediction dates, and (3) comparisons with existing representative SAR-to-optical image translation methods, such as Pix2Pix and S-CycleGAN, as shown in Figure 1. Experiments are conducted using Sentinel-1 and -2 images acquired from croplands in Illinois to illustrate the assessment of results and to discuss further research directions.

Figure 1.
Procedures applied to assess MTcGAN-based SAR-to-optical image translation for early-stage crop monitoring (MTcGAN: multi-temporal conditional generative adversarial network).
2. Methodology
The SAR-to-optical image translation method primarily evaluated in this study is MTcGAN. For comparison with MTcGAN in this study, the two existing methods, Pix2Pix and S-CycleGAN, are selected because they have been widely applied to SAR-to-optical image translation and provide a basic model structure for developing GAN variants. The main principles of these three methods are briefly described in this section.
2.1. Pix2Pix
Unlike conventional GANs that generate only uncontrolled random images, cGAN can control the image to be generated using conditional information. The representative model within the cGAN framework is Pix2Pix [39]. The basic architecture of Pix2Pix consists of two subnetworks: a generator network and a discriminator network . Both networks are simultaneously trained in an adversarial manner. takes a random noise and the conditional variable as input and is trained to generate a fake image that is as similar as possible to the real image by reflecting the characteristics of . On the other hand, receives , and as input and is trained to distinguish from . The goal of the overall training process can be detailed as
where is an expectation operator.
The objective of training is not only to trick the but also to generate a fake image similar to using the L1 loss function. The L1 loss function is employed in training to alleviate blurring of the generated image. The L1 loss function is defined as
Both the objective function and the L1 loss function are optimized as
where is the hyperparameter controlling the trade-off between and .
2.2. S-CycleGAN
In image-to-image translation, the collection of paired training data is a difficult and expensive task. To solve this issue, CycleGAN was proposed as it does not require spatially paired images as input [40]. Although CycleGAN is trained in an unsupervised manner, its prediction performance in SAR-to-optical image translation was reported to be similar to that of Pix2Pix [29].
CycleGAN is designed to learn the translation between two images, and , belonging to different domains. It comprises two generators and two discriminators. The generator is trained to generate a fake image as similar as possible to the real image . The aim of the discriminator corresponding to is to distinguish from . Another generator and discriminator are trained in the same way after exchanging input and output. The goal of the overall training process in an adversarial way can be detailed as
While training CycleGAN in an unsupervised manner, there is no guarantee that the translation between and is meaningfully paired. Thus, cycle consistency loss is of particular consideration due to the correct mapping between the two images. The cycle consistency loss is defined as
The final objective function to be optimized is as follows:
where is the hyperparameter controlling the importance of .
With regard to SAR-to-optical image translation, hypothetical optical images generated by CycleGAN tend to resemble SAR images with some of the colors appearing in the optical images. This is mainly because CycleGAN transfers the key features from one domain to another in an unsupervised manner [22,26]. Considering that the goal of image-to-image translation in this study is to accurately reproduce the reflectance of optical images, it is necessary to modify CycleGAN in a supervised manner. To address this, Wang et al. [26] proposed S-CycleGAN, which adopts the core principle of Pix2Pix for supervised learning. S-CycleGAN utilizes SAR and optical image pairs as input and employs L1 loss to achieve similarity between the generated and real images. The L1 loss function in S-CycleGAN is defined as
The final objective function of S-CycleGAN is as follows:
where the hyperparameter controls the importance of .
2.3. MTcGAN
MTcGAN is a modified cGAN that uses additional SAR and optical image pairs acquired on the reference date (hereafter referred to as ) as conditional variables along with the SAR image acquired on the prediction date (hereafter referred to as ) [17,38].
MTcGAN does not require a new loss function to be incorporated or a change in the model structure. Instead, its emphasis lies in ensuring the diversity of input data to extract temporal information. This simplicity enables MTcGAN’s applicability across various SAR-to-optical image translation tasks with different input data.
The overall training process for MTcGAN can be defined as
where is the conditional variable consisting of multi-temporal SAR and single optical images.
The L1 loss function is defined as
The final objective function of MTcGAN is as follows:
where is the hyperparameter controlling the trade-off between and .
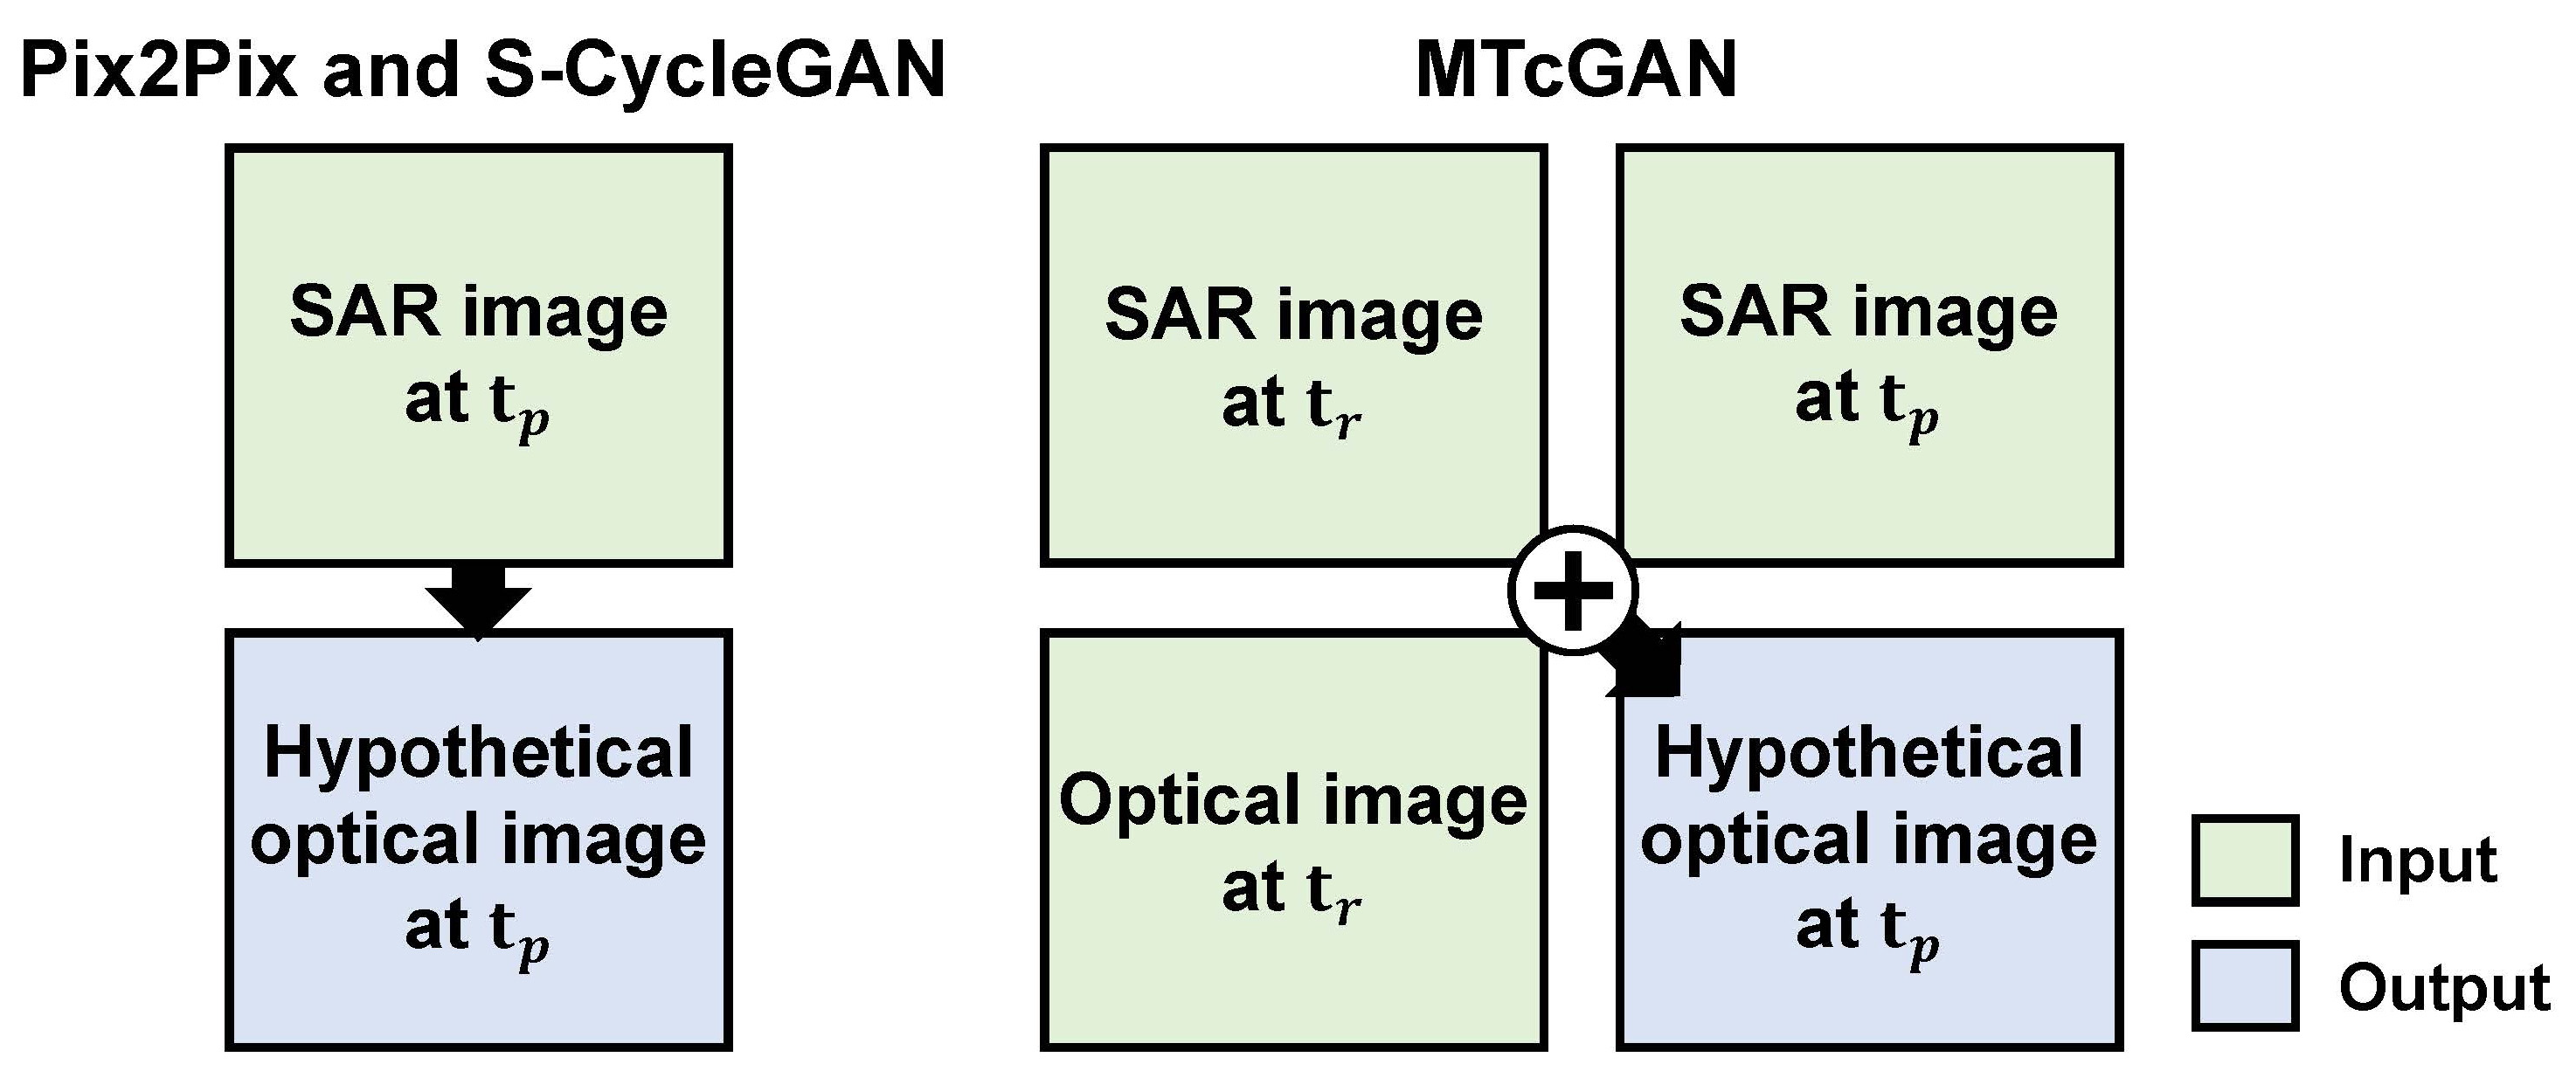
Figure 2 illustrates that MTcGAN utilizes additional image pairs as conditional input for hypothetical image generation compared to Pix2Pix and S-CycleGAN. The use of additional input data in MTcGAN has several advantages over cGAN, resulting in the generated hypothetical optical image being more similar to the real image. The optical image acquired at can contribute to compensating for the loss of textures, resulting in visually improved hypothetical optical imagery. This is because the optical image at is still more similar to the optical image at than the SAR image at in terms of texture, even though it was acquired on a different date. Abrupt changes in land cover cannot be captured when only using the optical image at . The multi-temporal SAR images at both and can be effectively utilized to account for the difference in information between and . Overall, MTcGAN has great potential to generate high-quality hypothetical optical imagery by relying on the optical image at while inferring possible changes that occurred between and . However, it should be noted that the prediction performance of MTcGAN depends not only on its capability to explain the quantitative relationships between optical and SAR images but also on the correlation between optical images acquired at and .
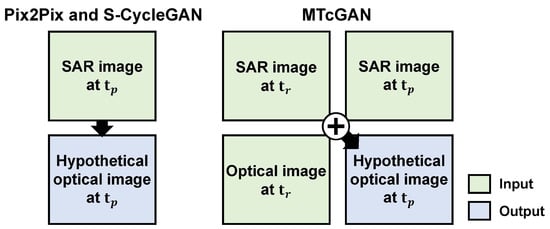
Figure 2.
Illustration of the difference in input data of Pix2Pix and S-CycleGAN vs. MTcGAN (S-CycleGAN: supervised cycle generative adversarial network; : reference date; : prediction date).
3. Experiments
3.1. Study Area
Experiments for hypothetical optical image generation were conducted in the subarea of Illinois within the US Corn Belt, where mostly corn and soybean are cultivated [41]. As Korea imports large amounts of corn and soybean from foreign countries, including the US, early season crop monitoring in Illinois is crucial for assessing crop yield forecasting.
In this study, the subarea in the southwest agricultural statistics district was selected as the experimental study area (Figure 3). The predominant crop types in the study area are corn and soybean. The minor land cover types include other crops, grass, and built-up classes.
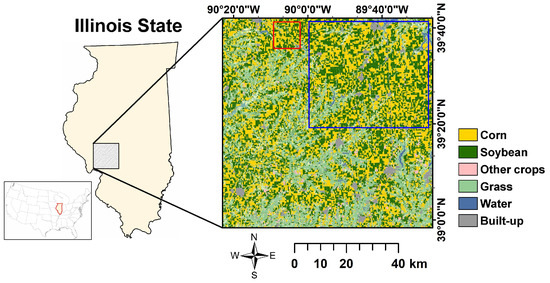
Figure 3.
Location of the study area. The blue and red boxes represent the training and test areas where hypothetical image generation is conducted. The background in the right image is the cropland data layer in 2022.
3.2. Data
Sentinel-1 and -2 images were used as input for SAR-to-optical image translation experiments. The Sentinel-1 level-1 ground range detected (GRD) product in the interferometric wide swath mode and the Sentinel-2 level-2A bottom-of-atmosphere (BOA) product were downloaded from the Copernicus Data Space Ecosystem [42]. After employing several preprocessing steps using Sentinel Application Platform (SNAP) software (version 8.0.0) [43,44], the calibrated backscattering coefficients for VV and VH polarizations were finally obtained at pixels with a spatial resolution of 10 m. In addition to the dual polarization backscattering coefficients, the dual-polarization-based radar vegetation index (RVI) was utilized as an additional SAR-based input. The RVI, which is useful for describing the crop growth dynamics [20,45], is defined as
where and are the backscattering coefficients for VV and VH polarizations, respectively.
The red-edge (RE) and the short-wave infrared (SWIR) bands available from Sentinel-2 images are known to provide useful information for the identification of complex crop types [11]. In addition to the commonly available spectral bands, including the blue, green, red, and near-infrared (NIR) bands, reflectance values from three RE and two SWIR bands in the Sentinel-2 optical images were also considered in this study. Five bands (RE 1–3 and SWIR 1–2 bands) with a spatial resolution of 20 m were resampled to 10 m using bilinear resampling to match the spatial resolution of the nine spectral bands.
A total of 10 Sentinel-1 and -2 images acquired from June to August 2022 were utilized for further analyses by considering the growth stages of corn and soybean in the study area (Table 1). The main objective of this study is to assess the predictive performance of MTcGAN for hypothetical optical image generation in cropland where substantial changes in land cover occur. To ensure the satisfactory performance of SAR-to-optical image translation, major crops should be visually discerned in the Sentinel-2 image. Sentinel-2 images acquired from June to July, corresponding to the early growing stages of corn and soybean, were utilized based on our previous study [20]. MTcGAN requires SAR and optical image pairs to be acquired on the same or a similar date. The temporal differences between the acquisition dates of Sentinel-1 and -2 images may result in changes in the physical conditions of land cover types, distorting the quantitative relationships between SAR and optical images. Hence, the temporal difference between the acquisition dates of Sentinel-1 and -2 images was limited to a maximum of 5 days, assuming no changes in crop condition. Sentinel-1 and -2 image pairs acquired approximately two weeks apart were utilized for analysis because a significant change in crop vitality could be observed in that time interval, as shown in Figure 4a. Moreover, corn and soybean can be visually discerned in the Sentinel-1 image after early July, when the crop vitality of the two major crops is very high (Figure 4b). These datasets were utilized to evaluate the performance of MTcGAN according to inputs acquired on different dates.

Table 1.
Summary of Sentinel-1 and -2 images used for SAR-to-optical image translation (GRD: ground range detected; BOA: bottom-of-atmosphere; NIR: near-infrared; RE: red-edge; SWIR: shortwave infrared).
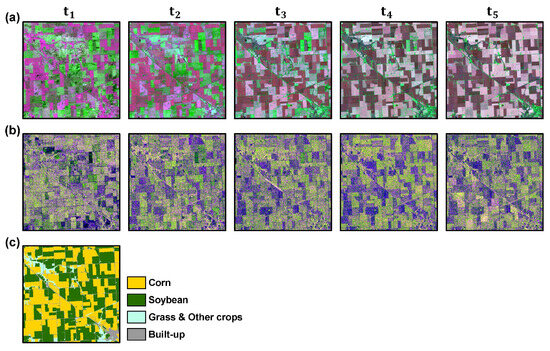
Figure 4.
Multi-temporal Sentinel images in the test region: (a) Sentinel-2 images (NIR–SWIR1–RE2 as RGB); (b) Sentinel-1 images (VV–VH–radar vegetation index as RGB). The reclassified cropland data layer in (c) is used as auxiliary information for interpretations. Image acquisition dates indicated as t can be found in Table 1.
To use multi-temporal Sentinel-1 and -2 images with different pixel value ranges as input for SAR-to-optical image translation, the normalization procedure presented in Enomoto et al. [46], defined in Equation (14), was adopted in this study:
where and represent the pixel values before and after normalization, respectively. and are the minimum and maximum values of individual images, respectively.
For Sentinel-2 images, and are defined as 0 and 1, respectively, since they have values between 0 and 1 after applying the scale factor. Unlike Sentinel-2 images, which have fixed minimum and maximum values, the backscattering coefficients in the dB unit of Sentinel-1 images are highly variable. Therefore, and for Sentinel-1 images were determined using mean () and standard deviation () values calculated from multi-temporal Sentinel-1 images as follows:
The cropland data layer (CDL), provided by the National Agricultural Statistics Service (NASS) of the United States Department of Agriculture (USDA) [47], was used as auxiliary information to interpret the prediction results and evaluate the prediction performance in the corn and soybean cultivation areas (Figure 4c). The CDL data with a spatial resolution of 30 m were resampled to 10 m using nearest neighbor resampling to match the spatial resolution of input images.
3.3. Experimental Design
3.3.1. Optimization of Model Hyperparameters
The basic architecture of the three SAR-to-optical image translation methods applied in this study is the same as that of Pix2Pix, which utilizes U-Net and PatchGAN as the generator and the discriminator, respectively. U-Net consists of a specific encoder–decoder architecture designed to generate a hypothetical image from input images. The encoder and decoder have distinct roles: the encoder extracts key features from the input images through down-sampling, while the decoder reconstructs the hypothetical image from features extracted through up-sampling. A notable feature of U-Net lies in the use of skip connections which connect corresponding layers of the encoder and decoder to prevent the loss of initial information during the down-sampling process.
The dimensions of the input and output images were set to 256 256 N and 256 256 9, respectively, where N is the total number of input spectral bands (3 for Pix2Pix and S-CycleGAN, and 15 for MTcGAN). All hyperparameters of U-Net except for the image size were determined based on the specifications of Pix2Pix [39]. The number of features in the encoder gradually increased from 64 to 512 during up-sampling, while the number of features in the decoder gradually decreased from 1024 to N during down-sampling. There are twice the number of features for the decoder than the encoder, since the decoder is combined with skip connections (refer to Table 2). Eight convolution and eight deconvolution blocks were used for up-sampling and down-sampling, respectively. The convolution block includes a convolution operation, batch normalization, and a leaky ReLU activation function. The deconvolution block includes a deconvolution operation, batch normalization, and a ReLU activation function. To adjust the number of features without applying pooling layers, the kernel and stride sizes were set to predefined values for convolution and deconvolution layers: 4 and 2, respectively. The dropout applied from the top three blocks of up-sampling replaces input noise in Equations (1) and (2) [39]. The structures and hyperparameters of U-Net and PatchGAN are listed in Table 2.
Table 2.
Details of the U-Net-based generator and PatchGAN-based discriminator used in the three SAR-to-optical image translation models. The numbers in parentheses represent the patch size, number of features, and kernel and stride sizes (C: convolution operation; B: batch normalization; L: leaky ReLU activation function; Dc: deconvolution operation; D: dropout; R: ReLU activation function; T: hyperbolic tangent; Z: zero-padding; S: sigmoid activation function; N: the number of input bands).
PatchGAN, employed as a discriminator architecture, is used to evaluate whether the generated image is real or fake in a predefined patch unit of a specific size rather than considering the entire image. Considering that spatial autocorrelation between neighboring pixels tends to decrease as the distance between pixels increases, the quality of the output image can be improved by using an appropriate patch size in the discriminator.
The input size of PatchGAN was set to the sum of the input and output dimensions of U-Net, 256 256 12 for Pix2Pix and S-CycleGAN, and 256 256 24 for MTcGAN. The architecture of PatchGAN involves a specific number of the abovementioned convolution blocks and one convolution layer with a sigmoid activation function for distinguishing the real image (1) from the fake image (0). Unlike U-Net, hyperparameter tuning for PatchGAN was performed through a trial-and-error procedure due to the divergence issue observed in the loss of PatchGAN when using the same structure and hyperparameters as Pix2Pix. After adjusting the number of convolution blocks and the patch size, the convolution block and the patch size were finally determined to be 4 and 30 30, respectively. The values of in Equations (3) and (7) and in Equation (9) were set to 100 in all cases.
3.3.2. Training and Test Setup
The training and test regions, for model construction and evaluation, respectively, were determined using the CDL in the study area. To ensure valid evaluation, spatially independent training and test regions were used, as shown in Figure 3. The training region was set to be larger than the test region so that sufficient training data could be used to effectively train deep learning models with complex structures. In addition, training and testing regions that did not contain clouds and shadows were selected from multi-temporal Sentinel-1 and -2 images to ensure the collection of sufficient data.
Both the training and test data were first extracted from Sentinel-1 and -2 image pairs in the region. The three SAR-to-optical image translation methods built using the training data were applied to the test data to evaluate their prediction performance. The patch size for training and test data was set to 256 256, with individual patches overlapping by 50% and adjacent patches for data augmentation. There were a total of 1085 and 49 pairs of patches extracted for the training and test data, respectively.
3.3.3. Experiment Setup
To evaluate the prediction performance of MTcGAN for various input cases, ten experimental cases were designed for the experiments (Table 3). The ten experimental cases were categorized into three classes (A, B, and C). The A and B classes were used to explore the impact of image acquisition and prediction dates on the performance of MTcGAN. More specifically, the four A cases were designed to evaluate the performance of MTcGAN for changes in reflecting different crop growing stages. For these four cases, as close as possible to was selected to analyze the impact of . The aim of the two B cases was to explore the impact of the temporal distance between and , particularly considering cases where the acquisition of cloud-free optical images is limited for long periods due to prolonged inclement weather conditions. In these two cases, was fixed to (22 July), since this period (around the end of July) was reported to be the optimal date for early crop classification [20]. Finally, the performance of MTcGAN was compared with Pix2Pix and S-CycleGAN in the four C cases to highlight the superiority of MTcGAN.
Table 3.
Experiment cases considered in this study. t indicates the acquisition date shown in Table 1. S1 and S2 denote the Sentinel-1 and -2 images, respectively.
3.4. Evaluation
Prior to the evaluation of prediction performance, the 49 image patches predicted in the test region (each with 50% overlap) were post-processed by replacing predictions near the boundary with the average value to minimize boundary artifacts between individual patches [27].
To quantitatively evaluate the prediction performance for ten cases in Table 3, the predicted values were first compared with actual values in the test region. Some metrics, including root mean square error (RMSE), relative RMSE (rRMSE), correlation coefficients (CCs), and structural similarity measure (SSIM), were then calculated as quantitative evaluation measures. rRMSE was calculated for a relative comparison of reflectance values for individual spectral bands with different ranges. SSIM was also calculated to measure spatial similarity between the real and hypothetical images, where higher SSIM values indicate higher spatial similarity.
3.5. Implementation
Three SAR-to-optical image translation methods were implemented using the TensorFlow [48] and Keras [49] libraries in Python 3.7.1. In addition, training and test image patch preparation, image normalization, and evaluation metrics computation were also implemented using Python coding. All procedures were run on the CentOS 7.0 operation system with an Intel XEON E5-2630 v4 @ 2.2 GHz CPU and two NVIDIA RTX 3090 GPUs with 24 GB memory.
4. Results
4.1. Analysis of Temporal Characteristics of Corn and Soybean
The temporal characteristics of corn and soybean in the Sentinel-1 and -2 images were analyzed before performing the SAR-to-optical image translation experiments due to the specific growing stages of each crop.
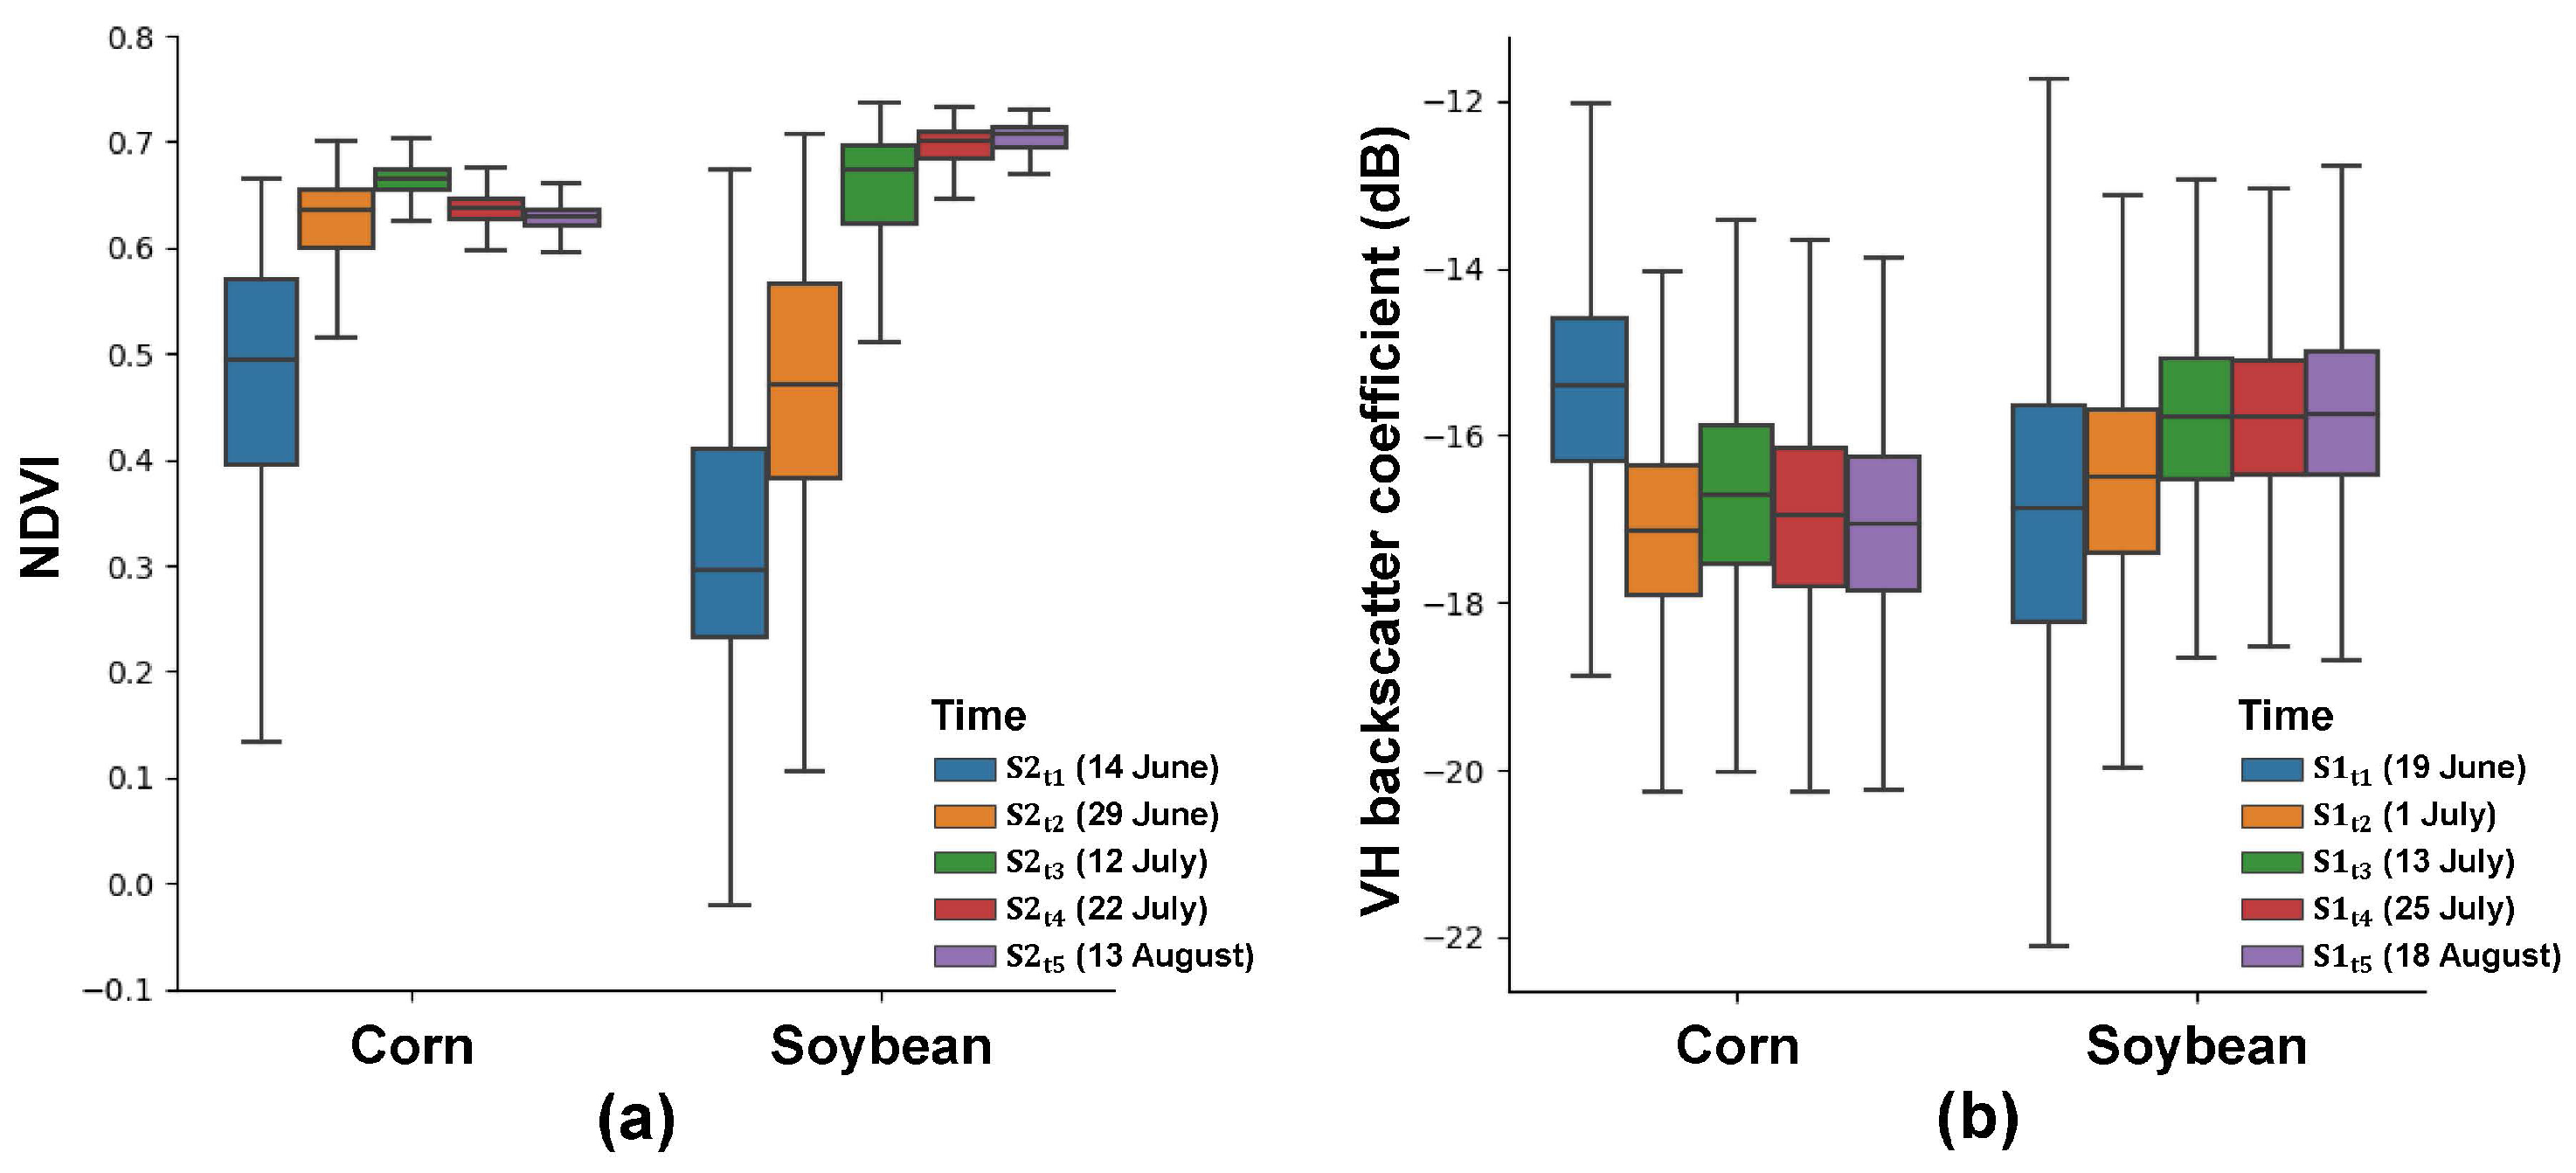
Figure 5 shows the temporal variation in the normalized difference vegetation index (NDVI) and VH backscattering coefficient distributions for corn and soybean in the training region. The NDVI was higher for corn than soybean, indicating that corn was sown earlier than soybean in the study area (Figure 5a). The vegetation vitality of corn reached its peak in mid-July and gradually decreased after the end of July. Meanwhile, the vegetation vitality of soybean increased rapidly until mid-July and peaked in mid-August. Consequently, the corn and soybean in the study area have distinct growth cycles and exhibit significant differences in vegetation vitality across the image acquisition dates.

Figure 5.
Boxplots of spectral and scattering distributions of corn and soybean calculated from individual Sentinel-1 and -2 images for the indicated image acquisition dates: (a) normalized difference vegetation index (NDVI); (b) VH backscattering coefficient. S1 and S2 denote the Sentinel-1 and -2 images, respectively.
The VV backscattering coefficient and RVI provided useful information to reflect crop growth characteristics in a previous study [20]. However, the VH backscattering coefficient was selected in this study to compare the scattering characteristics of corn and soybean, since the differences in temporal variations between corn and soybean were the most pronounced for VH polarization when compared with VV polarization and RVI (Figure 5b). Some significant differences were observed between the two crops. First, the VH backscattering coefficient for corn was highest in mid-June and then decreased significantly thereafter. In contrast, an increase in the VH backscattering coefficient for soybean was observed in the early part of this period. This variation is caused by crop growth and leaf development [50]. Therefore, the differences in NDVI and VH backscattering coefficients over time affect the prediction performance of MTcGAN when using different input data.
Table 4 lists the CCs of NDVI values between different and for ten experimental cases. The CCs of NDVI values were slightly higher for corn than soybean on almost all dates except between and , but this difference was not substantial. For both crops, the CCs decreased significantly as the temporal distance between and increased. These results are mainly attributed to differences in spectral reflectance caused by rapid changes in physical conditions during the early growth stage. The above information was later utilized to evaluate and interpret the prediction results of MTcGAN for different combinations of input data.
Table 4.
Correlation coefficients between NDVI values calculated from Sentinel-2 images acquired on different dates.
4.2. Impact of Different Prediction Dates in MTcGAN (Case A)
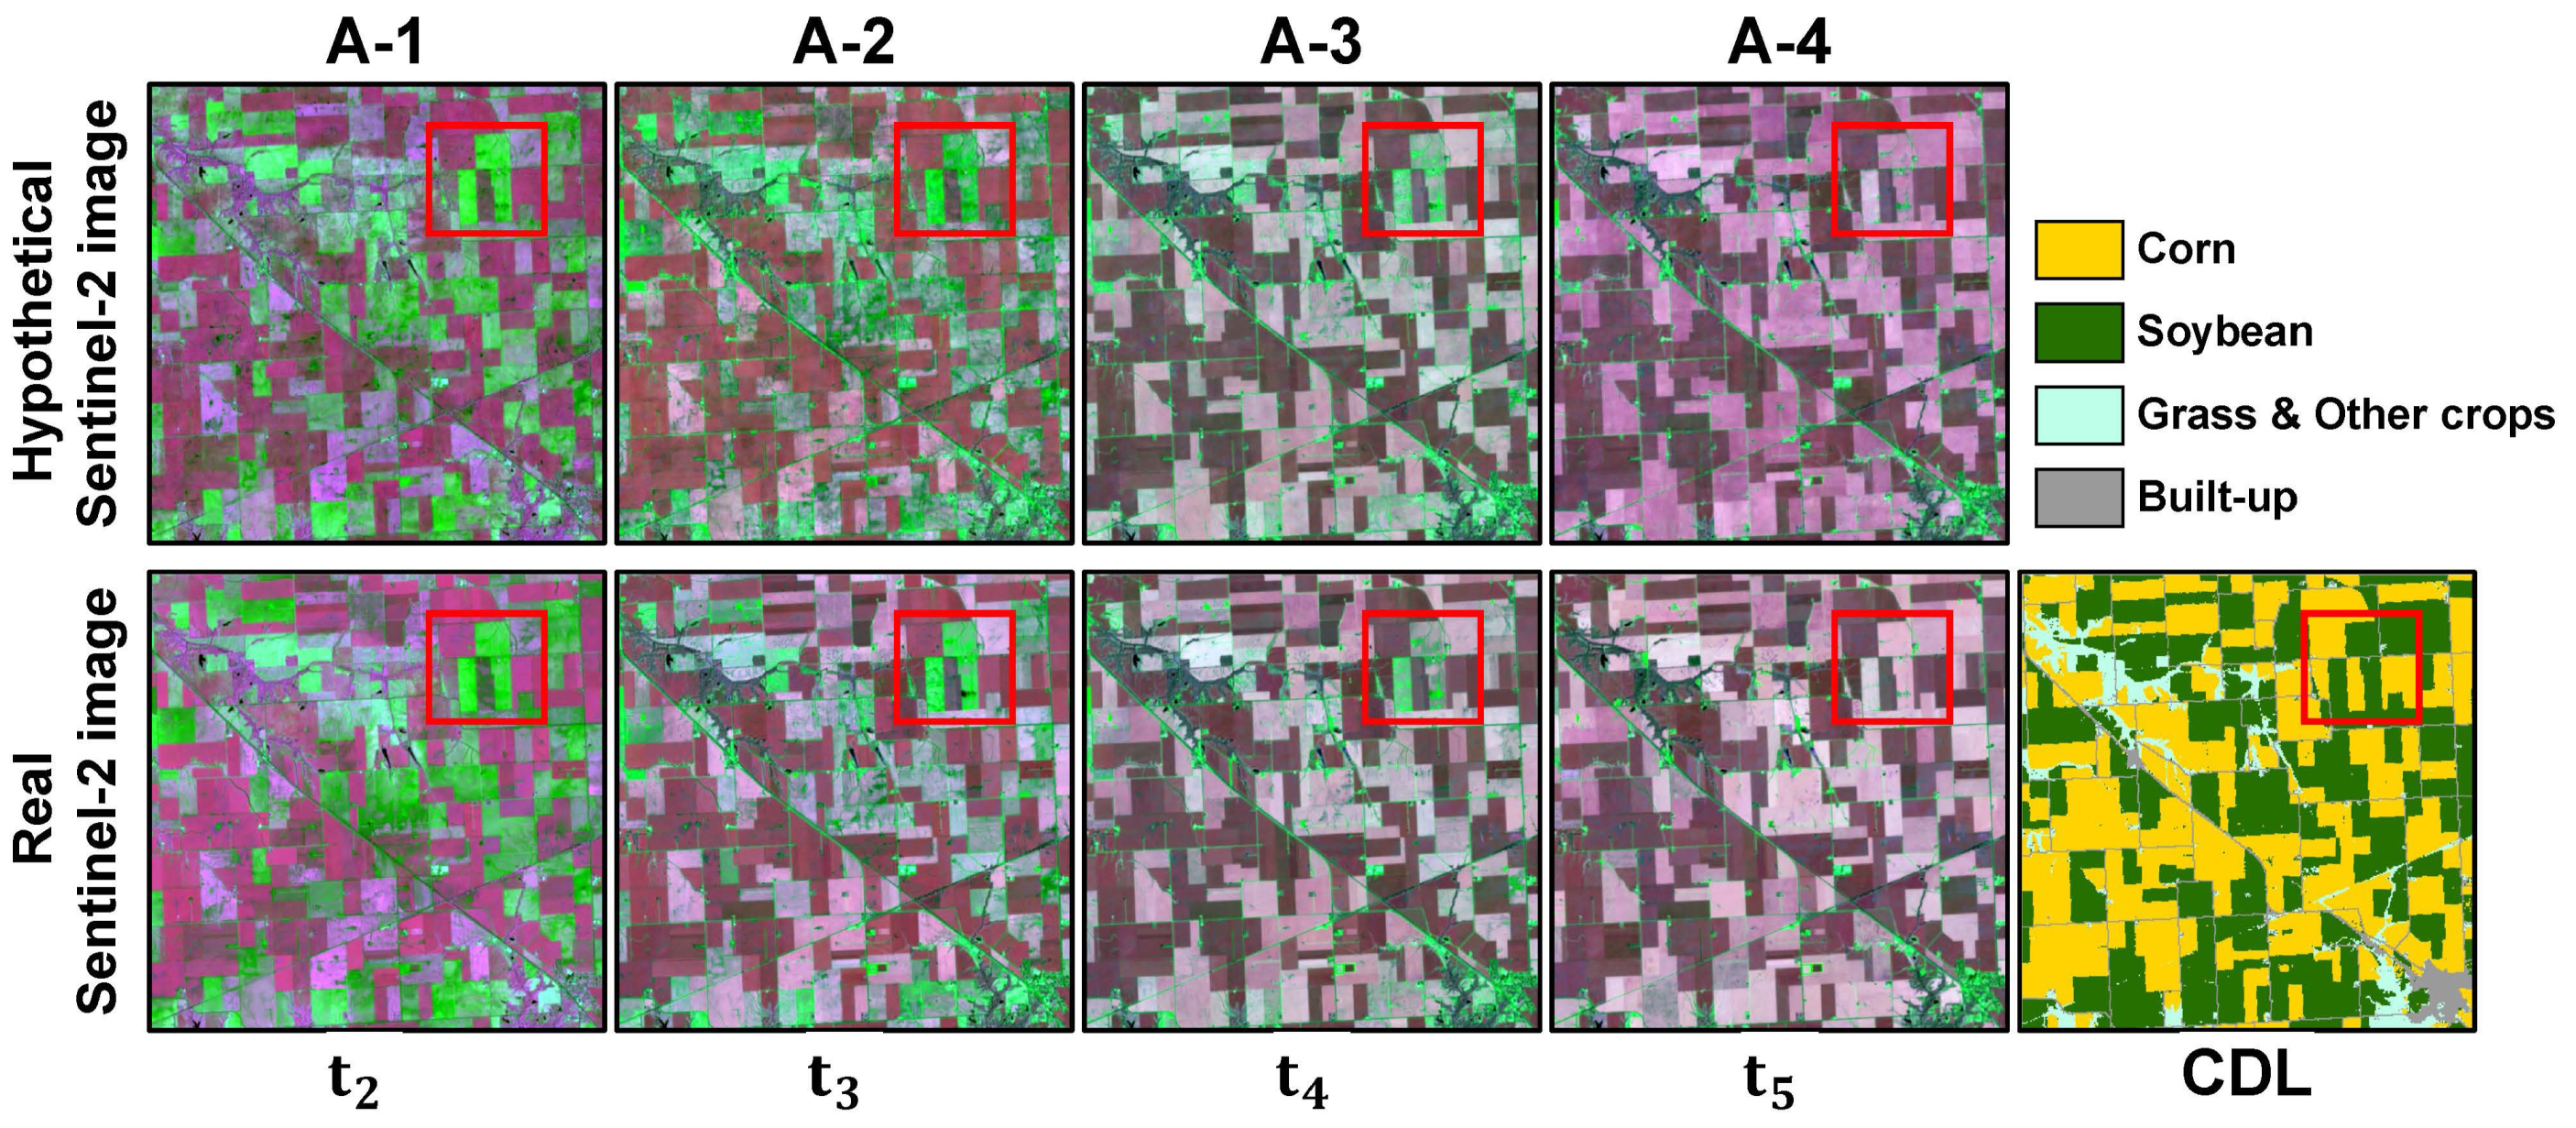
Figure 6 shows the results of hypothetical Sentinel-2 image generation using MTcGAN for different . Visual inspections of false color composite images using NIR, SWIR1, and RE2 bands, which are effective in crop identification, showed that all hypothetical images were very similar to the real Sentinel-2 images. Corn and soybean could be visually well distinguished in the hypothetical images. These results demonstrate that the performance of MTcGAN is less affected by the choice of as long as the image pairs acquired at , in close proximity to , are utilized as input. In particular, reflectance patterns were reproduced well within some soybean parcels where substantial changes occurred on individual prediction dates (see red boxes in Figure 6), indicating the ability of MTcGAN to effectively reflect rapid changes in land cover.
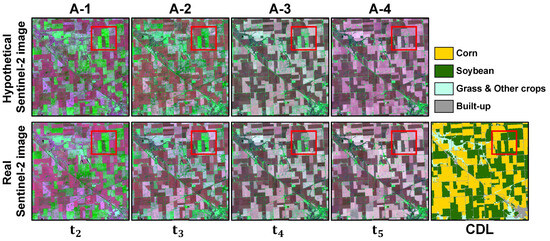
Figure 6.
Hypothetical Sentinel-2 images generated by MTcGAN and the real Sentinel-2 images (NIR–SWIR1–RE2 as RGB) for the four A cases with the CDL. Red boxes indicate soybean parcels where rapid changes occurred. Image acquisition dates indicated as t can be found in Table 1.
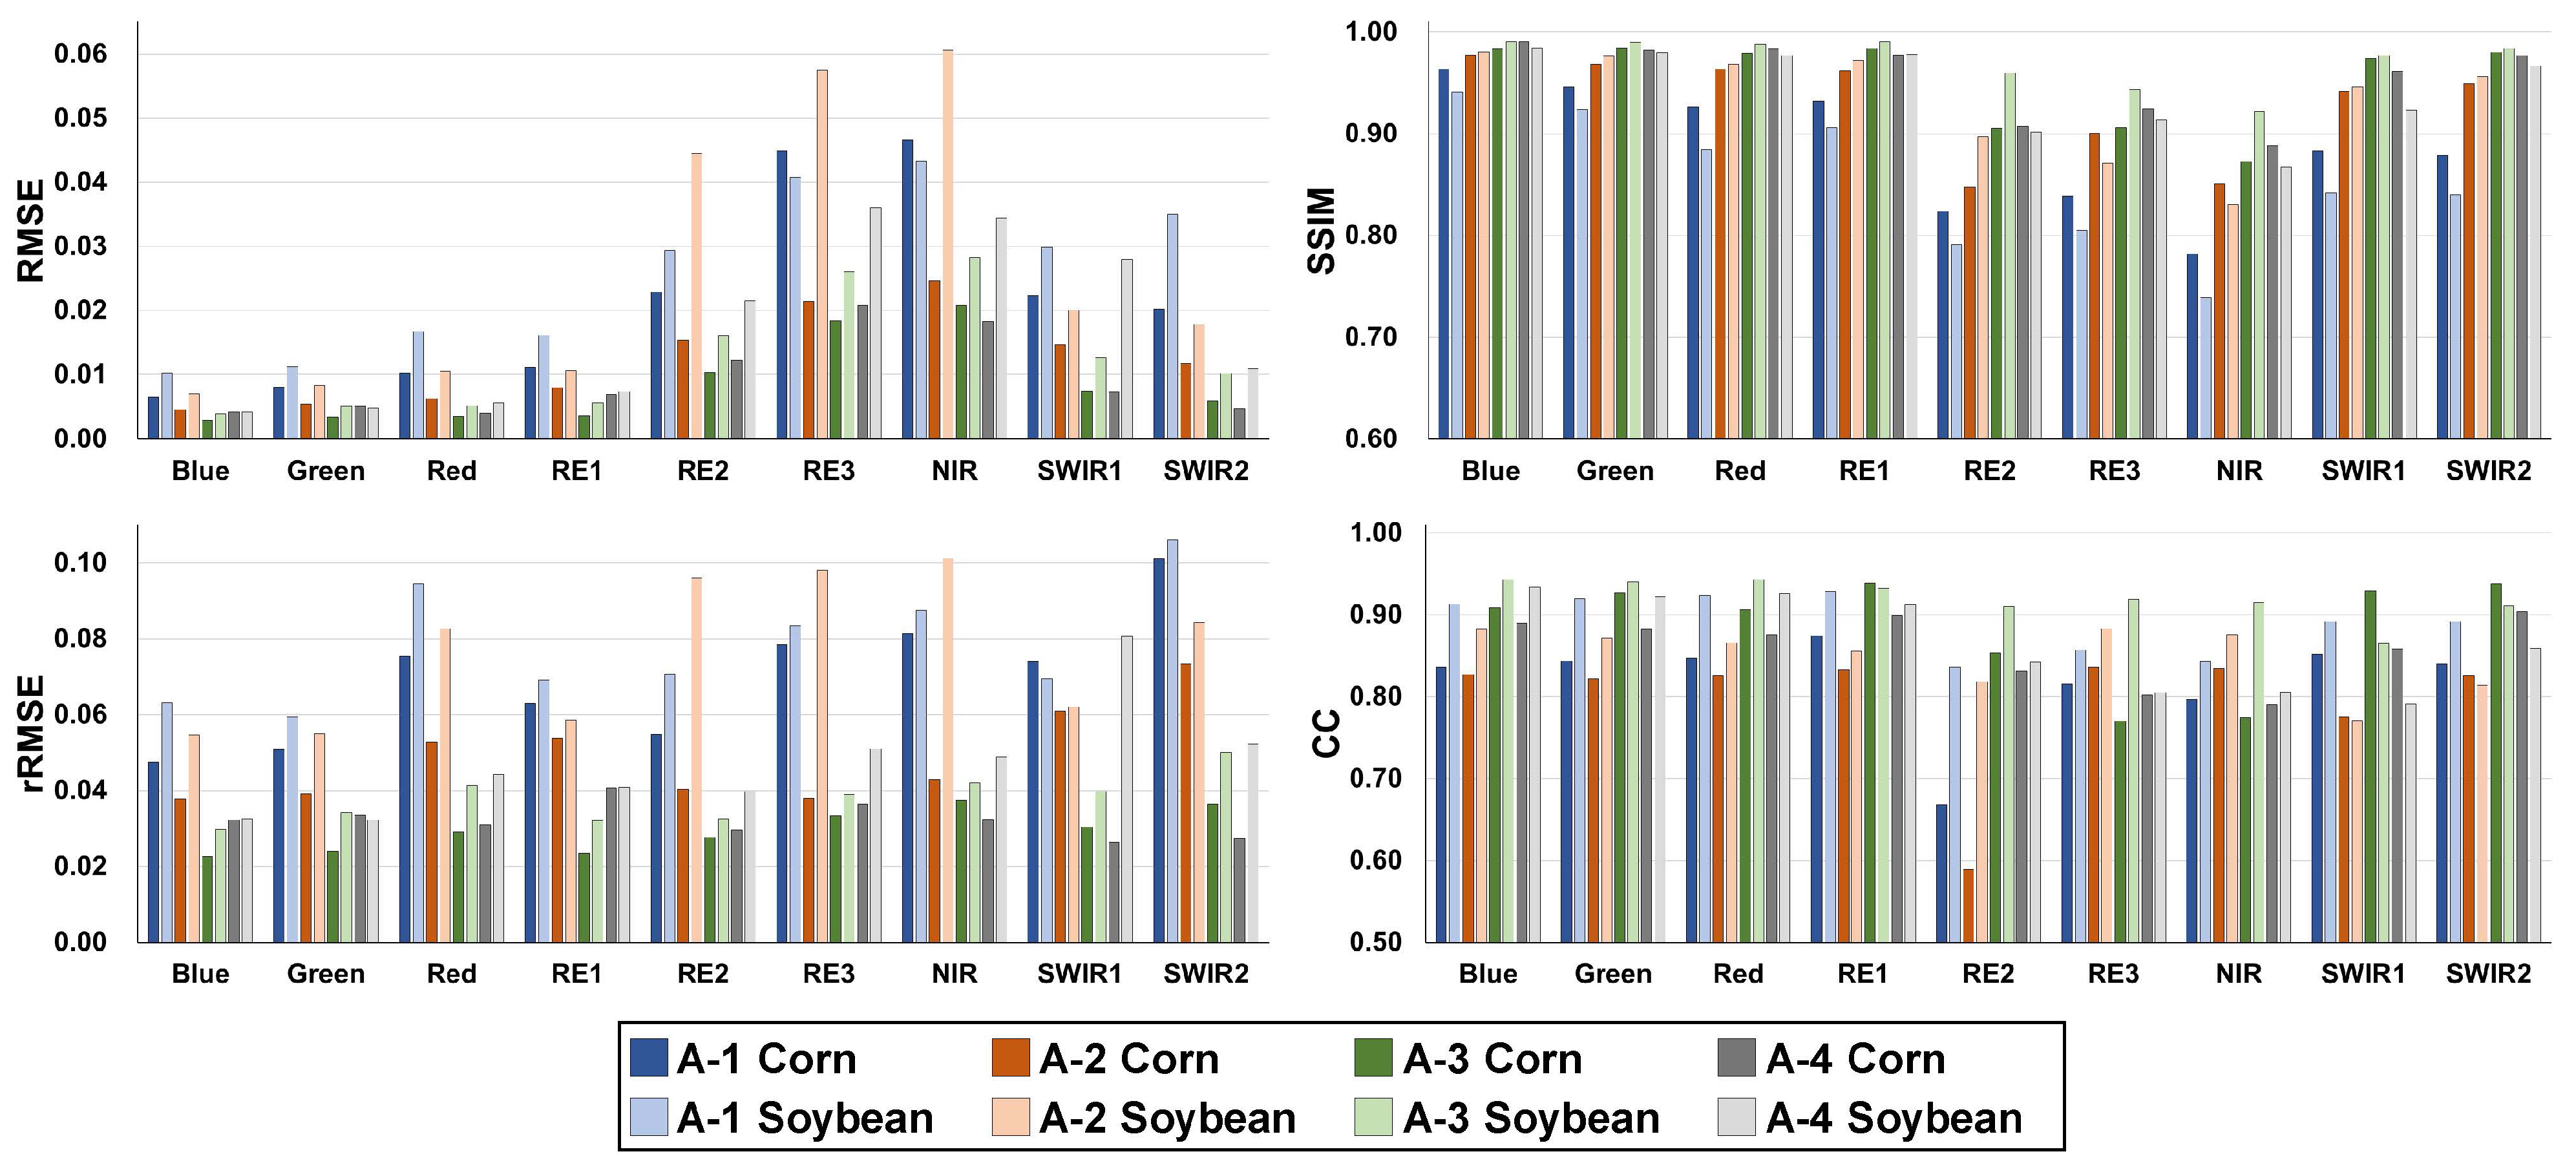
Figure 7 presents four accuracy statistics for corn and soybean in the four A cases of MTcGAN. Lower RMSE values were observed for the A-1 and A-2 cases, corresponding to the early growth stages, than the other two cases. As shown in Figure 5, substantial differences in NDVI were observed between and when comparing soybean to corn. As a result, the RMSE values of corn and soybean differed by about twofold in the case of A-2. These results may also be due to the consistently lower variation in NDVI for corn than for soybean. On the other hand, the A-3 case exhibited superior prediction performance as it had the highest CC of NDVI between and (see Table 4). During the early growth stages (A-1 and A-2), the rRMSE values for red, NIR, RE3, and SWIR2 were higher than other bands. Consistently high values of SSIM and CC were obtained for most bands except NIR and RE2. A high variation in NDVI due to rapid crop growth affected the prediction performance, but the magnitude of errors was small, with RMSE up to 0.06.
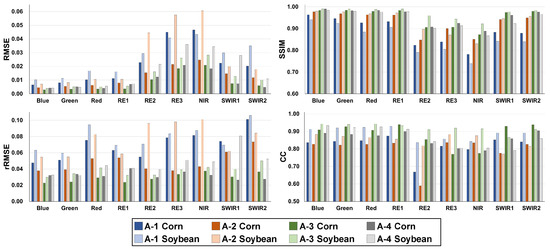
Figure 7.
Quantitative accuracy measures of corn and soybean for the four A cases of MTcGAN (RMSE: root mean squared error; rRMSE: relative RMSE; SSIM: structural similarity index measure; CC: correlation coefficient).
4.3. Impact of Temporal Distance between Reference and Prediction Dates in MTcGAN (Case B)
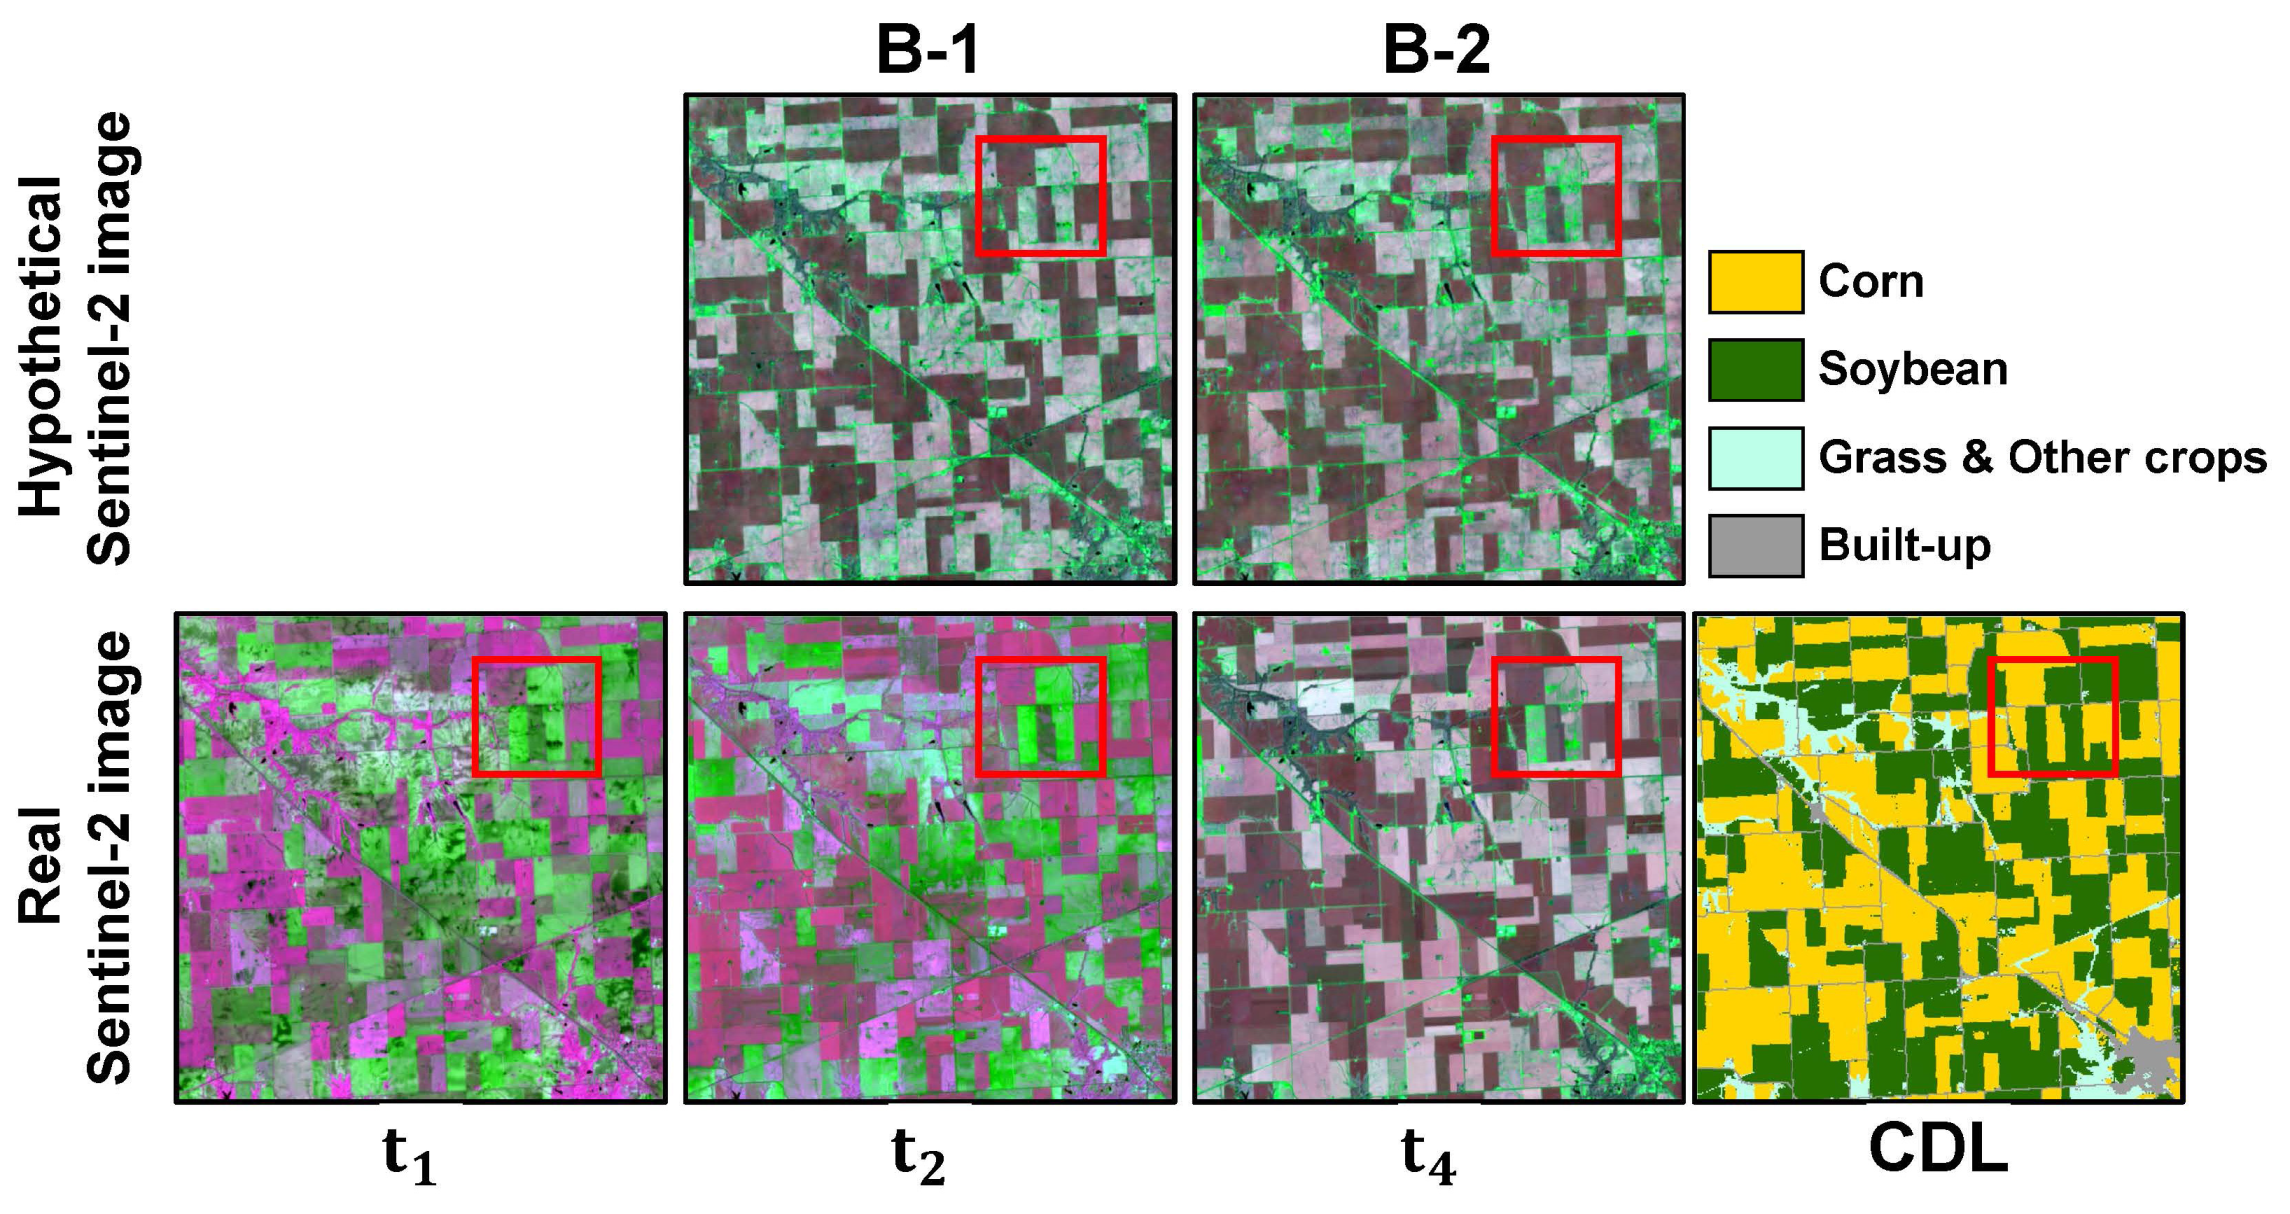
Figure 8 presents the prediction results of MTcGAN for the Sentinel-2 image at (25 July) using image pairs acquired at different .
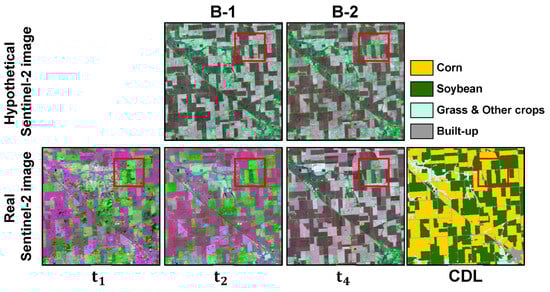
Figure 8.
Hypothetical Sentinel-2 images generated by MTcGAN and the real Sentinel-2 images (NIR–SWIR1–RE2 as RGB) for the two B cases with the CDL. Red boxes indicate soybean parcels where rapid changes occurred. Image acquisition dates indicated as t can be found in Table 1.
The hypothetical images generated in B-1 and B-2 show significant differences compared to the results of A-3 with the same . The spectral patterns of corn parcels were reproduced well in both cases. While the reflectance values of soybean parcels generally appeared to be reproduced well, the pixels within most soybean parcels exhibited similar spectral patterns to the built-up class. Based on visual inspection, these results appear to be due to several factors, such as residual speckle noise in Sentinel-1 images, high variability in VH backscattering coefficients and NDVI, and low correlation of NDVI between and . In particular, spectral distortion was observed in some soybean parcels, as highlighted in the red boxes in Figure 8. Despite the relatively low predictive performance of B-1 and B-2, the predicted images still contain visually useful information for distinguishing between corn and soybean.
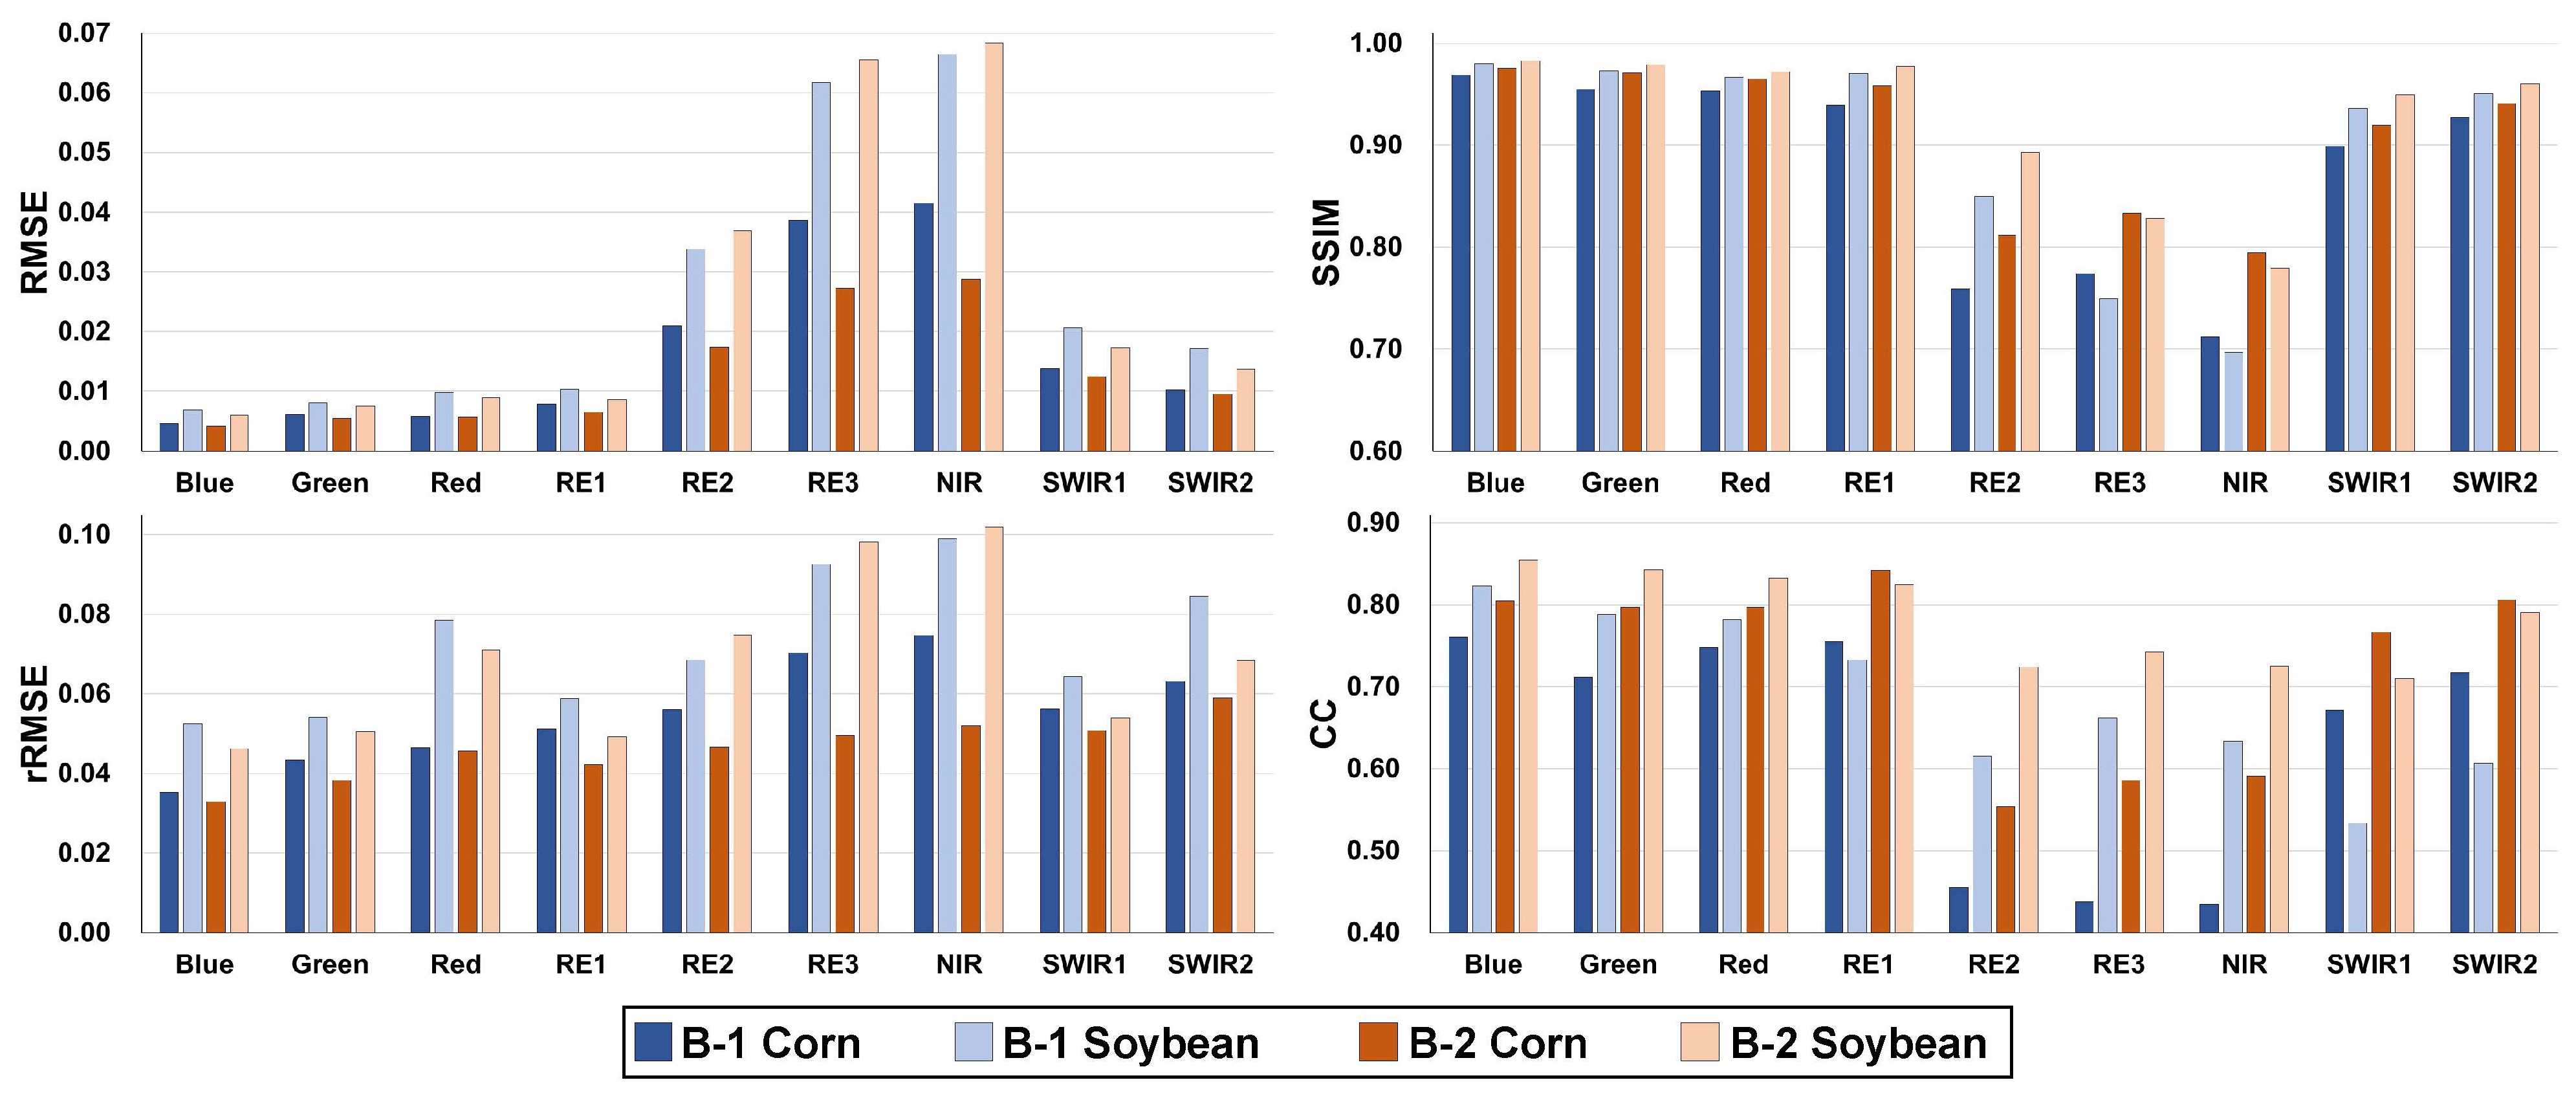
When analyzing accuracy statistics for the two B cases of MTcGAN (Figure 9), the RMSE values of corn and soybean for the NIR band were 0.042 and 0.066, respectively, for B-1, with significant increases in RMSE compared to case A-3 using image pairs at (0.021 and 0.028 for corn and soybean, respectively). Such an increase in RMSE was also obtained for the RE3 band. The predictive performance of B-1 was inferior to that of A-1 which had the lowest predictive performance of all the A cases. Lower SSIM and CC were also achieved for B-1 and B-2 compared to A-1. For example, the CCs of corn and soybean for the RE3 band of B-1 were 0.662 and 0.438, respectively, which are significantly lower than the CCs of A-1 (0.857 and 0.816 for corn and soybean, respectively). In particular, the difference in CC between A-1 and B-1 is substantial, likely due to the influence of some pixels in the soybean parcels that showed spectral patterns similar to those in the built-up class, as shown in the red boxes in Figure 8.
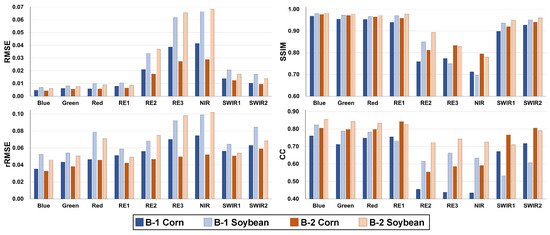
Figure 9.
Quantitative accuracy measures of corn and soybean for the two B cases of MTcGAN.
In summary, it is evident when evaluating both A and B cases that the prediction performance of MTcGAN was mainly affected by the correlation of NDVI between and rather than the vegetation vitality of the crops at . To achieve satisfactory prediction performance using MTcGAN in the study area, it is recommended that the temporal interval between and should not exceed one month.
4.4. Comparison of Different SAR-to-Optical Image Translation Methods (Case C)
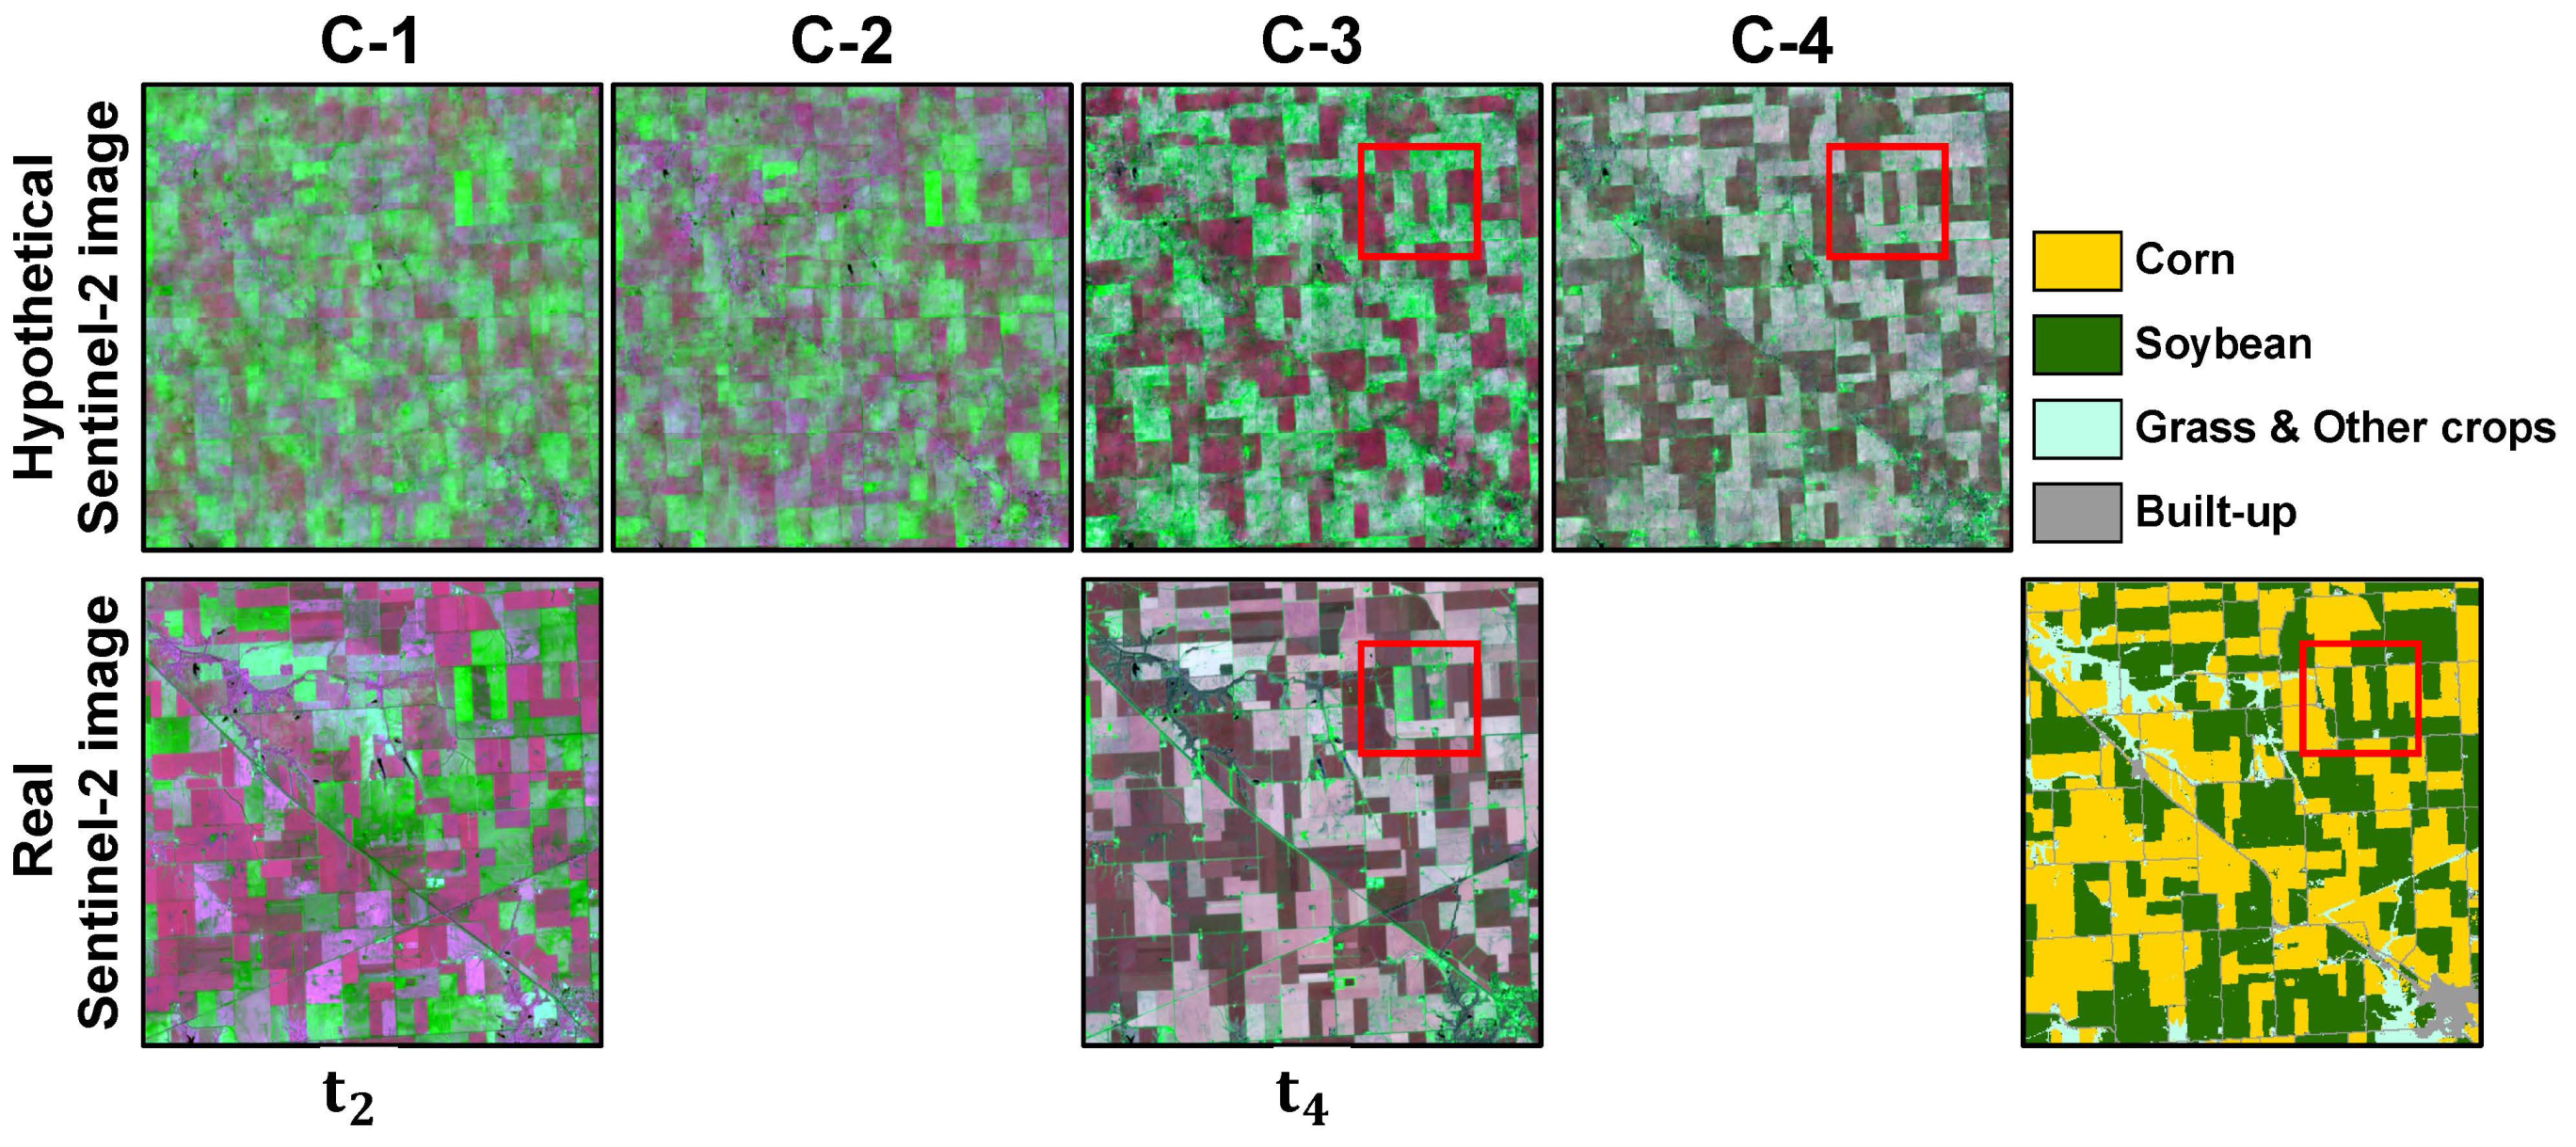
The prediction results of Pix2Pix and S-CycleGAN for the four C cases are presented in Figure 10. The prediction results of all C cases differed significantly from those for cases A and B. Most small structures, such as buildings and roads located at the boundary of crop parcels, were poorly represented due to blurring. Pix2Pix and S-CycleGAN are likely to fail to restore these structures if they are difficult to visually identify in SAR images. Furthermore, it was not feasible to distinguish corn from soybean in the prediction results for (1 July) using either Pix2Pix (C-1) or S-CycleGAN (C-2). These results indicate the limited applicability of conventional SAR-to-optical image translation methods when using only SAR images at , particularly when the crops have low vegetation vitality. In contrast, the visual identification of corn and soybean was possible in the results of C-3 and C-4, which is attributed to distinctive differences in the structural and spectral patterns of SAR and optical images due to the increased vegetation vitality of the crops. Therefore, the use of Pix2Pix and S-CycleGAN in hypothetical optical image generation could only yield benefits when applied to croplands under a limited range of conditions, for example, when corn and soybean can be clearly distinguished in both SAR and optical images. When comparing the two methods, S-CycleGAN yielded slightly better visual results than Pix2Pix. However, in contrast to MTcGAN, both methods failed to reproduce the spectral variations in reflectance within crop parcels due to spectral distortions.
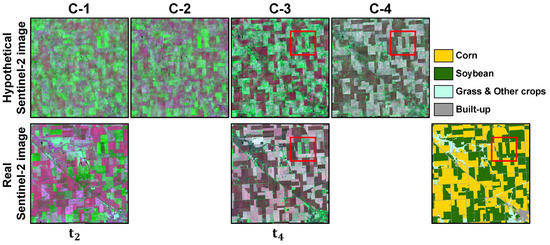
Figure 10.
Hypothetical Sentinel-2 images generated by Pix2Pix and S-CycleGAN and the real Sentinel-2 images (NIR–SWIR1–RE2 as RGB) for the four C cases with the CDL. Red boxes indicate soybean parcels whose spectral reflectance values differ from surrounding parcels. Image acquisition dates indicated as t can be found in Table 1.
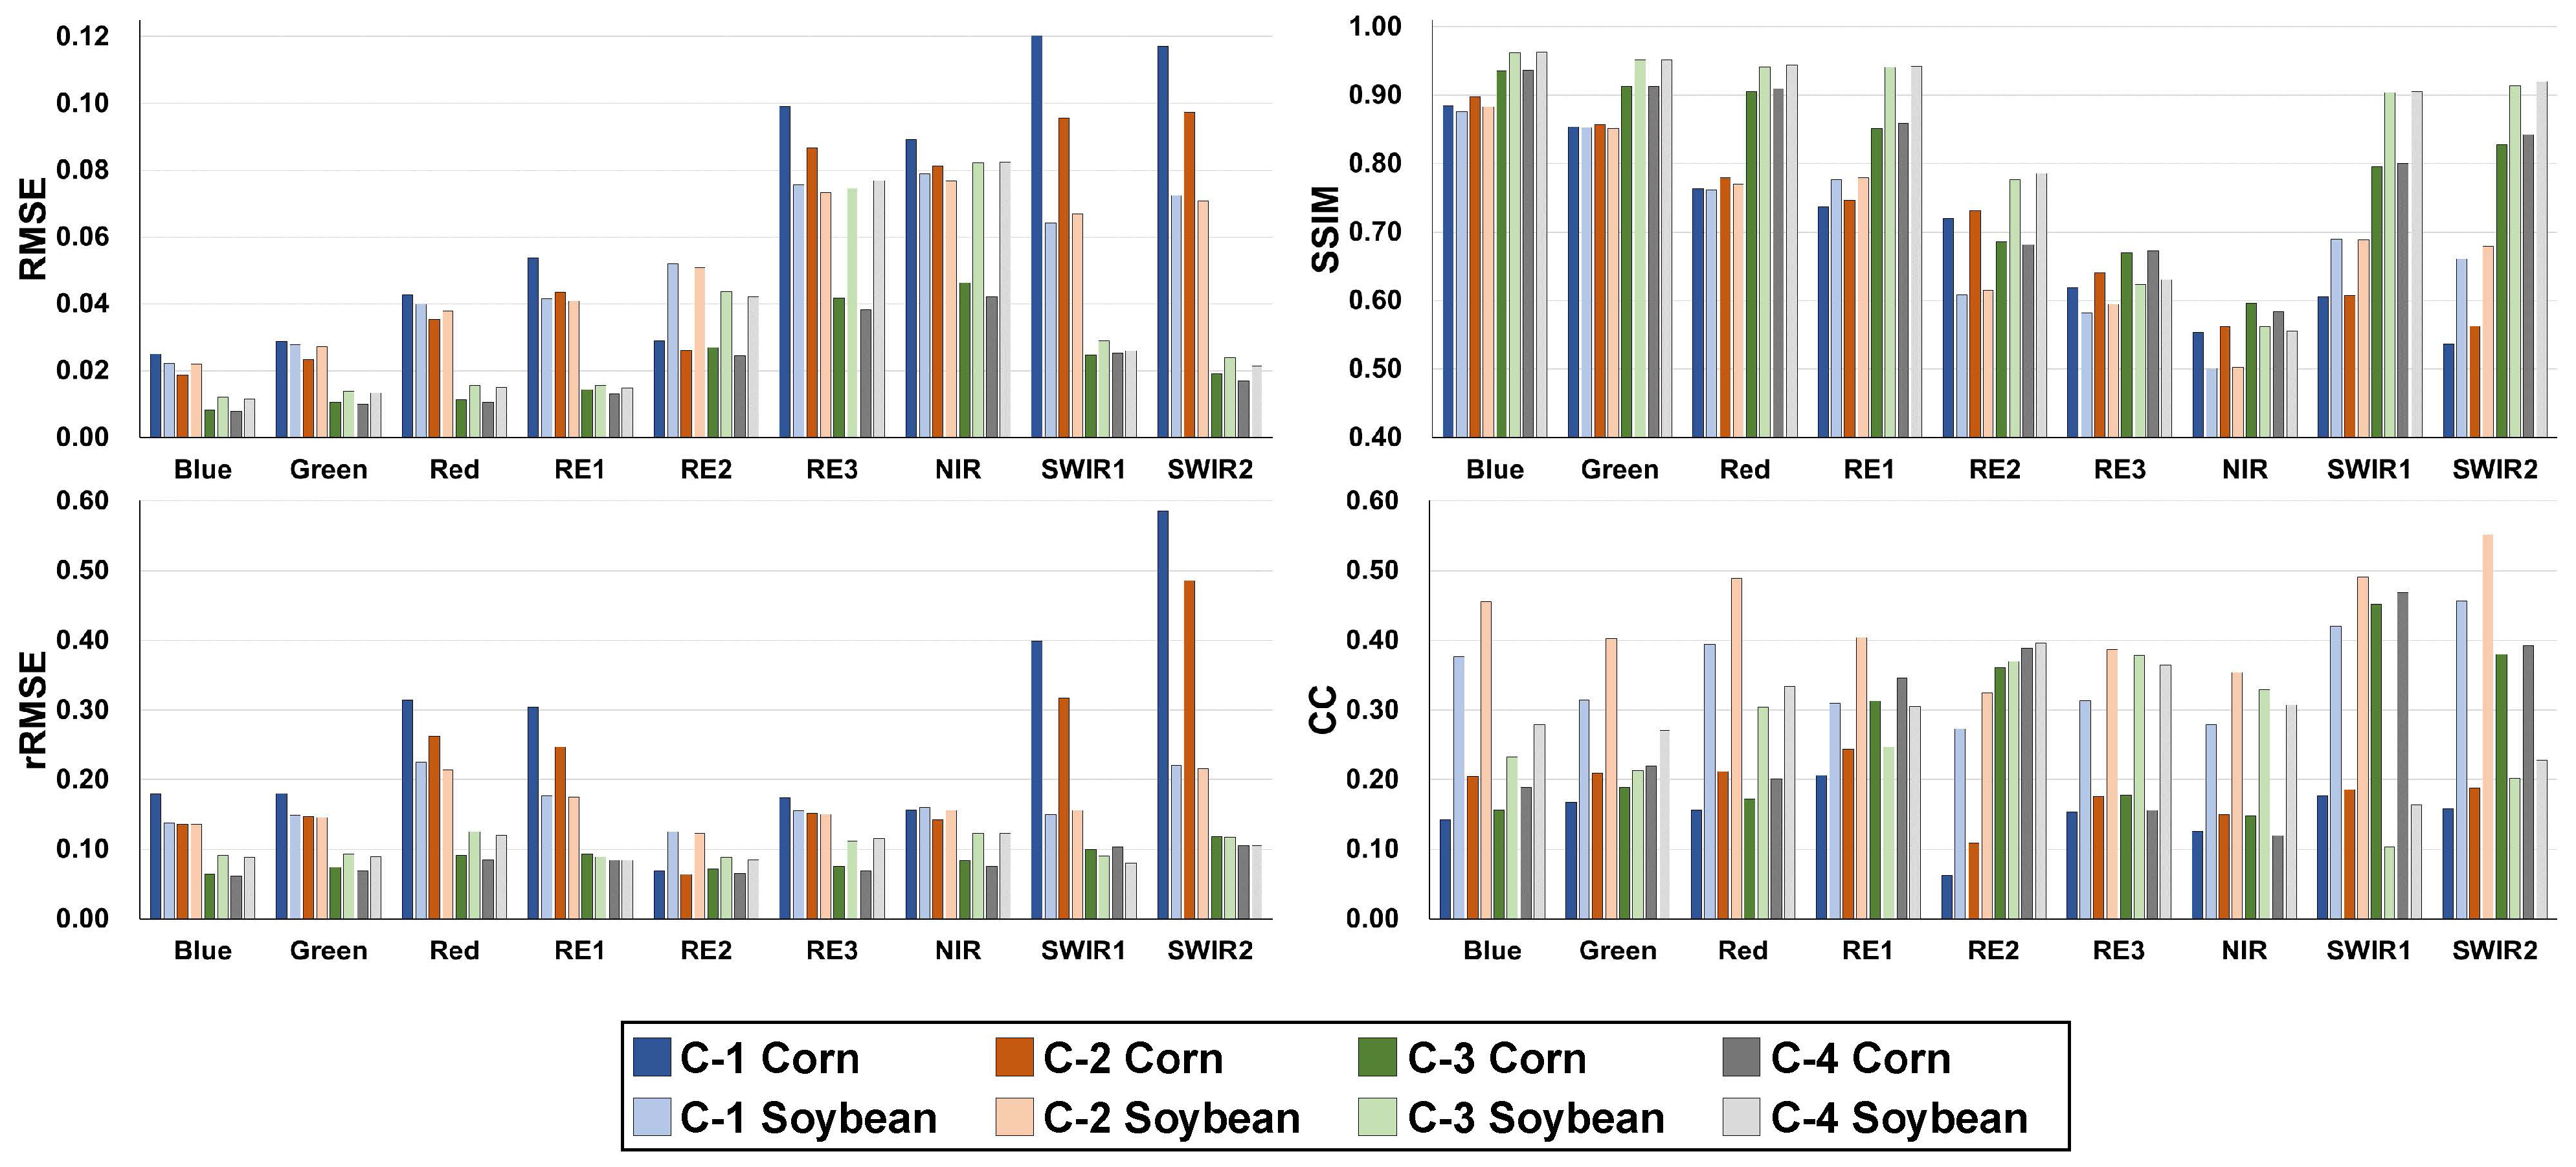
Figure 11 illustrates the quantitative assessment results for different SAR-to-optical image translation methods. As expected from the visual comparison results, MTcGAN showed the best prediction performance in all cases (A and B cases) compared to Pix2Pix and S-CycleGAN (C case). The improvement in the prediction accuracy of MTcGAN was more pronounced for the SWIR1 and SWIR2 bands. For example, MTcGAN improved the RMSE in corn from 0.120 (C-1) and 0.096 (C-2) to 0.022 (A-1) for the SWIR1 band and from 0.117 (C-1) and 0.097 (C-2) to 0.02 (A-1) for the SWIR2 band. The prediction accuracy of Pix2Pix and S-CycleGAN was significantly improved for C-3 and C-4. However, MTcGAN (A-4) still had better predictive performance than Pix2Pix and S-CycleGAN, regardless of the acquisition dates of the image pairs. The results of both the qualitative and quantitative comparisons demonstrate the advantage of MTcGAN in SAR-to-optical image translation, particularly when the vegetation vitality of crops is low.
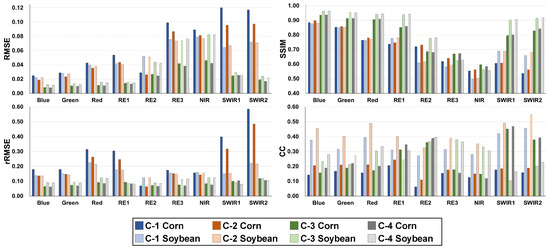
Figure 11.
Quantitative accuracy measures of corn and soybean for the four C cases of Pix2Pix and S-CycleGAN.
5. Discussion
5.1. Applicability of MTcGAN
Most previous studies on SAR-to-optical translation [26,35,37] have focused on generating hypothetical optical images that are closer to real images rather than their application in specific fields. The main contribution of this study is the evaluation of the applicability of MTcGAN in terms of different input data combinations, by considering rapid changes in the vegetation vitality of crops. To this end, performance evaluation experiments were conducted by comprehensively considering both the crop growth status on the prediction date and the availability of image pairs according to weather conditions. A consideration of these two conditions is essential when utilizing optical images for early-stage crop monitoring.
The experiments using multi-temporal Sentinel-1 and -2 images showed that a low correlation between NDVI values for prediction and reference dates significantly degraded the prediction performance of MTcGAN. As the temporal distance between the prediction and reference dates increased, the correlation of NDVI rapidly decreased. The variations in the growth rates of individual crops indicated by the low correlation were reflected differently in the SAR and optical images. For example, some soybean parcels appeared dark green in the false color composite (VV–VH–RVI as RGB) of the Sentinel-1 images acquired when crops had the lowest vegetation vitality (as shown in Figure 4b). The scattering properties of these parcels became similar to those of the surrounding soybean parcels in just 10 days (see SAR images acquired at and in Figure 3). However, such changes were not evident in the Sentinel-2 images acquired on the same date. This difference between the SAR and optical images was a primary factor hindering the appropriate learning of MTcGAN.
In terms of predictive performance, MTcGAN achieved a lower RMSE and higher SSIM and CC compared to existing methods, as shown in Figure 7 and Figure 11. Although the temporal distance between the prediction and reference dates was limited to less than one month, the advantage of MTcGAN was particularly pronounced in crop parcels with significant changes in vegetation vitality (see red boxes in Figure 6 and Figure 10). It is worth emphasizing that MTcGAN is simple to implement and provides superior prediction performance compared to existing methods as it only requires additional input data. Moreover, the prediction results from different combinations of input data can be used as a guide for selecting input data when applying MTcGAN to generate hypothetical optical images for early-stage crop monitoring.
5.2. Future Research Directions
Previous studies [20,21] reported that hypothetical optical images can be effectively applied in crop classification. In addition to crop classification [8,11], optical images can also be utilized for various monitoring and thematic mapping applications, such as tree detection and observation of growing status [51,52], crop yield prediction [53], and plant stress detection [13,54]. In real applications, hypothetical optical image generation is not the ultimate goal per se; instead, it is a preliminary step in constructing a cloud-free optical image time series for monitoring tasks. In this study, hypothetical Sentinel-2 images were generated to be used for early-stage crop monitoring. Several spectral indices, such as normalized difference vegetation index (NDVI), can be computed from the hypothetical Sentinel-2 images and used for crop monitoring. Despite its broad applicability for vegetation monitoring, NDVI has a saturation issue during periods of peak biomass. This limitation of NDVI can be alleviated using other spectral indices, such as normalized difference water index (NDWI) based on SWIR and NIR bands [55]. In this study, MTcGAN achieved satisfactory prediction accuracy for the two SWIR bands of Sentinel-2 imagery. Thus, the NDWI computed from the hypothetical Sentinel-2 image can be utilized to analyze the temporal responses of corn and soybean. As USDA provides information on crop progress on a weekly basis for each state and some specific agricultural districts [56], it is feasible to analyze the variability in vegetation indices according to different crop growth stages. Thus, it is worthwhile to compare the multi-year behaviors of NDVI and NDWI for corn and soybean under different weather conditions in order to highlight the benefit of hypothetical optical image generation for crop monitoring.
However, it should be noted that there are inherent problems with the direct application of hypothetical optical images predicted by SAR-to-optical image translation due to intrinsic errors present in the images, which result in error propagation issues in further analyses. This issue implies that the complete replacement of optical images with SAR images is impossible or at least difficult. However, this difficulty can be alleviated if SAR-to-optical image translation is focused on the removal of clouds from optical imagery. The benefit of SAR-to-optical image translation has been demonstrated in both cloud removal and missing value reconstruction [26,37]. The typical approach to improving prediction performance in cloud removal is to utilize cloud-free pixels as additional information for predicting the reflectance values of pixels contaminated by clouds and shadows. For example, pixels contaminated by clouds can be restored through SAR-to-optical image translation, and calibration procedures, such as regression modeling [24] and Poisson blending [14], can then be applied to correct the restored pixels.
From a methodological viewpoint, implementing SAR-to-optical image translation in MTcGAN by adding multi-temporal image pairs to the Pix2Pix architecture indicates that MTcGAN can be applied to other SAR-to-optical image translation methods. As mentioned in the Introduction, various SAR-to-optical image translation methods have been proposed that can consider new loss functions or modify the U-Net model architecture to mitigate information loss for small objects [32,33,34,35,36,37]. The combination of the advanced method and the simple but efficient nature of MTcGAN has the potential to improve predictive performance for hypothetical optical image generation.
In this study, the potential of MTcGAN for SAR-to-optical image translation was evaluated using a set of five pairs of Sentinel-1 and -2 images acquired in the specific subarea of Illinois State in 2022. The US Corn Belt covers an extensive area where information in optical images is inevitably lost due to cloud contamination. Thus, the hypothetical Sentinel-2 images can be utilized as input for early crop classification. However, from a practical point of view, additional tasks should be considered in SAR-to-optical image translation, such as the extension of spatial and temporal scales. Deep learning has great potential due to its scalability when it comes to extending the study area over the years. MTcGAN may use images acquired under different conditions (e.g., differences in crop growth stages) as input when extending the spatial and temporal scales. Domain adaptation, which transforms images with different characteristics to have similar characteristics [17,34], can be applied as a preprocessing step for MTcGAN. Evaluating these promising tasks to enhance the practicality of hypothetical optical image generation in croplands should be considered in future work.
6. Conclusions
This study evaluated the potential of MTcGAN for generating hypothetical optical images during the early crop growth stages, considering the availability of optical images. In the SAR-to-optical image translation experiments using Sentinel-1 and -2 in Illinois, the advantages of MTcGAN were demonstrated by exploring different input image combinations and comparing the predictive performance with that of existing methods. Two crucial factors must be considered when selecting input images for the application of MTcGAN to SAR-to-optical image translation, namely (1) the degree of change in the vegetation vitality of crops between prediction and reference dates and (2) the ability to identify crops from optical and SAR images. MTcGAN consistently outperformed Pix2Pix and S-CycleGAN regardless of the combination of input data and exhibited notable superiority in the early crop growth stages. These findings thus indicate the benefit of MTcGAN in SAR-to-optical image translation during the early crop growth stages, and the results can serve as a guide for selecting optimal input images for hypothetical optical image generation in croplands.
Author Contributions
Conceptualization, G.-H.K. and N.-W.P.; methodology, G.-H.K. and N.-W.P.; formal analysis, G.-H.K.; data curation, G.-H.K.; writing—original draft preparation, G.-H.K.; writing—review and editing, N.-W.P.; supervision, N.-W.P. All authors have read and agreed to the published version of the manuscript.
Funding
This work was supported by the Inha University Research Grant.
Data Availability Statement
The Sentinel-1 and -2 images are made publicly available by the European Space Agency via the Copernicus Data Space Ecosystem at https://dataspace.copernicus.eu/ (accessed on 18 March 2024).
Conflicts of Interest
The authors declare no conflicts of interest.
References
- Segarra, J.; Buchaillot, M.L.; Araus, J.L.; Kefauver, S.C. Remote sensing for precision agriculture: Sentinel-2 improved features and applications. Agronomy 2020, 10, 641. [Google Scholar] [CrossRef]
- Lee, K.; Kim, S.; Ryu, J.-H.; Ahn, H. Comparison of MODIS and VIIRS NDVI characteristics on corn and soybean cultivation areas in Illinois. Korean J. Remote Sens. 2023, 39, 1483–1490, (In Korean with English Abstract). [Google Scholar]
- Kazemi Garajeh, M.; Salmani, B.; Zare Naghadehi, S.; Valipoori Goodarzi, H.; Khasraei, A. An integrated approach of remote sensing and geospatial analysis for modeling and predicting the impacts of climate change on food security. Sci. Rep. 2023, 13, 1057. [Google Scholar] [CrossRef] [PubMed]
- Franch, B.; Vermote, E.F.; Becker-Reshef, I.; Claverie, M.; Huang, J.; Zhang, J.; Justice, C.; Sobrino, J.A. Improving the timeliness of winter wheat production forecast in the United States of America, Ukraine and China using MODIS data and NCAR Growing Degree Day information. Remote Sens. Environ. 2015, 161, 131–148. [Google Scholar] [CrossRef]
- Becker-Reshef, I.; Barker, B.; Whitcraft, A.; Oliva, P.; Mobley, K.; Justice, C.; Sahajpal, R. Crop type maps for operational global agricultural monitoring. Sci. Data 2023, 10, 172. [Google Scholar] [CrossRef]
- Gao, F.; Anderson, M.; Daughtry, C.; Karnieli, A.; Hively, D.; Kustas, W. A within-season approach for detecting early growth stages in corn and soybean using high temporal and spatial resolution imagery. Remote Sens. Environ. 2020, 242, 111752. [Google Scholar] [CrossRef]
- Song, J.-S.; Kim, S.B.; Ryu, S.; Oh, J.; Kim, D.-S. Emerging plasma technology that alleviates crop stress during the early growth stages of plants: A Review. Front. Plant Sci. 2020, 11, 988. [Google Scholar] [CrossRef] [PubMed]
- Yang, C.; Suh, C.P.C. Applying machine learning classifiers to Sentinel-2 imagery for early identification of cotton fields to advance boll weevil eradication. Comput. Electron. Agric. 2023, 213, 108268. [Google Scholar] [CrossRef]
- Skakun, S.; Franch, B.; Vermote, E.; Roger, J.C.; Becker-Reshef, I.; Justice, C.; Kussul, N. Early season large-area winter crop mapping using MODIS NDVI data, growing degree days information and a Gaussian mixture model. Remote Sens. Environ. 2017, 195, 244–258. [Google Scholar] [CrossRef]
- Kwak, G.-H.; Park, C.-w.; Lee, K.-d.; Na, S.-i.; Ahn, H.-y.; Park, N.-W. Potential of hybrid CNN-RF model for early crop mapping with limited input data. Remote Sens. 2021, 13, 1629. [Google Scholar] [CrossRef]
- Chaves, M.E.D.; Sanches, I.D. Improving crop mapping in Brazil’s Cerrado from a data cubes-derived Sentinel-2 temporal analysis. Remote Sens. Appl. Soc. Environ. 2023, 32, 101014. [Google Scholar] [CrossRef]
- Luo, K.; Lu, L.; Xie, Y.; Chen, F.; Yin, F.; Li, Q. Crop type mapping in the central part of the North China Plain using Sentinel-2 time series and machine learning. Comput. Electron. Agric. 2023, 205, 107577. [Google Scholar] [CrossRef]
- Karmakar, P.; Teng, S.W.; Murshed, M.; Pang, S.; Li, Y.; Lin, H. Crop monitoring by multimodal remote sensing: A review. Remote Sens. Appl. Soc. Environ. 2024, 33, 101093. [Google Scholar] [CrossRef]
- Park, S.; Park, N.-W. Combining Gaussian process regression with Poisson blending for seamless cloud removal from optical remote sensing imagery for cropland monitoring. Agronomy 2023, 13, 2789. [Google Scholar] [CrossRef]
- Hagolle, O.; Huc, M.; Pascual, D.V.; Dedieu, G. A multi-temporal method for cloud detection, applied to FORMOSAT-2, VENuS, LANDSAT and SENTINEL-2 images. Remote Sens. Environ. 2010, 114, 1747–1755. [Google Scholar] [CrossRef]
- Cheng, Q.; Shen, H.; Zhang, L.; Yuan, Q.; Zeng, C. Cloud removal for remotely sensed images by similar pixel replacement guided with a spatio-temporal MRF model. ISPRS J. Photogramm. Remote Sens. 2014, 92, 54–68. [Google Scholar] [CrossRef]
- He, W.; Yokoya, N. Multi-temporal Sentinel-1 and -2 data fusion for optical image simulation. ISPRS Int. J. Geo-Inf. 2018, 7, 389. [Google Scholar] [CrossRef]
- Liu, P.; Li, J.; Wang, L.; He, G. Remote sensing data fusion with generative adversarial networks: State-of-the-art methods and future research directions. IEEE Geosci. Remote Sens. Mag. 2022, 10, 295–328. [Google Scholar] [CrossRef]
- Kulkarni, S.C.; Rege, P.P. Pixel level fusion techniques for SAR and optical images: A review. Inf. Fusion 2020, 59, 13–29. [Google Scholar] [CrossRef]
- Park, N.-W.; Park, M.-G.; Kwak, G.-H.; Hong, S. Deep learning-based virtual optical image generation and its application to early crop mapping. Appl. Sci. 2023, 13, 1766. [Google Scholar] [CrossRef]
- Bermudez, J.D.; Happ, P.N.; Feitosa, R.Q.; Oliveira, D.A.B. Synthesis of multispectral optical images from SAR/optical multitemporal data using conditional generative adversarial networks. IEEE Geosci. Remote Sens. Lett. 2019, 16, 1220–1224. [Google Scholar] [CrossRef]
- Guang, J.; Zhaohui, W.; Lifan, Z.; Yu, X.; Shan, Z.; Shengrong, G. SAR image colorization using multidomain cycle-consistency generative adversarial network. IEEE Geosci. Remote Sens. Lett. 2021, 18, 296–300. [Google Scholar]
- Wang, Z.; Ma, Y.; Zhang, Y. Hybrid cGAN: Coupling global and local features for SAR-to-optical image translation. IEEE Trans. Geosci. Remote Sens. 2022, 60, 5236016. [Google Scholar] [CrossRef]
- Kwak, G.-H.; Park, S.; Park, N.-W. Combining conditional generative adversarial network and regression-based calibration for cloud removal of optical imagery. Korean J. Remote Sens. 2022, 38, 1357–1369, (In Korean with English Abstract). [Google Scholar]
- Xiong, Q.; Li, G.; Yao, X.; Zhang, X. SAR-to-optical image translation and cloud removal based on conditional generative adversarial networks: Literature survey, taxonomy, evaluation indicators, limits and future directions. Remote Sens. 2023, 15, 1137. [Google Scholar] [CrossRef]
- Wang, L.; Xu, X.; Yu, Y.; Yang, R.; Gui, R.; Xu, Z.; Pu, F. SAR-to-optical image translation using supervised cycle-consistent adversarial networks. IEEE Access 2019, 7, 129136–129149. [Google Scholar] [CrossRef]
- Fuentes Reyes, M.; Auer, S.; Merkle, N.; Henry, C.; Schmitt, M. SAR-to-optical image translation based on conditional generative adversarial networks—Optimization, opportunities and limits. Remote Sens. 2019, 11, 2067. [Google Scholar] [CrossRef]
- Zhang, J.; Zhou, J.; Lu, X. Feature-guided SAR-to-optical image translation. IEEE Access 2020, 8, 70925–70937. [Google Scholar] [CrossRef]
- Zhao, Y.; Celik, T.; Liu, N.; Li, H.C. A comparative analysis of GAN-based methods for SAR-to-optical image translation. IEEE Geosci. Remote Sens. Lett. 2022, 19, 3512605. [Google Scholar] [CrossRef]
- Won, T.; Eo, Y.-D. An experiment on image restoration applying the cycle generative adversarial network to partial occlusion Kompsat-3A image. Korean J. Remote Sens. 2022, 38, 33–43. [Google Scholar]
- Huang, Z.; Chen, Z.; Zhang, Q.; Quan, G.; Ji, M.; Zhang, C.; Yang, Y.; Liu, X.; Liang, D.; Zheng, H.; et al. CaGAN: A cycle-consistent generative adversarial network with attention for low-dose CT imaging. IEEE Trans. Comput. Imaging 2020, 6, 1203–1218. [Google Scholar] [CrossRef]
- Li, Y.; Fu, R.; Meng, X.; Jin, W.; Shao, F. A SAR-to-optical image translation method based on conditional generation adversarial network (cGAN). IEEE Access 2020, 8, 60338–60343. [Google Scholar] [CrossRef]
- Yang, X.; Zhao, J.; Wei, Z.; Wang, N.; Gao, X. SAR-to-optical image translation based on improved CGAN. Pattern Recognit. 2022, 121, 108208. [Google Scholar] [CrossRef]
- Turnes, J.N.; Castro, J.D.B.; Torres, D.L.; Vega, P.J.S.; Feitosa, R.Q.; Happ, P.N. Atrous cGAN for SAR to optical image translation. IEEE Geosci. Remote Sens. Lett. 2020, 19, 3031199. [Google Scholar]
- Zhao, J.; Ni, W.; Zhou, Y.; Chen, Y.; Yang, Z.; Bian, F. SAR-to-optical image translation by a variational generative adversarial network. Remote Sens. Lett. 2022, 13, 672–682. [Google Scholar] [CrossRef]
- Kong, Y.; Liu, S.; Peng, X. Multi-scale translation method from SAR to optical remote sensing images based on conditional generative adversarial network. Int. J. Remote Sens. 2022, 43, 2837–2860. [Google Scholar] [CrossRef]
- Jin, M.; Wang, P.; Li, Y. HyA-GAN: Remote sensing image cloud removal based on hybrid attention generation adversarial network. Int. J. Remote Sens. 2024, 45, 1755–1773. [Google Scholar] [CrossRef]
- Christovam, L.E.; Shimabukuro, M.H.; Galo, M.d.L.B.T.; Honkavaara, E. Pix2pix conditional generative adversarial network with MLP loss function for cloud removal in a cropland time series. Remote Sens. 2022, 14, 144. [Google Scholar] [CrossRef]
- Isola, P.; Zhu, J.Y.; Zhou, T.; Efros, A.A. Image-to-image translation with conditional adversarial networks. In Proceedings of the IEEE Conference on Computer Vision and Pattern Recognition 2017, Honolulu, HI, USA, 21–26 July 2017; pp. 1125–1134. [Google Scholar]
- Zhu, J.Y.; Park, T.; Isola, P.; Efros, A.A. Unpaired image-to-image translation using cycle-consistent adversarial networks. In Proceedings of the IEEE International Conference on Computer Vision 2017, Venice, Italy, 22–29 October 2017; pp. 2223–2232. [Google Scholar]
- USDA Foreign Agricultural Service. Available online: https://fas.usda.gov/commodities (accessed on 7 December 2023).
- ESA, Copernicus Data Space Ecosystem. Available online: https://dataspace.copernicus.eu/ (accessed on 28 November 2023).
- SNAP. Available online: https://step.esa.int/main/toolboxes/snap (accessed on 28 November 2023).
- Filipponi, F. Sentinel-1 GRD preprocessing workflow. Proceedings 2019, 18, 11. [Google Scholar] [CrossRef]
- Mandal, D.; Kumar, V.; Ratha, D.; Dey, S.; Bhattacharya, A.; Lopez-Sanchez, J.M.; Rao, Y.S. Dual polarimetric radar vegetation index for crop growth monitoring using sentinel-1 SAR data. Remote Sens. Environ. 2020, 247, 111954. [Google Scholar] [CrossRef]
- Enomoto, K.; Sakurada, K.; Wang, W.; Kawaguchi, N. Image translation between SAR and optical imagery with generative adversarial nets. In Proceedings of the IGARSS 2018-2018 IEEE International Geoscience and Remote Sensing Symposium, Valencia, Spain, 22–27 July 2018; pp. 1752–1755. [Google Scholar]
- CropScape—Cropland Data Layer. Available online: https://nassgeodata.gmu.edu/CropScape (accessed on 1 December 2023).
- TensorFlow. Available online: https://tensorflow.org (accessed on 13 November 2023).
- Keras Documentation. Available online: https://keras.io (accessed on 13 November 2023).
- Amherdt, S.; Leo, N.; Pereira, A.; Cornero, C.; Pacino, M. Assessment of interferometric coherence contribution to corn and soybean mapping with Sentinel-1 data time series. Geocarto Int. 2022, 38, 1–24. [Google Scholar] [CrossRef]
- Zheng, J.; Fu, H.; Li, W.; Wu, W.; Yu, L.; Yuan, S.; Tao, W.Y.W.; Pang, T.K.; Kanniah, K.D. Growing status observation for oil palm trees using Unmanned Aerial Vehicle (UAV) images. ISPRS J. Photogramm. Remote Sens. 2021, 173, 95–121. [Google Scholar] [CrossRef]
- Zheng, J.; Yuan, S.; Wu, W.; Li, W.; Yu, L.; Fu, H.; Coomes, D. Surveying coconut trees using high-resolution satellite imagery in remote atolls of the Pacific Ocean. Remote Sens. Environ. 2023, 287, 113485. [Google Scholar] [CrossRef]
- Roznik, M.; Boyd, M.; Porth, L. Improving crop yield estimation by applying higher resolution satellite NDVI imagery and high-resolution cropland masks. Remote Sens. Appl. Soc. Environ. 2022, 25, 100693. [Google Scholar] [CrossRef]
- Zhou, Y.; Lao, C.; Yang, Y.; Zhang, Z.; Chen, H.; Chen, Y.; Chen, J.; Ning, J.; Yang, N. Diagnosis of winter-wheat water stress based on UAV-borne multispectral image texture and vegetation indices. Agric. Water Manag. 2021, 256, 107076. [Google Scholar] [CrossRef]
- Chen, D.; Huang, J.; Jackson, T.J. Vegetation water content estimation for corn and soybeans using spectral indices derived from MODIS near- and short-wave infrared bands. Remote Sens. Environ. 2005, 98, 225–236. [Google Scholar] [CrossRef]
- USDA National Agricultural Statistics Service. Available online: https://www.nass.usda.gov/Statistics_by_State (accessed on 18 March 2024).


Disclaimer/Publisher’s Note: The statements, opinions and data contained in all publications are solely those of the individual author(s) and contributor(s) and not of MDPI and/or the editor(s). MDPI and/or the editor(s) disclaim responsibility for any injury to people or property resulting from any ideas, methods, instructions or products referred to in the content. |
© 2024 by the authors. Licensee MDPI, Basel, Switzerland. This article is an open access article distributed under the terms and conditions of the Creative Commons Attribution (CC BY) license (https://creativecommons.org/licenses/by/4.0/).