Abstract
The detection of Martian polar ice cap change patterns is important for understanding their effects on driving Mars’s global water cycle and for regulating atmospheric circulation. However, current Martian ice cap identification using optical remote sensing data mainly relies on visual interpretation, which makes it difficult to quickly extract ice caps from multiple images and analyze their fine-scale spatiotemporal variation characteristics. Therefore, this study proposes an automatic Martian polar ice cap extraction algorithm for remote sensing data and analyzes the dynamic change characteristics of the Martian North Pole ice cap using time-series data. First, the automatic Martian ice cap segmentation algorithm was developed based on the ice cap features of high reflectance in the blue band and low saturation in the RGB band. Second, the Martian North Pole ice cap was extracted for the three Martian years MY25, 26, and 28 using Mars Orbiter Camera (MOC) Mars Daily Global Maps (MDGMs) data, which had better spatiotemporal continuity to analyze its variation characteristics. Lastly, the spatiotemporal variation characteristics of the ice cap and the driving factors of ice cap ablation were explored for the three aforementioned Martian years. The results indicated that the proposed automatic ice cap extraction algorithm had good performance, and the classification accuracy exceeded 93%. The ice cap ablation boundary retreat rates and spatiotemporal distributions were similar for the three years, with approximately 105 km2 of ice cap ablation for every one degree of areocentric longitude of the Sun (Ls). The main driving factor of ice cap ablation was solar radiation, which was mainly related to Ls. In addition, elevation had a different effect on ice cap ablation at different Ls in the same latitude area near the ablation boundary of the ice cap.
1. Introduction
The Martian polar caps are currently the largest known reservoirs of H2O ice and CO2 ice on Mars [1,2]. The Martian polar caps have the function of driving the global water cycle of Mars and regulating its atmospheric quality. Many studies have shown that there is an interannual cycle in the north polar regions of Mars, with seasonal cap retreat between Martian years [3,4]. For instance, with the ablation of the seasonal ice cap in the Northern Hemisphere of Mars, a large amount of CO2 sublimates into the atmosphere, which promotes the atmospheric cycle of Mars, with approximately 25% of the atmosphere being cycled through the polar caps annually [5,6,7]. Moreover, icy deposits also record unique information about the past climate conditions and transformations of Mars [8,9,10]. Therefore, the ability to quickly determine the extent of the Martian ice caps and analyze their spatiotemporal variation characteristics is essential.
There are abundant landform features on Mars, such as volcanoes, impact craters, eolian dunes, and polar ice caps. Compared with volcanoes, impact craters, and other topographic and geomorphic types, the reflectance of the Martian ice caps is substantially different, allowing for remote sensing identification. Currently, the methods of using remote sensing technology to identify Martian ice caps are mainly based on radar data and optical data. Among them, the methods of classifying Martian ice caps for optical remote sensing data mainly include visual interpretation, threshold segmentation of a single band or band combinations, and supervised classification using hyperspectral data [11,12]. For example, James et al. employed wide-angle, red-band daily global map (DGM) images and thermal radiation data provided by the Mars Global Surveyor (MGS), combined with empirical formulae, to measure reflectance and infer the boundaries of the ice cap based on the light and shade of images [3]. Based on the Observatoire pour la Minéralogie, l’Eau, les Glaces et l’Activité (OMEGA) instrument’s hyperspectral data obtained by the European Space Agency (ESA)’s Mars Express mission, Zhang et al. utilized the minimum distance classification method to extract the ice cap area in the North Pole region and investigated the seasonal variation in the ice cap over a Martian year [13]. Although the current remote sensing extraction methods for the Martian ice caps have achieved good results, visual interpretation with a heavy workload is easily affected by Martian weather and other factors [14,15]. The large amount of hyperspectral data and the high redundancy between two bands make the extraction of Martian ice caps complicated, and it is difficult to achieve rapid extraction for the analysis and research of Martian ice cap changes with multiperiod remote sensing data.
For analysis of the spatiotemporal variation characteristics of the Martian ice cap, James et al. drew a schematic representation of the recession of the ice cap and ice cap ablation curves as a function of the areocentric longitude of the Sun (Ls) to analyze its spatiotemporal changes in a Martian year [3]. Appéré et al. used the 1429 nm and 1500 nm bands of OMEGA data to analyze the threshold values of CO2 ice and H2O ice reflectance, obtained a variation correlation of the boundary and time of CO2 ice and H2O ice ablation, and then constructed the distribution curve of seasonal ice [16]. Spatiotemporal analysis based on hyperspectral images can determine the ice cap ablation change trend, but it cannot obtain high-temporal-resolution ice cap data covering the entire Northern Hemisphere of Mars. Visual interpretation of Mars Orbiter Camera (MOC) Mars Daily Global Maps (MDGMs) allows for the acquisition of high-temporal-resolution ice cap data. However, the workload of visual interpretation is immense. As a result, it is difficult to conduct long-term ice cap change analysis.
Overall, many achievements have been made in remote sensing extraction and change analysis of the Martian polar ice caps, but there are still limitations. Although there is a large difference in reflectance between ice caps and surrounding coverage types, relying solely on threshold segmentation from a single band may not achieve accurate results, and the workload of visual interpretation is heavy. Hyperspectral data can improve the classification accuracy due to the large number of bands, but they cannot achieve the effect of fast extraction due to the large number of redundant bands and long training time. In addition, in terms of the change analysis of seasonal ice caps, the current research lacks the change law analysis of polar ice cap ablation covering the entire ice cap area, with a fine time interval. Therefore, based on MOC MDGMs with good temporal and spatial continuity covering the entire ice cap area, this study proposes an automatic Martian polar ice cap extraction algorithm for remote sensing data and analyzes the dynamic change characteristics of the Martian North Pole ice cap using time-series data. In this study, we selected regions of interest from images for feature analysis and extraction, aimed at constructing a feature set capable of distinguishing ice caps from other objects. Subsequently, we employed the Otsu method for classification, assessing accuracy to determine the most effective classification approach, which then formed the basis for our automatic Martian polar ice cap extraction algorithm. Utilizing this algorithm, we proceeded to extract ice caps from the time-series images, followed by the calculation of ice cap areas and the extraction of ice cap ablation boundaries. The results extracted and calculated were further used to analyze the dynamic change characteristics of the Martian North Pole ice cap and the driving factors of ice cap ablation.
2. Materials and Methods
2.1. Data and Preprocessing
2.1.1. MOC MDGM Data
The Mars Global Surveyor (MGS) was launched by the United States in November 1996. The MGS is in a polar orbit with an approximately two-hour revisiting period, because twelve consecutive swaths can cover Mars in one day. The Mars Orbiter Camera (MOC) aboard the MGS consists of a narrow-angle camera and two wide-angle red and blue cameras. The wavelength ranges of the two bands are 575–625 nm and 400–450 nm, respectively [17]. The MOC’s wide-angle red and blue cameras (WAR and WAB, respectively) offer a resolution range of 0.25 km to 1.5 km. However, due to downloaded image rate limitations, the spatial resolution is 7.5 km [14]. MGS MOC data are divided into four mission phases, each approximately one Martian year in length: “M” (MY24Ls = 150° − MY25Ls = 111°), “E” (MY25Ls = 111° − MY26Ls = 116°), “R” (MY26Ls = 117° − MY27Ls = 123°), and “S” (MY27Ls = 123° − MY28Ls = 122°) [18].
Mars Daily Global Maps (MDGMs) are generated by Huiqun Wang [18]. Based on the red and blue wide-angle MOC images, which can continuously image the Martian surface, the authors calibrated the strip images and removed the high-frequency brightness variations and some image preprocessing problems. Then, the continuous red- and blue-band global map strips were projected and spliced. The resulting stitched image had a resolution of 0.1° × 0.1°, with a spatial resolution of approximately 6 km at the equator [18]. The MOC MDGMs are divided into three maps: the nonpolar map (60°S–60°N), north polar map (45°N–90°N), and south polar map (45°S–90°S). To make the north polar map in the MDGMs, the average brightness of the relatively cloud-free region between 57.5°N–60°N and 90°W–180°W was normalized, and then the same linear stretch was applied to all red maps and blue maps. The 1/3 red map and 2/3 blue map were combined to construct the green map, and then a common linear stretch was applied [18].
Although the MGS stopped operating more than 10 years ago, this does not affect the use of MGS MOC MDGM data to test the proposed method, which can also be applied to other data within the visible spectral band. In this study, the MOC MDGM north polar map with the areocentric longitude of the Sun (Ls) from 0°–90° in MY25, 26, and 28 was used to extract the ice cap. The data preprocessing included the following steps:
- (1)
- Removing problem images: Since the MOC data have missing images during splicing, some images of the MDGMs after splicing have vacancies, and the missing images in the three Martian years of MY25, MY26, and MY28 were eliminated. The numbers of Ls files and MDGMs are different in some months, so we interpolated the Ls values of the missing parts in each month.
- (2)
- Maximum synthesis: Since some months of Mars have long-lasting dust storms, which obscure the ice caps, maximum synthesis was employed to remove the effect of dust storms in the image. The reflectivity of the dust storm in the blue band is significantly lower than that of the ice cap. Thus, the maximum value synthesis preserves the RGB band of the day with the largest DN value in the blue band within five days of each pixel. Most of the dust storms covering the North Pole ice cap were removed via the five-day maximum synthesis.
- (3)
- Median filter: There was noise in the image, which needed to be eliminated before any segmentation operation, and the median filtering method with a 3 × 3 template was used to eliminate the noise.
2.1.2. DEM
The MGS MOLA DEM data with a spatial resolution of 463 m per pixel were downloaded from the USGS official website, providing a digital elevation model generated by the Mars Orbiter Laser Altimeter (MOLA) carried on the Mars Global Surveyor (MGS) [19]. In this study, DEM data were utilized to explore the relationship between elevation and ice cap ablation. The 45°N–90°N portion of the DEM data was cropped and reprojected to the projection of the MOC north polar MDGMs, and then resampled to a spatial resolution of 0.1° × 0.1°.
2.2. Automatic Martian Polar Ice Cap Extraction Algorithm
The accuracy of threshold segmentation using a single band cannot be guaranteed, and although supervised classification of hyperspectral data can improve the classification accuracy, it has limitations in processing speed. Therefore, we selected and constructed a feature set capable of distinguishing the Martian ice cap from other coverage types, and then we filtered and enhanced the feature set. Subsequently, we investigated the fast remote sensing extraction algorithm for Martian ice caps by combining the binary segmentation algorithm to improve efficiency, on the premise of ensuring the accuracy of ice cap extraction. In our study, we primarily utilized a combination of ENVI and MATLAB for developing the algorithms and performing data analysis.
2.2.1. Color Systems
As mentioned in Section 2.1.1, RGB data were used in this study. Although the green band was not observed but was constructed by combining the red and blue bands, in order to construct more features, the green band was still considered as a band for feature selection. Nonetheless, identification of ice caps solely through RGB bands proves challenging. To search for suitable parameters to construct a new feature index, the HSV color system was also investigated. The HSV color system, in which H represents hue, S denotes saturation, and V indicates value, was proposed in 1978 [20]. HSV is a hexcone model transformed from the RGB cube [21]. Compared with the RGB color system, HSV is more related to human vision in terms of color sensitivity [22,23]. More importantly, HSV shows more robust results to luminance changes and shadow effects than RGB, which has three channels that are attached to brightness [24]. Therefore, the HSV color system is more suitable for segmentation, especially for some data with complex backgrounds [25]. The functions of each channel of HSV are calculated as follows:
2.2.2. Feature Index Construction
To develop an automated segmentation method, a well-built feature set is essential. We considered constructing a feature set capable of distinguishing ice caps from other objects, including bare land and clouds. Although the ice caps on Mars are a mixture of H2O ice and CO2 ice, the CO2 ice and H2O ice are not separated in this study because their reflectivity is similar, making them difficult to distinguish in the visible spectral range [16,26,27]. CO2 ice and H2O ice may be distinguished using the thermal IR band, but its instantaneous spatial coverage is relatively low [28].
To determine the characteristics of the ice cap that distinguish it from other objects, we selected the same amount of regions of interest for the ice cap, bare land, and clouds from three north polar MOC MDGMs of MY25 with Ls 89.2°, Ls 47.55°, and Ls 0.97°, respectively. Then, we drew histograms and stacked graphs, and we calculated the Jeffries–Matusita (JM) distance for judgment based on the regions of interest selected above. When selecting regions of interest in the image, we selected them evenly in each position of the image, and the number of each object type was roughly the same to ensure that the statistics were representative.
The JM distance statistic has been widely applied in remote sensing and image analysis for feature selection and classification tasks. The JM distance, which can range between 0 and 2, takes into account the statistical differences between classes and can effectively discriminate between different classes [29,30,31]. The JM distance (J) between two classes and that are members of a set of C classes (i, j = 1, 2, …, C, i ≠ j) has been defined as follows [32]:
where is the Bhattacharyya distance between classes and . Usually, the multivariate normal distribution is assumed, and the Bhattacharyya distance takes the following form:
where and denote the mean values and and denote the covariance matrices of the classes and , respectively. The superscript denotes the transpose of a matrix.
Figure 1 shows the RGB and HSV stacked graphs of typical regions of the ice cap, bare land, and clouds in the north polar MOC MDGMs. Table 1 shows the JM distances between different objects in the RGB and HSV bands. Since bare land and ice cap account for the largest proportion in the image, the separability between the two should be considered first. Across the four bands of R, G, B, and V, the JM distance between the ice cap and the bare land exceeds 1.8, indicating robust separability. Among them, the JM distance between the ice cap and the bare land of the blue band is the largest, implying the highest separability. Conversely, for the H and S bands, the JM distance between the ice cap and bare land falls below 0.9, indicating poor separability. Particularly, the H band exhibits the smallest JM distance, indicating the poorest separability. As shown by the blue-band stacked graph, the ice cap has higher reflectivity in the blue band, while the bare land has lower reflectivity. However, the JM distance between the ice cap and clouds in the B band is small, so it is difficult to distinguish the ice cap from clouds using only the blue band. On the basis of considering that the blue band is beneficial for distinguishing bare land and ice cap, we further considered the separability between the ice cap and clouds in other bands. Across the R, G, and S bands, the JM distance between the ice cap and clouds exceeded 1.67, indicating good separability. Conversely, the JM distance across the B, H, and V bands fell below 1.2, indicating poor separability. Further examination revealed that the S band displayed relatively small cloud values, with a more concentrated range compared to the R and G bands. This characteristic facilitates the construction of an index with distinct bimodal characteristics. Additionally, analysis of the S-band stacked graph indicated lower saturation of the ice cap and higher saturation of clouds and some bare land, enabling differentiation of the ice cap from high-saturation objects. In conclusion, the reflectance of ice in the RGB band is high, and the change in the RGB band is small; the reflectance of bare land in the RGB band is relatively low, and the change in the RGB band is small; and the reflectance of clouds in the RGB band is relatively high, and the change in the RGB band is relatively large. Therefore, the blue band and S channel were selected as the features to distinguish the ice cap from other objects.
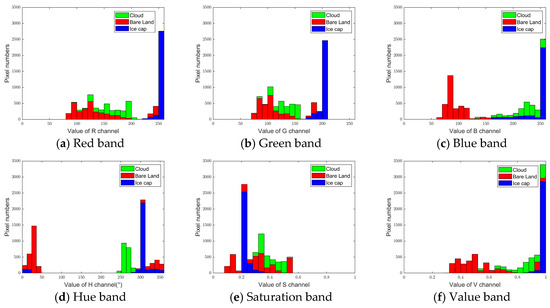
Figure 1.
RGB and HSV stacked graphs of different objects selected from MOC MDGMs.

Table 1.
JM distances for different objects selected in the RGB and HSV bands.
According to the two features of the ice cap, the relatively high reflectivity in the blue band and the low saturation in the RGB band, the blue band and the saturation S channel were selected to construct the normalized index to highlight the difference between the ice cap and other objects. At the same time, since the value range of the saturation S channel was [0, 1], it was necessary to stretch the reflectance value of the saturation S channel to [0, 255]. The formula of the index is presented as follows:
Figure 2 shows the index stacked graph of the ice cap and other objects selected from the MOC MDGMs. The index can distinguish the ice cap from other objects, including bare land and clouds.
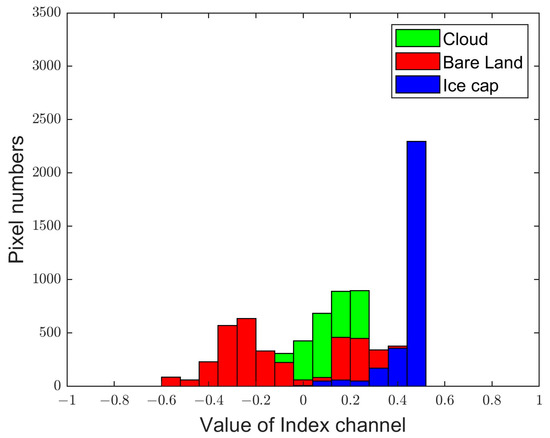
Figure 2.
Index stacked graph of ice cap and other objects selected from MOC MDGMs.
2.2.3. Otsu Segmentation Algorithm
After constructing the characteristic index, Otsu’s method was chosen as the binary segmentation method for extracting the ice cap. The Otsu algorithm is a classic segmentation method that automatically selects the global threshold value according to the distribution of the gray level in its histogram [33]. The main idea of this algorithm is to determine the optimal threshold that can maximize the variance between the target and the background, and it has better accuracy results when applied in remote sensing classification [34,35,36]. The Otsu algorithm can select appropriate segmentation thresholds for images with obvious bimodal features in histograms, but it has poorer results for features with unimodal or inconspicuous bimodal histograms. Therefore, it is necessary to construct features with obvious bimodal characteristics to distinguish the ice cap from other objects [37].
To further investigate the ability of the constructed index to distinguish the ice cap from other objects, an image taken at Ls 89.2°, when there were almost no clouds, was selected. The Otsu method was then applied to this image. Figure 3 shows the blue band, index, and saturation S-channel histograms of the MY25 and Ls 89.2° MOC MDGM images. The blue-band histogram has obvious bimodal characteristics, and the proposed index histogram shows bimodal characteristics. Since the feature shows good bimodality and the Martian North Pole ice cap occupies a moderate proportion of the entire image, Otsu’s method is suitable to perform automatic segmentation for this feature.

Figure 3.
Blue-band segment, index, and saturation S-channel histograms of MY25, Ls 89.2° MOC MDGM image.
By utilizing the Otsu segmentation method and analyzing the histogram, we further assessed the separability of objects. In Figure 4, the blue-band histogram represents the ice cap result after applying the Otsu segmentation method to the image index. Based on the analysis of the blue-band histogram of the ice cap result segmented using the index Otsu method, it can be observed that the index Otsu method successfully eliminates a significant portion of low- and medium-brightness objects. This indicates that the index-based segmentation approach is feasible for distinguishing ice from other objects. However, some low-brightness objects persist in the segmentation result, indicating a need for further refinements to enhance its effectiveness in eliminating all low-brightness objects.
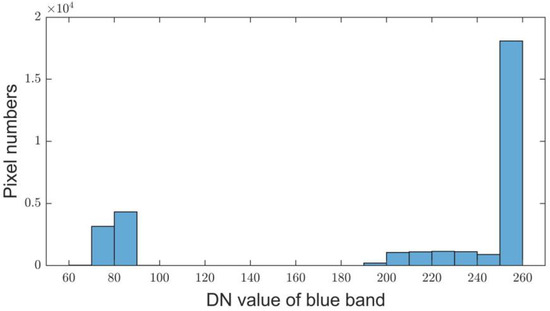
Figure 4.
Blue-band histogram of the ice cap result after segmentation of the image index by Otsu’s method.
Figure 5 shows the index stacked graph distribution of the ice cap and other objects selected in the MY25 and Ls 89.2° MOC MDGM images. It appears that ice caps partially share the same index values with other objects. The reason for this is that a small portion of low- and medium-reflectivity bare land segmented by the Otsu index method experiences minimal changes in the visible light spectrum. As a result, solely relying on the normalization index makes it challenging to differentiate between bare land and all ice caps. To remove the low-reflectivity bare land in this part of the ice cap, we attempted to combine the blue band and index for Otsu method segmentation. This approach takes advantage of the high-reflectivity characteristics of the ice cap in the blue band.
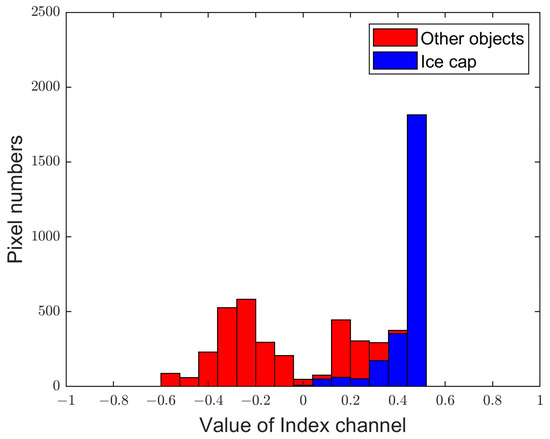
Figure 5.
Index stacked graph of ice cap and other selected objects.
In conclusion, the blue band is better at distinguishing ice caps from low-reflectivity bare ground. The constructed index has advantages in distinguishing clouds and ice caps. However, the two both have some shortcomings, so it is necessary to combine the advantages of the two features to improve segmentation accuracy. At the same time, the effect of the Otsu method is based on the histogram distribution of the image. Different combination methods of the two features will cause differences in the histograms, which will affect the results. In addition, the above analysis is based on the histogram of partial regions of interest selected in the image, and the effect needs to be further evaluated based on the actual image. Therefore, it is necessary to compare and select an automatic Martian polar ice cap extraction algorithm with the best actual effect. Afterward, we compared the four methods that rely only on the blue band or index for Otsu method segmentation or the combination of the blue band and index for Otsu method segmentation to obtain the best method.
The study compared four different methods for segmentation. The first method, namely, the blue-band Otsu method, applies the Otsu method to segment the blue band in the image. The pixels with higher values in the blue band are considered to belong to the ice cap. The second method, namely, the index Otsu method, applies the Otsu method to segment the index in the image. The pixels with higher values are considered to belong to the ice cap. The third method is the index Otsu method with blue-band Otsu method segmentation threshold condition. In this method, the ice cap results are determined by considering the pixels whose values are larger than the thresholds obtained from both the blue-band Otsu method and the index Otsu method. Any other pixels are classified as other objects. The fourth method is using the blue-band Otsu method to divide the ice cap segmented by the index Otsu method. The high-value parts of the index Otsu segmentation results are further divided using the blue-band Otsu method. The resulting high-value parts after two divisions are considered to belong to the ice cap, while the remaining parts are classified as other objects. By comparing the results obtained from these four methods, this study aims to identify the most effective approach for accurately segmenting the ice cap and distinguishing it from other objects.
2.3. Accuracy Assessment Method
In terms of the indicators of accuracy verification, the false-negative rate (FNR), false-positive rate (FPR), and accuracy rate (AR) were chosen as model evaluation indicators. The expression formulae of these three evaluation indicators are presented as follows:
where TP represents the positive samples with a positive segmentation result, that is, the correct number of pixels in the ice cap sample; FP denotes the negative samples divided into positive samples, i.e., the number of pixels in the other object sample that are incorrectly misclassified as ice caps; FN indicates the positive samples with a negative segmentation result, i.e., the number of pixels in the ice cap sample that are misclassified as other objects; and TN represents the negative samples with a negative segmentation result, that is, the number of correctly segmented pixels in the other object sample. The false-negative rate (FNR) indicates the proportion of the ice cap samples that are divided into the other objects, the false-positive rate (FPR) indicates the proportion of the other object samples that are divided into the ice caps, and the accuracy rate (AR) indicates the proportion of correctly classified pixels in the verification samples.
2.4. Analysis of Spatiotemporal Change Characteristics and Their Driving Force
Based on the ice cap extraction algorithm with the best classification accuracy, the MOC MDGM Martian North Pole ice caps with Ls between 0° and 90° in MY25, 26, and 28 were extracted. Then, the ice cap ablation boundary of each image was extracted by the image morphology method based on the extracted ice cap results. According to the obtained ice cap extraction results and the ice cap ablation boundaries, we further conducted spatiotemporal analysis to explore the changing characteristics of ice cap ablation. First, the ice cap ablation boundary map every 10° Ls was drawn to analyze the spatial variation characteristics in MY25, 26, and 28. Second, the North Pole ice cap area and the average latitude of the North Pole ice cap ablation boundary in the three Martian years were linearly fitted with Ls to analyze the ice cap ablation variation trend. According to the coefficients of linear fitting, we can roughly estimate the rate of ice cap ablation. Lastly, we explored how solar radiation and elevation drive ice cap ablation. Because the solar radiation received by the Northern Hemisphere gradually increases with increasing Ls from 0° to 90°, the influence of Ls can be considered to be the influence of solar radiation. By observing the relationships among the ice cap area, ice cap ablation boundary, and Ls, the influence of solar radiation on ice cap ablation was analyzed. Then, to explore the effect of elevation, the correlation coefficient between the extraction results at the average latitude of the ice cap ablation boundary and the DEM at each Ls was calculated to analyze the relationship between the elevation at the same latitude and the ice cap ablation. Generally, a correlation coefficient above 0.7 indicates a very close relationship, a correlation coefficient between 0.4 and 0.7 indicates a close relationship, and a correlation coefficient between 0.2 and 0.4 indicates a general relationship. According to the change in the correlation coefficient with Ls, the relationship between DEM and ice cap ablation at different Ls can be judged.
3. Results
3.1. Classification Accuracy
The three images with MY25 and Ls of 89.2°, 47.55°, and 0.97° were chosen to verify the segmentation accuracy of the four methods. Through visual interpretation, we selected roughly equal ice cap pixels and bare land pixels as the accuracy verification samples. The classification results and accuracy are shown in Table 2 and Figure 6 and Figure 7.

Table 2.
Segmentation accuracy of MOC MDGMs with different methods. Method a (blue-band Otsu method); Method b (index Otsu method); Method c (index Otsu method with the blue-band Otsu method segmentation threshold condition); Method d (using the blue-band Otsu method to divide the ice cap segmented by the index Otsu method).
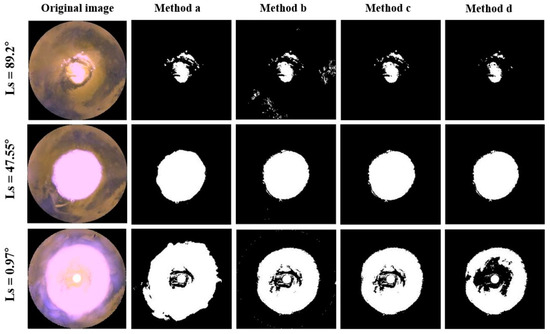
Figure 6.
Segmentation results of different MOC MDGM segmentation methods. Method a (blue-band Otsu method); Method b (index Otsu method); Method c (index Otsu method with the blue-band Otsu method segmentation threshold condition); Method d (using the blue-band Otsu method to divide the ice cap segmented by the index Otsu method).

Figure 7.
Segmentation accuracy of different MOC MDGM segmentation methods. Method a (blue-band Otsu method); Method b (index Otsu method); Method c (index Otsu method with the blue-band Otsu method segmentation threshold condition); Method d (using the blue-band Otsu method to divide the ice cap segmented by the index Otsu method).
According to the accuracy results, it is evident that the blue-band Otsu method performs well in classifying pixels when there is no influence from clouds. This method effectively distinguishes the ice cap, characterized by high reflectivity, from the low-reflectivity bare land in the blue band. Specifically, when Ls = 89.2°, the segmentation accuracy rate (AR) reaches 97.92%. However, the blue-band Otsu method cannot distinguish between ice caps and clouds. As shown in Figure 6 with Ls 0.97° and Table 2, clouds with high reflectivity in the blue band were misclassified as ice caps, with an FPR greater than 40% and an AR of 79.69%.
The effect of the index Otsu method is good. Due to the consideration of the high reflectance of the ice cap in the blue band and the low saturation of the RGB band, this method can separate the ice cap from clouds and most bare land, the classification AR of the three images exceeds 90%, and the overall segmentation accuracy is improved. However, the Otsu index method will misclassify a small amount of low-reflectivity and low-saturation bare land in mid-latitudes as ice caps, resulting in a decrease in accuracy, as shown in Figure 6 with Ls 89.2° and Table 2, with an AR of 92.95%.
The index Otsu method with the blue-band Otsu method segmentation threshold condition has the best classification effect among the four methods. This method removes bare land with low reflectivity in mid-latitudes, and its accuracy is higher than that of the index Otsu method. The classification AR in several images was greater than 93%.
Using the blue-band Otsu method to divide the ice cap segmented by the index Otsu method also removes bare land with low reflectivity in the mid-latitudes, but sometimes the ice cap is misclassified as other objects, as shown in Figure 6 with Ls 89.2° and Table 2, with an AR of 84.72%. The reason for this is that the proportion of the ice cap in the index segmentation results is too high, and the effectiveness of Otsu threshold segmentation will be reduced [38].
In general, the blue-band Otsu method can distinguish objects with high reflectance in the blue band and remove objects with low reflectance. However, its performance diminishes when clouds are present in the image, resulting in a lower AR. For the Otsu index method, the segmentation accuracy is improved, reaching higher than 90%, but some bare land with low reflectivity and low saturation will be incorrectly divided into ice caps, resulting in a decrease in AR. When the blue-band threshold condition is added to the index Otsu method, the FPR decreases, the AR is higher than that of the index Otsu method, and the overall segmentation effect is the best. Using the blue-band Otsu method to divide the ice cap segmented by the index Otsu method reduces the AR due to the high proportion of the ice cap after the first segmentation.
After comprehensive considerations, the index Otsu method with the blue-band Otsu method segmentation threshold condition was selected as the MOC MDGM ice cap extraction algorithm. This algorithm was applied to the following analysis.
3.2. Temporal and Spatial Variations in Ice Cap Ablation
Based on the selected ice cap extraction algorithm above, we extracted the ice cap in the Northern Hemisphere MDGMs with Ls between 0° and 90° in MY25, 26, and 28. Then, we calculated the ice cap area and extracted the ice cap ablation boundary. The ice cap ablation boundary was obtained by combining the erosion, dilation, image connectivity, and Sobel edge extraction methods.
3.2.1. Analysis of Spatial Characteristics
Figure 8 shows schematics of the change in the ablation boundaries of the MY25, 26, and 28 Martian north polar ice caps from the spring equinox to the summer solstice. Figure 9a–c show that in MY25, 26, and 28, Ls gradually decreased from 0° to 90°, and that the seasonal ice cap gradually ablated. The spatial distribution of ice cap ablation in the three Martian years was similar, and it can be speculated that the atmospheric environment of Mars has not significantly changed in the past three years. When Ls ranges from 0° to 10°, there is no significant change in the ablation boundary of the ice cap. When Ls ranges from 10° to 60°, the ablation boundary of the ice cap is roughly circular and more uniform, with a relatively stable retreat rate along the latitude. Between Ls 70° and 90°, the ablation boundary reaches the circumpolar dune field. The ablation boundary of the ice cap is no longer a regular circular shape. The ablation speed between 60°W and 120°W is faster than that between 0°E and 180°E, and it was determined by the DEMs that the elevation of the former is lower than that of the latter. During this period, the ablation boundary retreat rate of the ice cap in MY26 was faster than that in MY25 and MY28. Finally, when Ls reaches 90°, the seasonal ice cap effectively sublimates, and most of the remaining ice cap is permanent.
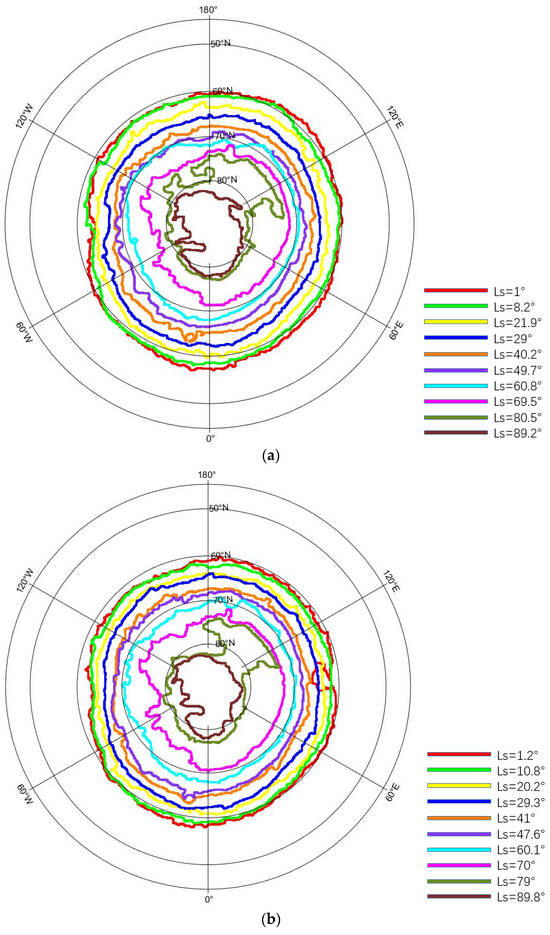
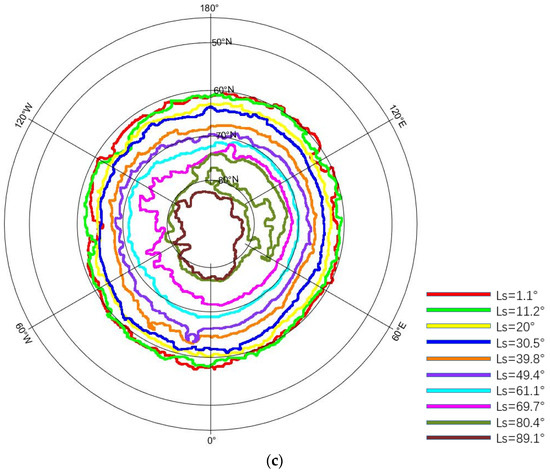
Figure 8.
Schematics of the change in the ablation boundary of the MY25, 26, and 28 Martian North Pole ice caps from the spring equinox to the summer solstice: (a) Change in the ablation boundary of the MY25 Martian North Pole ice cap. (b) Change in the ablation boundary of the MY26 Martian North Pole ice cap. (c) Change in the ablation boundary of the MY28 Martian North Pole ice cap.
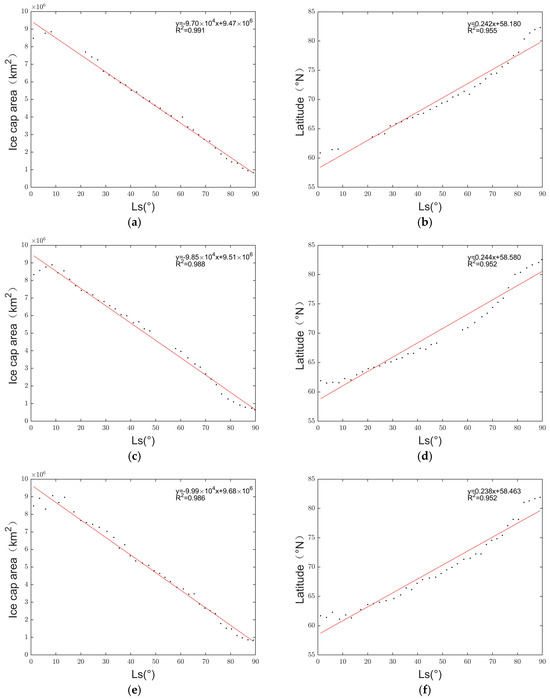
Figure 9.
Plots of ice cap area and average latitude of ice cap ablation boundary against Ls: (a) Plot of ice cap area against Ls in MY25. (b) Plot of average latitude of ice cap ablation boundary against Ls in MY25. (c) Plot of ice cap area against Ls in MY26. (d) Plot of average latitude of ice cap ablation boundary against Ls in MY26. (e) Plot of ice cap area against Ls in MY28. (f) Plot of average latitude of ice cap ablation boundary against Ls in MY28.
3.2.2. Analysis of Temporal Characteristics
Based on the ice cap extraction results and the edge extraction method, the change curves of the ice cap area and the average latitude of the ice cap ablation boundary in the three Martian years of MY25, 26, and 28 were obtained.
According to Figure 9a,c,e, in the three Martian years of MY25, 26, and 28, the relationship between the ice cap area and Ls demonstrates an approximate linearity, with the linear fitting R2 values measuring 0.991, 0.988, and 0.986, respectively, indicating a strong fitting effect. The ablation boundary retreat rate of the ice cap in these three years was approximately the same, and the ice cap sublimated approximately 105 km2 for every one degree of Ls.
Between 0° and 10° of Ls, the ice cap area is small, which is inconsistent with the actual area, because there are large-scale dust storms in the high-latitude area during this period [39]. Some dust storms near the poles have a long duration, so 5-day maximum value synthesis fails to remove all dust storms, causing the ice cap at high latitudes to be covered by dust storms and classified as other objects.
As shown in Figure 9b,d,f, the average latitude of the ice cap ablation boundary is approximately the same as the results of the reference and is approximately linear with Ls. The linear fitting R2 values, measuring 0.955, 0.952, and 0.952, respectively, indicate a strong fitting effect. The change rate of the average latitude of the ice cap ablation boundary in the three years was approximately the same, increasing by 0.24° for every degree of Ls. When Ls ranges from 0° to 10°, the average latitude of the ice cap ablation boundary shows no significant change. Within ranges of 10° to 60°, the average latitude of the ice cap ablation boundary changes at a constant speed. When Ls is from 60° to 80°, the change speed of the average latitude of the ice cap ablation boundary accelerates.
3.3. Analysis of Driving Factors of Ice Cap Ablation
Because the solar radiation received by the Northern Hemisphere gradually increases with increasing Ls from 0° to 90°, the influence of Ls can be considered to be the influence of solar radiation. As shown in Figure 9, when Ls is between 0° and 90°, the ice cap area and ablation boundary in the Northern Hemisphere of Mars gradually decrease with increasing Ls, that is, with increasing solar radiation. Solar radiation has a greater driving effect on ice cap ablation.
To explore the effect of elevation on seasonal ice cap ablation at the same latitude, we selected an area with an average latitude of ±0.05° of the ablation boundary in each image and conducted a correlation analysis between the ice cap extraction results and the DEM. In the ice cap extraction results, the value of ice cap area is 1, and the value of other objects is 0. That is, a positive correlation in the correlation analysis indicates that the higher the elevation, the greater the possibility that the ice cap will not sublimate, and a negative correlation indicates that the higher the elevation, the greater the possibility that the ice cap will sublimate. The correlation analysis results show that the relationship between the ice cap and the elevation was generally consistent in the three years, as shown in Figure 10a–c. Between Ls 0° and 50°, whether the ice cap exists at the average latitude of the ablation boundary of the ice cap is negatively correlated with the elevation, with a correlation coefficient of approximately −0.6. This indicates that, during this period, higher elevations are associated with a higher likelihood of ice cap sublimation. According to Figure 8, during this period, the southern elevation of the average latitude of ice cap ablation is lower, and the ice cap does not sublimate, while the northern elevation is higher, and the ice cap sublimates. It is speculated that the higher the elevation during this period, the greater the solar radiation causing the ice cap to sublimate. Between 50° and 70° of Ls, the correlation coefficient gradually increases from −0.6 to 0.6, indicating a shift in the effect of elevation on ice cap ablation. Specifically, the correlation suggests that as Ls progresses, there is a greater likelihood of ice cap ablation occurring at lower elevations. It is speculated that when the ice cap sublimates to high latitudes, the direct sunlight point cannot reach the high latitudes, leading to an increased influence of ground radiation on ice cap ablation. Consequently, areas with higher elevation are less affected by ground radiation, and ice caps are less likely to ablate. Between 70° and 90° of Ls, the correlation coefficient has a change that first drops and then rises. There is an outlying band of patchy frost deposits from latitudes 75°N to 80°N and from longitudes 90°E to 270°E, and its shape is irregular [40]. With Ls increasing, the proportion of ice cap at the average latitude of the ice cap ablation boundary first decreases and then increases. The decrease in the proportion of ice cap at the average latitude of the ice cap ablation boundary leads to a decrease in the correlation coefficient. As the proportion of ice cap at the average latitude of the ice cap ablation boundary gradually increases, the correlation coefficient also increases.
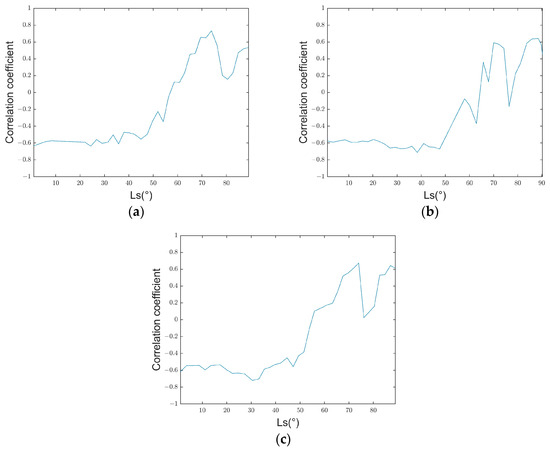
Figure 10.
Correlation coefficients between the elevation of pixels near the average latitude of the ablation boundary of each Ls and whether they are ice caps: (a) Correlation coefficient between the elevation of pixels near the average latitude of the ablation boundary of each Ls and whether they belong to the ice cap in MY25. (b) Correlation coefficient between the elevation of pixels near the average latitude of the ablation boundary of each Ls and whether they belong to the ice cap in MY26. (c) Correlation coefficient between the elevation of pixels near the average latitude of the ablation boundary of each Ls and whether they belong to the ice cap in MY28.
Four images in MY25, with Ls of 40.18°, 56.25°, 60.75°, and 69.45°, were selected to construct box plots from the seasonal ice cap extraction results and DEM near the average latitude of the ablation boundary, as shown in Figure 11a–d. At 40.18°, the lower quartile of the elevation of the non-ice-cap objects is approximately equal to the upper quartile of the elevation of the ice cap, and most of the elevations of the non-ice-cap objects are higher than the elevation of the ice cap. At 56.25° and 60.75°, there are no significant differences between the ice cap and other objects. At 69.45°, the lower quartile of the elevation of the ice cap is greater than the upper quartile of the elevation of the other objects, and the elevation of most of the seasonal ice cap is higher than that of the other objects, which is consistent with the results shown in Figure 10.
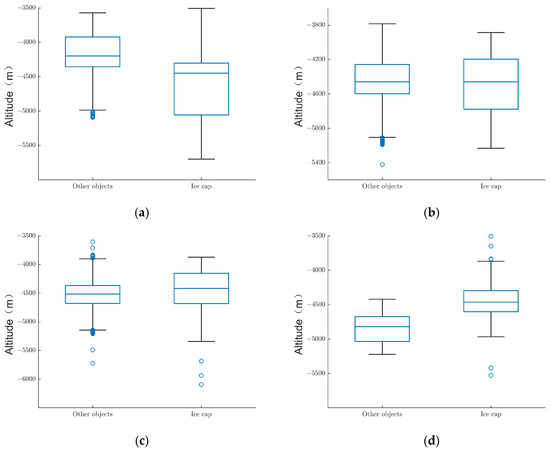
Figure 11.
Box plots of coverage types and elevation: (a) Box plots of coverage types and elevation in MY25 when Ls = 40.18°. (b) Box plots of coverage types and elevation in MY25 when Ls = 56.25°. (c) Box plots of coverage types and elevation in MY25 when Ls = 60.75°. (d) Box plots of coverage types and elevation in MY25 when Ls = 69.45°.
4. Discussion
The proposed automatic ice cap extraction algorithm can quickly extract Martian ice caps with high accuracy by using the visible spectral band, making it suitable for large-scale applications across Mars. However, this method does have limitations. Specifically, when the proportion of ice cap within an image is either too large or too small, the accuracy of the Otsu method threshold used for extraction may be compromised [38]. As a result, the proposed algorithm may not be suitable for small-scale images containing either a few or numerous ice caps. The index, constructed by utilizing the high reflectivity in the blue band of the ice cap and the low saturation in the visible spectral band, demonstrates a certain level of ability to distinguish the ice cap from other objects. However, some low-saturation bare land cannot be effectively removed without incorporating the threshold condition of the blue band. Subsequent research could try other indices or certain feature enhancement methods to better distinguish ice caps from other objects by using the visible spectral band. Due to some dust storms near the poles having a long duration between 0° and 10° of Ls, 5-day maximum value synthesis fails to remove all dust storms, causing the accuracy to decrease. We will consider other band data that are not affected by dust storms to remove their effects. At the same time, the proposed automatic ice cap extraction algorithm has been applied to a limited number of datasets, so we will consider using longer time-series datasets in subsequent research. Other or future mission data will use different wavelengths/sensors, such as thermal IR bands, to distinguish CO2 ice and H2O ice, so some modification might be required.
In terms of spatiotemporal analysis, we discovered that the spatial distribution of ice cap ablation in the three Martian years was essentially consistent. The boundary range in MY25 is roughly the same as James et al.’s visual interpretation results, showing that automatic extraction results are relatively reliable [3]. Compared with Zhang et al.’s supervised classification results based on hyperspectral images, the calculated ice cap ablation trend has a higher time resolution and shows more details of changes [13]. The linear fits of the latitude of the ice cap ablation boundary against Ls in MY25 are provided in Table 3. Comparing the linear fits of the latitude of the ice cap ablation boundary against Ls in MY25 with other results, the ice cap ablation boundary retreat rates are roughly the same, and the small differences can be attributed to varying methods as well as to the Ls range over which the fit was performed [3,4]. In contrast to other studies, it was determined that the ice cap did not significantly sublimate when Ls was between 0° and 10°. The ablation boundary retreat rate along latitude is faster when Ls is between 70° and 90° than when Ls is between 10° and 60°. When Ls ranges between 70° and 90°, the ablation boundary retreat rate of the MY26 ice cap is faster than that of MY25 and MY28. However, the spatiotemporal analysis does not take into account changes in the thickness of the ice cap and cannot calculate the amount of CO2 entering the atmosphere. If combined with laser altimetry data, the mass or volume of ice cap ablation could be calculated to better study the changes in the Martian ice cap.

Table 3.
MY25 ice cap ablation boundary with different methods.
In terms of driving force analysis, we discovered that the correlation between the elevation at the average latitude of the ablation boundary and the ice cap ablation greatly varied with increasing Ls. Between 0° and 50° of Ls, other ice cap objects at the mean latitude of the ice cap ablation boundary are negatively correlated with elevation. When Ls is between 50° and 70°, the correlation coefficient gradually increases, and the relationship between the elevation at the average latitude of the ablation boundary of the ice cap and the ablation of the ice cap is gradually positive. However, only the relationship between the elevation at the same latitude and the ice cap ablation was analyzed, and adding data such as air temperature could better explain the differences in ice cap ablation at the same latitude.
5. Conclusions
This study proposed an automatic Martian polar ice cap extraction algorithm for remote sensing data and analyzed the dynamic change characteristics of the Martian North Pole ice cap using time-series data. The following conclusions can be drawn:
- (1)
- By comprehensively using the proposed normalized index and the blue band for Otsu segmentation, the Martian ice cap can be quickly extracted with accuracy greater than 90%.
- (2)
- When Ls ranges from 0° to 10°, there is no significant change in the ablation boundary of the ice cap. When Ls ranges from 10° to 60°, the ablation boundary of the ice cap is roughly circular and more uniform, and the ablation boundary retreat rate along the latitude is relatively stable. Between 70° and 90° of Ls, the ice cap ablation boundary is no longer a regular round shape, and most of the remaining boundary is permanent ice cap. The ablation boundary retreat rate of the ice cap in the three studied years was roughly the same, approximately 105 km2 ice cap was sublimated for every one degree of Ls, and the average latitude of the ice cap ablation boundary was increased by 0.24° for every one degree of Ls.
- (3)
- The ablation of the Martian ice cap is mainly affected by solar radiation, which is mainly related to Ls. Elevation has different effects on ice cap ablation at different Ls in the same latitude area near the ablation boundary of the ice cap, with a strong negative correlation between 0° and 50° and a transition from a strong negative correlation to a strong positive correlation between 50° and 70°.
Author Contributions
Conceptualization, K.J.; methodology, W.X. and Z.C.; software, W.X.; validation, W.X. and Z.C.; formal analysis, Z.C.; writing—original draft preparation, W.X.; writing—review and editing, H.Z., K.J., D.Y., X.Z. (Xiang Zhao), Y.Y. and X.Z. (Xiaotong Zhang); supervision, K.J. All authors have read and agreed to the published version of the manuscript.
Funding
This study was supported by the National Natural Science Foundation of China, grant number 42192581 and 42171318.
Data Availability Statement
The original contributions presented in the study are included in the article, further inquiries can be directed to the corresponding author.
Conflicts of Interest
The authors declare no conflicts of interest.
References
- Bibring, J.-P.; Langevin, Y.; Poulet, F.; Gendrin, A.; Gondet, B.; Berthé, M.; Soufflot, A.; Drossart, P.; Combes, M.; Bellucci, G.; et al. Perennial Water Ice Identified in the South Polar Cap of Mars. Nature 2004, 428, 627–630. [Google Scholar] [CrossRef]
- Jakosky, B.M.; Slipski, M.; Benna, M.; Mahaffy, P.; Elrod, M.; Yelle, R.; Stone, S.; Alsaeed, N. Mars’ Atmospheric History Derived from Upper-Atmosphere Measurements of 38Ar/36Ar. Science 2017, 355, 1408–1410. [Google Scholar] [CrossRef] [PubMed]
- James, P.B.; Cantor, B.A. Martian North Polar Cap Recession: 2000 Mars Orbiter Camera Observations. Icarus 2001, 154, 131–144. [Google Scholar] [CrossRef]
- Calvin, W.M.; James, P.B.; Cantor, B.A.; Dixon, E.M. Interannual and Seasonal Changes in the North Polar Ice Deposits of Mars: Observations from MY 29–31 Using MARCI. Icarus 2015, 251, 181–190. [Google Scholar] [CrossRef]
- Guo, X.; Richardson, M.I.; Soto, A.; Toigo, A. On the Mystery of the Perennial Carbon Dioxide Cap at the South Pole of Mars. J. Geophys. Res. Planets 2010, 115, E04005. [Google Scholar] [CrossRef]
- Kieffer, H.H. Mars South Polar Spring and Summer Temperatures: A Residual CO2 Frost. J. Geophys. Res. Solid Earth 1979, 84, 8263–8288. [Google Scholar] [CrossRef]
- Tillman, J.E.; Johnson, N.C.; Guttorp, P.; Percival, D.B. The Martian Annual Atmospheric Pressure Cycle: Years without Great Dust Storms. J. Geophys. Res. Planets 1993, 98, 10963–10971. [Google Scholar] [CrossRef]
- Clifford, S.M.; Fisher, D.A.; Rice, J.W. Introduction to the Mars Polar Science Special Issue: Exploration Platforms, Technologies and Potential Future Missions. Icarus 2000, 144, 205–209. [Google Scholar] [CrossRef]
- Hansen, C.J.; Byrne, S.; Portyankina, G.; Bourke, M.; Dundas, C.; McEwen, A.; Mellon, M.; Pommerol, A.; Thomas, N. Observations of the Northern Seasonal Polar Cap on Mars: I. Spring Sublimation Activity and Processes. Icarus 2013, 225, 881–897. [Google Scholar] [CrossRef]
- Piqueux, S.; Christensen, P.R. North and South Subice Gas Flow and Venting of the Seasonal Caps of Mars: A Major Geomorphological Agent. J. Geophys. Res. Planets 2008, 113, E06005. [Google Scholar] [CrossRef]
- Douté, S.; Schmitt, B.; Bibring, J.-P.; Langevin, Y.; Altieri, F.; Bellucci, G.; Gondet, B. Mars Express OMEGA Team Nature and Composition of the Icy Terrains of the South Pole of Mars from MEX OMEGA Observations. In Proceedings of the 36th Annual Lunar and Planetary Science Conference, League City, TX, USA, 14–18 March 2005; p. 1734. [Google Scholar]
- Fukuhara, T.; Imamura, T. Waves Encircling the Summer Southern Pole of Mars Observed by MGS TES. Geophys. Res. Lett. 2005, 32, 18. [Google Scholar] [CrossRef]
- Zhang, D.K.; Liu, Z.Q.; Di, K.C.; Yue, Z.Y.; Liu, F.; Gou, S. Monitoring of seasonal changes of Martian north polar ice cap with OMEGA images. Remote Sens. Land Resour. 2016, 28, 99–105. [Google Scholar] [CrossRef]
- Cantor, B.A.; James, P.B.; Calvin, W.M. MARCI and MOC Observations of the Atmosphere and Surface Cap in the North Polar Region of Mars. Icarus 2010, 208, 61–81. [Google Scholar] [CrossRef]
- Di, K.; Xu, F.; Wang, J.; Agarwal, S.; Brodyagina, E.; Li, R.; Matthies, L. Photogrammetric Processing of Rover Imagery of the 2003 Mars Exploration Rover Mission. ISPRS J. Photogramm. Remote Sens. 2008, 63, 181–201. [Google Scholar] [CrossRef]
- Appéré, T.; Schmitt, B.; Langevin, Y.; Douté, S.; Pommerol, A.; Forget, F.; Spiga, A.; Gondet, B.; Bibring, J.-P. Winter and Spring Evolution of Northern Seasonal Deposits on Mars from OMEGA on Mars Express. J. Geophys. Res. 2011, 116, E05001. [Google Scholar] [CrossRef]
- Malin, M.C.; Edgett, K.S. Mars Global Surveyor Mars Orbiter Camera: Interplanetary Cruise through Primary Mission. J. Geophys. Res. Planets 2001, 106, 23429–23570. [Google Scholar] [CrossRef]
- Wang, H.; Ingersoll, A.P. Martian Clouds Observed by Mars Global Surveyor Mars Orbiter Camera. J. Geophys. Res. Planets 2002, 107, 8-1–8-16. [Google Scholar] [CrossRef]
- Smith, D.E.; Zuber, M.T.; Frey, H.V.; Garvin, J.B.; Head, J.W.; Muhleman, D.O.; Pettengill, G.H.; Phillips, R.J.; Solomon, S.C.; Zwally, H.J.; et al. Mars Orbiter Laser Altimeter: Experiment Summary after the First Year of Global Mapping of Mars. J. Geophys. Res. Planets 2001, 106, 23689–23722. [Google Scholar] [CrossRef]
- Smith, A.R. Color Gamut Transform Pairs. ACM Siggraph Comput. Graph. 1978, 12, 12–19. [Google Scholar] [CrossRef]
- Liu, J.; Zhong, X. An Object Tracking Method Based on Mean Shift Algorithm with HSV Color Space and Texture Features. Cluster Comput. 2019, 22, 6079–6090. [Google Scholar] [CrossRef]
- Indriani, O.R.; Kusuma, E.J.; Sari, C.A.; Rachmawanto, E.H.; Setiadi, D.R.I.M. Tomatoes Classification Using K-NN based on GLCM and HSV Color Space. In Proceedings of the 2017 International Conference on Innovative and Creative Information Technology (ICITech), Salatiga, Indonesia, 2–4 November 2017; pp. 1–6. [Google Scholar]
- Song, J.; Liu, L.; Huang, W.; Li, Y.; Chen, X.; Zhang, Z. Target Detection via HSV Color Model and Edge Gradient Information in Infrared and Visible Image Sequences under Complicated Background. Opt. Quant. Electron. 2018, 50, 175. [Google Scholar] [CrossRef]
- Bora, D. A Novel Approach for Color Image Edge Detection Using Multidirectional Sobel Filter on HSV Color Space. Int. J. Comput. Sci. Eng. 2017, 5, 154–159. [Google Scholar]
- Shen, Z.; Zheng, S.; Dong, R.; Chen, G. Saturation of Stool Color in HSV Color Model Is a Promising Objective Parameter for Screening Biliary Atresia. J. Pediatr. Surg. 2016, 51, 2091–2094. [Google Scholar] [CrossRef]
- Kieffer, H. TES Mapping of Mars’ North Seasonal Cap. Icarus 2001, 154, 162–180. [Google Scholar] [CrossRef]
- Langevin, Y.; Bibring, J.-P.; Montmessin, F.; Forget, F.; Vincendon, M.; Douté, S.; Poulet, F.; Gondet, B. Observations of the South Seasonal Cap of Mars during Recession in 2004–2006 by the OMEGA Visible/near-Infrared Imaging Spectrometer on Board Mars Express. J. Geophys. Res. Planets 2007, 112, 2841. [Google Scholar] [CrossRef]
- Piqueux, S.; Kleinböhl, A.; Hayne, P.O.; Kass, D.M.; Schofield, J.T.; McCleese, D.J. Variability of the Martian Seasonal CO2 Cap Extent over Eight Mars Years. Icarus 2015, 251, 164–180. [Google Scholar] [CrossRef]
- Wardlow, B.D.; Egbert, S.L.; Kastens, J.H. Analysis of Time-Series MODIS 250 m Vegetation Index Data for Crop Classification in the U.S. Central Great Plains. Remote Sens. Environ. 2007, 108, 290–310. [Google Scholar] [CrossRef]
- Zhang, X.; Lin, X.; Fu, D.; Wang, Y.; Sun, S.; Wang, F.; Wang, C.; Xiao, Z.; Shi, Y. Comparison of the Applicability of J-M Distance Feature Selection Methods for Coastal Wetland Classification. Water 2023, 15, 2212. [Google Scholar] [CrossRef]
- Sen, R.; Mandal, A.K.; Goswami, S.; Chakraborty, B. A Comparative Study of the Stability of Filter Based Feature Selection Algorithms. In Proceedings of the 2019 IEEE 10th International Conference on Awareness Science and Technology (iCAST), Morioka, Japan, 23–25 October 2019; pp. 1–6. [Google Scholar]
- Dabboor, M.; Howell, S.; Shokr, M.; Yackel, J. The Jeffries–Matusita Distance for the Case of Complex Wishart Distribution as a Separability Criterion for Fully Polarimetric SAR Data. Int. J. Remote Sens. 2014, 35, 6859–6873. [Google Scholar]
- Zhang, J.; Hu, J. Image Segmentation Based on 2D Otsu Method with Histogram Analysis. In Proceedings of the 2008 International Conference on Computer Science and Software Engineering, Wuhan, China, 12–14 December 2008; Volume 6, pp. 105–108. [Google Scholar]
- Yuan, X.; Martínez, J.-F.; Eckert, M.; López-Santidrián, L. An Improved Otsu Threshold Segmentation Method for Underwater Simultaneous Localization and Mapping-Based Navigation. Sensors 2016, 16, 1148. [Google Scholar] [CrossRef]
- Lv, Z.; Liu, T.; Zhang, P.; Benediktsson, J.; Lei, T.; Zhang, X. Novel Adaptive Histogram Trend Similarity Approach for Land Cover Change Detection by Using Bitemporal Very-High-Resolution Remote Sensing Images. IEEE Trans. Geosci. Remote Sens. 2019, 57, 9554–9574. [Google Scholar] [CrossRef]
- Zheng, Z.; Cao, J.; Lv, Z.; Benediktsson, J.A. Spatial–Spectral Feature Fusion Coupled with Multi-Scale Segmentation Voting Decision for Detecting Land Cover Change with VHR Remote Sensing Images. Remote Sens. 2019, 11, 1903. [Google Scholar] [CrossRef]
- Zhan, Y.; Zhang, G. An Improved OTSU Algorithm Using Histogram Accumulation Moment for Ore Segmentation. Symmetry 2019, 11, 431. [Google Scholar] [CrossRef]
- Yuan, X.; Jiang, H.; Chen, Y.Z.; Wang, X. Extraction of water body information using adaptive threshold value and OTSU algorithm. Remote Sens. Inf. 2016, 31. [Google Scholar] [CrossRef]
- Cantor, B.A.; James, P.B.; Caplinger, M.; Wolff, M.J. Martian Dust Storms: 1999 Mars Orbiter Camera Observations. J. Geophys. Res. Planets 2001, 106, 23653–23687. [Google Scholar] [CrossRef]
- Calvin, W.M.; Titus, T.N. Summer Season Variability of the North Residual Cap of Mars as Observed by the Mars Global Surveyor Thermal Emission Spectrometer (MGS-TES). Planet. Space Sci. 2008, 56, 212–226. [Google Scholar] [CrossRef]
Disclaimer/Publisher’s Note: The statements, opinions and data contained in all publications are solely those of the individual author(s) and contributor(s) and not of MDPI and/or the editor(s). MDPI and/or the editor(s) disclaim responsibility for any injury to people or property resulting from any ideas, methods, instructions or products referred to in the content. |
© 2024 by the authors. Licensee MDPI, Basel, Switzerland. This article is an open access article distributed under the terms and conditions of the Creative Commons Attribution (CC BY) license (https://creativecommons.org/licenses/by/4.0/).
