Abstract
North China (NC) is experiencing significant groundwater depletion. We used GRACE and GRACE-FO RL06 Level-2 data with Mascon data from April 2002 to July 2022. We fused these two types of data through the generalized three-cornered hat method and further combined them with hydrological models, precipitation, in situ groundwater-level, and groundwater extraction (GWE) data to determine and verify temporal and spatial variations in groundwater storage (GWS) in NC. We quantitatively assessed groundwater sustainability by constructing a groundwater index in NC. We further explored the dynamic cyclic process of groundwater change and quantified the impact of the South-to-North Water Transfer Project (SNWTP) on GWS change in NC. The overall GWS shows a decreasing trend. The GRACE/GRACE-FO-derived GWS change results are consistent with those shown by the in situ groundwater-level data from the monitoring well. Groundwater in NC is in various states of unsustainability throughout the period 2002 to 2022. The SNWTP affected the water use structure to some extent in NC. This study elucidates the latest spatial–temporal variations in GWS, especially in the groundwater sustainability assessment and quantitative description of the effects of the SNWTP on changes in GWS in NC. The results may provide a reference for groundwater resource management.
1. Introduction
Water resources are closely associated with human survival; therefore, changes in groundwater storage (GWS) have a major impact on daily life [1,2]. China holds scarce water resources and has been facing a major scarcity of groundwater resources in recent years [3], particularly in North China (NC), owing to the effect of anthropogenic and climate factors on groundwater [2]. Recently, the overexploitation of groundwater has caused considerable changes in the GWS in NC, leading to severe ecological and environmental problems and threats to the livelihoods of residents and jeopardizing the sustainable socioeconomic development of the region [4,5]. The depletion of shallow and deep groundwater is prominent in NC due to long-term and persistent overextraction [6].
GWS changes have traditionally been studied using ground monitoring stations [1]. However, the effective detection of large-scale hydrological changes using ground-based observations by ground monitoring stations is limited by high construction costs, high labor intensity, uneven station distribution, and insufficient monitoring network coverage. An alternative method for monitoring groundwater is through the use of satellites. The Gravity Recovery and Climate Experiment (GRACE) and GRACE Follow-on (GRACE-FO) satellites can continuously, steadily, and regularly detect global and regional changes in water storage [7,8,9,10]. Relevant geophysical information can be extracted from the high-precision time-varying gravitational field models provided by GRACE and GRACE-FO. The equivalent water height (EWH, which represents variation in GWS) can be determined with an accuracy of <1 cm, which cannot be achieved with other methods.
GRACE data were used to study hydrological changes in NC, primarily in the terrestrial water storage (TWS) and GWS. GRACE data revealed variation in TWS at medium and long spatial scales from 2003 to 2007 [1], and the rates of decrease in TWS and GWS from 2002 to 2010 were estimated by removing seasonal changes based on GRACE data [11]. The dynamics of GWS from 2002 to 2009 were analyzed based on GRACE, Global Land Data Assimilation System (GLDAS), and field-measured precipitation data [12]. GRACE data were used to reveal groundwater depletion from 2003 to 2010 in NC [13], drought conditions from 2003 to 2015 [14], and differences in GWS in different regions from 2003 to 2011 [15,16]. TWS changes in NC calculated from GRACE data from different institutions were compared [17], and a joint analysis of GWS changes in NC using GRACE and other data or models was performed [18,19,20]. In NC, GRACE data were also used to quantify anthropogenic influences on groundwater depletion rates from January 2003 to December 2012 [21], water shortages during October 2009 [22], and changes in TWS from 2003 to 2014 [23] and 2013 to 2015 [24]. The results of the above studies show that the overall trend of GWS in North China is decreasing.
The continuing decline in GWS in NC is mainly due to long-term overexploitation of groundwater, which is not only detrimental to groundwater sustainable development but also causes serious damage to the environment. Previous studies evaluated groundwater sustainability from the perspective of groundwater pollutants and recommended strengthening water resource management to enhance sustainability [25,26]. On the other hand, changes in GWS in NC will be influenced by other factors, such as the South-to-North Water Diversion Project (SNWTP). The effect of the middle route of the SNWTP on GWS in NC from 2003 to 2017 was discussed after the project commenced in December 2014 [27]. Variation in GWS in NC before and after the SNWTP was estimated using the GRACE data [28]. Spatiotemporal changes in GWS following the SNWTP have been studied using GRACE, GRACE-FO, and Global Navigation Satellite System (GNSS) data from 2015 to 2020 [29]. Temporal and spatial changes in GWS have also been estimated for NC from 2004 to 2020 [30].
Previous studies used different methods and periods of GRACE/GRACE-FO data to estimate the variability of TWS and GWS across different time scales and provided important references for understanding hydrological changes in NC. However, few scholars qualitatively evaluated groundwater sustainability in NC from the perspective of GWS changes and argued that groundwater in NC is in an unsustainable state [24]. The spatial and temporal quantitative evaluation of groundwater sustainability in NC is lacking. Additionally, although the variation in GWS in NC before and after the SNWTP was assessed, evidence showing that the changes in GWS are caused by the SNWTP is lacking [29], and there is currently no adequate quantitative description of the effects of the SNWTP on changes in GWS in NC.
We hypothesize that the uncertainty of hydrological changes and long-term and current temporal and spatial variation characteristics of TWS and GWS in NC can be elucidated by combining long-term GRACE data, GRACE-FO data, hydrological models, measured precipitation, in situ groundwater-level, and GWE data. The dynamic cyclic process of groundwater change can also be explored based on annual GWE data, the impact of the SNWTP on GWS change in NC, and the spatial and temporal evolutionary characteristics of groundwater sustainability in NC quantified.
In this study, we analyzed the changes in TWS and GWS in NC over a long period (April 2002–July 2022) using GRACE and GRACE-FO RL06 Level-2 and Mascon data, hydrological models, precipitation, in situ groundwater-level, and GWE data. We also estimated the hydrological changes and their uncertainties using the generalized three-cornered hat (GTCH) method based on six different GRACE/GRACE-FO products and analyzed the time series of GWS by combining monthly rainfall data, annual average rainfall anomaly data, and in situ groundwater-level data. Furthermore, we determined the spatial interannual and monthly variations in GWS and the mean variation in GWS for different periods and constructed a groundwater sustainability index (SI) model to quantitatively assess the spatial and temporal evolution characteristics of groundwater sustainability in NC. Finally, we conducted a quantitative study of the effect of the SNWTP on GWS changes in NC and compared our results with those from previous studies. Our results provide an important basis for the quantitative evaluation of current and long-term TWS and GWS changes in NC and provide reference values for groundwater resource management.
2. Data and Methods
2.1. Study Area
Located between 34°N and 40°N latitude and from 110°E to 120°E longitude, NC covers an area of approximately 370,000 km2 and includes the cities of Beijing and Tianjin and the provinces of Hebei and Shanxi, in the first-level regional division of land meteorology and geography in China (Figure 1). NC is the political and cultural center of China, as well as the country’s main grain production base, and typically has a temperate semi-humid continental monsoon climate [31]. Climate changes in NC are relatively similar and can be studied as a whole. The summer is hot and rainy, with increased solar altitude angles, long days, and short nights. The summer monsoon comes from the Pacific Ocean and brings abundant rainfall. Conversely, the winter is cold and dry, with mean temperatures below 0 °C in the coldest month and short days and long nights. Winter winds are cold and have high pressure from Siberia and Mongolia, blowing north or northwest [32]. The annual rainfall is approximately 400–800 mm. By comparing and analyzing the different responses of different geological conditions and population carrying capacity to water withdrawal in the study area, the overall water cycle process in NC can be further elucidated.
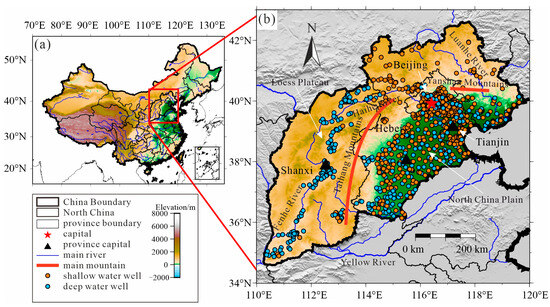
Figure 1.
(a) Location of North China within China and (b) distribution of its groundwater monitoring wells.
NC mainly includes the Taihang Mountains, Yanshan Mountains, the NC Plain, the Loess Plateau, basins, hills, and several rivers, including the Yellow River, Haihe River, Luanhe River, and Fenhe River. In the NC Plain, from the Piedmont Plain to the coastal plain, the lithology of the aquifer changes from pebble to silt sand, and loose rock pore groundwater is widely distributed [33]. The Yanshan Mountains have a large amount of loose rocks and vegetation, which is favorable for water circulation [34]. In the Taihang Mountains and Loess Plateau, the soil layer is thick and loose, and the soil particles are highly porous [35]. There are also more karst collapses, and the geological environment is complex. Groundwater sources in the Taihang Mountains and Loess Plateau include springs in mountainous areas, karst water in the hilly areas, and groundwater in plains [36]. NC is rich in hydrologic data, with thousands of groundwater wells monitoring changes in GWS (Figure 1).
Based on burial conditions, circulation characteristics, and retention time, groundwater in NC can be categorized as either shallow or deep [33]. Shallow groundwater is phreatic water, recharged by atmospheric precipitation, rivers, and lakes, whereas deep groundwater is confined water supplied by shallow groundwater and is less directly affected by climate.
In 2020, the population of NC reached 145 million (Bulletin of the Seventh National Population Census. http://www.stats.gov.cn/, accessed on 20 July 2023). In addition, the region has a high demand for industrial and agricultural water. The long-term overextraction of water resources has led to surface subsidence and groundwater depletion in NC. Groundwater funnels formed in numerous groundwater overexploitation areas in NC, causing ground subsidence that damages buildings, roads, and other facilities [37]. Overexploitation of groundwater in the coastal areas of NC also disrupted the balance between freshwater rivers and seawater in coastal aquifers, leading to inland seawater intrusion, deterioration of water quality, and soil salinization. The SNWTP may serve as an additional water resource supplement to improve regional water use structure and reduce the amount of GWE in NC [38].
2.2. GRACE/GRACE-FO Data and Calculation of TWS Changes
We used three SH files with GRACE and GRACE-FO RL06 Level-2 data from three institutions: the University of Texas Center for Space Research (CSR) (https://www2.csr.utexas.edu/grace/RL06.html, accessed on 10 October 2023); Jet Propulsion Laboratory (JPL) (https://grace.jpl.nasa.gov/data/get-data/, accessed on 12 October 2023); Geo-Forschungs Zentrum (GFZ) (http://icgem.gfz-potsdam.de/series, accessed on 12 October 2023). We selected the gravitational field model for 211 months, from April 2002 to July 2022, and truncated the SH coefficients at 60°. The mean of 2004.000 to 2009.999 solutions was then deduced from each gravity field model. The C20 and C30 coefficients showed unreasonable variations and were replaced [39,40]. Monthly geocentric estimates were used to recover the degree 1 coefficient of the gravitational field [41].
We corrected the effect of Glacial Isostatic Adjustment (GIA) using the ICE-6G_C (VM5a) model [42]. A two-step filtering process was then carried out. The first step removes the correlated noise using a Swenson decorrelation filter, and the second step reduces high-frequency noise using a 200 km Gaussian filter. We used the scale factor method to restore the TWS signal of the NC [18]. We used the sum of soil moisture storage (SMS) and snow water equivalent storage (SWES) from the GLDAS Noah model to calculate the scale factor. We calculated the water storage time series for the GLDAS model in the study area. The GLDAS model was then subjected to the same filtering process as the SH product of GRACE, and the water storage time series of the filtered GLDAS model in the study area was calculated. Finally, we determined a single scale factor between the two time series based on the least squares method [43]. Owing to the strong variability of the monthly hydrological signals in northern, southern, and northwestern NC, we considered leakage signals from outside the study area when calculating leakage [44]. There is some signal leakage from outside the study area into the study area [44].
We used three Mascon files for GRACE and GRACE-FO RL06 from the CSR [45,46] (https://www2.csr.utexas.edu/grace/RL06.html, accessed on 10 October 2023), JPL [47] (https://grace.jpl.nasa.gov/data/get-data/jpl_global_mascons/, accessed on 12 October 2023), and NASA Goddard Space Flight Center (GSFC) [48] (https://earth.gsfc.nasa.gov/geo/data/grace-mascons, accessed on 12 October 2023).
The three-cornered hat method evaluates the deviation between any three sets of sequence data (e.g., three different types of satellite gravity data) [49]. The GTCH method is an extension of the three-cornered hat method that can calculate and evaluate deviations between multiple datasets. The GTCH method can be used to evaluate the uncertainty in GRACE/GRACE-FO data [50]. The variance in the different GRACE/GRACE-FO data was obtained using the GTCH method and weighted to obtain GTCH-GRACE [29].
We calculated TWSGTCH, where TWSi is the TWS calculated with six types of GRACE/GRACE-FO data, and P is the weight [29]:
The GRACE satellite mission ended in October 2017 with a gap of several months between the GRACE and GRACE-FO missions. Therefore, an 11-month gap is present in the products provided by CSR and other institutions and is filled by a dataset of reconstructed terrestrial water storage in China based on precipitation [51] (https://data.tpdc.ac.cn/zh-hans/data/71cf70ec-0858-499d-b7f2-63319e1087fc/, accessed on 5 October 2023). The dataset is driven by the day-by-day gridded real-time analysis data of precipitation and temperature data in China. By building a precipitation reconstruction model and considering the seasonal and trend terms of the Mascon product, we obtain a dataset of terrestrial storage changes based on the reconstruction of regional precipitation in China, which is consistent with the GRACE Mascon form [51,52]. The data for CSR_TWSA_REC and JPL_TWSA_REC are available in the reconstructed dataset. In the specific calculation, the mean of these two data points was calculated as the change in TWS during the data gap, denoted as TWSREC.
2.3. Hydrological Data and Estimation of GWS Changes from GRACE/GRACE-FO
The TWS for a given area consists of SMS, SWES, GWS, and reservoir water storage (RWS) [29,53]. TWS can be calculated from the GRACE/GRACE-FO satellite gravitational field models, and SMS, SWES, and RWS can be estimated from the hydrological models. To obtain the EWH of non-groundwater in NC, we superimposed the soil moisture and snow water equivalent from GLDAS Noah model (https://ldas.gsfc.nasa.gov/gldas, accessed on 1 February 2024) and the RWS from the Annual Report on Water Conditions of the Ministry of Water Resources of the People’s Republic of China [54] (http://www.mwr.gov.cn/, accessed on 1 February 2024). GLDAS data were collected monthly from April 2002 to July 2022 at a spatial resolution of 0.25° × 0.25°. The GWS can be calculated as follows:
ΔGWS is the difference between next month’s GWS and this month’s GWS, or next year’s GWS and this year’s GWS, and is the differential form of GWS. ΔSMS, ΔSWES, and ΔRWS below are also differential forms of SMS, SWES, and RWS.
Precipitation is an important indicator for studying GWS in NC and was derived from the data products of the Global Precipitation Measurement (GPM) mission [55]. We used GPM IMERG final precipitation V06 data with a 0.1° × 0.1° spatial resolution and one-month temporal resolution, spanning from April 2002 to September 2021 (https://disc.gsfc.nasa.gov/, accessed on 6 November 2023). We also used the GPM IMERG final precipitation V06 data with a 0.1° × 0.1° spatial resolution and one-day temporal resolution, spanning from October 2021 to October 2022 (https://disc.gsfc.nasa.gov/, accessed on 10 November 2023). Between October 2021 and 2022, only daily precipitation was released without monthly precipitation. Therefore, we accumulated the daily precipitation to obtain the monthly precipitation.
2.4. The South-to-North Water Transfer Project and Groundwater Extraction Data
The middle route of the SNWTP is a major strategic infrastructure and ecological restoration project aimed at alleviating the severe shortage of water resources in NC Plains, optimizing the allocation of water resources, and improving the regional water ecology and water environment. The SNWTP connects the NC Plain to the Han River Basin [56] by transferring water from the Danjiangkou Reservoir in the middle and upper reaches of the Han River and by excavating a trunk canal in Henan Province on the east bank of the Danjiangkou Reservoir, which terminates in Beijing. The SNWTP was officially opened on 12 December 2014, with a total area of 155,000 square kilometers within the scope of water supply and a total length of 1277 km of trunk canals. The SNWTP focuses on solving the problem of water resource shortages along the route, providing water for production and living as well as industrial and agricultural in a dozen large and medium-sized cities along the route [38,57,58]. The SNWTP effectively promotes the restoration and protection of the water environment in the strategic areas of national construction, such as the integration of Beijing, Tianjin, and Hebei, and has significant social, economic, and ecological benefits.
From the above analysis, the SNWTP will have an impact on the GWS in NC. In order to combine water demand and GWS changes, in addition to the above GRACE/GRACE-FO estimation of TWS to calculate GWS, another type of dynamic water storage change is used to estimate ΔGWS, denoted as PESP-ΔGWS. The groundwater is replenished by precipitation (PRCP), consumed by evapotranspiration (ET), and subtracted from the amount of surface water change to arrive at the amount of groundwater recharge, which is then subtracted from the annual groundwater extraction (GWE) volume. We collected the Beijing Water Resources Bulletin (https://swj.beijing.gov.cn/, accessed on 1 February 2024), Tianjin Water Resources Bulletin (https://swj.tj.gov.cn/, accessed on 1 February 2024), the Hebei Water Resources Bulletin (http://slt.hebei.gov.cn/, accessed on 1 February 2024), and the Shanxi Water Resources Bulletin (https://slt.shanxi.gov.cn/, accessed on 1 February 2024). The annual water use data and water use types can be found in the provincial water resources bulletins. The amount of groundwater change (PESP-ΔGWS) can be obtained by subtracting the annual groundwater withdrawals from the GWE volumes and SNWTP withdrawals in each province. Because the groundwater pumping reports used in this study are annual, they were normalized on an annual scale. The ET data are from GLDAS (https://ldas.gsfc.nasa.gov/gldas, accessed on 1 February 2024). PESP-ΔGWS calculations are as follows:
2.5. Groundwater Sustainability Index
Sustainability is an important indicator of water security. Regional groundwater sustainability can be analyzed using the proposed SI [59]. In NC, groundwater is overexploited, and the sustainability of groundwater resources is poor [60]. The SI is calculated as follows:
SIGWS, RELGWS, RESGWS, and VULGWS represent groundwater sustainability index, reliability, recovery, and vulnerability, respectively. RELGWS is the number of times when month-to-month ΔGWS is greater than zero divided by the total number of times. RESGWS is the number of times month-to-month ΔGWS greater than zero changes to less than zero divided by the number of times month-to-month ΔGWS is less than zero. VULGWS is the number of times in which month-to-month ΔGWS is less than zero divided by the total number of times. The indices represent the levels of sustainability as listed in Table 1.

Table 1.
Level of sustainability represented by the index.
2.6. In Situ Groundwater-Level Data
The in situ groundwater-level data from the monitoring well can effectively reveal changes in GWS [61,62]; therefore, we used in situ groundwater-level observations to calculate changes in GWS using a specific yield [29]. The monthly in situ groundwater-level changes in thousands of monitoring wells across NC were collected from 2005 to 2021 and recorded in the China Geological Environmental Monitoring Groundwater Level Yearbook (https://www.ngac.cn/, accessed on 10 December 2023). The specific yield of the in situ groundwater-level data was calibrated according to the specific yield distribution map of NC [63], geological maps of Shanxi, Hebei, Beijing, and Tianjin [64] (http://www.ngac.org.cn/Map/List, accessed on 10 October 2023), and the geological conditions of NC [65,66]. We used specific yields and storage coefficients ranging from 0.02 to 0.29 and 0.0004 to 0.0045 to estimate changes in water storage caused by changes in shallow- and deep-groundwater levels [29,67,68]. We calculated the GWS changes in NC from 2005 to 2021 using in situ groundwater-level data. The GWS derived by in situ groundwater-level data were used to compare and validate the GWS derived from GRACE/GRACE-FO and GLDAS.
The detailed calculation process is shown in Figure 2.
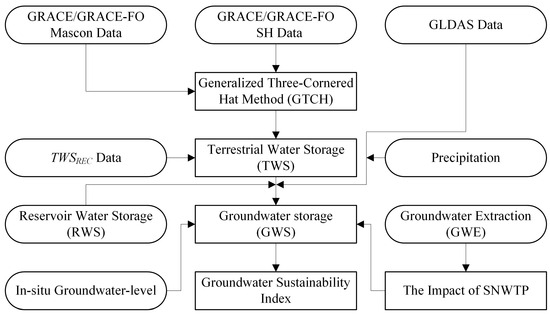
Figure 2.
Schematic of inversing GWS using the GRACE/GRACE-FO gravity satellites, GLDAS hydrological model, in situ groundwater-level, and GWE data.
3. Results
3.1. Time Series Characteristics of TWS and GWS in NC
The TWS inverted by the different GRACE/GRACE-FO products exhibited similar phases and variation trends. The TWS in NC showed cyclical changes (Figure 3a), reaching a maximum in September and a minimum around June each year. The differences between the six TWS were mainly in their amplitudes. The amplitudes of the TWS time series data derived from the Mascon data were lower than those derived from the SH data (Figure 3a). This lower amplitude may be because the SH products were corrected for leakage errors using the scale factor method. However, compared with the TWS time series derived from the GRACE-FO products, the differences between the time series of TWS derived from the six GRACE products were relatively small (Figure 3a). The uncertainty in the six GRACE/GRACE-FO products was determined using the GTCH algorithm. We used this uncertainty to weigh each of the GRACE/GRACE-FO products and obtained TWSGTCH by the weighted sum of the six products (Table 2). Time series data for various water storage systems are shown in Figure 3b–d. Different types of water storage systems exhibit periodic changes throughout the year. Using the 13-point window smoothing method allows for a relatively accurate determination of interannual variability trends. Changes in TWS calculated using the GTCH method (TWSGTCH) and changes in water storage calculated using GLDAS data showed the same trends, that is, increasing in 2003, 2016, and 2021 and decreasing or showing no change in the other years (Figure 3). The rate of decrease in TWS from April 2002 to July 2022 reached approximately −1.40 ± 0.14 cm/a. The increase in RWS was attributed to an increase in the number of reservoirs and precipitation, as well as the supply of water from the SNWTP. (Figure 3c). The variation in GWS was then estimated and is shown in Figure 3d. After subtracting the water storage signals calculated by GLDAS and RWS from TWSGTCH, the trend in GWS was similar to that revealed by TWSGTCH but with a relatively small amplitude. The estimated GWS showed a long-term decrease, indicating that NC experienced a prolonged period of water scarcity and that water consumption exceeds recharge. Since 2021, GWS increased, primarily owing to unusually high rainfall in NC.
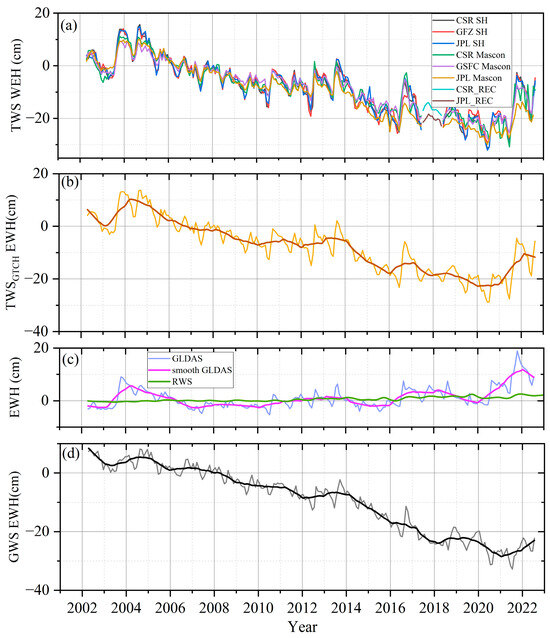
Figure 3.
(a) Time series of TWS in NC from April 2002 to July 2022. (b) Variation in TWS, calculated using the GTCH method (TWSGTCH). (c) Changes in SM and SWES, estimated by hydrological models from GLDAS, RWS estimated from reservoir data. (d) GWS changes. The original time series is shown by thin lines, and the thirteen-point smoothed time series is represented by thick lines.

Table 2.
Uncertainty and relative weighting of the six GRACE/GRACE-FO products.
3.2. GWS Time Series Variation in NC
Figure 4a shows the time series of changes in GWS across NC from April 2002 to July 2022, expressed in EWH. We removed annual and semiannual cyclical effects using 13-point smoothing and obtained the linear variation in GWS using least-squares fitting to refine the time series trend (Figure 4a). We estimated and integrated the uncertainties of the six products, as shown in Figure 4a. The maximum difference between TWSGTCH and the six GRACE products is defined as uncertainty [29].
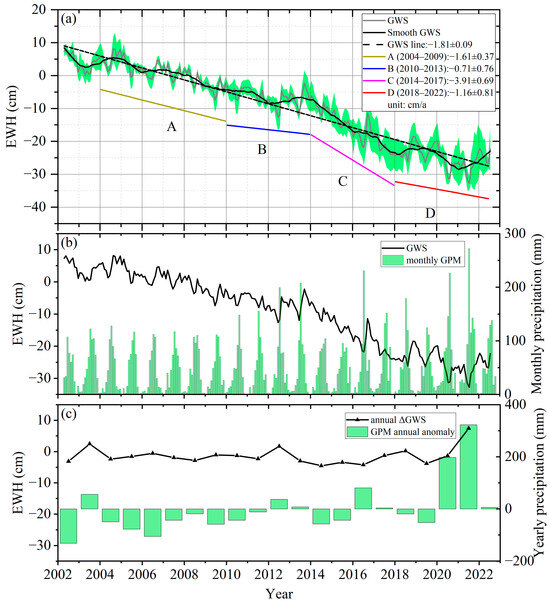
Figure 4.
(a) Time series of GWS in NC from April 2002 to July 2022. Gray polyline represents the EWH of GWS, black curve represents smoothing results, and light green shading represents uncertainty in GWS. (b) Monthly GWS (black line) from April 2002 to July 2022 and precipitation data (green bars) from April 2002 to October 2022 in NC. (c) Annual ΔGWS (black line) from April 2002 to July 2022 and annual precipitation anomalies (green bars) from April 2002 to October 2022 in NC.
As shown in Figure 4a, GWS fluctuated considerably from April 2002 to July 2022 and continued to decline after 2004. The rate of decrease in GWS from April 2002 to July 2022 reached approximately −1.81 ± 0.09 cm/a, which is equivalent to 67.35 ± 3.36 km3/a throughout the study area. According to the GWS change rate, the groundwater loss in NC over 21 years was approximately 141.33 billion tons. The mean annual precipitation is the mean of all annual precipitations over the study period, and the mean annual precipitation anomaly is the annual precipitation minus the mean annual precipitation, which demonstrates the relative change in precipitation from year to year. By comparing the monthly precipitation data and monthly GWS (Figure 4b), the annual mean precipitation anomaly, and annual ΔGWS (Figure 4c) in NC, we found that concentrated rainfall during the year could effectively supplement the GWS values of the corresponding month [27]. Every year, annual ΔGWS values significantly increased in months with high rainfall.
The monthly ΔGWS is the difference between next month’s GWS and this month’s GWS; we performed Pearson correlation analyses of monthly ΔGWS and rainfall for the entire study period, pre-SNWTP (2002–2013) and post-SNWTP (2014–2022) (Table 3). The monthly ΔGWS was moderately correlated with rainfall (r between 0.3 and 0.5). Importantly, the significance (p-value) of monthly ΔGWS versus rainfall was <0.01 throughout the study period and before the completion of the SNWTP, indicating a highly significant correlation between monthly ΔGWS and rainfall. After the completion of the SNWTP, the significance of monthly ΔGWS versus rainfall was 0.07, and the decrease in significance suggests other factors affecting monthly ΔGWS. The correlation between monthly ΔGWS and rainfall is greater before SNWTP than after, possibly owing to the introduction of new impact factors on top of the original impact factors, which are supplemented by SNWTP [28,30].

Table 3.
Pearson’s correlation coefficient between monthly ΔGWS and rainfall in different periods.
Based on the variation characteristics of precipitation (Figure 4b) and GWS (Figure 4a), the patterns in GWS variation from 2002 to 2022 in NC can be divided into the following four phases (Figure 4a): (1) 2004–2009; (2) 2010–2013; (3) 2014–2017; and (4) 2018–2022, where we identified the following patterns:
- (1)
- In 2004, the annual mean precipitation anomaly in NC reached 55.83 mm (Figure 4c) and correlated with an increase in GWS (Figure 4a). The annual average precipitation anomaly and annual ΔGWS were negative from 2004 to 2009 (Figure 4c), coinciding with a decrease in GWS (line segment A in Figure 4a). The depletion rate obtained by fitting the GWS with a straight line was approximately −1.61 ± 0.37 cm/a from 2004 to 2009.
- (2)
- From 2010 to 2013, the precipitation anomaly increased, changing from negative to positive (Figure 4c); in 2012, the annual ΔGWS was positive and correlating with a reduced decrease rate in GWS (line B in Figure 4a), namely, −0.71 ± 0.76 cm/a, suggesting that rainfall can partially compensate for the loss of GWS due to groundwater overexploitation, especially in 2012.
- (3)
- During 2014–2017, GWS decreased sharply at a rate of −3.91 ± 0.69 cm/a, despite the precipitation anomaly reaching its maximum in 2016. The annual ΔGWS is negative (Figure 4c). This decrease in GWS may be attributed to overexploitation, which led to an imbalance between rainfall recharge and groundwater depletion; therefore, groundwater could not be sufficiently replenished [20,23]. During this period, NC was in drought, with decreased rainfall and increased evaporation [68]. Owing to the overexploitation of groundwater, the water layer in the zone of aeration thickened, which prolonged the GWS recharge cycle and reduced recharge [23]. During 2014–2017, the rate of GWS decline accelerated (line segment C in Figure 4a). However, GWS in Beijing and Tianjin recovered slightly because of the SNWTP in 2014.
- (4)
- During 2018–2022, the GWS decreased at a rate of −1.16 ± 0.81 cm/a. The change in GWS derived from GRACE-FO data (line segment D in Figure 4a) is similar to the changes estimated using GRACE data in 2014–2017. Although a small overall decrease was present in GWS from 2018 to 2022, the annual ΔGWS during this period showed an initial deficit followed by a surplus. This trend was due to a sharp increase in rainfall in 2020 and 2021, indicating that rainfall can effectively replenish GWS (Figure 4b,c). In addition, the SNWTP may replenish groundwater in NC [28,30].
Figure 5 shows a count chart of the monthly mean GWS from April 2002 to July 2022 and rainfall from April 2002 to October 2022, which can be used to analyze the extraction and replenishment of GWS over a year. The monthly mean GWS decreased from January to June, increased from July to September, and decreased from September to December, consistent with the rainfall patterns. The mean monthly rainfall initially increased and then decreased. From June to September, the monthly rainfall exceeded 50 mm. From January to June and October to December, precipitation was scarce, and the monthly mean GWS variation decreased, which is in agreement with lower precipitation. The response of GWS changes to precipitation changes lags by two to three months [27]. Precipitation is abundant from July to September and can replenish groundwater.
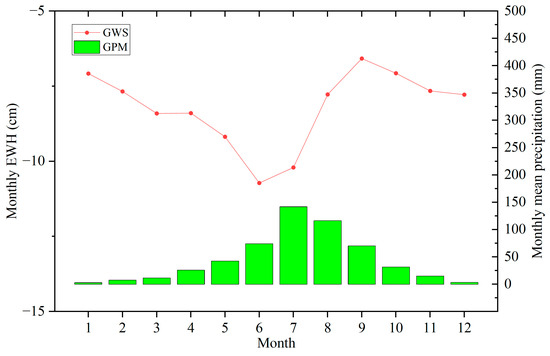
Figure 5.
The monthly mean of GWS and GPM in NC from 2002 to 2022.
3.3. Spatial Interannual Variation in GWS in NC
Figure 6 shows that the interannual spatial variation of GWS in NC exhibits clear variation across different periods, consistent with the time series GWS variation (Figure 4a). We averaged the 12-month GWS for each year to obtain the GWS for the corresponding year. We used the bicubic interpolation method for the spatial resampling. From 2002 to 2003, the change in GWS decreased (Figure 6a,b), which might have been due to insufficient precipitation (Figure 4c). From 2003 to 2004, the change in GWS increased (Figure 6b,c), which might have been due to sufficient precipitation (Figure 4c). Because sufficient precipitation can supplement GWS to a certain extent, the groundwater level does not significantly decrease as a result of GWE or agricultural irrigation. From 2004 to 2009, the changes in GWS gradually decreased (Figure 6c,h), which might be because precipitation in 2004–2009 was much lower than precipitation in 2003 (Figure 4c). The lack of precipitation, combined with factors such as heavy GWE and agricultural irrigation, led to a significant decrease in GWS. During 2004–2009, minimal spatial variation was present in GWS across the study area. The overall change in GWS also exhibited a relatively stable pattern from 2010 to 2013 (Figure 6i,l), which might have been due to the gradual increase in precipitation (Figure 4c) that mitigated the effect of groundwater withdrawal on GWS.
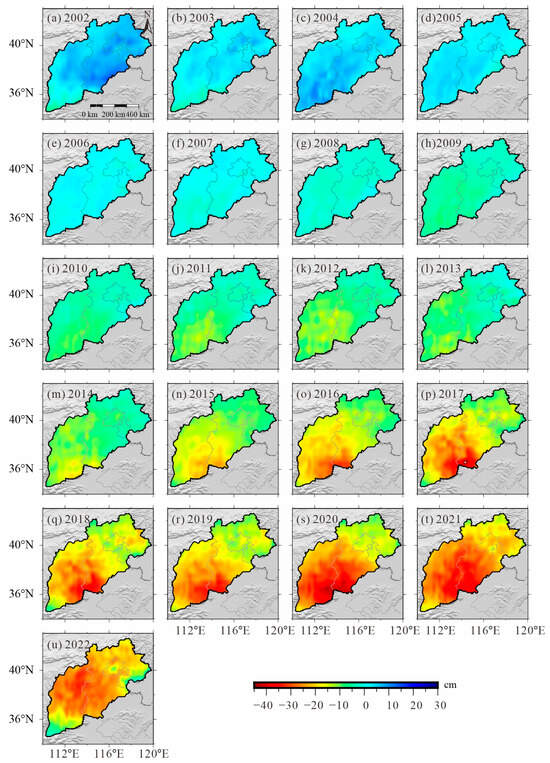
Figure 6.
Spatial distribution of annual GWS variations in NC estimated from GRACE/GRACE-FO from 2002 to 2022.
During 2014–2017, the GWS changes in NC showed a sharp decrease, mainly concentrated in Shanxi and southern Hebei (Figure 6m–p). The GWS deficit was more severe in 2014–2017 than in 2004–2009 (Figure 6c–h). Owing to the successful implementation of the SNWTP, the Action Plan for Comprehensive Control of Groundwater Overexploitation in NC [37,69], and the increase in precipitation, GWS showed an overall increase from 2018 to 2022 (Figure 6q–u). However, GWS remains in severely short supply throughout NC owing to the long-term overexploitation of groundwater. The decline in GWS shifted from Shanxi and southern Hebei to other parts of NC.
4. Discussion
4.1. Comparison with In Situ Groundwater-Level Data from Monitoring Well
The GWS estimated using in situ groundwater-level data is defined as in situ GWS. Remote sensing methods (GRACE/GRACE-FO data) can be used to invert GWS changes and compare the results with those of in situ groundwater-level inversions.
There are two types of groundwater wells: shallow and deep. The variations and trends of the shallow and deep groundwater levels in NC are shown in Figure 7a. A larger change was present in the deep groundwater level (−0.61 ± 0.04 m/a) compared with that in the shallow water level (−0.21 ± 0.02 m/a). Note that the unit for this in situ groundwater level is m/a. With sufficient precipitation, the pumped shallow groundwater is quickly replenished, whereas adequate replenishment of overexploited deep groundwater is difficult.
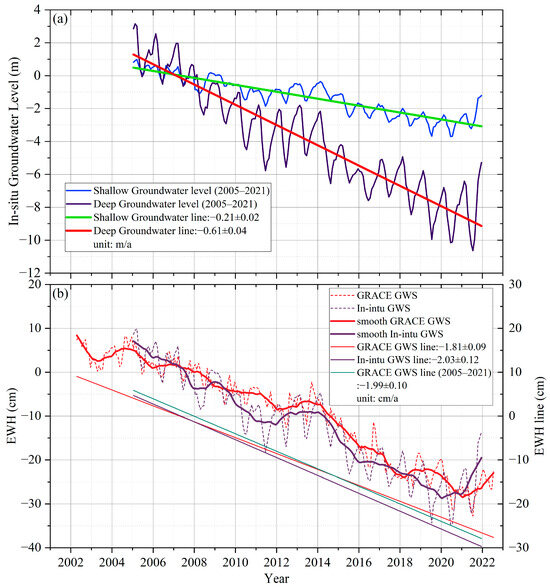
Figure 7.
(a) Variation in shallow and deep groundwater levels in NC from 2005 to 2021. (b) Comparison of GWS changes inverted from GRACE/GRACE-FO with the results calculated from in situ groundwater-level data.
Water supplies from different groundwater wells were calibrated to calculate GWS. Water storage can be obtained by multiplying different groundwater wells by a specific yield [28]. We used specific yields and storage coefficients ranging from 0.02 to 0.29 and 0.0004 to 0.0045 to estimate changes in water storage caused by changes in shallow and deep groundwater levels [29,67,68]. Figure 7b shows a comparison of the GWS inverted from the GRACE/GRACE-FO data and the GWS inferred from the in situ groundwater-level data. From April 2002 to July 2022, the GWS trend from the GRACE/GRACE-FO was −1.81 ± 0.09 cm/a. From 2005 to 2021, the GWS trend revealed by GRACE/GRACE-FO was −1.99 ± 0.10 cm/a. From 2005 to 2021, the GWS trend retrieved from the in situ groundwater-level data was −2.03 ± 0.12 cm/a. These two results are consistent with the long-term trends, and their correlation is very strong.
To more clearly compare the differences between the GWS estimated from in situ groundwater-level and GRACE/GRACE-FO data, we constructed additional scatter plots and fitted curves (Figure 8). We plotted GWS estimated from the in situ groundwater-level data for each month as the horizontal axis and GWS estimated from GRACE/GRACE-FO for each month as the vertical axis. Comparing the in situ GWS and the GRACE/GRACE-FO-derived GWS, we obtained a Pearson’s correlation coefficient, r, of 0.94, a p-value of <0.01, an RMSE of 4.15 cm, and a relative BIAS of 6.39%.
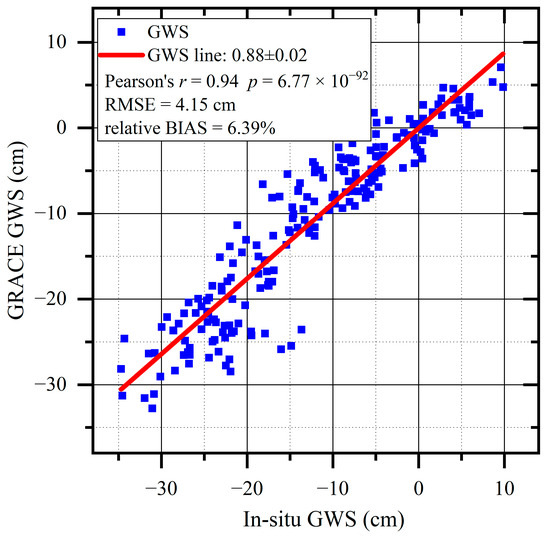
Figure 8.
Scatter plots and a best-fit line showing the correlation between GWS estimated from in situ groundwater-level and GRACE/GRACE-FO data.
These statistics indicate that the GWS estimated from the GRACE/GRACE-FO data and in situ groundwater-level data are consistent. The in situ–GRACE/GRACE-FO data’s fitted line had a slope of 0.88 ± 0.02. The GWS estimated from the GRACE/GRACE-FO data was slightly lower compared with the GWS estimated from the in situ groundwater-level data.
We also calculated the GWS for each of the six GRACE product inversions and compared them with the in situ GWS (Figure 9). Figure 9 shows the trends of all six GRACE inversions are similar to the in situ GWS, while the amplitudes of the three SH products are closer to those of the in situ GWS than to those of the Mascon products. The correlations between the GWS estimated by the six GRACE/GRACE-FO products and the in situ GWS are shown in the Table 4. Comparison of Figure 8 and Table 4 shows that the weighted GRACE GWS has the best match up with the in situ GWS. Because the correlation coefficient between the weighted GRACE GWS and the in-sit GWS is the highest, reaching 0.94, and the fitting slopes are closer to 1.
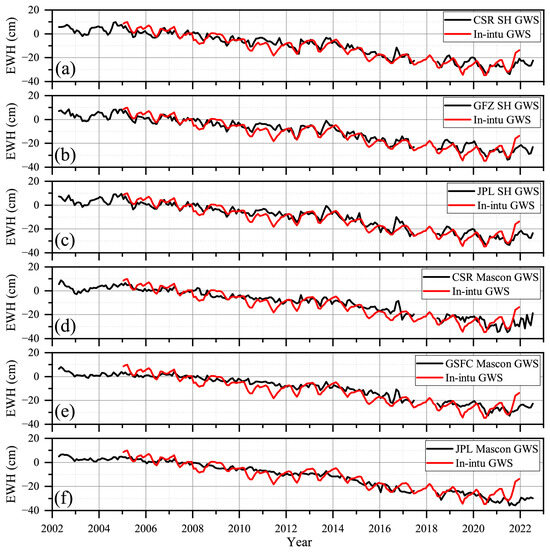
Figure 9.
Comparison of GWS estimated by the six GRACE/GRACE-FO products and in situ GWS. (a) CSR SH GWS; (b) GFZ SH GWS; (c) JPL SH GWS; (d) CSR Mascon GWS; (e) GSFC Mascon GWS; and (f) JPL Mascon GWS.

Table 4.
Comparison of trends and correlations between GWS estimated by the six GRACE/GRACE-FO products and in situ GWS.
4.2. Spatial and Temporal Variability of Groundwater Sustainability in NC
Long-term water use exceeds water replenishment in NC, causing an unsustainable groundwater state [60]. Groundwater sustainability in NC in different periods was calculated (Figure 10). During 2004–2009, groundwater in NC continued to decline (Figure 4), with a SI of 0.48, which is a mildly unsustainable state.
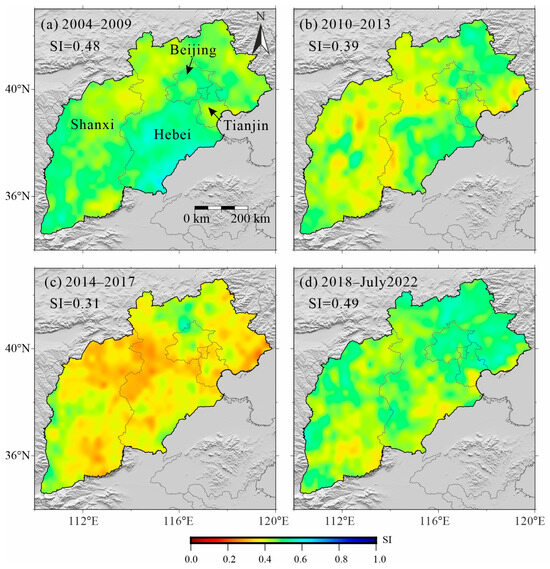
Figure 10.
Spatial distribution of groundwater sustainability in NC for (a) 2004–2009; (b) 2010–2013; (c) 2014–2017; and (d) 2018–July 2022.
During 2010–2013, GWS in NC declined (Figure 4), with an overall SI of 0.39, which is highly unsustainable, and poorer in some areas of Shanxi and Hebei Provinces. During 2014–2017, GWS decreased significantly (Figure 4) owing to reduced rainfall and drought events [59,70]. The groundwater SI is only 0.31, seriously unsustainable. In Figure 10c, the mean value of groundwater SI is below 0.4, approaching extreme unsustainability in parts of central, southern, and northeastern NC. Groundwater sustainability indicators are relatively high in areas receiving SNWTP water supply in Beijing, Tianjin, and south–central Hebei but remain in a severely unsustainable state with severe water shortages. During 2018–2022, owing to the continuous water transfers from the SNWTP, the rainfall increased, the proportion of groundwater pumping decreased, and the groundwater SI in NC was 0.49. Although it is still in a mildly unsustainable state, the groundwater sustainability in 2018–2022 significantly improved compared with that in 2014–2017. During these four stages, the groundwater SI in NC decreased and then increased, mainly due to changes in rainfall (Figure 4), drought events [71,72], and adjustments in the regional water use structure after the opening of the SNWTP, which reduces groundwater pumping [38,56].
4.3. SNWTP’s Impact on GWS and Estimation of the Overall Hydrological Cycle in NC
To alleviate the severe water shortage in NC, the SNWTP was implemented in 2014 [56]. By the end of 2021, 44.7 billion cubic meters of water had been transferred from the SNWTP, strongly guaranteeing water security along the route [38].
According to the water resources bulletin of Beijing City, Tianjin City, Hebei Province, and Shanxi Province, GWE is gradually decreasing while the overall water supply has remained almost unchanged, especially after 2014 (Figure 11). The largest decrease in GWE was observed in Hebei Province. Before the completion of the SNWTP, GWE accounted for 60–70% of the total water supply, whereas after the SNWTP, groundwater pumping declined as the percentage of the total water supply, and by 2021, groundwater pumping accounted for only 36% of the total water supply. This indicates that the SNWTP affected water use to some extent, as well as changed the water use structure in NC [56,73].
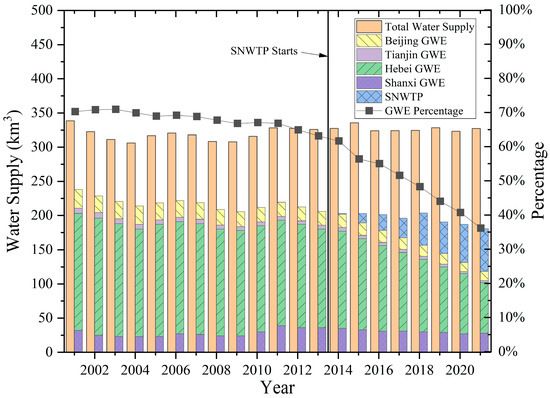
Figure 11.
Total water supply, GWE, and percentage of GWE in NC.
In the detection of GWS in NC using the GRACE/GRACE-FO satellites, different trends of GWS in NC before and after 2014 were detected [27,28,30]. The seasonal contribution of GWS increased after 2014, possibly attributed to the changes in the water supply structure influenced by the SNWTP [27]. We believe that rainfall is partly responsible for the change in GWS. Indeed, the correlation between monthly ΔGWS and rainfall worsens after the SNWTP (Table 3), which suggests that the GWS is affected by other factors, such as drought or the SNWTP changes the water use structure. The GWS recovered in some areas within NC (e.g., Beijing) after the SNWTP [28,74].
The variation of GWS is influenced by several factors, such as rainfall, evapotranspiration, runoff, and human activities. The exchange relationship between surface water, shallow groundwater, and deep groundwater is also complex. A single variable has limited influence on changes in GWS; however, reducing groundwater pumping and conserving water can undoubtedly alleviate the shortage of groundwater in NC.
To combine the water demand and GWS changes, dynamic water storage change is used to estimate year-to-year ΔGWS, denoted as PESP-ΔGWS. The PESP-ΔGWS is replenished by precipitation (PRCP), consumed by evapotranspiration (ET), and subtracted from the amount of surface water change to arrive at the amount of groundwater recharge, which is then subtracted from the annual GWE volume.
The PESP-ΔGWS is further calculated in Figure 12. Dynamic hydrologic cycle processes were calculated in NC. The PESP-ΔGWS and annual ΔGWS inverted from GRACE/GRACE-FO data were below zero in most years because GWE was greater than replenishment in most years. Groundwater in NC is in an unsustainable state. For ease of quantification, we used the area of NC in calculating the EWH. Except for the peak precipitation in 2020 and 2021, the long-term mean EWH for PESP-ΔGWS from 2002 to 2019 was −1.71 cm, equivalent to 63.63 km3, while the long-term mean EWH for annual ΔGWS was −1.81 cm, equivalent to 67.35 km3. From 2002 to 2019, the mean annual pumping EWH was 5.41 cm, equivalent to 201.31 km3, while the mean annual recharge EWH was 3.69 cm, equivalent to 137.30 km3. The implementation of the SNWTP reduced the GWS withdrawal in NC to some extent. In 2020 and 2021, the precipitation surge effectively replenishes the GWS in NC. As shown in Figure 12, without the SNWTP implementation (red dotted line), the trend of groundwater decline will be more pronounced. For example, from 2014 to 2021, without the SNWTP implementation, GWS in NC would have been cumulatively reduced by an additional 7.45 cm EWH, equivalent to approximately 27.75 km3 of water.
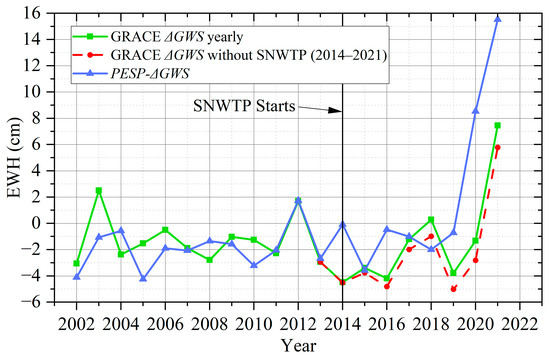
Figure 12.
Time series of PESP-ΔGWS (Blue line) and the annual ΔGWS from GRACE (green line) The SNWTP was opened in 2014; hence, the calculated annual ΔGWS from GRACE includes the impact of the SNWTP. It is assumed that without the SNWTP, the annual ΔGWS inverted from GRACE would be the red dashed line.
4.4. Comparison with Previous Results
GRACE data were used in several studies to calculate TWS and GWS changes in NC. The trends in TWS and GWS changes in NC obtained in the present study are similar to those of previous studies. However, some differences are also present in terms of the magnitude and spatial distribution of the TWS and GWS changes (Table 5). By using 211 GRACE and GRACE-FO monthly products from April 2002 to July 2022 combined with the GTCH method, the rates of GWS and TWS decline were obtained in NC as −1.81 ± 0.09 cm/a and −1.40 ± 0.14 cm/a, respectively.

Table 5.
Characteristics of GWS/TWS changes in NC revealed by previous studies.
Certain differences in the trends of TWS and GWS can be identified between these previous studies in NC. One reason for these differences might be that GRACE or GRACE-FO data from different periods were used to calculate changes in TWS and GWS. Additionally, different datasets issued by different organizations or the same type of data issued by different organizations were used to estimate the TWS and GWS variations.
The spatial coverage across NC was also different for the different studies. For example, the coverage of [18] included Hebei, Beijing, and Tianjin, excluding Shanxi. In summary, the differences in the TWS and GWS variations in NC between studies are likely attributable to variations in the data time windows, data providers, release versions, and coverage areas.
Groundwater sustainability has been studied as an important component of groundwater safety. Environmental tracers have been used to assess groundwater sustainability, which is considered to be in an unsustainable state in NC [25]. Groundwater contamination has been used to assess groundwater sustainability, which requires improvement in NC [26]. The SI is a useful indicator of regional water sustainability. We constructed a groundwater SI for NC using GWS changes, quantitatively assessed groundwater sustainability in NC, and calculated groundwater SI for different periods to demonstrate spatial variation in groundwater sustainability. Groundwater sustainability in NC ranges from mildly unsustainable in 2004–2009, severely unsustainable in 2010–2013, and 2014–2017 to mildly unsustainable in 2018–2022.
In this study, variations in TWS and GWS across NC were calculated based on RL06 Level-2 of the GRACE and GRACE-FO SH and Mascon data issued by the CSR from April 2002 to July 2022. Compared with Release 05 (RL05) Level-2, RL06 Level-2 data show improvements in the background gravitational field, third-body perturbations, solid Earth polar tidal models, and atmospheric and non-tidal models.
Although the GRACE and GRACE-FO can accurately detect trends in TWS and changes in GWS in NC and the scale factor method used in this study could correct for signal leakage errors, the method correction remained incomplete, and the recovery of regional water storage could also have been influenced by quality differences within and outside the study region. It should be noted that the GLDAS hydrologic model itself also contains errors, and removing SMS and SWES when calculating GWS may also absorb their errors. However, most in situ wells in NC indicate that the groundwater levels in this area are greater than 2 m, and the estimated range of soil water storage by GLDAS is from 0 m to 2 m below the surface; then, we approximate and consider that this range is still soil water. The amount of water generated by irrigation is reduced mainly through evapotranspiration, leaving less water in the soil and having less impact on NC. Therefore, we did not consider the impact of irrigation in this study. However, as considered more finely, irrigation is indeed an integral part of the water cycle, and we will consider the role of irrigation in future studies. In future research, GRACE-FO data and other monitoring sensors (e.g., additional continuous GNSS, Interferometric Synthetic Aperture Radar (InSAR), mobile gravity monitoring, and leveling) should be used to monitor changes in TWS and GWS in NC and improve resolution and accuracy. Finally, considering the severe groundwater depletion in NC detected using the GRACE and GRACE-FO data, further efforts should be made to reduce groundwater overexploitation in NC. Such measures could include managing aquifer recharge, improving water use efficiency, reducing water consumption, inter-basin water diversion, drip or sprinkler irrigation, and reintroducing fallow periods [67,75,76].
5. Conclusions
In this study, we used long-term GRACE and GRACE-FO data (from April 2002 to July 2022) in conjunction with hydrological models, measured precipitation, in situ groundwater-level, and GWE data to study the long-term and current temporal and spatial variation characteristics of hydrological changes in NC.
- (1)
- The results of GRACE and GRACE-FO showed that NC is an important region in China with continuous reductions in both TWS and GWS. The GTCH method can effectively integrate the six GRACE/GRACE-FO products. The time series TWS data showed a large variation in amplitude across the period 2002–2022, and the rate of decrease in TWS was approximately −1.40 ± 0.14 cm/a. GWS decreased from 2002 to 2022, with an average decrease rate of approximately −1.81 ± 0.09 cm/a.
- (2)
- We found significant differences in the variation in GWS for different periods in NC. GWS decreased from −1.61 ± 0.37 cm/a in 2004–2009, −0.71 ± 0.76 cm/a in 2010–2013, −3.91 ± 0.69 cm/a in 2014–2017, and −1.16 ± 0.81 cm/a in 2018–2022. A slight increase in GWS was present in 2021 and 2022, as a result mainly of a remarkable increase in precipitation. Groundwater sustainability in NC ranged from mildly unsustainable in 2004–2009 and severely unsustainable in 2010–2013 and 2014–2017 to mildly unsustainable in 2018–2022.
- (3)
- We showed good agreement between the GWS inverted by the GRACE/GRACE-FO data (−1.99 ± 0.10 cm/a) and the GWS changes revealed using the in situ groundwater level (−2.03 ± 0.12 cm/a) for 2005–2021. A larger change was present in the deep groundwater level (−0.61 ± 0.04 m/a) compared with that in the shallow groundwater level (−0.21 ± 0.02 m/a), indicating that deep groundwater extraction is serious in NC.
- (4)
- Following SNWTP implementation, the correlation between rainfall and GWS became weaker, probably because drought or the SNWTP changed the water supply structure. More important, we found that the mean annual groundwater recharges was 137.30 km3, while the annual pumping was 201.31 km3 from 2002 to 2019. Groundwater replenishment is less than pumping, which explains the decline in GWS. By 2021, the SNWTP replenished a cumulative approximately 27.75 km3 of groundwater.
This study showed that the GRACE and GRACE-FO satellites effectively detect variations in hydrological signals in NC. Although uncertainties persist, the inversion results can effectively reveal the temporal and spatial changes in both TWS and GWS on a large scale, the spatiotemporal evolution characteristics of groundwater sustainability, as well as the quantitative effects of the SNWTP, which are significant for managing groundwater resources in NC.
Author Contributions
W.Q., conceptualization, methodology, funding acquisition, writing—original draft, writing—reviewing and editing. P.Z. and P.C., software, writing—reviewing and editing. J.L. and Y.G., formal analysis, writing—reviewing and editing. All authors have read and agreed to the published version of the manuscript.
Funding
This research was funded by the National Natural Science Foundation of China, grant numbers 42174006 and 42090055; the Science Fund for Distinguished Young Scholars of Shaanxi Province, grant number 2022JC-18; the Fundamental Research Funds for the Central Universities, CHD, grant number 300102263201.
Data Availability Statement
GRACE and GRACE-FO data used in this study are publicly available from https://www2.csr.utexas.edu/ (accessed on 10 October 2023), https://grace.jpl.nasa.gov/data (accessed on 12 October 2023), https://earth.gsfc.nasa.gov/ (accessed on 12 October 2023) and http://icgem.gfz-potsdam.de/series (accessed on 12 October 2023). Dataset of recon-structed terrestrial water storage in China based on precipitation (2002–2019) is from https://data.tpdc.ac.cn/zh-hans/data/71cf70ec-0858-499d-b7f2-63319e1087fc/ (accessed on 5 October 2023). The GLDAS model is from https://ldas.gsfc.nasa.gov/gldas (accessed on 1 February 2024). The RWS in the Annual Report on Water Conditions of the Ministry of Water Resources of the People’s Republic of China is from http://www.mwr.gov.cn/ (accessed on 1 February 2024). GPM IMERG final precipitation data are from https://disc.gsfc.nasa.gov/ (accessed on 10 November 2023). The monthly in situ groundwater levels in thousands of groundwater wells accessed NC were collected from 2005 to 2021 and recorded in the China Geological Environmental Monitoring Groundwater Level Yearbook from https://www.ngac.cn (accessed on 10 December 2023). Geological maps of Shanxi, Hebei, Beijing, and Tianjin are from http://www.ngac.org.cn/Map/List (accessed on 10 October 2023).
Acknowledgments
Some figures were prepared using the public domain Generic Mapping Tools GMT 6.2. [77]. We also express our thanks to the two anonymous reviewers and academic editors for their constructive comments and suggestions that improved the manuscript.
Conflicts of Interest
The authors declare no conflicts of interest.
References
- Zhong, M.; Duan, J.; Xu, H.; Peng, P.; Yan, H.; Zhu, Y. Trend of China land water storage redistribution at medi-and large-spatial scales in recent five years by satellite gravity observations. Chin. Sci. Bull. 2009, 54, 816–821. [Google Scholar] [CrossRef]
- Feng, W.; Shum, C.; Zhong, M.; Pan, Y. Groundwater storage changes in China from satellite gravity: An overview. Remote Sens. 2018, 10, 674. [Google Scholar] [CrossRef]
- Qu, W.; Jin, Z.; Zhang, Q.; Gao, Y.; Zhang, P.; Chen, P. Estimation of Evapotranspiration in the Yellow River Basin from 2002 to 2020 Based on GRACE and GRACE Follow-On Observations. Remote Sens. 2022, 14, 730. [Google Scholar] [CrossRef]
- Wang, D.; Zhao, B.; Li, Y.; Yu, J.; Chen, Y.; Zhou, X. Determination of tectonic and nontectonic vertical motion rates of the North China Craton using dense GPS and GRACE data. J. Asian Earth Sci. 2022, 236, 105314. [Google Scholar] [CrossRef]
- Shen, Y.; Zheng, W.; Zhu, H.; Yin, W.; Xu, A.; Pan, F.; Wang, Q.; Zhao, Y. Inverted Algorithm of Groundwater Storage Anomalies by Combining the GNSS, GRACE/GRACE-FO, and GLDAS: A Case Study in the North China Plain. Remote Sens. 2022, 14, 5683. [Google Scholar] [CrossRef]
- Pang, Y.; Zhang, H.; Cheng, H.; Shi, Y.; Fang, C.; Luan, X.; Chen, S.; Li, Y.; Hao, M. The modulation of groundwater exploitation on crustal stress in the North China Plain, and its implications on seismicity. J. Asian Earth Sci. 2020, 189, 104141. [Google Scholar] [CrossRef]
- Yu, W.; Gong, H.; Chen, B.; Zhou, C.; Zhang, Q. Combined GRACE and MT-InSAR to assess the relationship between groundwater storage change and land subsidence in the Beijing-Tianjin-Hebei Region. Remote Sens. 2021, 13, 3773. [Google Scholar] [CrossRef]
- Schmidt, R.; Petrovic, S.; Güntner, A.; Barthelmes, F.; Wünsch, J.; Kusche, J. Periodic components of water storage changes from GRACE and global hydrology models. J. Geophys. Res. Solid Earth 2008, 113, 1–14. [Google Scholar] [CrossRef]
- Wang, H.; Jia, L.; Steffen, H.; Wu, P.; Jiang, L.; Hsu, H.; Xiang, L.; Wang, Z.; Hu, B. Increased water storage in North America and Scandinavia from GRACE gravity data. Nat. Geosci. 2013, 6, 38–42. [Google Scholar] [CrossRef]
- Rodell, M.; Reager, J.T. Water cycle science enabled by the GRACE and GRACE-FO satellite missions. Nat. Water 2023, 1, 47–59. [Google Scholar] [CrossRef]
- Su, X.; Ping, J.; Ye, Q. Terrestrial water variations in the North China Plain revealed by the GRACE mission. Sci. China Earth Sci. 2011, 54, 1965–1970. [Google Scholar] [CrossRef]
- Moiwo, J.P.; Tao, F.; Lu, W. Analysis of satellite-based and in situ hydro-climatic data depicts water storage depletion in North China Region. Hydrol. Process. 2013, 27, 1011–1020. [Google Scholar] [CrossRef]
- Feng, W.; Zhong, M.; Lemoine, J.M.; Biancale, R.; Hsu, H.T.; Xia, J. Evaluation of groundwater depletion in North China using the Gravity Recovery and Climate Experiment (GRACE) data and ground-based measurements. Water Resour. Res. 2013, 49, 2110–2118. [Google Scholar] [CrossRef]
- Wang, F.; Wang, Z.; Yang, H.; Di, D.; Zhao, Y.; Liang, Q. Utilizing GRACE-based groundwater drought index for drought characterization and teleconnection factors analysis in the North China Plain. J. Hydrol. 2020, 585, 124849. [Google Scholar] [CrossRef]
- Huang, Z.; Pan, Y.; Gong, H.; Yeh, P.J.F.; Li, X.; Zhou, D.; Zhao, W. Subregional-scale groundwater depletion detected by GRACE for both shallow and deep aquifers in North China Plain. Geophys. Res. Lett. 2015, 42, 1791–1799. [Google Scholar] [CrossRef]
- Tang, Q.; Zhang, X.; Tang, Y. Anthropogenic impacts on mass change in North China. Geophys. Res. Lett. 2013, 40, 3924–3928. [Google Scholar] [CrossRef]
- Li, L.; Chen, L.; Wang, L. A research on terrestrial water storage variations with grace satellite data in the Jing-Jin-Ji region. In Proceedings of the 2016 IEEE International Geoscience and Remote Sensing Symposium (IGARSS), Beijing, China, 10–15 July 2016; pp. 6225–6228. [Google Scholar]
- Feng, W.; Wang, C.-Q.; Mu, D.-P.; Zhong, M.; Zhong, Y.-L.; Xu, H.-Z. Groundwater storage variations in the North China Plain from GRACE with spatial constraints. Chin. J. Geophys. 2017, 60, 1630–1642. [Google Scholar] [CrossRef]
- Yin, W.; Han, S.-C.; Zheng, W.; Yeo, I.-Y.; Hu, L.; Tangdamrongsub, N.; Ghobadi-Far, K. Improved water storage estimates within the North China Plain by assimilating GRACE data into the CABLE model. J. Hydrol. 2020, 590, 125348. [Google Scholar] [CrossRef]
- Zhao, Q.; Zhang, B.; Yao, Y.; Wu, W.; Meng, G.; Chen, Q. Geodetic and hydrological measurements reveal the recent acceleration of groundwater depletion in North China Plain. J. Hydrol. 2019, 575, 1065–1072. [Google Scholar] [CrossRef]
- Ebead, B.M.; Ahmed, M.E.; Niu, Z.; Huang, N. Quantifying the anthropogenic impact on groundwater resources of North China using Gravity Recovery and Climate Experiment data and land surface models. J. Appl. Remote Sens. 2017, 11, 026029. [Google Scholar] [CrossRef]
- Zhu, B.; Xie, X.; Zhang, K. Water storage and vegetation changes in response to the 2009/10 drought over North China. Hydrol. Res. 2018, 49, 1618–1635. [Google Scholar] [CrossRef]
- Li, Z.; Zhang, C.; Ke, B.; Liu, Y.; Li, W.; Yin, C. North China Plain water storage variation analysis based on GRACE and seasonal influence considering. Acta Geod. Geophys. Sin. 2018, 47, 940. [Google Scholar]
- Huang, Q.; Zhang, Q.; Xu, C.-Y.; Li, Q.; Sun, P. Terrestrial Water Storage in China: Spatiotemporal Pattern and Driving Factors. Sustainability 2019, 11, 6646. [Google Scholar] [CrossRef]
- Huang, T.; Pang, Z. Groundwater Recharge and Dynamics in Northern China: Implications for Sustainable Utilization of Groundwater. Procedia Earth Planet. Sci. 2013, 7, 369–372. [Google Scholar] [CrossRef][Green Version]
- Wu, M.; Wu, J.; Liu, J.; Wu, J.; Zheng, C. Effect of groundwater quality on sustainability of groundwater resource: A case study in the North China Plain. J. Contam. Hydrol. 2015, 179, 132–147. [Google Scholar] [CrossRef] [PubMed]
- Xu, Y.; Gong, H.; Chen, B.; Zhang, Q.; Li, Z. Long-term and seasonal variation in groundwater storage in the North China Plain based on GRACE. Int. J. Appl. Earth Obs. Geoinf. 2021, 104, 102560. [Google Scholar] [CrossRef]
- Zhang, C.; Duan, Q.; Yeh, P.J.-F.; Pan, Y.; Gong, H.; Moradkhani, H.; Gong, W.; Lei, X.; Liao, W.; Xu, L. Sub-regional groundwater storage recovery in North China Plain after the South-to-North water diversion project. J. Hydrol. 2021, 597, 126156. [Google Scholar] [CrossRef]
- Liu, R.; Zhong, B.; Li, X.; Zheng, K.; Liang, H.; Cao, J.; Yan, X.; Lyu, H. Analysis of groundwater changes (2003–2020) in the North China Plain using geodetic measurements. J. Hydrol. Reg. Stud. 2022, 41, 101085. [Google Scholar] [CrossRef]
- Xiong, J.; Yin, J.; Guo, S.; Yin, W.; Rao, W.; Chao, N. Using GRACE to detect groundwater variation in North China Plain after south-north water diversion. Groundwater 2022, 610, 127799. [Google Scholar] [CrossRef]
- He, J.; Ju, J.; Wen, Z.; Lü, J.; Jin, Q. A review of recent advances in research on Asian monsoon in China. Adv. Atmos. Sci. 2007, 24, 972–992. [Google Scholar] [CrossRef]
- Wang, B.; Wu, Z.; Chang, C.-P.; Liu, J.; Li, J.; Zhou, T. Another look at interannual-to-interdecadal variations of the East Asian winter monsoon: The northern and southern temperature modes. J. Clim. 2010, 23, 1495–1512. [Google Scholar] [CrossRef]
- Yang, H.; Cao, W.; Zhi, C.; Li, Z.; Bao, X.; Ren, Y.; Liu, F.; Fan, C.; Wang, S.; Yabin, W. Evolution of groundwater level in the North China Plain in the past 40 years and suggestions on its overexploitation treatment. Geol. China 2021, 48, 1142–1155. [Google Scholar] [CrossRef]
- Wang, R.; Lin, J.; Zhao, B.; Li, L.; Xiao, Z.; Pilz, J. Integrated Approach for Lithological Classification Using ASTER Imagery in a Shallowly Covered Region—The Eastern Yanshan Mountain of China. IEEE J. Sel. Top. Appl. Earth Obs. Remote Sens. 2018, 11, 4791–4807. [Google Scholar] [CrossRef]
- Liu, M.; Pei, H.; Shen, Y. Evaluating dynamics of GRACE groundwater and its drought potential in Taihang Mountain Region, China. J. Hydrol. 2022, 612, 128156. [Google Scholar] [CrossRef]
- He, K.; Zhang, S.; Wang, F.; Du, W. The karst collapses induced by environmental changes of the groundwater and their distribution rules in North China. Environ. Earth Sci. 2010, 61, 1075–1084. [Google Scholar] [CrossRef]
- Liu, C.; Yu, J.; Kendy, E. Groundwater exploitation and its impact on the environment in the North China Plain. Water Int. 2001, 26, 265–272. [Google Scholar] [CrossRef]
- Niu, X. The First Stage of the Middle-Line South-to-North Water-Transfer Project. Engineering 2022, 16, 21–28. [Google Scholar] [CrossRef]
- Cheng, M.; Ries, J. The unexpected signal in GRACE estimates of C20. J. Geod. 2017, 91, 897–914. [Google Scholar] [CrossRef]
- Loomis, B.D.; Rachlin, K.E.; Wiese, D.N.; Landerer, F.W.; Luthcke, S.B. Replacing GRACE/GRACE-FO with satellite laser ranging: Impacts on Antarctic Ice Sheet mass change. Geophys. Res. Lett. 2020, 47, e2019GL085488. [Google Scholar] [CrossRef]
- Sun, Y.; Riva, R.; Ditmar, P. Optimizing estimates of annual variations and trends in geocenter motion and J2 from a combination of GRACE data and geophysical models. J. Geophys. Res. Solid Earth 2016, 121, 8352–8370. [Google Scholar] [CrossRef]
- Peltier, W.R.; Argus, D.F.; Drummond, R. Space geodesy constrains ice age terminal deglaciation: The global ICE-6G_C (VM5a) model. J. Geophys. Res. Solid Earth 2015, 120, 450–487. [Google Scholar] [CrossRef]
- Landerer, F.W.; Swenson, S.C. Accuracy of scaled GRACE terrestrial water storage estimates. Water Resour. Res. 2012, 48, 1–11. [Google Scholar] [CrossRef]
- Rodell, M.; Velicogna, I.; Famiglietti, J.S. Satellite-based estimates of groundwater depletion in India. Nature 2009, 460, 999–1002. [Google Scholar] [CrossRef]
- Save, H.; Bettadpur, S.; Tapley, B.D. High-resolution CSR GRACE RL05 mascons. J. Geophys. Res. Solid Earth 2016, 121, 7547–7569. [Google Scholar] [CrossRef]
- Wahr, J.; Swenson, S.; Velicogna, I. Accuracy of GRACE mass estimates. Geophys. Res. Lett. 2006, 33, L06401. [Google Scholar] [CrossRef]
- Landerer, F.W.; Flechtner, F.M.; Save, H.; Webb, F.H.; Bandikova, T.; Bertiger, W.I.; Bettadpur, S.V.; Byun, S.H.; Dahle, C.; Dobslaw, H. Extending the global mass change data record: GRACE Follow-On instrument and science data performance. Geophys. Res. Lett. 2020, 47, e2020GL088306. [Google Scholar] [CrossRef]
- Loomis, B.D.; Luthcke, S.B.; Sabaka, T.J. Regularization and error characterization of GRACE mascons. J. Geod. 2019, 93, 1381–1398. [Google Scholar] [CrossRef]
- Galindo, F.J.; Ruiz, J.J.; Giachino, E.; Premoli, A.; Tavella, P. Estimation of the covariance matrix of individual standards by means of comparison measurements. In Advanced Mathematical and Computational Tools in Metrology V; Ciarlini, P., Cox, M.G., Filipe, E., Pavese, F., Richter, D., Eds.; World Scientific: Caparica, Portugal, 2001; pp. 177–184. [Google Scholar]
- Ali, S.; Wang, Q.; Liu, D.; Fu, Q.; Mafuzur Rahaman, M.; Abrar Faiz, M.; Jehanzeb Masud Cheema, M. Estimation of spatio-temporal groundwater storage variations in the Lower Transboundary Indus Basin using GRACE satellite. J. Hydrol. 2022, 605, 127315. [Google Scholar] [CrossRef]
- Zhong, Y.; Feng, W.; Humphrey, V.; Zhong, M. Human-induced and climate-driven contributions to water storage variations in the Haihe River Basin, China. Remote Sens. 2019, 11, 3050. [Google Scholar] [CrossRef]
- Han, J.; Miao, C.; Gou, J.; Zheng, H.; Zhang, Q.; Guo, X. A new daily gridded precipitation dataset based on gauge observations across mainland China. Earth Syst. Sci. Data Discuss. 2022, 2022, 1–33. [Google Scholar]
- Rodell, M.; Chen, J.; Kato, H.; Famiglietti, J.S.; Nigro, J.; Wilson, C.R. Estimating groundwater storage changes in the Mississippi River basin (USA) using GRACE. Hydrogeol. J. 2007, 15, 159–166. [Google Scholar] [CrossRef]
- Xie, J.; Xu, Y.-P.; Booij, M.J.; Guo, Y. Influences of reservoir operation on terrestrial water storage changes detected by GRACE in the Yellow River basin. J. Hydrol. 2022, 610, 127924. [Google Scholar] [CrossRef]
- Bhuiyan, M.A.E.; Yang, F.; Biswas, N.K.; Rahat, S.H.; Neelam, T.J. Machine learning-based error modeling to improve GPM IMERG precipitation product over the brahmaputra river basin. Forecasting 2020, 2, 248–266. [Google Scholar] [CrossRef]
- Zhang, C.; Duan, Q.; Yeh, P.J.-F.; Pan, Y.; Gong, H.; Gong, W.; Di, Z.; Lei, X.; Liao, W.; Huang, Z.; et al. The Effectiveness of the South-to-North Water Diversion Middle Route Project on Water Delivery and Groundwater Recovery in North China Plain. Water Resour. Res. 2020, 56, e2019WR026759. [Google Scholar] [CrossRef]
- Li, F.; Yang, Y. Impacts of the Middle Route of China’s South-to-North Water Diversion Project on the water network structure in the receiving basin. Environ. Sci. Pollut. Res. 2024, 31, 15611–15626. [Google Scholar] [CrossRef] [PubMed]
- Guo, T.; Li, R.; Xiao, Z.; Cai, P.; Guo, J.; Fu, H.; Zhang, X.; Song, X. The Divergent Changes in Surface Water Area after the South-to-North Water Diversion Project in China. Remote Sens. 2024, 16, 378. [Google Scholar] [CrossRef]
- Loucks, D.P. Quantifying trends in system sustainability. Hydrol. Sci. J. 1997, 42, 513–530. [Google Scholar] [CrossRef]
- Liu, J.; Cao, G.; Zheng, C. Sustainability of groundwater resources in the North China Plain. In Sustaining Groundwater Resources; Springer: Dordrecht, The Netherlands, 2011; pp. 69–87. [Google Scholar]
- Cui, W.; Hao, Q.; Xiao, Y.; Zhu, Y.; Li, J.; Zhang, Y. Combining river replenishment and restrictions on groundwater pumping to achieve groundwater balance in the Juma River Plain, North China Plain. Front. Earth Sci. 2022, 10, 1275. [Google Scholar] [CrossRef]
- Zhang, J.; Chen, L.; Hou, X.; Li, J.; Ren, X.; Lin, M.; Zhang, M.; Wang, Y.; Tian, Y. Effects of multi-factors on the spatiotemporal variations of deep confined groundwater in coal mining regions, North China. Sci. Total Environ. 2022, 823, 153741. [Google Scholar] [CrossRef]
- Zhang, Z.; Fei, Y. Atlas of Groundwater Sustainable Utilization in North China Plain; Sinomap Press: Beijing, China, 2009; pp. 1–185. [Google Scholar]
- Qian, Y.; Zhang, Z.; Fei, Y.; Chen, Y. Discussion of calculation method of synthetic specific yield based on MapGIS and groundwater database. Site Investig. Sci. Technol 2007, 1, 26. [Google Scholar] [CrossRef]
- Deng, J.; Wang, C.; Bagas, L.; Santosh, M.; Yao, E. Crustal architecture and metallogenesis in the south-eastern North China Craton. Earth Sci. Rev. 2018, 182, 251–272. [Google Scholar] [CrossRef]
- Gao, Y.; Qu, W.; Zhang, Q.; Chen, H.; Liang, S.; Hao, M.; Wang, Q. Influence of crustal rheology and heterogeneity on tectonic stress accumulation characteristics of North China constrained by GNSS observations. J. Asian Earth Sci. 2021, 214, 104780. [Google Scholar] [CrossRef]
- Cao, G.; Zheng, C.; Scanlon, B.R.; Liu, J.; Li, W. Use of flow modeling to assess sustainability of groundwater resources in the North China Plain. Water Resour. Res. 2013, 49, 159–175. [Google Scholar] [CrossRef]
- Feng, T.; Shen, Y.; Chen, Q.; Wang, F.; Zhang, X. Groundwater storage change and driving factor analysis in north china using independent component decomposition. J. Hydrol. 2022, 609, 127708. [Google Scholar] [CrossRef]
- Wang, L.; Chen, C.; Du, J.; Wang, T. Detecting seasonal and long-term vertical displacement in the North China Plain using GRACE and GPS. Hydrol. Earth Syst. Sci. 2017, 21, 2905–2922. [Google Scholar] [CrossRef]
- Thomas, B.F.; Caineta, J.; Nanteza, J. Global assessment of groundwater sustainability based on storage anomalies. Geophys. Res. Lett. 2017, 44, 11445–11455. [Google Scholar] [CrossRef]
- Wang, F.; Lai, H.; Li, Y.; Feng, K.; Zhang, Z.; Tian, Q.; Zhu, X.; Yang, H. Identifying the status of groundwater drought from a GRACE mascon model perspective across China during 2003–2018. Agric. Water Manag. 2022, 260, 107251. [Google Scholar] [CrossRef]
- Zhao, A.; Xiang, K.; Zhang, A.; Zhang, X. Spatial-temporal evolution of meteorological and groundwater droughts and their relationship in the North China Plain. J. Hydrol. 2022, 610, 127903. [Google Scholar] [CrossRef]
- Yao, Y.; Zheng, C.; Andrews, C.; He, X.; Zhang, A.; Liu, J. Integration of groundwater into China’s south-north water transfer strategy. Sci. Total Environ. 2019, 658, 550–557. [Google Scholar] [CrossRef] [PubMed]
- Long, D.; Yang, W.; Scanlon, B.R.; Zhao, J.; Liu, D.; Burek, P.; Pan, Y.; You, L.; Wada, Y. South-to-North Water Diversion stabilizing Beijing’s groundwater levels. Nat. Commun. 2020, 11, 3665. [Google Scholar] [CrossRef] [PubMed]
- Han, Z. Groundwater resources protection and aquifer recovery in China. Environ. Geol. 2003, 44, 106–111. [Google Scholar] [CrossRef]
- Shang, Y.; You, B.; Shang, L. China’s environmental strategy towards reducing deep groundwater exploitation. Environ. Earth Sci. 2016, 75, 1439. [Google Scholar] [CrossRef]
- Wessel, P.; Luis, J.F.; Uieda, L.; Scharroo, R.; Wobbe, F.; Smith, W.H.F.; Tian, D. The Generic Mapping Tools Version 6. Geochem. Geophys. Geosyst. 2019, 20, 5556–5564. [Google Scholar] [CrossRef]
Disclaimer/Publisher’s Note: The statements, opinions and data contained in all publications are solely those of the individual author(s) and contributor(s) and not of MDPI and/or the editor(s). MDPI and/or the editor(s) disclaim responsibility for any injury to people or property resulting from any ideas, methods, instructions or products referred to in the content. |
© 2024 by the authors. Licensee MDPI, Basel, Switzerland. This article is an open access article distributed under the terms and conditions of the Creative Commons Attribution (CC BY) license (https://creativecommons.org/licenses/by/4.0/).