


Glacier Mass Balance and Its Impact on Land Water Storage in the Southeastern Tibetan Plateau Revealed by ICESat-2 and GRACE-FO


Abstract
1. Introduction
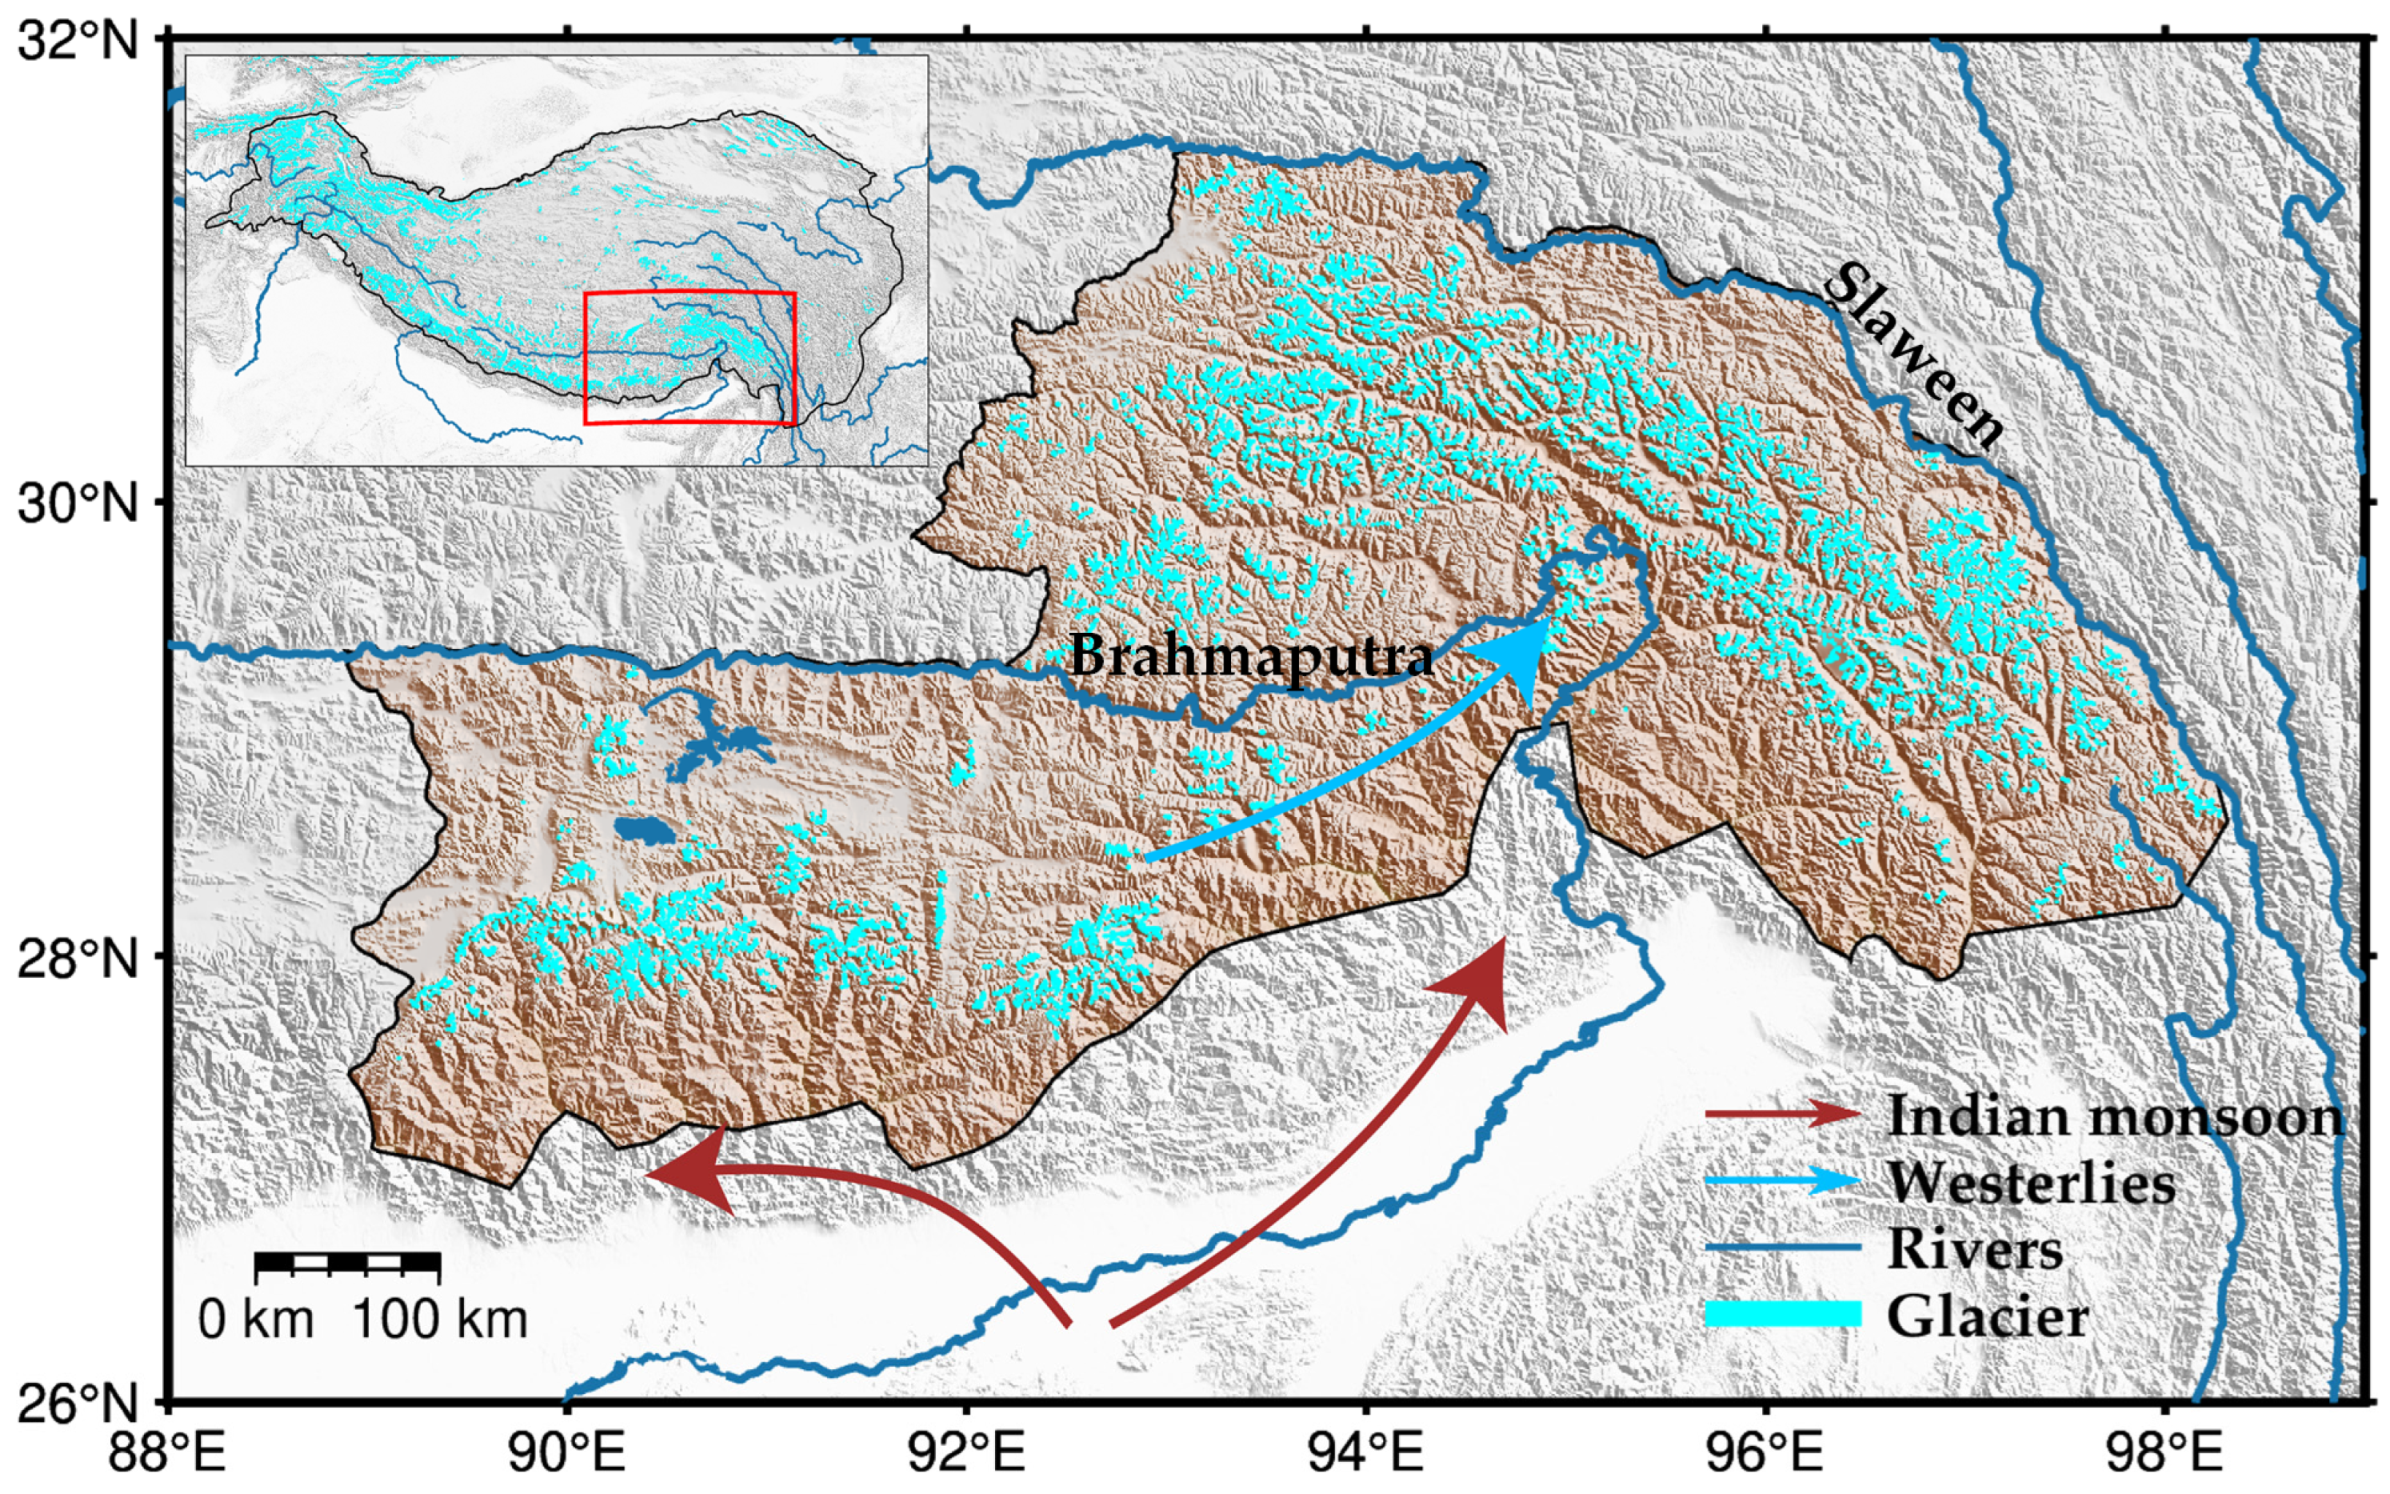
2. Study Area
3. Data and Methods
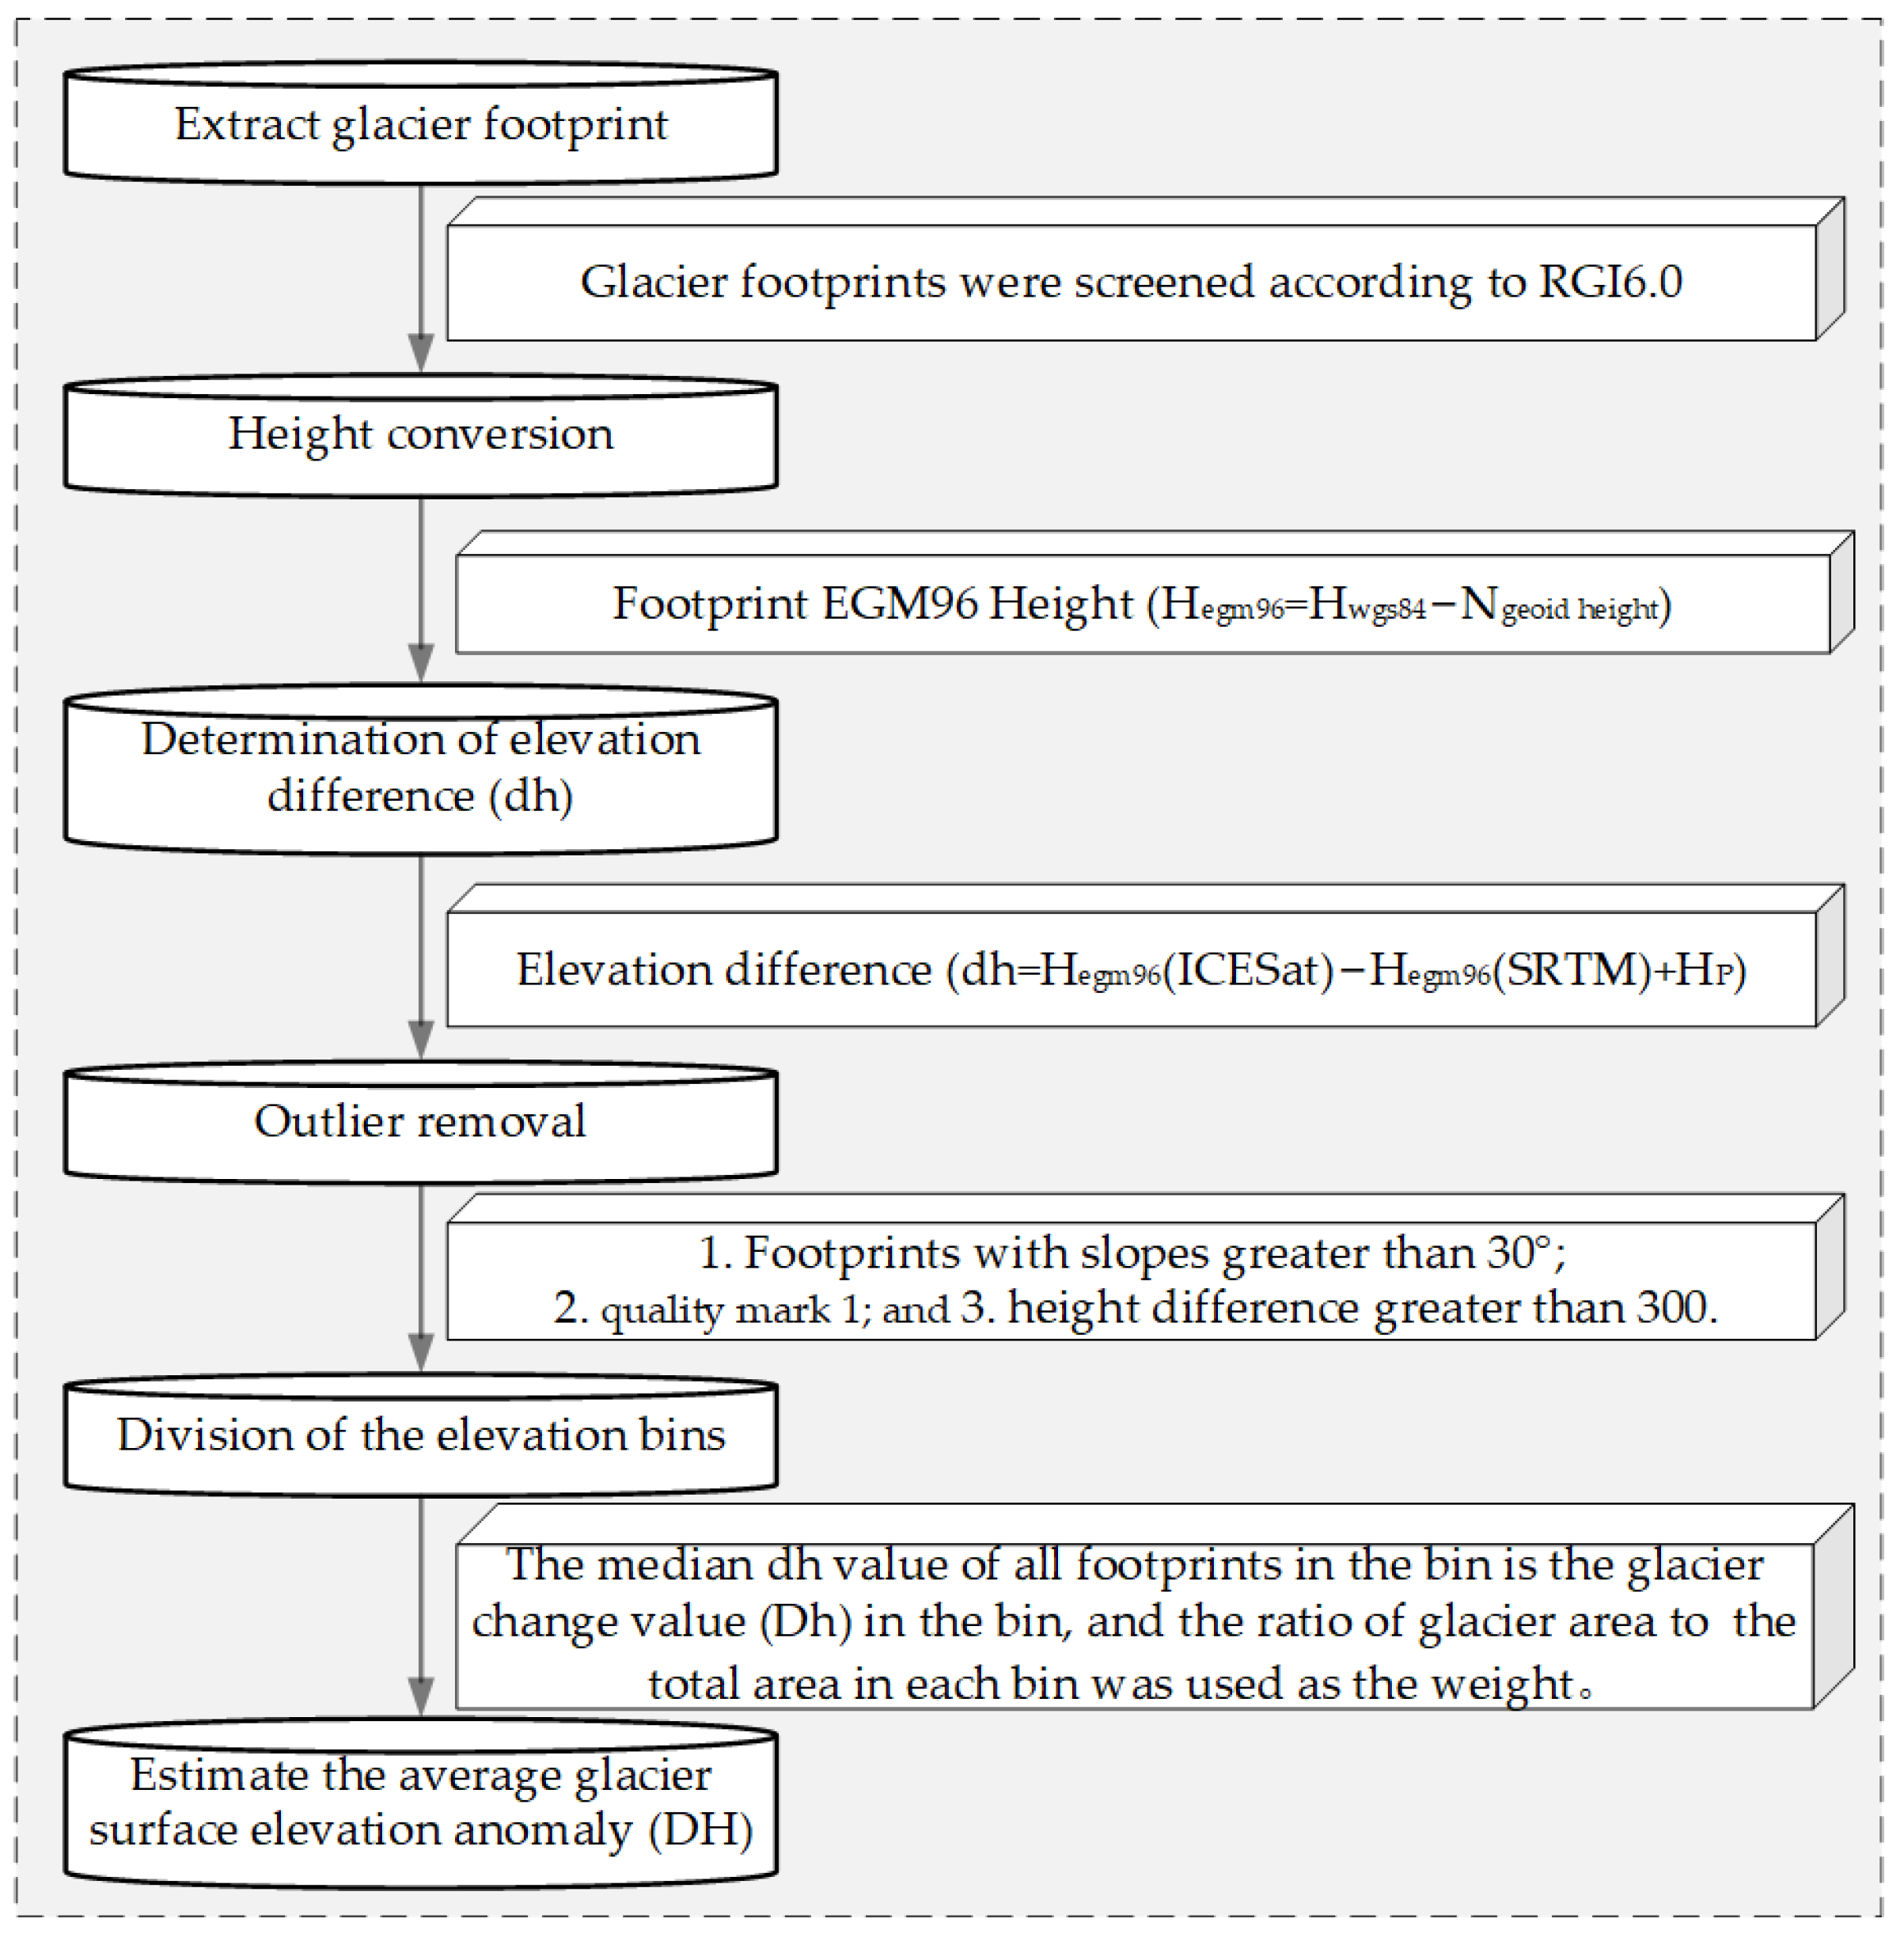
3.1. ICESat-2 Data and Processing
- (1)
- Extract glacier footprint. We determined the footprint of the ICESat-2 within the glacier using RGI6.0 glacier boundary data.
- (2)
- Height conversion. We converted the ICESat-2 footprint height based on the WGS-84 ellipsoid to the orthometric height based on EGM96 to be consistent with the coordinate system of the DEM (Hegm96 = Hwgs84 − Ngeoid height).
- (3)
- Determination of elevation difference. The SRTM elevation and slope of each ICESat footprint were extracted through the bilinear interpolation of DEM grid cells, and the elevation difference between ICESat-2 and SRTM data was obtained (dh = HICESat-2 − HSRTM + Hp). Because the DEM data of the SRTM have a penetration depth for the glacier, the penetration depth of Hp = 1.5 m was added back into this study [43].
- (4)
- Outlier removal. To eliminate the abnormal points affected by cloud, fog, and terrain, we selected a threshold of 300 to remove the abnormal elevation difference, removed the measured points with a terrain slope greater than 30°, and retained the footprint points with mark 0 according to the official quality mark.
- (5)
- Division of the elevation bins. We divided the glacier into multiple elevation bins with the same width and no overlap between each bin. The median elevation difference (dh) of all footprint points within each bin determined the elevation difference (Dh) for that bin.
- (6)
- Estimate the average glacier surface elevation anomaly (DH). We used the ratio of the glacier area to the total glacier area of each elevation chamber as the weight (Pi = Si/S, P1 + P2 + P3+…+ Pn = 1). Then, the weighted elevation differences across all bins were aggregated to yield the final elevation difference (DH = P1 × Dh1 + P2 × Dh2 + P3 × Dh3 +…+ Pn × Dhn).
3.2. GRACE-FO Data
3.3. Hydrological Model
3.4. Precipitation and Temperature Data
3.5. Lake Data
4. Results and Analysis
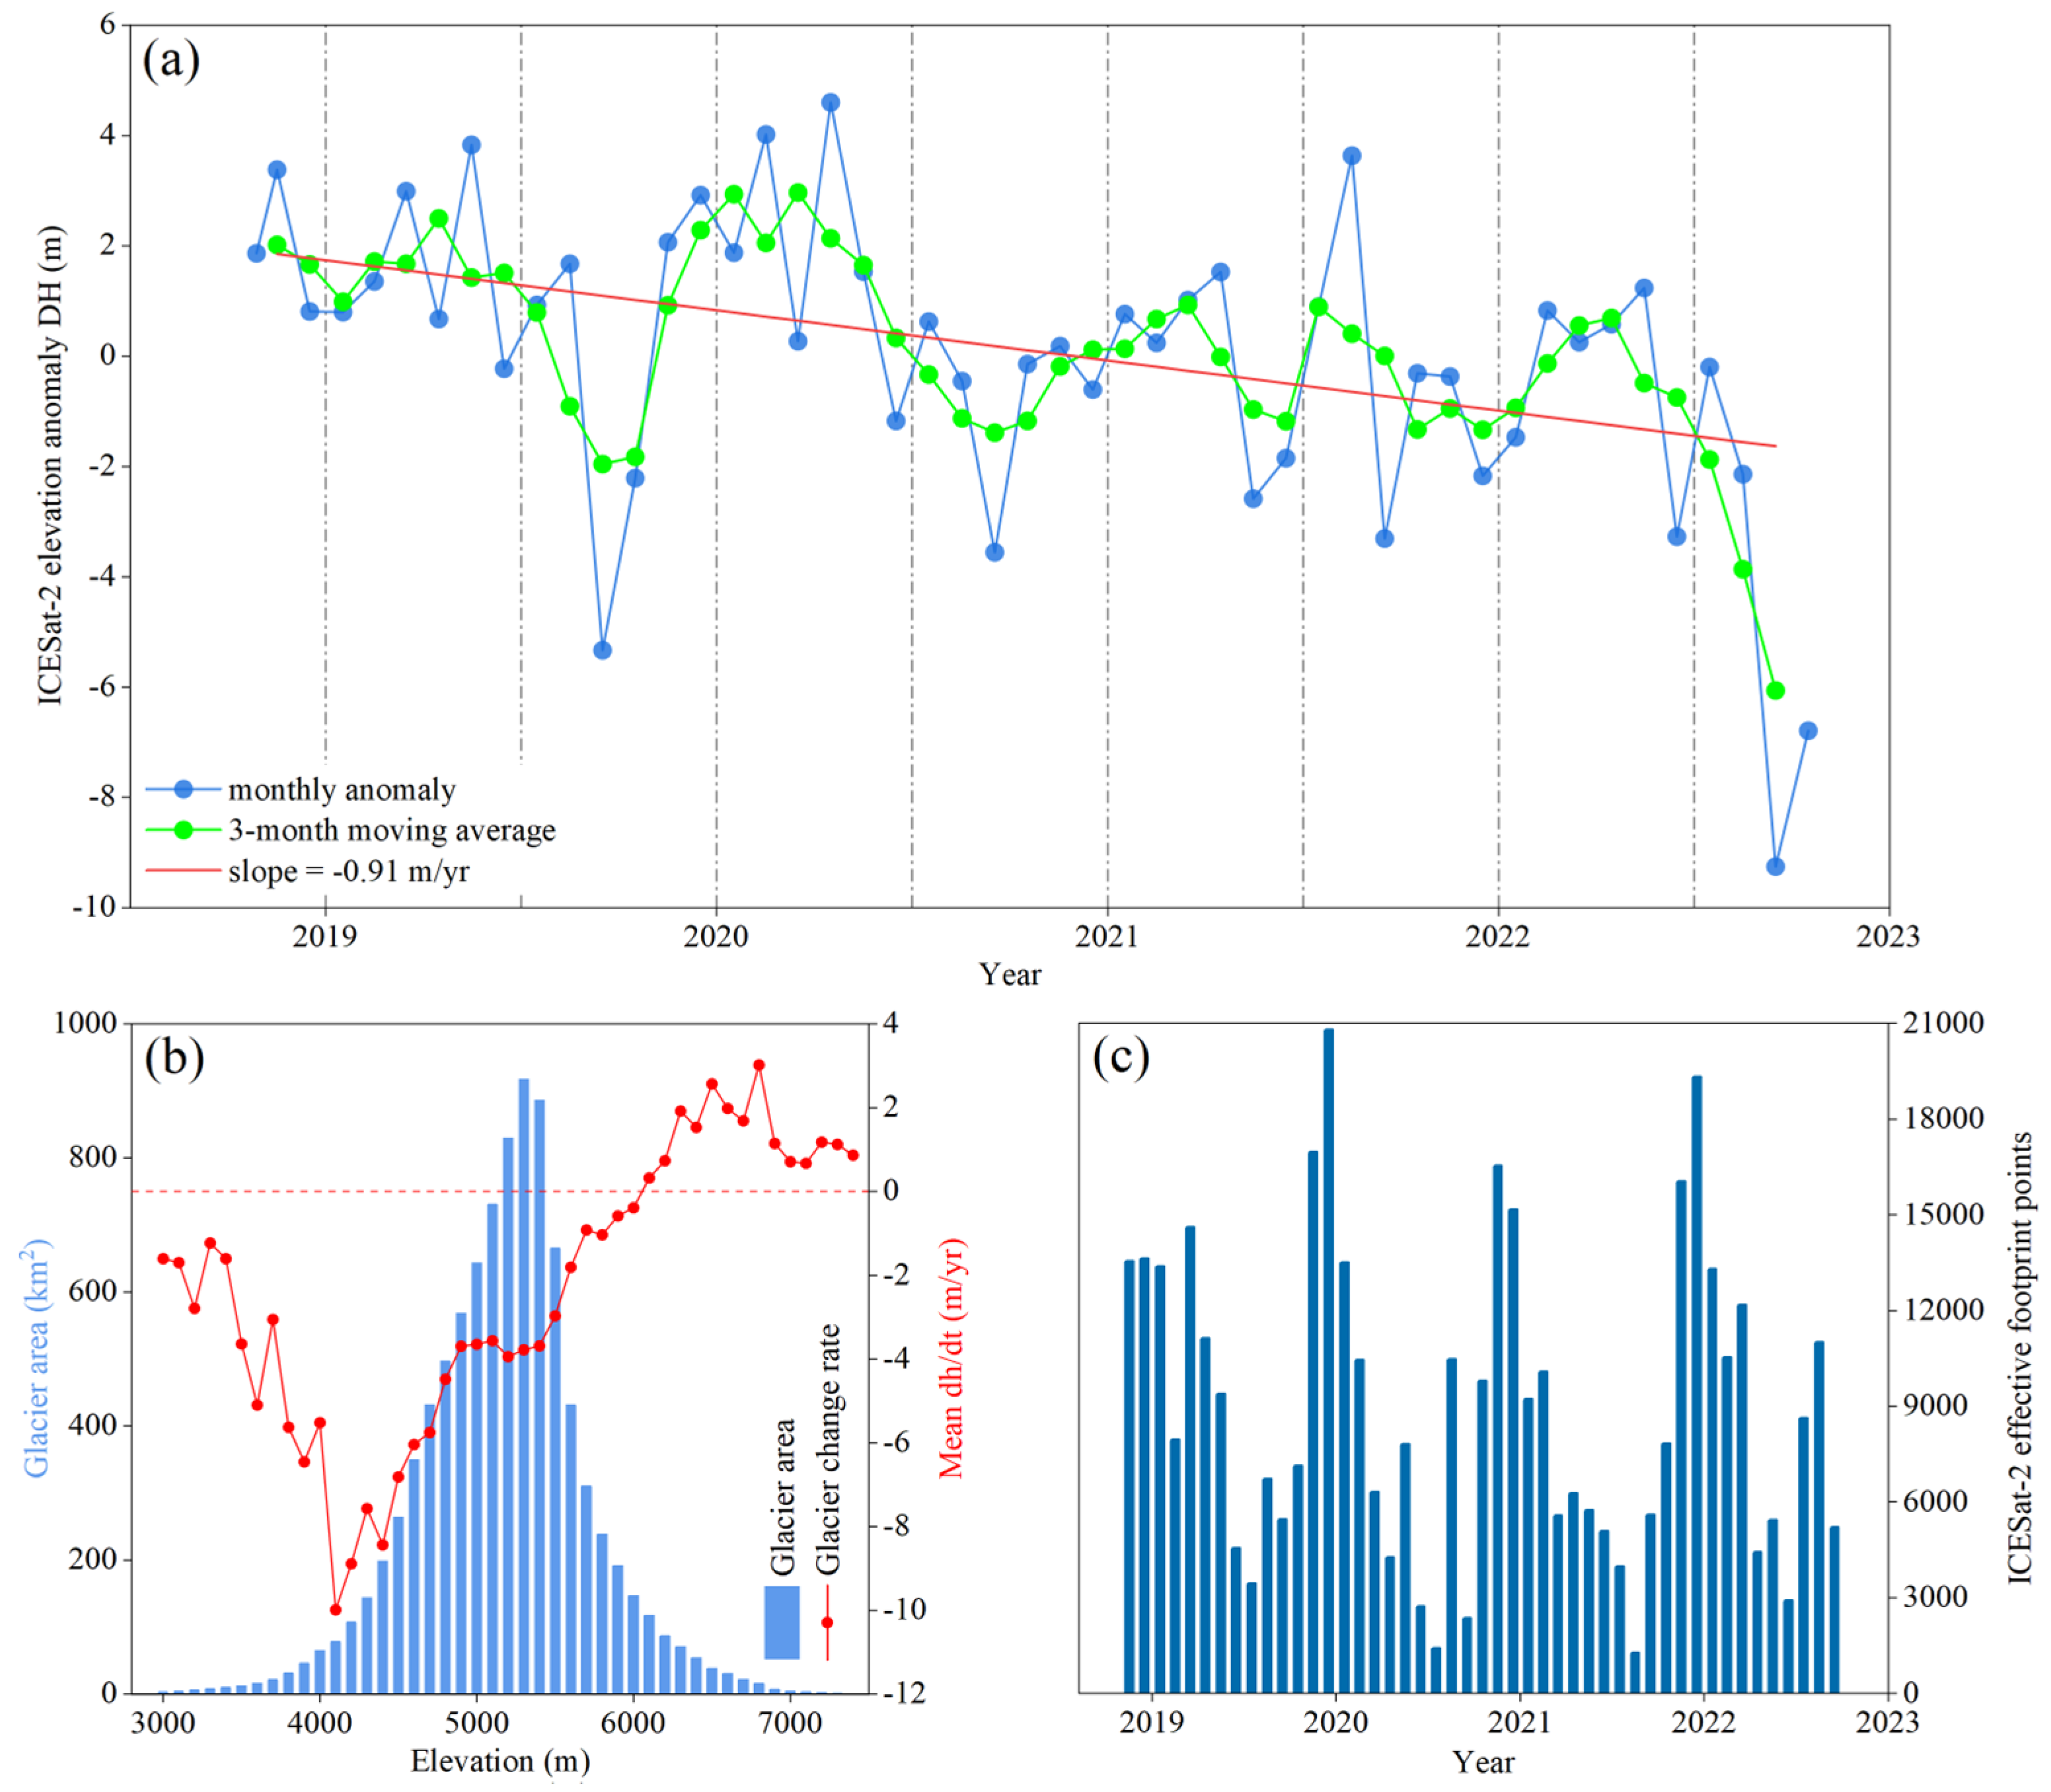
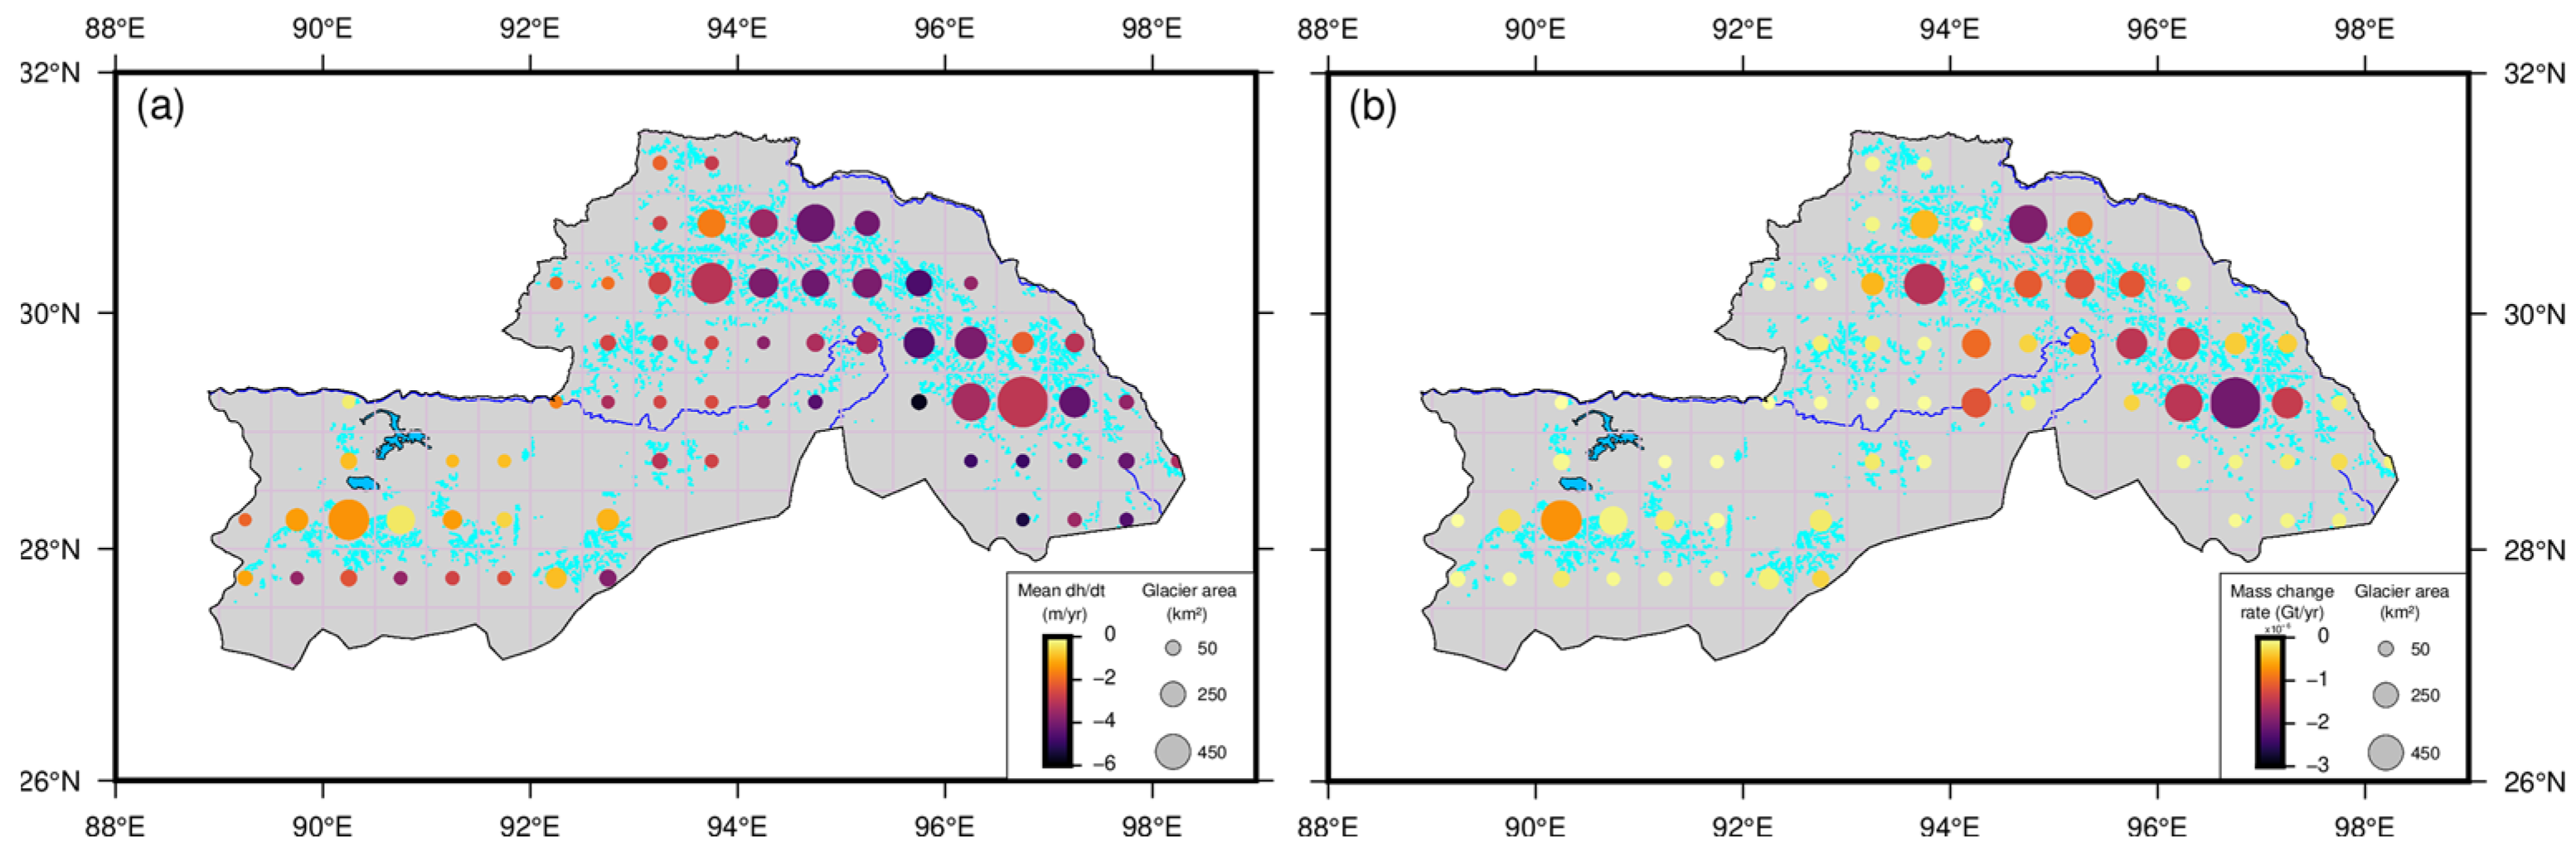
4.1. Glacier Thickness and Glacier Mass Change from ICESat-2 Measurements
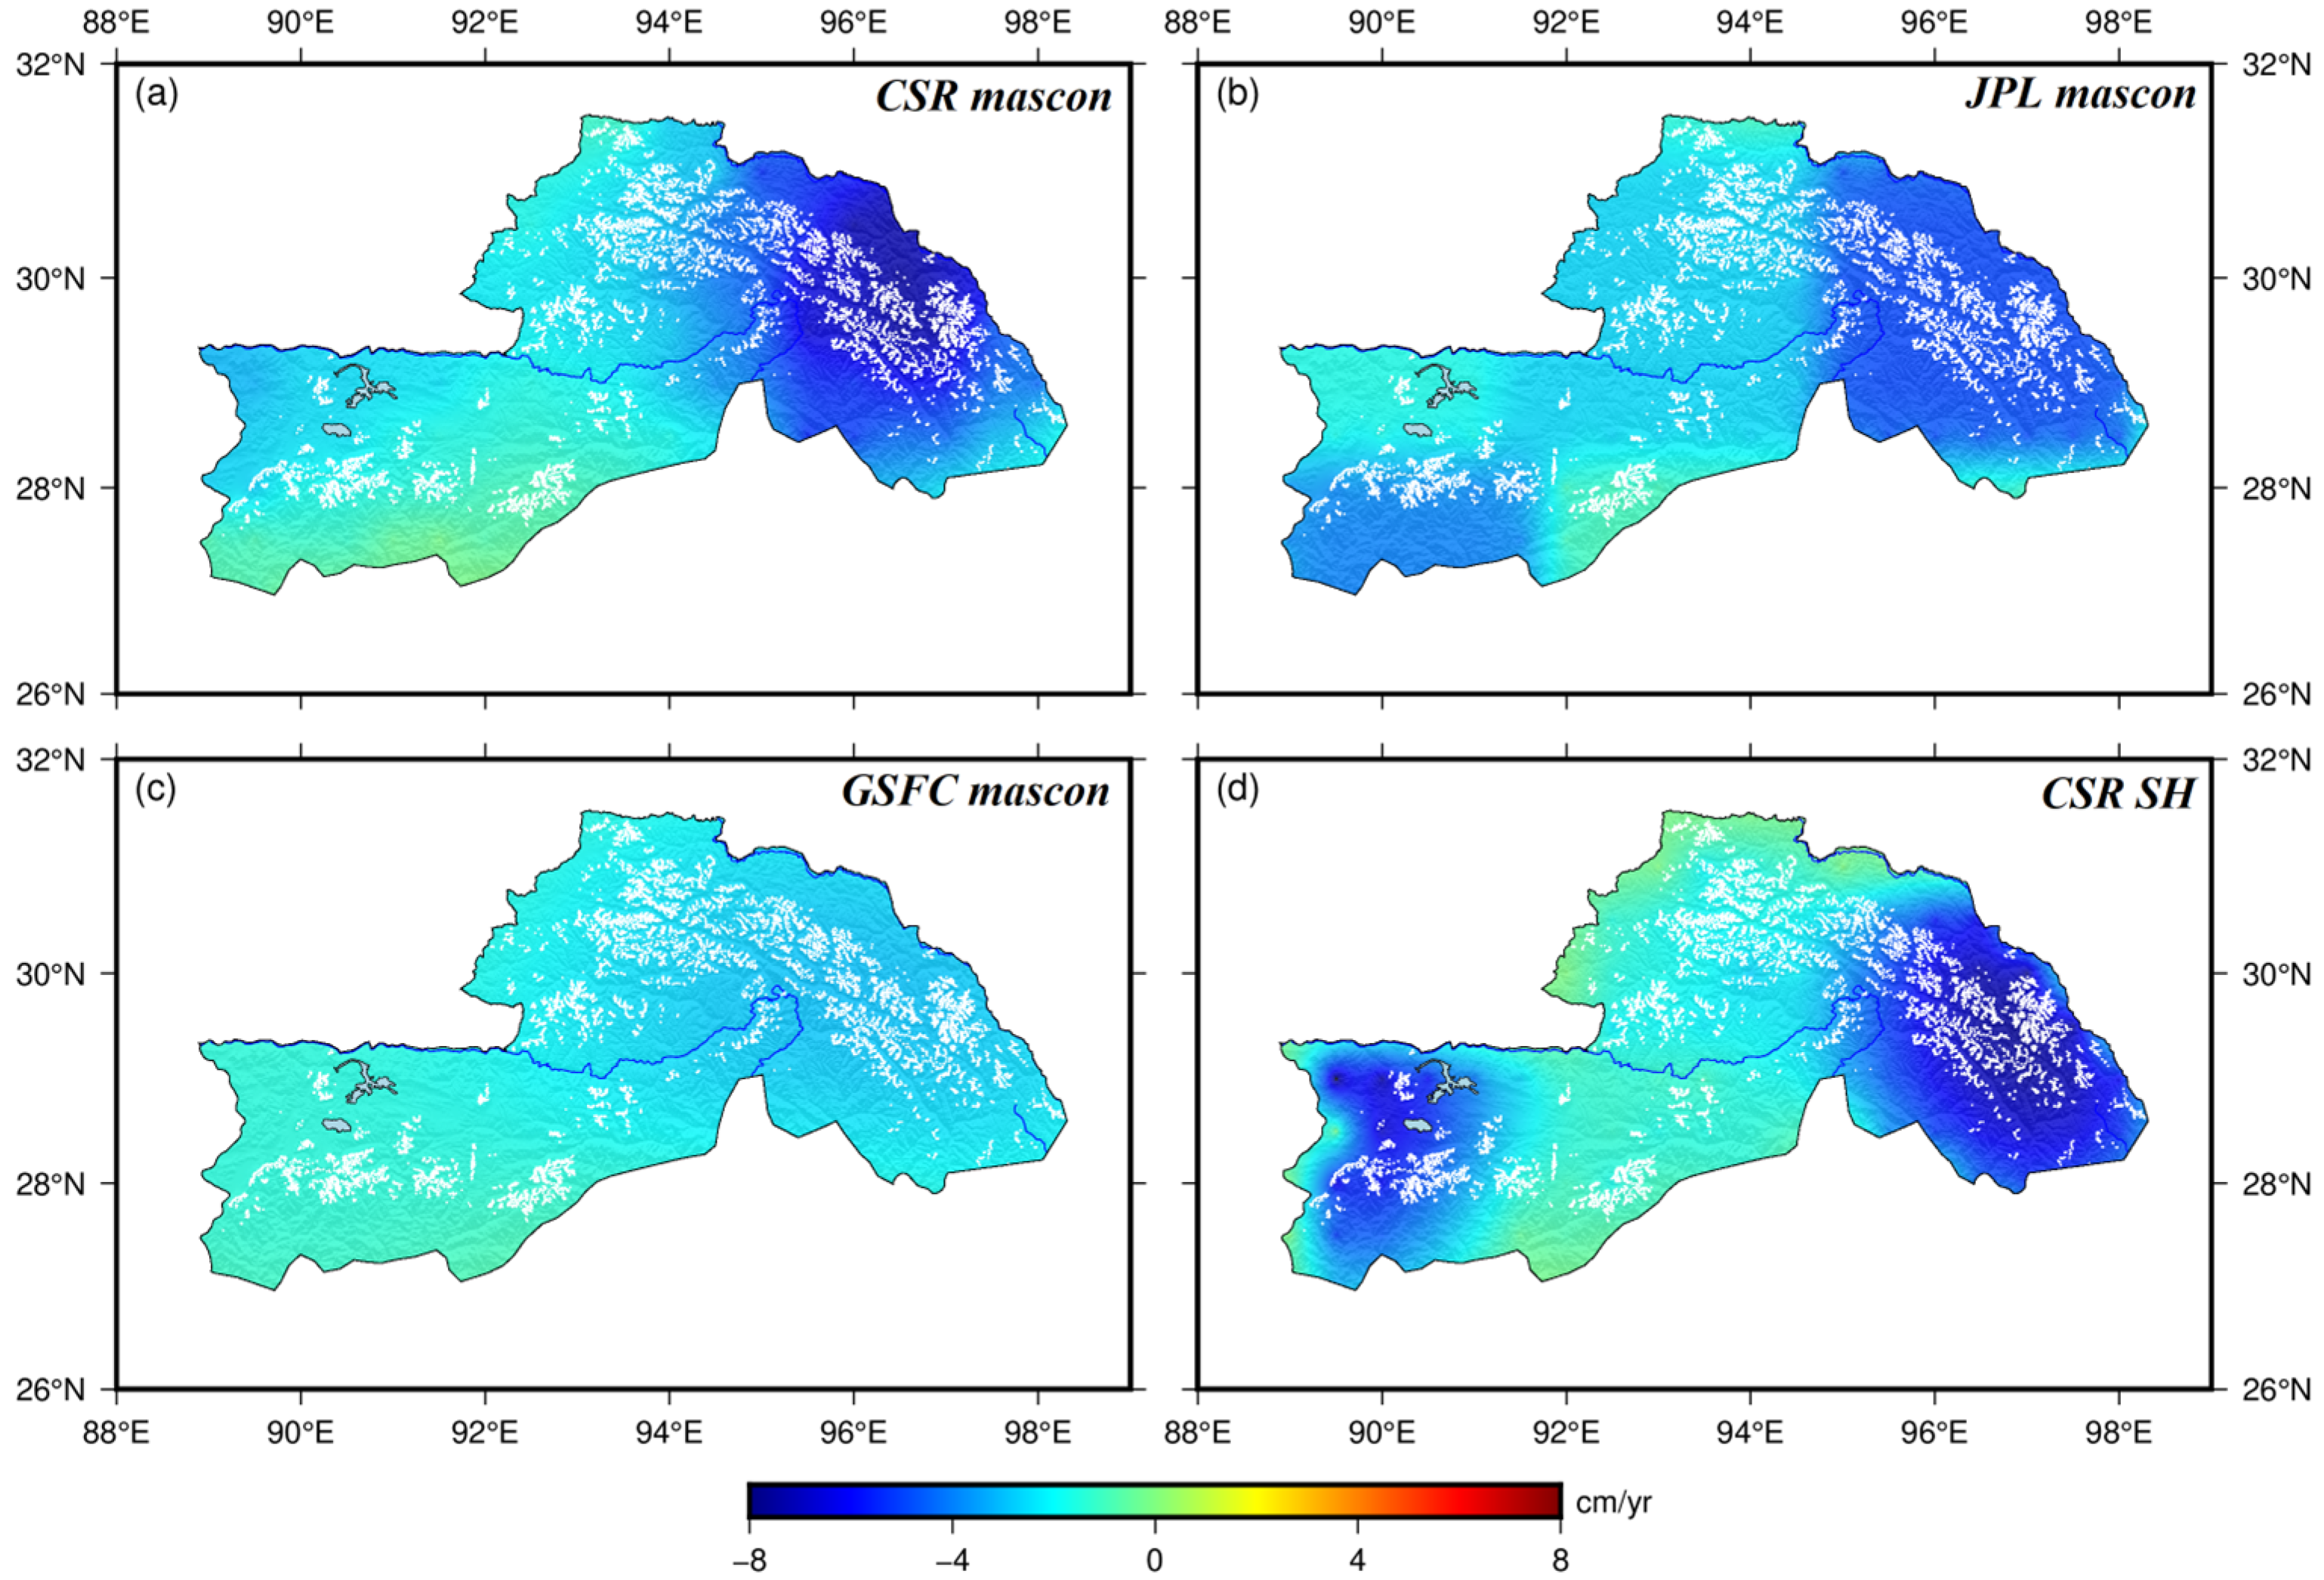
4.2. Mass Loss in Southeast Tibet Observed by GRACE
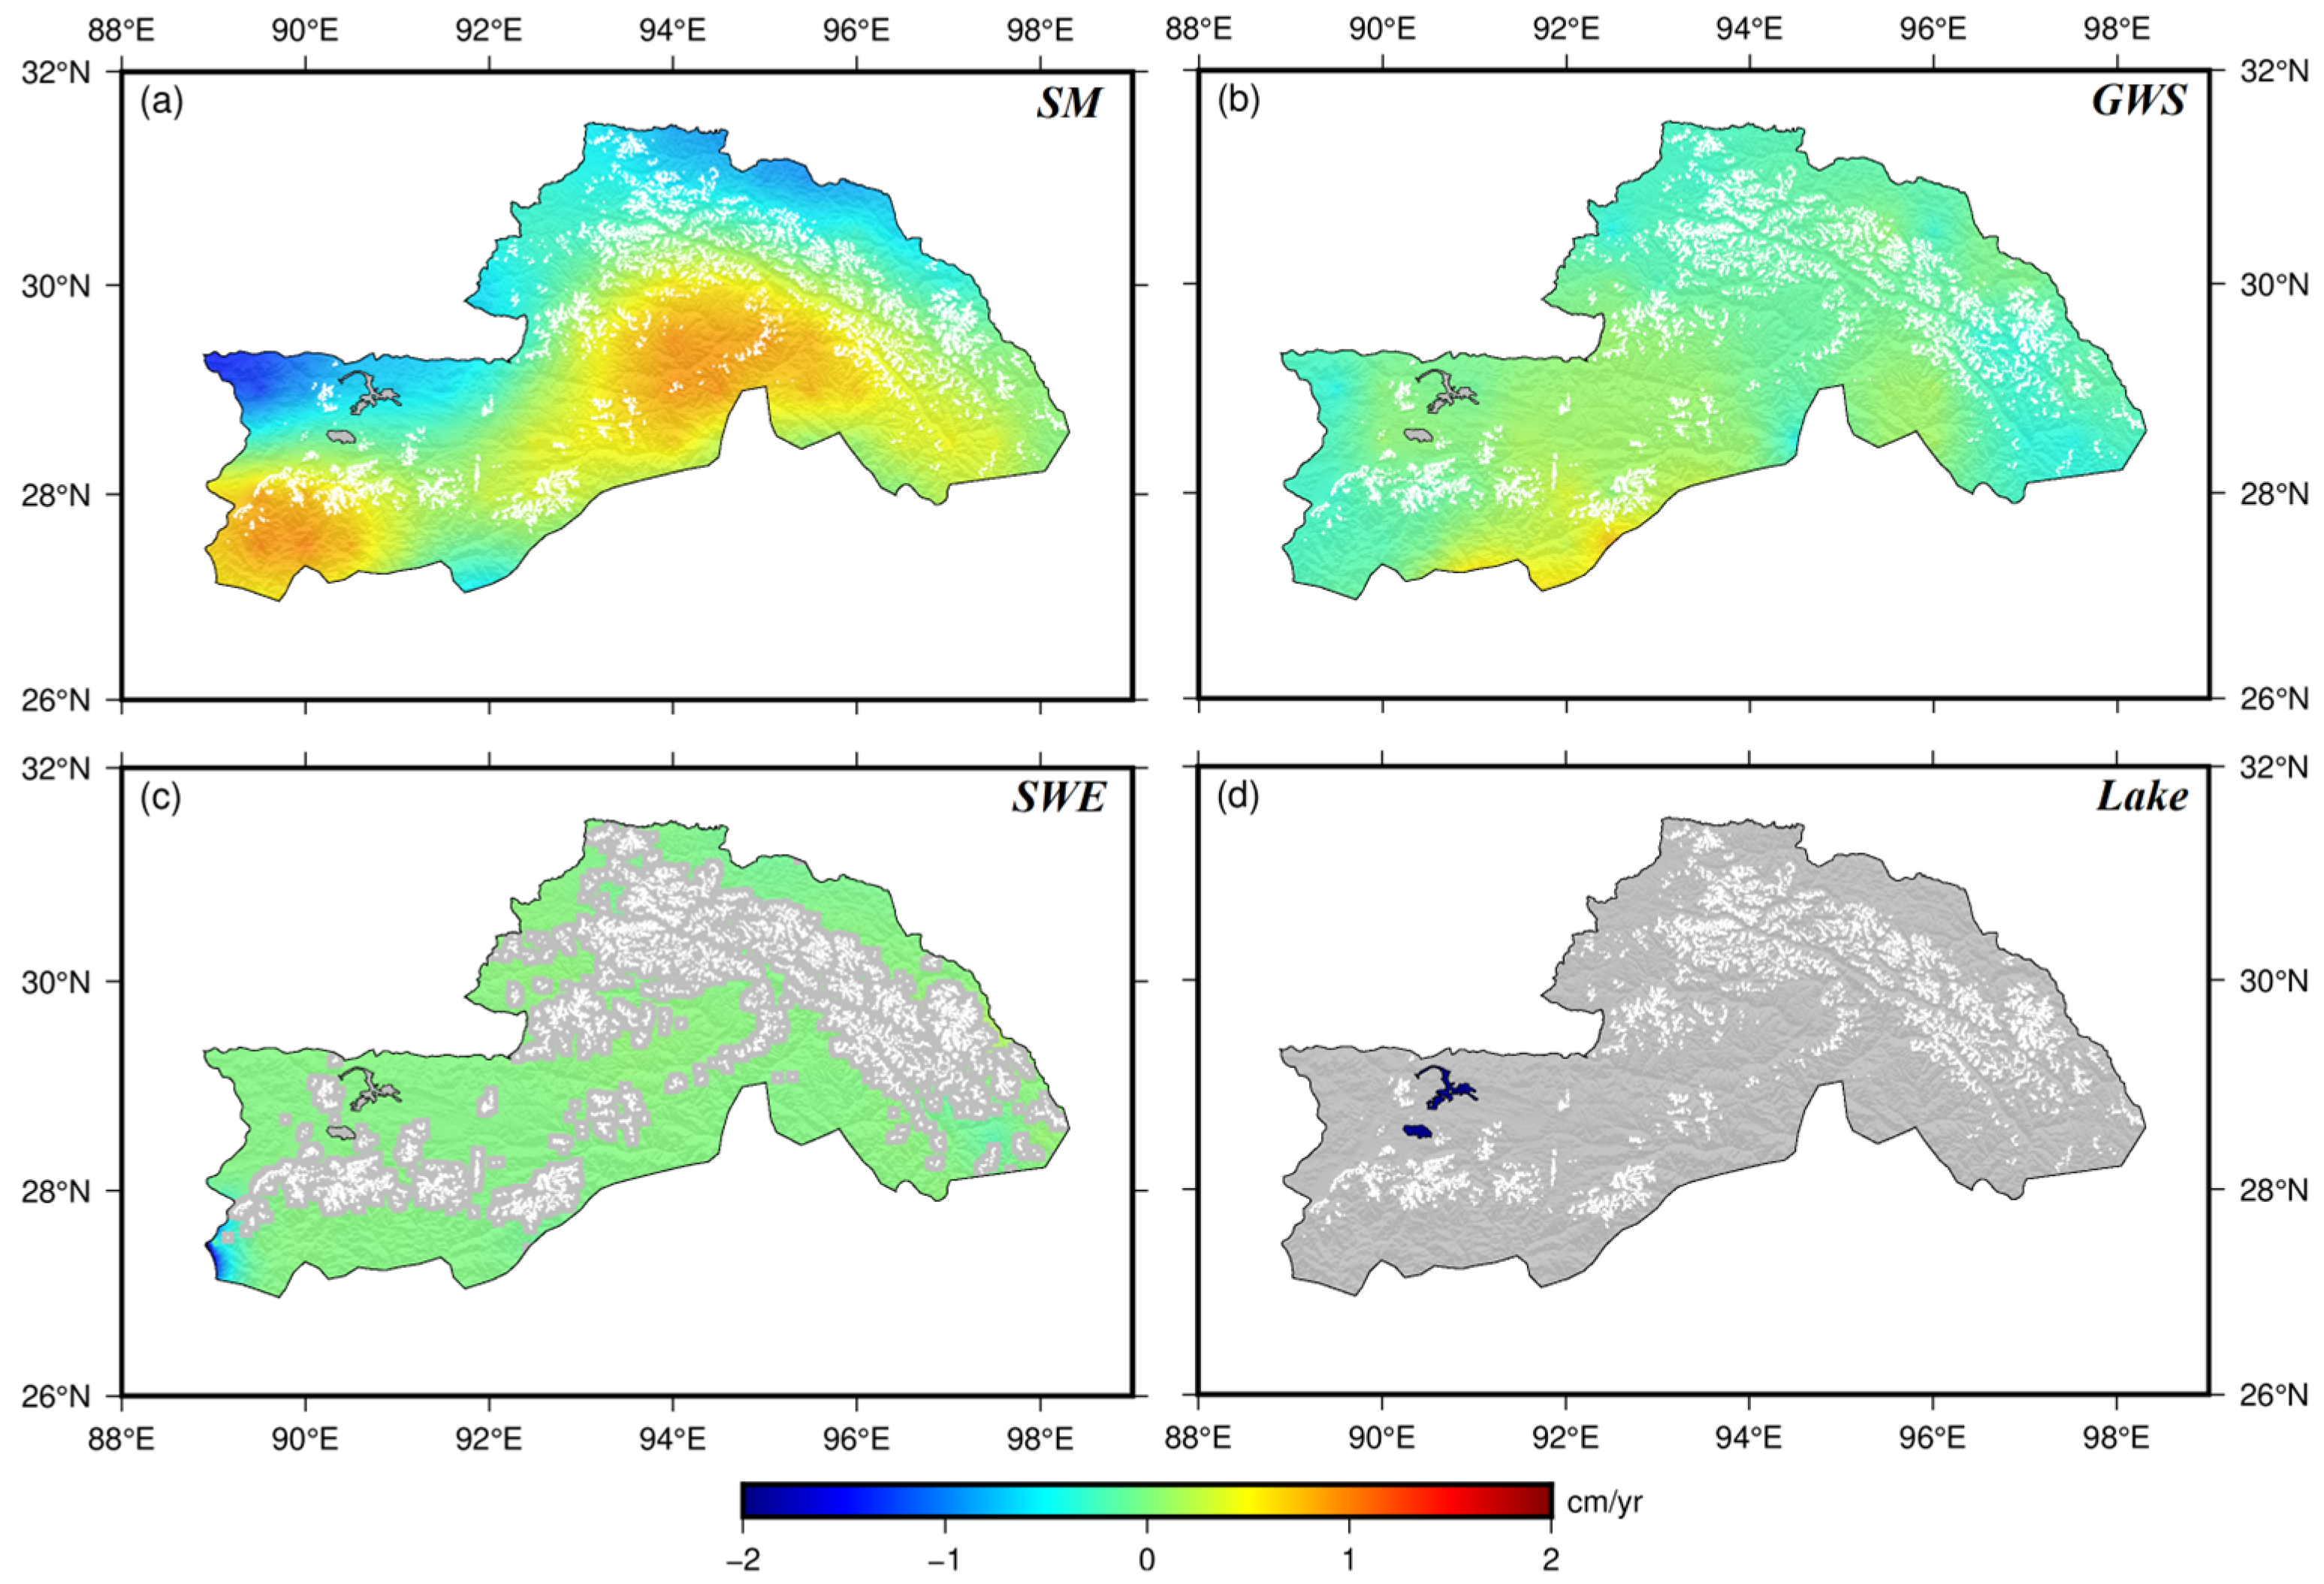
4.3. Variation in Land Water Storage Based on the Hydrological Model
5. Discussion
5.1. Comparison with Previous Studies

5.2. Contribution of Glacier Mass Loss to Land Water Mass Change in the SETP
5.3. Dominant Factors of Glacier Seasonal Variation in the SETP
6. Conclusions
- (1)
- The glaciers in the SETP are melting rapidly, and the ICESat-inferred average thickness change rate is −0.91 ± 0.18 m/yr. It is important to note the difference in the spatial distribution of thickness change, with a more rapid decline in the eastern part of the SETP, where the maximum decrease rate reaches −5.71 m/yr. The diminishing thickness of glaciers has led to a significant mass loss of −7.61 ± 1.52 Gt/yr and shows signs of further acceleration.
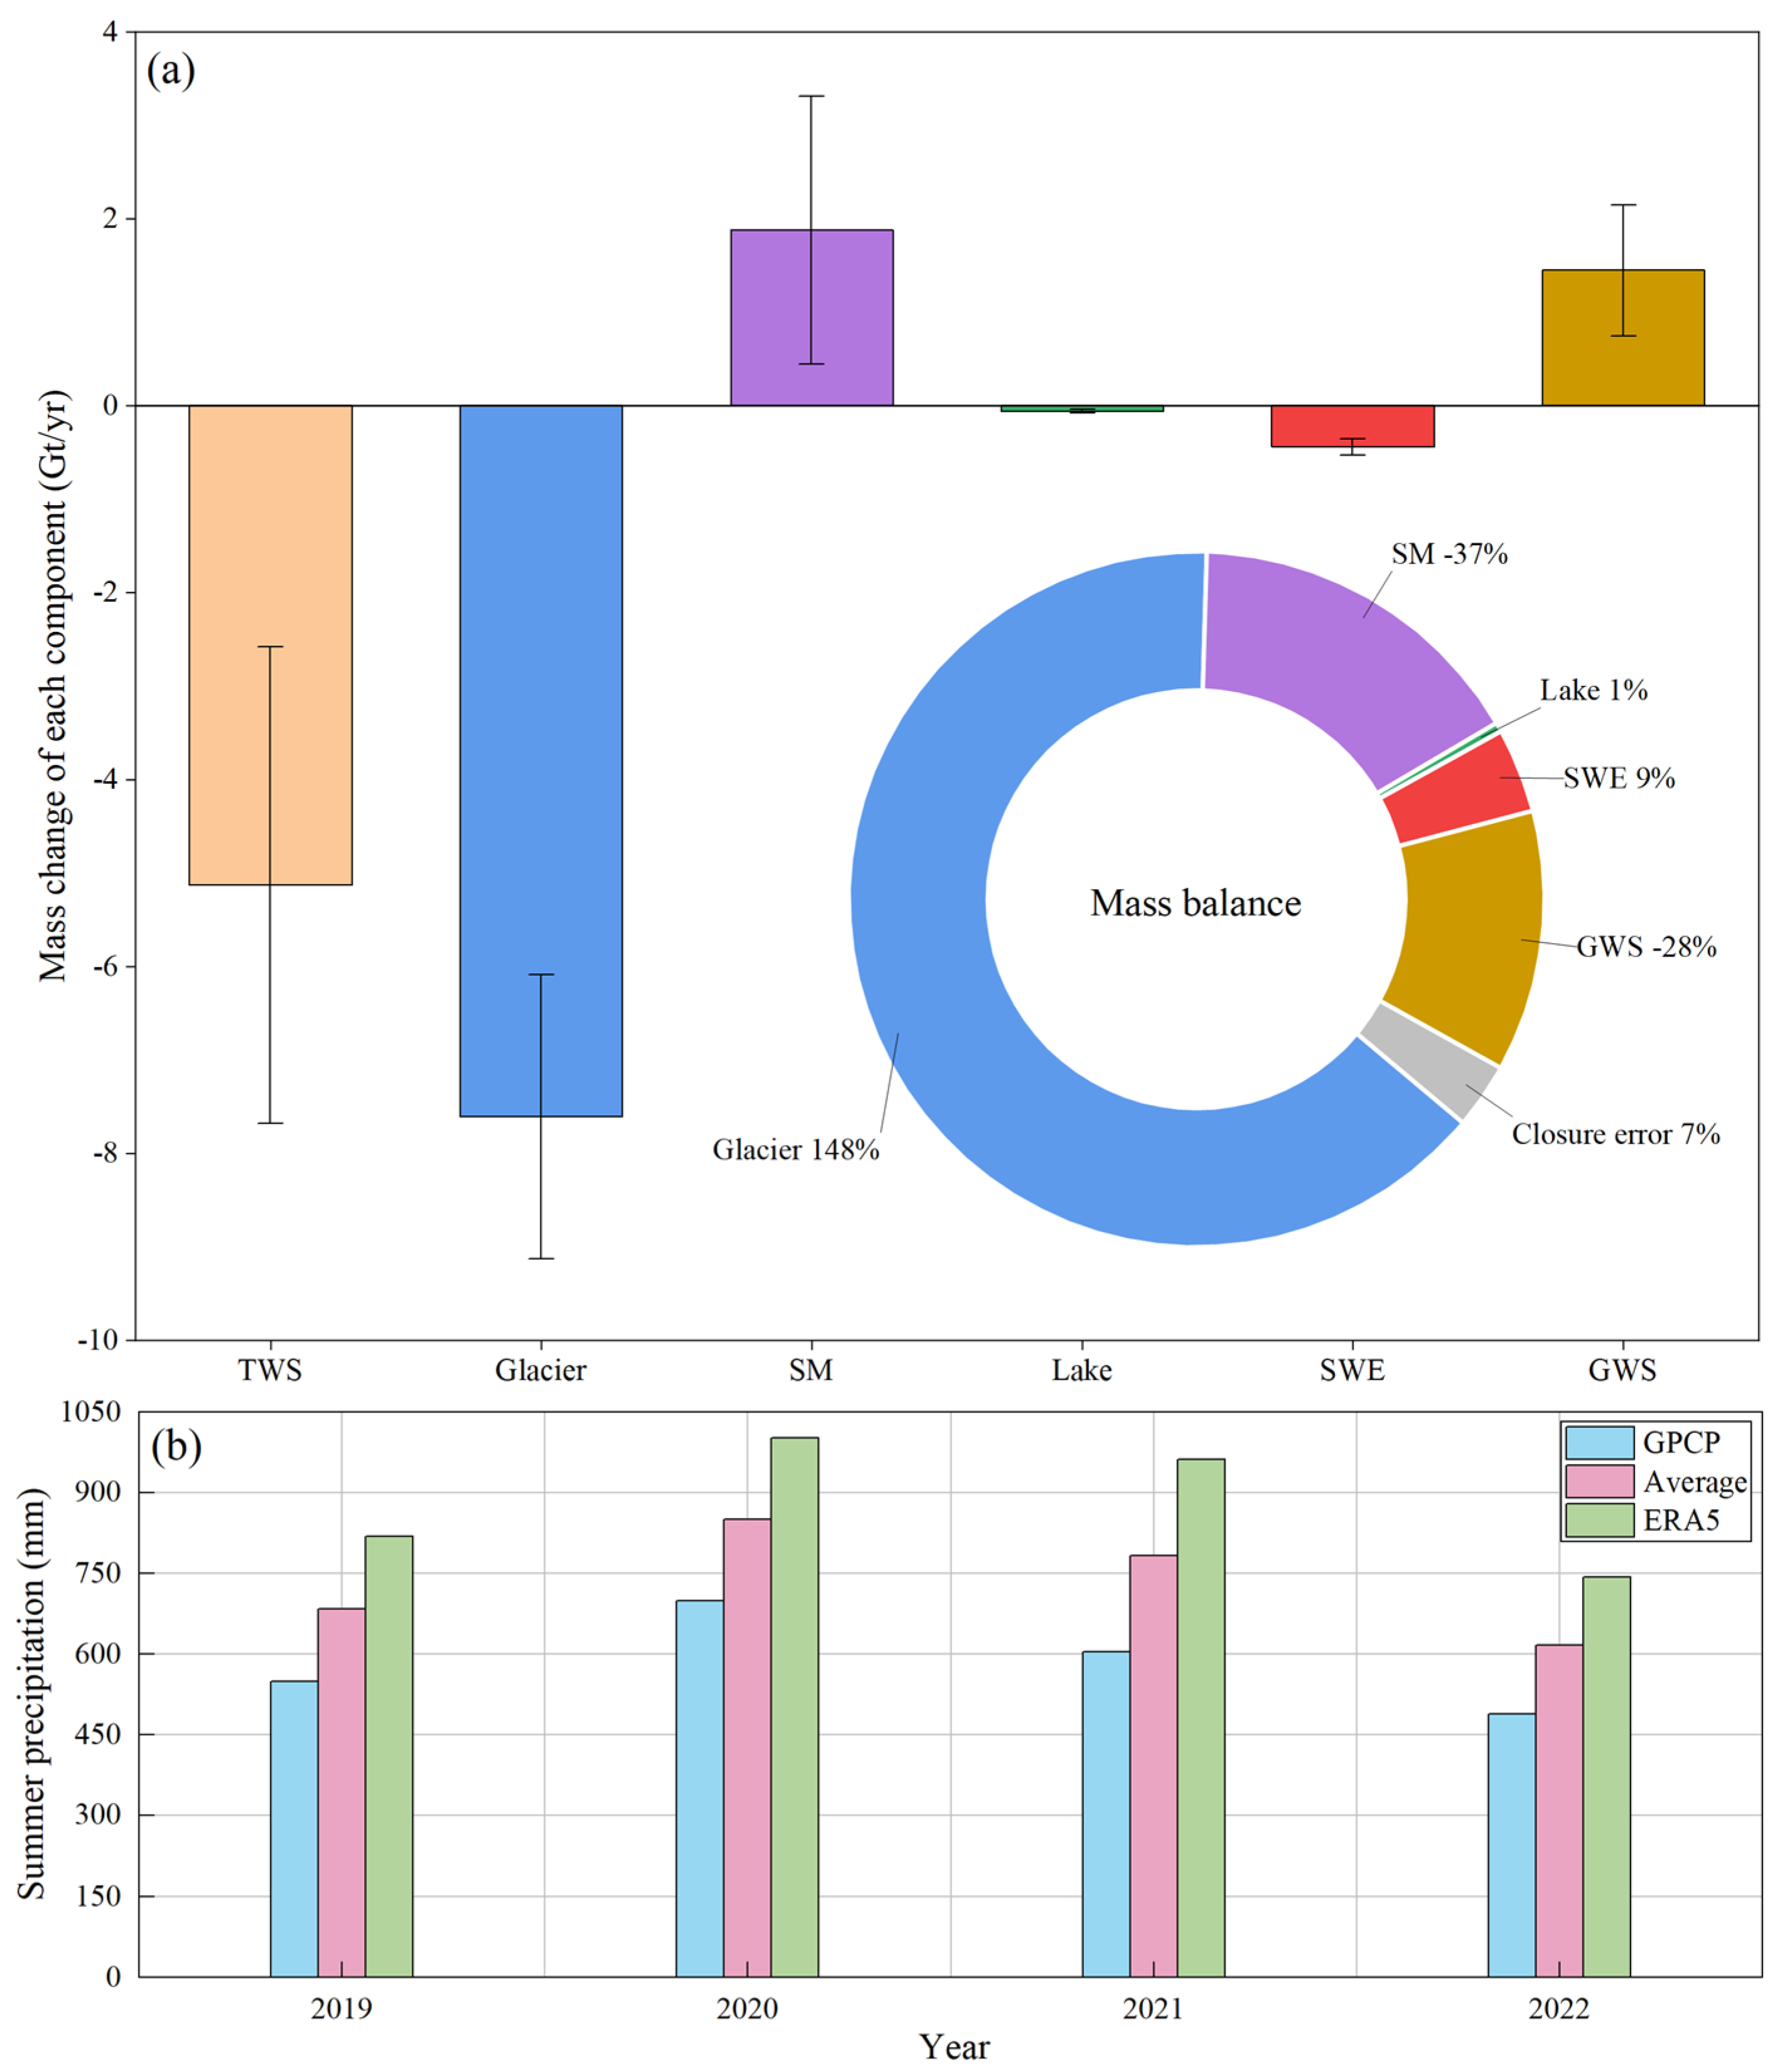
- (2)
- The GRACE-inferred terrestrial water storage (TWS) change in the SETP is experiencing a declining trend, with a rate of −5.13 ± 2.55 Gt/yr. Furthermore, the change rates of snow, lakes, soil moisture, and groundwater, as estimated through various hydrological models, are −0.44 ± 0.09 Gt/yr, −0.06 ± 0.02 Gt/yr, 1.88 ± 1.83 Gt/yr, and 1.45 ± 0.70 Gt/yr, respectively. Their corresponding proportional contributions to land water are 9%, 1%, −37%, and −28%, respectively. These findings underscore pronounced glacier mass loss as the primary driving factor of land water mass loss within the SETP.
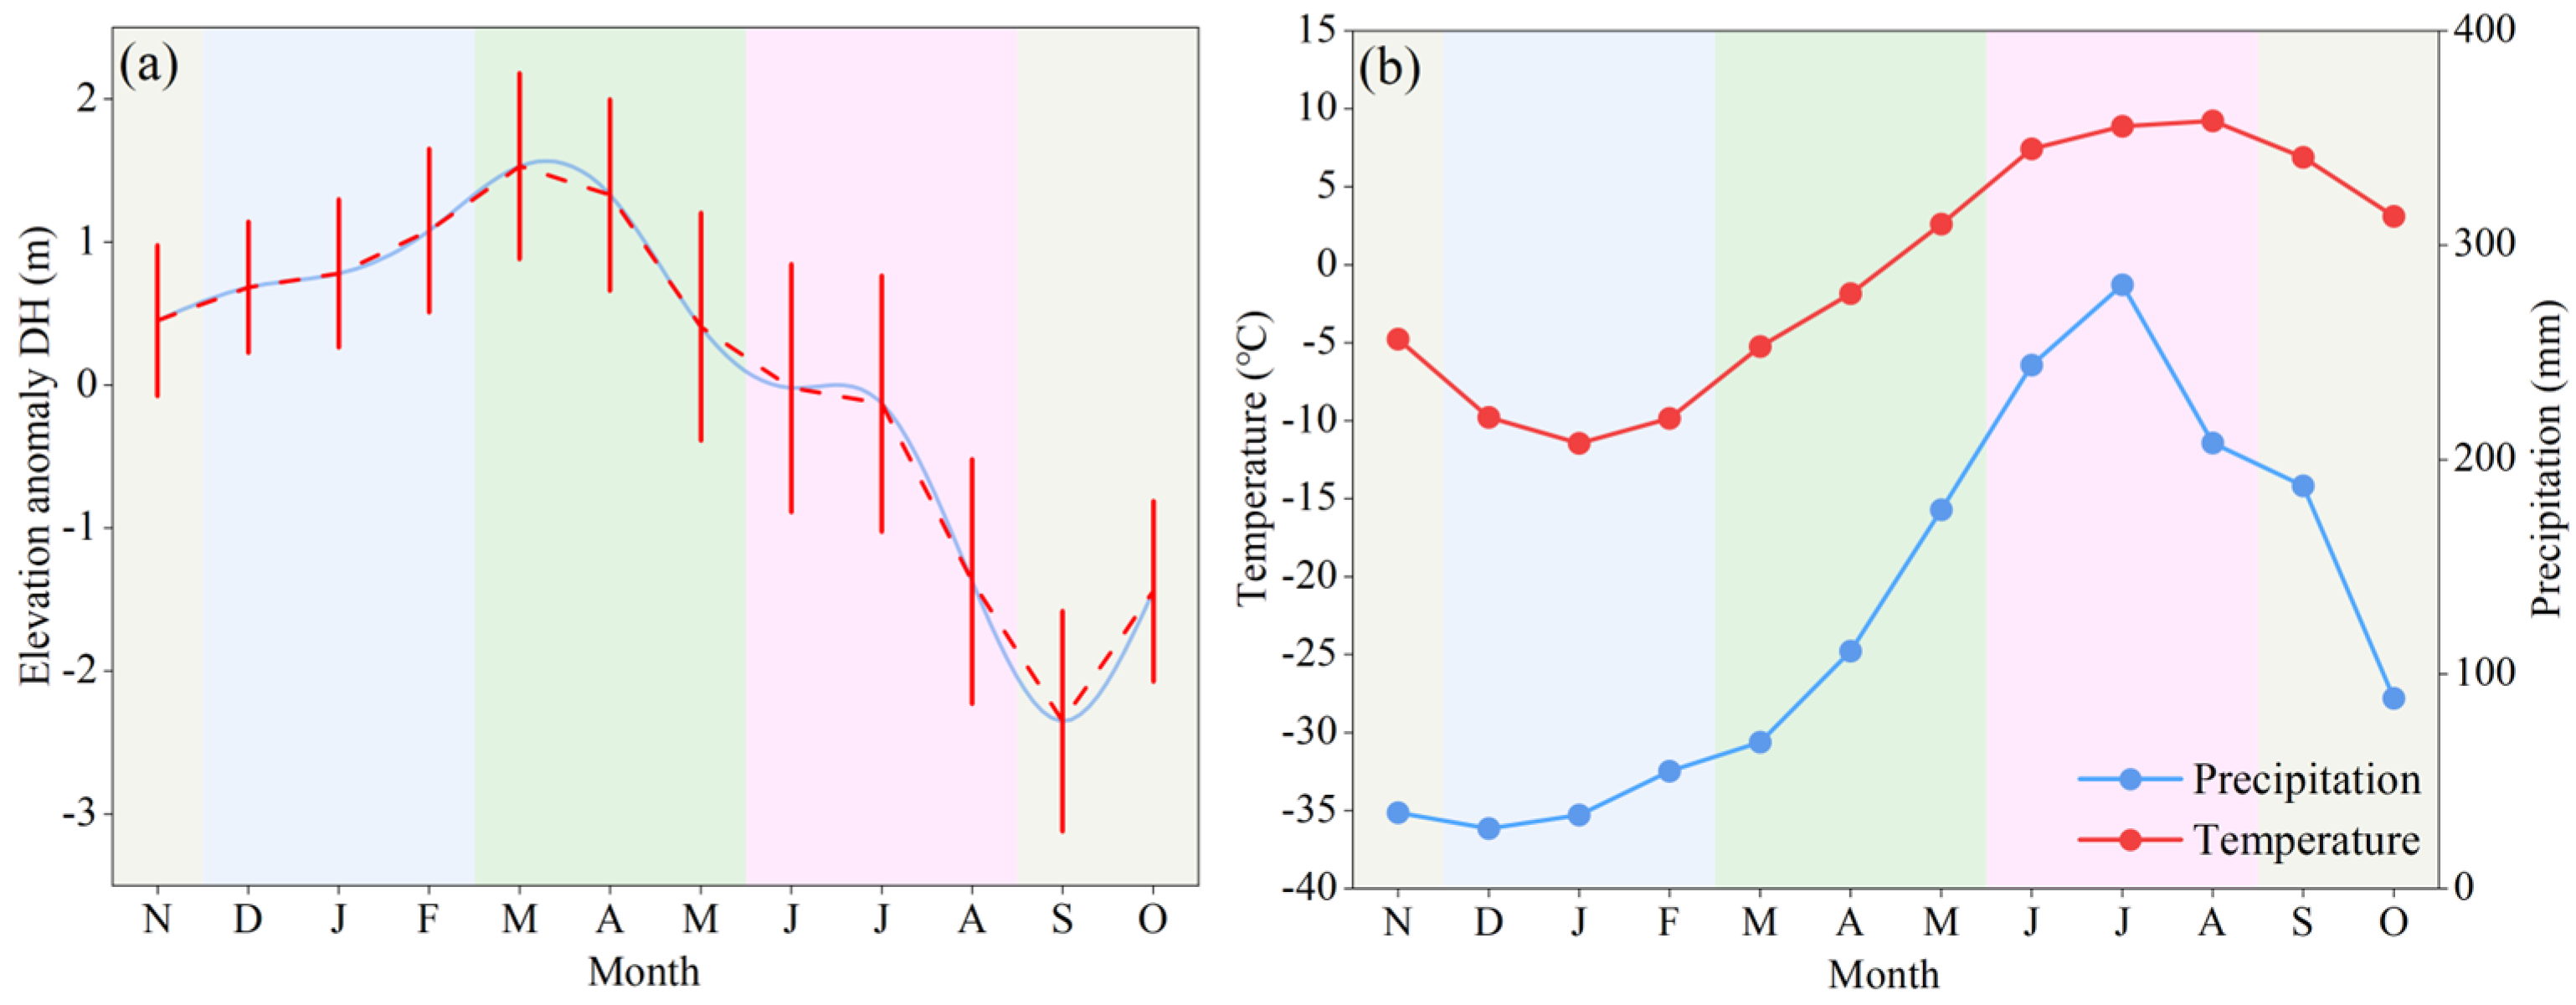
- (3)
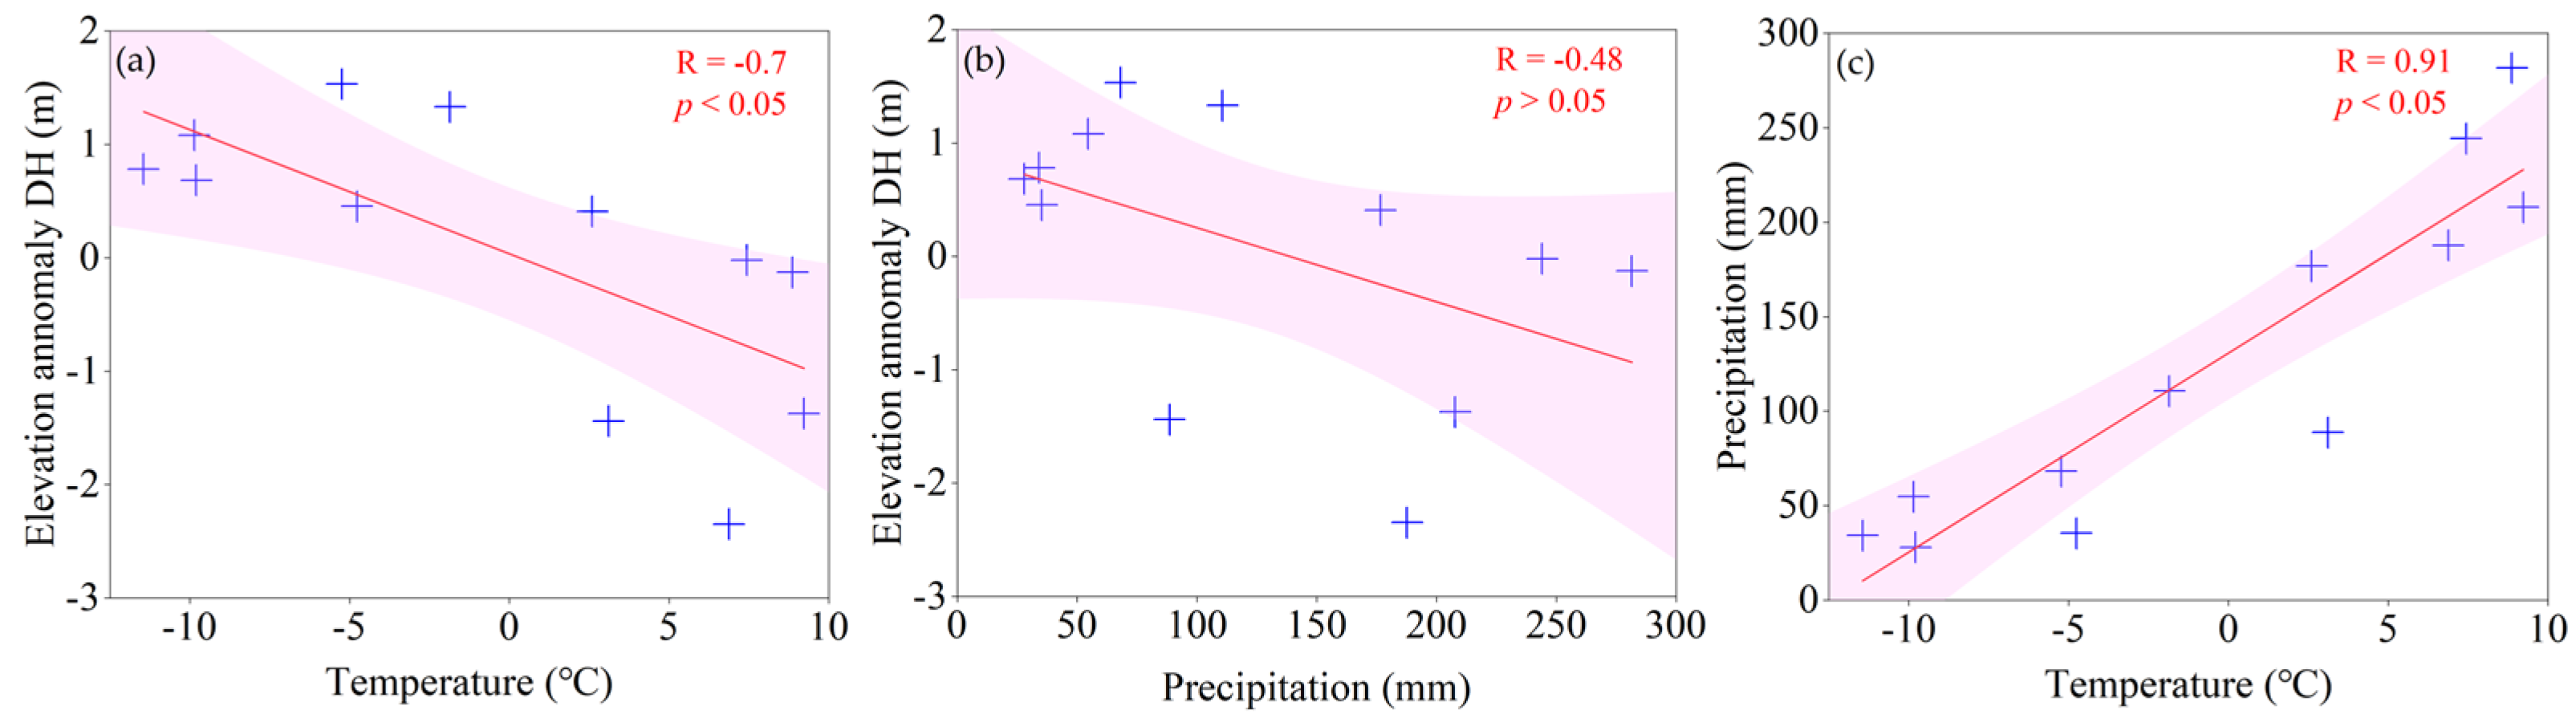
- Compared with precipitation (R = −0.48, p > 0.05), temperature (R = −0.7, p < 0.05) has a stronger correlation with glacier thickness change. The SETP is characterized by a decreasing trend in solid water components (glacier and snow), while liquid water components (lakes, soil moisture, and groundwater) are either maintaining equilibrium or showing an increased trend. This highlights the compensatory effect of meltwater on land-based liquid water.
Author Contributions
Funding
Data Availability Statement
Acknowledgments
Conflicts of Interest
References
- Yao, T.; Thompson, L.; Yang, W.; Yu, W.; Gao, Y.; Guo, X.; Yang, X.; Duan, K.; Zhao, H.; Xu, B. Different glacier status with atmospheric circulations in Tibetan Plateau and surroundings. Nat. Clim. Chang. 2012, 2, 663–667. [Google Scholar] [CrossRef]
- Di, L.; Xueying, L.; Xingdong, L.; Pengfei, H.; Fanyu, Z.; Zhongkun, H.; Yiming, W.; Fuqiang, T. Remote sensing retrieval of water storage changes and underlying climatic mechanisms over the Tibetan Plateau during 2000–2020. Adv. Water Sci. 2022, 33, 375–389. [Google Scholar] [CrossRef]
- Yin, Z.; Yong, Z.; Shiyin, L.; Xin, W. Review of maritime glacier mass balance in the southeastern Tibetan Plateau. J. Glaciol. Geocryol. 2022, 44, 930–945. [Google Scholar]
- Fujita, K.; Suzuki, R.; Nuimura, T.; Sakai, A. Performance of ASTER and SRTM DEMs, and their potential for assessing glacial lakes in the Lunana region, Bhutan Himalaya. J. Glaciol. 2008, 54, 220–228. [Google Scholar] [CrossRef]
- Song, C.; Ke, L.; Huang, B.; Richards, K.S. Can mountain glacier melting explains the GRACE-observed mass loss in the southeast Tibetan Plateau: From a climate perspective? Glob. Planet. Chang. 2015, 124, 1–9. [Google Scholar] [CrossRef]
- Ninglian, W.; Tandong, Y.; Baiqing, X.; An’an, C.; Weicai, W. Spatiotemporal Pattern, Trend, and Influence of Glacier Change in Tibetan Plateau and Surroundings under Global Warming. Bull. Chin. Acad. Sci. 2019, 34, 1220–1232. [Google Scholar] [CrossRef]
- Qin, D.; Zhou, B.; Xiao, C. Progress in studies of cryospheric changes and their impacts on climate of China. J. Meteorol. Res. 2014, 28, 732–746. [Google Scholar] [CrossRef]
- Bolch, T.; Kulkarni, A.; Kääb, A.; Huggel, C.; Paul, F.; Cogley, J.G.; Frey, H.; Kargel, J.S.; Fujita, K.; Scheel, M. The state and fate of Himalayan glaciers. Science 2012, 336, 310–314. [Google Scholar] [CrossRef] [PubMed]
- Yao, T.; Xue, Y.; Chen, D.; Chen, F.; Thompson, L.; Cui, P.; Koike, T.; Lau, W.K.-M.; Lettenmaier, D.; Mosbrugger, V. Recent third pole’s rapid warming accompanies cryospheric melt and water cycle intensification and interactions between monsoon and environment: Multidisciplinary approach with observations, modeling, and analysis. Bull. Am. Meteorol. Soc. 2019, 100, 423–444. [Google Scholar] [CrossRef]
- Lee, H.; Calvin, K.; Dasgupta, D.; Krinner, G.; Mukherji, A.; Thorne, P.; Trisos, C.; Romero, J.; Aldunce, P.; Barrett, K. Climate Change 2023: Synthesis Report. Contribution of Working Groups I, II and III to the Sixth Assessment Report of the Intergovernmental Panel on Climate Change; The Australian National University: Canberra, Australia, 2023. [Google Scholar]
- Immerzeel, W.W.; van Beek, L.P.H.; Bierkens, M.F.P. Climate Change Will Affect the Asian Water Towers. Science 2010, 328, 1382–1385. [Google Scholar] [CrossRef]
- Pritchard, H.D. Asia’s shrinking glaciers protect large populations from drought stress. Nature 2019, 569, 649–654. [Google Scholar] [CrossRef] [PubMed]
- Yida, X.; Feiteng, W.; Shihai, H.; Canwen, Z. Test research on slowing down glacier melting by artificial intervention: A case study of Dagu Glacier. J. Glaciol. Geocryol. 2021, 43, 1878–1887. [Google Scholar]
- Zun-lan, C.; Ping-yi, Z.; Chao, D.; Jing-jing, L. Hazards of Debris Flow due to Glacier-Lake Outburst in Southeastern Tibet. J. Glaciol. Geocryol. 2008, 30, 954–959. [Google Scholar]
- Zhou, Y.; Li, Z.; Li, J.; Zhao, R.; Ding, X. Glacier mass balance in the Qinghai–Tibet Plateau and its surroundings from the mid-1970s to 2000 based on Hexagon KH-9 and SRTM DEMs. Remote Sens. Environ. 2018, 210, 96–112. [Google Scholar] [CrossRef]
- Jansson, P.; Hock, R.; Schneider, T. The concept of glacier storage: A review. J. Hydrol. 2003, 282, 116–129. [Google Scholar] [CrossRef]
- Yi, S.; Song, C.; Heki, K.; Kang, S.; Wang, Q.; Chang, L. Satellite-observed monthly glacier and snow mass changes in southeast Tibet: Implication for substantial meltwater contribution to the Brahmaputra. Cryosphere 2020, 14, 2267–2281. [Google Scholar] [CrossRef]
- Shi, Y.; Liu, S. Estimation on the response of glaciers in China to the global warming in the 21st century. Chin. Sci. Bull. 2000, 45, 668–672. [Google Scholar] [CrossRef]
- Yang, W.; Guo, X.; Yao, T.; Zhu, M.; Wang, Y. Recent accelerating mass loss of southeast Tibetan glaciers and the relationship with changes in macroscale atmospheric circulations. Clim. Dyn. 2016, 47, 805–815. [Google Scholar] [CrossRef]
- Brun, F.; Berthier, E.; Wagnon, P.; Kääb, A.; Treichler, D. A spatially resolved estimate of High Mountain Asia glacier mass balances from 2000 to 2016. Nat. Geosci. 2017, 10, 668–673. [Google Scholar] [CrossRef] [PubMed]
- Maurer, J.M.; Schaefer, J.; Rupper, S.; Corley, A. Acceleration of ice loss across the Himalayas over the past 40 years. Sci. Adv. 2019, 5, eaav7266. [Google Scholar] [CrossRef] [PubMed]
- Gao, J.; Du, J.; Yixi, Z. Forewarning Model for Glacial Lake Outburst in Southeast Tibet. Appl. Sci. 2023, 13, 1797. [Google Scholar] [CrossRef]
- Rounce, D.R.; Hock, R.; Shean, D.E. Glacier Mass Change in High Mountain Asia Through 2100 Using the Open-Source Python Glacier Evolution Model (PyGEM). Front. Earth Sci. 2020, 7, 331. [Google Scholar] [CrossRef]
- Yang, W.; Yao, T.; Xu, B.; Wu, G.; Ma, L.; Xin, X. Quick ice mass loss and abrupt retreat of the maritime glaciers in the Kangri Karpo Mountains, southeast Tibetan Plateau. Chin. Sci. Bull. 2008, 53, 2547–2551. [Google Scholar] [CrossRef]
- Wang, Q.; Yi, S.; Sun, W. Continuous estimates of glacier mass balance in high mountain Asia based on ICESat-1, 2 and GRACE/GRACE follow-on data. Geophys. Res. Lett. 2021, 48, e2020GL090954. [Google Scholar] [CrossRef]
- Liu, L.; Jiang, L.; Jiang, H.; Wang, H.; Ma, N.; Xu, H. Accelerated glacier mass loss (2011–2016) over the Puruogangri ice field in the inner Tibetan Plateau revealed by bistatic InSAR measurements. Remote Sens. Environ. 2019, 231, 111241. [Google Scholar] [CrossRef]
- Wu, K.; Liu, S.; Jiang, Z.; Xu, J.; Wei, J.; Guo, W. Recent glacier mass balance and area changes in the Kangri Karpo Mountains from DEMs and glacier inventories. Cryosphere 2018, 12, 103–121. [Google Scholar] [CrossRef]
- Cao, B.; Pan, B.; Wen, Z.; Guan, W.; Li, K. Changes in glacier mass in the Lenglongling Mountains from 1972 to 2016 based on remote sensing data and modeling. J. Hydrol. 2019, 578, 124010. [Google Scholar] [CrossRef]
- Ren, S.; Menenti, M.; Jia, L.; Zhang, J.; Zhang, J.; Li, X. Glacier mass balance in the Nyainqentanglha Mountains between 2000 and 2017 retrieved from ZiYuan-3 stereo images and the SRTM DEM. Remote Sens. 2020, 12, 864. [Google Scholar] [CrossRef]
- Long, D.; Shen, Y.; Sun, A.; Hong, Y.; Longuevergne, L.; Yang, Y.; Li, B.; Chen, L. Drought and flood monitoring for a large karst plateau in Southwest China using extended GRACE data. Remote Sens. Environ. 2014, 155, 145–160. [Google Scholar] [CrossRef]
- Sun, Z.; Long, D.; Yang, W.; Li, X.; Pan, Y. Reconstruction of GRACE data on changes in total water storage over the global land surface and 60 basins. Water Resour. Res. 2020, 56, e2019WR026250. [Google Scholar] [CrossRef]
- Jiao, J. Mass Transports in the Tibetan Plateau and Fennoscandia Revealed by Satellite Gravimetry. Ph.D. Thesis, Chang’an University, Xi’an, China, 2020. [Google Scholar]
- He, M.; Li, Z.; Jiang, W.; Pan, Y.; Jiao, J.; Xiao, Y. Seasonal and Interannual Fluctuations of Glacier Mass balance and Climate Response Processes on the Tibetan Plateau Based on GRACE/GRACE-FO. IEEE Trans. Geosci. Remote Sens. 2023, 61, 4301709. [Google Scholar] [CrossRef]
- Kääb, A.; Berthier, E.; Nuth, C.; Gardelle, J.; Arnaud, Y. Contrasting patterns of early twenty-first-century glacier mass change in the Himalayas. Nature 2012, 488, 495–498. [Google Scholar] [CrossRef] [PubMed]
- Gardelle, J.; Berthier, E.; Arnaud, Y.; Kääb, A. Region-wide glacier mass balances over the Pamir-Karakoram-Himalaya during 1999–2011. Cryosphere 2013, 7, 1263–1286. [Google Scholar] [CrossRef]
- Kääb, A.; Treichler, D.; Nuth, C.; Berthier, E. Brief Communication: Contending estimates of 2003–2008 glacier mass balance over the Pamir–Karakoram–Himalaya. Cryosphere 2015, 9, 557–564. [Google Scholar] [CrossRef]
- Treichler, D.; Kääb, A. ICESat laser altimetry over small mountain glaciers. Cryosphere 2016, 10, 2129–2146. [Google Scholar] [CrossRef]
- Smith, B.; Fricker, H.A.; Gardner, A.S.; Medley, B.; Nilsson, J.; Paolo, F.S.; Holschuh, N.; Adusumilli, S.; Brunt, K.; Csatho, B. Pervasive ice sheet mass loss reflects competing ocean and atmosphere processes. Science 2020, 368, 1239–1242. [Google Scholar] [CrossRef] [PubMed]
- Yao, T.; Pu, J.; Lu, A.; Wang, Y.; Yu, W. Recent glacial retreat and its impact on hydrological processes on the Tibetan Plateau, China, and surrounding regions. Arct. Antarct. Alp. Res. 2007, 39, 642–650. [Google Scholar] [CrossRef]
- Consortium, R. Randolph Glacier Inventory—A Dataset of Global Glacier Outlines, Version 6 [Dataset]; National Snow and Ice Data Center: Boulder, CO, USA, 2017. [Google Scholar]
- Zhao, F.; Long, D.; Li, X.; Huang, Q.; Han, P. Rapid glacier mass loss in the Southeastern Tibetan Plateau since the year 2000 from satellite observations. Remote Sens. Environ. 2022, 270, 112853. [Google Scholar] [CrossRef]
- Xu, Z.; Gong, T.; Li, J. Decadal trend of climate in the Tibetan Plateau—Regional temperature and precipitation. Hydrol. Process. Int. J. 2008, 22, 3056–3065. [Google Scholar] [CrossRef]
- Li, C.; Jiang, L.; Liu, L.; Wang, H. Regional and altitude-dependent estimate of the SRTM C/X-band radar penetration difference on High Mountain Asia glaciers. IEEE J. Sel. Top. Appl. Earth Obs. Remote Sens. 2021, 14, 4244–4253. [Google Scholar] [CrossRef]
- Scanlon, B.R.; Zhang, Z.; Save, H.; Wiese, D.N.; Landerer, F.W.; Long, D.; Longuevergne, L.; Chen, J. Global evaluation of new GRACE mascon products for hydrologic applications. Water Resour. Res. 2016, 52, 9412–9429. [Google Scholar] [CrossRef]
- Chen, J.; Wilson, C.; Tapley, B.; Save, H.; Cretaux, J.F. Long-term and seasonal Caspian Sea level change from satellite gravity and altimeter measurements. J. Geophys. Res. Solid Earth 2017, 122, 2274–2290. [Google Scholar] [CrossRef]
- Chen, J.; Wilson, C.; Li, J.; Zhang, Z. Reducing leakage error in GRACE-observed long-term ice mass change: A case study in West Antarctica. J. Geod. 2015, 89, 925–940. [Google Scholar] [CrossRef]
- Jiao, J.; Zhang, Y.; Bilker-Koivula, M.; Poutanen, M.; Yin, P.; Zhang, Y. Interannual glacier and lake mass changes over Scandinavia from GRACE. Geophys. J. Int. 2020, 221, 2126–2141. [Google Scholar] [CrossRef]
- Bi, H.; Ma, J.; Zheng, W.; Zeng, J. Comparison of soil moisture in GLDAS model simulations and in situ observations over the Tibetan Plateau. J. Geophys. Res. Atmos. 2016, 121, 2658–2678. [Google Scholar] [CrossRef]
- Huang, J.; van den Dool, H.M.; Georgarakos, K.P. Analysis of model-calculated soil moisture over the United States (1931–1993) and applications to long-range temperature forecasts. J. Clim. 1996, 9, 1350–1362. [Google Scholar] [CrossRef]
- Chen, M.; Xie, P.; Janowiak, J.E.; Arkin, P.A. Global land precipitation: A 50-yr monthly analysis based on gauge observations. J. Hydrometeorol. 2002, 3, 249–266. [Google Scholar] [CrossRef]
- Fan, Y.; Van den Dool, H. A global monthly land surface air temperature analysis for 1948–present. J. Geophys. Res. Atmos. 2008, 113, D01103. [Google Scholar] [CrossRef]
- Döll, P.; Müller Schmied, H.; Schuh, C.; Portmann, F.T.; Eicker, A. Global-scale assessment of groundwater depletion and related groundwater abstractions: Combining hydrological modeling with information from well observations and GRACE satellites. Water Resour. Res. 2014, 50, 5698–5720. [Google Scholar] [CrossRef]
- Herbert, C.; Döll, P. Global assessment of current and future groundwater stress with a focus on transboundary aquifers. Water Resour. Res. 2019, 55, 4760–4784. [Google Scholar] [CrossRef]
- Adler, R.F.; Huffman, G.J.; Chang, A.; Ferraro, R.; Xie, P.-P.; Janowiak, J.; Rudolf, B.; Schneider, U.; Curtis, S.; Bolvin, D. The version-2 global precipitation climatology project (GPCP) monthly precipitation analysis (1979–present). J. Hydrometeorol. 2003, 4, 1147–1167. [Google Scholar] [CrossRef]
- Sun, F.; He, B.; Liu, C.; Zeng, Y. Comparison of Hydrological Patterns between Glacier-Fed and Non-Glacier-Fed Lakes on the Southeastern Tibetan Plateau. Remote Sens. 2021, 13, 4024. [Google Scholar] [CrossRef]
- Wang, Q.; Sun, W. Seasonal Cycles of High Mountain Asia Glacier Surface Elevation Detected by ICESat-2. J. Geophys. Res. Atmos. 2022, 127, e2022JD037501. [Google Scholar] [CrossRef]
- Handuo, T.; Yangzong, C.; Chen, Z.; Fan, Z. Characteristics of the lake water level changes and influencing factors in Yamzhog Yumco in Tibet from 1974 to 2019. J. Arid. Land Resour. Environ. 2021, 35, 83–89. [Google Scholar] [CrossRef]
- Neckel, N.; Kropáček, J.; Bolch, T.; Hochschild, V. Glacier mass changes on the Tibetan Plateau 2003–2009 derived from ICESat laser altimetry measurements. Environ. Res. Lett. 2014, 9, 014009. [Google Scholar] [CrossRef]
- Jakob, L.; Gourmelen, N.; Ewart, M.; Plummer, S. Spatially and temporally resolved ice loss in High Mountain Asia and the Gulf of Alaska observed by CryoSat-2 swath altimetry between 2010 and 2019. Cryosphere 2021, 15, 1845–1862. [Google Scholar] [CrossRef]
- Zhen, T.; Zhi-qiang, Y.; Shi-di, W. Moment Deficits on the Major Faults And Earthquake Hazard Assessment in the Eastern Himalayan Syntaxis. Seismol. Geol. 2020, 42, 33–49. [Google Scholar]
- Tian, Z.; Freymueller, J.T.; Yang, Z. Spatio-temporal variations of afterslip and viscoelastic relaxation following the Mw 7.8 Gorkha (Nepal) earthquake. Earth Planet. Sci. Lett. 2020, 532, 116031. [Google Scholar] [CrossRef]
- Jiao, J.; Zhang, Y.; Yin, P.; Zhang, K.; Wang, Y.; Bilker-Koivula, M. Changing Moho Beneath the Tibetan plateau revealed by GRACE observations. J. Geophys. Res. Solid Earth 2019, 124, 5907–5923. [Google Scholar] [CrossRef]
- Xiang, L.; Wang, H.; Steffen, H.; Wu, P.; Jia, L.; Jiang, L.; Shen, Q. Groundwater storage changes in the Tibetan Plateau and adjacent areas revealed from GRACE satellite gravity data. Earth Planet. Sci. Lett. 2016, 449, 228–239. [Google Scholar] [CrossRef]
- Feng, S.Y.; Song, Z.X. Climate change impacts on surface water resources in northwest arid area and the future trend. Sci. Sin. (Chim.) 1995, 25, 968–977. (In Chinese) [Google Scholar]
- Kunpeng, W.; Shiyin, L.; Wanqin, G. Glacier variation and its response to climate change in the Mount Namjagbarwa from 1980 to 2015. J. Glaciol. Geocryol. 2020, 42, 1115–1125. [Google Scholar]
- Yang, W.; Yao, T.; Guo, X.; Zhu, M.; Li, S.; Kattel, D.B. Mass balance of a maritime glacier on the southeast Tibetan Plateau and its climatic sensitivity. J. Geophys. Res. Atmos. 2013, 118, 9579–9594. [Google Scholar] [CrossRef]
- Sturm, M.; Holmgren, J. Differences in compaction behavior of three climate classes of snow. Ann. Glaciol. 1998, 26, 125–130. [Google Scholar] [CrossRef]
- Jouberton, A.; Shaw, T.E.; Miles, E.; McCarthy, M.; Fugger, S.; Ren, S.; Dehecq, A.; Yang, W.; Pellicciotti, F. Warming-induced monsoon precipitation phase change intensifies glacier mass loss in the southeastern Tibetan Plateau. Proc. Natl. Acad. Sci. USA 2022, 119, e2109796119. [Google Scholar] [CrossRef]
- Cogley, J.G.; Arendt, A.; Bauder, A.; Braithwaite, R.; Hock, R.; Jansson, P.; Kaser, G.; Moller, M.; Nicholson, L.; Rasmussen, L. Glossary of Glacier Mass Balance and Related Terms; International Hydrological Programme: Paris, Fance, 2010. [Google Scholar]
- Yang, W.; Zhao, C.; Westoby, M.; Yao, T.; Wang, Y.; Pellicciotti, F.; Zhou, J.; He, Z.; Miles, E. Seasonal dynamics of a temperate Tibetan glacier revealed by high-resolution UAV photogrammetry and in situ measurements. Remote Sens. 2020, 12, 2389. [Google Scholar] [CrossRef]

Disclaimer/Publisher’s Note: The statements, opinions and data contained in all publications are solely those of the individual author(s) and contributor(s) and not of MDPI and/or the editor(s). MDPI and/or the editor(s) disclaim responsibility for any injury to people or property resulting from any ideas, methods, instructions or products referred to in the content. |
© 2024 by the authors. Licensee MDPI, Basel, Switzerland. This article is an open access article distributed under the terms and conditions of the Creative Commons Attribution (CC BY) license (https://creativecommons.org/licenses/by/4.0/).
Share and Cite
Tong, J.; Shi, Z.; Jiao, J.; Yang, B.; Tian, Z. Glacier Mass Balance and Its Impact on Land Water Storage in the Southeastern Tibetan Plateau Revealed by ICESat-2 and GRACE-FO. Remote Sens. 2024, 16, 1048. https://doi.org/10.3390/rs16061048
Tong J, Shi Z, Jiao J, Yang B, Tian Z. Glacier Mass Balance and Its Impact on Land Water Storage in the Southeastern Tibetan Plateau Revealed by ICESat-2 and GRACE-FO. Remote Sensing. 2024; 16(6):1048. https://doi.org/10.3390/rs16061048
Chicago/Turabian StyleTong, Jinwei, Zhen Shi, Jiashuang Jiao, Bing Yang, and Zhen Tian. 2024. "Glacier Mass Balance and Its Impact on Land Water Storage in the Southeastern Tibetan Plateau Revealed by ICESat-2 and GRACE-FO" Remote Sensing 16, no. 6: 1048. https://doi.org/10.3390/rs16061048
APA StyleTong, J., Shi, Z., Jiao, J., Yang, B., & Tian, Z. (2024). Glacier Mass Balance and Its Impact on Land Water Storage in the Southeastern Tibetan Plateau Revealed by ICESat-2 and GRACE-FO. Remote Sensing, 16(6), 1048. https://doi.org/10.3390/rs16061048