Article

Spectral Signatures of Macroalgae on Hawaiian Reefs

by
Kimberly Fuller
1,2,
Roberta E. Martin
1,3 and
Gregory P. Asner
1,3,*
1
Center for Global Discovery and Conservation Science, Arizona State University, Hilo, HI 96720, USA
2
Hawaiʻi Department of Land and Natural Resources, Division of Aquatic Resources, Honolulu, HI 96813, USA
3
School of Ocean Futures, Arizona State University, Hilo, HI 96720, USA
*
Author to whom correspondence should be addressed.
Remote Sens. 2024, 16(7), 1140; https://doi.org/10.3390/rs16071140
Submission received: 16 February 2024 / Revised: 17 March 2024 / Accepted: 23 March 2024 / Published: 25 March 2024
(This article belongs to the Section Ocean Remote Sensing)

Abstract

:
In Hawaiʻi, native macroalgae or “limu” are of ecological, cultural, and economic value. Invasive algae threaten native macroalgae and coral, which serve a key role in the reef ecosystem. Spectroscopy can be a valuable tool for species discrimination, while simultaneously providing insight into chemical processes occurring within photosynthetic organisms. The spectral identity and separability of Hawaiian macroalgal taxonomic groups and invasive and native macroalgae are poorly known and thus were the focus of this study. A macroalgal spectroscopic library of 30 species and species complexes found in Hawaiʻi was created. Spectral reflectance signatures were aligned with known absorption bands of taxonomic division-specific photosynthetic pigments. Quadratic discriminant analysis was used to explore if taxonomic groups of algae and native versus invasive algae could be classified spectrally. Algae were correctly classified based on taxonomic divisions 96.5% of the time and by species 83.2% of the time. Invasive versus native algae were correctly classified at a rate of 93% and higher, although the number of invasive algal species tested was limited. Analyses suggest that there is promise for the spectral separability of algae investigated in this study by algal taxonomic divisions and native-invasive status. This study created a spectral library that lays the groundwork for testing the spectral mapping of algae using current airborne and forthcoming spaceborne imaging spectroscopy, which could have significant implications for coastal management.

1. Introduction

Hawaiʻi’s native marine macroalgae or “limu” have ecological, economic, and cultural value. Limu are an integral part of coral reefs, provide key food sources for many marine organisms, and enrich nearshore fisheries [1,2]. Limu are also an important part of the diet of local communities and are key in certain native Hawaiian ceremonies [1,2,3,4]. Both native algae and coral are biocultural keystone organisms that compete for space on the reef surface but in healthy systems, the two lifeforms are usually well-balanced. Healthy coral-dominated reefs generally have low macroalgal cover, with algae present in areas where herbivores (fish and sea urchins) cannot easily reach them [2,5]. There are also instances of natural and healthy native algae-dominated reefs with low coral cover [6]. Two important factors that can cause a coral-dominated or macroalgae-dominated habitat are herbivore activity and nutrient levels [7,8,9,10]. Anthropogenic activities have changed these drivers by decreasing herbivory with fishing pressure and increasing nutrients with land-based sources of pollution [1,5,7]. These human-mediated alterations have resulted in dramatic ecosystem-level regime shifts from coral to macroalgae-dominated benthic composition [5].
Invasive macroalgae compound other anthropogenic stressors on coral reefs and native algae. Invasive macroalgae are non-native algae that have been introduced to native ecosystems, often causing detrimental impacts. They typically adapt well to habitats degraded by human activity, grow quickly, and are less desired by herbivorous fish than native algae [2,5,11,12]. These characteristics allow invasive algae to overgrow and kill corals and outcompete native algae, reducing diversity by creating monocultures [2,5,11,12]. Invasive algae are capable of creating harmful benthic phase shifts from coral to algae-dominated systems and in some cases from sand to mud [5,11,12,13].
Algae can be grouped taxonomically into divisions based on a combination of color differences that demonstrate underlying differences in photosynthetic pigments and physical attributes. These divisions include red (Rhodophyta), green (Chlorophyta), brown (Ochrophyta), and blue–green algae or cyanobacteria (Cyanophyta). As primary producers, algae have photosynthetic pigments that allow them to harvest sunlight to synthesize chemical energy. The taxonomic algal divisions have characteristic pigments and some divisions have pigments unique to those divisions. Green algae uniquely contain Chlorophyll b (Chl b), whereas brown uniquely contains Chlorophyll c (Chl c) [2,14]. Both cyanobacteria and red algae contain photosynthetic accessory pigments phycocyanin and phycoerythrin [2,14]. These photosynthetic pigments absorb light in the visible spectrum [14], thereby creating spectral reflectance signatures. Because the different algal taxonomic divisions have characteristic photosynthetic pigments and these pigments are expressed differently in spectra, different species are likely to have characteristic spectral signatures [2,14].
Several studies have indicated that marine macroalgae can be spectrally separable by taxonomic division [14,15,16]. A step further would be to spectrally identify algae species, which has been accomplished in terrestrial plants [17]. Algal taxonomic groups could have specific adaptations that allow them to survive in certain habitats that are expressed in their spectral signatures. Invasive algae, which are known to grow quickly and outcompete native algae, may show spectral characteristics that differ from native algae. Asner et al. [18] found that terrestrial native and introduced species could be delineated using a combination of canopy reflectance from 1125–2500 nm along with pigment-related absorption features (reflectance derivatives) in the 400–700 nm range. We are unaware of any studies on invasive and native macroalgal spectral separability.
To date, 519 species of red (355), green (102), and brown (62) marine algae and 7 cyanobacteria have been described in the Hawaiian Islands [2,19]. Approximately 20 species of invasive marine algae have been introduced to Hawaiʻi since the 1950s and at least one quarter are considered to be invasive [5,19,20,21,22]. Most invasive algae in Hawaiʻi belong to the red division and a few belong to the green division. The division names associated with the taxonomic classification of algae may suggest color categorization but intraspecific variation in visible color within taxonomic divisions can be large.
Spectral differentiation of algae is requisite to future classification methods derived from optical remote sensing. While traditional field studies produce detailed information, they often are inadequate to survey large ecological areas [23]. When paired with field studies, remote sensing may provide a comprehensive solution to surveying large areas. Recently, remote sensing has been used in the nearshore environment. Several studies have mapped rugosity to a 22 m depth and live coral distribution to a 16 m depth using imaging spectroscopy of nearshore marine environments in the Hawaiian Islands [24,25,26,27]. Hawaiian corals have also been mapped to the species level in one ecosystem using imaging spectroscopy [28]. The distribution and composition of algal cover in Hawaiʻi has not yet been spectrally mapped or studied in detail. Documentation of the distribution of algal taxonomic groups and native or invasive status could support management decisions such as to prioritize areas for invasive species control or prioritize areas with valuable alga for conservation.
Here, we measured and analyzed the spectral reflectance of 30 highly representative species or species complexes of Hawaiian marine macroalgae with the aim to quantify the spectral separability of Hawaiian marine macroalgae by division and species taxonomic groups and by invasive or native status. These steps add to macroalgal spectral knowledge and establish baseline spectral data that could be used in future remote sensing applications and studies in Hawaiʻi.

2. Materials and Methods

2.1. Spectral Reflectance

Macroalgae were sampled from the shoreline and shallow reefs of Miloliʻi and Pāpā Bays on Hawaiʻi Island and Maunalua and Kāneʻohe Bays on Oʻahu Island, Hawaiʻi, USA. The habitats of the algae sampled ranged from intertidal to subtidal, with a maximum collection depth of 10.6 m. Spectral signatures were collected in June and July of 2021 and July and August of 2022. Algal samples were identified to the finest taxonomic level possible using the best morphological data available. For the few samples that could not be identified to the species level without further analysis, descriptive names were used in place of genus and species.
Spectroscopic readings were collected either ex situ or in situ. For ex situ measurements, algae were collected in Whirl-pak® bags with seawater and brought back to field stations close to each collection area. Algae samples were placed into a plastic tub coated with matte black paint and submerged in clean seawater to measure spectral reflectance properties. Spectral measurements were taken within 60 min of collection. Ex situ measurements were particularly helpful for intertidal species that likely could not be measured where they were growing because of shallow water depth and wave action. For in situ measurements, divers using either SCUBA or snorkeling took measurements of the algae where they were growing on the reef. In both cases, reflectance spectra were measured using an underwater spectrometer (Analytical Spectral Devices HH2-Pro) with a tungsten halogen light calibrated to the solar spectrum (Keldan Inc., Zurich, Switzerland). Reflectance was calculated from each spectral radiance measurement using a calibration panel (Spectralon®, Labsphere Inc., Durham, NH USA) by calculating the ratio between the radiance of the sample and the incident radiance.
Spectral reflectance was measured on 30 species or species complexes for a total of 604 samples (Table 1 and Table A1). Spectral samples included species from the cyanobacteria (Cyanophyta), red algae (Rhodophyta), green algae (Chlorophyta), and brown algae (Ochrophyta) divisions. Samples also included species classified as invasive, native, and with unknown biogeographic status. Turf was sampled and listed as a complex of divisions since it contains many different species of algae.

2.2. Data Processing and Analysis

Noise at the beginning and end of the spectra was trimmed, resulting in a spectral range of 427–702 nm. Spectra were averaged from 1.3 nm FWHM to 5 nm increments to mirror previous studies while retaining important spectral signature characteristics that might be lost with a broader smoothing filter [15]. The brightness index (BI) was calculated by finding the sum of the squares of the reflectance of all spectra of each signature. Brightness normalization was calculated for all spectra by dividing the reflectance at each specified wavelength by the square root of the BI and then multiplying that value by 100. Brightness normalization was used to reduce cross-spectrum brightness effects as well as overall deviations due to illumination conditions of different measurement regimes [29].
Quadratic discriminant analysis (QDA) was used to quantify our ability to spectrally distinguish algae by division and species taxonomic group, and native versus invasive status. Discriminant analysis uses known categories to identify characteristics of continuous variables that indicate membership to that category. This is a step further than simply clustering the observations using spectral similarity; QDA maximizes the differences between known categories [30]. QDA is commonly used when the within-group covariance matrices vary [30]. Because of the varying sample sizes of each category, we utilized QDA.
Three analyses were performed using all the individual spectra with the QDA categorical variables assigned as algal taxonomic divisions, algal species, and as native and invasive algae by division. Algal turf reflectance was not included in the quadratic discriminant analysis of taxonomic divisions because turf is difficult to define taxonomically and is likely to be a combination of divisions. A total of 21 species or species complexes were included in the QDA exploring species or species complex separability. Algal species that had less than 20 samples were excluded from the species QDA. We used QDA to investigate the difference in native and invasive species in the red and green divisions, the only divisions that include invasive algae in Hawaiʻi. We sampled seven invasive red algal species and only one invasive green algal species because these are the only invasive algal species we found in our surveys.
For all QDA analyses, continuous known response variables were the brightness-normalized reflectance of all the individual samples at wavelengths from 427 to 702 nm for a total of 56 continuous variables per sample used to predict the categorical classification tested. Samples were randomly assigned to training, validation (for within-model evaluation), or test sets at a rate of 60%, 20%, and 20%, respectively. A low misclassification rate shows the categorical model correctly predicting the membership of observations and indicates that there is separability of categories. The entropy R2 is the ratio of the log-likelihood difference between the full and reduced model to the log-likelihood of the reduced model and the value indicates the fit of the model, with a value of one indicating a perfect fit [30].

3. Results

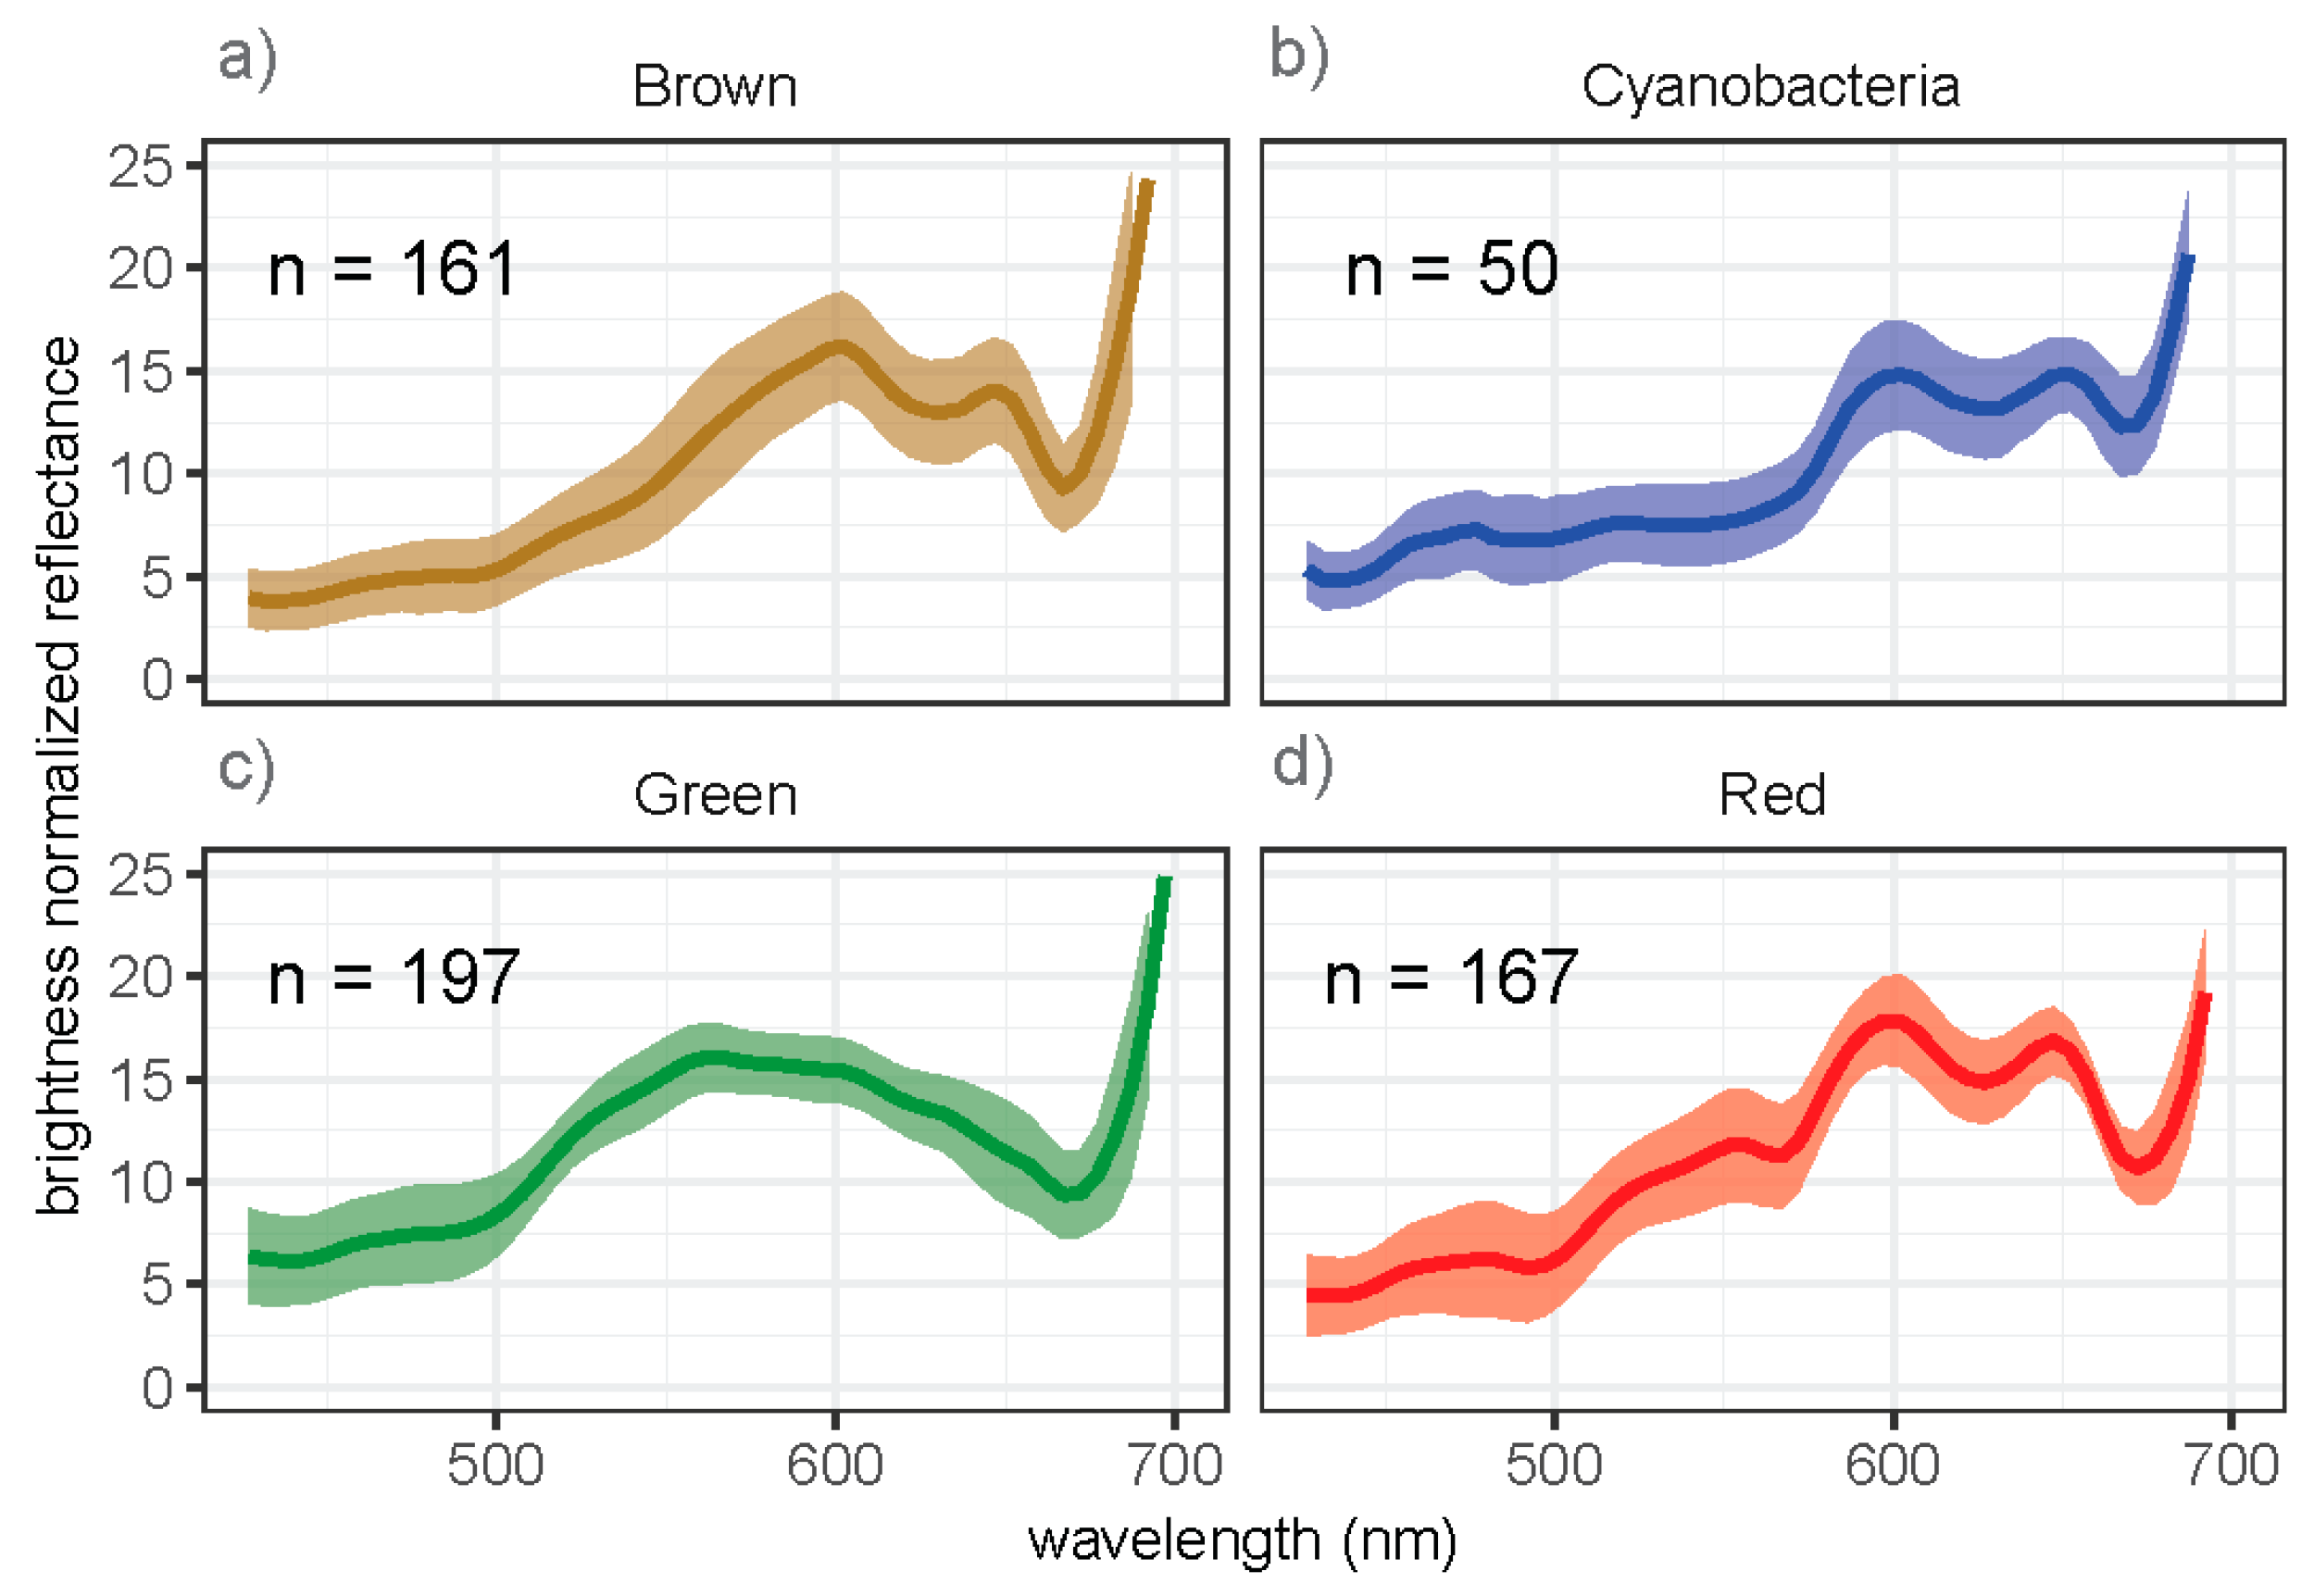
3.1. Spectral Signatures of Algae

The mean brightness-normalized spectra of each algal division displayed characteristic reflectance peaks and absorption features (Figure 1). The spectra by species can be found in Figure A1. Brown algae, red algae, and cyanobacteria had reflectance peaks around 600 nm and 650 nm. Green algae were characterized by a single reflectance peak with a local maximum located at 562 nm. A reflectance peak unique to red algae had a local maximum located at 552 nm. While the spectral signatures of species generally followed taxonomic division characteristics, there was variation between species and some characteristics apparent at the species level were muted at the mean division level. Turf algae, a complex of divisions, displayed peaks at 600 nm and 650 nm that were common to brown algae, cyanobacteria, and red algae.
Green and red algal taxonomic divisions were the only ones to contain invasive algae. The invasive and native means of those divisions are shown in Figure 2. The spectral characteristics of each taxonomic division are present in both invasive and native algae belonging to that division.
Red invasive algae had a mean reflectance higher than the native red algae in the 487–527 nm wavelength range where the standard deviation of the groups did not overlap. The mean reflectance of invasive green algae was lower than native green algae from 552–577 nm and higher than native green algae from 667–672 nm with no standard deviation overlap.

3.2. Discriminant Analyses

Quadratic discriminant analysis (QDA) with algal taxonomic divisions as known categories had low levels of misclassification, indicating pronounced spectral separability among the divisions. The QDA algal division score summaries are listed in Table 2. The training set had a misclassification rate of 0.3% and an entropy R2 = 0.95. Validation and testing sets had a higher misclassification rate of 3.5% and a lower entropy R2 of 0.23 and 0.29, respectively. This indicates that the validation and testing sets were less well fit than the training sets, but they still had a correct classification rate of this data subset at over 96%.
Brown algae and cyanobacteria were most commonly confused with each other. Brown samples were misclassified as cyanobacteria at a rate of 2.5% and cyanobacteria were misclassified as brown algae at a rate of 6%. Green algae samples were misclassified as belonging to red (0.5%) and brown (0.5%) taxonomic divisions.
Visualization of the first two canonicals (analogous to principal components) derived from the QDA analysis of spectra that provide maximum separation among groups revealed a clear multivariate spectral clustering of different taxonomic divisions, while illustrating a slight overlap between divisions (Figure 3). Cyanobacteria were clustered in the middle of the other three clusters and were most misclassified as brown algae in the algal division QDA. The canonical scatterplot matrices with canonicals 1–3 are shown in Figure A2.
QDA showed a low percentage of misclassification for the training set (1.7%) and an entropy R2 (0.98) close to one (Table 3). Validation and test sets had a higher rate of misclassification at 16.8% and 16.7%, respectively. The validation and test sets had entropy R2 values that were negative and indicated a less fit model.
The taxonomic divisions with the highest rates of misclassifications of the species within them were brown algae (15.3%) and cyanobacteria (16%), indicating a correct classification rate of 84% or higher. The five algal species with the highest misclassification rates were also either brown algae or cyanobacteria. Brown algae Sargassum echinocarpum (41.6%) and Lobophora variegata (26.7%) were the most misclassified species. Cyanobacteria Symploca hydnoides (20%), brown alga Dictyota acutiloba (13.8%), and cyanobacteria Leptolyngbya crosbyana (12%) misclassification rates followed. Brown algae species were most misclassified as other species of brown algae (8.9%) but were also misclassified as turf and species in the other three divisions. Cyanobacteria were mostly misclassified as turf (6%) but were also misclassified as other species of cyanobacteria as well as species belonging to the brown and red taxonomic divisions.
Turf and red algae species had mid-level misclassification rates, with a correct classification rate of 93% or higher. Turf was misclassified (6.9%) as a species belonging to red and brown algal taxonomic divisions. Species in the red algae division that were misclassified (5.2%) were primarily invasive algae. Red algae were misclassified as other species of red algae, cyanobacteria, and brown algae. All red invasive algae were misclassified as native species.
The taxonomic division with the lowest misclassification rate of species was the green division (1.1%). The two algae with the lowest misclassification rates are the green invasive alga Avrainvillea lacerata (3.1%) and the green native alga Dictyosphaeria versluysii (3.3%). Both species were misclassified once as green alga Halimeda opuntina. No other green algae species were misclassified but brown alga Sargassum echinocarpum was misclassified once as green invasive alga Avrainvillea lacerata (4.2%).
Almost half of the misclassifications were species misclassified as different species of the same division (47.8%) and 20.5% of the misclassifications involved turf, which likely has species of more than one division. Invasive algae were misclassified 6.8% of the time and made up 18.2% of the misclassifications. All invasive algae misclassifications were classified as native species and only one native alga was misclassified as invasive. Native algae were misclassified at a rate of 7.9% and made up 77.3% of the misclassifications. Misclassified species were most classified as one of four species: cyanobacteria Symploca hydnoides, turf, brown algae Turbinaria ornata, and red algae Dichotomaria marginata.

3.3. Spectral Separability of Invasive and Native Algae

QDA with invasive and native algae as known categories had a very low rate of misclassification within the division (Table 4), with only one sample of native green algae misclassified as an invasive green algae. No other misclassifications occurred and all entropy R2 values were 1 except for the green algae validation set with an entropy R2 of 0.65. An entropy R2 value of one indicates a perfectly fit model. Only one invasive green algal species was present in this study with 32 representative individuals collected throughout Maunalua Bay, Oahu, HI (Table A1).

4. Discussion

4.1. Spectral Separability of Algae by Taxonomic Division

We created a well-calibrated spectral reflectance library of 30 Hawaiian marine macroalgae species or species complexes. Spectral reflectance patterns of algal taxonomic divisions followed characteristics observed in previous studies and lined up with absorption bands of photosynthetic pigments characteristic to the divisions [14,15,16]. All algal taxonomic division spectral signatures had an absorption well with a minimum reflectance at 667–672 nm that corresponds to chlorophyll (Chl) a [14]. Chl a is common across all algal taxonomic divisions. Brown algae, cyanobacteria, and red algae divisions had reflectance peaks at 600 nm and 650 nm and green had a singular peak around 560 nm in agreement with findings from previous studies [14,15,16]. These characteristic reflectance peaks are due to the different photosynthetic pigments present in each division.
The brown algal division is the only division known to contain Chl c and the characteristic absorbance well with a local minimum at 632 nm we observed corresponds to the absorption of that pigment [14,15]. While the brown algal division mean spectral signature does not show peaks around 570 nm found in previous studies, most of the brown algae species means showed peaks in that area (Figure A1) [15,16]. The 570 nm peak in brown algae could be indicative of absorption by Chl c in the 582–596 nm range [14]. The muted peak at 570 nm found here may indicate that Chl c is not as active in these wavelengths for some brown algae species in this dataset or reflect the additive effect of all the photosynthetic components expressed.
Red algae and cyanobacteria have similar reflectance peaks as brown algae with local maxima at 600 nm and 650 nm. However, the photosynthetic pigments responsible for these peaks likely differ. Unlike brown algae, red algae and cyanobacteria do not contain Chl c. They both contain phycocyanin, which brown algae lack, that is associated with reflectance peaks at 600 nm and 650 nm. Phycocyanin has an absorption band at 608–628 nm, which could account for the absorbance well minimum at 627 nm observed in cyanobacteria and red algae [2,14]. Both cyanobacteria and red algae showed an absorbance well at 492 nm associated with phycoerythrin [14,15]. Red algae showed a unique peak at 552 nm linked to an absorbance well at 567 nm that corresponds to phycoerythrin absorption at 556–581 nm [14]. Douay et al. [16] found a peak unique to red algae with a local maximum at 515 nm that we did not observe in our red division signature that may be tied to phycoerythrin absorption at 492–506 nm and 537–549 nm. However, some of the red algae species signatures did demonstrate a peak at 515 nm. While spectral absorptions known to be associated with individual pigments may provide insight into observed spectral signatures, the additive effect of all the photosynthetic components expressed can have a significant impact on reflectance. Future studies could focus on the convolved effects of multiple chemicals on macroalgal reflectances.
Visual inspection of these division signatures indicates a clear distinction between the green division and the three other divisions. Likewise, the red division is visually discernable because of its unique peak at 552 nm. The brown and cyanobacteria signatures are similar and may be difficult to separate simply by looking at their reflectance signatures. This illustrates the importance of using statistical analysis to differentiate between spectral signatures by division.
Quadratic discriminant analysis (QDA) with algal divisions as the categorical variables correctly classified the readings by division at a rate of 96% or higher and had a low misclassification percentage throughout training, validation, and test sets not surpassing four percent. The entropy R2 decreased in validation and test sets indicating a decrease in model fit. However, small entropy R2 values are common with discriminant models due to uncertainty in the predicted probabilities.
Brown algae and cyanobacteria were most confused with each other in the discriminant classification. Both brown algae and cyanobacteria have peaks at 600 nm and 650 nm and lack the peak unique to red found with a mean maximum located at 552 nm. These spectral similarities likely play into why they are commonly misclassified but the chemical compounds behind these matching peaks differ.
Previous algal spectral separability studies, to our knowledge, have not included cyanobacteria in the analysis. This is likely because cyanobacteria are protists, whereas the other divisions are eukaryotes. We included cyanobacteria because it is a photosynthetic benthic species that grows in the same habitat as traditional algae divisions. The cyanobacteria Lyngbya majuscula can bloom in certain conditions and cover large areas. As cyanobacteria inhabit similar niches and have spectral characteristics similar to brown algae, it is important to include cyanobacteria in future spectroscopy studies.
To explore the spectral separability of cyanobacteria, brown, green, and red algal divisions, we used QDA and known categorical data were input into the model built. We also captured intraspecific variation by inputting all measurements into the QDA instead of by species means. Douay et al. [16] and Olmedo-Masat et al. [15] did not use categorical input in their analysis of macroalgae spectral signatures and instead used multiscale bootstrap resampling and hierarchical cluster analysis as a bottom-up approach. Olmedo-Masat et al. [15] found this approach was sufficient to identify macroalgal divisions but used species medians that did not consider intraspecific variation. Douay et al. [16] found that brown and red divisions could not be differentiated with the bottom-up methodology when including intraspecific variation. Our findings indicate that it may be useful to include known categorical input into models to determine the separability of algal divisions.

4.2. Spectral Separability of Algal Species

The spectral signatures of each algal species generally displayed reflectance minima and maxima found by taxonomic division; however, there were some differences in spectral signatures among species of the same taxonomic division. This could be indicative of different levels of photosynthetic activity of certain pigments in different species belonging to the same taxonomic division. For example, Lobophora variegata was the only alga belonging to the brown division that was missing an absorption peak at 570 nm indicating that absorption is not occurring in the 582–596 nm range usually associated with Chl c in that species. L. variegata was found growing in more shaded areas of the reef than the other brown algae, which could impact its photosynthetic activity.
Classification accuracies at the species levels were lower than those at division levels. Nonetheless, species-level QDA still performed well, with an accuracy exceeding 83%. Almost half of the misclassifications were species confused with other species of the same division, likely due to similarities in photosynthetic pigments within each division. The brown algae with the highest misclassification rate, Sargassum echinocarpum, was misclassified 90% of the time as other species of brown algae that share similar color, structure, and intertidal habitat [2]. This shows that misclassification may not only be influenced by the common taxonomic division of photosynthetic pigments but also by algal structure and habitat.
Twenty percent of species misclassifications were associated with turf. Given that turf is a combination of divisions and species, it is not surprising that a high percentage of misclassifications involve turf. Turf was mostly misclassified as brown alga L. variegata. The spectral signatures of turf and L. variegata share peaks at 600 nm and 650 nm and an absorbance well minimum at 500 nm. Although L. variegata belongs to the brown algal taxonomic division, it sometimes looks red in color. The L. variegata we sampled is usually found on shaded surfaces and was found growing adjacent to the turf we sampled. Turf algae are a common component of Hawaiian reef ecosystems but their cover fraction is highly variable with estimates ranging from 5–60% [10]. The complex makeup of turf algae that may cause misclassification of species is an important consideration for reef-scale mapping using spectral signatures and warrants more study.

4.3. Spectral Separability of Native and Invasive Algae

Invasive and native algal spectral signatures demonstrated classic division characteristics but the reflectance of native and invasive algae within the same division slightly differed without standard deviation overlap (Figure 3). Invasive red algae had higher reflectance than native red algae from 487–527 nm, the wavelengths at which phycoerythrin absorbs light. This indicates that red native algae absorb more light at these wavelengths than red invasive algae. Invasive green algae reflectance was lower than the native green algae at 552–577 nm. These wavelengths correspond to the characteristic peak of green algae influenced by Chl a and Chl b. The native green algae peak maximum is at 557 nm, while the invasive green algae peak maximum is at 597 nm. Previous studies have suggested that higher absorption by Chl b will narrow and shift the peak to the shorter wavelengths suggesting native algae may contain more Chl b [15]. These trends may be the first indicators of differences in physiological processes between native and invasive algae but further investigation is warranted before any conclusions are drawn.
Native and invasive algae species were analyzed using quadratic discriminant analysis (QDA); analyzing all readings of the algal species of all four divisions as categorical variables yielded similar accuracies of 92.1% and 93.2%, respectively. Although more invasive algal species were mistakenly reported as native species than native algae species reported as invasive species, invasive algae were not misclassified at a rate higher than the native algae species. Half of the invasive algae species misclassified were classified as other species belonging to the same division, following the larger trend of species-specific QDA misclassification.
Quadratic discriminant analysis of samples with invasive and native algae as the categorical variables using readings from only red and green divisions only yielded one misclassification of a native green alga as an invasive green alga (3.1%). These results differ from QDA using all division readings of algal species with the categorical variable set as species, where 6.8% of invasive algae were misclassified as native algae and were primarily comprised of red taxonomic division misclassifications. This QDA using invasive and native algae as the categorical variable was grouped by division, so the potential for misclassification of the invasive algae as other species belonging to different divisions was excluded. Taxonomic division and native and invasive status were included in the categorical input as opposed to species which reduced the number of categorical variables. Seven invasive red species and one invasive green species were tested which could have influenced invasive and native QDA as the invasive species tested were limited. While there were misclassifications in both QDA analyses, native and invasive algae were correctly classified greater than 92% of the time.
Our results indicate that the classification of invasive and native algae is possible at the taxonomic division level. This is similar to the findings of Asner et al. [18] in which Hawaiian terrestrial native and invasive species were spectrally delineated by a combination of canopy reflectance from 1125–2500 nm and absorption features in the 400–700 nm range. Here, we only assessed the visible wavelengths for which marine spectroscopy is limited to due to water absorption of a longer wavelength energy.

5. Conclusions

We created a spectral library of 30 Hawaiian marine macroalgae species or species complexes. The algal species and division signatures generally followed the characteristics found in previous studies and were aligned with the photosynthetic pigment absorption characteristic of the divisions. Quadratic discriminant analysis (QDA) with taxonomic divisions as the categorical variables showed a high accuracy equal to or greater than 96%. Algal species QDA showed a lower accuracy rate than algal taxonomic division QDA but still amounted to over 83%. Spectral signatures of native and invasive algae followed taxonomic division characteristics and differences between native and invasive species allowed us to discriminate between these categories 93–100% of the time, although we used a limited number of invasive species to perform the analysis. The high rate of correct classification shows the promise of spectral separability of algal taxonomic divisions, algal species, and between native and invasive algae.
This study lays the groundwork for further research involving the spectral signatures of Hawaiian marine macroalgae. If algal taxonomic categories are spectrally separable with high accuracy, in situ spectral measurements could be used for the identification of those algae difficult to identify in the field. Additionally, these findings of the spectral separability of taxonomic categories and native and invasive macroalgae could be applied to airborne and satellite-based remote sensing studies in support of marine management and assessment of reef health.

Author Contributions

Conceptualization, K.F., G.P.A. and R.E.M.; methodology, K.F., G.P.A. and R.E.M.; formal analysis, K.F. and R.E.M.; investigation, K.F., G.P.A. and R.E.M.; resources, K.F., G.P.A. and R.E.M.; data curation, K.F.; writing—original draft preparation, K.F. and G.P.A.; writing—review and editing, K.F., G.P.A. and R.E.M.; funding acquisition, G.P.A. All authors have read and agreed to the published version of the manuscript.

Funding

This research was funded by the Lenfest Ocean Program GPA-2020 of Pew Trust.

Data Availability Statement

The data presented in this study are openly available in Zenodo at https://zenodo.org/records/10826300 (accessed 22 March 2024).

Conflicts of Interest

The authors declare no conflicts of interest.

Appendix A

Table A1. Information on macroalgal species included in the study.
DivisionStatusIslandSiteGenusSpeciesMethodNumber of Individuals
BrownNativeHawaiʻiMiloliʻiSargassumechinocarpumex situ23
BrownNativeHawaiʻiMiloliʻiSargassumobtusifoliumex situ24
BrownNativeHawaiʻiMiloliʻiTurbinariaornataex situ24
BrownNativeHawaiʻiPapaChrysocystisfragilisin situ24
BrownNativeHawaiʻiPapaLobophoravariegatain situ27
BrownNativeHawaiʻiPapaLobophoravariegataex situ3
BrownNativeHawaiʻiPapaPadinaaustralisex situ1
BrownNativeHawaiʻiPapaSargassumechinocarpumex situ1
BrownNativeHawaiʻiPapaSargassumobtusifoliumex situ1
BrownNativeHawaiʻiPapaTurbinariaornataex situ1
BrownNativeOʻahuMaunaluaDictyotaacutilobaex situ29
BrownNativeOʻahuMaunaluaPadinaaustralisex situ3
ComplexUnknownHawaiʻiPapaTurfspp.in situ23
ComplexUnknownHawaiʻiPapaTurfspp.ex situ6
CyanobacteriaNativeHawaiʻiPapaLeptolyngbyacrosbyanaex situ25
CyanobacteriaNativeHawaiʻiPapaSymplocahydnoidesin situ16
CyanobacteriaNativeHawaiʻiPapaSymplocahydnoidesex situ9
GreenInvasiveOʻahuMaunaluaAvrainvillealacerataex situ32
GreenNativeHawaiʻiMiloliʻiChaetomorphaantenninaex situ5
GreenNativeHawaiʻiPapaCaulerpataxifoliaex situ4
GreenNativeHawaiʻiPapaHalimedaopuntinain situ22
GreenNativeHawaiʻiPapaHalimedaopuntinaex situ2
GreenNativeOʻahuKāneʻoheDictyosphaeriacavernosain situ25
GreenNativeOʻahuKāneʻoheDictyosphaeriaversluysiiin situ24
GreenNativeOʻahuKāneʻoheHalimedadiscoideain situ25
GreenNativeOʻahuKāneʻoheDictyosphaeriaversluysiiex situ6
GreenNativeOʻahuMaunaluaCaulerpaserularioidesex situ43
GreenNativeOʻahuMaunaluaDictyosphaeriacavernosaex situ3
GreenNativeOʻahuMaunaluaEnteromorphaproliferaex situ3
GreenNativeOʻahuMaunaluaHalimedadiscoideaex situ3
RedInvasiveOʻahuKāneʻoheAcanthophoraspiciferain situ25
RedInvasiveOʻahuKāneʻoheEucheumaspp.in situ25
RedInvasiveOʻahuKāneʻoheEucheumaspp.ex situ3
RedInvasiveOʻahuKāneʻoheGracillariasalicorniaex situ3
RedInvasiveOʻahuKāneʻoheKappaphycusspp.ex situ5
RedInvasiveOʻahuMaunaluaAcanthophoraspiciferaex situ2
RedInvasiveOʻahuMaunaluaGracillariasalicorniaex situ27
RedNativeHawaiʻiMiloliʻiAnfeltiopsisconcinnaex situ20
RedNativeHawaiʻiPapaAnfeltiopsisconcinnaex situ1
RedNativeHawaiʻiPapaDichotomariamarginatain situ19
RedNativeHawaiʻiPapaDichotomariamarginataex situ3
RedNativeHawaiʻiPapaRamicrustahawaiiensisin situ26
RedNativeOʻahuKāneʻoheGreen CCAspp_007ex situ1
RedNativeOʻahuKāneʻoheRed CCAspp_006ex situ1
RedUnknownOʻahuKāneʻoheRed Branchingspp_005ex situ3
RedUnknownOʻahuKāneʻoheRed Filamentousspp_004ex situ3
Figure A1. Brightness normalized reflectance spectra of Hawaiian macroalgae species. Species means are plotted as solid lines and standard deviation is indicated by shaded areas. The number of samples is indicated in each panel (n).
Remotesensing 16 01140 g0a1
Figure A2. Scatterplot matrices of canonicals 1–3 from quadratic discriminant analysis using algal divisions as the known categories. The first three canonical axes explain 47%, 33%, and 14% of the variation, respectively. Points indicate samples and ellipses contain 95% of each algal division.
Remotesensing 16 01140 g0a2

References

  1. Friedlander, A.; Aeby, G.; Brown, E.; Clark, A.; Coles, S.; Dollar, S.; Hunter, C.; Jokiel, P.; Smith, J.; Walsh, B.; et al. The State of Coral Reef Ecosystems of the Main Hawaiian Islands; University of Hawaii Press: Honolulu, HI, USA, 2005. [Google Scholar]
  2. Huisman, J.M.; Abbott, I.A.; Smith, C.M. Hawaiian Reef Plants; University of Hawaii Sea Grant College Program: Honolulu, HI, USA, 2007. [Google Scholar]
  3. Hart, G.M.; Ticktin, T.; Kelman, D.; Wright, A.D.; Tabandera, N. Contemporary Gathering Practice and Antioxidant Benefit of Wild Seaweeds in Hawai’i. Econ. Bot. 2014, 68, 30–43. [Google Scholar] [CrossRef]
  4. McDermid, K.J.; Martin, K.J.; Haws, M.C. Seaweed Resources of the Hawaiian Islands. Bot. Mar. 2019, 62, 443–462. [Google Scholar] [CrossRef]
  5. Smith, J.E.; Hunter, C.L.; Smith, C.M. Distribution and Reproductive Characteristics of Nonindigenous and Invasive Marine Algae in the Hawaiian Islands. Pac. Sci. 2002, 56, 299–315. [Google Scholar] [CrossRef]
  6. Vroom, P.; Page, K.; Kenyon, J.; Brainard, R. Algae-Dominated Reefs: Numerous Reports Suggest That Reefs Must Be Dominated by Coral to Be Healthy, but Many Thriving Reefs Depent More on Algae. Am. Sci. 2006, 94, 430–437. [Google Scholar] [CrossRef]
  7. Jouffray, J.-B.; Nyström, M.; Norström, A.V.; Williams, I.D.; Wedding, L.M.; Kittinger, J.N.; Williams, G.J. Identifying Multiple Coral Reef Regimes and Their Drivers across the Hawaiian Archipelago. Phil. Trans. R. Soc. B 2015, 370, 20130268. [Google Scholar] [CrossRef]
  8. Littler, M.M.; Littler, D.S. Models of Tropical Reef Biogenesis: The Contribution of Algae. Prog. Phycol. Res. 1984, 3, 323–364. [Google Scholar]
  9. Rasher, D.B.; Engel, S.; Bonito, V.; Fraser, G.J.; Montoya, J.P.; Hay, M.E. Effects of Herbivory, Nutrients, and Reef Protection on Algal Proliferation and Coral Growth on a Tropical Reef. Oecologia 2012, 169, 187–198. [Google Scholar] [CrossRef] [PubMed]
  10. Smith, J.E.; Hunter, C.L.; Smith, C.M. The Effects of Top–down versus Bottom–up Control on Benthic Coral Reef Community Structure. Oecologia 2010, 163, 497–507. [Google Scholar] [CrossRef]
  11. Conklin, E.J.; Smith, J.E. Abundance and Spread of the Invasive Red Algae, Kappaphycus Spp., in Kane’ohe Bay, Hawai’i and an Experimental Assessment of Management Options. Biol Invasions 2005, 7, 1029–1039. [Google Scholar] [CrossRef]
  12. Neilson, B.J.; Wall, C.B.; Mancini, F.T.; Gewecke, C.A. Herbivore Biocontrol and Manual Removal Successfully Reduce Invasive Macroalgae on Coral Reefs. PeerJ 2018, 6, e5332. [Google Scholar] [CrossRef]
  13. Foster, A.D.; Spalding, H.L.; Cox, T.E.; La Valle, F.F.; Philippoff, J. The Invasive Green Alga Avrainvillea Sp. Transforms Native Epifauna and Algal Communities on a Tropical Hard Substrate Reef. Phycol. Res. 2019, 67, 164–169. [Google Scholar] [CrossRef]
  14. Chao Rodríguez, Y.; Domínguez Gómez, J.A.; Sánchez-Carnero, N.; Rodríguez-Pérez, D. A Comparison of Spectral Macroalgae Taxa Separability Methods Using an Extensive Spectral Library. Algal Res. 2017, 26, 463–473. [Google Scholar] [CrossRef]
  15. Olmedo-Masat, O.M.; Raffo, M.P.; Rodríguez-Pérez, D.; Arijón, M.; Sánchez-Carnero, N. How Far Can We Classify Macroalgae Remotely? An Example Using a New Spectral Library of Species from the South West Atlantic (Argentine Patagonia). Remote Sens. 2020, 12, 3870. [Google Scholar] [CrossRef]
  16. Douay, F.; Verpoorter, C.; Duong, G.; Spilmont, N.; Gevaert, F. New Hyperspectral Procedure to Discriminate Intertidal Macroalgae. Remote Sens. 2022, 14, 346. [Google Scholar] [CrossRef]
  17. Falcioni, R.; Moriwaki, T.; Pattaro, M.; Herrig Furlanetto, R.; Nanni, M.R.; Camargos Antunes, W. High Resolution Leaf Spectral Signature as a Tool for Foliar Pigment Estimation Displaying Potential for Species Differentiation. J. Plant Physiol. 2020, 249, 153161. [Google Scholar] [CrossRef] [PubMed]
  18. Asner, G.P.; Jones, M.O.; Martin, R.E.; Knapp, D.E.; Hughes, R.F. Remote Sensing of Native and Invasive Species in Hawaiian Forests. Remote Sens. Environ. 2008, 112, 1912–1926. [Google Scholar] [CrossRef]
  19. Tsuda, R.T. Endemism of Marine Algae in the Hawaiian Islands. Bish. Mus. Occassional Pap. 2014, 115, 23–27. [Google Scholar]
  20. Carlton, J.T.; Eldredge, L.G. Marine Bioinvasions of Hawaiʻi: The Introduced and Cryptogenic Marine and Estuarine Animals and Plants of the Hawaiian Archipelago; Bishop Museum Bulletin in Cultural and Environmental Studies; Bernice P. Bishop Museum, Bishop Museum Press: Honolulu, HI, USA, 2009; ISBN 978-1-58178-096-3. [Google Scholar]
  21. Carlton, J.T.; Eldredge, L.G. Update and Revisions of The Marine Bioinvasions of Hawai‘i: The Introduced and Cryptogenic Marine and Estuarine Animals and Plants of the Hawaiian Archipelago; Bishop Museum Bulletin in Zoology; Bernice P. Bishop Museum, Bishop Museum Press: Honolulu, HI, USA, 2015; Volume 9, pp. 25–47. [Google Scholar]
  22. Department of Land and Natural Resources, (DLNR). State of Hawaii Aquatic Invasive Species Management Plan; Department of Land and Natural Resources: Honolulu, HI, USA, 2003; 205p. [Google Scholar]
  23. Li, J.; Schill, S.R.; Knapp, D.E.; Asner, G.P. Object-Based Mapping of Coral Reef Habitats Using Planet Dove Satellites. Remote Sens. 2019, 11, 1445. [Google Scholar] [CrossRef]
  24. Asner, G.P.; Vaughn, N.R.; Heckler, J.; Knapp, D.E.; Balzotti, C.; Shafron, E.; Martin, R.E.; Neilson, B.J.; Gove, J.M. Large-Scale Mapping of Live Corals to Guide Reef Conservation. Proc. Natl. Acad. Sci. USA 2020, 117, 33711–33718. [Google Scholar] [CrossRef]
  25. Asner, G.P.; Vaughn, N.; Foo, S.; Heckler, J.; Martin, R. Abiotic and Human Drivers of Reef Habitat Complexity Throughout the Main Hawaiian Islands. Front. Mar. Sci. 2021, 8, 631842. [Google Scholar] [CrossRef]
  26. Thompson, D.R.; Hochberg, E.J.; Asner, G.P.; Green, R.O.; Knapp, D.E.; Gao, B.-C.; Garcia, R.; Gierach, M.; Lee, Z.; Maritorena, S.; et al. Airborne Mapping of Benthic Reflectance Spectra with Bayesian Linear Mixtures. Remote Sens. Environ. 2017, 200, 18–30. [Google Scholar] [CrossRef]
  27. Kutser, T.; Hedley, J.; Giardino, C.; Roelfsema, C.; Brando, V.E. Remote Sensing of Shallow Waters–A 50 Year Retrospective and Future Directions. Remote Sens. Environ. 2020, 240, 111619. [Google Scholar] [CrossRef]
  28. Drury, C.; Martin, R.E.; Knapp, D.E.; Heckler, J.; Levy, J.; Gates, R.D.; Asner, G.P. Ecosystem-scale Mapping of Coral Species and Thermal Tolerance. Front. Ecol. Environ. 2022, 20, 285–291. [Google Scholar] [CrossRef]
  29. Feilhauer, H.; Asner, G.P.; Martin, R.E.; Schmidtlein, S. Brightness-Normalized Partial Least Squares Regression for Hyperspectral Data. J. Quant. Spectrosc. Radiat. Transf. 2010, 111, 1947–1957. [Google Scholar] [CrossRef]
  30. SAS Institute Inc. JMP®, Version 16; SAS Institute Inc.: Cary, NC, USA, 2022. [Google Scholar]
Figure 1. Brightness normalized reflectance spectra by algal taxonomic division: (a) brown (Ochrophyta), (b) cyanobacteria (Cyanophyta), (c) green (Chlorophyta), and (d) red (Rhodophyta). The mean spectral reflectance of each division is shown as the solid line. The shaded bands indicate one standard deviation. n indicates the number of samples per division.
Remotesensing 16 01140 g001
Figure 2. Brightness normalized spectral reflectance signatures of invasive and native algae by (a) green (Chlorophyta) division (native n = 165 and invasive n = 32) and (b) red (Rhodophyta) division (native n = 71 and invasive n = 90). Mean reflectance is shown as the solid line and shaded bands indicate one standard deviation.
Remotesensing 16 01140 g002
Figure 3. Canonical plot from quadratic discriminant analysis of all samples. Points indicate samples and ellipses contain 95% of each algal division. The first and second canonical axes explain 47% and 33% of the variation, respectively.
Remotesensing 16 01140 g003
Table 1. Number of macroalgal species and spectral measurements by division and by invasive, native, and unknown biogeographic status. The number of unique species is listed along with the number of spectra in parentheses. Dashes indicate no samples were taken. Details of the species sampled are provided in Table A1. Turf algae are labeled as a division complex.
DivisionInvasiveNativeUnknownTotal
Cyanobacteria-2 (50)-2 (50)
Red4 (90)5 (71)2 (6)11 (167)
Green1 (32)8 (165)-9 (197)
Brown-7 (161)-7 (161)
Complex--1(29)1(29)
Total5 (122)22 (447)3 (35)30 (604)
Table 2. Algal division quadratic discriminant analysis score summary for training, validation, and test sets.
SourceCountNumber
Misclassified
Percent
Misclassified
Entropy R2
Training34510.30.95
Validation11543.50.23
Test11543.50.29
Table 3. Algal species quadratic discriminant analysis score summary for training, validation, and test sets.
SourceCountNumber
Misclassified
Percent
Misclassified
Entropy R2
Training34861.70.98
Validation1131916.8−1.81
Test1141916.7−4.40
Table 4. Native and invasive algae quadratic discriminant analysis score summary for training, validation, and test sets.
DivisionSourceCountNumber
Misclassified
Percent
Misclassified
Entropy R2
GreenTraining118001
GreenValidation3812.630.65
GreenTest41001
RedTraining97001
RedValidation33001
RedTest31001
Disclaimer/Publisher’s Note: The statements, opinions and data contained in all publications are solely those of the individual author(s) and contributor(s) and not of MDPI and/or the editor(s). MDPI and/or the editor(s) disclaim responsibility for any injury to people or property resulting from any ideas, methods, instructions or products referred to in the content.

