Abstract
The response of vegetation phenology to urbanization has become a growing concern. As impervious surfaces change as urbanization advances, the variation in vegetation phenology at the dynamic urbanization level was analyzed to significantly quantify the impact of urbanization processes on vegetation phenology. Based on the MOD13Q1 vegetation index product from 2001 to 2020, vegetation phenology parameters, including the start of the growing season (SOS), the end of the growing season (EOS), and the length of the growing season (GSL), were extracted, and the spatial–temporal variation in vegetation phenology, as well as its response to urbanization, was comprehensively analyzed. The results reveal that (1) from 2001 to 2020, the average rates of change for the SOS, EOS, and GSL were 0.41, 0.16, and 0.57 days, respectively. (2) The vegetation phenology changes showed significant spatial–temporal differences at the urbanization level. With each 10% increase in the urbanization level, the SOS and EOS were advanced and delayed by 0.38 and 0.34 days, respectively. (3) The urban thermal environment was a major factor in the impact of urbanization on the SOS and EOS. Overall, this study elucidated the dynamic reflection of urbanization in phenology and revealed the complex effects of urbanization on vegetation phenology, thus helping policymakers to develop effective strategies to improve urban ecological management.
1. Introduction
Vegetation phenology refers to the sprouting, leaf expansion, flowering, fruiting, and defoliation of vegetation responding to external factors (temperature, precipitation, etc.) during the growth [1] period and is the most flexible biological indicator of seasonal environmental changes [2]. Research has shown that the phenology of vegetation changes over time. For example, the EOS, SOS, and GSL in the temperate regions of China tended to be delayed, advanced, and extended, respectively [3]. From 2001 to 2016, the trend in the SOS in freshwater swamps in northeastern China was for it to occur earlier, and the SOS in the Greater Khingan Mountains was earlier than that in the Songnen Plain [4]. With the development of society, human activities such as population growth, land use changes, and extensive resource exploitation have led to a range of environmental changes [5]. For instance, an increase in the impermeable surface area impacts the process of energy exchange between the atmosphere and the surface, which, in turn, changes the environment for vegetation growth [6]. Overall, with the development of climate warming and urbanization, the influence of urbanization on vegetation phenology has attracted growing attention and become a new urgent issue in phenology research.
Previous studies have found that with the advancement of urbanization, phenology will also change [7,8]. A study of 32 cities in China presented an EOS that was 5.4 days earlier while the SOS was 11.9 days later in rural areas compared to urban areas [9]. Using the percentage of the impervious layer to express the urbanization level, another research work found that an increase in the impervious layer will lead to an advanced SOS and a delayed EOS [10]. A tenfold increase in urban size may lead to a 1.3-day advance in the SOS and a 2.4-day delay in the EOS [11]. Previous studies have differed in their approach to dividing the urbanization level. However, most of them have only considered urban impacts on vegetation phenology under a fixed urbanization level, ignoring the process of urban expansion [12,13]. The percentage of impervious surfaces has also changed during the urbanization process, resulting in the urbanization level changing from year to year [14]. Thus, this study used a dynamic level that can be quantified using remote sensing technology, taking into account the process of urban sprawl. The impervious surface was used instead of the traditional method of establishing an urban–rural differential between rural and urban areas, which allows for a more significant quantification of the urbanization process affecting vegetation phenology.
In contrast to traditional ground-based methods, remote sensing images are not restricted by time or space. They not only facilitate the acquisition of long time series of vegetation phenology information but also compensate for the limited-scale coverage of field observation sites, which greatly promotes the development of vegetation phenology research [15]. MODIS remote sensing monitoring data have a suitable spatial resolution and a stable vegetation index, which is extensively used in vegetation phenology research. Thompson et al., used MODIS NDVI data to extract phenology information in the Alps and found that the higher the elevation, the shorter the GSL [16]. Sarvia et al., used MOD13Q1 data and found that different vegetation types have different responses to climate change [17]. Vegetation phenology parameters were extracted using MOD13Q1-NDVI data with spatial and temporal resolutions of 250 m and 16 days, respectively, for a total of 460 periods (https://search.earthdata.nasa.gov/, accessed on 1 February 2022). MOD11A2 surface temperature data with spatial and temporal resolutions of 1000 m and 8 days, respectively, were used (https://search.earthdata.nasa.gov/, accessed on 20 March 2022). MODIS product data have the advantages of good time continuity and a high spatial resolution [18,19,20] and are widely used in vegetation growth monitoring [21], soil moisture monitoring [22], and research on vegetation phenology changes [23,24]. The impervious surface data constitute global high-resolution impervious-surface-mapping products released by Prof. Peng Gong et al. for the period of 2001 to 2018 with a spatial resolution of 30 m [25] (https://data-starcloud.pcl.ac.cn/zh, accessed on 18 June 2022). The impervious surface data for 2019 and 2020 were supplemented using land use data sourced from 30 consecutive years of land use in China from 1990 to 2021 (China Land Cover Dataset, CLCD) [26], and the accuracy rate reaches 80%.
The maximum-slope-of-change method, the dynamic threshold method, and the sliding average method are commonly used to extract vegetation phenology parameters from remote sensing data [27,28]. Human factors such as the setting of the threshold and the window size in the dynamic threshold method and the sliding average method can produce errors in the results, while the maximum-slope-of-change method can avoid such errors. So, in this paper, the maximum-slope-of-change method was utilized to extract the vegetation phenology parameters, as it utilizes the slope of a fitted linear function to reflect the vegetation phenology trend more objectively and accurately, thus effectively avoiding the interference of human subjective factors with the vegetation phenology inversion.
This paper hypothesized a relationship between the ISP, LST, and vegetation phenology parameters. We defined phenological changes due to an increase in the impervious surface (ISP) as the effect of urbanization on phenology and phenological changes due to land surface temperature (LST) as the effect of the thermal environment on phenology as caused by urbanization. The processing flow of this study was as follows. Firstly, MODIS NDVI data from 2001 to 2020 were utilized to extract the vegetation phenology parameters for the Yangtze River Delta region, including the EOS, SOS, and GSL. Secondly, the spatial–temporal features of vegetation phenology were analyzed. Thirdly, the vegetation phenology variation, along with the dynamic urbanization level, was analyzed to significantly quantify the impact of the urbanization process on vegetation phenology. Finally, the contribution of the urban thermal environment to the physical climate was explored.
2. Data and Methods
2.1. Study Area
The Yangtze River Delta region (29°12′ to 35°20′N and 114°54′ to 121°28′E) is located in eastern China, downstream of the Yangtze River, covering a total area of approximately 359,000 square kilometers. The region is dominated by a subtropical monsoon and temperate monsoon climate, and it is warm and humid year-round. Plains, hills, and mountains are the main terrain types, and the three main vegetation types are mixed evergreen deciduous broad-leaf forest, green broad-leaved forest, and temperate deciduous broad-leaved forest (Figure 1). As a region with strong economic power and rapidly developing urbanization levels in China, its total GDP reached CNY 24.5 trillion, and its total population reached 235 million people in 2020, which profoundly changed the urban ecological environment [29] (Table 1). In addition, the urbanization level was complete in the selected study area, making it an excellent natural experimental area for exploring the effects of urbanization on vegetation phenology. In addition, compared to existing research focusing on the area within the city and its surrounding limited areas, our selected study area covers areas with different urbanization levels, including rural areas and urban areas with various development levels, making the study area a natural experimental area for exploring the effects of urbanization on plant phenology.
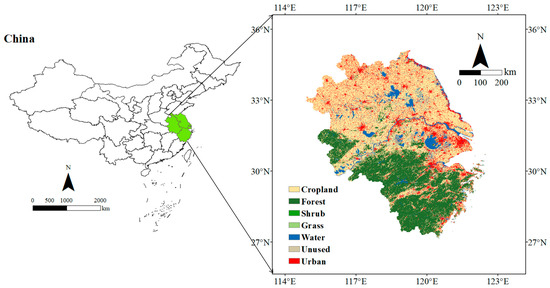
Figure 1.
Land cover map of the study area in 2020.

Table 1.
Population and GDP of provinces in the Yangtze River Delta region in 2020.
2.2. Data Source
The data used in this study include the MOD13Q1-NDVI dataset, the MOD11A2-surface temperature dataset, a land use dataset, and urban boundary data, as detailed in Table 2.

Table 2.
Data sources and uses.
2.3. Methods
2.3.1. Time-Series Reconstruction
MODIS is an important sensor onboard the Terra and Aqua satellites, generating the land vegetation data product MOD13Q1 with a spatial resolution of 250 m and a temporal resolution of 16 days, of which the normalized difference vegetation index (NDVI) layer is extensively used in large-scale vegetation phenology research [30]. However, cloud and snow cover, haze effects, and the performance of the sensor itself can have an impact on the radiant energy output from the sensor, resulting in valleys and peaks in the synthesized NDVI curves. These anomalies cause the accuracy of the parameter inversion results to decrease and deviate from the real vegetation activity on the surface. Therefore, reconstructing and smoothing the time series of NDVI data are necessary to improve the accuracy and effectiveness of the data. In this paper, the Savitzky–Golay (S-G) filtering method was chosen to fit the raw NDVI time-series data [31]. The S-G filtering method is a sliding window weighting algorithm proposed by Savitzky and Golay in 1960, where the weighting coefficients are obtained by the least-squares fitting of a given high-order polynomial within a sliding window [32]. The new curve obtained by the S–G filtering method can retain complete detailed information in the process of filtering out the noise interference and can describe the changes in long time-series data in more detail [33].
The Savitzky–Golay filtering (S–G) filtering method is as follows:
where represents the initial NDVI value, is the smoothed NDVI data, is the filter coefficient for the least-squares fit, is the initial coordinate of the sliding window, is the jth initial value in the sliding window, and is the sliding window size.
2.3.2. Vegetation Phenology Parameter Extraction
Three phenological parameters, namely, SOS, GSL, and EOS, were selected to investigate the response of vegetation phenology to urbanization. In this study, the maximum-slope-of-change method was used to retrieve vegetation phenology parameters, which can effectively avoid the interference of human subjective factors and reflect vegetation phenology trends more objectively and accurately. The maximum-slope-of-change method is used to identify the date when the fitted curve first reaches the maximum rate of change, which is the vegetation phenology start time; similarly, the end time of vegetation phenology is the date when the curve reaches the maximum rate of decline in change. The length of the season is the length of time between the start time and the end time of the vegetation phenology period. To eliminate the uncertainty caused by errors, the ranges of the SOS and EOS were restricted to a certain interval. The SOS and EOS were limited to Days 50–180 and Days 240–330 of the year, respectively [34,35]. Additionally, to minimize errors, we used only areas where there was no change in the land cover type (Figure 2).
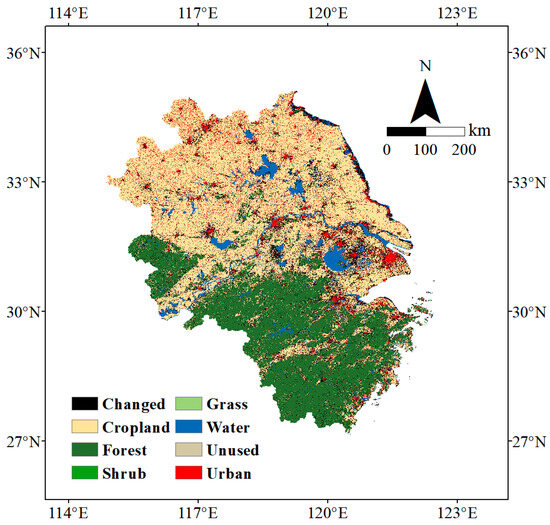
Figure 2.
Changed and unchanged areas.
2.3.3. Dynamic Urbanization Level Setting
In this paper, we use the percentage of impervious surfaces to indicate different urbanization levels within the region. We first used remote sensing data to calculate the percentage of impervious surfaces (PISP) in every 1 km × 1 km grid and then used the PISP to classify the urbanization level. The following equation was used to calculate the PISP:
where PISP is the percentage of impervious surfaces, and is the area of impervious surfaces.
The PISP values are listed in descending order, from 100% to 0%, of the percentage value. Then, we divided the PISP into 100 equal-scale intervals (0–1%, 1–2%, …, 99–100%) as the urbanization levels. The urbanization level is the first level when the PISP is between 0% and 1%, the second level when it is between 1% and 2%, and so on. Areas with a proportion greater than 80% were defined as urban cores, areas with a proportion less than 20% were defined as rural areas, and areas with a proportion between 20% and 80% were defined as suburban areas. As the urban landscape changes, the percentage of impervious surfaces in the city also changes from year to year. The endpoints of the level change depending on the urbanization level in different locations, creating a dynamic urbanization level that allows for a better exploration of how the urban environment affects vegetation phenology. The dynamic effects of urbanization on vegetation phenology were expressed by phenological parameters at each level to determine the spatial–temporal variability in phenology at the urbanization level. The grid at 0% impervious surface was used as the initial base, and all initial grid values were averaged. The process of determining the level is shown in Figure 3. Figure 4 shows the urbanization levels in 2001 and 2020.

Figure 3.
Process for determining the urbanization level.
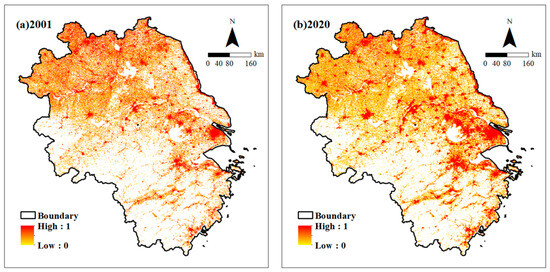
Figure 4.
Maps of the urbanization levels in the study area in 2001 and 2020.
2.3.4. Trend Analysis of Vegetation Phenology
We used linear regression to explore variations in phenology indicators during 2001–2020, which was calculated as follows:
where t is the year, is the SOS, EOS, or GSL in year t, S is the trend in the SOS, EOS, or GSL over time in days/year, and n is equal to 20. A slope greater than 0 indicates a trend in which the SOS or EOS is delayed or a trend in which the GSL is extended. A slope smaller than 0 indicates that the GSL tends to shorten, while the SOS and EOS tend to advance. The magnitude of the slope indicates the speed at which the SOS and EOS are delayed or advanced or the GSL is extended or shortened.
2.3.5. The Impact of Urbanization on Vegetation Phenology
We quantified the differences between different levels and nonurbanized areas (ISP = 0) as ΔSOS, ΔEOS, and ΔGSL. To explore the effect of urbanization over the course of a year, we calculated trends in phenology using the following equations:
where , , and are the , , and , respectively, of the i-th urbanization level in year t; is the difference between the nonurbanized area (ISP = 0) and the urbanization level in year t; and the value range of i is 1–100. represents the temperature difference between the i-th level in year t and nonurban areas (ISP = 0) in year t. When exploring the relationships between the SOS, EOS, and GSL and temperature, spring and fall temperatures and average annual temperatures were used. The parameter a indicates the effects of urbanization on phenology, and the parameter b indicates the effects of temperature changes on phenology.
2.3.6. Distinguishing the Influences of Urban Thermal Environments on Changes in Vegetation Phenology
Thermal and nonthermal environmental factors are the two main categories of factors of urbanization that affect vegetation phenology. In this paper, we previously hypothesized a relationship between ISP, LST, and vegetation phenology parameters, which we quantified using linear regression with a known fixed-intercept model [36]. First, all the data were normalized, and then the phenological changes caused by the increase in impervious surfaces were defined as the influence of urbanization on phenology. Second, the change in phenology owing to surface temperature was defined as the effect of the urban thermal environment on phenology. The following equations were used to calculate the contribution rates of the LST and ISP:
where CR indicates the contribution rate of the urban thermal environment to the effect of urbanization on vegetation phenology. A CR > 100% indicates that the thermal environment is the only factor affecting vegetation phenology caused by urbanization.
3. Results and Discussion
3.1. Average Rate of Changes in Vegetation Phenology
The variation in vegetation phenology is shown in Figure 5, with a clear trend in vegetation phenology over time. The variation in the SOS was more erratic, with an average advance of 0.41 days/year. The amplitude of change from 2006 to 2009 was relatively uniform (Figure 5a). The variation in the EOS showed a trend of being delayed, but the delay trend was less variable than that in the SOS. The average delay was 0.16 days per year, and all SOSs fell between Days 286 and 291 (Figure 5b). The duration between the SOS and EOS was defined as the length of the growing season of the vegetation. The SOS showed an advancing trend, while the EOS showed a trend of being delayed, leading to a trend of the GSL being extended. The findings indicated that the GSL was extended by 0.57 days per year on average, with a relatively stable change from Days 208 to 210 from 2015 to 2020 (Figure 5c).
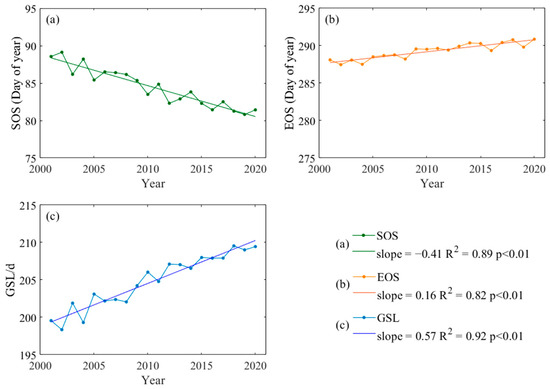
Figure 5.
Variation in vegetation phenology.
To explore the variations in vegetation phenology among urban, rural, and suburban areas, this study extracted the average values of phenology in urban, rural, and suburban areas and fitted them with a linear regression equation. The results are shown in Figure 6. From 2001 to 2020, the average SOSs were on Days 86, 82, and 77 in rural, suburban, and urban areas, respectively, all showing early trends. Rural areas advanced by an average of 0.46 days per year, and suburban areas showed the greatest change, advancing by an average of 0.52 days per year. The trend in urban areas was not obvious, with an increase of 0.16 days per year (Figure 6a). Figure 6b shows the interannual variation in the average EOSs, all of which exhibit a trend of being delayed. The average EOSs for urban, rural, and suburban areas were on Days 293, 278, and 285, respectively. The largest variation was in rural areas, with an average delay of 0.58 days per year, and the smallest variation was in urban areas, with a delay of 0.14 days per year. The change in suburban areas was between those in rural and urban areas, with a delay of 0.4 days/year. The GSLs in rural, suburban, and urban areas all tended to extend due to the advance in the SOS and the delay in the EOS (Figure 6c). The greatest variation in the GSL was observed in suburban areas, with a lengthening of 1.05 days per year and a mean GSL of 203 days. The average GSL in rural areas was 192 days, with a mean delay of 1.02 days per year. The lowest amplitude of GSL was found in urban areas, where the average prolongation was 0.32 days per year, with a mean GSL of 216 days.
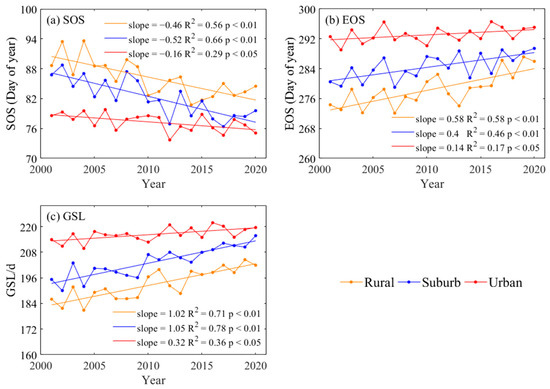
Figure 6.
Variation in vegetation phenology in urban, suburban, and rural areas.
We also analyzed the variability in phenology for different land cover types, and the results are shown in Figure 7. The built-up area contains green vegetation such as green belts, so phenological parameters can also be extracted. The trends in the SOS and EOS were the same for all five types, with the SOS showing a trend of advancing and the EOS showing a trend of being delayed. The SOS advanced by 0.29 days/year (grassland), 0.13 days/year (shrub), 0.13 days/year (crop), 0.08 days/year (built-up area), and 0.06 days/year (forest). The EOS was delayed by 0.39 days/year (grassland), 0.31 days/year (forest), 0.14 days/year (crop), 0.14 days/year (built-up area), and 0.1 days/year (shrub).
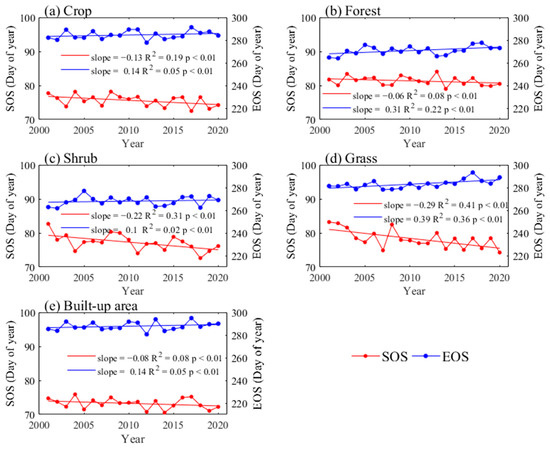
Figure 7.
Variability in the phenology of five different land types.
The results of the SOS, EOS, and GSL of the five land cover types (farmland, shrub, grassland, forest, and built-up area) are displayed in Figure 8. The SOS on the five land cover types began in March, with an average distribution between Day 73 and Day 82. The built-up area had the earliest onset time, with the average on Day 74. Excluding built-up areas, the earliest average start time among the four vegetation types was for agricultural land, occurring on around Day 75, followed by shrubs and grasslands, occurring on Days 77 and 78, respectively. The EOS of forests was evenly distributed on Day 81, with the latest SOS (Figure 8a). The EOS started in September, with an average distribution between Days 268 and 287. The built-up areas had the latest EOS, with the average being on Day 287. The EOS occurred later in agricultural and grassland areas on Day 284 and Day 283, respectively. The EOS of forests was evenly distributed on Day 271, and shrubs had the latest EOS, distributed on Day 268 (Figure 8b). The GSL was distributed between 190 and 215 days, with the longest time GSL occurring in built-up areas at 215 days and the shortest time GSL occurring in forested areas at 190 days (Figure 8c).
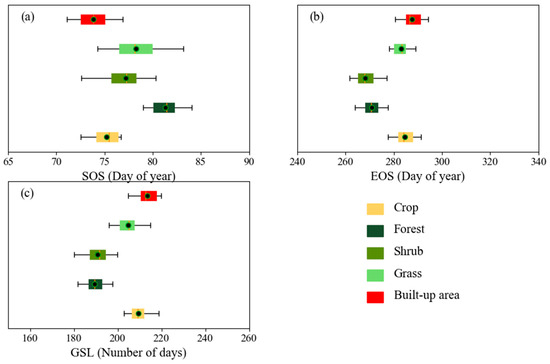
Figure 8.
Box plots of the different land cover types. (a) shows the distribution of SOS per year for the five land types. (b) shows the distribution of EOS per year for the five land types. (c) shows the distribution of GSL per year for the five land types.
The vegetation phenology changed over time, with the SOS, EOS, and GSL showing trends of being advanced, delayed, and extended, respectively, which is similar to the findings of previous related studies. For example, Wang et al. studied the spring vegetation phenology in 292 cities in China and found that 78.3% of the cities showed an early trend in spring vegetation phenology [37]. Jiao et al., used integrated empirical mode decomposition (EEMD) to explore the changes in regional phenology in China and reported that the national average SOS advanced by 0.01 days/year and that the average delay in the EOS was 0.20 days/year [38]. This phenomenon can be attributed to several factors, such as global warming and precipitation. Research suggests that adequate precipitation may advance the SOS on the Tibetan Plateau, while the advancement of the SOS in meadow areas may be associated with increased temperature [39]. The EOS and GSL were obviously positively correlated with temperature in arid Central Asia, while the SOS was obviously negatively correlated with temperature [40]. The discrepancies in the variation in phenology between urban, rural, and suburban areas indicate that different levels of urbanization lead to different trends in phenology. The changes were more dramatic in suburban areas than in urban areas, which may be because the urban environment has stabilized, while the suburbs are in a rapid stage of urbanization.
3.2. Spatial Distribution Characteristics of Vegetation Phenology
The results of the spatial distribution of vegetation phenology are shown in Figure 9. Figure 9a shows the average SOS, with an early trend from northwest to southeast. The SOS in northern Anhui (including Fuyang, Bozhou, Huabei, Suizhou, and northern Liuan) and Xuzhou and Jiangsu were significantly later than those in other regions, with the SOS concentrated on Days 93 to 107. Compared with those in other regions, the SOSs in Anqing and southern Liuan in Anhui and the remaining part of Jiangsu were earlier than in other regions, with the SOS concentrated on Days 72 to 79. Figure 9b shows the average EOS distribution, with time gradually advancing from north to south. The EOSs in northern Anhui, Jiangsu, and Shanghai were significantly later, mostly concentrated between Days 285 and 300. In the southern region, the EOS was significantly earlier due to the higher altitude, and it was mostly concentrated between Days 270 and 280. Figure 9c shows the average GSL distribution, which was mostly concentrated between 180 and 200 days. The early SOS and late EOS resulted in a significantly longer GSL in Jiangsu than in the other regions. Since the EOS was significantly later than in other regions, the GSL was longer in northern Anhui.
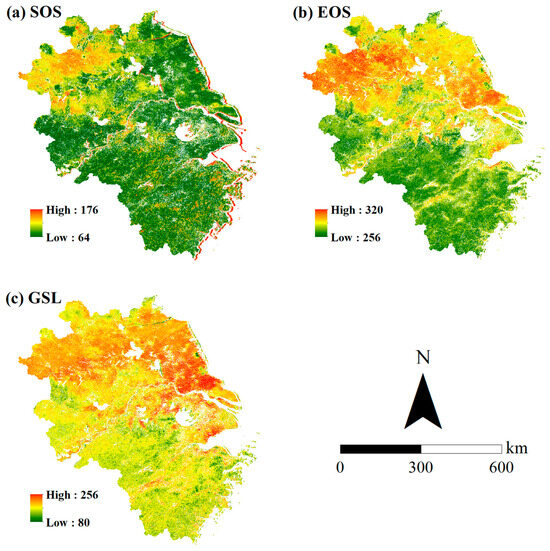
Figure 9.
The average vegetation phenology from 2001 to 2020.
The results showing the trends in vegetation phenology changes are shown in Figure 10. Figure 10a shows the distribution of SOS variation, where the proportion of areas with an early SOS (slope < 0) was 40.33%, and the proportion of areas with a delayed SOS (slope > 0) was 59.67%. The SOS in Fuyang, Bozhou, Huabei, Suizhou, and northern Bengbu in Anhui showed obvious trends of being delayed, with delays of 1.75, 3.18, 2.86, 2.80, and 2.2 days, respectively. Figure 10b shows the distribution of EOS changes, and most of them showed trends of being delayed. Delayed areas accounted for 95.27%, and advanced areas accounted for only 4.73%. The junction of Anqing, Chizhou, Tongling, and Wuhu in Anhui Province and the southern part of Yancheng in Jiangsu Province showed early trends, with variations ranging from 1 to 3 days. The phenology in other regions showed a trend of being delayed, with variations ranging from 1 to 2 days. Figure 10c shows the distribution of GSL changes, and the percentages of regions with longer and shorter GSLs were 61% and 39%, respectively.
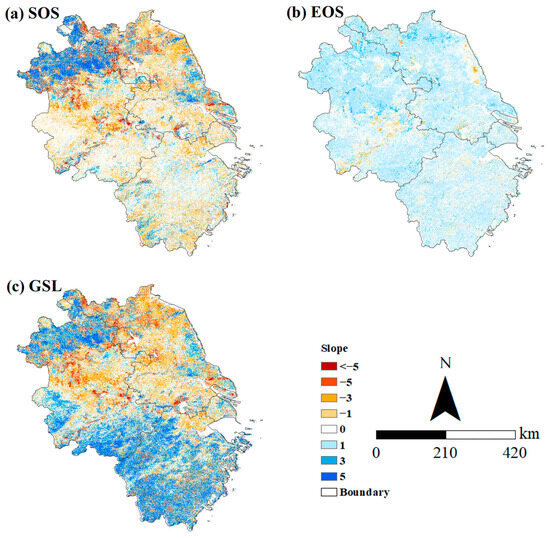
Figure 10.
Spatial–temporal variation in phenology from 2001 to 2020.
The vegetation phenology showed significant spatial differences, with the EOS being earlier in the south than in the north and the GSL being shorter than in the north. The possible reason for this phenomenon is the altitude factor. Studies have shown that the higher the altitude, the later the SOS and the earlier the EOS, resulting in a shorter GSL [41,42]. The southern part of the research area is at a higher elevation than the northern part and, therefore, has a shorter growing season length. In contrast to the distribution of EOS changes, the distributions of SOS and GSL changes were not uniform, and the rates of change varied greatly. There were some areas where the level of SOS delay was greater, such as northern Anhui. The EOS variation was equally distributed and less variable than the SOS variation, ranging between 1 and 2 days. This suggests that the SOS is more sensitive to surrounding environmental factors than is the EOS, and similar conclusions have been reached in prior studies. Lukasová et al., studied the influence of altitude on the phenology of beech and reported that spring phenology was closely related to altitude, while fall phenology was not closely related to altitude [43]. Hou et al. reported that the daytime temperature was the main element that promoted the SOS in the northeast region, while the effect on the EOS was not significant [44].
3.3. Trends in Vegetation Phenology at the Urbanization Level
Figure 11a shows that the SOS advanced with changing rural–urban levels, with the average SOS in rural areas (Day 86.75, ISP ≤ 20%) occurring 3.09 days later than the average SOS in urban areas (Day 83.66, ISP ≥ 80%). When the urbanization level was below 60%, the SOS advanced significantly as the urbanization level increased; when the urbanization process exceeded 60%, the SOS gradually stabilized and did not become significantly earlier. Figure 11b shows that the EOS showed a trend of being delayed at the rural–urban level, with the average EOS in rural areas (Day 280.34, ISP ≤ 20%) delayed by 81 days compared with the average EOS in urban areas (Day 283.15, ISP ≥ 80%). When the urbanization level was less than 50%, the EOS showed a trend of being delayed with increasing urbanization levels; when the urbanization level was more than 50%, the EOS tended to stabilize and did not change significantly. Figure 11c shows that the GSL exhibited an increasing trend at the rural–urban level, with an average GSL of 193.60 days in rural areas, which was 6.1 days shorter than the average GSL in urban areas (199.70 days). The GSL gradually stabilized when urbanization exceeded 60%.
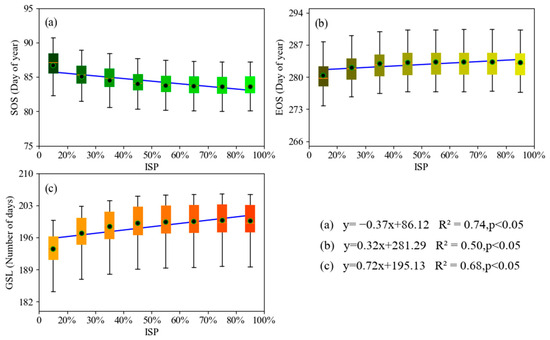
Figure 11.
Vegetation phenology changes with increasing urbanization levels. (a) shows the changes in the SOS with the changes in the urbanization level. (b) shows the changes in the EOS with the changes in the urbanization level. (c) shows the changes in the GSL with the changes in urbanization level.
With accelerated urbanization, the urban environment has undergone significant changes, with profound effects on vegetation phenology. Studies have shown that urbanization changes the land cover type and has an impact on the surrounding environment, thus profoundly altering the vegetation phenology in the region. As the level of urbanization increases, the SOS, EOS, and GSL appear to be advanced, delayed, and prolonged, respectively, which is similar to the findings of prior studies. Li et al., reported a later SOS and earlier EOS in rural areas than in urban areas [10]. Ren et al., explored the relationship between urbanization and vegetation phenology and reported that the vegetation SOS occurred approximately 2.4 days earlier, the EOS occurred approximately 0.7 days later, and the GSL was 3.1 days longer in urban areas than in rural areas [45].
3.4. The Impact of Urbanization on Urbanization-Level Phenology
To quantify the effect of urbanization on vegetation phenology, a linear regression of the difference in vegetation phenology and the difference in urbanization level was performed. The results of the study are presented in Figure 12. The evolution of the ∆SOS showed a clear trend toward advancement at the urbanization level. With each 10% increase in the percentage of impervious surfaces, the ∆SOS decreased by 0.38 days, indicating a general trend of SOS advancement with increasing levels of urbanization. The average ∆SOS in rural and urban areas was 0.57 days and 3.72 days, respectively (Figure 12a). Figure 12b shows that the change in ∆EOS exhibited a trend of being delayed at the urbanization level. When the urbanization level increased by 10%, the ∆EOS was delayed by 0.34 days. The average ∆EOS was 1.14 and 3.97 days for rural and urban areas, respectively. The ∆GSL showed a positive trend at the urbanization level, with the ∆GSL increasing by 0.57 days for each 10% increase in impervious surfaces. The average ∆GSLs for the rural and urban areas were 0.23 and 4.58 days, respectively (Figure 12c). Overall, from 2001 to 2020, there was a tendency for the SOS to be advanced with changing rural-to-urban levels and for the EOS and GSL to be delayed with changing rural-to-urban levels.
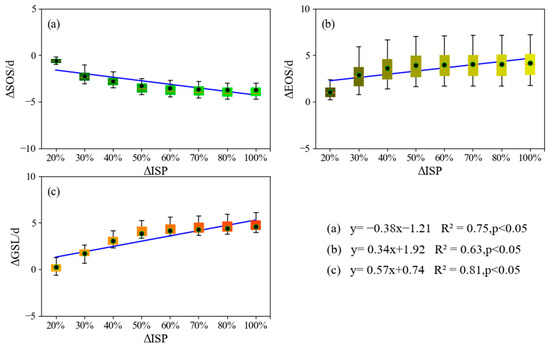
Figure 12.
Effect of changing PISP on urbanization-level phenology. (a) shows the variation in ∆SOS with urbanization level differences. (b) shows the variation in ∆EOS with urbanization-level differences. (c) shows the variation in ∆GSL with urbanization-level differences.
The results showed that the discrepancy in vegetation phenology among urban areas and rural areas increased with increasing urbanization levels. When the urbanization level reaches a certain height, the differences between the two areas gradually tend to level off. The differences in vegetation phenology under different levels of urbanization are likely related to several factors [15]. First, areas with low urbanization levels (e.g., less than 20% impervious surfaces) are dominated by nonurban factors, and their phenology is mainly attributed to natural vegetation (e.g., forests, farmland, etc.). Areas with high levels of urbanization (e.g., >80% impervious surfaces) are subject to phenological changes due to the effects of urbanization (e.g., the urban thermal environment). This finding is congruent with existing findings. Ruan et al. investigated the relationship between phenology and the urban–rural distance in 32 major cities in the Northern Hemisphere and found that 22 cities experienced earlier SOSs and 19 cities experienced delayed EOSs as the distance increased, leading to greater differences in phenology between rural and urban areas [46].
3.5. Impacts of Rising Temperatures on Phenology across Urbanization Levels
To explore the relationships between temperature and phenology at the rural–urban level, this paper analyzed the relationships between spring temperature differences and the ∆SOS, between fall temperature differences and the ∆EOS, and between annual mean temperature differences and the ∆GSL using linear regression. Figure 13a shows that the ∆SOS was negatively correlated with the difference in spring surface temperature, and the ∆SOS of vegetation phenology increased with increasing spring temperatures. The results suggest that increased spring temperatures can advance the SOS. For each 1 °C increase in spring surface temperature, the ∆SOS was advanced by 0.47 days. The advancement of the SOS was more obvious when the temperature was increased by 2–10 °C. Figure 13b shows a positive correlation between the ∆EOS and the difference in surface temperature in autumn. As the autumn temperature increased, the ∆EOS increased, indicating that the autumn surface temperature promoted a delay in the EOS. The effect of the fall surface temperature on the EOS was not strong, with the ΔEOS delayed by 0.13 for each 1 °C increase in the fall surface temperature. Figure 13c shows that the ΔGSL was positively correlated with the difference in the mean annual temperature. As the mean annual temperature increased, the GSL increased. The GSL increased by 0.6 days for each 1 °C increase in the annual mean temperature.
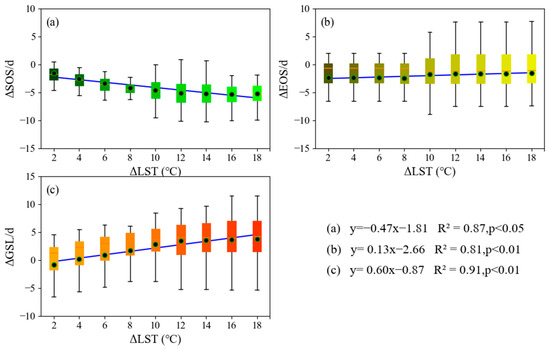
Figure 13.
The effect of surface temperature on urbanization-level phenology. (a) shows the variation in ∆SOS with temperature differences. (b) shows the variation in ∆EOS with temperature differences. (c) shows the variation in ∆GSL with temperature differences.
We calculated the contribution rate of temperature changes to vegetation phenology to distinguish the warming effect from the environmental effect of urbanization. For the relationships between ΔISP, ΔLST, and ΔSOS, the slopes of the ΔISP − ΔSOS normalization ranged from −0.75 to −0.95 when anchored to a given level. For ΔISP − ΔLST − ΔSOS, the slope ranged from −0.76 to −0.90 days per year. In terms of the relationships between ΔISP, ΔLST, and ΔEOS, the slopes of the ΔISP − ΔEOS normalized curves ranged from 0.80 to 0.96, and the slopes of the ΔISP − ΔLST − ΔEOS curves ranged from 0.75 to 0.95. Overall, the contribution of the LST in spring and fall ranged from 87 to 99%, indicating that urban warming was a major factor in the impact of urbanization on the SOS and EOS (Figure 14).
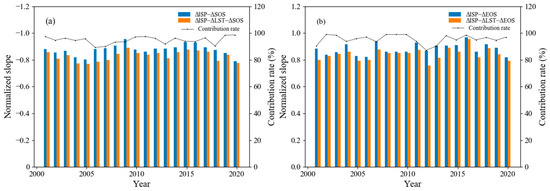
Figure 14.
The contribution of the surface temperature increase to phenological changes. (a) shows the contribution of surface temperature to the impact of urbanization on the SOS. (b) shows the contribution of surface temperature to the impact of urbanization on the EOS.
A combination of factors due to urbanization affected vegetation phenology. Studies have shown that there is a warming trend in temperature with increasing urbanization [47]. Warming can contribute to an earlier SOS and a delayed EOS. The urban thermal environment caused by rising temperatures was a major factor in the difference between urban and rural levels, which is identical to the results of existing studies [48].
4. Conclusions
This study extracted vegetation phenology based on MOD13Q1 vegetation index products from 2001 to 2020 and explored its spatial–temporal variation in the Yangtze River Delta. Furthermore, using impervious surface data and land cover data, the impact of urbanization on vegetation phenology was explored through a dynamic-level approach. The results showed that the SOS, EOS, and GSL were advanced by 0.41 days, delayed by 0.16 days, and extended by 0.57 days per year, respectively. Spatially, there were differences in the variability in phenology among rural, suburban, and urban areas, where suburban areas had the strongest variation in phenology, mainly because suburban areas are still experiencing the most dramatic stage of urban expansion and environmental changes. Additionally, due to the higher altitude of the southern region, the GSL in the southern region was shorter than that in the northern region. The correlation between vegetation phenology and the urbanization process is obvious. With each 10% increase in the urbanization level, the SOS, EOS, and GSL were advanced by 0.38 days, delayed by 0.34 days, and extended by 0.57 days per year, respectively, which was attributed to the temperature discrepancy in the city. The SOS was advanced by 0.47 days for every 1 °C increase in surface temperature, and the EOS was delayed by 0.13 days for every 1 °C increase in surface temperature. Overall, this study provides information on the dynamic response of vegetation phenology to urbanization and can aid in understanding the complex effects of urbanization on vegetation phenology, which is crucial for ecological planning in the process of urbanization.
Author Contributions
Conceptualization, E.Z. and L.C.; methodology, D.F.; software, D.F.; validation, E.Z.; formal analysis, Y.Q.; writing—original draft preparation, E.Z.; writing—review and editing, L.C. and T.L.; visualization, D.F.; funding acquisition, E.Z. All authors have read and agreed to the published version of the manuscript.
Funding
This research was funded by the National Natural Science Foundation of China, grant number 72104139; the Shanghai “Innovation Action Plan” Soft Science Project, grant number 23692120200; the MEL Visiting Fellowship, grant number MELRS2333; and the Science and Technology Commission of Shanghai Municipality (STCSM) Capacity Building Project of Local Universities, grant number 23010502200.
Data Availability Statement
The data that support the findings of this study are available by request to the corresponding author. The data are not publicly available due to data confidentiality.
Acknowledgments
The authors would like to acknowledge the editor and anonymous reviewers for improving the paper’s quality.
Conflicts of Interest
The authors declare no conflicts of interest.
References
- Zeng, L.; Wardlow, B.D.; Xiang, D.; Hu, S.; Li, D. A review of vegetation phenological metrics extraction using time-series, multispectral satellite data. Remote Sens. Environ. 2020, 237, 111511. [Google Scholar] [CrossRef]
- Shen, X.; Liu, B.; Henderson, M.; Wang, L.; Wu, Z.; Wu, H.; Jiang, M.; Lu, X. Asymmetric effects of daytime and nighttime warming on spring phenology in the temperate grasslands of China. Agric. For. Meteorol. 2018, 259, 240–249. [Google Scholar] [CrossRef]
- Wang, Y.Y.; Yuan, J.G.; Zhang, Y.; Wu, C.Y. Temporal and spatial variation of vegetation phenology in temperate China and its impact on gross primary productivity. Remote Sens. Technol. Appl. 2019, 34, 377–388. [Google Scholar]
- Shen, X.; Liu, B.; Xue, Z.; Jiang, M.; Lu, X.; Zhang, Q. Spatiotemporal variation in vegetation spring phenology and its response to climate change in freshwater marshes of Northeast China. Sci. Total Environ. 2019, 666, 1169–1177. [Google Scholar] [CrossRef] [PubMed]
- Singh, N.; Singh, S.; Mall, R. Urban ecology and human health: Implications of urban heat island, air pollution and climate change nexus. In Urban Ecology; Elsevier: Amsterdam, The Netherlands, 2020; pp. 317–334. [Google Scholar] [CrossRef]
- Yan, S.J.; Wang, H.; Jiao, K.W. Spatiotemporal Dynamics of NDVI in the Beijing-Tianjin-Hebei Region based on MODIS Data and Quantitative Attribution. J. Geo-Inf. Sci. 2019, 21, 767–780. [Google Scholar] [CrossRef]
- Du, H.; Wang, M.; Liu, Y.; Guo, M.; Peng, C.; Li, P. Responses of autumn vegetation phenology to climate change and urbanization at northern middle and high latitudes. Int. J. Appl. Earth Obs. Geoinf. 2022, 115, 103086. [Google Scholar] [CrossRef]
- Li, X.; Zhou, Y.; Asrar, G.R.; Meng, L. Characterizing spatiotemporal dynamics in phenology of urban ecosystems based on Landsat data. Sci. Total Environ. 2017, 605, 721–734. [Google Scholar] [CrossRef]
- Zhou, D.; Zhao, S.; Zhang, L.; Liu, S. Remotely sensed assessment of urbanization effects on vegetation phenology in China’s 32 major cities. Remote Sens. Environ. 2016, 176, 272–281. [Google Scholar] [CrossRef]
- Qiu, T.; Song, C.; Zhang, Y.; Liu, H.; Vose, J.M. Urbanization and climate change jointly shift land surface phenology in the northern mid-latitude large cities. Remote Sens. Environ. 2020, 236, 111477. [Google Scholar] [CrossRef]
- Li, X.; Zhou, Y.; Asrar, G.R.; Mao, J.; Li, X.; Li, W. Response of vegetation phenology to urbanization in the conterminous United States. Glob. Chang. Biol. 2017, 23, 2818–2830. [Google Scholar] [CrossRef]
- Zhao, C.; Weng, Q.; Wang, Y.; Hu, Z.; Wu, C. Use of local climate zones to assess the spatiotemporal variations of urban vegetation phenology in Austin, Texas, USA. GISci. Remote Sens. 2022, 59, 393–409. [Google Scholar] [CrossRef]
- Zhang, W.; Randall, M.; Jensen, M.B.; Brandt, M.; Wang, Q.; Fensholt, R. Socio-economic and climatic changes lead to contrasting global urban vegetation trends. Glob. Environ. Chang. 2021, 71, 102385. [Google Scholar] [CrossRef]
- Jia, W.; Zhao, S.; Zhang, X.; Liu, S.; Henebry, G.M.; Liu, L. Urbanization imprint on land surface phenology: The urban–rural gradient analysis for Chinese cities. Glob. Chang. Biol. 2021, 27, 2895–2904. [Google Scholar] [CrossRef]
- Zhang, Y.; Yin, P.; Li, X.; Niu, Q.; Wang, Y.; Cao, W.; Huang, J.; Chen, H.; Yao, X.; Yu, L. The divergent response of vegetation phenology to urbanization: A case study of Beijing city, China. Sci. Total Environ. 2022, 803, 150079. [Google Scholar] [CrossRef]
- Thompson, J.A.; Paull, D.J. Assessing spatial and temporal patterns in land surface phenology for the Australian Alps (2000–2014). Remote Sens. Environ. 2017, 199, 1–13. [Google Scholar] [CrossRef]
- Sarvia, F.; De Petris, S.; Borgogno-Mondino, E. Exploring climate change effects on vegetation phenology by MOD13Q1 data: The piemonte region case study in the period 2001–2019. Agronomy 2021, 11, 555. [Google Scholar] [CrossRef]
- Zhang, R.; Zhou, Y.; Hu, T.; Sun, W.; Zhang, S.; Wu, J.; Wang, H. Detecting the Spatiotemporal Variation of Vegetation Phenology in Northeastern China Based on MODIS NDVI and Solar-Induced Chlorophyll Fluorescence Dataset. Sustainability 2023, 15, 6012. [Google Scholar] [CrossRef]
- Zhou, Y.K.; Liu, J.W. Spatio-temporal analysis of vegetation phenology with multiple methods over the Tibetan Plateau based on modis NDVI data. Remote Sens. Technol. Appl. 2018, 33, 486–498. [Google Scholar] [CrossRef]
- Wu, Y.; Tang, G.; Gu, H.; Liu, Y.; Yang, M.; Sun, L. The variation of vegetation greenness and underlying mechanisms in Guangdong province of China during 2001–2013 based on MODIS data. Sci. Total Environ. 2019, 653, 536–546. [Google Scholar] [CrossRef]
- Ahmed, T.; Singh, D. Probability density functions based classification of MODIS NDVI time series data and monitoring of vegetation growth cycle. Adv. Space Res. 2020, 66, 873–886. [Google Scholar] [CrossRef]
- Tao, L.; Ryu, D.; Western, A.; Boyd, D. A new drought index for soil moisture monitoring based on MPDI-NDVI trapezoid space using MODIS data. Remote Sens. 2020, 13, 122. [Google Scholar] [CrossRef]
- Hu, P.; Sharifi, A.; Tahir, M.N.; Tariq, A.; Zhang, L.; Mumtaz, F.; Shah, S.H.I.A. Evaluation of vegetation indices and phenological metrics using time-series modis data for monitoring vegetation change in Punjab, Pakistan. Water 2021, 13, 2550. [Google Scholar] [CrossRef]
- Xin, Q.; Li, J.; Li, Z.; Li, Y.; Zhou, X. Evaluations and comparisons of rule-based and machine-learning-based methods to retrieve satellite-based vegetation phenology using MODIS and USA National Phenology Network data. Int. J. Appl. Earth Obs. Geoinf. 2020, 93, 102189. [Google Scholar] [CrossRef]
- Gong, P.; Li, X.; Wang, J.; Bai, Y.; Chen, B.; Hu, T.; Liu, X.; Xu, B.; Yang, J.; Zhang, W. Annual maps of global artificial impervious area (GAIA) between 1985 and 2018. Remote Sens. Environ. 2020, 236, 111510. [Google Scholar] [CrossRef]
- Yang, J.; Huang, X. The 30 m annual land cover dataset and its dynamics in China from 1990 to 2019. Earth Syst. Sci. Data 2021, 13, 3907–3925. [Google Scholar] [CrossRef]
- Li, N.; Zhan, P.; Pan, Y.; Zhu, X.; Li, M.; Zhang, D. Comparison of remote sensing time-series smoothing methods for grassland spring phenology extraction on the Qinghai–Tibetan Plateau. Remote Sens. 2020, 12, 3383. [Google Scholar] [CrossRef]
- Bornez, K.; Descals, A.; Verger, A.; Peñuelas, J. Land surface phenology from VEGETATION and PROBA-V data. Assessment over deciduous forests. Int. J. Appl. Earth Obs. Geoinf. 2020, 84, 101974. [Google Scholar] [CrossRef]
- Yu, Z.; Yao, Y.; Yang, G.; Wang, X.; Vejre, H. Spatiotemporal patterns and characteristics of remotely sensed region heat islands during the rapid urbanization (1995–2015) of Southern China. Sci. Total Environ. 2019, 674, 242–254. [Google Scholar] [CrossRef] [PubMed]
- Cai, Z.; Jönsson, P.; Jin, H.; Eklundh, L. Performance of smoothing methods for reconstructing NDVI time-series and estimating vegetation phenology from MODIS data. Remote Sens. 2017, 9, 1271. [Google Scholar] [CrossRef]
- Li, S.; Xu, L.; Jing, Y.; Yin, H.; Li, X.; Guan, X. High-quality vegetation index product generation: A review of NDVI time series reconstruction techniques. Int. J. Appl. Earth Obs. Geoinf. 2021, 105, 102640. [Google Scholar] [CrossRef]
- Liu, X.; Ji, L.; Zhang, C.; Liu, Y. A method for reconstructing NDVI time-series based on envelope detection and the Savitzky-Golay filter. Int. J. Digit. Earth 2022, 15, 553–584. [Google Scholar] [CrossRef]
- Tang, L.; Zhao, Z.; Tang, P.; Yang, H. SURE-based optimum-length SG filter to reconstruct NDVI time series iteratively with outliers removal. Int. J. Wavelets Multiresolut. Inf. Process. 2020, 18, 2050001. [Google Scholar] [CrossRef]
- Cong, N.; Piao, S.; Chen, A.; Wang, X.; Lin, X.; Chen, S.; Han, S.; Zhou, G.; Zhang, X. Spring vegetation green-up date in China inferred from SPOT NDVI data: A multiple model analysis. Agric. For. Meteorol. 2012, 165, 104–113. [Google Scholar] [CrossRef]
- White, M.; de Beurs, K.; Didan, K.; Inouye, D.; Richardson, A.; Jensen, O.; O’Keefe, J.; Zhang, G.; Nemani, R.; Van Leeuwen, W.; et al. Intercomparison, interpretation, and assessment of spring phenology in North America estimated from remote sensing for 1982–2006. Glob. Chang. Biol. 2009, 15, 2335–2359. [Google Scholar] [CrossRef]
- Liu, Z.; Zhou, Y.; Feng, Z. Response of vegetation phenology to urbanization in urban agglomeration areas: A dynamic urban–rural gradient perspective. Sci. Total Environ. 2023, 864, 161109. [Google Scholar] [CrossRef] [PubMed]
- Wang, L.; De Boeck, H.J.; Chen, L.; Song, C.; Chen, Z.; McNulty, S.; Zhang, Z. Urban warming increases the temperature sensitivity of spring vegetation phenology at 292 cities across China. Sci. Total Environ. 2022, 834, 155154. [Google Scholar] [CrossRef] [PubMed]
- Jiao, F.; Liu, H.; Xu, X.; Gong, H.; Lin, Z. Trend evolution of vegetation phenology in China during the period of 1981–2016. Remote Sens. 2020, 12, 572. [Google Scholar] [CrossRef]
- Cheng, M.; Jin, J.; Zhang, J.; Jiang, H.; Wang, R. Effect of climate change on vegetation phenology of different land-cover types on the Tibetan Plateau. Int. J. Remote Sens. 2018, 39, 470–487. [Google Scholar] [CrossRef]
- Wu, L.; Ma, X.; Dou, X.; Zhu, J.; Zhao, C. Impacts of climate change on vegetation phenology and net primary productivity in arid Central Asia. Sci. Total Environ. 2021, 796, 149055. [Google Scholar] [CrossRef] [PubMed]
- Deng, C.; Ma, X.; Xie, M.; Bai, H. Effect of altitude and topography on vegetation phenological changes in the Niubeiliang nature reserve of Qinling Mountains, China. Forests 2022, 13, 1229. [Google Scholar] [CrossRef]
- Shen, X.; Jiang, M.; Lu, X. Diverse impacts of day and night temperature on spring phenology in freshwater marshes of the Tibetan Plateau. Limnol. Oceanogr. Lett. 2023, 8, 323–329. [Google Scholar] [CrossRef]
- Lukasová, V.; Bucha, T.; Škvareninová, J.; Škvarenina, J. Validation and application of European beech phenological metrics derived from MODIS data along an altitudinal gradient. Forests 2019, 10, 60. [Google Scholar] [CrossRef]
- Hou, X.; Gao, S.; Sui, X.; Liang, S.; Wang, M. Changes in day and night temperatures and their asymmetric effects on vegetation phenology for the period of 2001–2016 in northeast China. Can. J. Remote Sens. 2018, 44, 629–642. [Google Scholar] [CrossRef]
- Ren, Q.; He, C.; Huang, Q.; Zhou, Y. Urbanization impacts on vegetation phenology in China. Remote Sens. 2018, 10, 1905. [Google Scholar] [CrossRef]
- Ruan, Y.; Zhang, X.; Xin, Q.; Ao, Z.; Sun, Y. Enhanced vegetation growth in the urban environment across 32 cities in the Northern Hemisphere. J. Geophys. Res. Biogeosci. 2019, 124, 3831–3846. [Google Scholar] [CrossRef]
- Kabano, P.; Lindley, S.; Harris, A. Evidence of urban heat island impacts on the vegetation growing season length in a tropical city. Landsc. Urban Plan. 2021, 206, 103989. [Google Scholar] [CrossRef]
- Meng, L.; Mao, J.; Zhou, Y.; Richardson, A.D.; Lee, X.; Thornton, P.E.; Ricciuto, D.M.; Li, X.; Dai, Y.; Shi, X. Urban warming advances spring phenology but reduces the response of phenology to temperature in the conterminous United States. Proc. Natl. Acad. Sci. USA 2020, 117, 4228–4233. [Google Scholar] [CrossRef]
Disclaimer/Publisher’s Note: The statements, opinions and data contained in all publications are solely those of the individual author(s) and contributor(s) and not of MDPI and/or the editor(s). MDPI and/or the editor(s) disclaim responsibility for any injury to people or property resulting from any ideas, methods, instructions or products referred to in the content. |
© 2024 by the authors. Licensee MDPI, Basel, Switzerland. This article is an open access article distributed under the terms and conditions of the Creative Commons Attribution (CC BY) license (https://creativecommons.org/licenses/by/4.0/).
