Article

Stationary Detection for Zero Velocity Update of IMU Based on the Vibrational FFT Feature of Land Vehicle

1
Institute of Space Sciences, Shandong University, Weihai 264209, China
2
Research Group of Astronomy and Geomatics (gAGE), Universitat Politecnica de Catalunya (UPC), 08034 Barcelona, Spain
*
Author to whom correspondence should be addressed.
Remote Sens. 2024, 16(5), 902; https://doi.org/10.3390/rs16050902
Submission received: 19 January 2024 / Revised: 24 February 2024 / Accepted: 25 February 2024 / Published: 4 March 2024

Abstract

:
The inertial navigation system (INS) and global satellite navigation system (GNSS) are two of the most significant systems for land navigation applications. The inertial measurement unit (IMU) is a kind of INS sensor that measures three-dimensional acceleration and angular velocity measurements. IMUs based on micro-electromechanical systems (MEMSs) are widely employed in vehicular navigation thanks to their low cost and small size, but their magnitude and noisy biases make navigation errors diverge very fast without external constraint. The zero-velocity update (ZVU) function is one of the efficient functions that constrain the divergence of IMUs for a stopped vehicle, and the key of the ZVU is the correct stationary detection for the vehicle. When a land vehicle is stopped, the idling engine produces a very stable vibration, which allows us to perform frequency analysis and a comparison based on the fast Fourier transform (FFT) and IMU measurements. Hence, we propose a stationary detection method based on the FFT for a stopped land vehicle with an idling engine in this study. An urban vehicular navigation experiment was carried out with our GNSS/IMU integration platform. Three stops for 10 to 20 min were set to analyze, generate and evaluate the FFT-based stationary detection method. The FFT spectra showed clearly idling vibrational peaks during the three stop periods. Through the comparison of FFT spectral features with decelerating and accelerating periods, the amplitudes of vibrational peaks were put forward as the key factors of stationary detection. For the consecutive stationary detection in the GNSS/IMU integration process, a three-second sliding window with a one-second updating rate of the FFT was applied to check the amplitudes of peaks. For the assessment of the proposed stationary detection method, GNSS observations were removed to simulate outages during the three stop periods, and the proposed detection method was conducted together with the ZVU. The results showed that the proposed method achieved a 99.7% correct detection rate, and the divergence of the positioning error constrained via the ZVU was within 2 cm for the experimental stop periods, which indicates the effectiveness of the proposed method.

1. Introduction

An inertial navigation system (INS) measures specific forces and the angular velocity of its carrier using accelerometers and gyroscopes [1,2]. The direct dynamic measurements of the carrier make the INS capable of processing independent navigation and avoiding external interference for the user. The inertial measurement unit (IMU) is a kind of INS sensor that generally combines three accelerometers and three gyroscopes to produce three-dimensional acceleration and angular velocity measurements. Due to comprising small size, lightweight and low-cost IMUs, micro-electromechanical systems (MEMSs) are widely applied in vehicular navigation with the global navigation satellite system (GNSS) and other sensors [3,4,5]. Nevertheless, magnitude and noisy biases make MEMSs perform poorly in solo-IMU processing, as errors of navigation parameters accumulate quickly via IMU mechanization, i.e., integrating IMU acceleration and angular velocity measurements to update attitude, velocity and position [6].
To apply the independent observations of an IMU without error accumulation in navigation applications, the integration between the INS and other positioning sensors, like the GNSS, camera and lidar, is well studied and practiced [7,8,9]. In the integrated processing, the GNSS provides absolute geometric observations to align the INS to the Earth-centered Earth-fixed (ECEF) frame and assists with the correction of INS errors [10,11]. However, the GNSS signals are usually weakened and blocked for dynamic users in urban canyons, tunnels or other occluded environments [12,13,14]. When there is a lack of geometric constraints from other sensors, like the GNSS, the navigation errors produced via the INS diverge rapidly and terminate accurate navigation.
One of the solutions for inhibiting the divergence of IMU errors in the outage of the other sensors is zero-the velocity update (ZVU) constraint [15]. For land vehicles, employing a ZVU-based GNSS/IMU system was found to benefit both ambiguity resolution and positioning accuracy with GNSS-observation gaps in urban canyons [15]. Applying a ZVU and nonholonomic constraint for the land vehicular GNSS/IMU integration system was able to improve the positioning accuracy by 23.3% and 34.3% with GNSS outages of 30 and 60 s, respectively [6]. For a high-grade IMU, the ZVU could also reduce the velocity and position errors to 24.2% and 9.2% in a five-hour solo-IMU vehicular experiment with frequent and short as well as ten-minute stops [16].
The precondition for applying a ZVU constraint is detecting when a vehicle is going to stop. Many efforts that relied on the velocity, acceleration and angular velocity produced via a vehicular IMU have been made to detect the stationary condition for vehicles [10]. Both velocity and angular velocity were suggested to be compared with a specified threshold, while the standard deviation (STD) was proposed to calculate the vehicle acceleration in a sliding window and was used to compare it with the threshold deduced from the stationary data [6,15]. An attitude heading reference system was put forward to detect the stationary states with acceleration data, which achieved an 87% correction rate in a vehicular test [17,18]. A neural network was also trained to use velocity and IMU measurements for stationary detection in GNSS outages [16,19]. A frequency domain method of forward acceleration was proposed to detect the stationary states, and the frequency in the region of common vehicular vibration was eliminated from the method [20,21]. These previous works focus more on the value and STD of the IMU measurements; however, the feature of the acceleration and angular velocity in the frequency domain has not been considered enough. For the stationary detection of land vehicles, this work focuses on the vibration of an idling engine.
The vibrational frequencies of an idling engine have been studied well regarding land vehicles. The vibration of an idling engine was first taken into account for the optimization of engine mounting systems within the frequency range from 6 to 20 Hz [22,23]. The vibrational frequency of an idling engine was found to be mostly determined by the engine’s revolutions per minute (RPM) and its number of cylinders [24,25,26]. Generally, the vibrational frequency of a land vehicle caused by an idling engine ranges from 10 to 50 Hz [24,25,26,27,28]. When the vehicle is in an idling status, the resonant peak at the double dominant frequency is distinct and considerable [24,25]. It is worth noting that the IMU data sampling frequency is usually in the range of 100 to 200 Hz; hence, the vibrational frequency caused by an idling engine can be availably reflected with the IMU [2,6,10].
This paper proposes a novel stationary detection method based on the fast Fourier transform (FFT) and vibrational features of an idling engine. The algorithm of the FFT is introduced in the Section 2. To assess the proposed method, an urban vehicular navigation experiment and the conducted GNSS/IMU integration system are presented in the Experimental Setup. Based on the three stops designed for the vehicular test, the FFT features of a vehicle in stationary, decelerating and accelerating states are analyzed. The stationary detection method is put forward according to the found features and is applied for the three stop periods together with a three-second sliding window. Finally, the FFT-based stationary detection for land vehicles is evaluated using the correct rate and positioning error constrained by the ZVU.

2. Methods

The key of the proposed stationary detection approach is generating the features of stopped and idling vehicles. For a usual land vehicle, the vibrational frequency of an idling engine falls in the range of 10 to 50 Hz [24,25,26,27,28]. Thus, with the assistance of IMU measurements at a high sampling rate, the FFT serves as a powerful algorithm for spectral analysis in the frequency range of an idling vehicle.

2.1. FFT-Based Vibration Frequency Analysis

Fourier analysis transforms a signal from the original time domain into a representation in the frequency domain. Natural signals, such as the vibration of an object, are continuous (i.e., without gaps). Typically, vibrational signals related to acceleration or angular velocity in each direction of the body frame can be written as the sum of several sinusoidal functions:
V ( t ) = j = 1 n A j sin ( 2 π f j t + φ j ) = j = 1 n V j ( t )
where V ( t ) and V j ( t ) denote the total and the j th component of vibration, respectively; A j , f j and φ j represent the amplitude, frequency and initial phase of the single vibration component, respectively.
However, the signals recorded by sensors like IMUs are discrete. The Discrete Fourier Transform (DFT) offers a solution for converting a finite sequence of equally spaced samples into a sequence of complex numbers containing the frequency information [29]. The DFT for a measurement sequence of length N is defined as follows:
F ( k ) = n = 0 N 1 e 2 π i k n N M ( n ) ,   k = 0 N 1
where M ( n ) denotes the n th measurement in the real sequence, F ( k ) represents the k th component of the DFT and i is the imaginary unit.
With the increase in the length of the sequence, the original DFT requires significantly more resources, as the computation complexity of the DFT is O ( N 2 ) . To address this, the FFT is proposed to reduce the computation complexity of the DFT to O ( N log N ) [30]. The radix-2 decimation-in-time (DIT) FFT derived from the Cooley–Tukey algorithm is one of the most commonly used solutions that has been widely applied in many domains [31,32]. The promoted DIT algorithm can be expressed as follows:
F ( k ) = n = 0 N / 2 1 e 2 π i k n N / 2 M ( 2 n ) + n = 0 N / 2 1 e 2 π i k n N / 2 M ( 2 n + 1 )
F ( k + N 2 ) = n = 0 N / 2 1 e 2 π i k n N / 2 M ( 2 n ) n = 0 N / 2 1 e 2 π i k n N / 2 M ( 2 n + 1 )
In this algorithm, the computation is simplified by dividing the original discrete sequence into even ( 2 n ) and odd ( 2 n + 1 ) parts, each with a length of N / 2 .
For the FFT, the maximum frequency that can be analyzed within one consecutive measurement sequence is determined by its sampling rate, while the frequency resolution depends on the total time span covered by the sequence as expressed in the following equations:
max ( f F F T ) = 1 2 f m e a s
Δ f F F T = 1 T m e a s
where f F F T is the frequency sequence obtained via the FFT algorithm; f m e a s and T m e a s represent the sampling rate and the time length covering all the measurements, respectively.

2.2. ZVU Constraint in GNSS/IMU Tight Integration

In the GNSS/IMU integration process, GNSS provides absolute position information for IMU to correct navigation errors and align to the ECEF frame. In the present contribution, the kinematic Precise Point Positioning (PPP) is employed for processing multi-GNSS dual-frequency Ionosphere-Free (IF) observations. The state parameters for multi-GNSS IF kinematic PPP and the corresponding observation equations within an extended Kalman filter (EKF) are defined as follows [33,34,35]:
X G , k T = δ p 1 × 3 e δ c r δ I S B 1 × s 1 δ t r o r δ N L C , 1 × m k
L G , k = φ G , k ρ G , k = H G , k X G , k V G , k
H G , k = H φ , k H ρ , k = H p , k 1 H I S B , k H t r o , k H N , k H p , k 1 H I S B , k H t r o , k 0 k
where δ c r , δ I S B , δ t r o and δ N L C denote the errors of the receiver clock, intersystem bias (ISB), tropospheric delay and IF ambiguity, respectively. It is important to note that the italic symbols denote values or numbers, whereas bold symbols represent vectors or matrices. s and m represent the number of employed constellations and IF carrier-phase measurements, respectively; the subscript k denotes the epoch index; L G , k and V G , k represent the multi-GNSS observation vector and the corresponding residual vector, respectively; φ G , k and ρ G , k are carrier-phase and pseudo-range measurements minus the modeled terms, respectively; H G , k is the PPP design matrix; H φ , k , H ρ , k , H p , k , H I S B , k , H t r o , k and H N , k represent the design matrices of the corresponding measurement or state parameters in regard to their subscripts.
In the GNSS/IMU integration process, the state parameters of IMU for the EKF are defined as follows:
X I , k T = δ ε 1 × 3 e δ v 1 × 3 e δ p 1 × 3 e δ b a 1 × 3 b δ b g 1 × 3 b k
where the superscript e stands for the ECEF frame and b stands for the body frame. In this study, the body frame is defined as the vehicular body Right–Forward–Up (RFU) frame with the same origin as the IMU center. Finally, δ ε , δ v , δ p , δ b a and δ b g represent the error of attitude, velocity, position, accelerometer bias and gyroscope bias, respectively [10].
For a stopped vehicle, ZVU is a common constraint used to inhibit the divergence of IMU errors. The observation equation for the ZVU constraint at epoch k , with respect to the IMU state parameters, is as follows:
L Z V U T , k = v i m u , k e = H Z V U T , k X I , k T V Z V U T , k
H Z V U T , k = [ 0 3 × 3 I 3 × 3 0 3 × 3 0 3 × 3 0 3 × 3 ]
where L Z V U T , k and V Z V U T , k represent the observation vector and the corresponding residual vector, respectively; H Z V U T , k denotes the design matrix; v i m u , k e is the velocity in the ECEF frame as produced by the IMU mechanization; I denotes the identity matrix.
By combining (7) to (12), one can derive the integrated equation for the ZVU constraint-based GNSS-PPP/IMU tight integration as follows [10]:
X k T = X I , k T δ c r δ I S B 1 × s 1 δ t r o r δ N L C , 1 × m k
L k = φ G , k ρ G , k v i m u , k e = H k X k V k
H k = H T C , φ , k H T C , ρ , k H Z V U T , k = 0 0 H p , k 0 0 1 H I S B , k H t r o , k H N , k 0 0 H p , k 0 0 1 H I S B , k H t r o , k 0 0 I 0 0 0 0 0 0 0
where H T C , φ , k and H T C , ρ , k represent the multi-GNSS design matrix in the GNSS-PPP/IMU tightly integrated equation, as the position errors are uniform with the IMU.
In the present work, Equations (13)–(15) are adopted to implement the GNSS-PPP/IMU tight integration when the vehicle is stopped. When the GNSS signals are blocked or simulated to be in outage during the vehicle stop periods, Equations (10)–(12) are employed for ZVU constraint processing.

3. Experimental Setup

3.1. Hardware Platform

A GNSS/IMU hardware platform was established for testing the land vehicular navigation. Figure 1 depicts the configuration and equipment of the hardware platform on the car. The GNSS receiver and IMU fusion instrument, NovAtel PwrPak7-E2, was secured in the middle of the platform with screws. The GNSS antenna was mounted in front of the IMU within the vehicular body frame. The entire platform was tightly hinged to the roof of the car.
The IMU integrated in the PwrPak7-E2 receiver is the MEMS EG370N with the specification parameters listed in Table 1. The magnitude of gyroscope bias is in the order of hundreds of deg/h with a stability of less than 1 deg/h. The PwrPak7-E2 receiver is capable of tracking multi-GNSS signals from GPS, GLONASS (GLO), Galileo (GAL) and BDS. The produced pseudo-range and carrier-phase measurements were used for the tight integration of the GNSS with the IMU.

3.2. Experimental Strategy

To evaluate the availability of FFT-based stationary detection with an IMU for an idling car, a vehicular test supported by the GNSS/IMU hardware platform was conducted on a Toyota Prado 2016 with the engine of 7GR-FKS from the GPS time (GPST) 12 October 2021 01:55:20 to 03:50:45. Figure 2 depicts the test trajectory in the urban area of Weihai City, China. The car started moving after the turn-on of the hardware platform and moved forward in a straight line for a while to initialize the yaw angle of the IMU. After aligning the IMU, the vehicle was stopped with the engine idling for three periods lasting 10 to 20 min each. The time spans of these three stops, along with the associated ten-second decelerating and accelerating phases, are detailed in Table 2. The IMU measurements of accelerations and gyroscopes during these three stop periods were used to implement FFT processing to examine the vibrational features of our stationary idling vehicle. Based on the experimental evidence, a three-second sliding window FFT was employed for the stationary detection. To evaluate the proposed detection method, GNSS observations were removed to simulate a complete GNSS outage during each stop period. Then, the proposed detection method was implemented together with the ZVU constraint. Finally, the correct detection rate was calculated, and the positioning errors were compared with the errors of solo-IMU processing without the ZVU constraint.
The EKF-based GNSS-PPP/IMU tight integration was conducted to obtain the navigation solution for the entire trajectory, with the processing strategy detailed in Table 3. The kinematic PPP was implemented to obtain the multi-GNSS observation equations for the tight integration with the IMU. The IF combination was utilized to eliminate 99.9% of the ionospheric delay in GNSS measurements. Positioning errors, receiver clock errors, tropospheric delay, intersystem bias and carrier-phase ambiguities were set as the filter state parameters to be estimated. The base station equipped with a Septentrio PolaRx5 receiver was used to obtain a high-accuracy reference position for the trajectory, by employing multi-GNSS double-differenced (DD) Real-Time Kinematics (RTK) [33]. The GNSS Doppler velocity was used to initialize the yaw of the IMU, while the roll and pitch were initialized based on the direction of gravity [10]. Note that all accelerometer and gyroscope measurements of the IMU were converted from the IMU frame to the vehicular RFU body frame. Hence, in the present paper, the accelerometer X, Y and Z measurements represent right, forward and up accelerations, respectively, and the gyroscope X, Y and Z measurements account for the angular rotational velocity of pitch, roll and yaw, respectively. The sampling rate of the MEMS IMU is 200 Hz, resulting in the maximum FFT frequency of 100 Hz as derived from (5).

4. Experimental Results and Discussion

This section describes how the DIT FFT algorithm, as introduced previously in the Methods, was employed to analyze the vibrational features of the idling vehicle. The consecutive measurements from IMU accelerometers and gyroscopes during the three stop periods are addressed using the FFT. In order to compare the results, the decelerating and accelerating periods before and after the three stops are also processed by the FFT algorithm. A stationary detection based on a three-second sliding window method is proposed to extract the FFT features. The present section ends with the artificial removal of GNSS observations during the three stop periods to simulate a complete GNSS outage. Then, the three stop periods are re-assessed using the proposed method and constrained by ZVU. Finally, the correct detection rate is calculated as a reliable indicator of the proposed method, and the results of the IMU constrained by ZVU are presented in comparison with the results without constraints for a complete evaluation.

4.1. FFT Features of Acceleration and Angular Velocity for Stationary Idling Vehicle

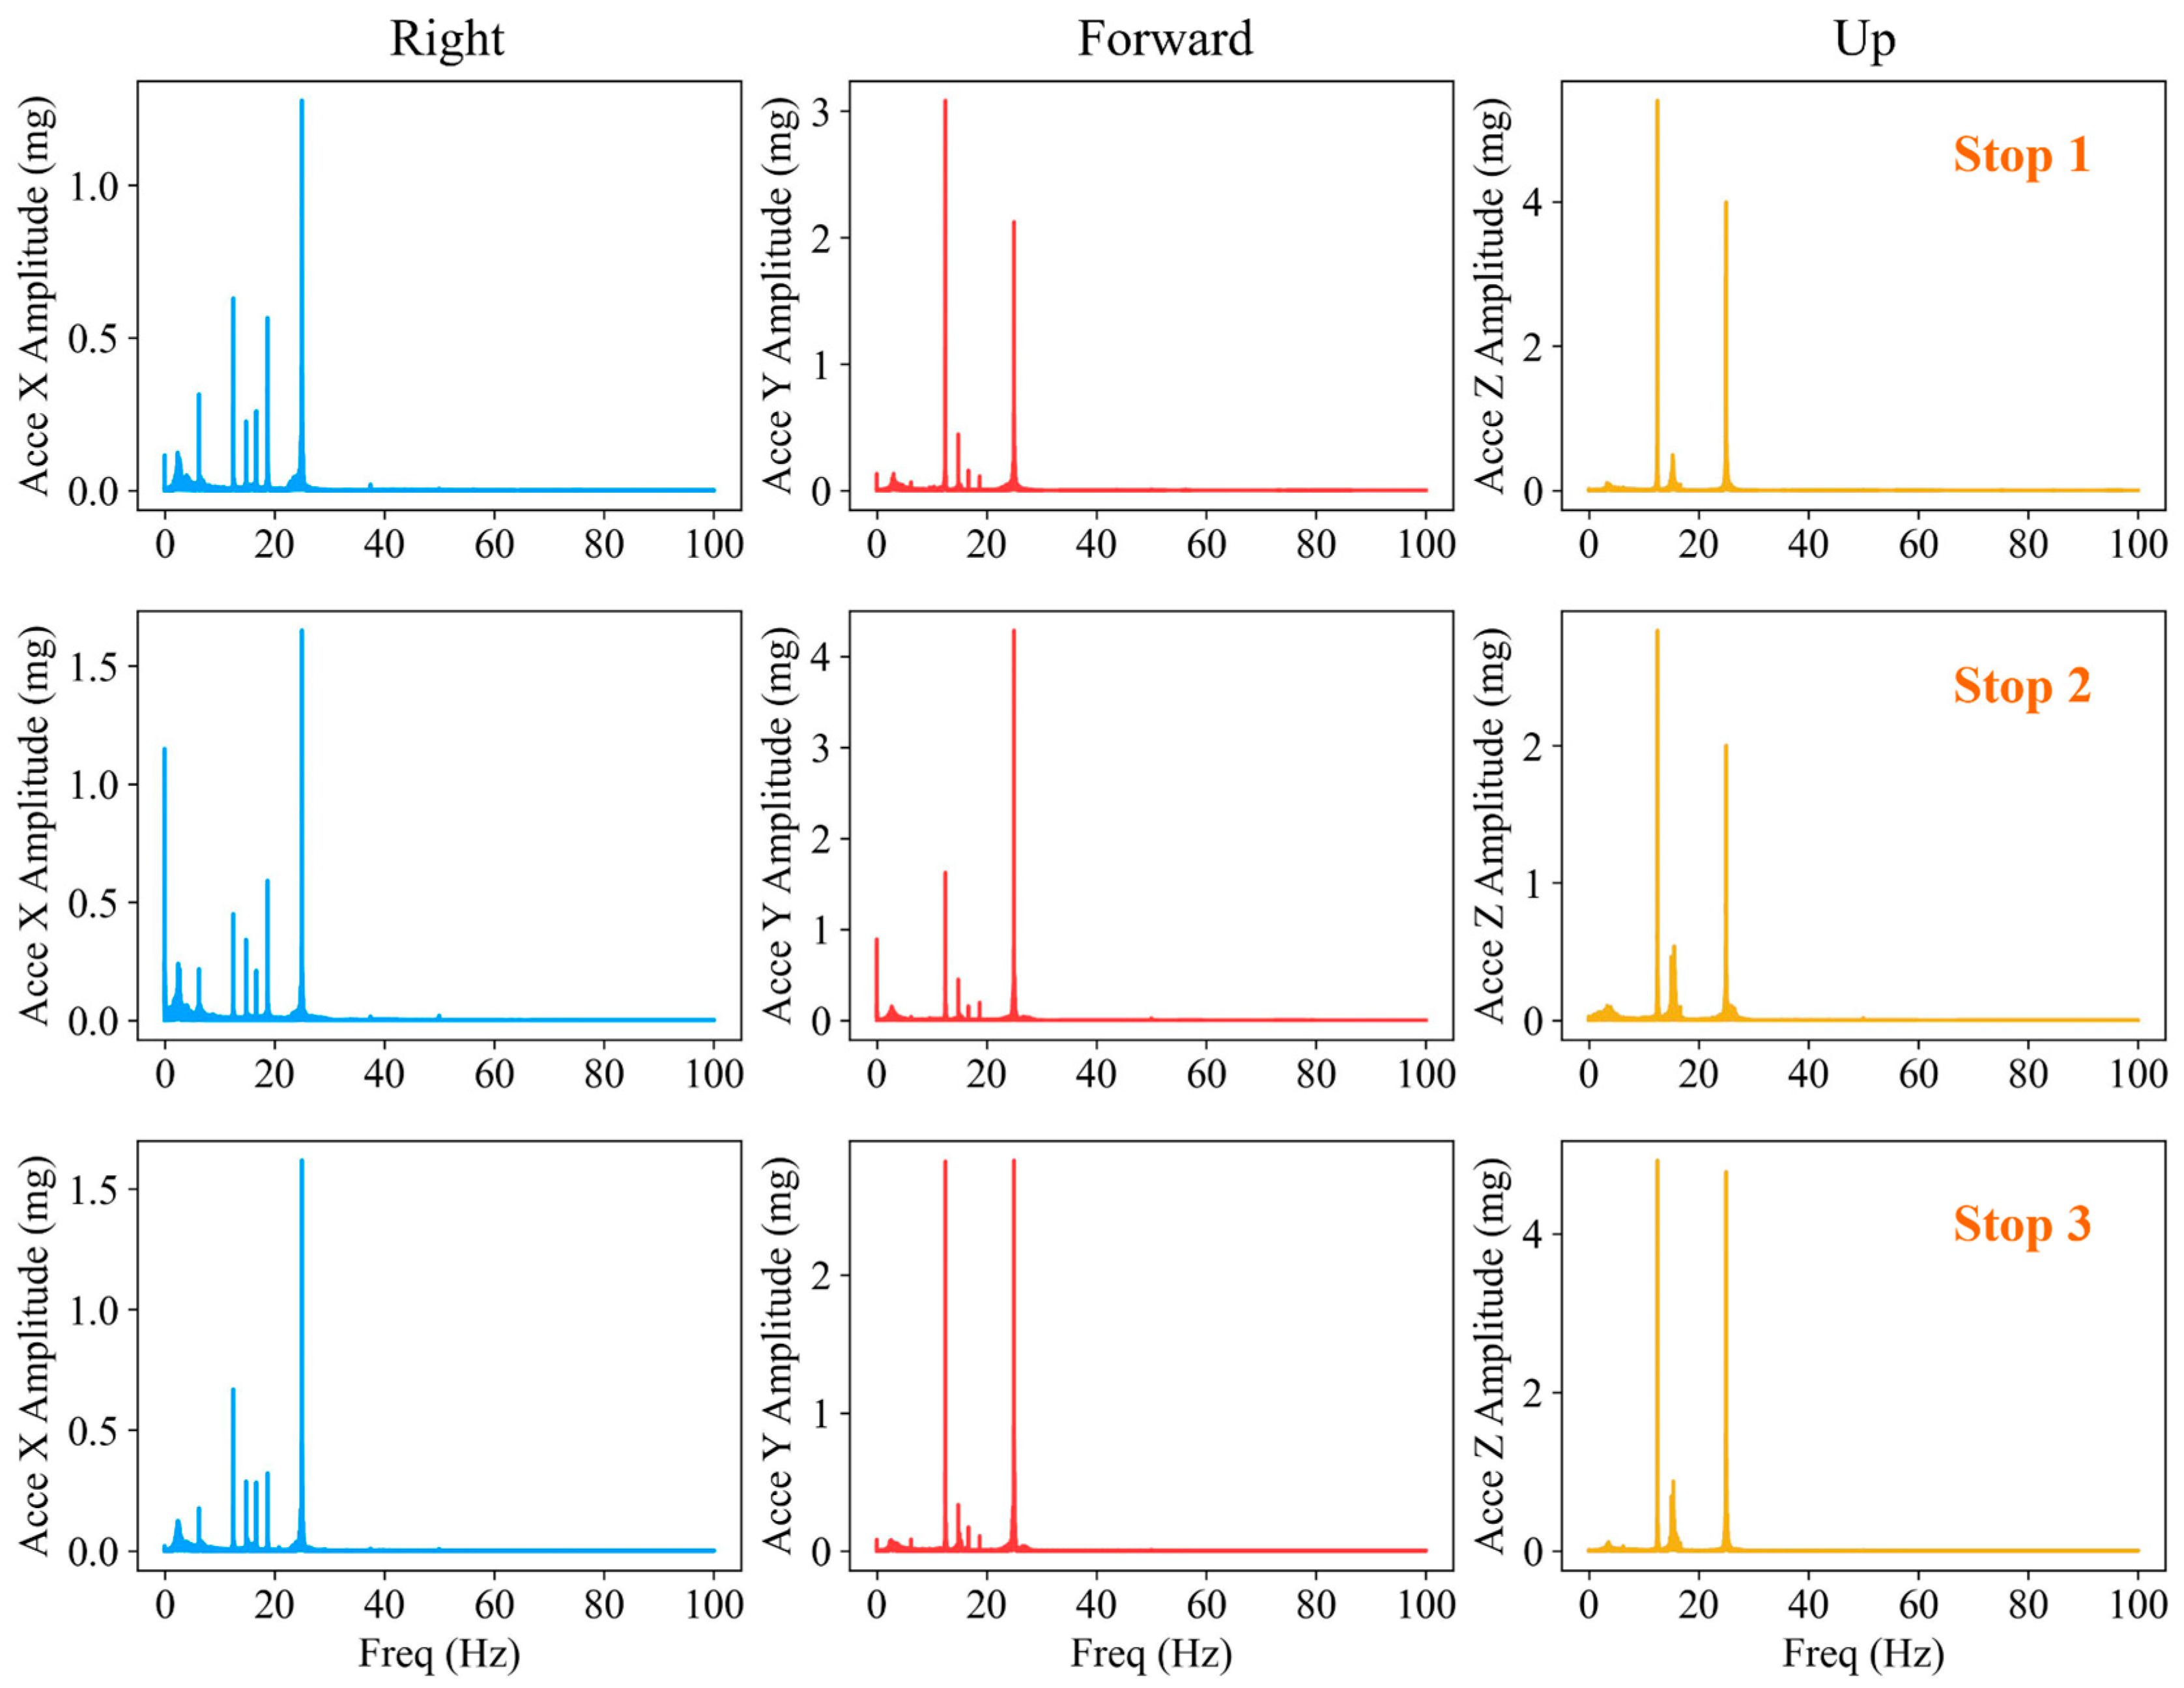
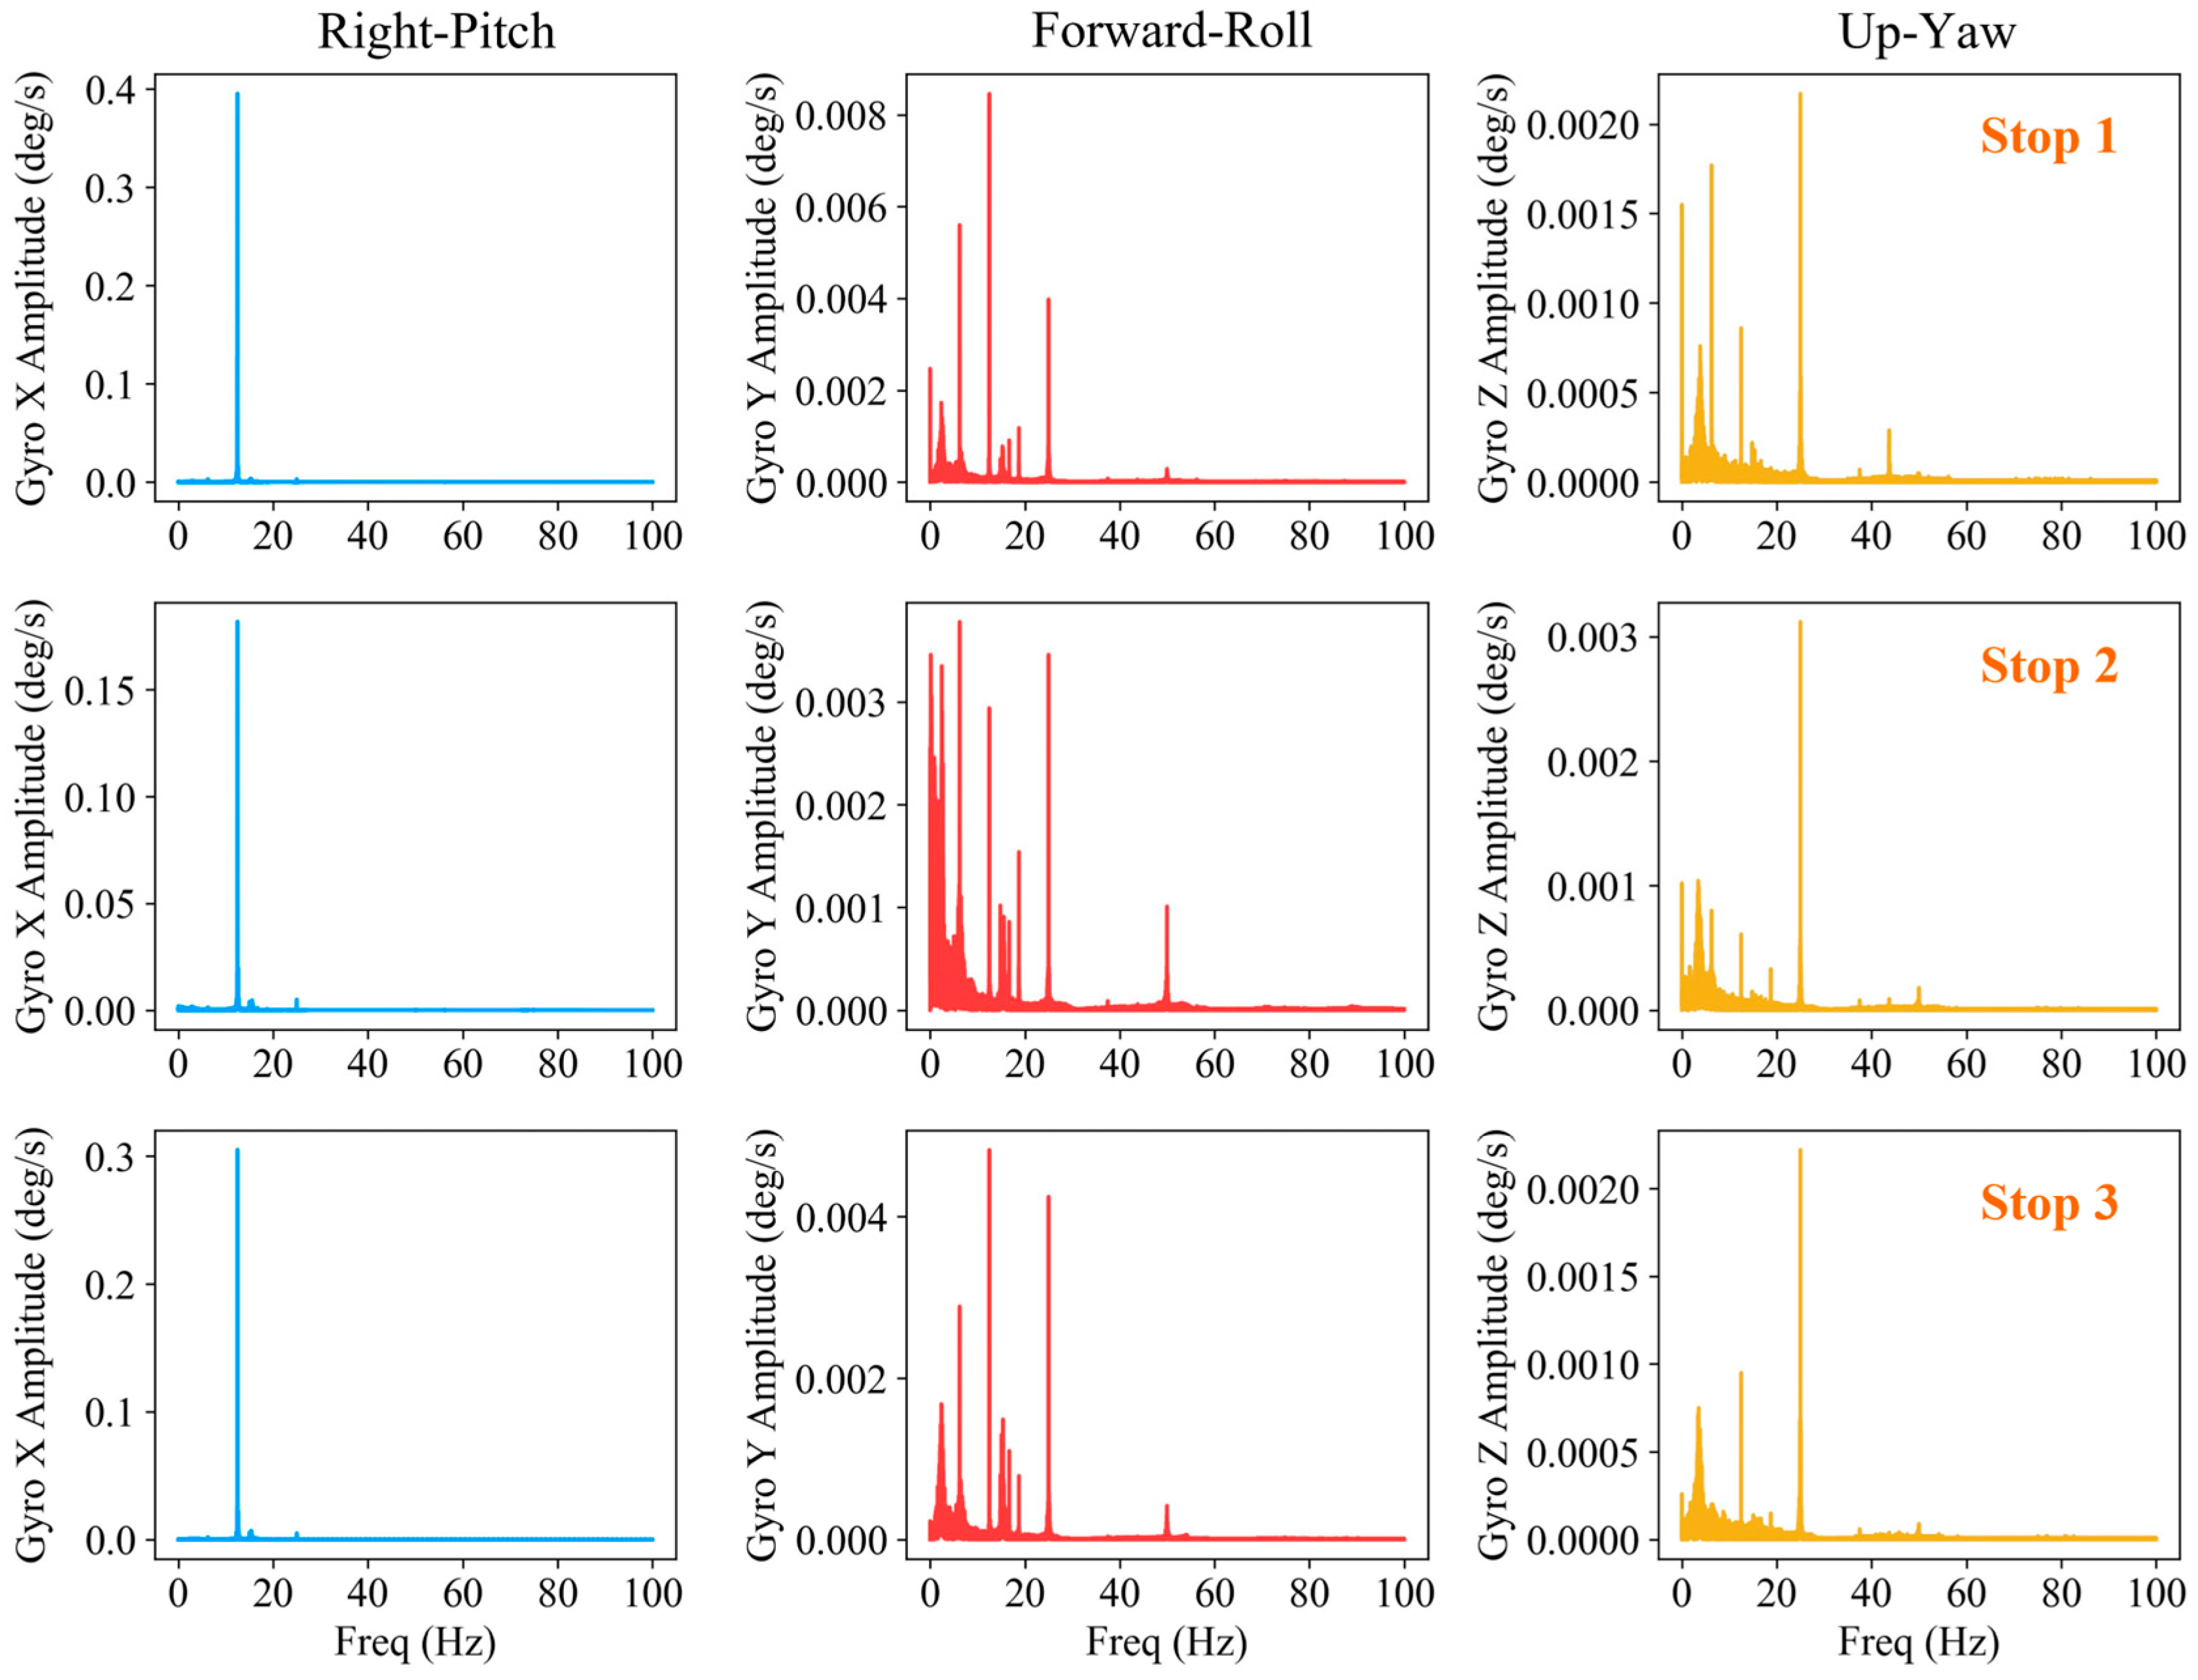
Figure 3 depicts the FFT spectrum of acceleration amplitude with respect to frequency for the three stop periods. The IMU acceleration reveals several obvious peaks in all the three directions during the stationary period. Moreover, the two highest peaks in the ranges of 10 to 20 Hz and 20 to 30 Hz show significantly greater amplitude compared to the other frequencies in the forward and up directions. The frequencies of the two peaks correspond to the general vibration frequency range of 10 to 50 Hz for an idling vehicle [24,25,26,27,28]. Although the same apparent peak is observed from 10 to 20 Hz in the right direction, there is no peak within the 20 to 30 Hz range, which is accompanied by more noise than in the other two directions. In contrast, gyroscope measurements presented opposite features, as depicted in Figure 4. The angular velocity presents only one distinct peak within the 10 to 20 Hz range along the X-axis. Even though the gyroscope spectra show the same peaks as the accelerometers within the 10 to 20 Hz and 20 to 30 Hz ranges along the Y- and Z-axes, too many strong chaotic peaks mask these two peaks. The opposite behavior in axes between accelerometers and gyroscopes is caused by the orthogonality of acceleration and angular velocity vectors in periodic vibrations.
The FFT spectra of accelerometers and gyroscopes clearly delineate the vibrational peaks within the 10 to 20 Hz and 20 to 30 Hz ranges. To analyze these peaks, the spectra are segmented into three frequency ranges: 0 to 10 Hz, 10 to 20 Hz and 20 to 30 Hz, with the statistics of these peaks summarized in Table 4. The result indicates that the frequencies of the highest peaks within the 10 to 20 Hz and 20 to 30 Hz ranges are 12.495 Hz and 24.991 Hz, respectively. The dominant frequency is 12.495 Hz, which indicates that the idling speed of the engine of the experimental vehicle is approximately 750 RPM [24,25]. For simplicity, the peaks at 12.495 Hz and 24.991 Hz are designated as Peak-1 and Peak-2, respectively, with the frequency of the latter being the twice that of the former. These two frequencies are consistent for both acceleration and angular velocity across the three stop periods, as the STDs are even less than the FFT frequency interval. Note that the FFT frequency intervals derived from (6) for the three stop periods are 1 × 10⁻³, 7 × 10⁻⁴ and 8 × 10⁻⁴ Hz, respectively, corresponding to the duration of each stop. For the pitch angular velocity, only Peak-1 is prominent compared to the other frequencies. The highest peaks within the 0 to 10 Hz range (denoted by Peak-0) exhibit more uncertainty with the STDs of frequencies ranging from 0.1 Hz to several Hz. Overall, the amplitudes of Peak-1 and Peak-2 are 7 and 37 times greater than that of Peak-0 for the forward and up acceleration, respectively, and the amplitude of Peak-1 is 67 times greater than that of Peak-0 for the pitch angular velocity.

4.2. FFT Features of Acceleration and Angular Velocity in Decelerating and Accelerating

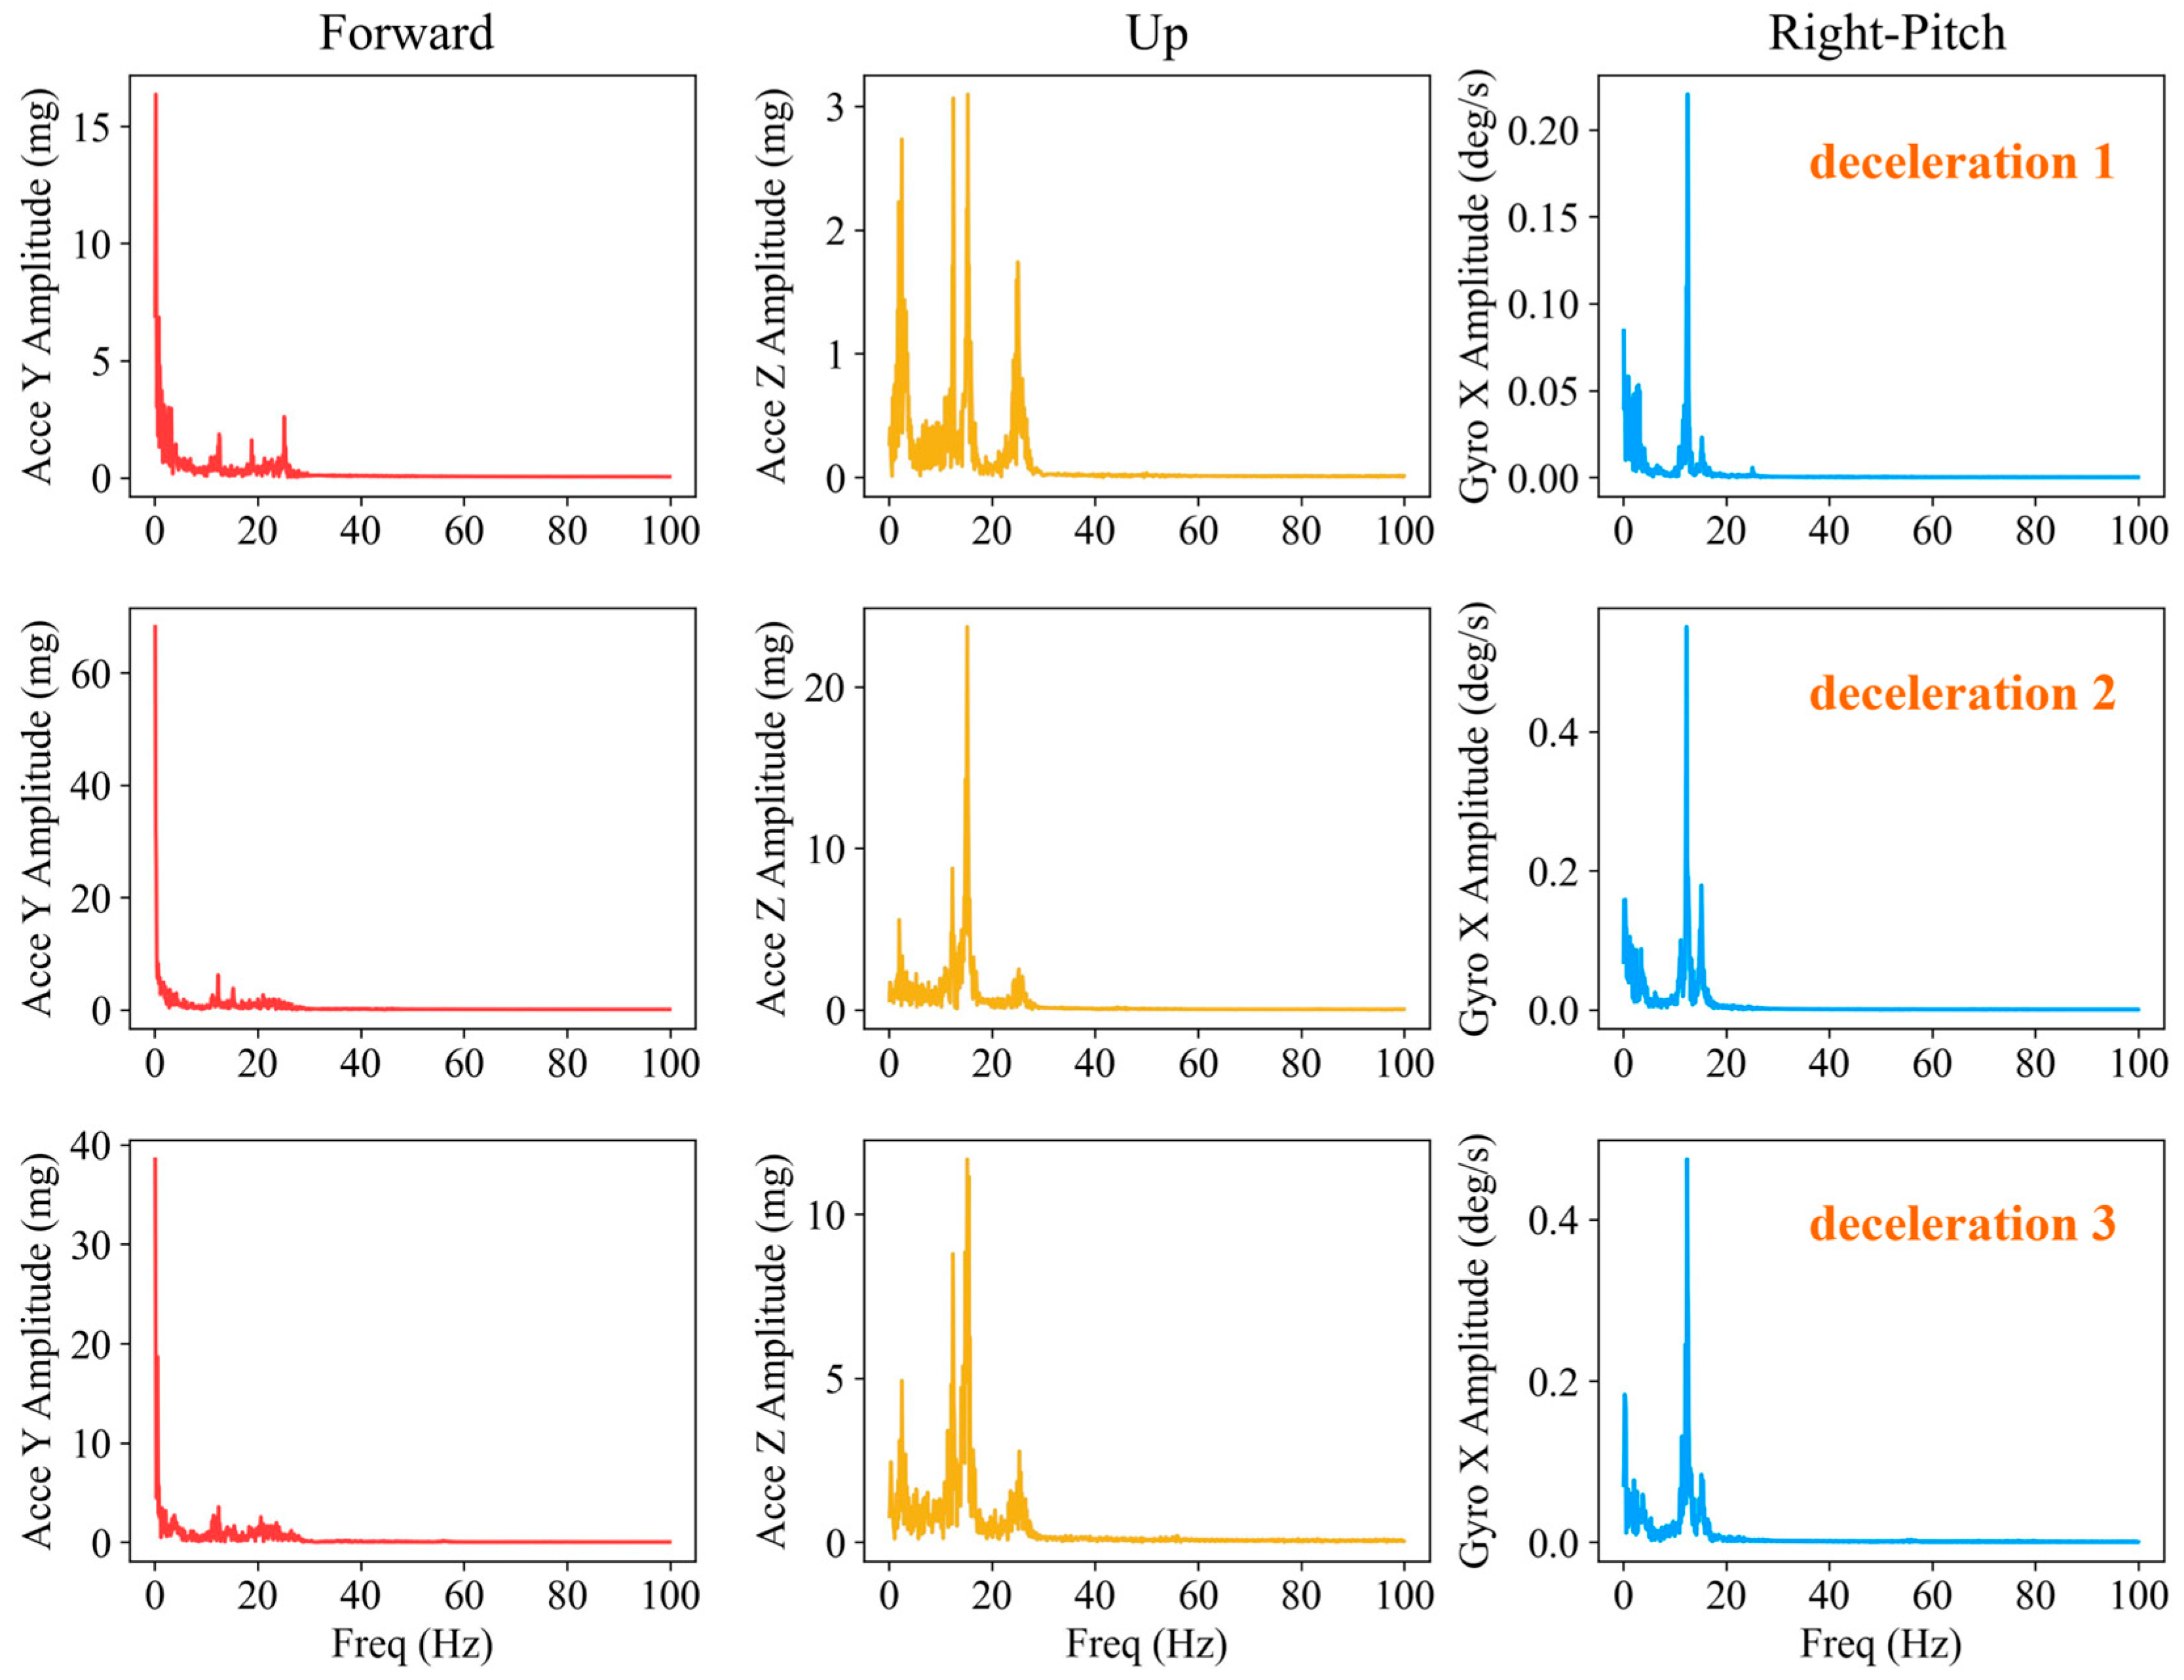
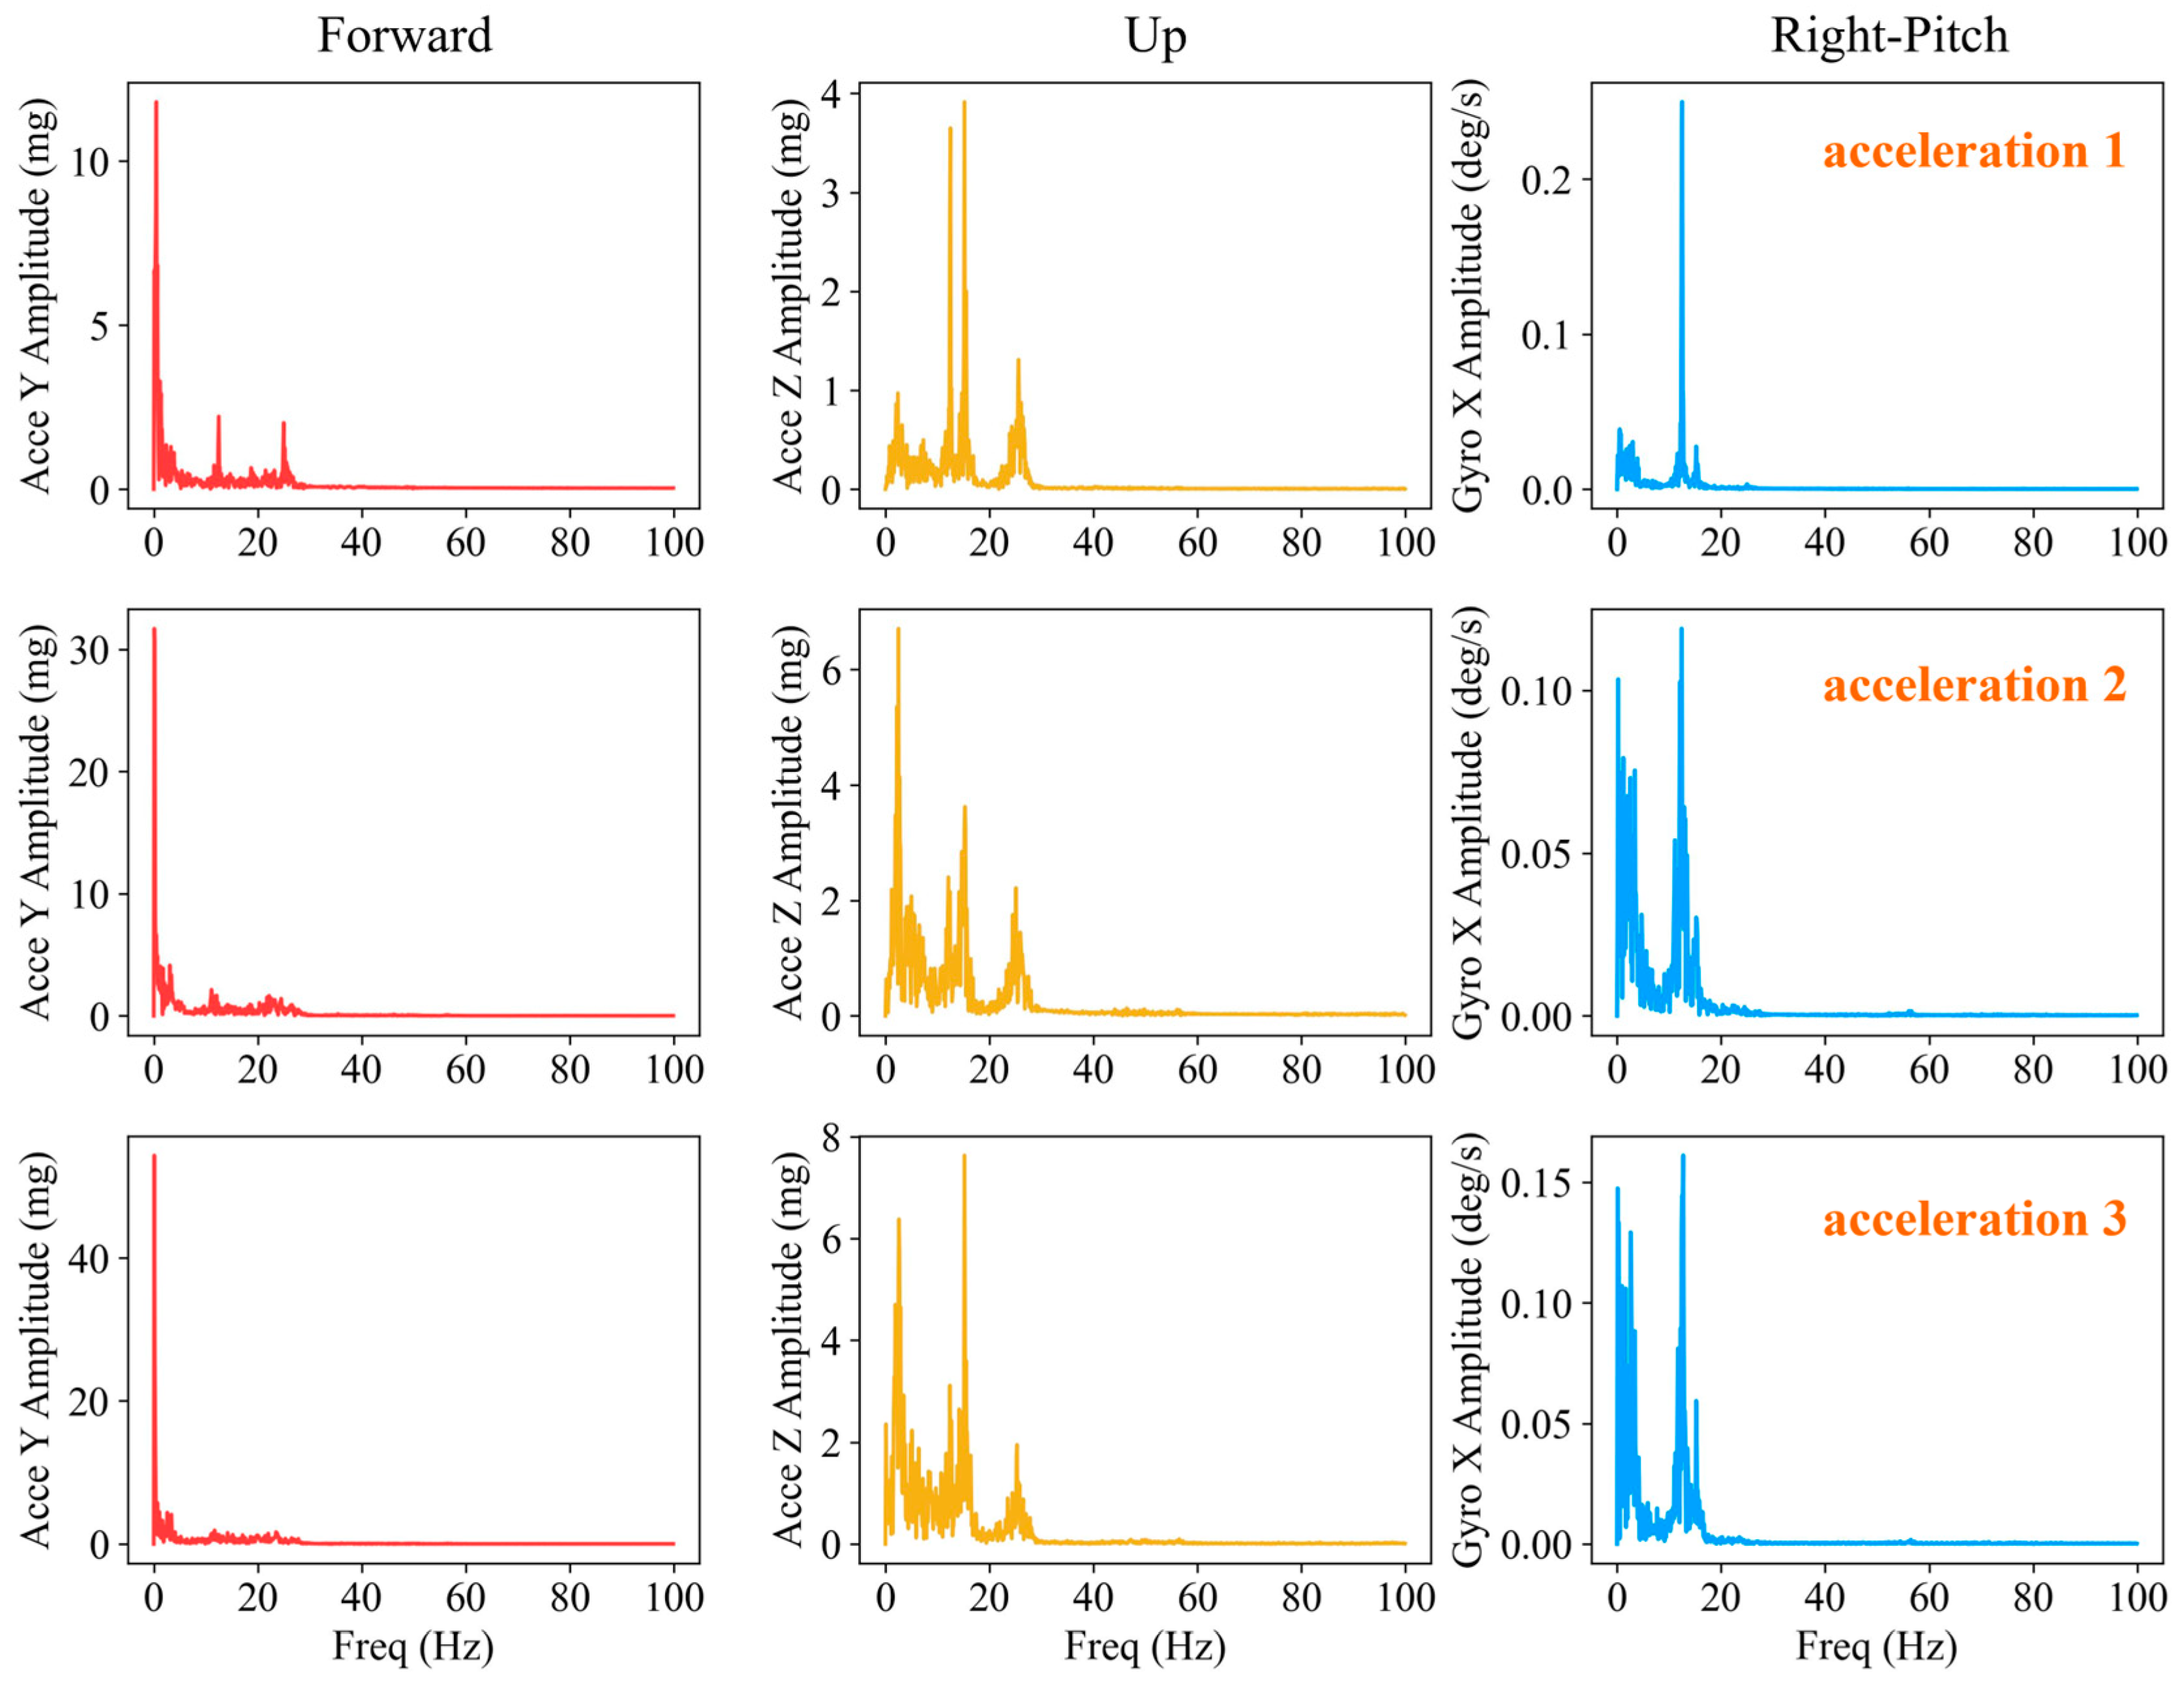
For comparison with the features of a stationary idling vehicle, the FFT is also implemented and analyzed for decelerating and accelerating near the three stop periods; the corresponding periods are exhibited in Table 2. The FFT spectra of forward/up acceleration during the decelerating and accelerating periods are depicted in Figure 5 and Figure 6. For the acceleration, Peak-1 and Peak-2 are still observable in the up direction rather than the forward direction during the decelerating and accelerating period, since the motive force of the vehicle is almost along the forward direction. However, because Peak-0 becomes more striking, the vibrational peaks in the forward and up directions are not as prominent as they are during the stationary period. A similar phenomenon is also observed in the angular velocity, where the amplitude of Peak-0 is increased to the same magnitude as Peak-1.
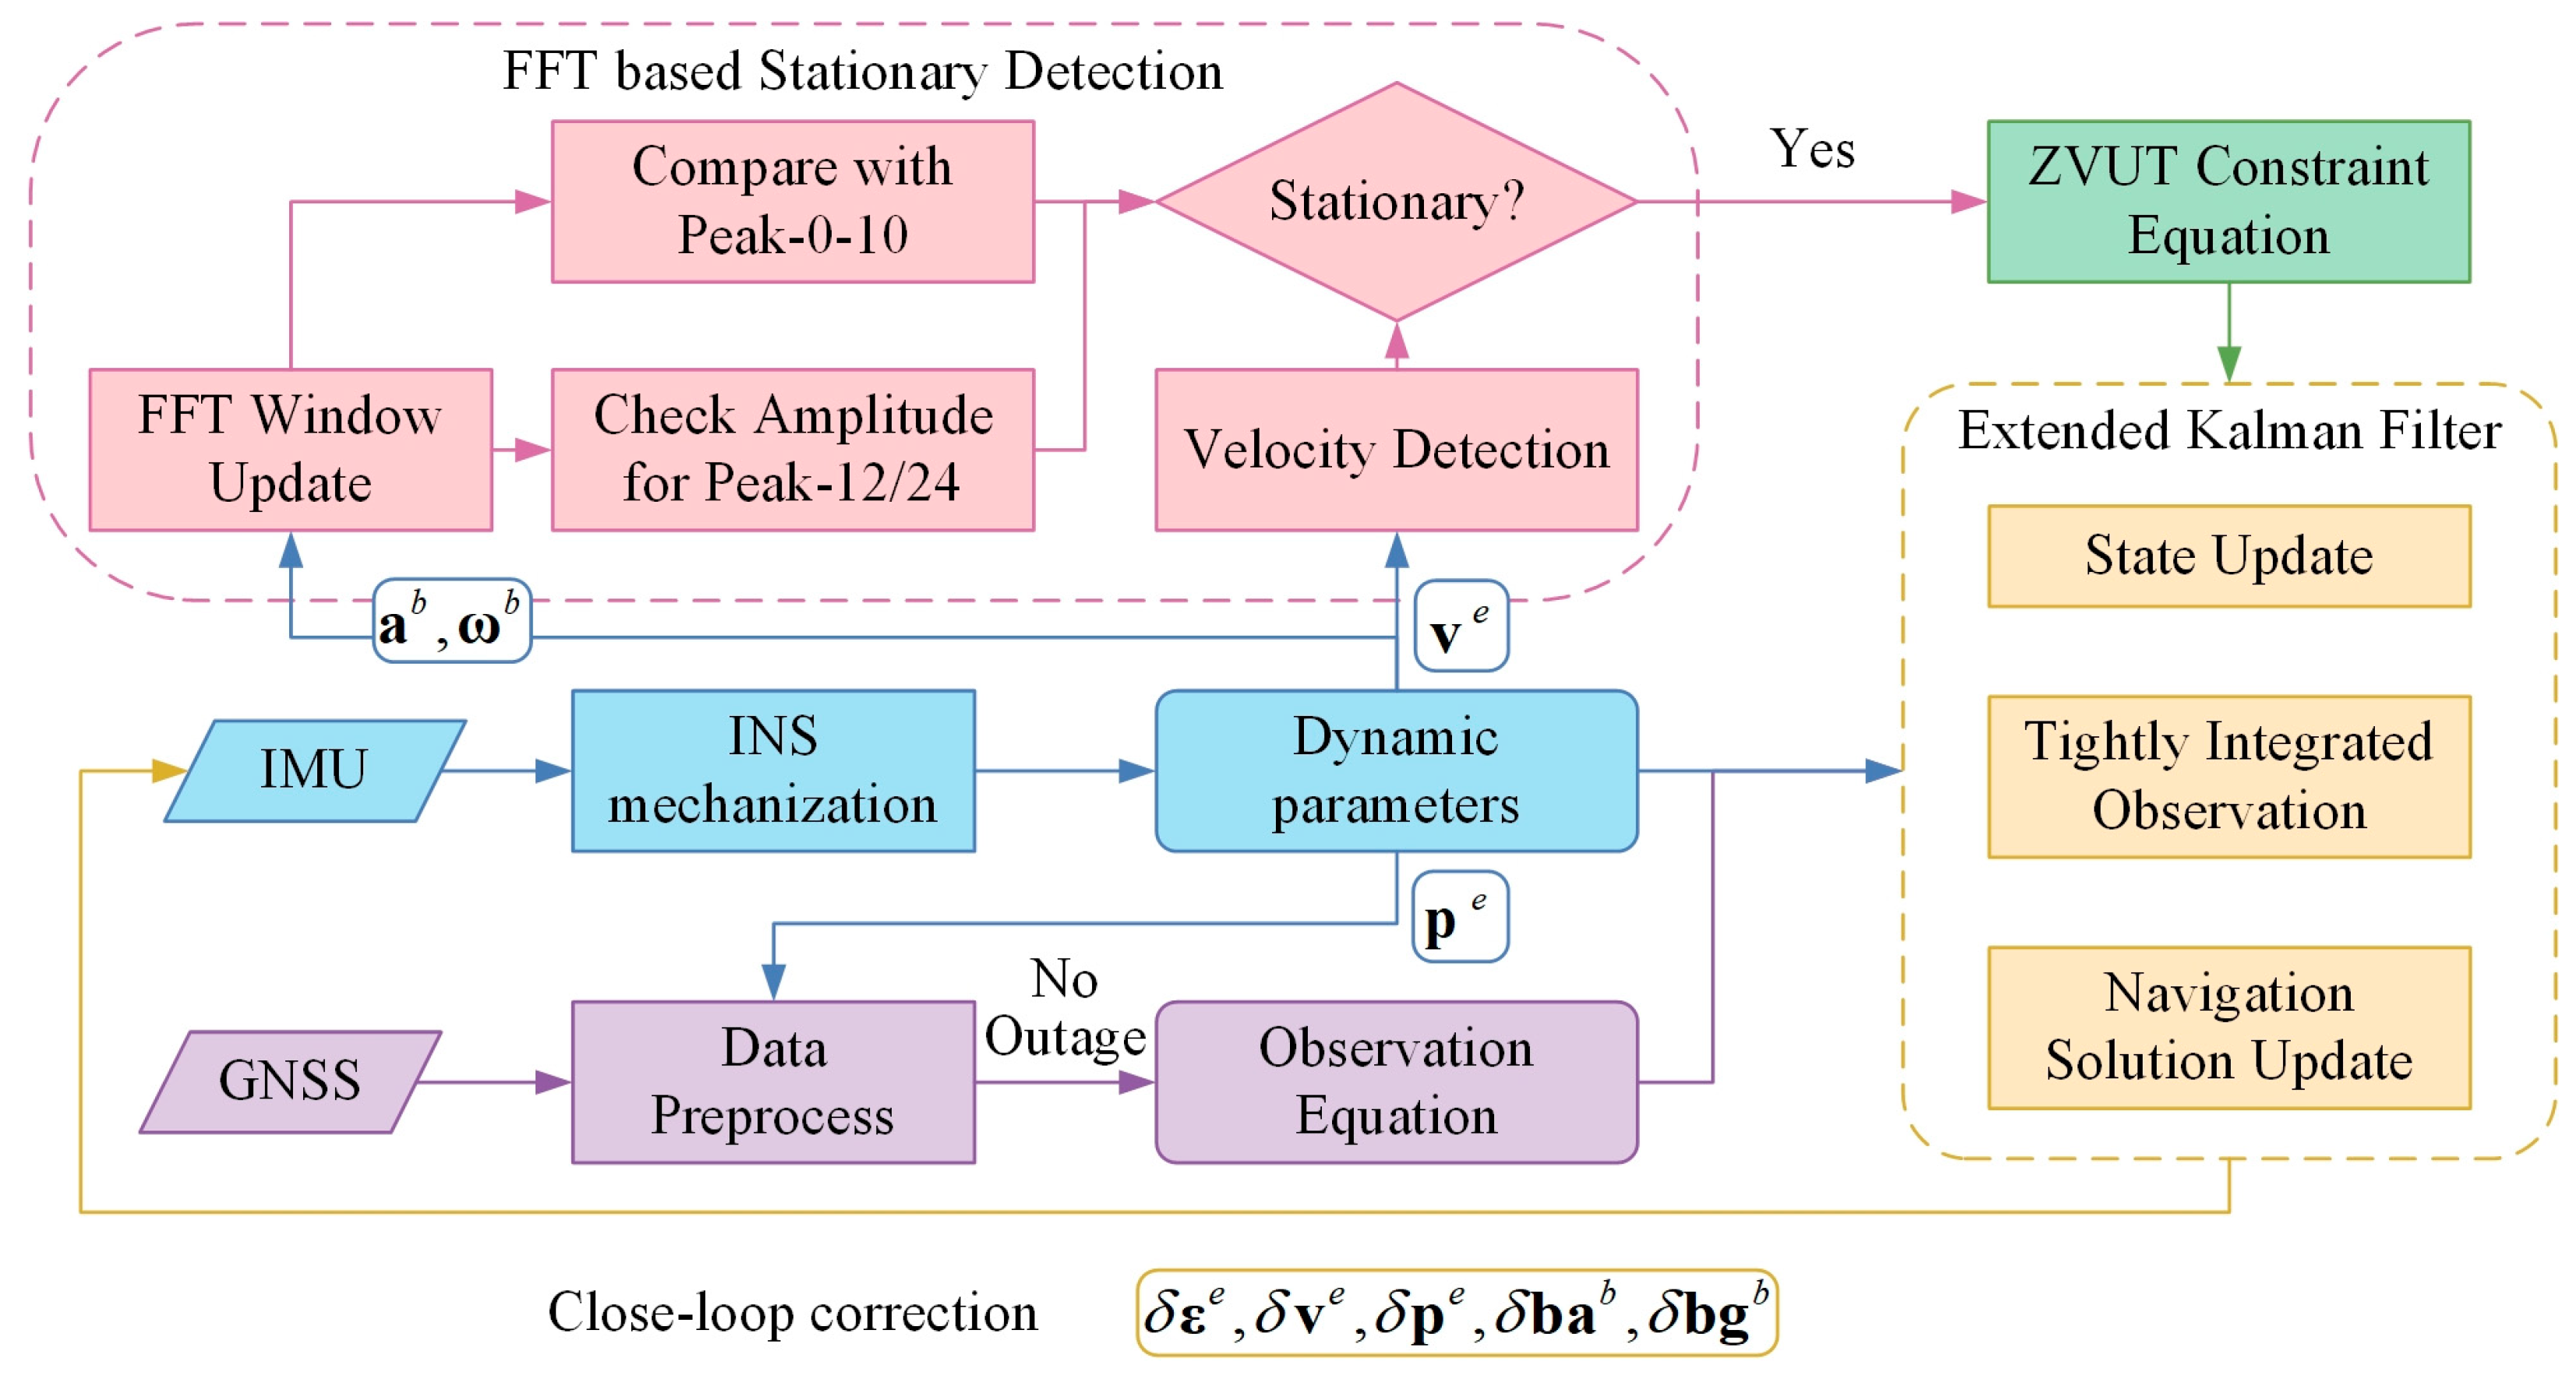
Comprehensively taking the FFT features of acceleration and angular velocity during stationary, decelerating and accelerating periods into account, we propose a method of FFT-based stationary detection as depicted by red nodes in Figure 7: a three-second sliding window with a one-second updating rate, i.e., a two-second overlap between the two adjacent windows, is adopted to perform the FFT processing for the forward/up acceleration and the pitch angular velocity. The number of measurements to process with the FFT in a single window is 600 with respect to the 200 Hz sampling rate of the IMU. Once the FFT window is updated, the frequency and amplitude of Peak-0, Peak-1 and Peak-2 are calculated and compared. On one hand, a larger window size might cause the wrong detection of a stationary condition at the start and the end of the vehicle stop, since the window contains more historical dynamic information. On the other hand, a smaller window size could make the detection easily affected by random disturbances or measurement errors. Therefore, a three-second window size is selected as the optimal size of the sliding window.
The entire window period is considered as stationary if the FFT result satisfies three conditions. First, the vehicular velocity must be below a threshold of 0.5 m/s [6]. Second, the amplitude of all three peaks of acceleration and angular velocity must be lower than the threshold of 15 mg and 0.7 deg/s, respectively. Third, both amplitudes of Peak-1 and Peak-2 of the forward/up acceleration must be higher than the amplitude of Peak-0, and the amplitude of Peak-1 of pitch angular velocity is required to be at least 7.0 times greater than that of Peak-0. In terms of acceleration, the amplitudes of Peak-1 and Peak-2 are multiplied by an amplification factor of 1.5, as there might be some external disturbances, e.g., passenger movements while opening or entering/exiting the car, which may randomly impact the vibration of the vehicle.
The FFT-based stationary detection and ZVU in the GNSS-PPP/IMU tight integration process is depicted in Figure 7 using different colored modules. At the start of every integration epoch, dynamic parameters are produced by IMU mechanization and propagated to other subprocesses in the navigation implementation. For stationary detection, IMU acceleration a b and angular velocity ω b are adopted to implement the FFT analysis and frequency detection, while IMU velocity v e is employed for velocity detection. If all detection nodes return a positive stationary result, a ZVU constraint equation is generated and propagated to the EKF module. Then, the GNSS module receives IMU position p e for data preprocessing and outage checking. If no outage is found, GNSS observation equations are calculated and forwarded to the EKF module. Finally, the EKF module updates all state parameters and generates tightly integrated observations to update the navigation solution. The estimated IMU errors are transmitted back to IMU for a closed-loop correction.

4.3. FFT-Based Stationary Detection Results

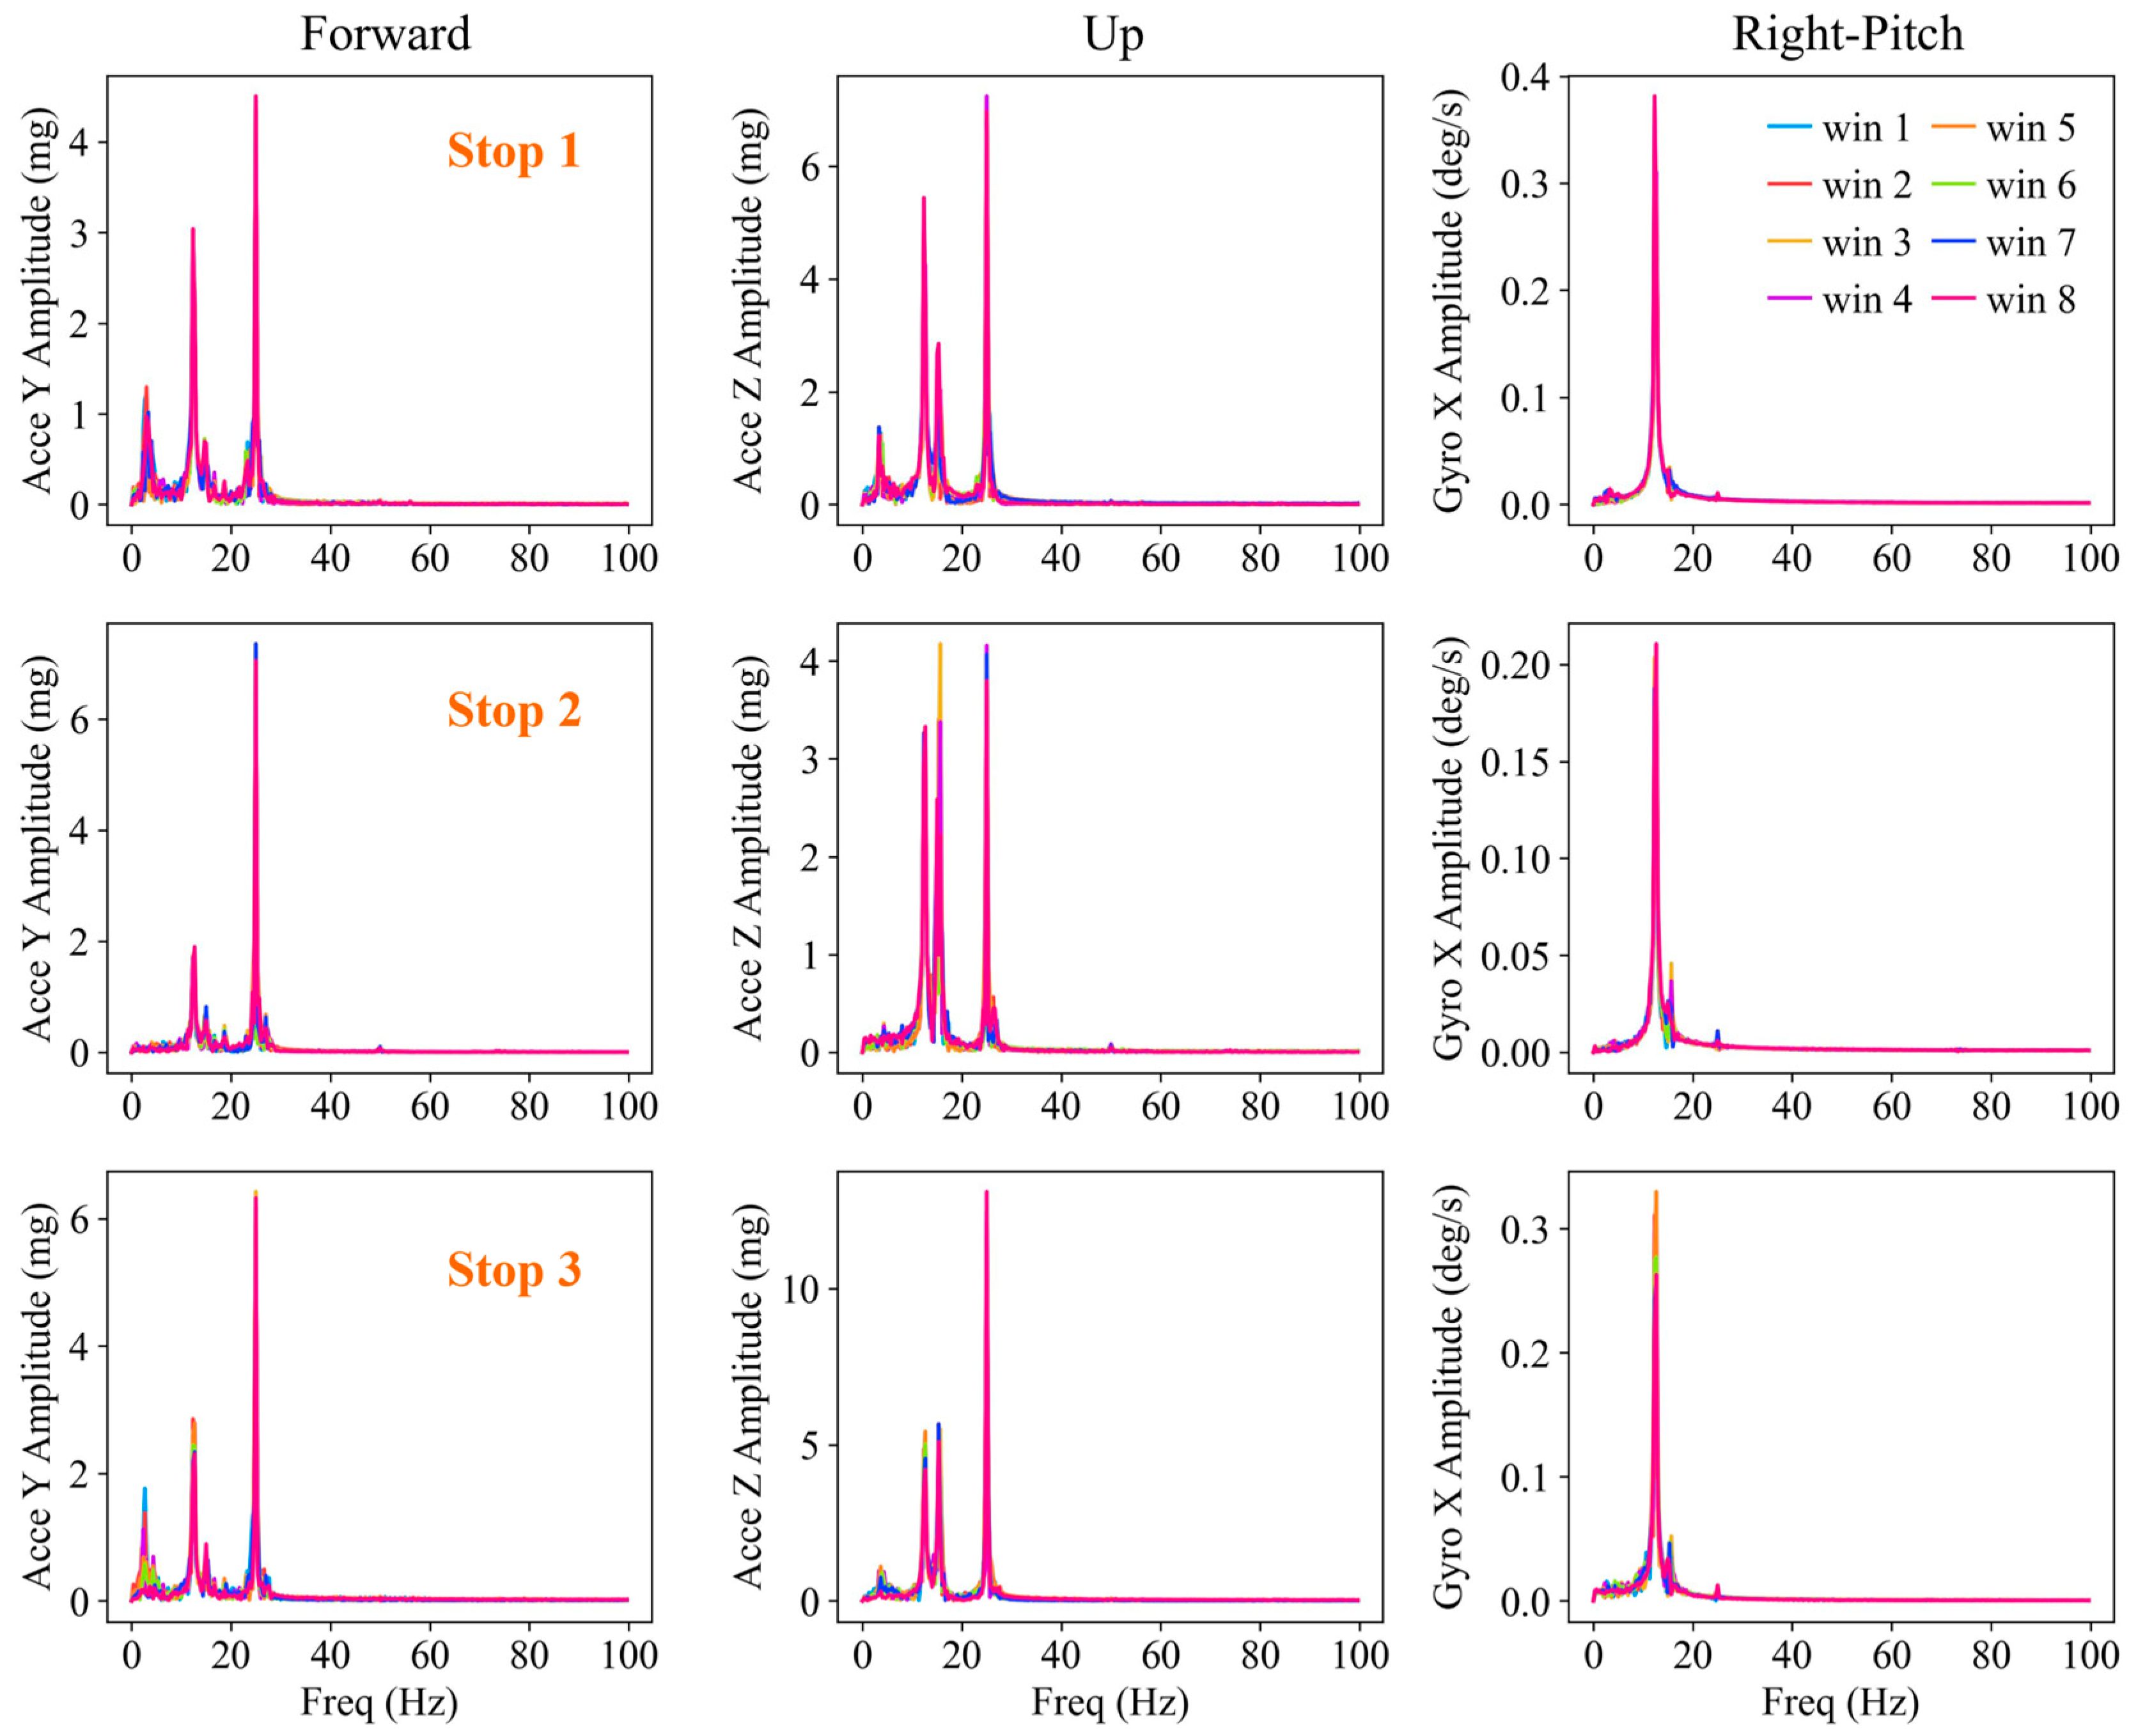
To assess the performance of the proposed stationary detection method, the GNSS observations during the three stop periods are artificially removed to simulate a complete outage of GNSS. The proposed method is conducted together with ZVU constraints for the IMU navigation processing. The FFT spectra of forward/up acceleration and pitch angular velocity in regard to three-second sliding windows are exhibited in Figure 8. Sliding window results in consecutive ten-second intervals of each stop period are selected as examples. The sliding window FFT result presents consistent features of both acceleration and angular velocity for each entire stationary period. Note that because of the spectral leakage caused by the short window size of three seconds [30,36,37], an extra peak can be seen in Figure 8 besides Peak-1 and Peak-2, especially for Peak-1 of the acceleration in the up component. Although the extra peak is produced from the real Peak-1, only the peak closest to the frequency Peak-1, located at 12.333 Hz, is used in the detection processing, as the extra peak may be contaminated by random noise or unpredictable disturbances.
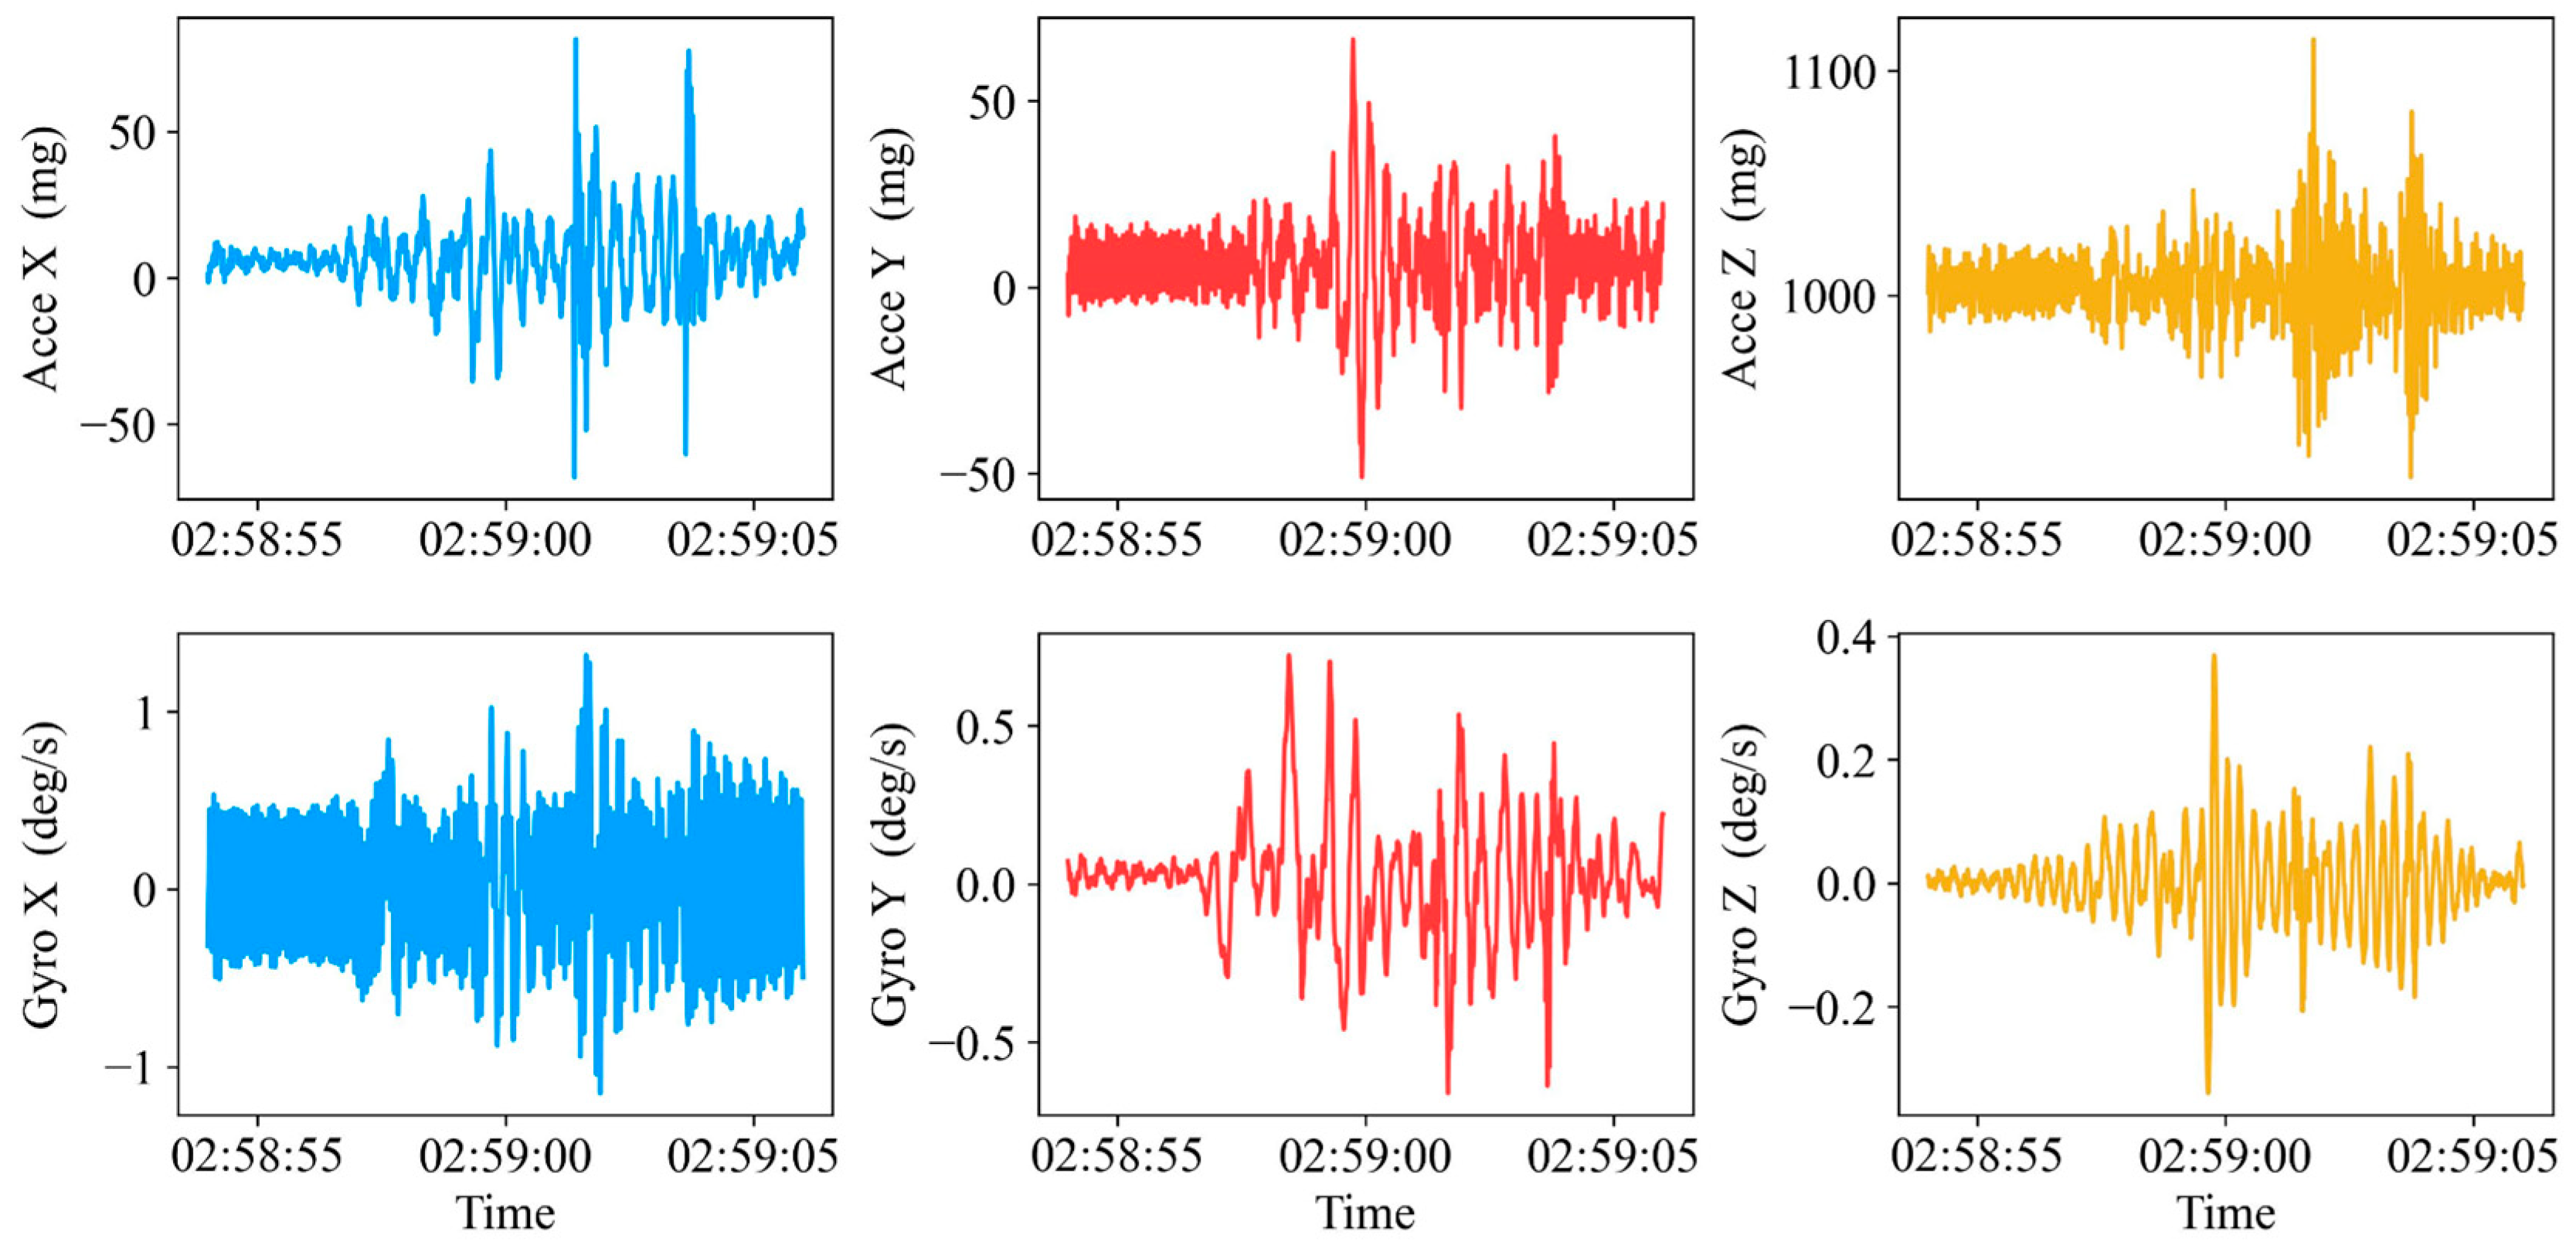
The statistical results of the FFT-based stationary detection across the three stop periods are presented in Table 5. The correct detection rate is determined as the ratio of the number of seconds that are correctly detected as stationary to the total duration of the stop period. For the three stop periods, all the correct rates exceed 99%, and the aggregated correct rate is 99.7%. The failed detection of some epochs is caused by passenger movements of opening and entering/exiting the car. We intentionally added more of these actions for the second stop period, and Figure 9 shows one case of opening and entering movements before we drove the car at the end of the second stop period. It clearly depicts the influence of the passenger actions in the vehicle on the acceleration and angular velocity.

4.4. ZVU-Constrained Positioning Results

In order to further evaluate the performance of the proposed FFT-based stationary detection method, the errors of ZVU-constrained positioning results and no-constraint results were calculated with respect to multi-GNSS DD RTK results as a reference. As mentioned in Section 4.3, all the GNSS observations were artificially removed, and only the IMU was employed for computing the navigation solution during the three stop periods. The tight GNSS-PPP/IMU integration was implemented individually from the trajectory start to the end of each stationary phase within the stop periods.
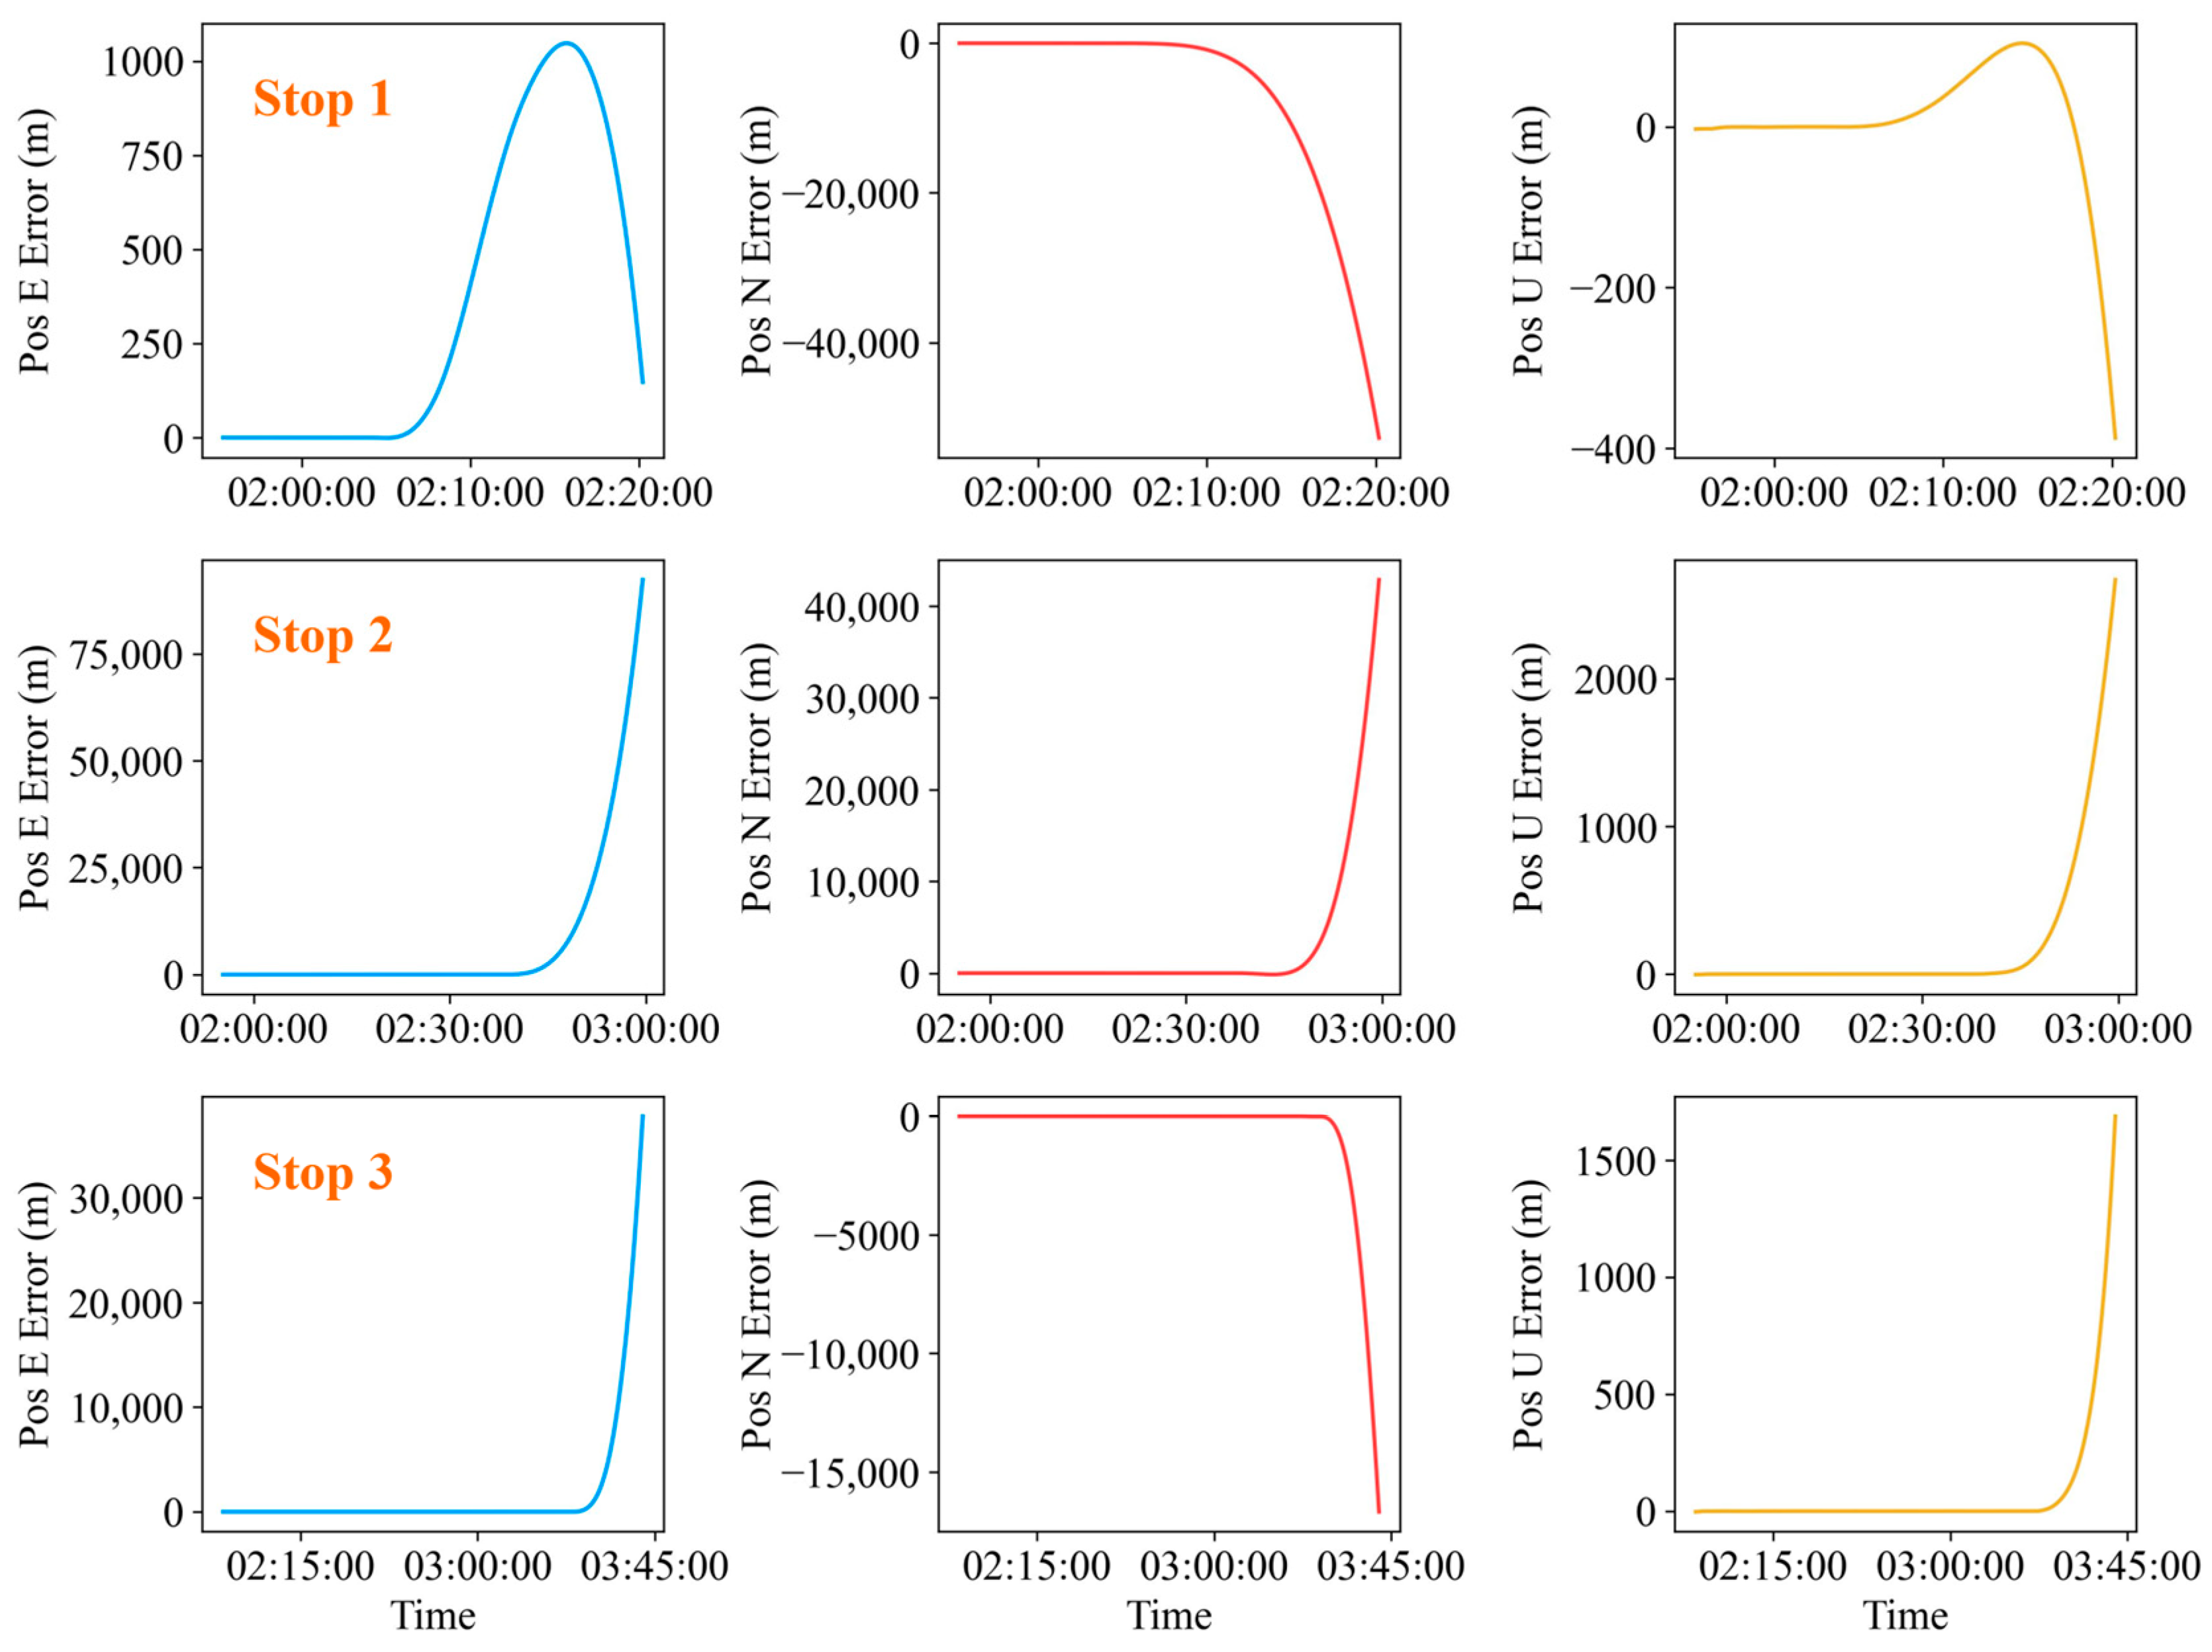
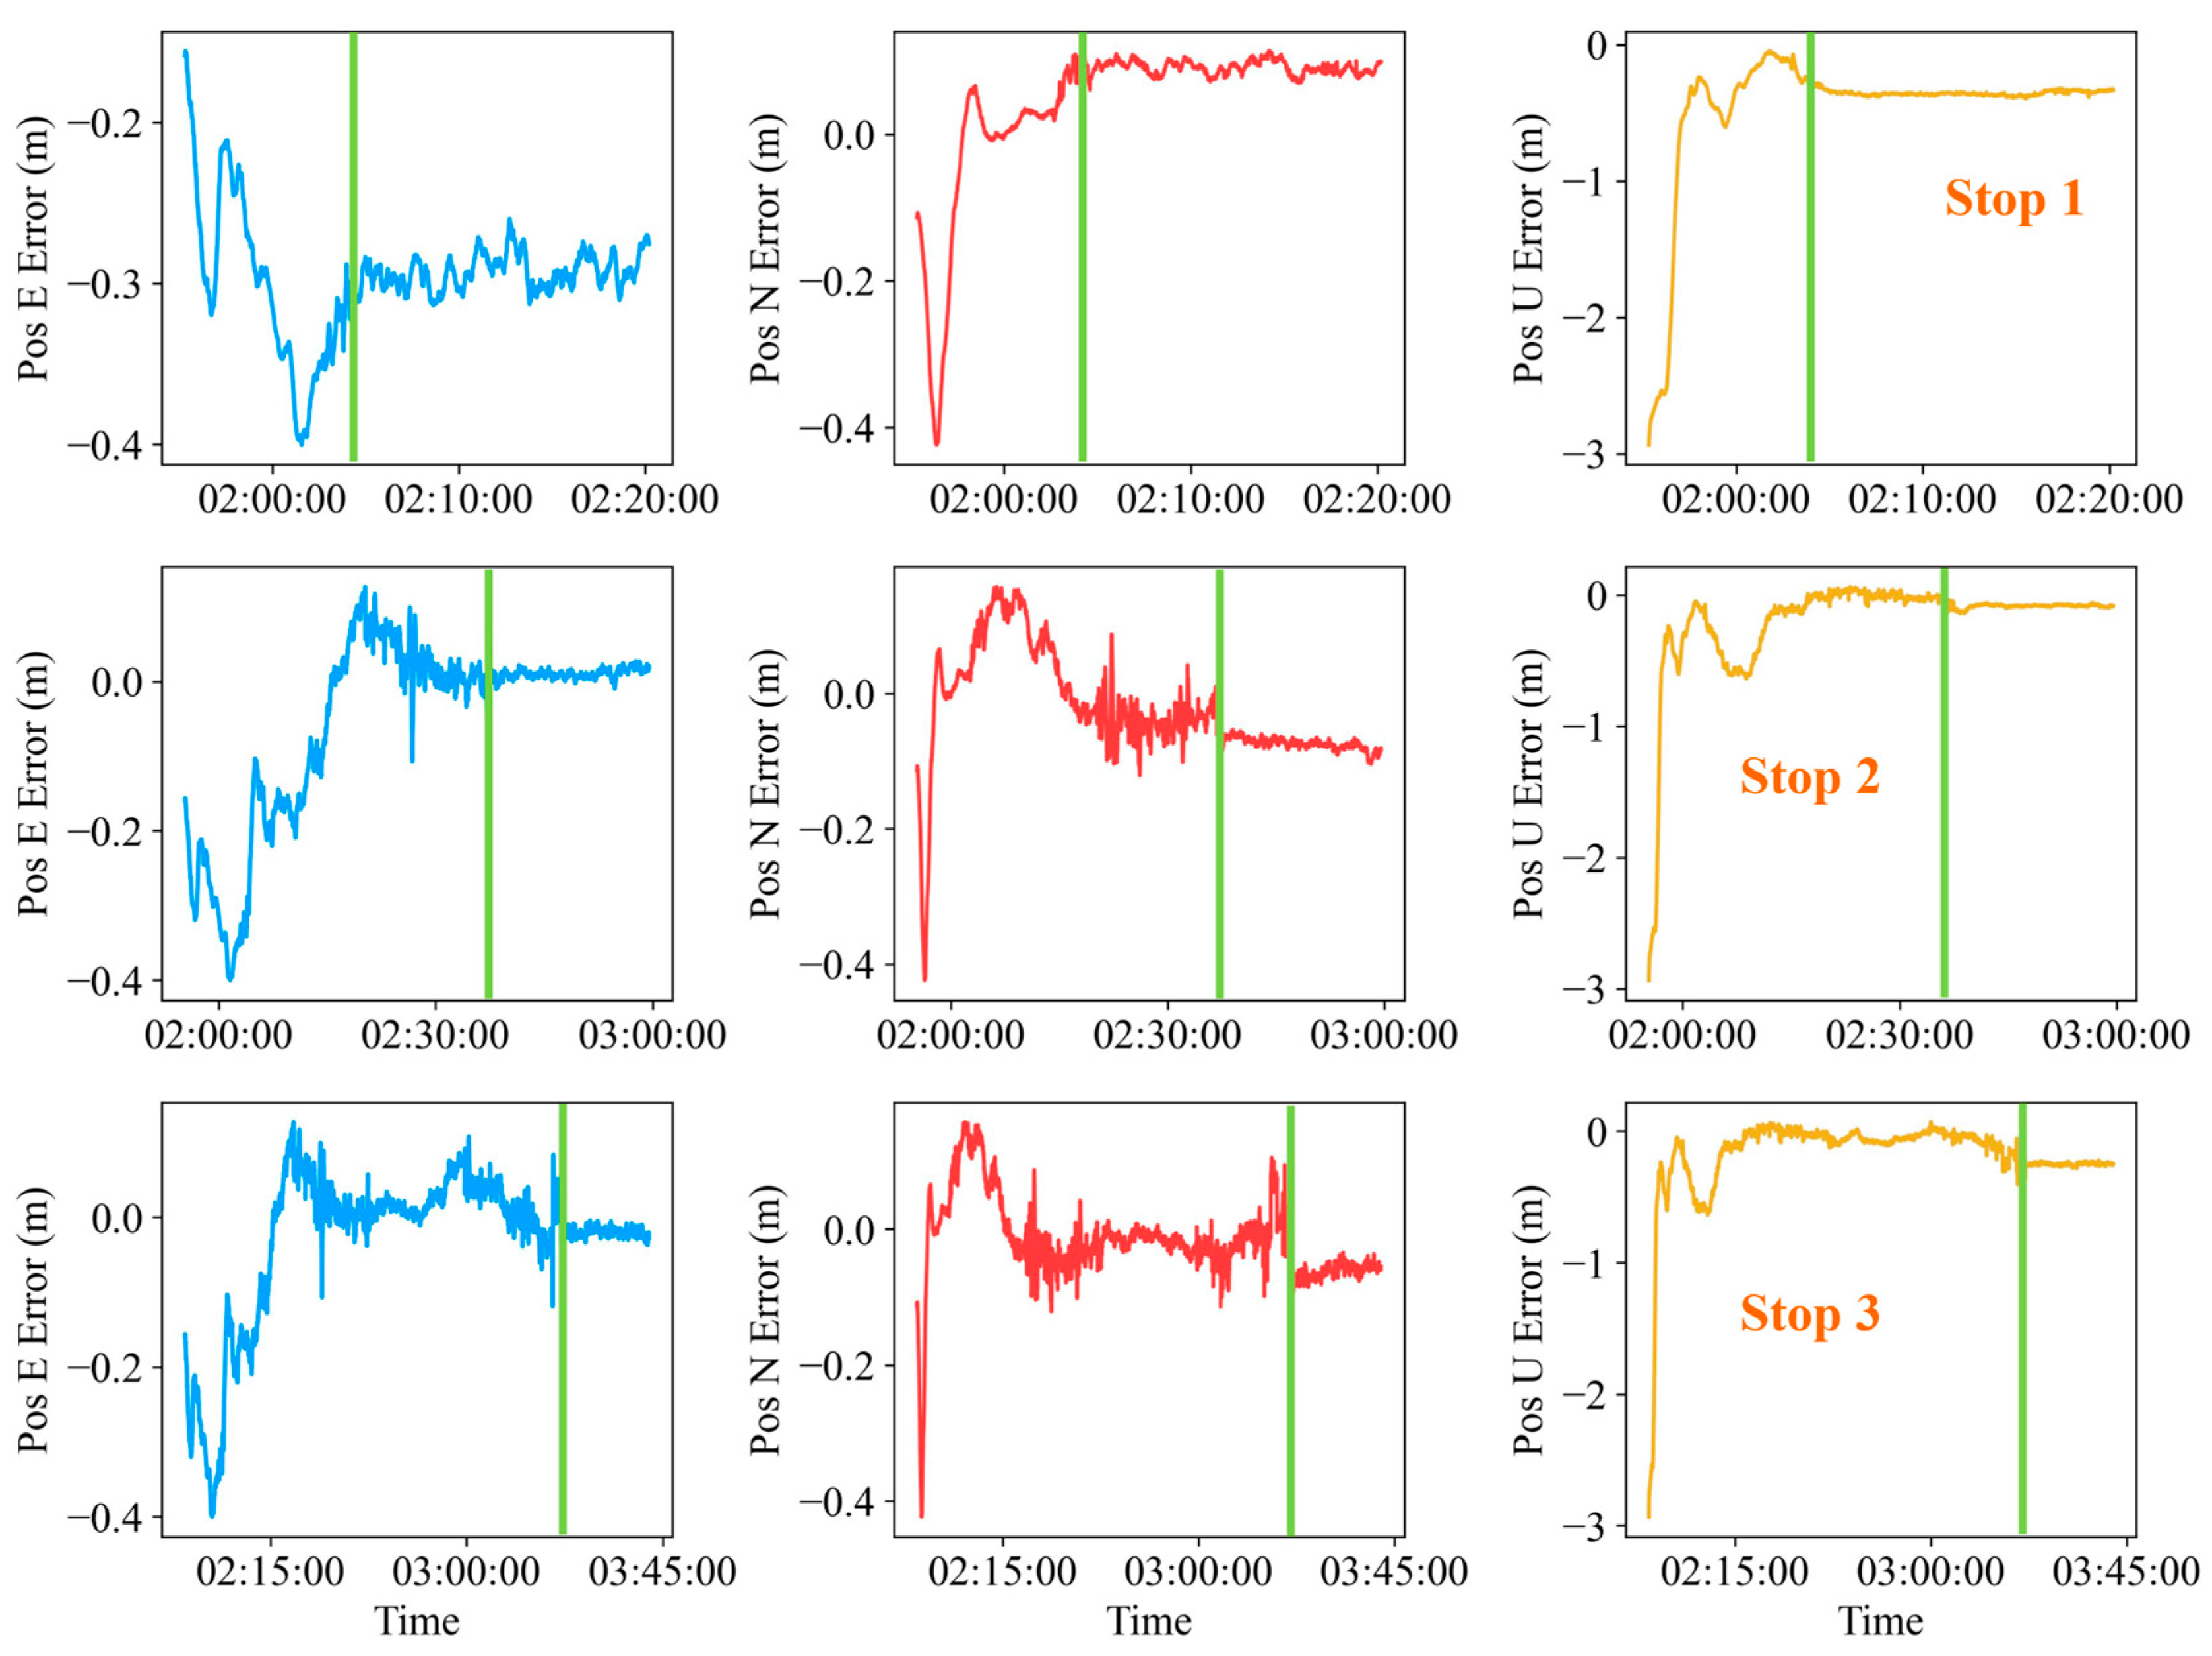
The positioning error series without constraints are depicted in Figure 10. Foreseeably, the positioning errors attributable to the IMU mechanization diverge rapidly to tens of kilometers in all directions during the three stop periods. In contrast, Figure 11 presents the positioning errors produced by the ZVU-constrained IMU mechanization. The green lines indicate the start time of every stop period. It is clearly seen that the position is well constrained by the ZVU function, and all the positioning errors are converged within one decimeter.
Table 6 summarizes the position variation from the first stop epoch obtained with the ZVU in terms of the Root Mean Square (RMS), STD and maximum (Max) deviation. The RMS, STD and Max of the three stop periods in all the east, north and up directions are below 3 cm, 1 cm and 4cm, respectively. Moreover, the average RMS, STD and Max of position variation for the experimental stop periods are 1.12 cm, 0.51 cm and 2.29 cm, respectively. The statistical results illustrate that the proposed stationary detection method is efficient in supporting the ZVU in inhibiting the divergence of positioning error.

5. Conclusions

The MEMS IMU is a significant piece of equipment for vehicles, allowing them to produce consecutive navigation information in an integrated system with GNSS and other sensors. MEMS IMU errors are prone to accumulate over time, and the ZVU is recognized as an efficient method for constraining the divergence of an IMU. The key to implementing ZVU is detecting the stop of the vehicle correctly. Hence, we propose a method based on FFT that has been tailored for land vehicles with idling engines. The feasibility of the proposed method was evaluated by an urban vehicular test with three stops with durations ranging from 10 to 20 min. The conclusions of our study are as follows:
The frequency peak caused by the vibration of an idling engine can be distinguished in the FFT spectra of forward/up acceleration and pitch angular velocity when the vehicle is stopped. In contrast, the vibrational peak is masked by the peaks within the 0 to 10 Hz range during the decelerating and accelerating periods. Therefore, we propose implementing FFT based on a three-second sliding window for IMU measurements per second. Then, we compare the amplitude of the vibrational frequency with the 0 to 10 Hz range frequency peak to detect if the vehicle is in a stationary condition.
To evaluate the performance of the proposed stationary detection method, we implemented the ZVU constraint under the simulated GNSS outages over three stop periods. As a result, the proposed detection method achieved an overall correct detection rate of 99.7% for the experimental stop periods. Based on the stationary detection method, the ZVU constrains the divergence of positioning error within centimeters. The results demonstrate the feasibility of the proposed stationary detection based on IMU measurements and the FFT feature of idling vibration tailored for land vehicles.

Author Contributions

Conceptualization, M.L.; methodology, M.L., V.S. and W.N.; software, M.L. and W.Z.; validation, T.X., A.R.-G. and G.X.; formal analysis, M.L.; investigation, M.L.; resources, T.X.; data curation, M.L. and W.Z.; writing—original draft preparation, M.L.; writing—review and editing, M.L., W.N., V.S., A.R.-G. and T.X.; visualization, M.L.; supervision, T.X., A.R.-G. and G.X.; project administration, T.X., W.N. and A.R.-G.; funding acquisition, T.X., W.N., A.R.-G. and V.S. All authors have read and agreed to the published version of the manuscript.

Funding

This research was funded by National Key Research and Development Program of China (2020YFB0505800 and 2020YFB0505804), the Young Scholars Program of Shandong University, Weihai and Youth Innovation Team Development Project of Higher School in Shandong Province (2023KJ143), Key Laboratory of Smart Earth (KF2023YB02-11), State-funded postdoctoral researcher program (GZC20231482), the Spanish AEI/MCIN project (CNS2022-135383 and PID2022-138485OB-I00) within the European Community FEDER and industrial PhD grant number 2020 DI 108 from the Generalitat de Catalunya.

Data Availability Statement

The datasets utilized in this work are available from the corresponding author on reasonable request.

Acknowledgments

Thanks to the International GNSS Service (IGS) for providing the multi-GNSS precise orbit and clock products. Thanks to Shili Yang, Junting Wang, Long Li and Lei Zhang for their contribution to the construction of GNSS/IMU hardware. Thanks to Yongqing Lin for the driving service under the experimental requirements.

Conflicts of Interest

The authors declare no conflicts of interest.

References

  1. Titterton, D.; Weston, J.L.; Weston, J. Strapdown Inertial Navigation Technology; IET: London, UK, 2004; Volume 17. [Google Scholar]
  2. Lawrence, A. Modern Inertial Technology: Navigation, Guidance, and Control; Springer Science & Business Media: Berlin/Heidelberg, Germany, 2012. [Google Scholar]
  3. Abd Rabbou, M.; El-Rabbany, A. Tightly coupled integration of GPS precise point positioning and MEMS-based inertial systems. GPS Solut. 2015, 19, 601–609. [Google Scholar] [CrossRef]
  4. Li, T.; Zhang, H.; Gao, Z.; Niu, X.; El-sheimy, N. Tight Fusion of a Monocular Camera, MEMS-IMU, and Single-Frequency Multi-GNSS RTK for Precise Navigation in GNSS-Challenged Environments. Remote Sens. 2019, 11, 610. [Google Scholar] [CrossRef]
  5. Kempe, V. Inertial MEMS: Principles and Practice; Cambridge University Press: Cambridge, UK, 2011. [Google Scholar]
  6. Aggarwal, P. MEMS-Based Integrated Navigation; Artech House: Norwood, MA, USA, 2010. [Google Scholar]
  7. Li, X.; Wang, H.; Li, S.; Feng, S.; Wang, X.; Liao, J. GIL: A tightly coupled GNSS PPP/INS/LiDAR method for precise vehicle navigation. Satell. Navig. 2021, 2, 26. [Google Scholar] [CrossRef]
  8. Li, X.; Chang, H.; Wang, X.; Li, S.; Zhou, Y.; Yu, H. An Optimization-Based Tightly-Coupled Integration of PPP, INS and Vision for Precise and Continuous Navigation. IEEE Trans. Veh. Technol. 2023, 1–14. [Google Scholar] [CrossRef]
  9. Li, T.; Zhang, H.; Niu, X.; Gao, Z. Tightly-Coupled Integration of Multi-GNSS Single-Frequency RTK and MEMS-IMU for Enhanced Positioning Performance. Sensors 2017, 17, 2462. [Google Scholar] [CrossRef] [PubMed]
  10. Groves, P.D. Principles of GNSS, Inertial, and Multisensor Integrated Navigation Systems, 2nd ed.; Artech House: Norwood, MA, USA, 2013; p. 776. [Google Scholar]
  11. Grewal, M.S.; Weill, L.R.; Andrews, A.P. Global Positioning Systems, Inertial Navigation, and Integration; John Wiley & Sons: Hoboken, NJ, USA, 2007. [Google Scholar]
  12. Lima Filho, V.C.; Moraes, A. Modeling multifrequency GPS multipath fading in land vehicle environments. GPS Solut. 2020, 25, 3. [Google Scholar] [CrossRef]
  13. Wang, X.; Li, X.; Shen, Z.; Li, X.; Zhou, Y.; Chang, H. Factor graph optimization-based multi-GNSS real-time kinematic system for robust and precise positioning in urban canyons. GPS Solut. 2023, 27, 200. [Google Scholar] [CrossRef]
  14. Quan, Y.; Lau, L.; Roberts, G.W.; Meng, X.; Zhang, C. Convolutional Neural Network Based Multipath Detection Method for Static and Kinematic GPS High Precision Positioning. Remote Sens. 2018, 10, 2052. [Google Scholar] [CrossRef]
  15. Grejner-Brzezinska, D.A.; Yi, Y.; Toth, C.K. Bridging GPS Gaps in Urban Canyons: The Benefits of ZUPTs. Navigation 2001, 48, 216–226. [Google Scholar] [CrossRef]
  16. Li, Q.; Li, K.; Liang, W. A zero-velocity update method based on neural network and Kalman filter for vehicle-mounted inertial navigation system. Meas. Sci. Technol. 2023, 34, 045110. [Google Scholar] [CrossRef]
  17. Amin, M.S.; Reaz, M.B.I.; Nasir, S.S.; Bhuiyan, M.A.S. Attitude Heading Reference System based vehicle stationary state detection. In Proceedings of the 2014 International Conference on Electrical Engineering and Information & Communication Technology, Mirpur, Pakistan, 10–12 April 2014; pp. 1–4. [Google Scholar]
  18. Amin, M.S.; Reaz, M.B.I.; Nasir, S.S.; Bhuiyan, M.A.S.; Ali, M.A.M. A Novel Vehicle Stationary Detection Utilizing Map Matching and IMU Sensors. Sci. World J. 2014, 2014, 597180. [Google Scholar] [CrossRef] [PubMed]
  19. Lu, S.; Gong, Y.; Luo, H.; Zhao, F.; Li, Z.; Jiang, J. Heterogeneous Multi-Task Learning for Multiple Pseudo-Measurement Estimation to Bridge GPS Outages. IEEE Trans. Instrum. Meas. 2021, 70, 8500916. [Google Scholar] [CrossRef]
  20. Ramanandan, A.; Chen, A.; Farrell, J.A.; Suvarna, S. Detection of Stationarity in an Inertial Navigation System. In Proceedings of the 23rd International Technical Meeting of the Satellite Division of the Institute-of-Navigation (ION GNSS-2010), Portland, OR, USA, 21–24 September 2010; pp. 238–244. [Google Scholar]
  21. Ramanandan, A.; Chen, A.; Farrell, J.A. Inertial Navigation Aiding by Stationary Updates. IEEE Trans. Intell. Transp. Syst. 2012, 13, 235–248. [Google Scholar] [CrossRef]
  22. Johnson, S.R.; Subhedar, J.W. Computer optimization of engine mounting systems. In Proceedings of the 3rd International Conference on Vehicle Structural Mechanics, Troy, MI, USA, 1 February 1979. [Google Scholar]
  23. Lee, J.M.; Yim, H.J.; Kim, J.-H. Flexible Chassis Effects on Dynamic Response of Engine Mount Systems. In Proceedings of the International Conference On Vehicle Structural Mechanics & CAE, Troy, MI, USA, 4–6 April 1995. [Google Scholar]
  24. Iyer, G.; Prasanth, B.; Wagh, S.; Hudson, D. Idle Vibrations Refinement of a Passenger Car. In Proceedings of the 2011 Symposium on International Automotive Technology, Pune, India, 19–21 January 2011. [Google Scholar]
  25. Balla, C.K.; Naidu, S.; Ambardekar, M.N. Reduction of Idle Shake in a Small Commercial Vehicle. In Proceedings of the SAE 2015 Noise and Vibration Conference and Exhibition, Tokyo, Japan, 22–25 June 2015. [Google Scholar]
  26. Qatu, M.S.; Abdelhamid, M.K.; Pang, J.; Sheng, G. Overview of automotive noise and vibration. Int. J. Veh. Noise Vib. 2009, 5, 1–35. [Google Scholar] [CrossRef]
  27. Wang, X. Vehicle Noise and Vibration Refinement; Woodhead Publishing: Cambridge, UK, 2010. [Google Scholar] [CrossRef]
  28. Kalla, B.; Patil, S.; Kumbhar, M. Idle Shake Simulation and Optimization through Digital Car Model. In Proceedings of the SAE 2015 Noise and Vibration Conference and Exhibition, Tokyo, Japan, 22–25 June 2015. [Google Scholar]
  29. Heideman, M.; Johnson, D.; Burrus, C. Gauss and the history of the fast fourier transform. IEEE ASSP Mag. 1984, 1, 14–21. [Google Scholar] [CrossRef]
  30. Smith, S. Digital Signal Processing: A Practical Guide for Engineers and Scientists; Newnes: London, UK, 2003. [Google Scholar]
  31. Cooley, J.W.; Tukey, J.W. An algorithm for machine calculation of complex fourier series. Math. Comput. 1965, 19, 297–301. [Google Scholar] [CrossRef]
  32. Cooley, J.; Lewis, P.; Welch, P. The finite Fourier transform. IEEE Trans. Audio Electroacoust. 1969, 17, 77–85. [Google Scholar] [CrossRef]
  33. Sanz Subirana, J.; Juan Zornoza, J.M.; Hernández-Pajares, M. GNSS Data Processing. Fletcher, K., Ed.; European Space Agency, ESA Communications: Noordwijk, The Netherlands, 2013; Volume I. [Google Scholar]
  34. Leick, A.; Rapoport, L.; Tatarnikov, D. GPS Satellite Surveying; John Wiley & Sons: Hoboken, NJ, USA, 2015. [Google Scholar]
  35. Xu, G.; Xu, Y. GPS: Theory, Algorithms and Applications, 3rd ed.; Springer: Berlin/Heidelberg, Germany, 2016. [Google Scholar] [CrossRef]
  36. Harris, F.J. On the use of windows for harmonic analysis with the discrete Fourier transform. Proc. IEEE 1978, 66, 51–83. [Google Scholar] [CrossRef]
  37. Rohling, H.; Schuermann, J. Discrete time window functions with arbitrarily low sidelobe level. Signal Process. 1983, 5, 127–138. [Google Scholar] [CrossRef]
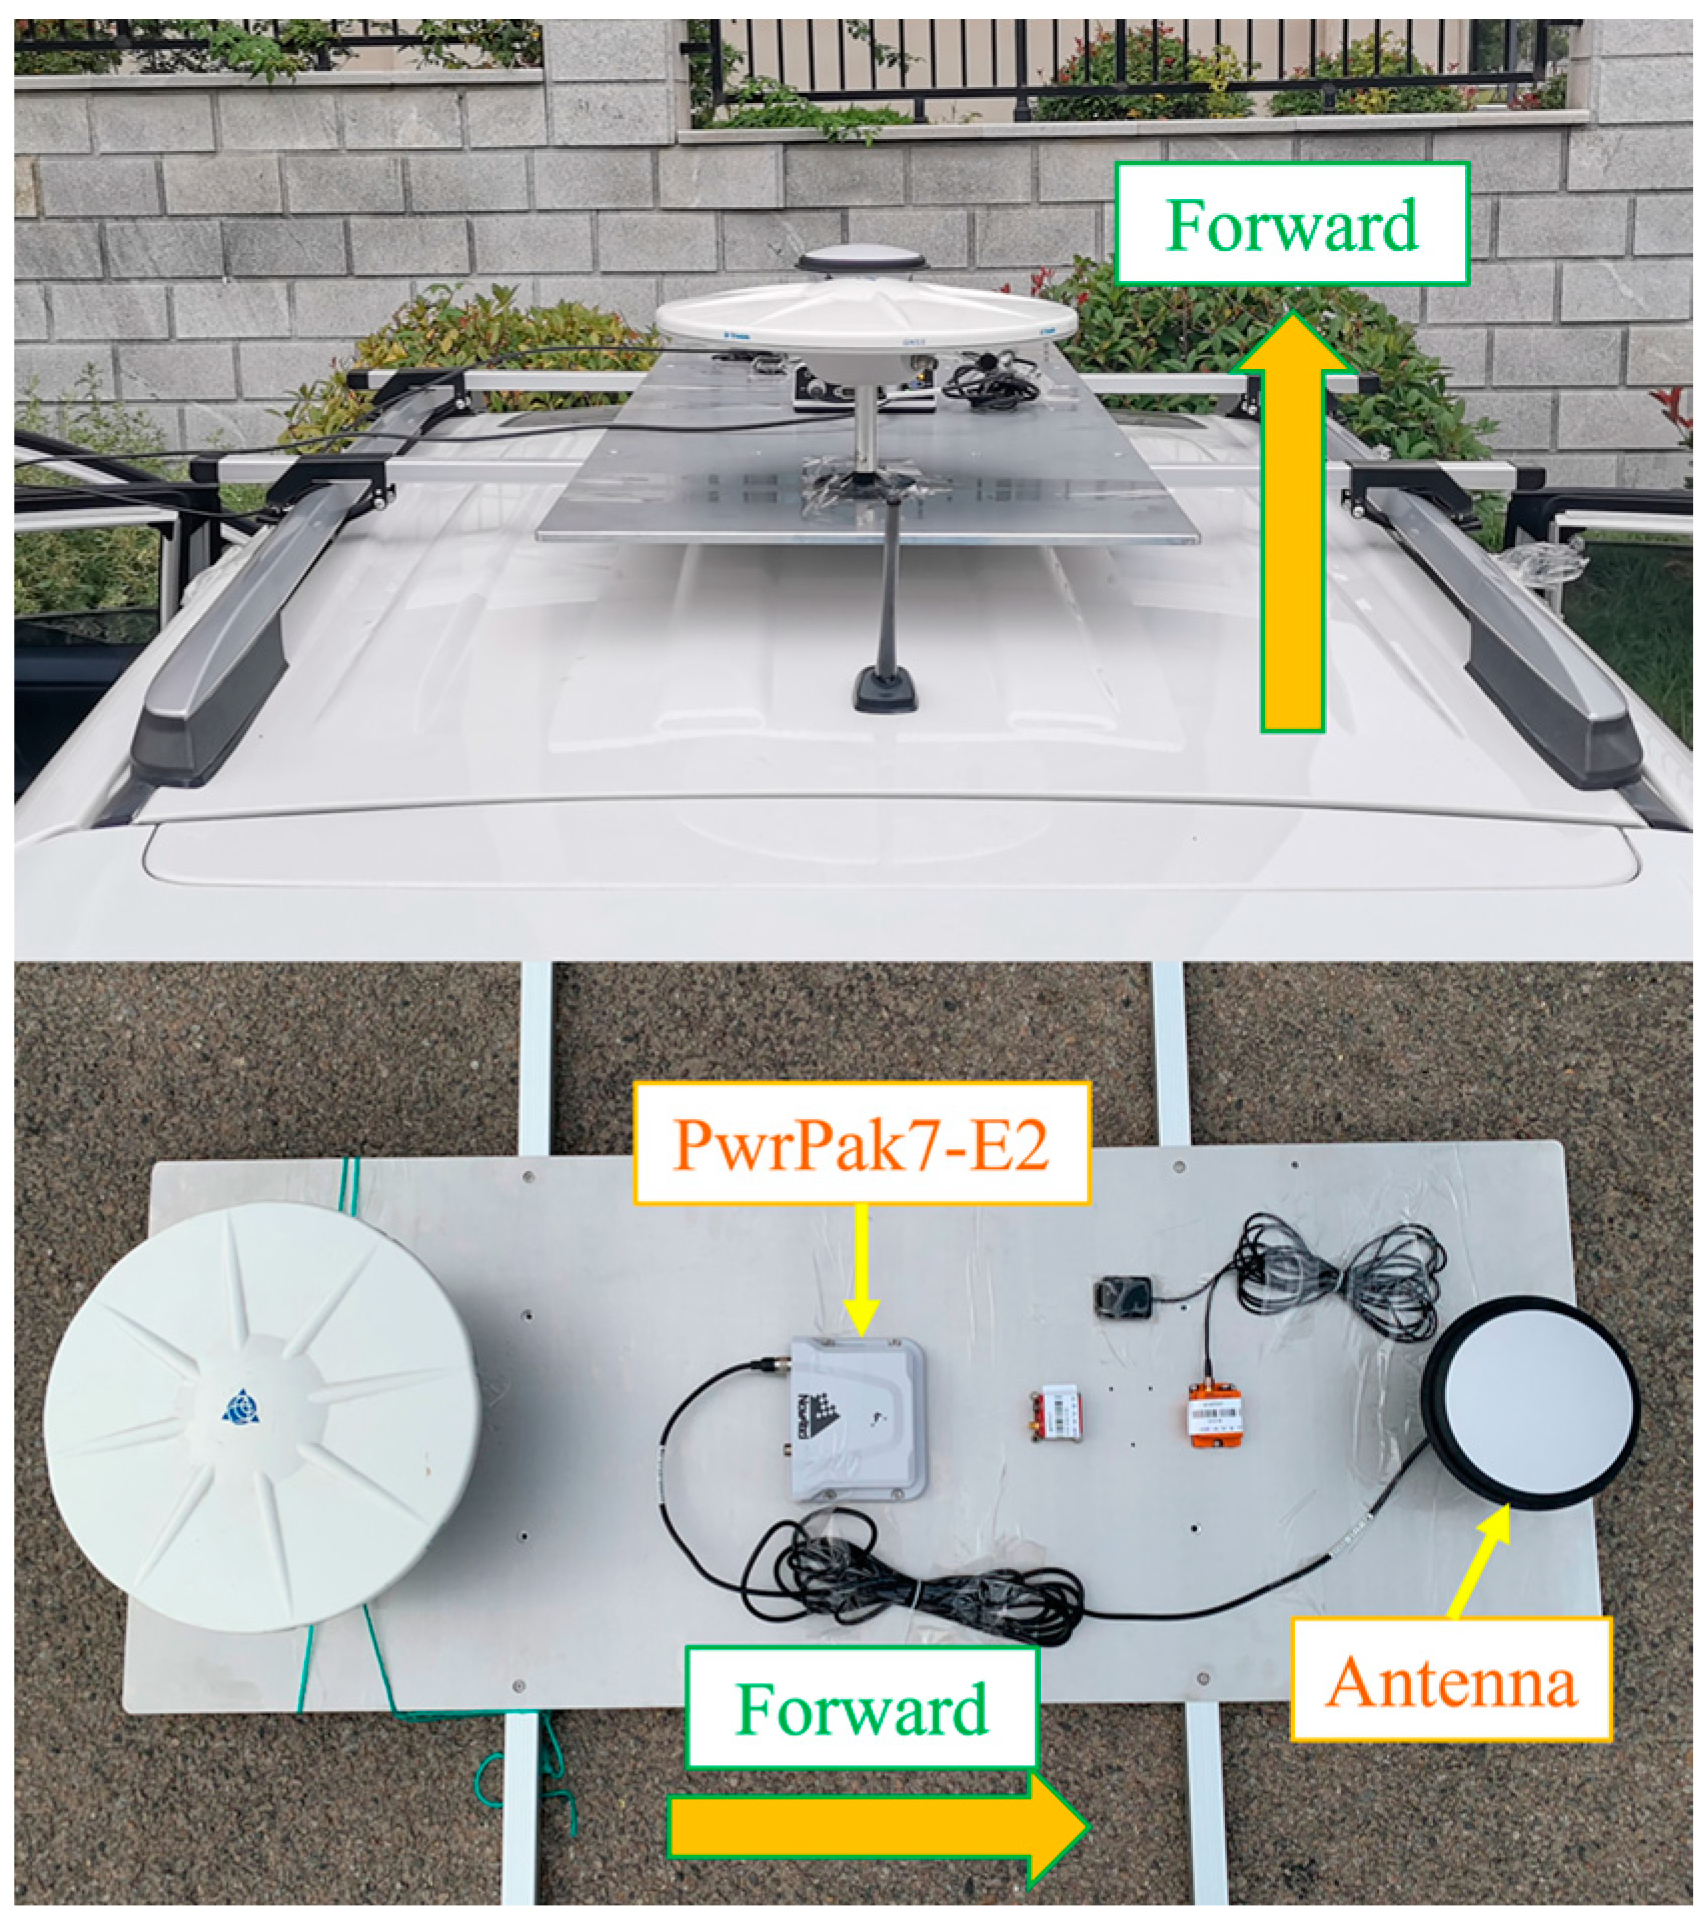
Figure 1. GNSS/IMU hardware platform and its equipment on the land vehicle.
Remotesensing 16 00902 g001
Figure 2. Urban trajectory (yellow), base station (blue) and three stop points in vehicular test.
Remotesensing 16 00902 g002
Figure 3. Acceleration FFT spectrum of the Stop 1 (top row), Stop 2 (middle row) and Stop 3 (Bottom row) in the right (left column), forward (middle column) and up (right column) directions.
Remotesensing 16 00902 g003
Figure 4. Angular velocity FFT spectrum of Stop 1 (top row), Stop 2 (middle row) and Stop 3 (Bottom row) in the right (left column), forward (middle column) and up (right column) directions.
Remotesensing 16 00902 g004
Figure 5. FFT spectrum of forward (left column) and up acceleration (middle column) and pitch angular velocity (right column) during deceleration 1 (top row), deceleration 2 (middle row) and deceleration 3 (bottom row).
Remotesensing 16 00902 g005
Figure 6. FFT spectrum of forward (left column) and up acceleration (middle column) and pitch angular velocity (right column) during acceleration 1 (top row), acceleration 2 (middle row) and acceleration 3 (bottom row).
Remotesensing 16 00902 g006
Figure 7. Flow chart of FFT-based stationary detection and ZVU in the GNSS/IMU tight integration.
Remotesensing 16 00902 g007
Figure 8. Ten-second examples of three-second sliding window FFT spectrum for Stop 1 (top row), Stop 2 (middle row) and Stop 3 (Bottom row). Each panel contains FTT results of eight consecutive windows.
Remotesensing 16 00902 g008
Figure 9. Raw IMU measurements of acceleration (top row) and angular velocity (bottom row) during the passenger entry into the vehicle registered in the second stop period.
Remotesensing 16 00902 g009
Figure 10. Divergence of positioning error in east (left column), north (middle column) and up (right column) during the three stop periods (in each row) with total GNSS outages.
Remotesensing 16 00902 g010
Figure 11. ZVU-constrained positioning error in east (left column), north (middle column) and up (right column) during the three stop periods (in each row) with total GNSS outages. The green line indicates the start time of the stop period.
Remotesensing 16 00902 g011
Table 1. Specifications of MEMS IMU in PwrPak7-E2.
PwrPak7-E2ItemValue
GyroscopeBias Magnitude 360 ° / h
Bias Stability 0.8 ° / h
Angle Random Walk 0.06 ° / h
AccelerometerBias Magnitude 2   mg
Bias Stability 0.012   mg
Velocity Random Walk 0.06   mg / Hz
Table 2. Time range of stop, deceleration and acceleration of the three stop periods.
PeriodStateStartEnd
1Stop02:04:0702:20:13
Decelerating02:03:5602:04:06
Accelerating02:20:1402:20:24
2Stop02:37:3102:59:32
Decelerating02:37:2002:37:30
Accelerating02:59:3302:59:43
3Stop03:21:4203:41:54
Decelerating03:21:3103:21:41
Accelerating03:41:5503:42:05
Table 3. Processing strategy of post-GNSS-PPP/IMU tight integration.
ModuleItemStrategy
GNSSModePost-kinematic PPP
ObservationsIF combination of GPS: C1C-C2W/L1C-L2W; GLO: C1C-C2P/L1C-L2P; Galileo: C1C-C5Q/L1C-L5Q; BDS: C2I-C6I/L2I-L6I
Elevation cutoff15°
Measurement weightElevation-dependent weight
Satellite productsMulti-GNSS precise orbit and clock products from IGS
Receiver clock offsetWhite noise process
ISBConstant mode
Tropospheric delayEstimate the zenith total delay as a random walk process
Phase windupCorrected for rover
Ambiguity resolutionFloat
IMUAlignmentGNSS Doppler velocity
IntegrationSolutionTightly coupled
Table 4. Analysis of the forward/up acceleration and pitch angular velocity with respect to the three frequency ranges (Hz) in the three stops: highest peak, mean value and STD.
Stop PeriodFreq Range
(Hz)
Acce YAcce ZGyro X
Freq
(Hz)
Amp
(mg)
Freq
(Hz)
Amp
(mg)
Freq
(Hz)
Amp
(deg/s)
10~103.0710.1333.3050.1056.2470.003
10~2012.4953.08512.4955.40212.4950.395
20~3024.9912.12424.9913.99424.9910.003
20~100.0010.8903.3320.1070.1000.002
10~2012.4961.62212.4962.83912.4960.182
20~3024.9914.28324.9912.00124.9910.005
30~106.2480.0853.5730.1136.2480.002
10~2012.4962.82112.4964.92712.4960.305
20~3024.9912.82924.9914.78224.9910.005
Mean0~103.1060.3693.4040.1084.1980.002
10~2012.4952.50912.4954.38912.4950.294
20~3024.9913.07824.9913.59224.9910.004
STD0~102.5500.3690.1210.0032.8985 × 10−4
10~204 × 10−40.6374 × 10−41.1134 × 10−40.087
20~302 × 10−40.8992 × 10−41.1712 × 10−40.001
Table 5. Correct rate of FFT stationary detection during the three stop periods.
Stop PeriodDuration (s)Correct (s)Rate
196696599.9%
21321131499.5%
31212120899.7%
Total3499348799.7%
Table 6. RMS, STD and Max of position variation with respect to the initial position of each stop period.
Stop PeriodEast (cm)North (cm)Up (cm)
RMSSTDMaxRMSSTDMaxRMSSTDMax
10.990.982.921.390.923.160.310.290.87
21.000.442.170.700.422.162.240.212.72
31.290.472.450.730.632.121.360.252.08
Average1.090.632.510.940.662.481.300.251.89
Disclaimer/Publisher’s Note: The statements, opinions and data contained in all publications are solely those of the individual author(s) and contributor(s) and not of MDPI and/or the editor(s). MDPI and/or the editor(s) disclaim responsibility for any injury to people or property resulting from any ideas, methods, instructions or products referred to in the content.