Article

Optimizing the Atmospheric CO2 Retrieval Based on the NDACC-Type FTIR Mid-Infrared Spectra at Xianghe, China

1
CNRC & LAGEO, Institute of Atmospheric Physics, Chinese Academy of Sciences, Beijing 100029, China
2
College of Earth and Planetary Sciences, University of Chinese Academy of Sciences, Beijing 100049, China
3
Royal Belgian Institute for Space Aeronomy (BIRA-IASB), 1180 Brussels, Belgium
4
Xianghe Observatory of Whole Atmosphere, Institute of Atmospheric Physics, Chinese Academy of Sciences, Langfang 065400, China
5
Institute of Carbon Neutrality, Jinan 250100, China
*
Author to whom correspondence should be addressed.
Remote Sens. 2024, 16(5), 900; https://doi.org/10.3390/rs16050900
Submission received: 13 January 2024 / Revised: 16 February 2024 / Accepted: 26 February 2024 / Published: 3 March 2024

Abstract

:
Carbon dioxide (CO2) is the most important long-lived greenhouse gas and can be retrieved using solar absorption spectra recorded by a ground-based Fourier-transform infrared spectrometer (FTIR). In this study, we investigate the CO2 retrieval strategy using the Network for the Detection of Atmospheric Composition Change–Infrared Working Group (NDACC–IRWG) type spectra between August 2018 and April 2022 (~4 years) at Xianghe, China, aiming to find the optimal observed spectra, retrieval window, and spectroscopy. Two spectral regions, near 2600 and 4800 cm−1, are analyzed. The differences in column-averaged dry-air mole fraction of CO2 (XCO2) derived from spectroscopies (ATM18, ATM20, HITRAN2016, and HITRAN2020) can be up to 1.65 ± 0.95 ppm and 7.96 ± 2.02 ppm for NDACC-type 2600 cm−1 and 4800 cm−1 retrievals, respectively, which is mainly due to the CO2 differences in air-broadened Lorentzian HWHM coefficient (γair) and line intensity (S). HITRAN2020 provides the best fitting, and the retrieved CO2 columns and profiles from both 2600 and 4800 cm−1 are compared to the co-located Total Column Carbon Observing Network (TCCON) measurements and the greenhouse gas reanalysis dataset from the Copernicus Atmosphere Monitoring Service (CAMS). The amplitude of XCO2 seasonal variation derived from the NDACC-type (4800 cm−1) is closer to the TCCON measurements than that from the NDACC-type (2600 cm−1). Moreover, the NDACC-type (2600 cm−1) retrievals are strongly affected by the a priori profile. For tropospheric XCO2, the correlation coefficient between NDACC-type (4800 cm−1) and CAMS model is 0.73, which is higher than that between NDACC-type (2600 cm−1) and CAMS model (R = 0.56).

1. Introduction

Carbon dioxide (CO2) is the most important long-lived greenhouse gas that plays a significant role in global climate change. The concentration of CO2 in the atmosphere has increased from 277 ppm in 1750 to 417.2 ppm in 2022 [1,2], which is mainly owing to human activities such as fossil fuel combustion and land use change [1]. The IPCC AR6 report demonstrated that the fertilization effect of CO2 and climate warming can impact the biodiversity of coastal ecosystems [3]. The CO2 concentration dependence of global terrestrial carbon storage is one of the largest and most uncertain feedbacks to the terrestrial carbon cycle, greatly affecting climate change [4]. Accurate and precise monitoring of atmospheric CO2 can provide an insight into the carbon cycle and help mitigate carbon emissions.
The Total Carbon Column Observing Network (TCCON) uses a ground-based Fourier-transform infrared spectrometer (FTIR) to retrieve column-averaged dry-air mole fraction of CO2 (XCO2) via shortwave infrared (SWIR) solar absorption spectra. TCCON was established in 2004 with 4 sites and expanded to 28 sites globally in 2023. TCCON XCO2 measurements have been widely used in carbon cycle study and satellite validation [5,6,7,8]. The Network for the Detection of Atmospheric Composition Change–Infrared Working Group (NDACC-IRWG) is another international FTIR network with more than 20 sites globally, recording mid-to-thermal infrared spectra [9]. In total, 10 standard species (CH4, N2O, O3, CO, ClONO2, HCl, HF, HNO3, C2H6, HCN) are well documented in the NDACC community with recommended retrieval windows, spectroscopy, and other retrieval parameters (https://www2.acom.ucar.edu/irwg, accessed on 5 July 2023).
Previous studies have been carried out to research CO2 retrieval using NDACC-type spectra, but the CO2 retrieval strategy is not well investigated or harmonized. Barthlott et al. [10] proposed a CO2 retrieval strategy using 4 micro-windows near 2620 cm−1, and they performed the CO2 retrievals at several NDACC sites. Buschmann et al. [11] used 8 micro-windows between 2620 cm−1 and 3345 cm−1; they found similar results to Barthlott et al. [10]). NDACC CO2 retrievals have weak sensitivity to tropospheric change, which means that they are not suitable for studies of variations on shorter timescales [10,11]. Recently, Chiarella et al. [12] used the vicinity of the 4790 cm−1 band to retrieve XCO2 in the NDACC observational mode and found that the seasonal variation of XCO2 was well captured and the precision of retrieval can be up to 0.2% [12]. In addition to the total column, Shan et al. [13] used the same retrieval windows as Barthlott et al. [10] to study the NDACC retrieved CO2 vertical profile. The paper [13] found that XCO2 is lower than the tropospheric XCO2 at Hefei, and that the seasonal phase and amplitude of CO2 concentration varies among different layers due to the different influence of air masses at different altitudes.
As mentioned above, previous NDACC CO2 studies used different retrieval strategies, e.g., retrieval window and spectroscopy. In this study, we investigate the CO2 retrieval strategy using the NDACC-type spectra between August 2018 and April 2022 (~4 years) at Xianghe, and the objective is to find the optimal parameter settings for CO2 retrievals. Section 2 gives an introduction to the measurement site, retrieval strategies, and datasets involved. The NDACC CO2 retrievals using different settings are compared to each other in Section 3. In addition, the results from NDACC are also compared with the co-located TCCON measurements, as well as the greenhouse gas reanalysis dataset from the Copernicus Atmosphere Monitoring Service (CAMS). Finally, conclusions are drawn in Section 4.

2. Materials and Methods

2.1. Measurement Site

The Xianghe site (39.75°N, 116.96°E; 36 m above sea level) is located about 50 km southeast of Beijing and is affiliated with the Institute of Atmospheric Physics of the Chinese Academy of Sciences (IAP-CAS). This area is dominated by light industry. The main vegetation type is irrigated farmland, and the surrounding buildings are mainly residential houses with a height of less than 20 m [14]. In June 2016, a Bruker IFS 125HR FTIR instrument was installed, and it began recording solar absorption spectra in June 2018 [15]. Currently, Xianghe is an operational TCCON site, and it also records NDACC-type spectra [16,17].

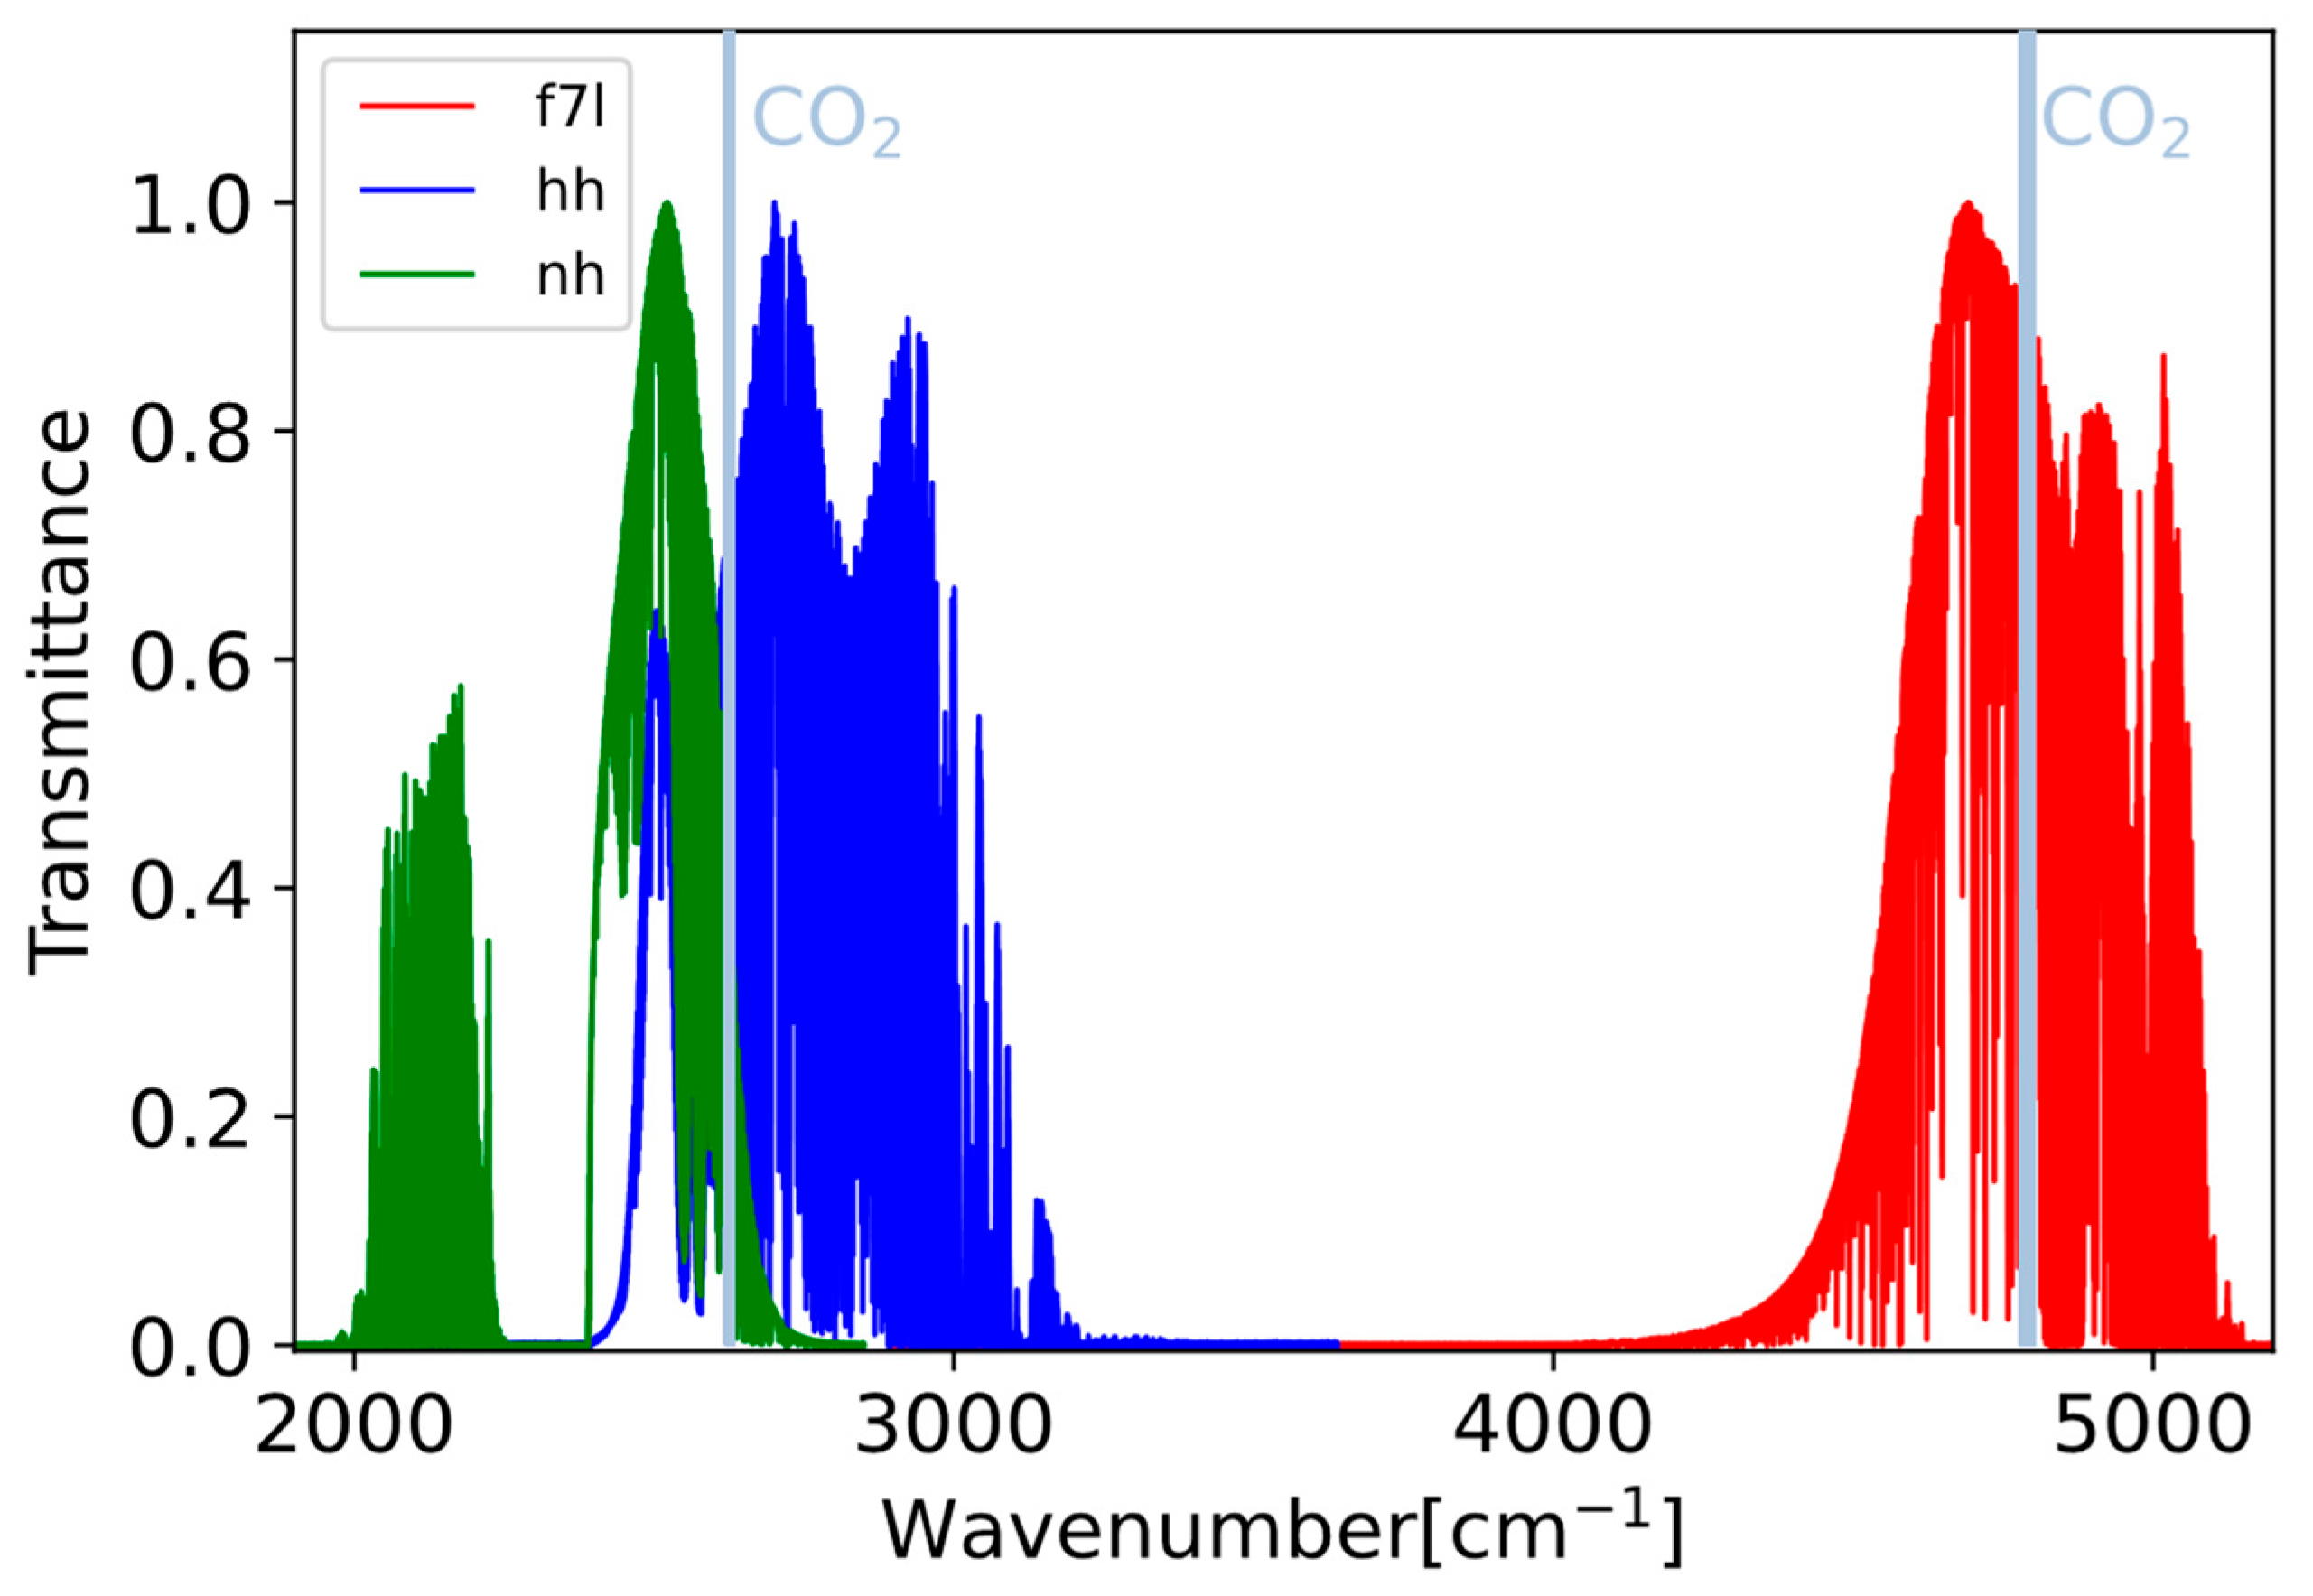
2.2. FTIR Measurement

Two observation modes are used alternately to acquire FTIR spectra at Xianghe. TCCON mode records SWIR spectra, and uses GGG2020 code to retrieve XCO2. The SWIR spectra are acquired by the FTIR with an indium gallium arsenide (InGaAs) detector, which covers the spectral range from 3800 to 10,000 cm−1, with a spectral resolution of 0.02 cm−1. The NDACC mode records mid-infrared (MIR) spectra, and uses SFIT4 code to retrieve both the vertical profile and total column of CO2. The MIR spectra are recorded with a liquid-nitrogen-cooled indium antimonide (InSb) detector, which covers the spectral range from 1800 to 5400 cm−1, with a spectral resolution of 0.0035–0.0078 cm−1 [15]. In addition, NDACC mode uses several optical filters in front of the InSb detector to improve the signal-to-noise ratio (SNR) of the spectra (Appendix A in Blumenstock et al. [18]). Each optical filter obtains a type of spectrum with a specific wavenumber range. As the CO2 absorption lines are mainly located near 2600 cm−1 and 4800 cm−1 [19,20], three types of spectra are looked into in this study, namely nh, hh, and f7l (Figure 1). Both nh and hh spectra cover the CO2 lines near 2600 cm−1, and f7l covers the CO2 lines near 4800 cm−1.
We used all the measurements between August 2018 and April 2022. Due to the COVID-19 lockdown, delivery of liquid nitrogen was not feasible between February and May 2020, resulting in a short gap.

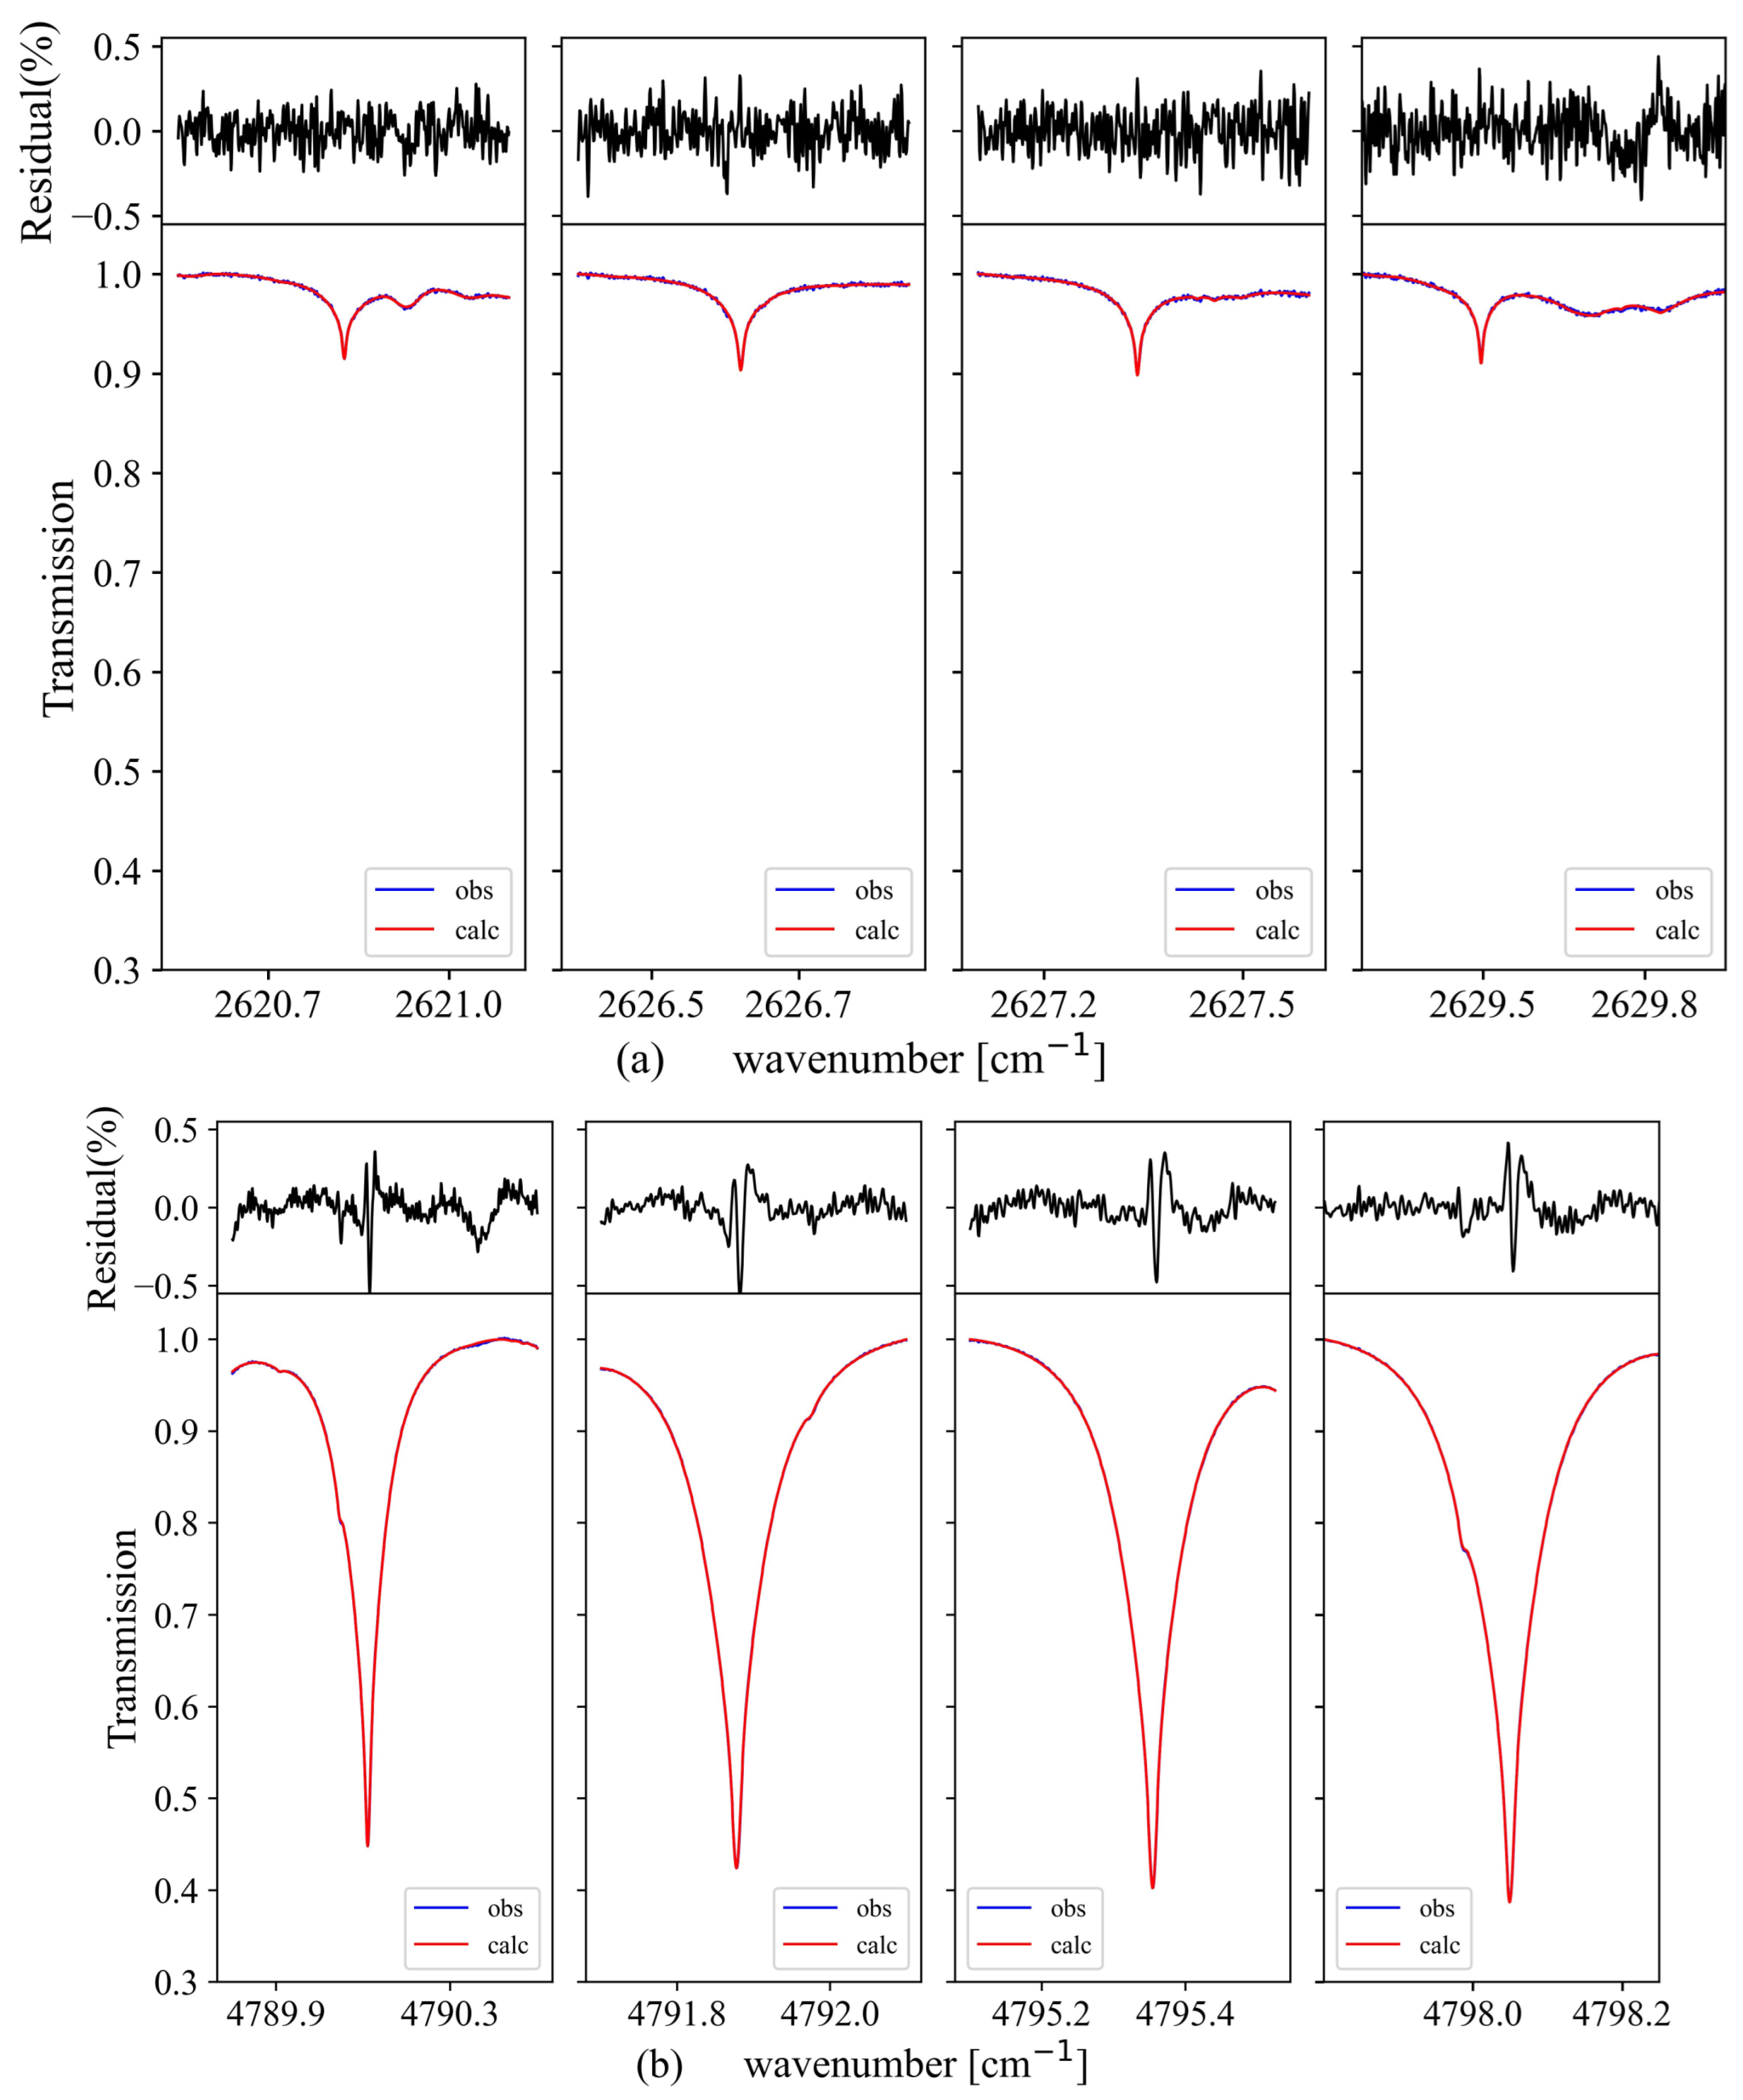
2.3. NDACC Retrieval Strategy

The SFIT4 v1.0.18 software is used to retrieve the column and vertical profile of atmospheric CO2 from the NDACC-type spectra, which comprises an atmospheric radiative transfer model using line-by-line integration and an inversion framework based on the optimal estimation method [21]. In this software, firstly initial atmospheric state vector as input is provided by lots of information including the a priori profiles of gas, temperature and pressure, and line list parameters of gas. The spectrum is simulated based on the atmospheric radiative transfer model combined with instrument line shape, and the difference between simulated and measured spectra is then calculated. The initial state vector will be adjusted iteratively until the difference is less than threshold, at which point the state vector is considered as true. To simulate spectrum, the integral form of the Schwarzschild equation is used, and the atmosphere is subdivided in layers, the number of which is defined by the user. Therefore, the integral can be replaced by a sum over discreet layers in the atmosphere:
I = B exp τ + i = 0 n B i e x p τ i + 1 e x p τ i
τ i = i = 0 n k i α i
where B i represents the Planck function of layer i and τ i represents the optical depth from ground to layer i, which is calculated by the absorption cross section α i and absorber k i . n represents the number of total layers, which we set here as 47. The main retrieval parameter settings are listed in Table 1.
The retrieved CO2 profile x r can be presented as:
x r = x a + A x t x a + ε ,
A = G K = K T S ϵ 1 K + S a 1 1 K T S ϵ 1 K ,
where x t and x a represent the true and a priori profiles of CO2 mole fraction, respectively; ε represents the error containing the forward model and observation error; K and G are the Jacobian matrix and gain matrix, respectively; and S ϵ and S a are the covariance matrix of the measurement and prior, respectively. The relative magnitudes of S ϵ and S a determine the weights of measurement and a priori information. Here, S ϵ is constructed using the spectral signal-to-noise ratio (SNR) whose diagonal elements are set to (1/SNR2) and non-diagonal lines are 0. The SNR near 2600 cm−1 and 4800 cm−1 bands are set to 400 and 250, respectively. A is the averaging kernel matrix, indicating the sensitivity of the retrieved CO2 profile to the perturbation of the true and prior at each vertical level.
The Tikhonov regularization is used to construct S a ( S a 1 = R = α L 1 T L 1 ) [22], where α values are chosen depending on the root mean square error (RMSE), DOF, and the CO2 profile from the retrieval [23]. Several α values were tested with the spectra on 3 July 2019, as this was a day with a relatively large number (9 for nh and 10 for f7l) and high quality of spectra. The results for NDACC-type (2600 cm−1) and NDACC-type (4800 cm−1) retrievals are listed in Table 2, and the a priori and retrieved CO2 vertical profiles are shown in Figure 2. It is noted that we use the same parameter settings for nh and hh type spectra (2600 cm−1), and the retrieved results shown in Figure 2 are the nh type spectra. For NDACC-type (2600 cm−1) retrievals, the CO2 vertical profile exhibits significant anomalies with α = 500. The RMSE with α = 1500 is almost the same as those with α = 2500 and α = 6000, but the DOF is greater. For NDACC-type (4800 cm−1) retrievals, the XCO2 value with α = 2500 is similar to that with α = 6000 and provides the lowest mean RMSE value. Finally, the α near the 2600 cm−1 and 4800 cm−1 bands are set to 1500 and 2500, respectively.
Regarding the a priori profiles, we use the mean of the Whole Atmosphere Community Climate Model (WACCM v7) between 1980 and 2040 to generate the CO2, CH4, N2O, and O3 priors. Note that these a priori profiles are fixed, which means that they do not vary with time. Due to the large variation, the a priori profiles of H2O and HDO are derived from the National Centers for Environmental Protection (NCEP) 6-hourly reanalysis data and interpolated to the measurement time.
The spectroscopic parameters are key elements in the remote sensing field. Here, several spectroscopic databases have been tested in Section 3.1.1. The retrieval micro-windows are rather important, too. Generally, retrieval windows are taken where the target gas absorption is significant but not saturated and where interference from other gases is minimized [11]. In the MIR spectral range, there are many other interfering gases with strong absorption. According to the HITRAN2020 database, as well as previous studies, micro-windows near 2600 cm−1 and 4800 cm−1 are selected separately. The interfering gases simultaneously retrieved in each band are given in Table 1 [10,12,24]. Figure 3 shows two typical spectra near 2600 cm−1 collected at 01:57 UTC on 16 April 2019 with a solar zenith angle (SZA) of 48.67° and near 4800 cm−1 collected at 01:26 UTC on 16 April 2019 with a SZA of 43.35°, respectively. The fitting residuals of all windows are within ±0.5%, and the two RMSE values are 0.116% and 0.111%, indicating that we obtained good fits in both spectral regions.
The CO2 total column averaging kernels (AVK) from the FTIR retrievals are shown in Figure 4. The shape and numerical magnitude of the column AVK are influenced by various factors, such as SZA, retrieval window, and spectroscopy [12,25,26]. The NDACC-type (2600 cm−1) CO2 retrievals have a relatively weak sensitivity in the lower troposphere but a good sensitivity in the upper troposphere and lower stratosphere, with values varying from 0.5 to 1.5 with altitude in the troposphere. The NDACC-type (4800 cm−1) CO2 retrievals have a good sensitivity in the troposphere and lower stratosphere, with values close to 1.
According to the optimal estimation method (OEM) [21], the trace of A is the signal degree of freedom (DOF). When the DOF of the target gas within a vertical range is greater than 1, this indicates that the corresponding total column can be separated into independent partial columns [24,27]. Vertical information on CO2 can be obtained in our NDACC retrievals, and here the DOF is about 2.0 for the NDACC-type (2600 cm−1) CO2 retrievals and about 2.6 for the NDACC-type (4800 cm−1) CO2 retrievals.

2.4. Reference Datasets and Comparison Methods

2.4.1. TCCON

As mentioned above, TCCON measurements are also carried out at Xianghe. TCCON uses the GGG2020 algorithm to retrieve XCO2 [28]:
X C O 2 = 0.2095 × C o l u m n C O 2 C o l u m n O 2 ,
where the CO2 column is retrieved using 6180–6260 cm−1 and 6297–6382 cm−1 bands and the O2 column is retrieved in the 7765–8005 cm−1 band. Using the retrieved O2 column can reduce common uncertainties, such as instrument and light path errors [10,25]. The uncertainty of TCCON XCO2 is proved to be below 0.15% (~0.6 ppm) [29], and the TCCON CO2 retrievals have good sensitivity in the troposphere (Figure 4c).
To evaluate the performance of the retrieval of NDACC XCO2, the results are compared with co-located TCCON measurements. Note that NDACC uses the surface pressure and water vapor column to calculate XCO2:
X C O 2 = V C C O 2 P S N A m a i r d r y g V C H 2 O m H 2 O m a i r d r y ,
where m a i r d r y and m H 2 O are the molecular masses of dry air and water, respectively; P S is the surface pressure; {g} is the column-averaged gravitational acceleration; V C C O 2 and V C H 2 O are the total column of CO2 and H2O, respectively; and N A is the Avogadro constant number, which is 6.022 × 10²³ molecules/mole [30,31].
Since TCCON and NDACC use different a priori profiles and have different vertical sensitivities, we need to correct these differences before comparing both datasets [32]. Here, a prior substitution is applied, where the TCCON a priori profile is used as the common a priori profile to adapt the NDACC retrievals [33]:
x N , r = x N , r + I A N x T , a x N , a ,
where x N , r is the NDACC retrieved CO2 profile; I is the unit matrix; A N is the NDACC averaging kernel matrix; and x T , a and x N , a are the TCCON and NDACC a priori profiles, respectively. After that, the x N , r is smoothed with TCCON column averaging kernel ( A T ) to take the vertical sensitivity of TCCON retrievals into consideration:
T C N , r = T C a , T + A T P C d r y , a i r x N , r x T , a ,
where P C d r y , a i r is the dry air partial column profile and T C a , T is the TCCON a priori total column. Finally, T C N , r is compared to the co-located TCCON retrievals.

2.4.2. CAMS Global Greenhouse Gas Reanalysis (EGG4)

The CAMS global greenhouse gas reanalysis (version egg4) assimilates both in situ and satellite measurements. It provides atmospheric CO2 mole fractions with a spatial resolution of 0.75° × 0.75° and a temporal resolution of 3 h. In this study, we use 1-year (2019) model data with 25 pressure levels (1000 to 1 hPa). The CAMS global greenhouse reanalysis data (EGG4) has been well evaluated in previous studies, whose error is within ±10 ppm for near-surface CO2 mole fraction and ±4 ppm for XCO2, respectively, for the period from 2003 to 2020, validated against a set of independent observations. The CAMS model can capture well the synoptic and large-scale variability of CO2 [34].
In addition, the vertical profiles of target gas can be provided in NDACC retrievals. For the purpose of evaluating the performance of the NDACC CO2 vertical retrievals, the tropospheric CO2 partial column from NDACC measurement is compared with CAMS model data as well. In consideration of the comparison, for CAMS model data, the nearest model pixel close to Xianghe is selected.
To obtain tropospheric information, we choose the monthly mean of tropopause pressure gridded data from NCEP/NCAR reanalysis dataset in 2019, which is global and has a grid resolution of 2.5° × 2.5°, and can be downloaded from https://psl.noaa.gov/data/gridded/data.ncep.reanalysis.html#source (accessed on 5 July 2023). We use the grid data near Xianghe and then convert pressure values into altitude values and take an average. Here, the troposphere is set to 12.2 km. In the vertical range between the surface and the tropopause height, the mean DOF of CO2 from NDACC-type (2600 cm−1) retrievals is about 1.0, and from NDACC-type (4800 cm−1) retrievals is about 1.5. This indicates that we can derive an independent partial column from both NDACC-type CO2 retrievals. The tropospheric XCO2 mole fraction is defined as:
x C O 2 , t r o p = C o l u m n C O 2 , t r o p C o l u m n d r y a i r , t r o p ,
where C o l u m n C O 2 , t r o p and C o l u m n d r y a i r , t r o p represent partial columns of CO2 and dry air in the troposphere, respectively [24,35].
The CAMS model profiles are first interpolated into the NDACC altitude layer and then smoothed with the NDACC AVK [32]:
x C A M S , s = x a + A x C A M S x a ,
where x C A M S and x C A M S , s are the CAMS reanalysis CO2 profiles without and with smoothing, respectively. x a is the NDACC a priori profile and A is averaging kernel matrix from NDACC retrievals. x C A M S , s is compared to the NDACC retrievals.

3. Results

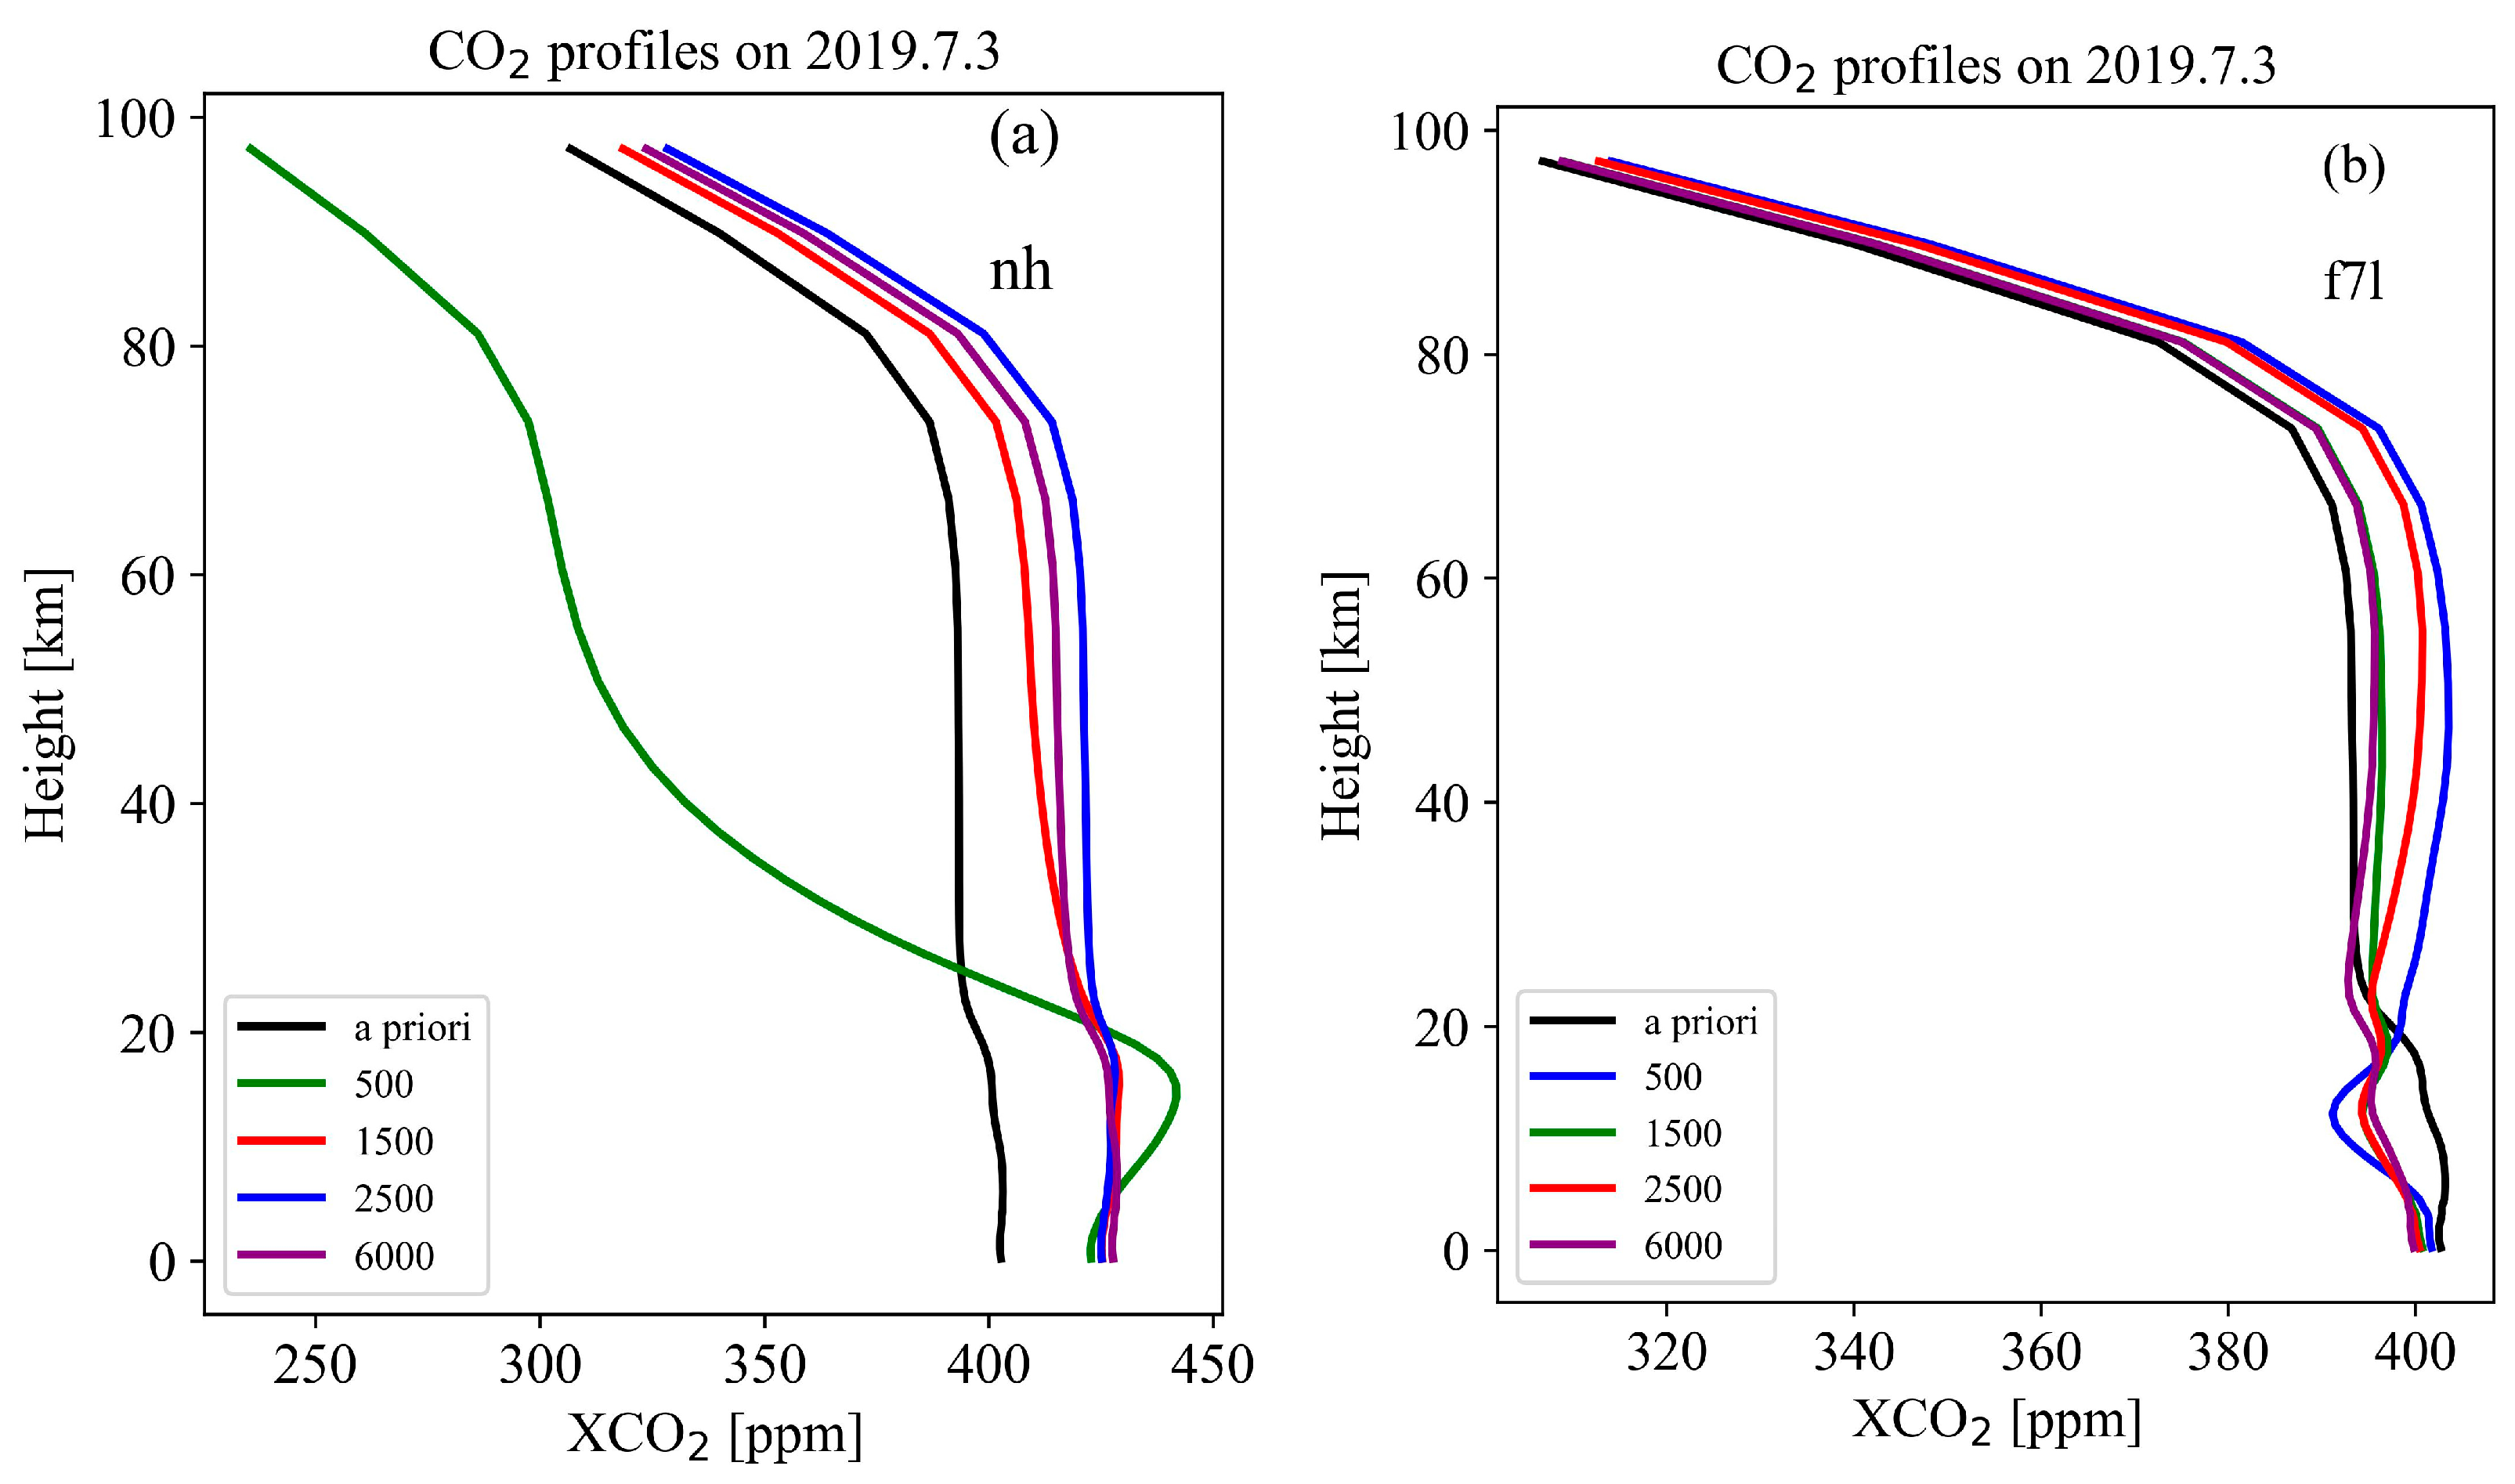
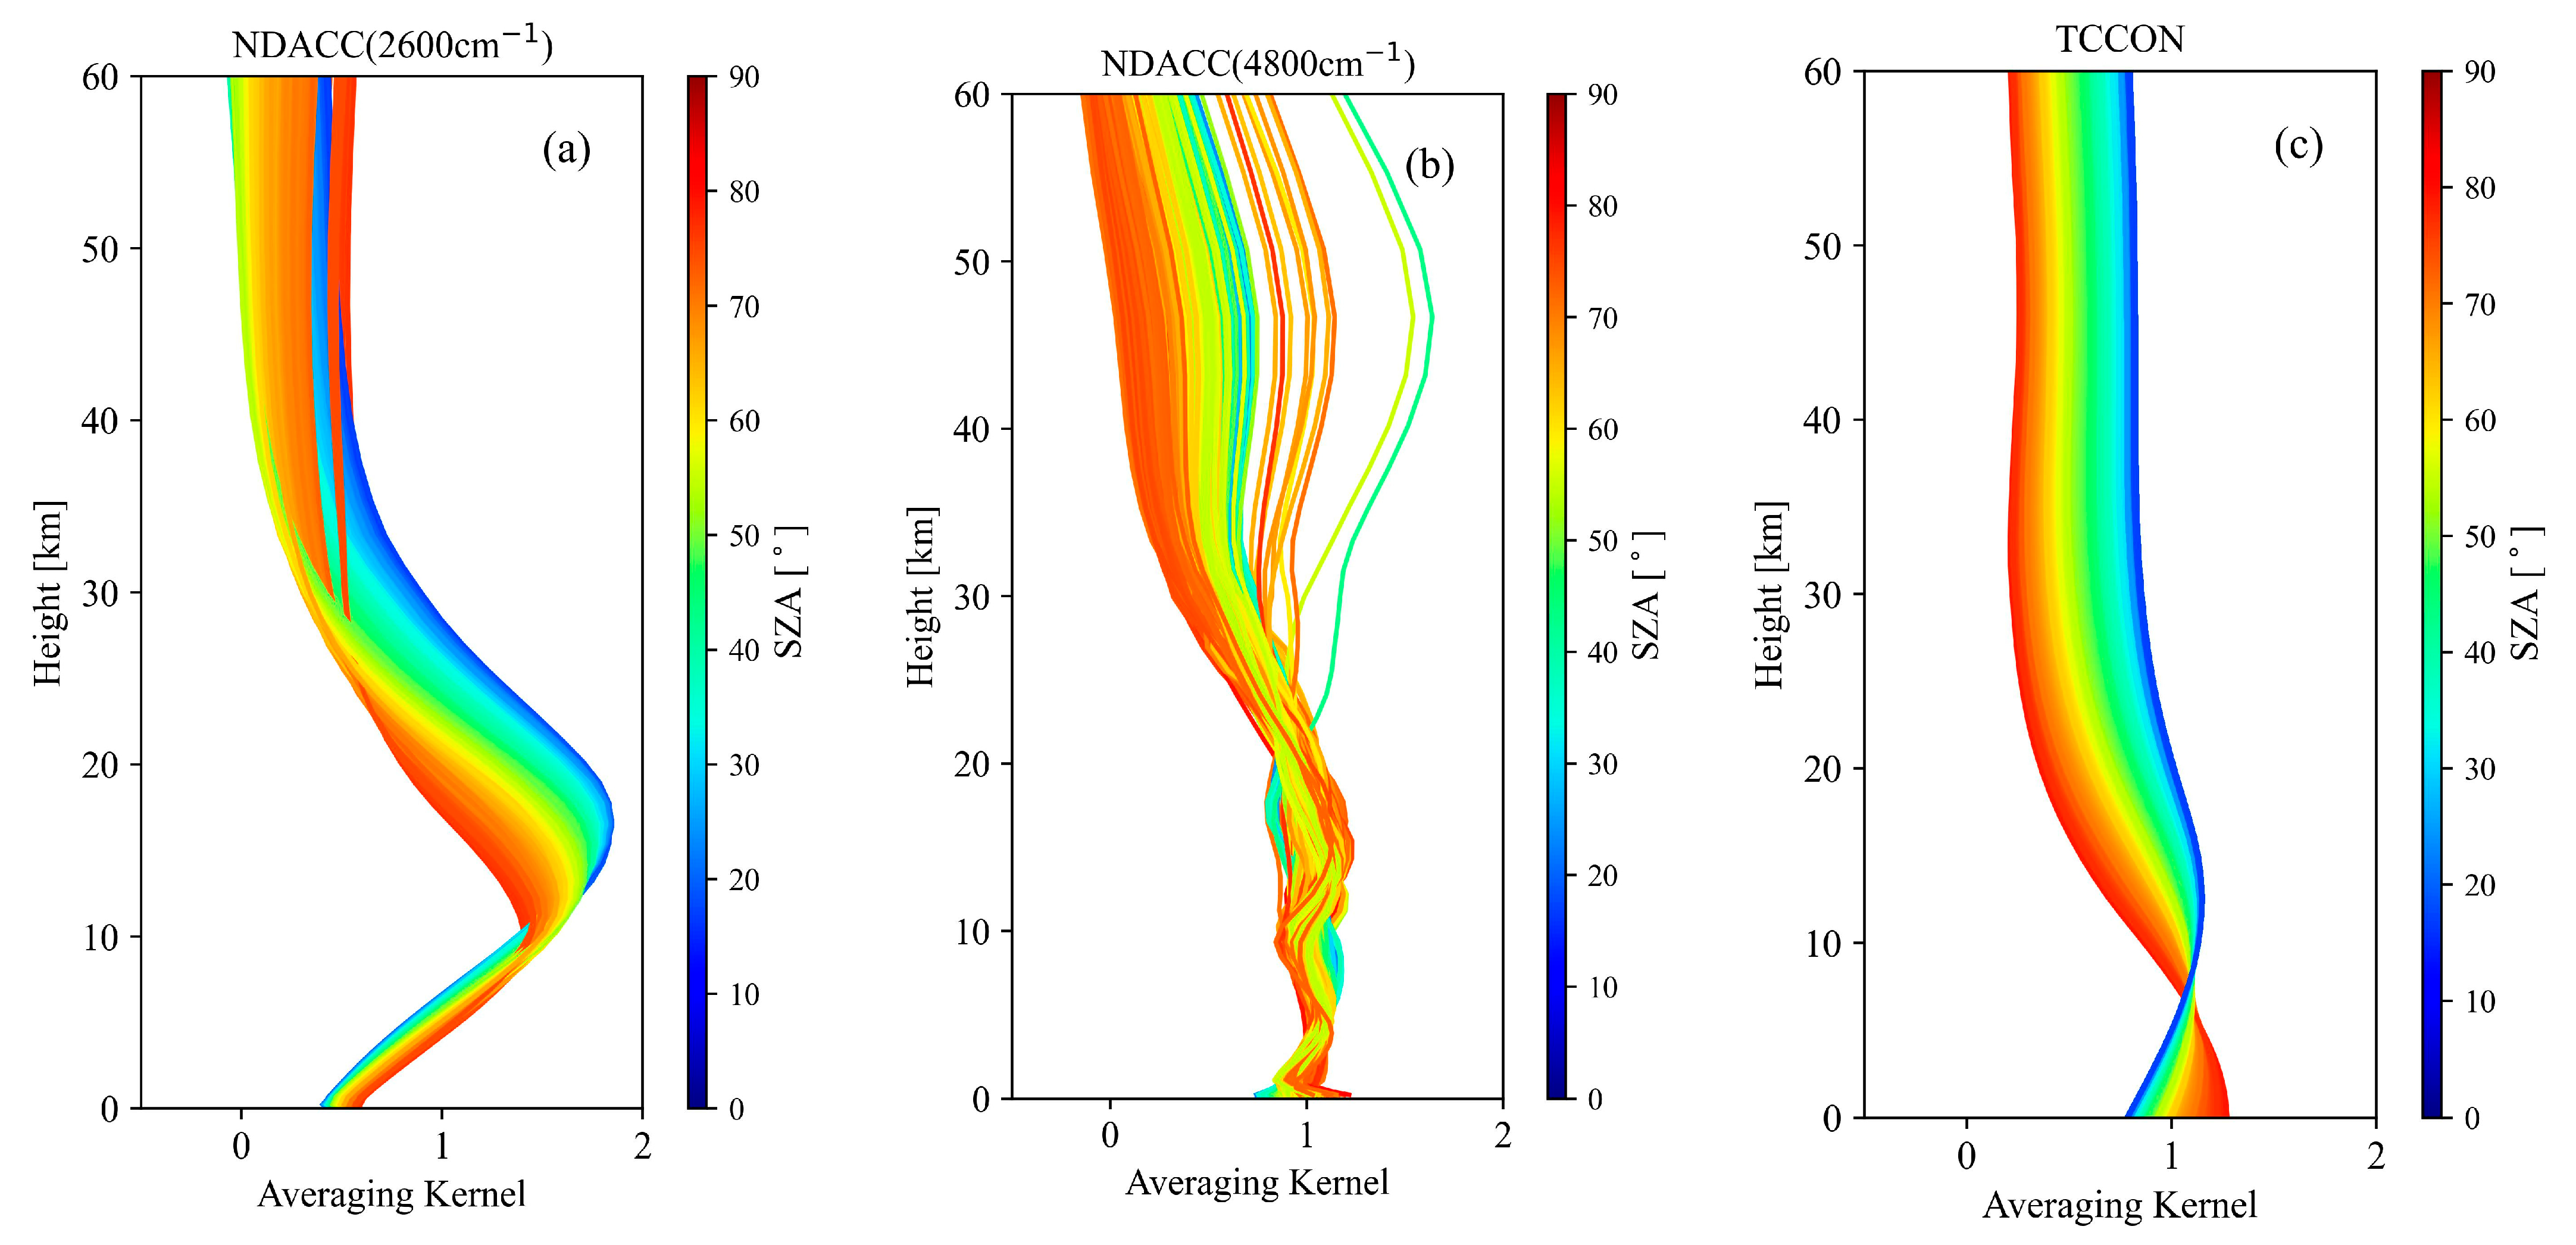
3.1. Sensitivity Studies

3.1.1. Impact from the Type of Spectra and Spectroscopy

Based on previous studies, the uncertainty of the spectroscopy is the dominant error source in CO2 retrieval [10,36]. In this section, 4 spectroscopies (ATM18, ATM20, HITRAN2016 and HITRAN2020) were tested for NDACC CO2 retrievals. Note that we kept all the other parameters unchanged and only changed the spectroscopic parameters of CO2. For the interfering species (H2O, HDO, CH4, N2O, O3), we all used the ATM20 line list, as it provides the best fitting.
The mean values of XCO2, RMSE, and DOF derived from the nh, hh, and f7l spectra when using these four spectroscopic databases between August 2018 and April 2022 are presented in Table 3. In the 2600 cm−1 band, the mean RMSE values from nh and hh spectra reach the minimum by using the HITRAN2020. The mean retrieved XCO2 with ATM18 and HITRAN2016 are the same, and the retrieved XCO2 with HITRAN2020 is slightly lower. Such a difference is mainly due to the difference in line list parameters of CO2. By using the same spectroscopy, the mean XCO2 derived from the nh spectra is slightly greater than that derived from the hh spectra, with a difference of about 0.2–0.3 ppm, and the RMSE derived from the nh spectra is about 0.02% lower than that derived from the hh spectra. It is indicated that the fit of nh spectra is slightly better than that of hh spectra for the CO2 retrievals in the 2600 cm−1 spectral region.
Since the retrieved XCO2 values with ATM18 and HITRAN2016 are the same, the time series of monthly mean retrieved XCO2 using ATM20, HITRAN2016, and HITRAN2020 derived from the nh and hh spectra, together with their differences, are shown in Figure 5. Note that the values here are original, without a priori substitution or AVK smoothing (same as Figure 6). The retrieved XCO2 using different spectroscopies shows a consistent seasonal variation, with a maximum in spring and a minimum in summer. Moreover, the amplitudes of the seasonal variations using different spectroscopies are almost the same. The monthly standard deviation of XCO2 derived from the nh spectra is slightly less than that derived from the hh spectra. A slight difference in XCO2 derived from nh and hh is observed, with a range of −2.5 to 2.1 ppm. One possible reason is that the nh and hh spectra are not observed at the same time, leading to a sampling error. Nevertheless, the retrieved results between nh and hh are similar, and only the results of nh are shown in the remainder of this paper.
As for the 4800 cm−1 band, there is only one spectral type (f7l). The mean DOF in the CO2 retrievals with these four spectroscopic databases are almost consistent (2.6). The retrieved results by using ATM18 and ATM20 are the same. The retrieved XCO2 values with HITRAN2020 are about 6–8 ppm lower than the others, and they show their superiority for significantly lower RMSE values, with a value of about 0.13% [37]. Figure 6 shows the time series of retrieved monthly mean XCO2 derived from the f7l spectra. Similar to the features exhibited in 2600 cm−1, using different spectroscopies has comparable seasonal variations of XCO2, but with slightly different mean values.

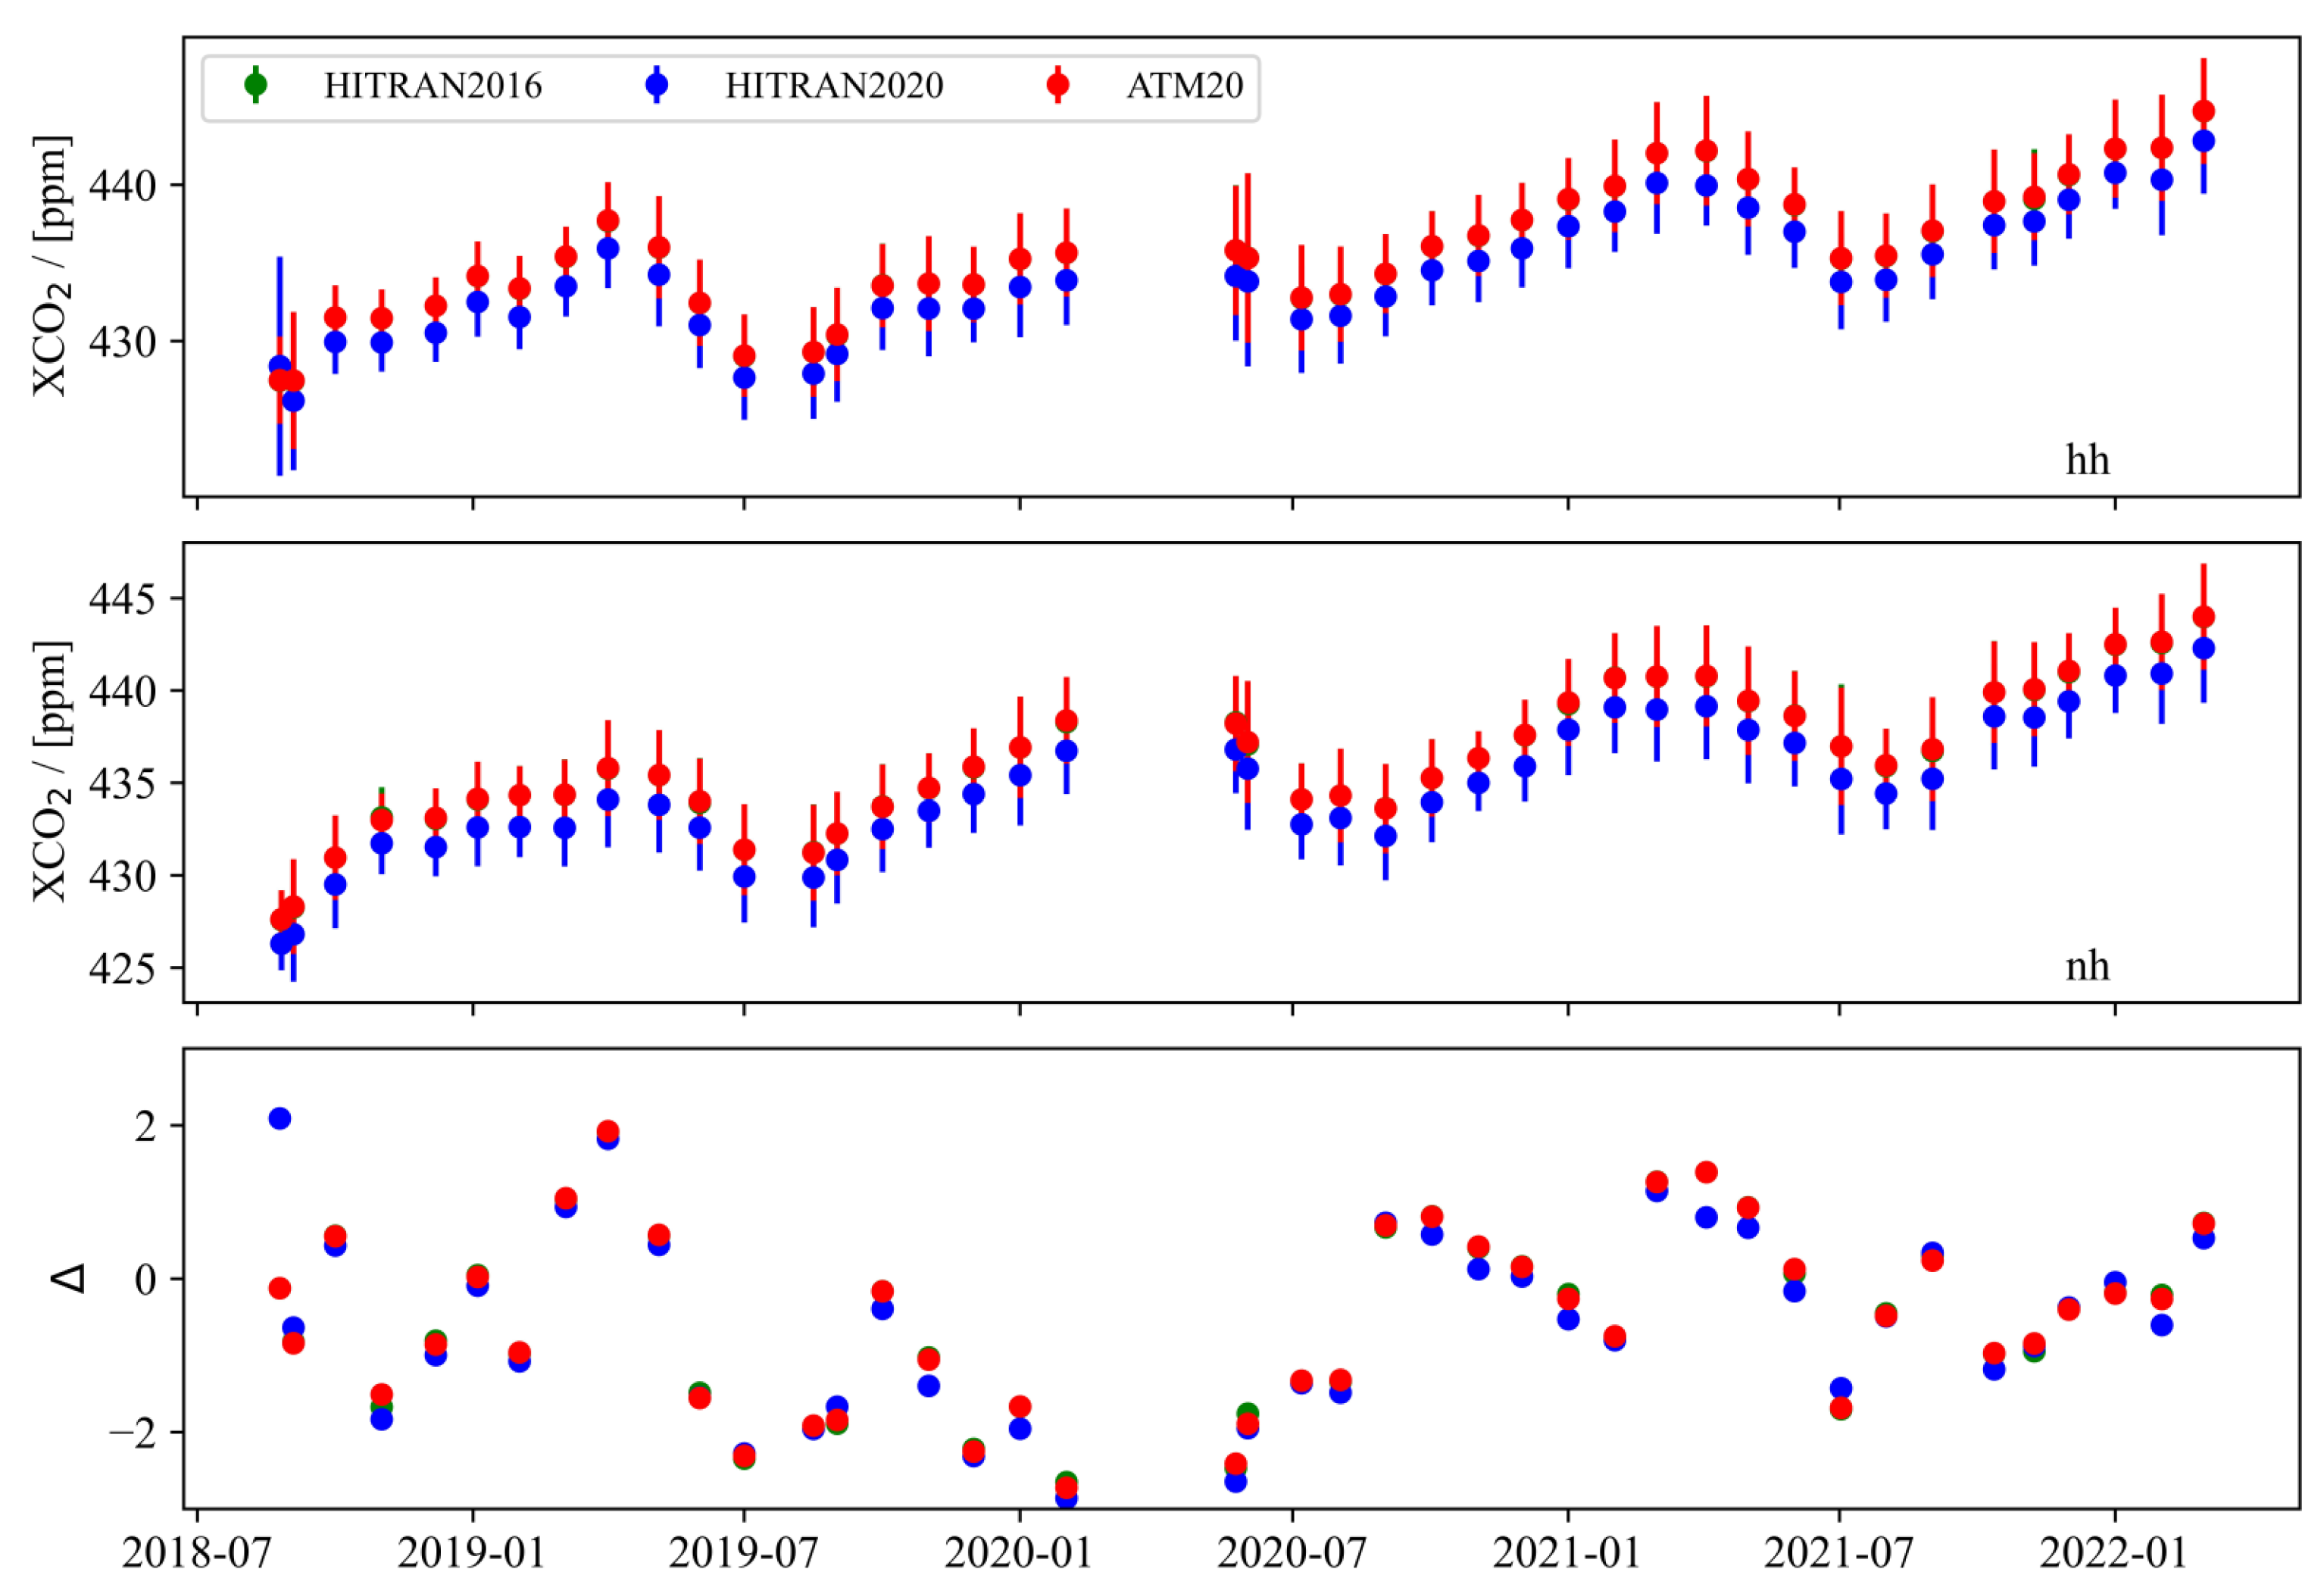
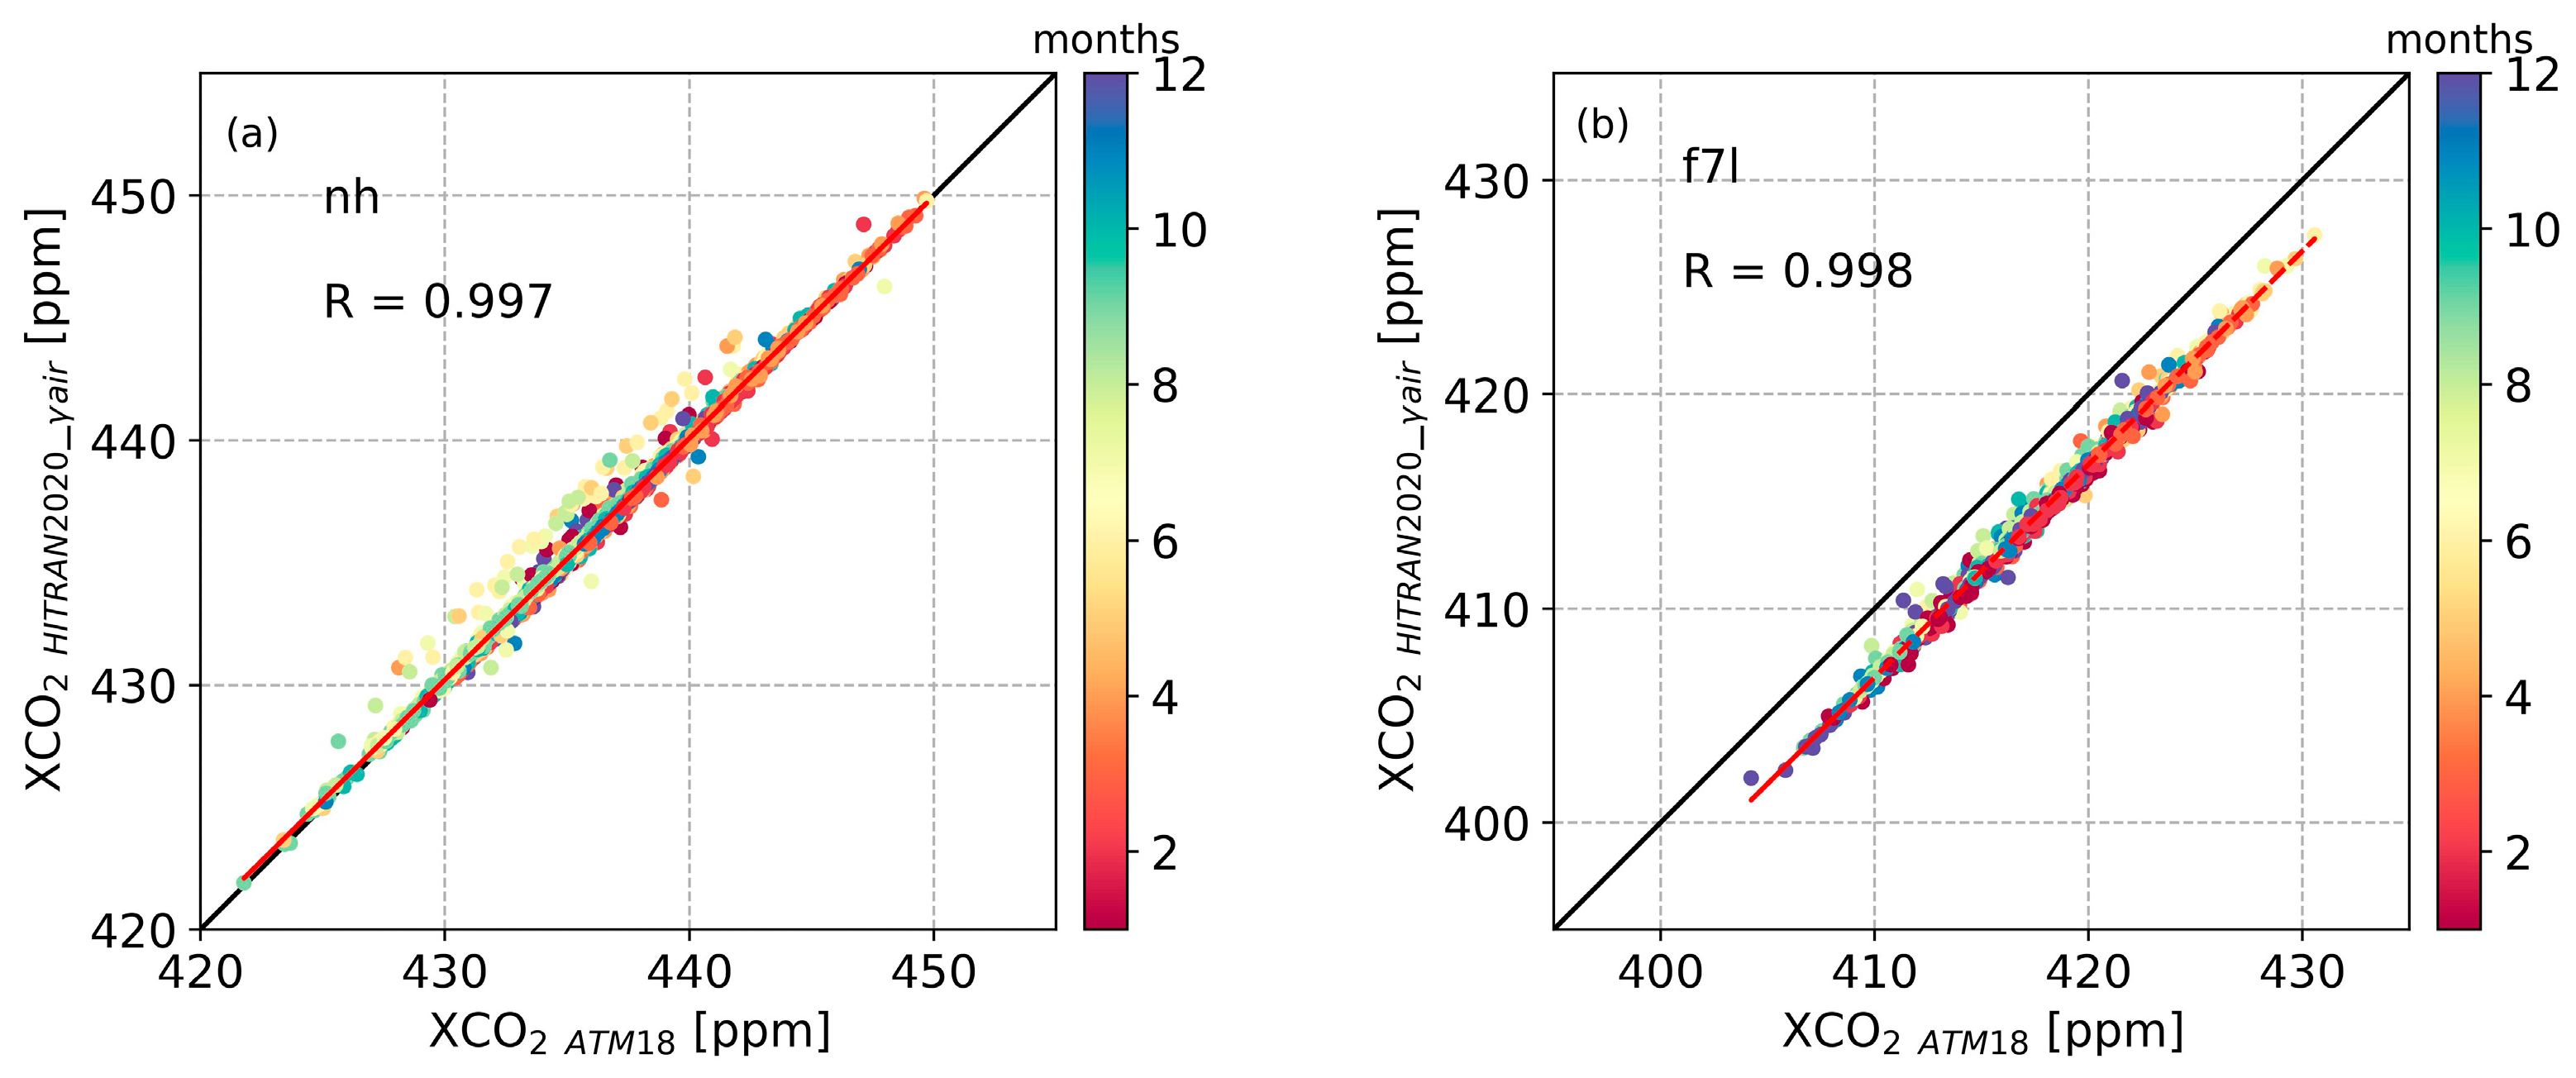
3.1.2. Impact from Line List Parameters

To better understand the impact of spectroscopy, we made sensitivity tests about the line intensity (S), air-broadened Lorentzian HWHM coefficient (γair), and self-broadened Lorentzian HWHM coefficient (γself). Firstly, we changed these values in HITRAN2020 at the position of the strongest line intensity in retrieval windows to the values of corresponding positions in ATM18. The information of the position with the strongest line intensity in each retrieval micro-window from four different spectroscopies are listed in Table A1. Then, the XCO2 values retrieved with the changed HITRAN2020 (HITRAN2020_γair, HITRAN2020_γself, and HITRAN2020_S) were compared to the XCO2 retrieved with unchanged HITRAN2020 and ATM18. Figure 7 shows the correlations and differences between retrieved XCO2 with unchanged HITRAN2020 and different spectroscopies in 2600 cm−1 (nh) and 4800 cm−1 (f7l) bands, respectively. In the 2600 cm−1 band, the values of S at the corresponding positions in ATM18 and HITRAN2020 are the same. Therefore, only the retrieved values with HITRAN2020_γair (blue) and HITRAN2020_γself (green), respectively, are given here. In 2600 cm−1, it can apparently be found that the retrieved XCO2 with HITRAN2020_γself is very close to those using unchanged HITRAN2020. The difference between them is close to 0, and the Pearson correlation coefficient (R) is about 0.999. The retrieved XCO2 with HITRAN2020_γair is much closer to that with those using ATM18, with an R of 0.997 (Figure 8a).
In 4800 cm−1, among these changed parameters, the retrieved XCO2 with HITRAN2020_γair is quite different from that with unchanged HITRAN2020 but much closer to that with ATM18, which shows the same performance as in 2600 cm−1. The R between the retrieved XCO2 with HITRAN2020_γair and ATM18 is 0.998 (Figure 8b). Additionally, the parameter S also plays an important role in retrieval, with R of 0.995 between the retrieved XCO2 using HITRAN2020_S and unchanged HITRAN2020. The difference between retrieved CO2 with changed HITRAN2020 and unchanged HITRAN2020 is 4.93 ± 0.79 ppm for HITRAN2020_γair, 2.90 ± 0.41 ppm for HITRAN2020_S, and 0.004 ± 0.04 ppm for HITRAN2020_γself, respectively. The difference in parameter γself causes little effect, which is consistent with the characteristics found in 2600 cm−1.
In summary, we select the HITRAN2020 for CO2 retrieval both for NDACC-type (2600 cm−1) and NDACC-type (4800 cm−1).

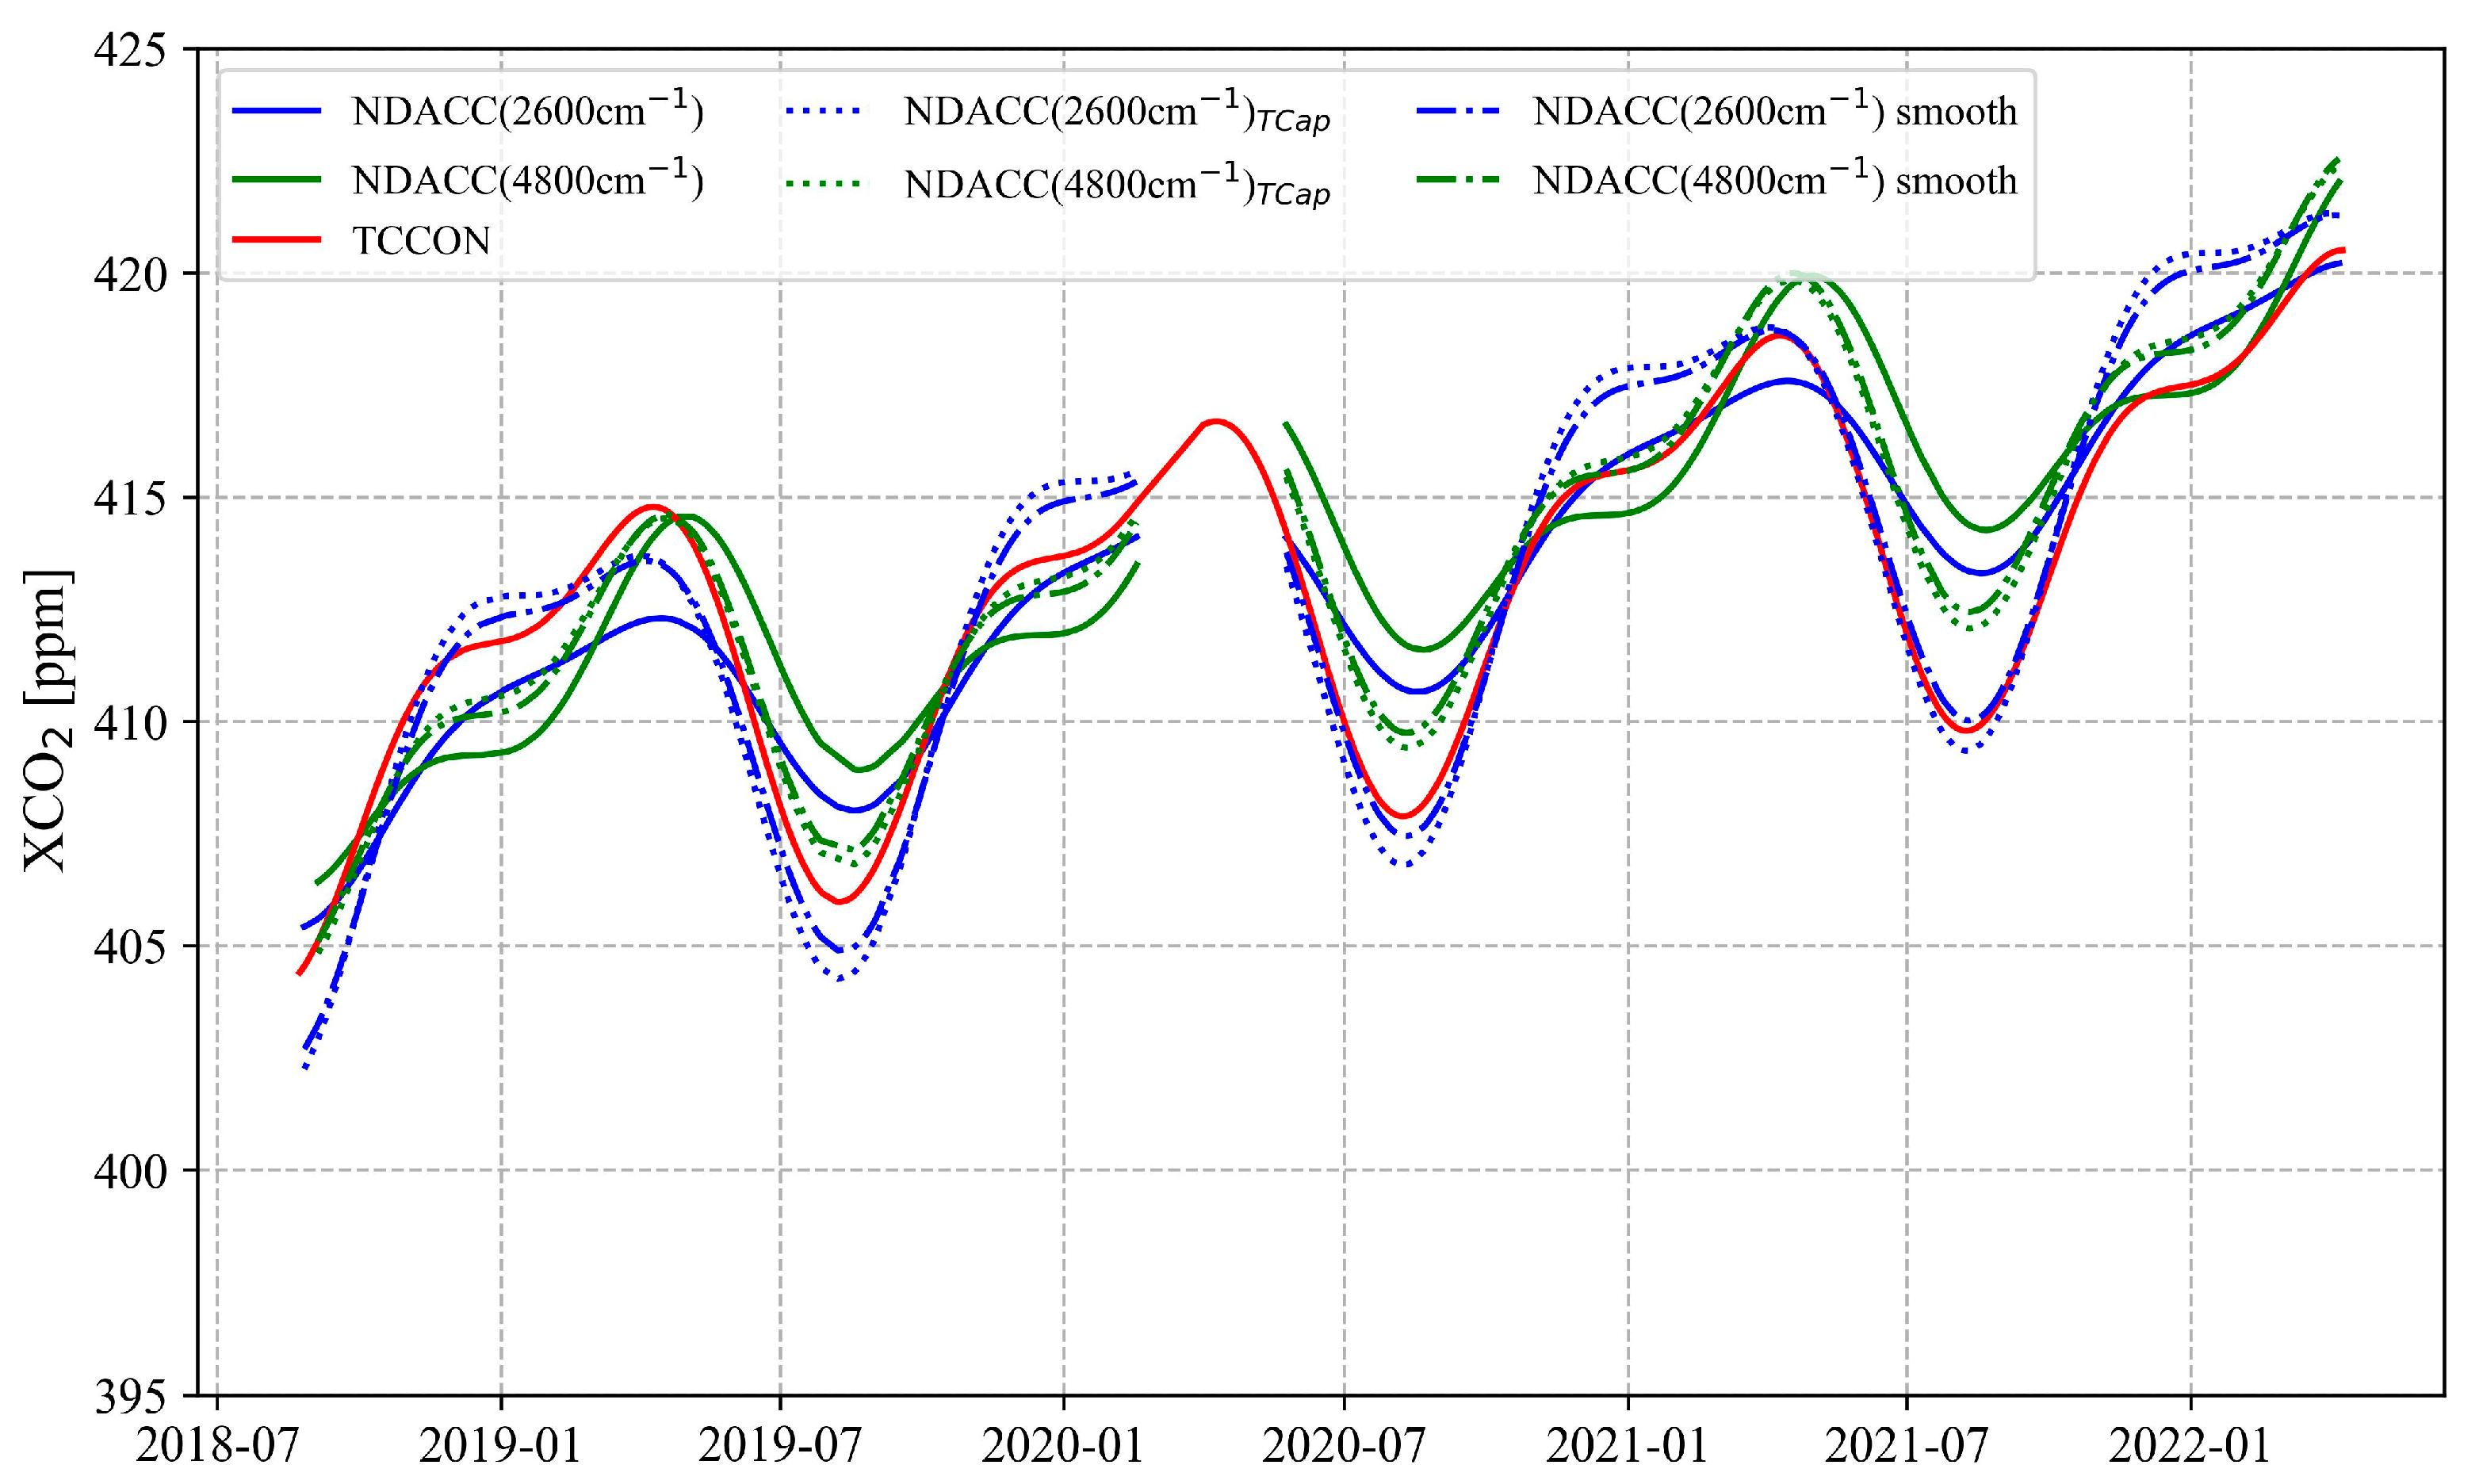
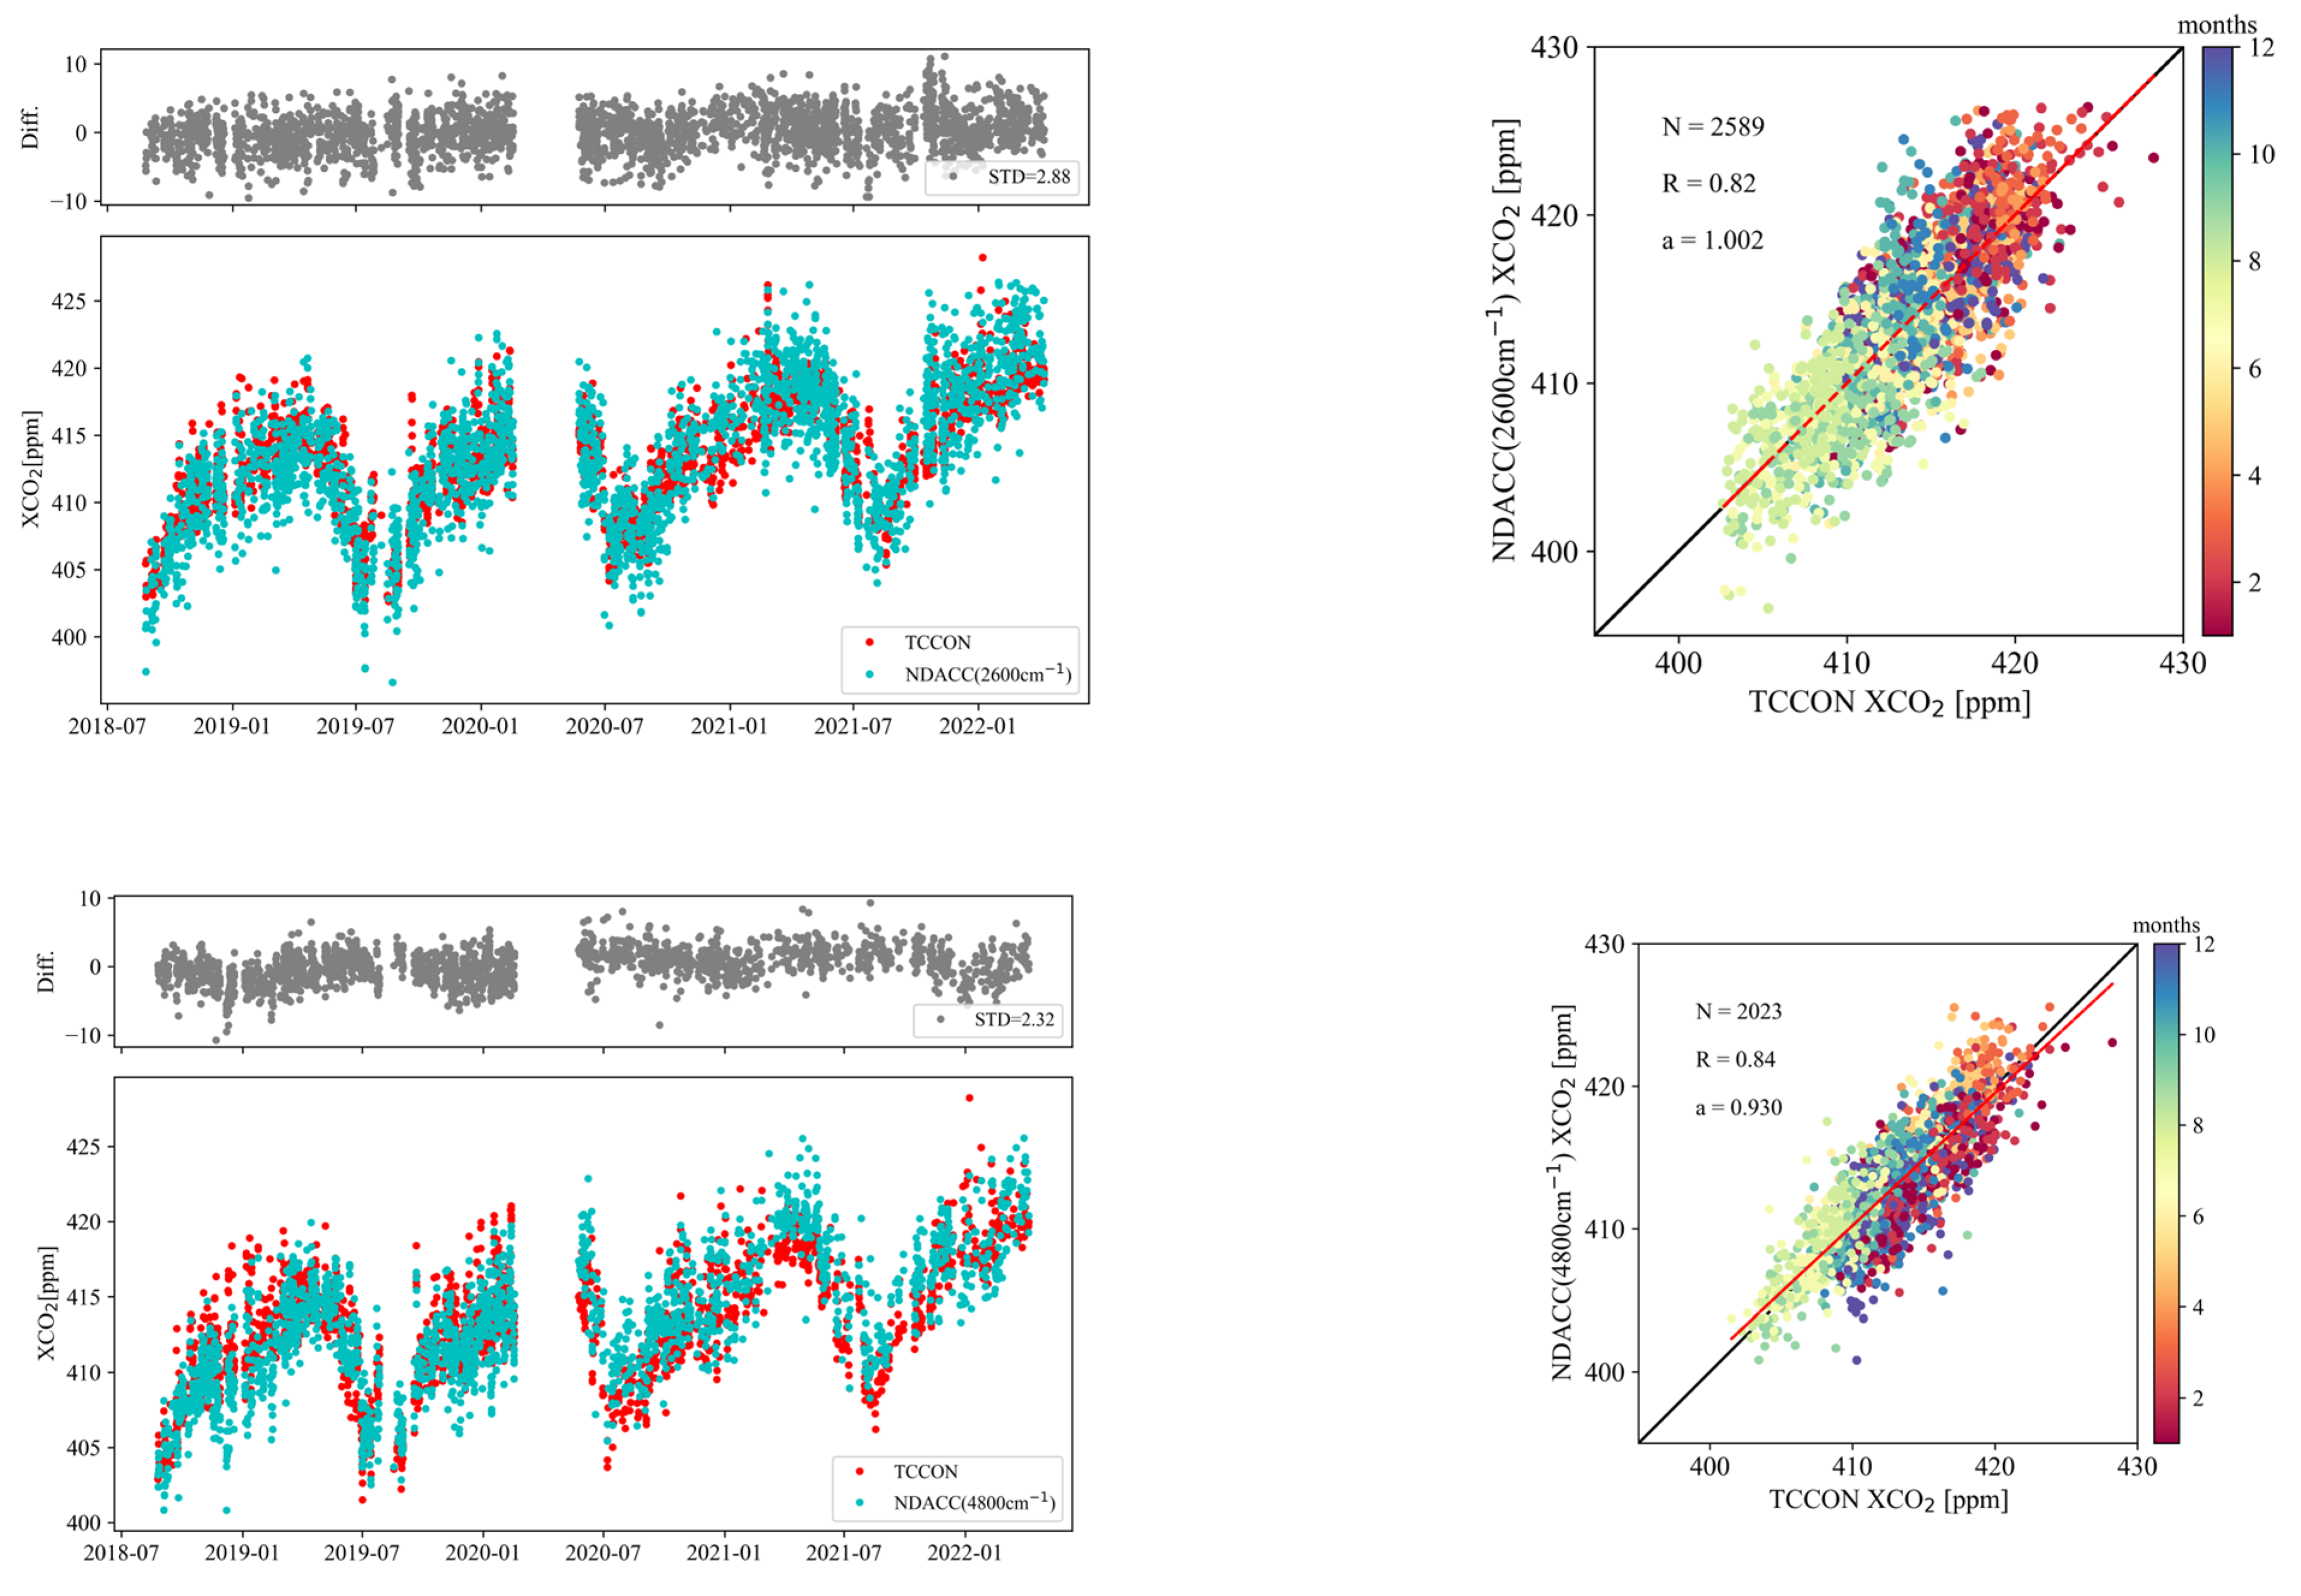
3.2. Comparison with TCCON Measurements

The XCO2 time series of NDACC-type (2600 cm−1), NDACC-type (4800 cm−1), and TCCON XCO2 measurements between August 2018 and April 2022, together with their differences and correlations, are shown in Figure 9. The a priori substitution and smoothing correction were applied to NDACC retrievals (see Section 2.4.1). Since TCCON has been scaled to the WMO standard, we applied the correction to remove the systematic bias of NDACC retrievals, with values of 18.45 ppm for NDACC-type (2600 cm−1) and 7.07 ppm for NDACC-type (4800 cm−1). The seasonal variations of XCO2 derived from NDACC-type (2600 cm−1), NDACC-type (4800 cm−1), and TCCON have a similar pattern with a maximum in spring and a minimum in summer. There is a good correlation between NDACC and TCCON XCO2 measurements, and the R between NDACC-type (4800 cm−1) and TCCON of 0.84 is similar to that between NDACC-type (2600 cm−1) and TCCON with R of 0.82. The STD of the XCO2 difference is 2.88 ppm between TCCON and NDACC-type (2600 cm−1) and 2.32 ppm between TCCON and NDACC-type (4800 cm−1). The scatter of the NDACC-type (4800 cm−1) retrievals is less than that of the NDACC-type (2600 cm−1) retrievals.
In order to have a better insight into the seasonal variation of XCO2, the FTIR measurements are fitted with the following formula:
f t = α t + k = 0 2 a k cos 2 π k t + b k sin 2 π k t ,
where t represents time which in the form of the fractional year α and a0 are associated with linear changes; α represents the linear trend per year; the unit of α is ppm/year; and a0 represents an intercept beginning on 1 January 2000 [38,39,40]. The fitted curves are shown in Figure 10.
Figure 10 shows that there is a large distinction in the shape of the fitted curves between original NDACC measurements and TCCON and the correlation between them is relatively weak, with R values of 0.75 and 0.73 for NDACC-type (2600 cm−1) and NDACC-type (4800 cm−1), respectively. The amplitude of the XCO2 seasonal variation in NDACC retrievals with the fixed a priori profile from WACCM is lesser than that in NDACC retrievals using the same a priori profile as TCCON, especially for the NDACC-type (2600 cm−1) measurements. On the scale of seasons, the changes in the CO2 profile are mainly reflected in the shape, where the changes in the lower and middle troposphere dominate [10]. This demonstrates the difficulty of using the NDACC-type (2600 cm−1) retrieved XCO2 to capture the whole seasonal variation due to its low sensitivity (Figure 4a) [10,11].
Unlike NDACC-type (2600 cm−1) XCO2, the amplitudes of the XCO2 seasonal cycles from NDACC-type (4800 cm−1) before and after the prior substitution have no significant change. The CO2 absorbing line intensity near 4800 cm−1 is much stronger than that near 2600 cm−1 (Figure 3), which allows us to acquire more information in the lower troposphere. In general, the NDACC-type (4800 cm−1) CO2 retrievals capture the seasonal variation well and are less reliant on the choice of the a priori profile.
The smoothing correction aims to reduce the distinctions caused by different vertical sensitivities. Compared to the impact from different a priori profiles, the smoothing correction has relatively little effect on the results. The scatter between TCCON and NDACC-type (2600 cm−1) XCO2 decreases from 2.90 ppm before smoothing correction to ±2.88 ppm after the smoothing, while the scatter between TCCON and NDACC-type (4800 cm−1) XCO2 increases from 2.29 ppm before smoothing correction to 2.32 ppm after the smoothing. The difference in the annual growth rate of XCO2 before and after smoothing correction is within 0.02 ppm/year, which can be ignored.

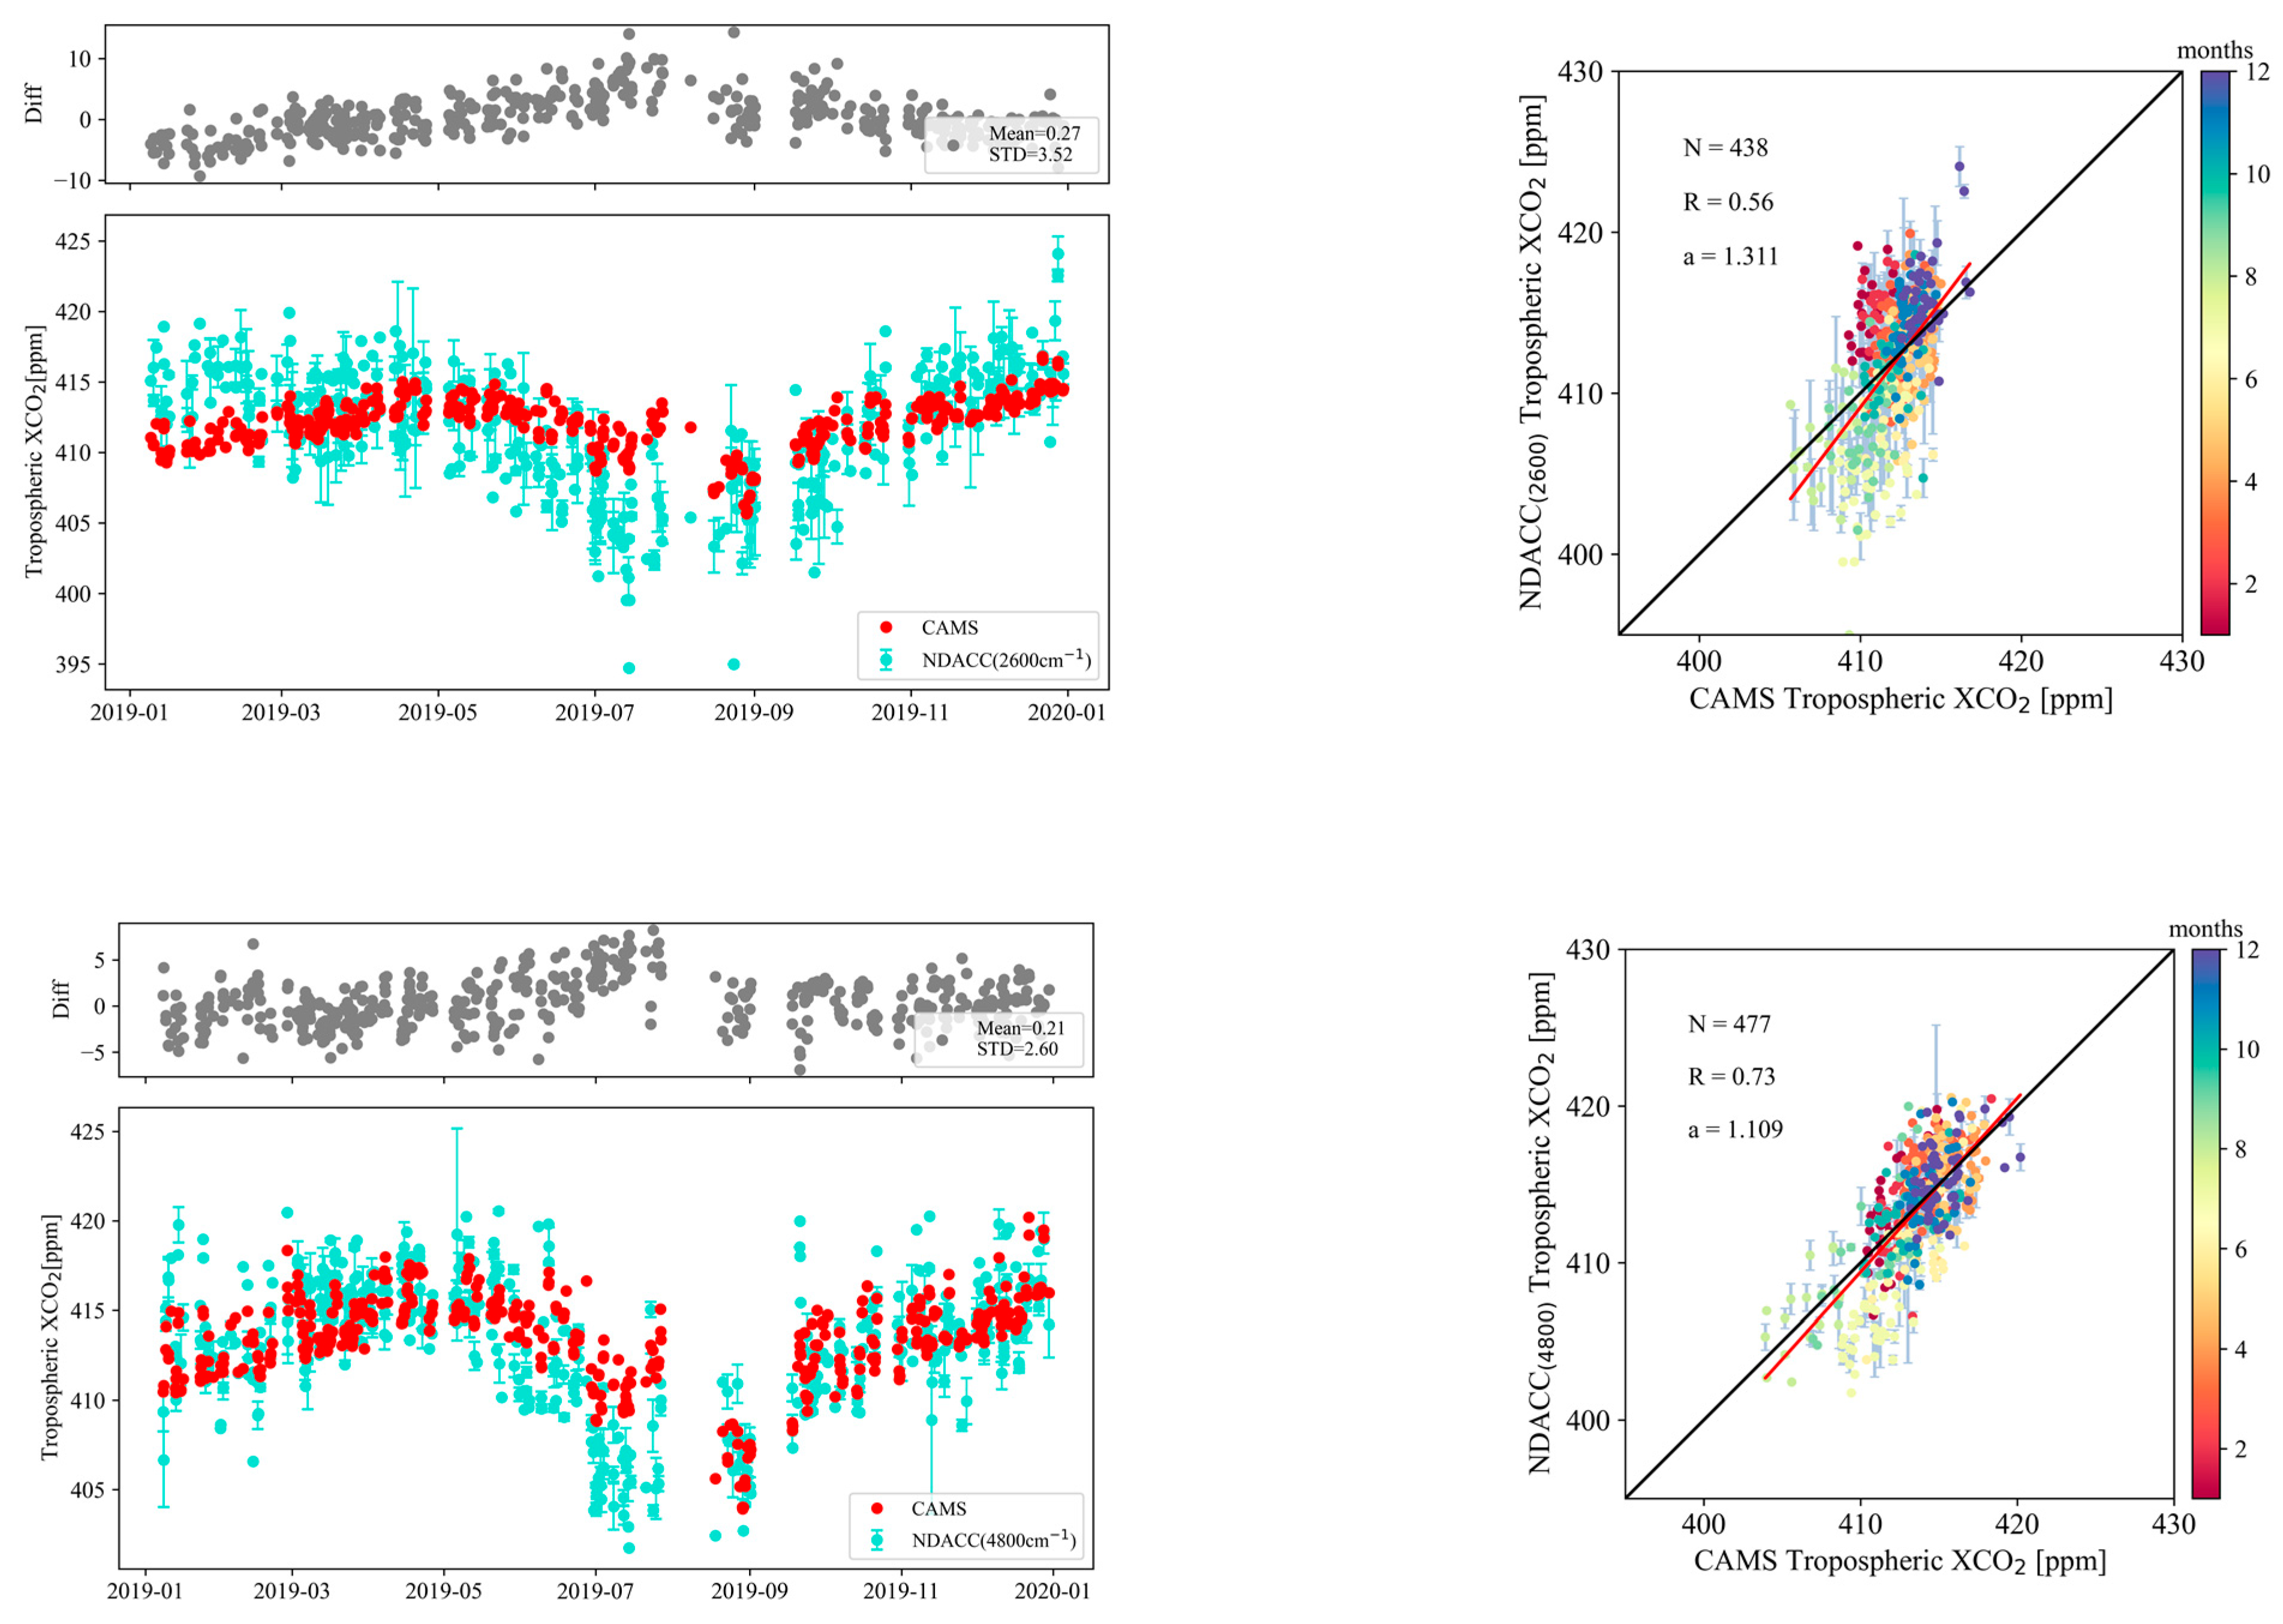
3.3. Comparison with CAMS Model

As the change of CO2 mainly occurs in the lower troposphere [10], the tropospheric CO2 partial column can better capture the signal of the emissions and sinks than the total column [24]. The time series of tropospheric XCO2 between February 2019 and February 2020 from NDACC retrievals and CAMS re-analysis products, together with their differences and correlations, are shown in Figure 11. To remove the systematic bias in NDACC retrievals, the corrections of 19.36 ppm for NDACC-type (2600 cm−1) and 5.46 ppm for NDACC-type (4800 cm−1) were applied using TCCON as a standard. The CAMS XCO2 was smoothed by NDACC AVK (see Section 2.4.2). Similarly to the CO2 total column, the time series of tropospheric XCO2 has a significant seasonal variation, with the maximum in spring and the minimum value in summer. The tropospheric XCO2 from the CAMS model is 0.27 ± 3.52 ppm lower than that from NDACC-type (2600 cm−1) retrievals, and the R is 0.56. The tropospheric XCO2 from CAMS is 0.21 ± 2.60 ppm higher than that from NDACC-type (4800 cm−1) retrievals, and the R is 0.73. It is indicated that the NDACC-type (4800 cm−1) retrievals have a better agreement with the CAMS model in the troposphere than the NDACC-type (2600 cm−1) retrievals (R = 0.56). This is not surprising, as the AVK of the NDACC-type (4800 cm−1) retrieval shows a good sensitivity in the troposphere. It can be found that the CAMS reanalysis data show an underestimation of the seasonal amplitude of tropospheric XCO2 compared to those from both NDACC retrievals. The incomplete spatial matching between the CAMS model (regional mean) and FTIR observation (one site), as well as the uncertainty of the CAMS model, may cause this difference [34].

4. Conclusions

By utilizing the solar absorption NDACC-type MIR spectra observed by the FTIR at Xianghe, the retrieval window and spectroscopy are optimized for CO2 retrieval. Two types of spectra with a central wavelength number near 2600 cm−1 (nh and hh) and one type near 4800 cm−1 (f7l) are investigated.
Concerning the two different types of spectra (nh and hh) near 2600 cm−1, we find that the phase, amplitude, and inter-annual growth trends of the retrieved XCO2 seasonal cycle variation are consistent between the two groups for the period between July 2018 and April 2022. Different spectroscopic databases (ATM16, ATM20, HITRAN2016, and HITRAN2020) can affect the results in the XCO2 retrieval, and the differences can be up to 1.65 ± 0.95 ppm in the retrieval of NDACC-type (2600 cm−1) and up to 7.96 ± 2.02 ppm in the retrieval of NDACC-type (4800 cm−1). The main reason for these systematic deviations is the differences in the parameter of γair and S in the spectroscopies of CO2. The HITRAN2020 is found to be superior to the other three databases for the NDACC retrieval of XCO2, since it provides the best fitting.
NDACC and TCCON CO2 retrievals exhibit a relatively consistent seasonal variation, reaching a maximum in April and a minimum in August. In addition, there are high correlations between TCCON and NDACC-type (2600 cm−1) with an R value of 0.82, and between TCCON and NDACC-type (4800 cm−1) with an R value of 0.84. For the NDACC-type (2600 cm−1) CO2 retrievals, the seasonal amplitude of XCO2 is underestimated because of its low AVK in the troposphere. Moreover, the a priori profiles have a strong influence on the XCO2 seasonal amplitude derived from NDACC-type (2600 cm−1) CO2 retrievals. For the NDACC-type (4800 cm−1) CO2 retrievals, the seasonal amplitude of XCO2 is close to the TCCON measurements, and the a priori profiles have a limited influence on the XCO2 seasonal variation. The NDACC-type (4800 cm−1) AVK shows good vertical sensitivity in both the troposphere and lower stratosphere. The CAMS model also indicates that the NDACC-type (4800 cm−1) retrievals can provide better information on the CO2 vertical profile than the NDACC-type (2600 cm−1) retrievals.
The retrieval strategy with HITRAN2020 near 4800 cm−1 offers potential for the better use of NDACC-type spectra in CO2 retrieval, and its results are considered to provide the best information on CO2 concentration among the retrieval strategies we have tested in this study.

Author Contributions

Conceptualization, J.W. and M.Z.; methodology, J.W.; software, J.W.; validation, J.W., M.Z., B.L., W.N., T.W. and P.W.; formal analysis, M.Z.; investigation, J.W.; resources, M.Z.; data curation, J.W.; writing—original draft preparation, J.W.; writing—review and editing, M.Z.; visualization, J.W.; supervision, M.Z. and P.W.; project administration, M.Z.; funding acquisition, M.Z. All authors have read and agreed to the published version of the manuscript.

Funding

This research is supported by the National key research and development program (2023YFB3907505).

Data Availability Statement

The TCCON XCO2 data is publicly available at https://data.caltech.edu/records/6ywxa-yk431 (accessed on 13 June 2023). The CAMS CO2 reanalysis data is publicly available at https://ads.atmosphere.copernicus.eu/cdsapp#!/dataset/cams-global-ghg-reanalysis-egg4?tab=form (accessed on 5 July 2023). The tropopause pressure gridded data from NCEP/NCAR reanalysis is publicly available at https://psl.noaa.gov/data/gridded/data.ncep.reanalysis.html#source (accessed on 5 July 2023).

Acknowledgments

The authors would like to thank the Xianghe stuff for operating the FTIR measurements, Chrisitan Hermans, Martine De Mazière (BIRA-IASB) for the guidance, and the NDACC-IRWG community for supporting the WACCM model as well as the SFIT4 retrieval.

Conflicts of Interest

The authors declare no conflicts of interest.

Appendix A

Table A1. Information of the position with the strongest line intensity in each retrieval micro-window from different spectroscopies.
SpectroscopyWavenumber
cm−1
Line Intensity
cm−1/(Molecule cm−2)
γairγselfUncertainty
Line Intensityγairγself
ATM182620.8353133.195 × 10−250.08280.1100[1%, 2%)[1%, 2%)[1%, 2%)
ATM202620.8353133.195 × 10−250.08280.1100[1%, 2%)[1%, 2%)[1%, 2%)
HITRAN20162620.8353133.195 × 10−250.08280.110[1%, 2%)[1%, 2%)[1%, 2%)
HITRAN20202620.8353183.195 × 10−250.08010.109[1%, 2%)[2%, 5%)[2%, 5%)
ATM182626.6298614.210 × 10−250.07450.1010[1%, 2%)[1%, 2%)[1%, 2%)
ATM202626.6298614.210 × 10−250.07450.1010[1%, 2%)[1%, 2%)[1%, 2%)
HITRAN20162626.6298614.210 × 10−250.07450.101[1%, 2%)[1%, 2%)[1%, 2%)
HITRAN20202626.6298694.210 × 10−250.07400.100[1%, 2%)[2%, 5%)[2%, 5%)
ATM182627.3501414.193 × 10−250.07370.1010[1%, 2%)[1%, 2%)[1%, 2%)
ATM202627.3501004.193 × 10−250.07370.1010[1%, 2%)[1%, 2%)[1%, 2%)
HITRAN20162627.3501414.193 × 10−250.07370.101[1%, 2%)[1%, 2%)[1%, 2%)
HITRAN20202627.3501494.193 × 10−250.07350.099[1%, 2%)[2%, 5%)[2%, 5%)
ATM182629.5056163.983 × 10−250.07170.0980[1%, 2%)[1%, 2%)[1%, 2%)
ATM202629.5056163.983 × 10−250.07170.0980[1%, 2%)[1%, 2%)[1%, 2%)
HITRAN20162629.5056163.983 × 10−250.07170.098[1%, 2%)[1%, 2%)[1%, 2%)
HITRAN20202629.5056273.983 × 10−250.07200.096[1%, 2%)[2%, 5%)[2%, 5%)
ATM184790.1257629.871 × 10−240.07220.0990[1%, 2%)[1%, 2%)[1%, 2%)
ATM204790.1257629.871 × 10−240.07220.0990[1%, 2%)[1%, 2%)[1%, 2%)
HITRAN20164790.1257629.871 × 10−240.07220.099[1%, 2%)[1%, 2%)[1%, 2%)
HITRAN20204790.1257559.960 × 10−240.07200.096[1%, 2%)[2%, 5%)[2%, 5%)
ATM184791.8925681.037 × 10−230.07350.1000[1%, 2%)[1%, 2%)[1%, 2%)
ATM204791.8925681.037 × 10−230.07350.1000[1%, 2%)[1%, 2%)[1%, 2%)
HITRAN20164791.8925681.037 × 10−230.07350.100[1%, 2%)[1%, 2%)[1%, 2%)
HITRAN20204791.8925601.048 × 10−230.07300.098[2%, 5%)[2%, 5%)[2%, 5%)
ATM184795.3692621.060 × 10−230.07690.1040[1%, 2%)[1%, 2%)[1%, 2%)
ATM204795.3692621.060 × 10−230.07690.1040[1%, 2%)[1%, 2%)[1%, 2%)
HITRAN20164795.3692621.060 × 10−230.07690.104[1%, 2%)[1%, 2%)[1%, 2%)
HITRAN20204795.3692481.074 × 10−230.07520.102[1%, 2%)[2%, 5%)[2%, 5%)
ATM184798.0643461.093 × 10−230.08000.1070[1%, 2%)[1%, 2%)[1%, 2%)
ATM204798.0643461.093 × 10−230.08000.1070[1%, 2%)[1%, 2%)[1%, 2%)
HITRAN20164798.0643461.093 × 10−230.08000.107[1%, 2%)[1%, 2%)[1%, 2%)
HITRAN20204798.0642941.093 × 10−230.07740.105[2%, 5%)[2%, 5%)[2%, 5%)

References

  1. Friedlingstein, P.; Jones, M.W.; O’Sullivan, M.; Andrew, R.M.; Bakker, D.C.E.; Hauck, J.; Le Quéré, C.; Peters, G.P.; Peters, W.; Pongratz, J.; et al. Global Carbon Budget 2021. Earth Syst. Sci. Data 2022, 14, 1917–2005. [Google Scholar] [CrossRef]
  2. Lan, X.; Tans, P.; Thoning, K.W. Trends in globally-averaged CO2 determined from NOAA Global Monitoring Laboratory measurements. Version 2023-04. Available online: https://gml.noaa.gov/ccgg/trends/global.html?doi=10.15138/9n0h-zh07 (accessed on 5 July 2023).
  3. IPCC. Climate Change 2022: Impacts, Adaptation, and Vulnerability. Contribution of Working Group II to the Sixth Assessment Report of the Intergovernmental Panel on Climate Change; Cambridge University Press: Cambridge, UK; New York, NY, USA, 2022; 3056p. [Google Scholar] [CrossRef]
  4. Schimel, D.; Stephens, B.B.; Fisher, J.B. Effect of increasing CO2 on the terrestrial carbon cycle. Proc. Natl. Acad. Sci. USA 2015, 112, 436–441. [Google Scholar] [CrossRef]
  5. Messerschmidt, J.; Parazoo, N.; Wunch, D.; Deutscher, N.M.; Roehl, C.; Warneke, T.; Wennberg, P.O. Evaluation of seasonal atmosphere–biosphere exchange estimations with TCCON measurements. Atmos. Chem. Phys. 2013, 13, 5103–5115. [Google Scholar] [CrossRef]
  6. Velazco, V.A.; Deutscher, N.M.; Morino, I.; Uchino, O.; Bukosa, B.; Ajiro, M.; Kamei, A.; Jones, N.B.; Paton-Walsh, C.; Griffith, D.W.T. Satellite and ground-based measurements of XCO2 in a remote semiarid region of Australia. Earth Syst. Sci. Data 2019, 11, 935–946. [Google Scholar] [CrossRef]
  7. Yang, D.; Boesch, H.; Liu, Y.; Somkuti, P.; Cai, Z.; Chen, X.; Di Noia, A.; Lin, C.; Lu, N.; Lyu, D.; et al. Toward high precision XCO2 retrievals from TanSat observations: Retrieval improvement and validation against TCCON measurements. J. Geophys. Res. 2020, 125, 032794. [Google Scholar] [CrossRef] [PubMed]
  8. Zhou, M.; Ni, Q.; Cai, Z.; Langerock, B.; Nan, W.; Yang, Y.; Che, K.; Yang, D.; Wang, T.; Liu, Y.; et al. CO2 in Beijing and Xianghe Observed by Ground-Based FTIR Column Measurements and Validation to OCO-2/3 Satellite Observations. Remote Sens. 2022, 14, 3769. [Google Scholar] [CrossRef]
  9. De Mazière, M.; Thompson, A.M.; Kurylo, M.J.; Wild, J.D.; Bernhard, G.; Blumenstock, T.; Braathen, G.O.; Hannigan, J.W.; Lambert, J.-C.; Leblanc, T.; et al. The Network for the Detection of Atmospheric Composition Change (NDACC): History, status and perspectives. Atmos. Chem. Phys. 2018, 18, 4935–4964. [Google Scholar] [CrossRef]
  10. Barthlott, S.; Schneider, M.; Hase, F.; Wiegele, A.; Christner, E.; González, Y.; Blumenstock, T.; Dohe, S.; García, O.E.; Sepúlveda, E.; et al. Using XCO2 retrievals for assessing the long-term consistency of NDACC/FTIR data sets. Atmos. Meas. Tech. 2015, 8, 1555–1573. [Google Scholar] [CrossRef]
  11. Buschmann, M.; Deutscher, N.M.; Sherlock, V.; Palm, M.; Warneke, T.; Notholt, J. Retrieval of xCO2 from ground-based mid-infrared (NDACC) solar absorption spectra and comparison to TCCON. Atmos. Meas. Tech. 2016, 9, 577–585. [Google Scholar] [CrossRef]
  12. Chiarella, R.; Buschmann, M.; Laughner, J.; Morino, I.; Notholt, J.; Petri, C.; Toon, G.; Velazco, V.A.; Warneke, T. A retrieval of XCO2 from ground-based mid-infrared NDACC solar absorption spectra and comparison to TCCON. Atmos. Meas. Tech. 2023, 16, 3987–4007. [Google Scholar] [CrossRef]
  13. Shan, C.; Wang, W.; Xie, Y.; Wu, P.; Xu, J.; Zeng, X.; Zha, L.; Zhu, Q.; Sun, Y.; Hu, Q.; et al. Observations of atmospheric CO2 and CO based on in-situ and ground-based remote sensing measurements at Hefei site, China. Sci. Total Environ. 2022, 851, 158188. [Google Scholar] [CrossRef] [PubMed]
  14. Yang, Y.; Zhou, M.; Wang, T.; Yao, B.; Han, P.; Ji, D.; Zhou, W.; Sun, Y.; Wang, G.; Wang, P. Spatial and temporal variations of CO2 mole fractions observed at Beijing, Xianghe, and Xinglong in North China. Atmos. Chem. Phys. 2021, 21, 11741–11757. [Google Scholar] [CrossRef]
  15. Yang, Y.; Zhou, M.; Langerock, B.; Sha, M.K.; Hermans, C.; Wang, T.; Ji, D.; Vigouroux, C.; Kumps, N.; Wang, G.; et al. New ground-based Fourier-transform near-infrared solar absorption measurements of XCO2, XCH4 and XCO at Xianghe, China. Earth Syst. Sci. Data 2020, 12, 1679–1696. [Google Scholar] [CrossRef]
  16. Ji, D.; Zhou, M.; Wang, P.; Yang, Y.; Wang, T.; Sun, X.; Hermans, C.; Yao, B.; Wang, G. Deriving temporal and vertical distributions of methane in Xianghe using ground-based Fourier transform infrared and gas-analyzer measurements. Adv. Atmos. Sci. 2020, 37, 597–607. [Google Scholar] [CrossRef]
  17. Zhou, M.; Langerock, B.; Vigouroux, C.; Dils, B.; Hermans, C.; Kumps, N.; Nan, W.; Metzger, J.-M.; Mahieu, E.; Wang, T.; et al. Tropospheric and stratospheric NO retrieved from ground-based Fourier-transform infrared (FTIR) measurements. Atmos. Meas. Tech. 2021, 14, 6233–6247. [Google Scholar] [CrossRef]
  18. Blumenstock, T.; Hase, F.; Keens, A.; Czurlok, D.; Colebatch, O.; Garcia, O.; Griffith, D.W.T.; Grutter, M.; Hannigan, J.W.; Heikkinen, P.; et al. Characterization and potential for reducing optical resonances in Fourier transform infrared spectrometers of the Network for the Detection of Atmospheric Composition Change (NDACC). Atmos. Meas. Tech. 2021, 14, 1239–1252. [Google Scholar] [CrossRef]
  19. Gordon, I.E.; Rothman, L.S.; Hargreaves, R.J.; Hashemi, R.; Karlovets, E.V.; Skinner, F.M.; Conway, E.K.; Hill, C.; Kochanov, R.V.; Tan, Y.; et al. The HITRAN2020 molecular spectroscopic database. J. Quant. Spectrosc. Radiat. Transf. 2022, 277, 107949. [Google Scholar] [CrossRef]
  20. Toth, R.A.; Brown, L.R.; Miller, C.E.; Devi, V.M.; Benner, D.C. Spectroscopic database of CO2 line parameters: 4300–7000 cm−1. J. Quant. Spectrosc. Radiat. Transf. 2008, 109, 906–921. [Google Scholar] [CrossRef]
  21. Rodgers, C.D. Inverse methods for atmospheric sounding—Theory and Practice, Series on Atmospheric Oceanic and Planetary Physics; World Scientific: Singapore, 2000; Volume 2, p. 256. [Google Scholar] [CrossRef]
  22. Tihonov, A.N. Solution of incorrectly formulated problems and the regularization method. Soviet Math. Dokl. 1963, 4, 1035–1038. [Google Scholar]
  23. Zhou, M.; Langerock, B.; Sha, M.K.; Kumps, N.; Hermans, C.; Petri, C.; Warneke, T.; Chen, H.; Metzger, J.-M.; Kivi, R.; et al. Retrieval of atmospheric CH4 vertical information from ground-based FTS near-infrared spectra. Atmos. Meas. Tech. 2019, 12, 6125–6141. [Google Scholar] [CrossRef]
  24. Shan, C.; Wang, W.; Liu, C.; Guo, Y.; Xie, Y.; Sun, Y.; Hu, Q.; Zhang, H.; Yin, H.; Jones, N. Retrieval of vertical profiles and tropospheric CO2 columns based on high-resolution FTIR over Hefei, China. Opt. Express 2021, 29, 4958–4977. [Google Scholar] [CrossRef] [PubMed]
  25. Buschmann, M.; Deutscher, N.M.; Palm, M.; Warneke, T.; Weinzierl, C.; Notholt, J. The arctic seasonal cycle of total column CO2 and CH4 from ground-based solar and lunar FTIR absorption spectrometry. Atmos. Meas. Tech. 2017, 10, 2397–2411. [Google Scholar] [CrossRef]
  26. Wunch, D.; Toon, G.C.; Blavier, J.-F.L.; Washenfelder, R.A.; Notholt, J.; Connor, B.J.; Griffith, D.W.T.; Sherlock, V.; Wennberg, P.O. The Total Carbon Column Observing Network. Phil Trans. R. Soc. A 2011, 369, 2087–2112. [Google Scholar] [CrossRef]
  27. Sun, Y.; Liu, C.; Palm, M.; Vigouroux, C.; Notholt, J.; Hu, Q.; Jones, N.; Wang, W.; Su, W.; Zhang, W.; et al. Ozone seasonal evolution and photochemical production regime in the polluted troposphere in eastern China derived from high-resolution Fourier transform spectrometry (FTS) observations. Atmos. Chem. Phys. 2018, 18, 14569–14583. [Google Scholar] [CrossRef]
  28. Zhou, M.; Wang, P.; Kumps, N.; Hermans, C.; Nan, W. TCCON Data from Xianghe, China, Release GGG2020.R0 [Data Set]. CaltechDATA. 2022. Available online: https://data.caltech.edu/records/6ywxa-yk431 (accessed on 13 June 2023).
  29. Laughner, J.L.; Toon, G.C.; Mendonca, J.; Petri, C.; Roche, S.; Wunch, D.; Blavier, J.-F.; Griffith, D.W.T.; Heikkinen, P.; Keeling, R.F.; et al. The Total Carbon Column Observing Network’s GGG2020 Data Version. Earth Syst. Sci. Data Discuss. 2023; in preprint. [Google Scholar] [CrossRef]
  30. Wunch, D.; Wennberg, P.O.; Toon, G.C.; Connor, B.J.; Fisher, B.; Osterman, G.B.; Frankenberg, C.; Mandrake, L.; O’Dell, C.; Ahonen, P.; et al. A method for evaluating bias in global measurements of CO2 total columns from space. Atmos. Chem. Phys. 2011, 11, 12317–12337. [Google Scholar] [CrossRef]
  31. Deutscher, N.M.; Griffith, D.W.T.; Bryant, G.W.; Wennberg, P.O.; Toon, G.C.; Washenfelder, R.A.; Keppel-Aleks, G.; Wunch, D.; Yavin, Y.; Allen, N.T.; et al. Total column CO2 measurements at Darwin, Australia—Site description and calibration against in situ aircraft profiles. Atmos. Meas. Tech. 2010, 3, 947–958. [Google Scholar] [CrossRef]
  32. Rodgers, C.D.; Connor, B.J. Intercomparison of remote sounding instruments. J. Geophys. Res. Atmos. 2003, 108, 4116. [Google Scholar] [CrossRef]
  33. Zhou, M.; Wang, P.; Langerock, B.; Vigouroux, C.; Hermans, C.; Kumps, N.; Wang, T.; Yang, Y.; Ji, D.; Ran, L.; et al. Ground-based Fourier transform infrared (FTIR) O3 retrievals from the 3040 cm−1 spectral range at Xianghe, China. Atmos. Meas. Tech. 2020, 13, 5379–5394. [Google Scholar] [CrossRef]
  34. Agustí-Panareda, A.; Barré, J.; Massart, S.; Inness, A.; Aben, I.; Ades, M.; Baier, B.C.; Balsamo, G.; Borsdorff, T.; Bousserez, N.; et al. Technical note: The CAMS greenhouse gas reanalysis from 2003 to 2020. Atmos. Chem. Phys. 2023, 23, 3829–3859. [Google Scholar] [CrossRef]
  35. Zhou, M.; Langerock, B.; Vigouroux, C.; Sha, M.K.; Ramonet, M.; Delmotte, M.; Mahieu, E.; Bader, W.; Hermans, C.; Kumps, N.; et al. Atmospheric CO and CH4 time series and seasonal variations on Reunion Island from ground-based in situ and FTIR (NDACC and TCCON) measurements. Atmos. Chem. Phys. 2018, 18, 13881–13901. [Google Scholar] [CrossRef]
  36. Virolainen, Y.A. Methodical aspects of the determination of carbon dioxide in atmosphere using FTIR spectroscopy. J. Appl. Spectrosc. 2018, 85, 462–469. [Google Scholar] [CrossRef]
  37. Chesnokova, T.Y.; Makarova, M.V.; Chentsov, A.V.; Kostsov, V.S.; Poberovskii, A.V.; Zakharov, V.I.; Rokotyan, N.V. Estimation of the impact of differences in the CH4 absorption line parameters on the accuracy of methane atmospheric total column retrievals from ground-based FTIR spectra. J. Quant. Spectrosc. Radiat. Transf. 2020, 254, 107187. [Google Scholar] [CrossRef]
  38. Baylon, J.L.; Stremme, W.; Grutter, M.; Hase, F.; Blumenstock, T. Background CO2 levels and error analysis from ground-based solar absorption IR measurements in central Mexico. Atmos. Meas. Tech. 2017, 10, 2425–2434. [Google Scholar] [CrossRef]
  39. García, O.E.; Schneider, M.; Sepúlveda, E.; Hase, F.; Blumenstock, T.; Cuevas, E.; Ramos, R.; Gross, J.; Barthlott, S.; Röhling, A.N.; et al. Twenty years of ground-based NDACC FTIR spectrometry at Izaña Observatory—Overview and long-term comparison to other techniques. Atmos. Chem. Phys. 2021, 21, 15519–15554. [Google Scholar] [CrossRef]
  40. Wunch, D.; Wennberg, P.O.; Messerschmidt, J.; Parazoo, N.C.; Toon, G.C.; Deutscher, N.M.; Keppel-Aleks, G.; Roehl, C.M.; Randerson, J.T.; Warneke, T.; et al. The covariation of Northern Hemisphere summertime CO2 with surface temperature in boreal regions. Atmos. Chem. Phys. 2013, 13, 9447–9459. [Google Scholar] [CrossRef]
Figure 1. 3 types of typical spectra obtained with optical filters on 6 August 2021 (nh: filter No. 4, hh: filter No. 3, f7l: filter No. 1 [18]).
Remotesensing 16 00900 g001
Figure 2. The a priori and retrieved CO2 vertical profiles on 3 July 2019 for NDACC-type (2600 cm−1) (a) and NDACC-type (4800 cm−1) (b) retrievals with different α values.
Remotesensing 16 00900 g002
Figure 3. The spectral micro-windows used for the retrieval of CO2 in 2600 cm−1 ((a); 16 April 2019, 01:57 UTC, SZA: 48.67°) and 4800 cm−1 ((b); 16 April 2019 01:26 UTC, SZA: 43.35°) respectively. The spectra are fitted with HITRAN2020.
Remotesensing 16 00900 g003
Figure 4. CO2 total column averaging kernels from the NDACC-type (2600 cm−1) (a), NDACC-type (4800 cm−1) (b) and TCCON (c) retrievals.
Remotesensing 16 00900 g004
Figure 5. Time series of monthly mean XCO2 derived from different spectroscopic databases (HITRAN2016, HITRAN2020, and ATM20) with hh type spectra (top), nh type spectra (middle), and the absolute differences in retrieved XCO2 between hh and nh (hh-nh) (bottom).
Remotesensing 16 00900 g005
Figure 6. Time series of monthly mean retrieved XCO2 from f7l type spectra with HITRAN2016, ATM18, and HITRAN2020, respectively.
Remotesensing 16 00900 g006
Figure 7. The correlations (left) and the time series of differences from August 2018 to April 2022 (right) between the retrieved XCO2 using different spectroscopies (ATM18; HITRAN2020_ γself; HITRAN2020_ γair; and HITRAN2020_ S) and unchanged HITRAN2020 in 2600 cm−1 (upper) and 4800 cm−1 (bottom) bands. Note that the line intensity (S) at the corresponding positions in ATM18 and HITRAN2020 are the same in the 2600 cm−1 band so that only the parameters γair (blue) and γself (green) are shown here. “r” is the correlation coefficient between the retrieved XCO2 using unchanged HITRAN2020 and spectroscopy shown in subscript.
Remotesensing 16 00900 g007
Figure 8. The correlations between retrieved XCO2 using HITRAN2020 after changing γair and ATM18 in 2600 cm−1 (a) and 4800 cm−1 (b). The correlation dots are colored with their measurement months. The red dashed line is the linear regression curve. R is the correlation coefficient.
Remotesensing 16 00900 g008
Figure 9. XCO2 time series from the NDACC-type (2600 cm−1), NDACC-type (4800 cm−1), and TCCON retrievals cover the period August 2018 to April 2022, together with the absolute difference (TCCON–NDACC) and the corresponding correlations. The red dashed line is the linear regression curve. N is the correspondent number of data pairs, R is the correlation coefficient, and a is the slope of the fitted line.
Remotesensing 16 00900 g009
Figure 10. The fitting curve of XCO2 time series from August 2018 to April 2022. XCO2 from TCCON retrievals are used as the reference.
Remotesensing 16 00900 g010
Figure 11. The time series of the co-located 3-h average of tropospheric XCO2 between CAMS and NDACC-type (2600 cm−1) (top) and NDACC-type (4800 cm−1) (bottom), together with their absolute differences (CAMS − NDACC) and their correlations. The red line is the linear regression curve. N is the correspondent number of data pairs, R is the correlation coefficient, and a is the slope of the fitted line.
Remotesensing 16 00900 g011
Table 1. The parameters setting of CO2 retrieval from 3 NDACC-type spectra (nh, hh and f7l).
Spectral Typenh, hhf7l
Retrieval windows (cm−1)2620.55–2621.104789.80–4790.50
2626.40–2626.854791.70–4792.10
2627.10–2627.604795.10–4795.525
2629.275–2629.9504797.8–4798.25
Interfering gasesCH4, H2O, HDO, O3H2O, HDO, CH4, N2O
RegularizationTikhonov (α = 1500)Tikhonov (α = 2500)
T, P and H2O profilesNCEP
A priori profiles of retrieved speciesWACCM v7
SNR400250
Table 2. The mean and standard deviation of XCO2, RMSE and DOF from NDACC-type (2600 cm−1) and NDACC-type (4800 cm−1) retrievals on 3 July 2019 with different α values.
nhf7l
α500150025006000500150025006000
XCO2 (ppm)430.64 ± 2.05429.84 ± 1.18430.15 ± 0.78430.89 ± 0.88403.01 ± 2.47403.66 ± 1.90403.63 ± 1.95403.58 ± 1.72
RMSE (%)0.095 ± 0.0180.092 ± 0.0200.092 ± 0.0200.093 ± 0.0200.144 ± 0.1250.112 ± 0.0530.092 ± 0.0170.095 ± 0.016
DOF2.27 ± 0.191.89 ± 0.161.72 ± 0.161.45 ± 0.133.20 ± 0.162.76 ± 0.112.55 ± 0.112.18 ± 0.10
Table 3. The retrieved mean XCO2, RMSE, and DOF from NDACC-type spectra at Xianghe with different spectroscopic databases for the period between August 2018 and April 2022. The number of nh, hh, and f7l spectra is 2608, 2443, and 2087, separately.
Spectroscopic DatabaseXCO2 (ppm)RMSE (%)DOF
nhhhf7lnhhhf7lnhhhf7l
ATM18436.58436.38416.920.1250.1430.1541.971.932.60
ATM20436.60436.40416.920.1250.1430.1541.971.932.60
HITRAN2016436.58436.38414.870.1250.1430.1811.971.932.63
HITRAN2020435.07434.75408.970.1240.1420.1291.971.942.60
Disclaimer/Publisher’s Note: The statements, opinions and data contained in all publications are solely those of the individual author(s) and contributor(s) and not of MDPI and/or the editor(s). MDPI and/or the editor(s) disclaim responsibility for any injury to people or property resulting from any ideas, methods, instructions or products referred to in the content.

