


Sea Level Rise, Land Subsidence, and Flood Disaster Vulnerability Assessment: A Case Study in Medan City, Indonesia
 ,
,
Abstract
1. Introduction
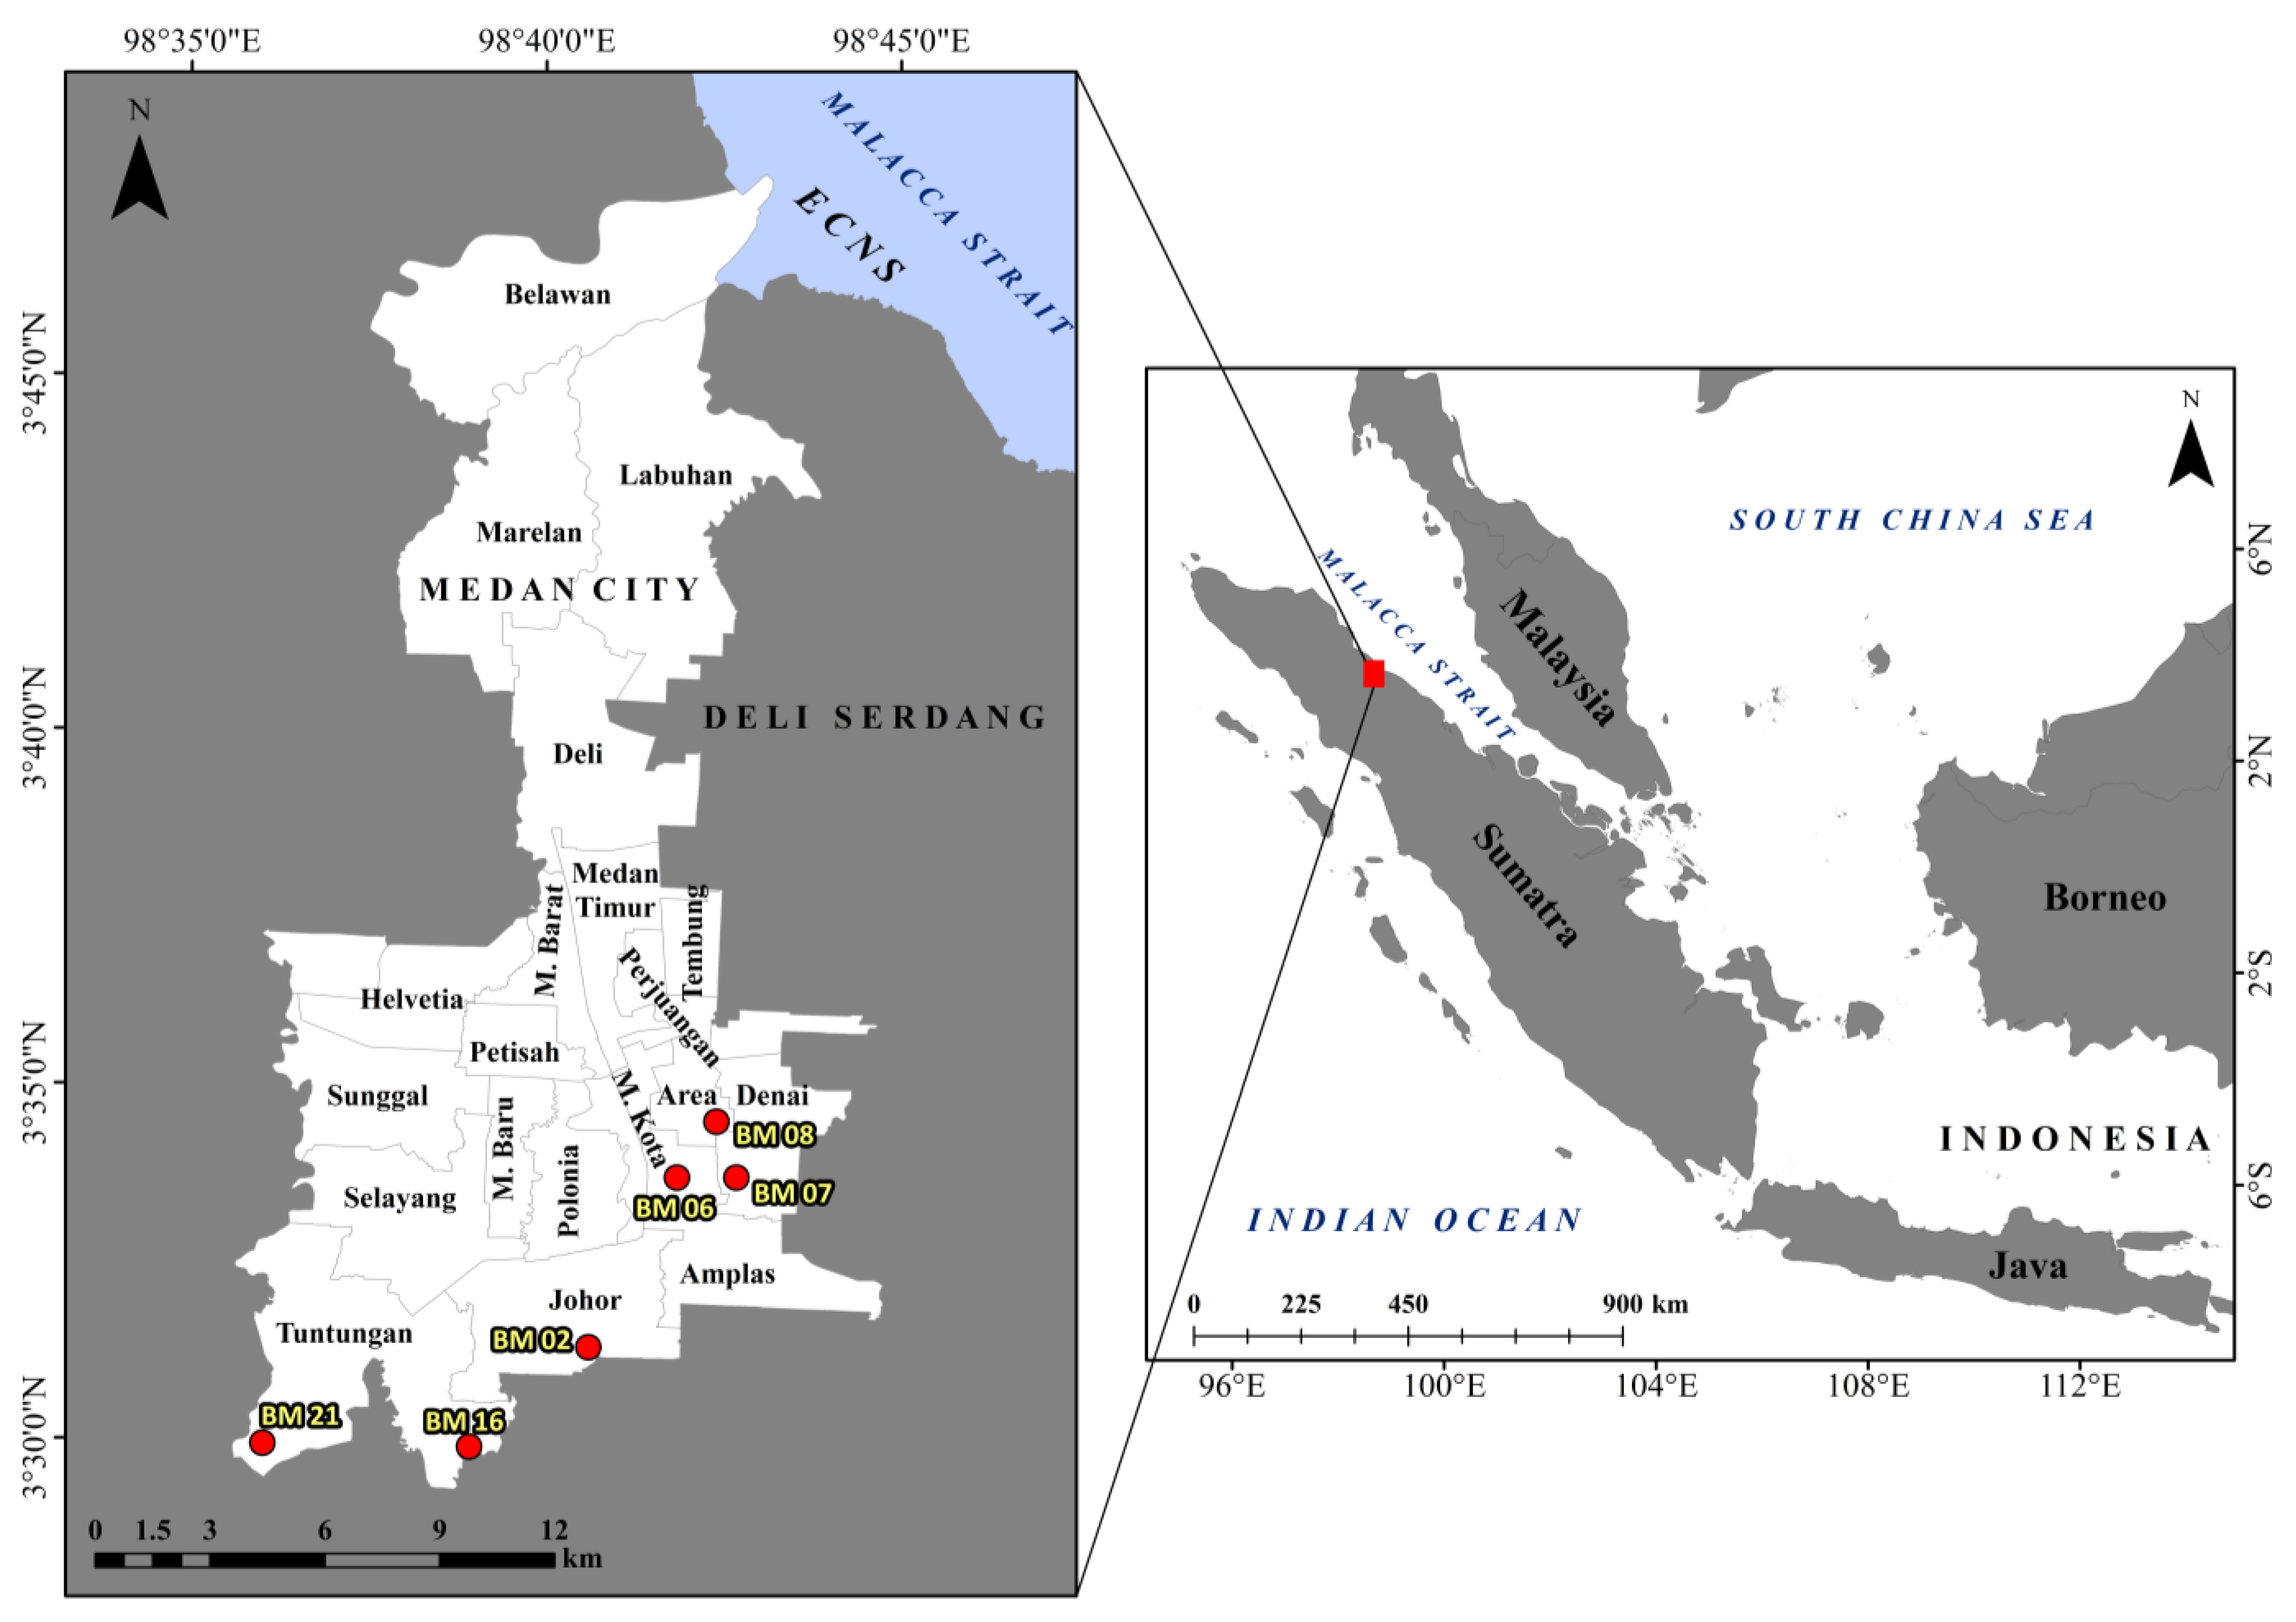
Study Site
2. Materials and Methods
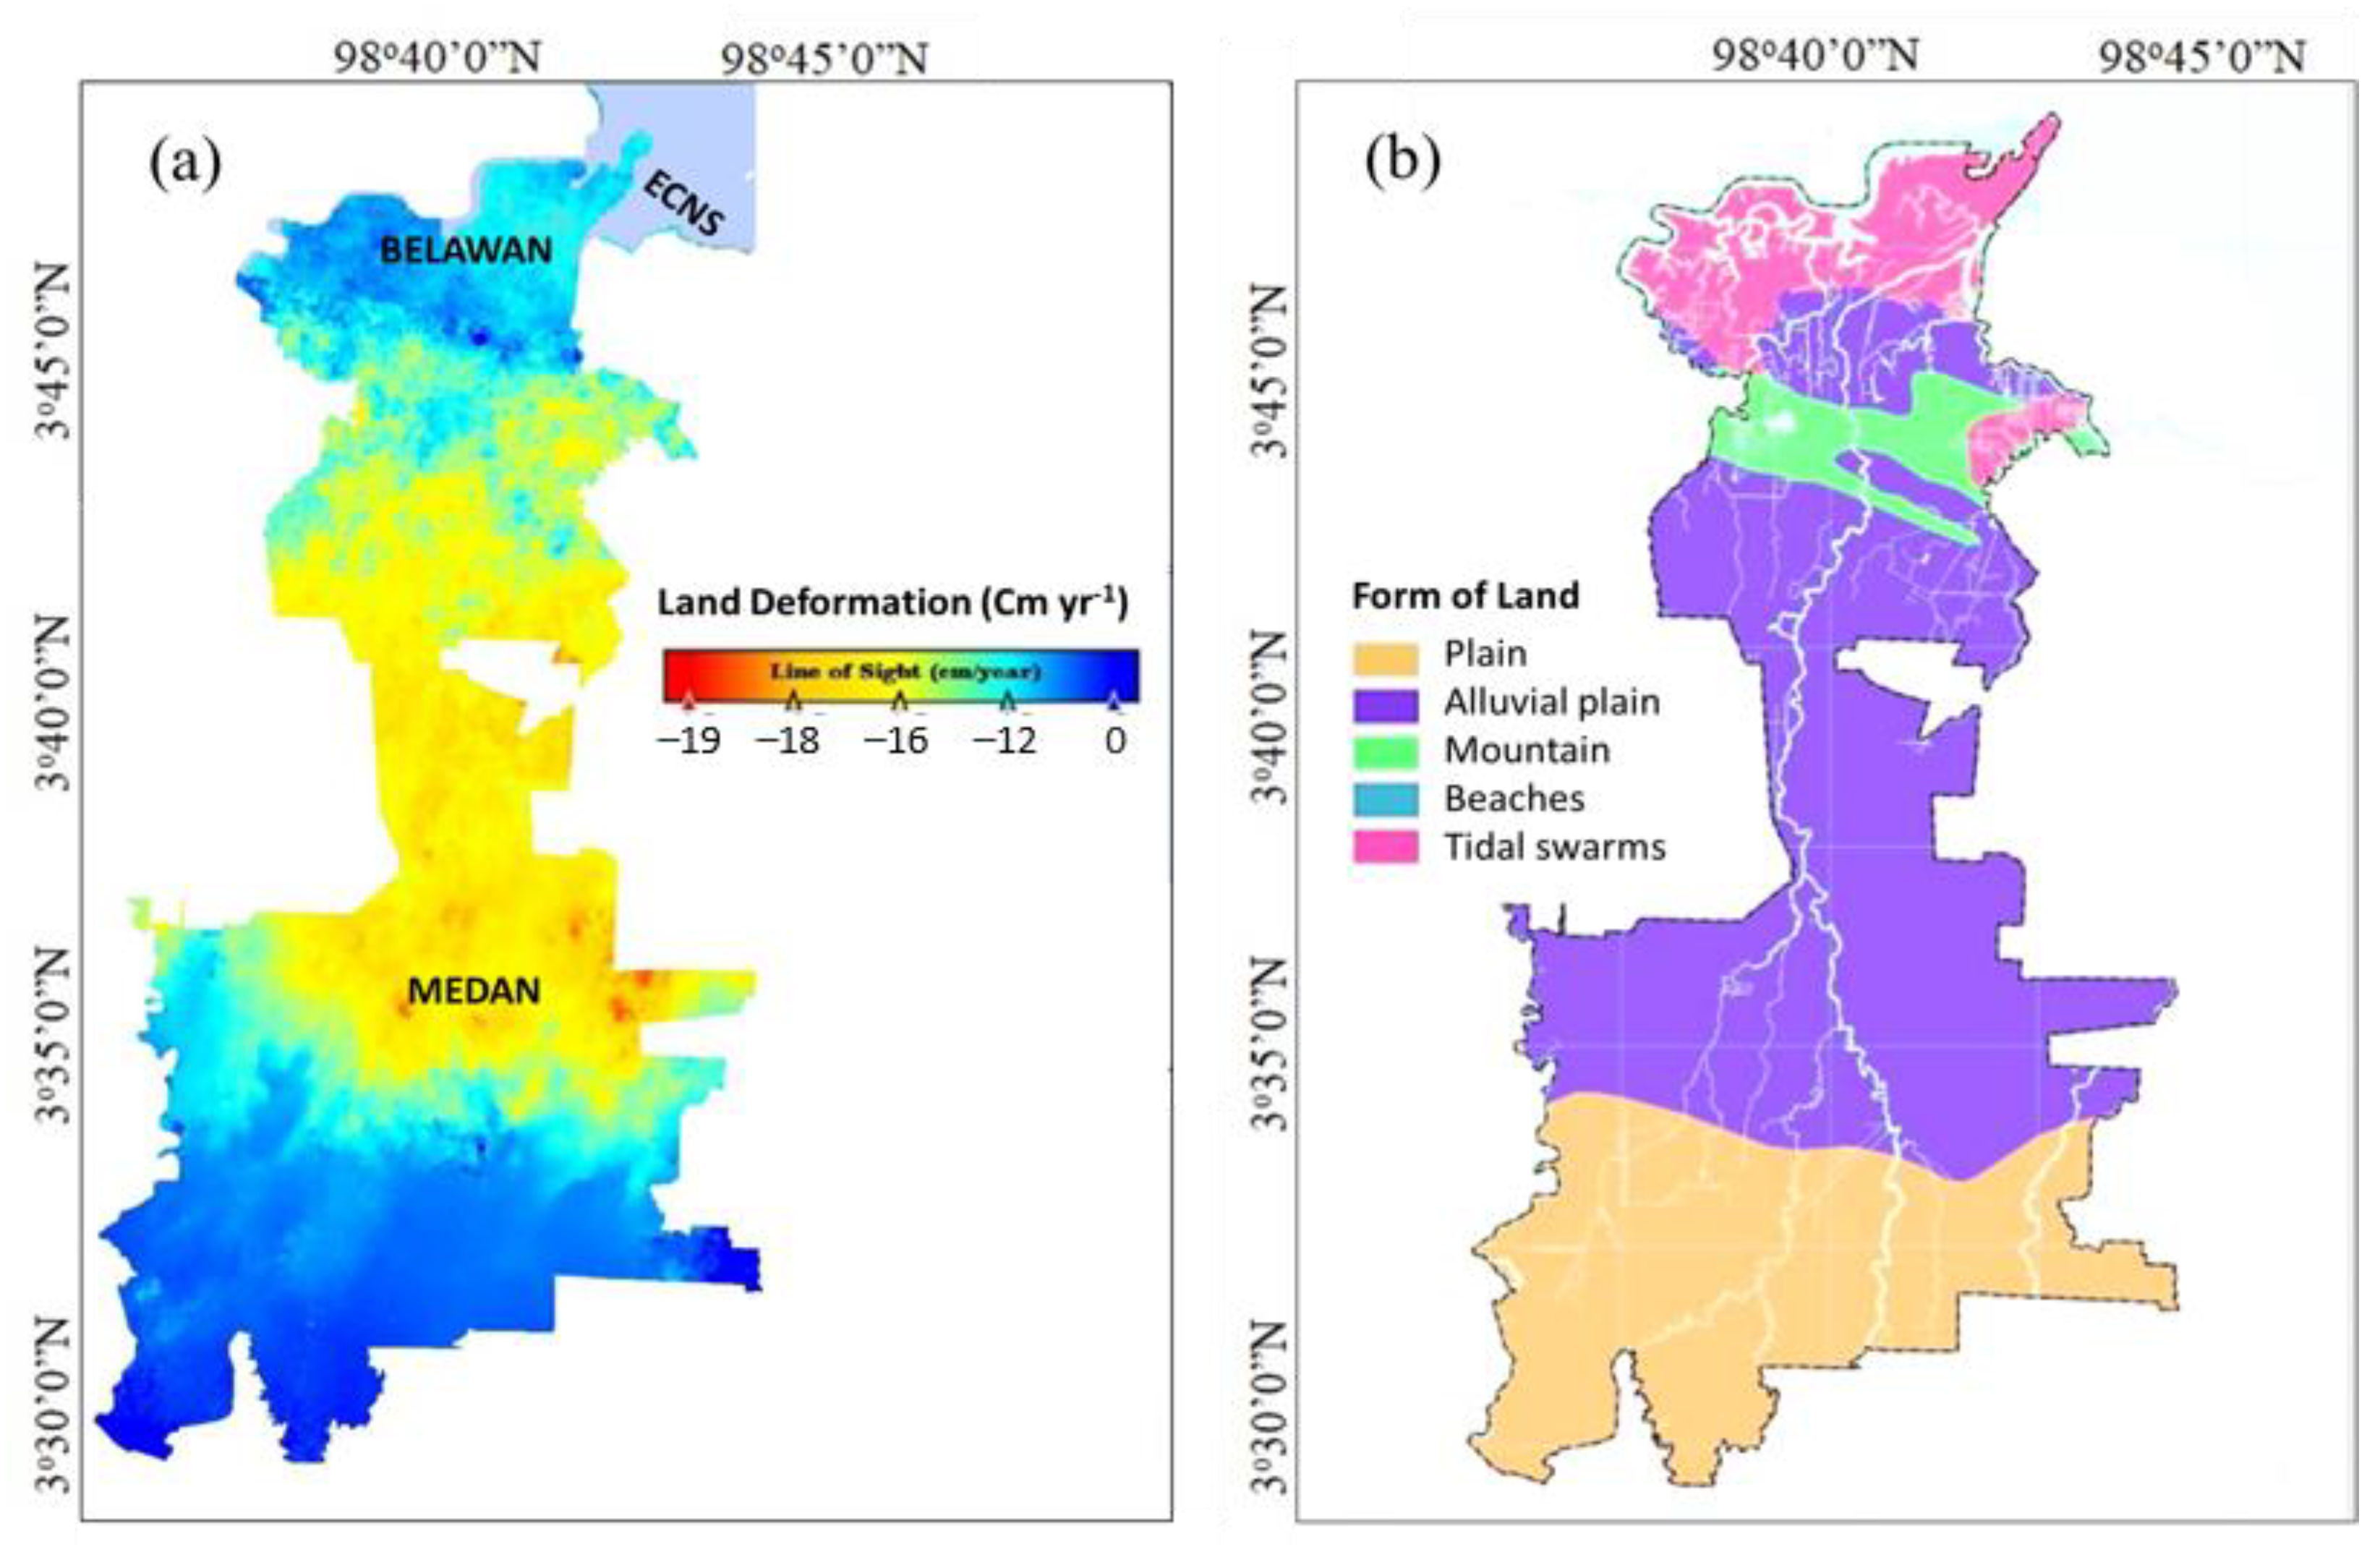
2.1. Satellite-Derived Land Deformation
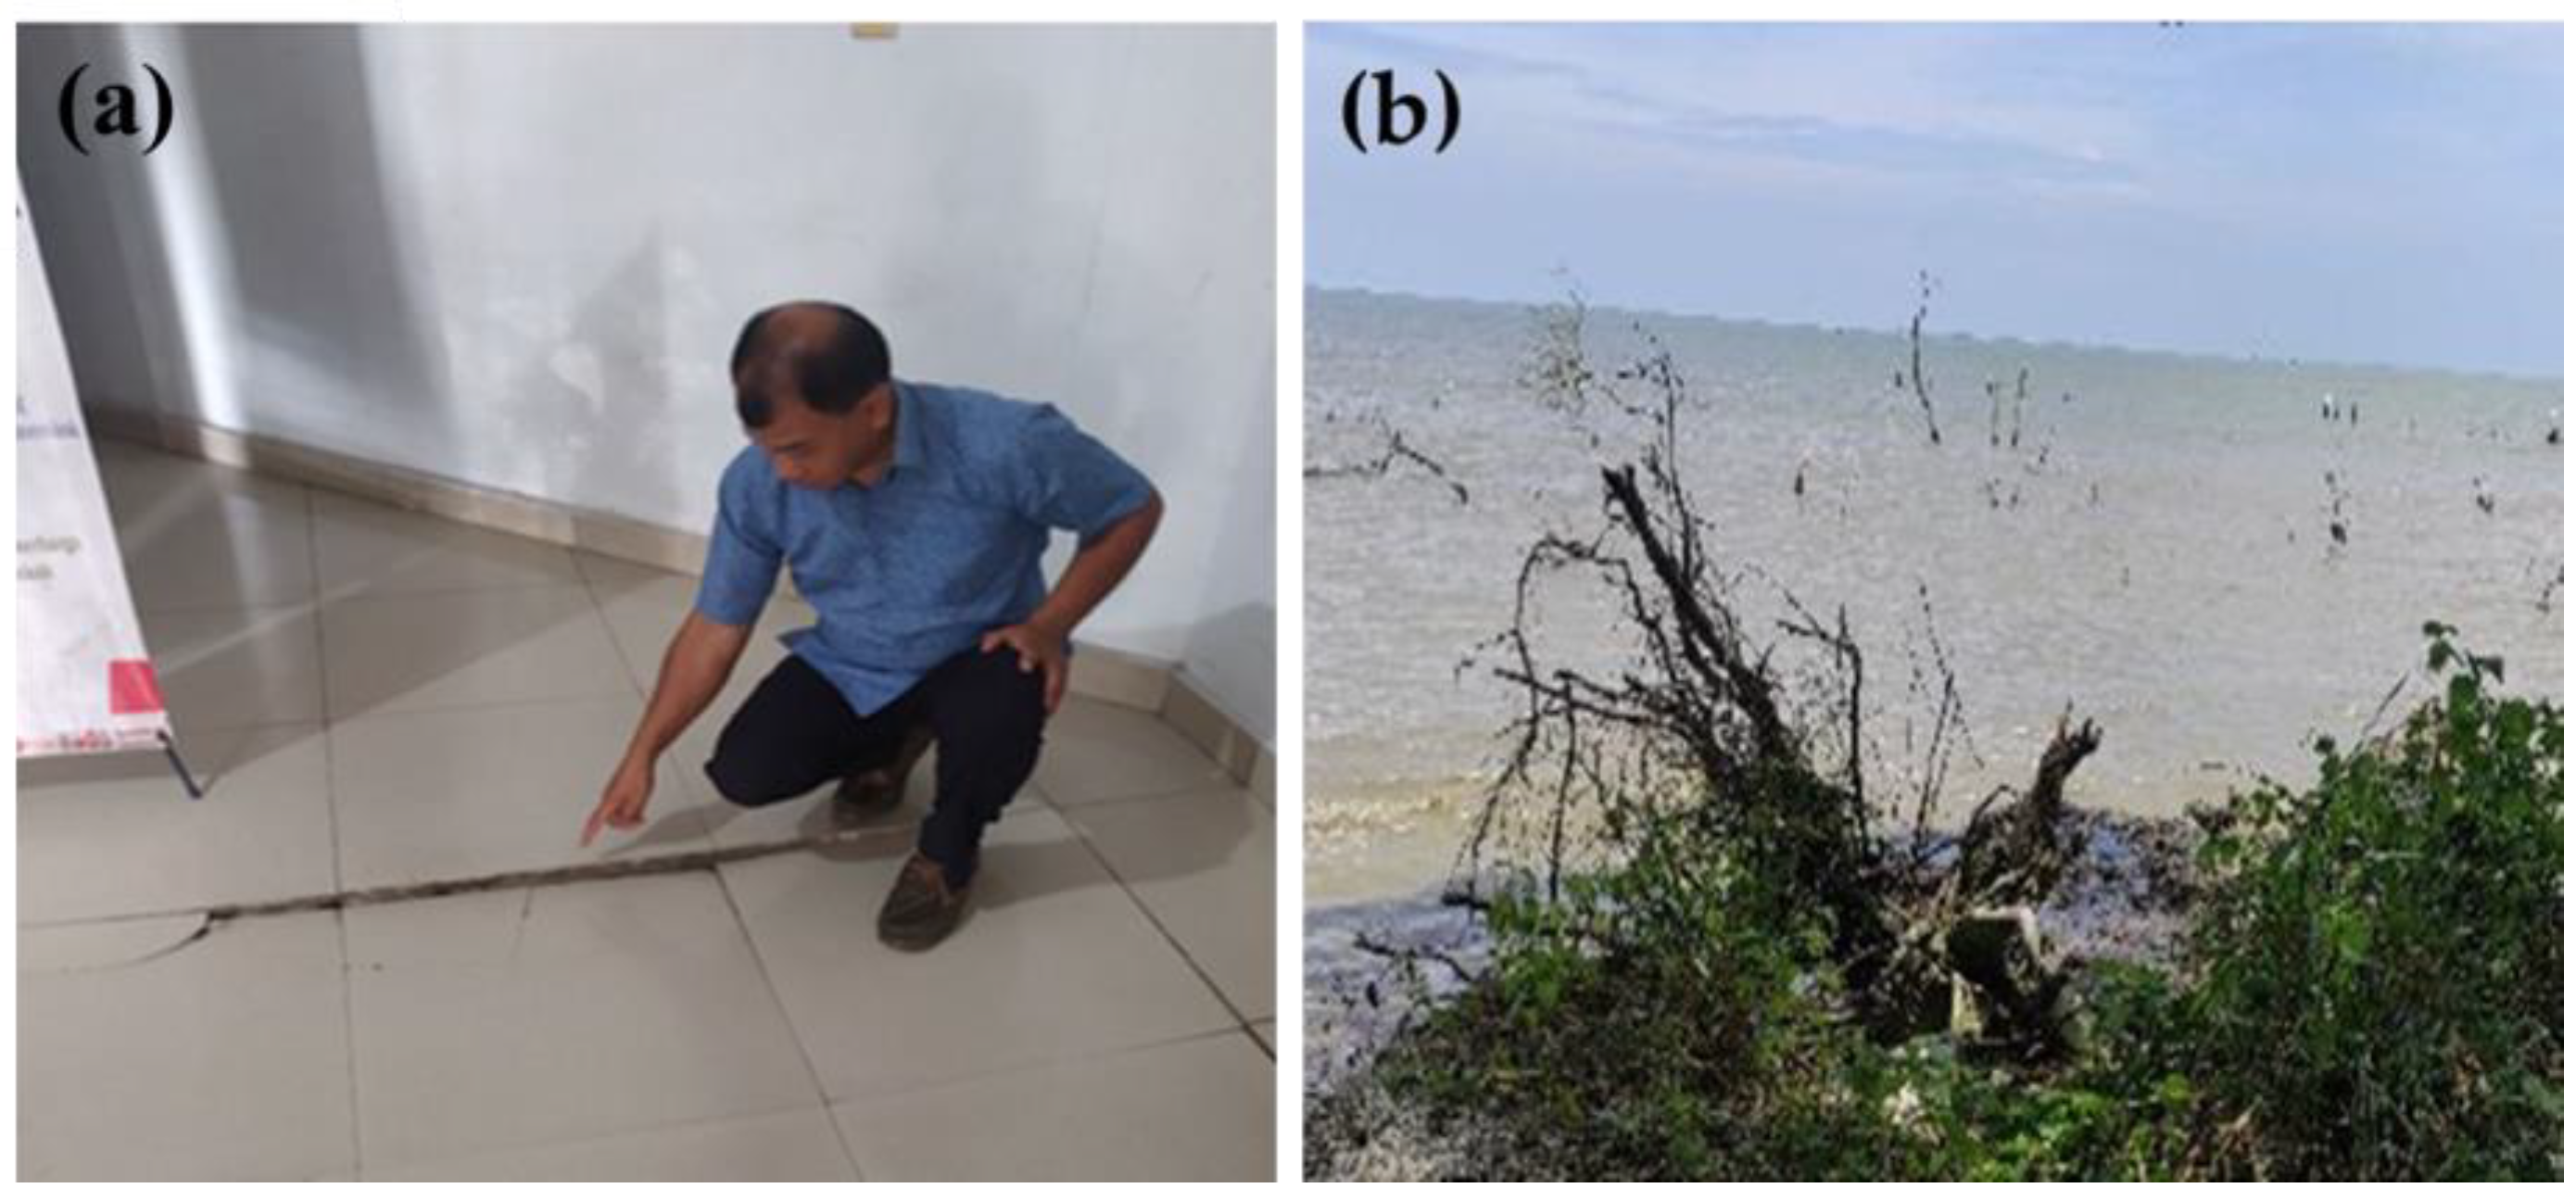
2.2. In Situ Land Deformation Measurement
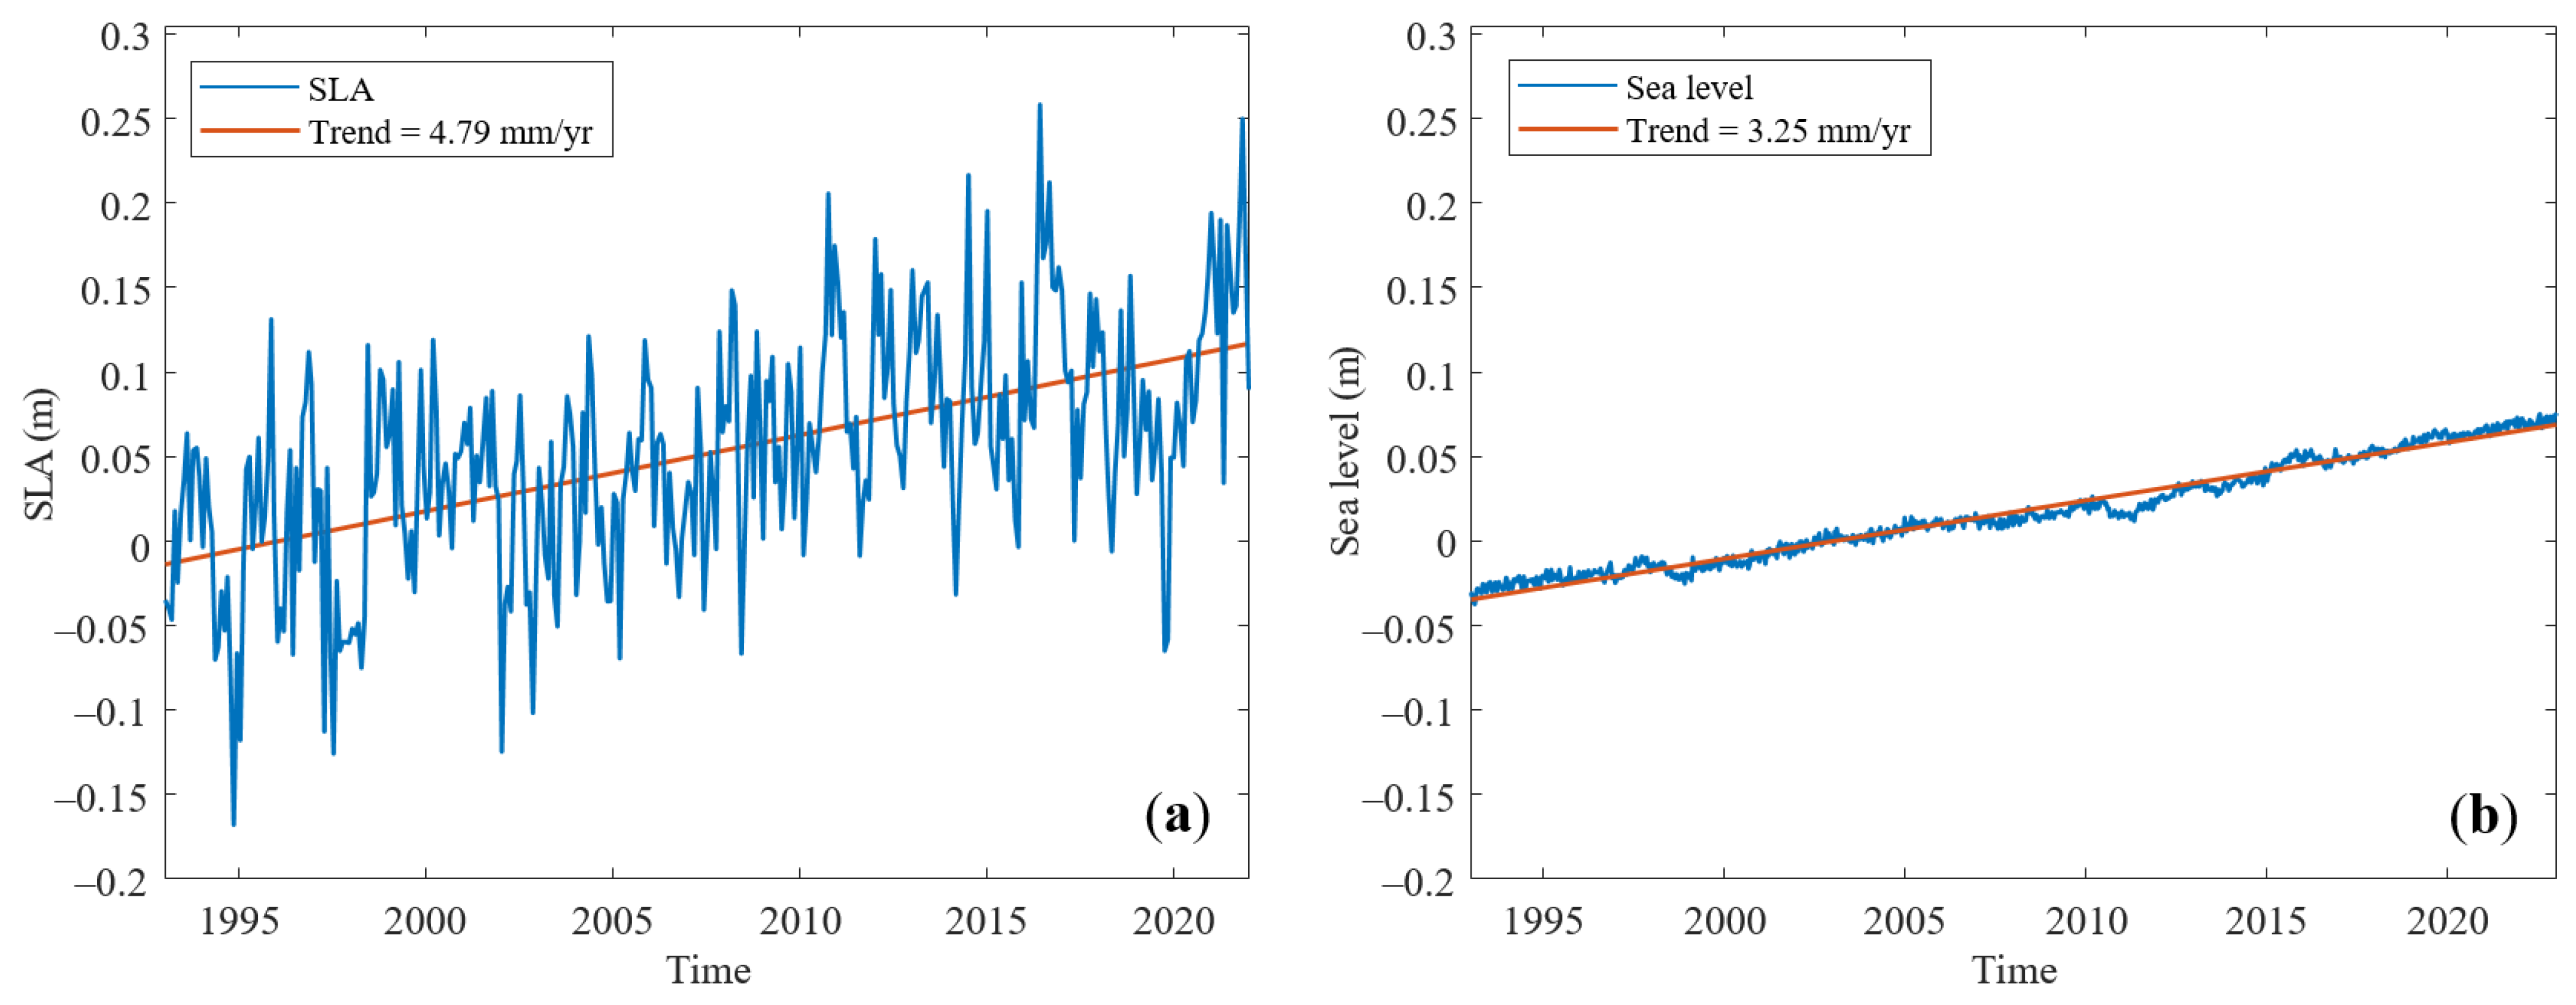
2.3. Sea Level Rise Trends
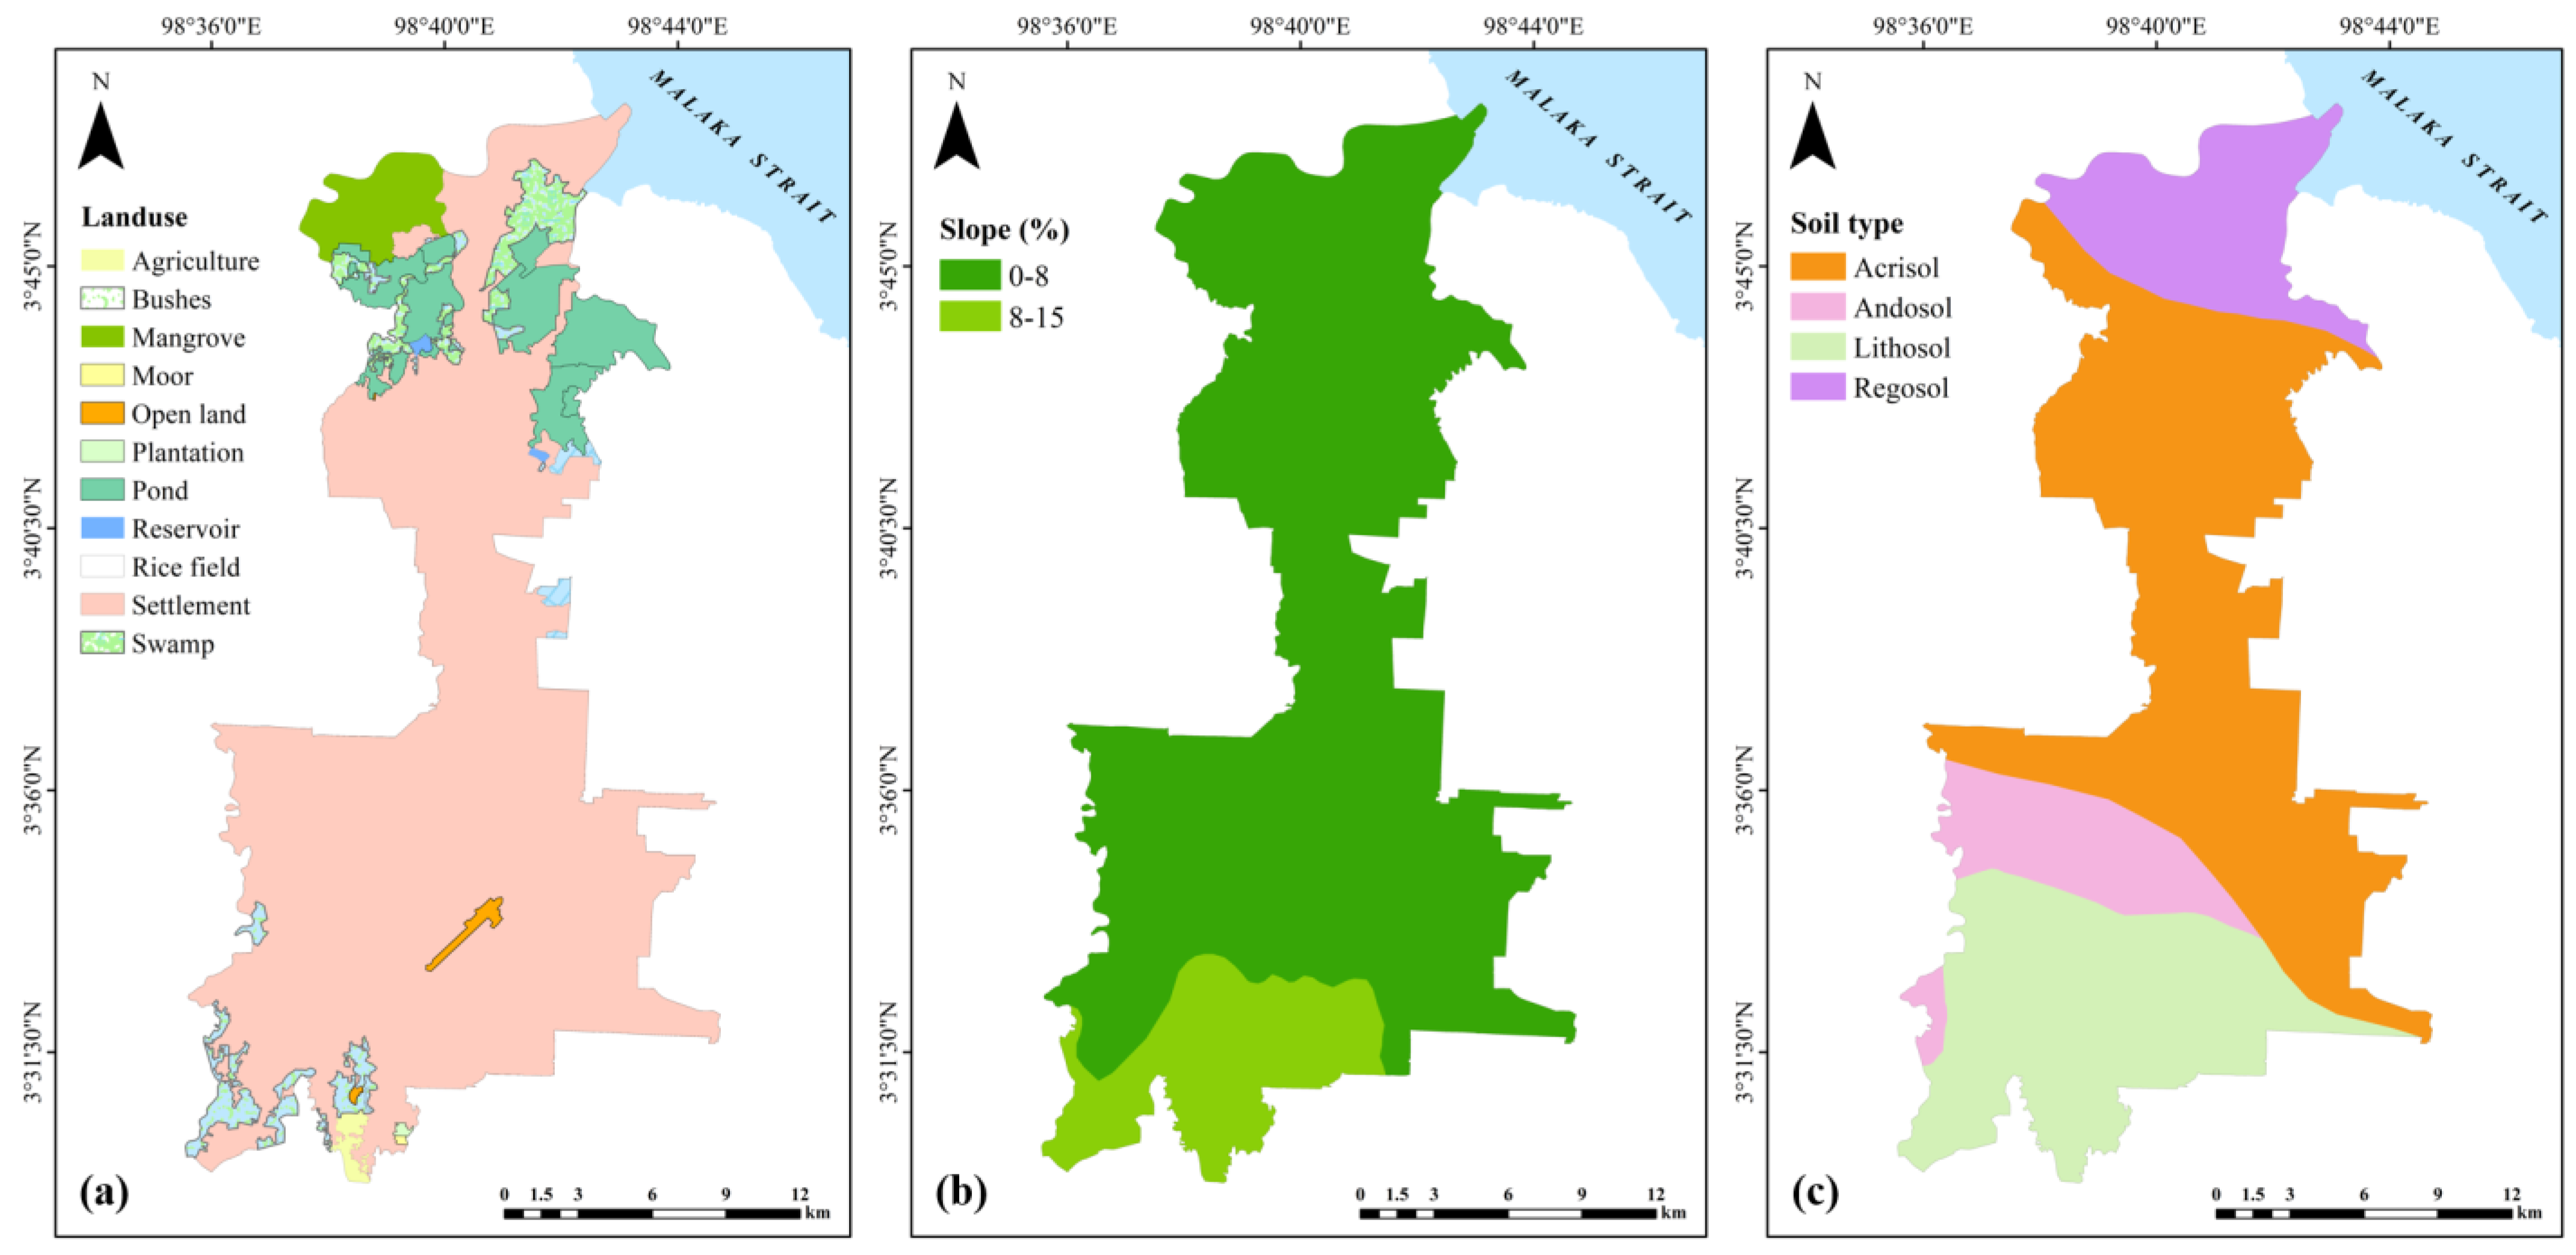
2.4. Land Use, Soil Type, and Slope
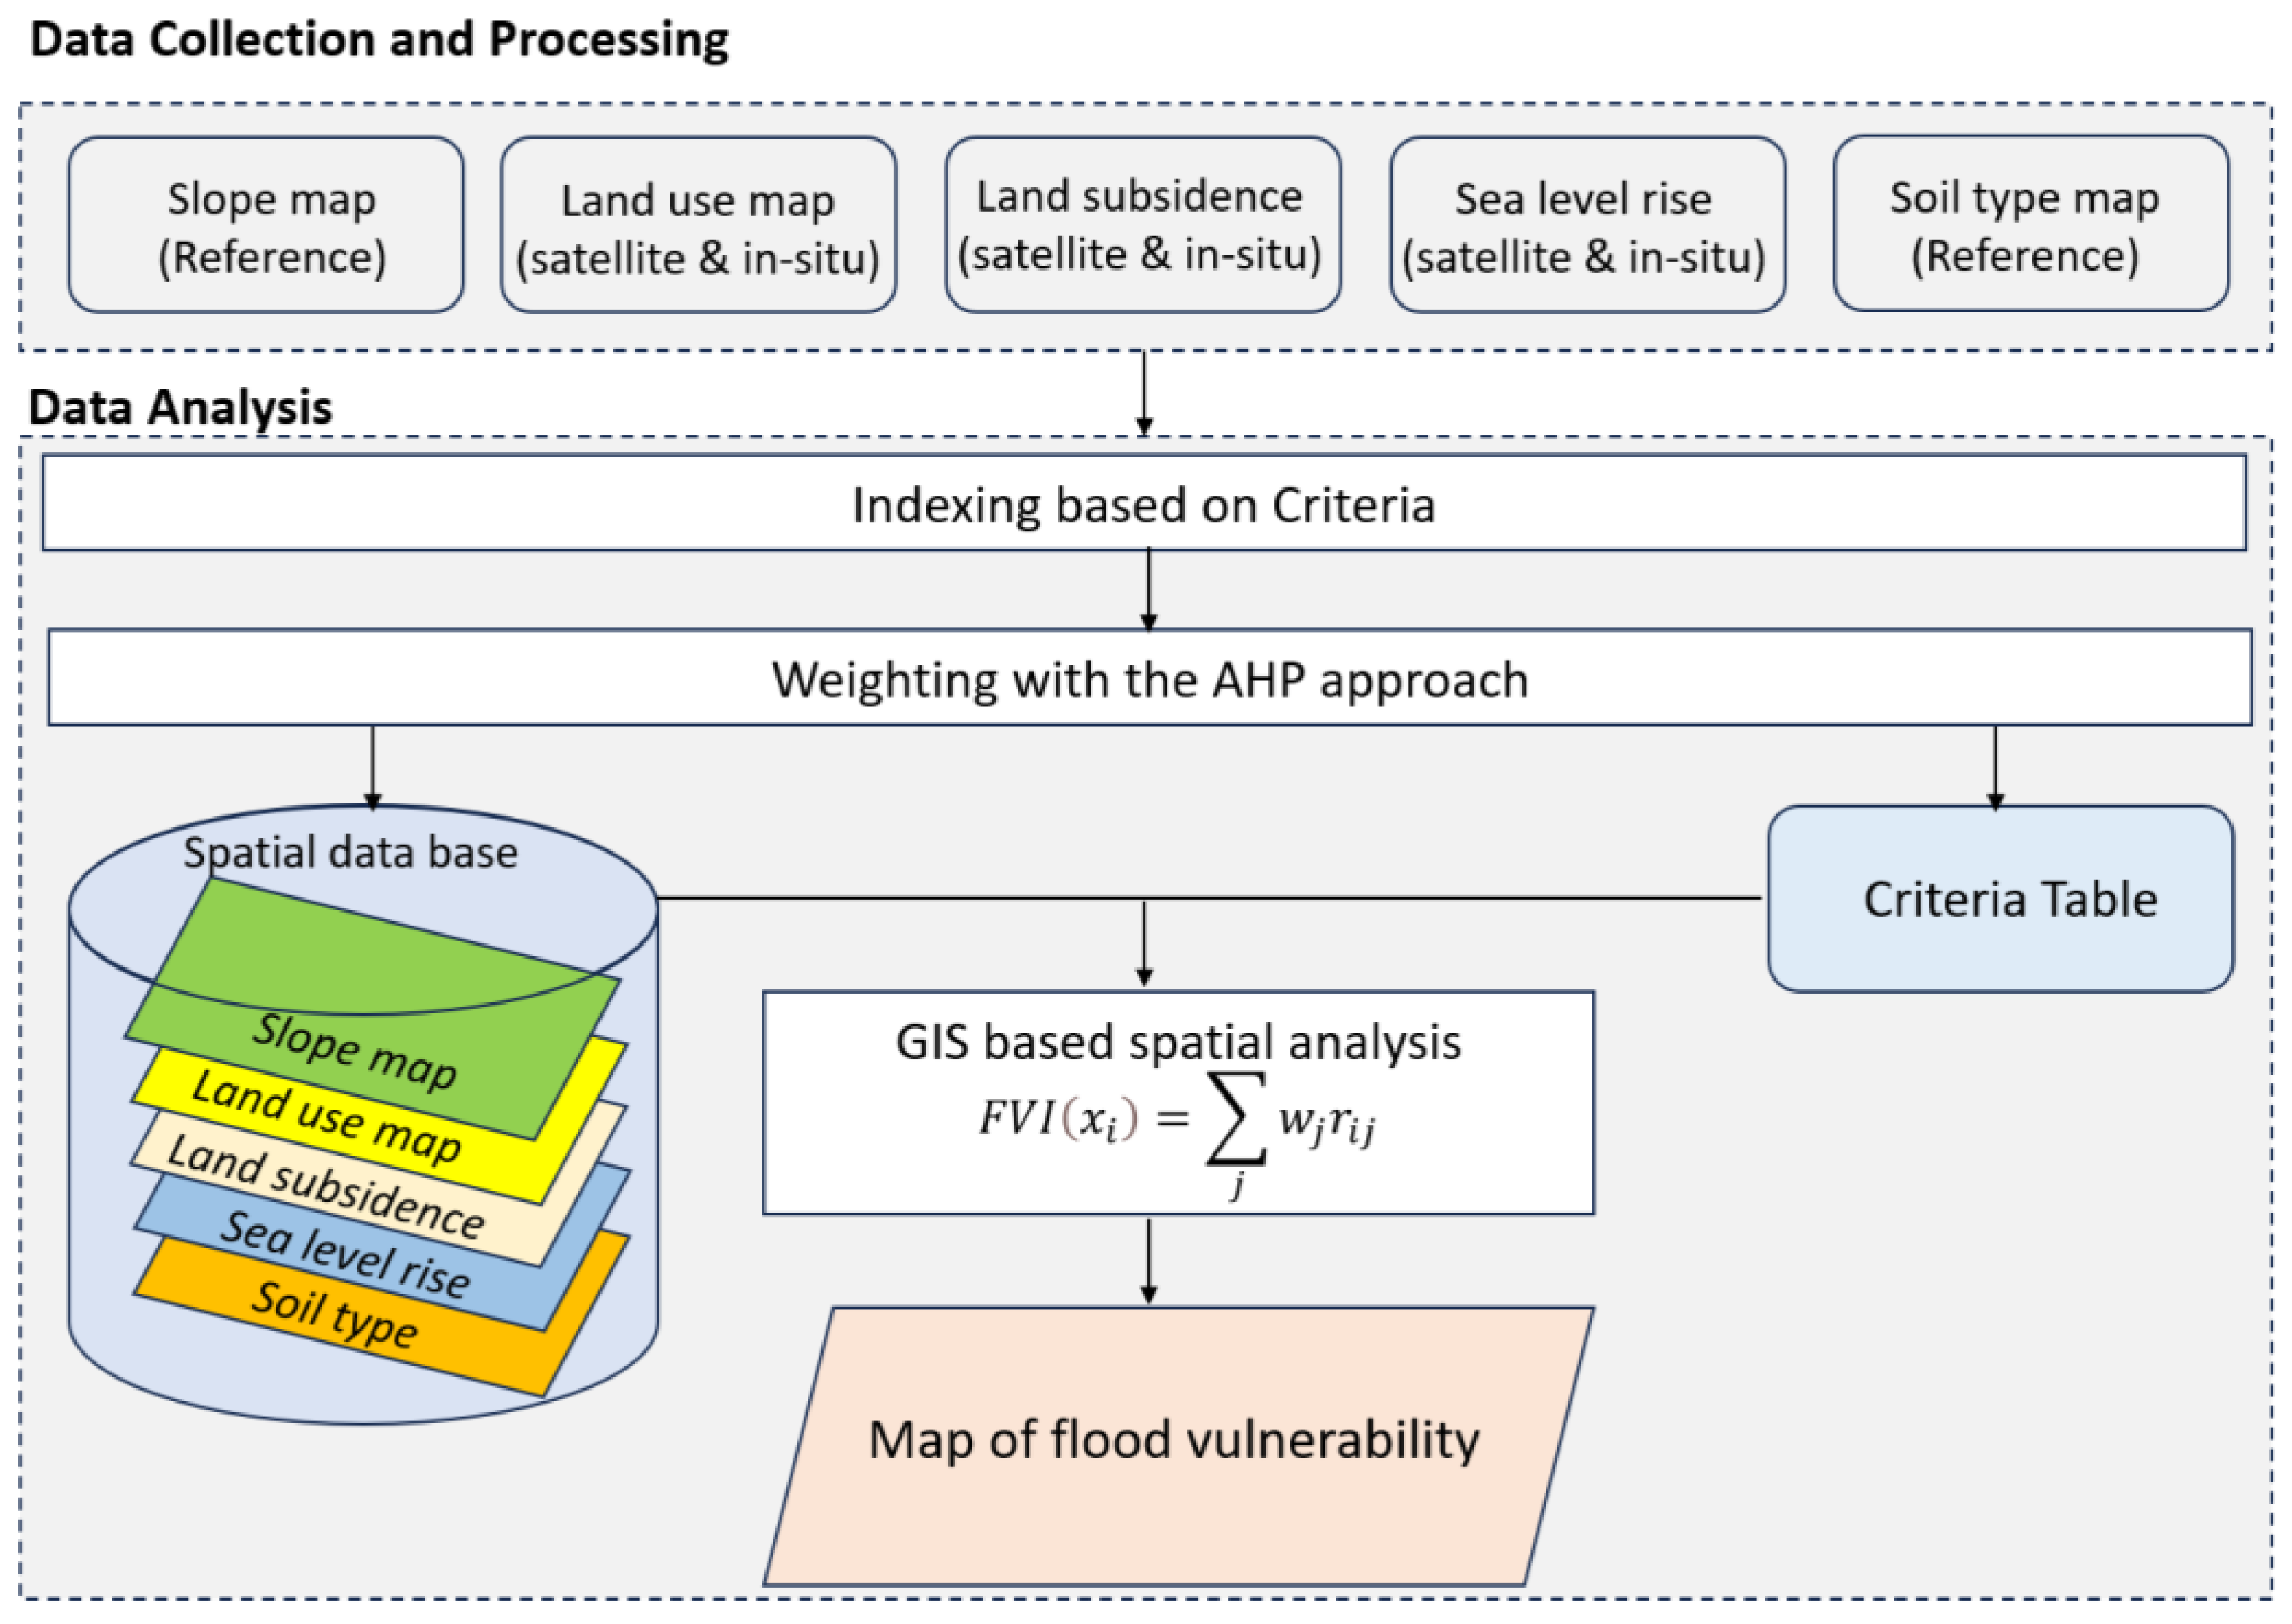
2.5. Spatial Analysis of Flood Disaster Vulnerability
3. Results
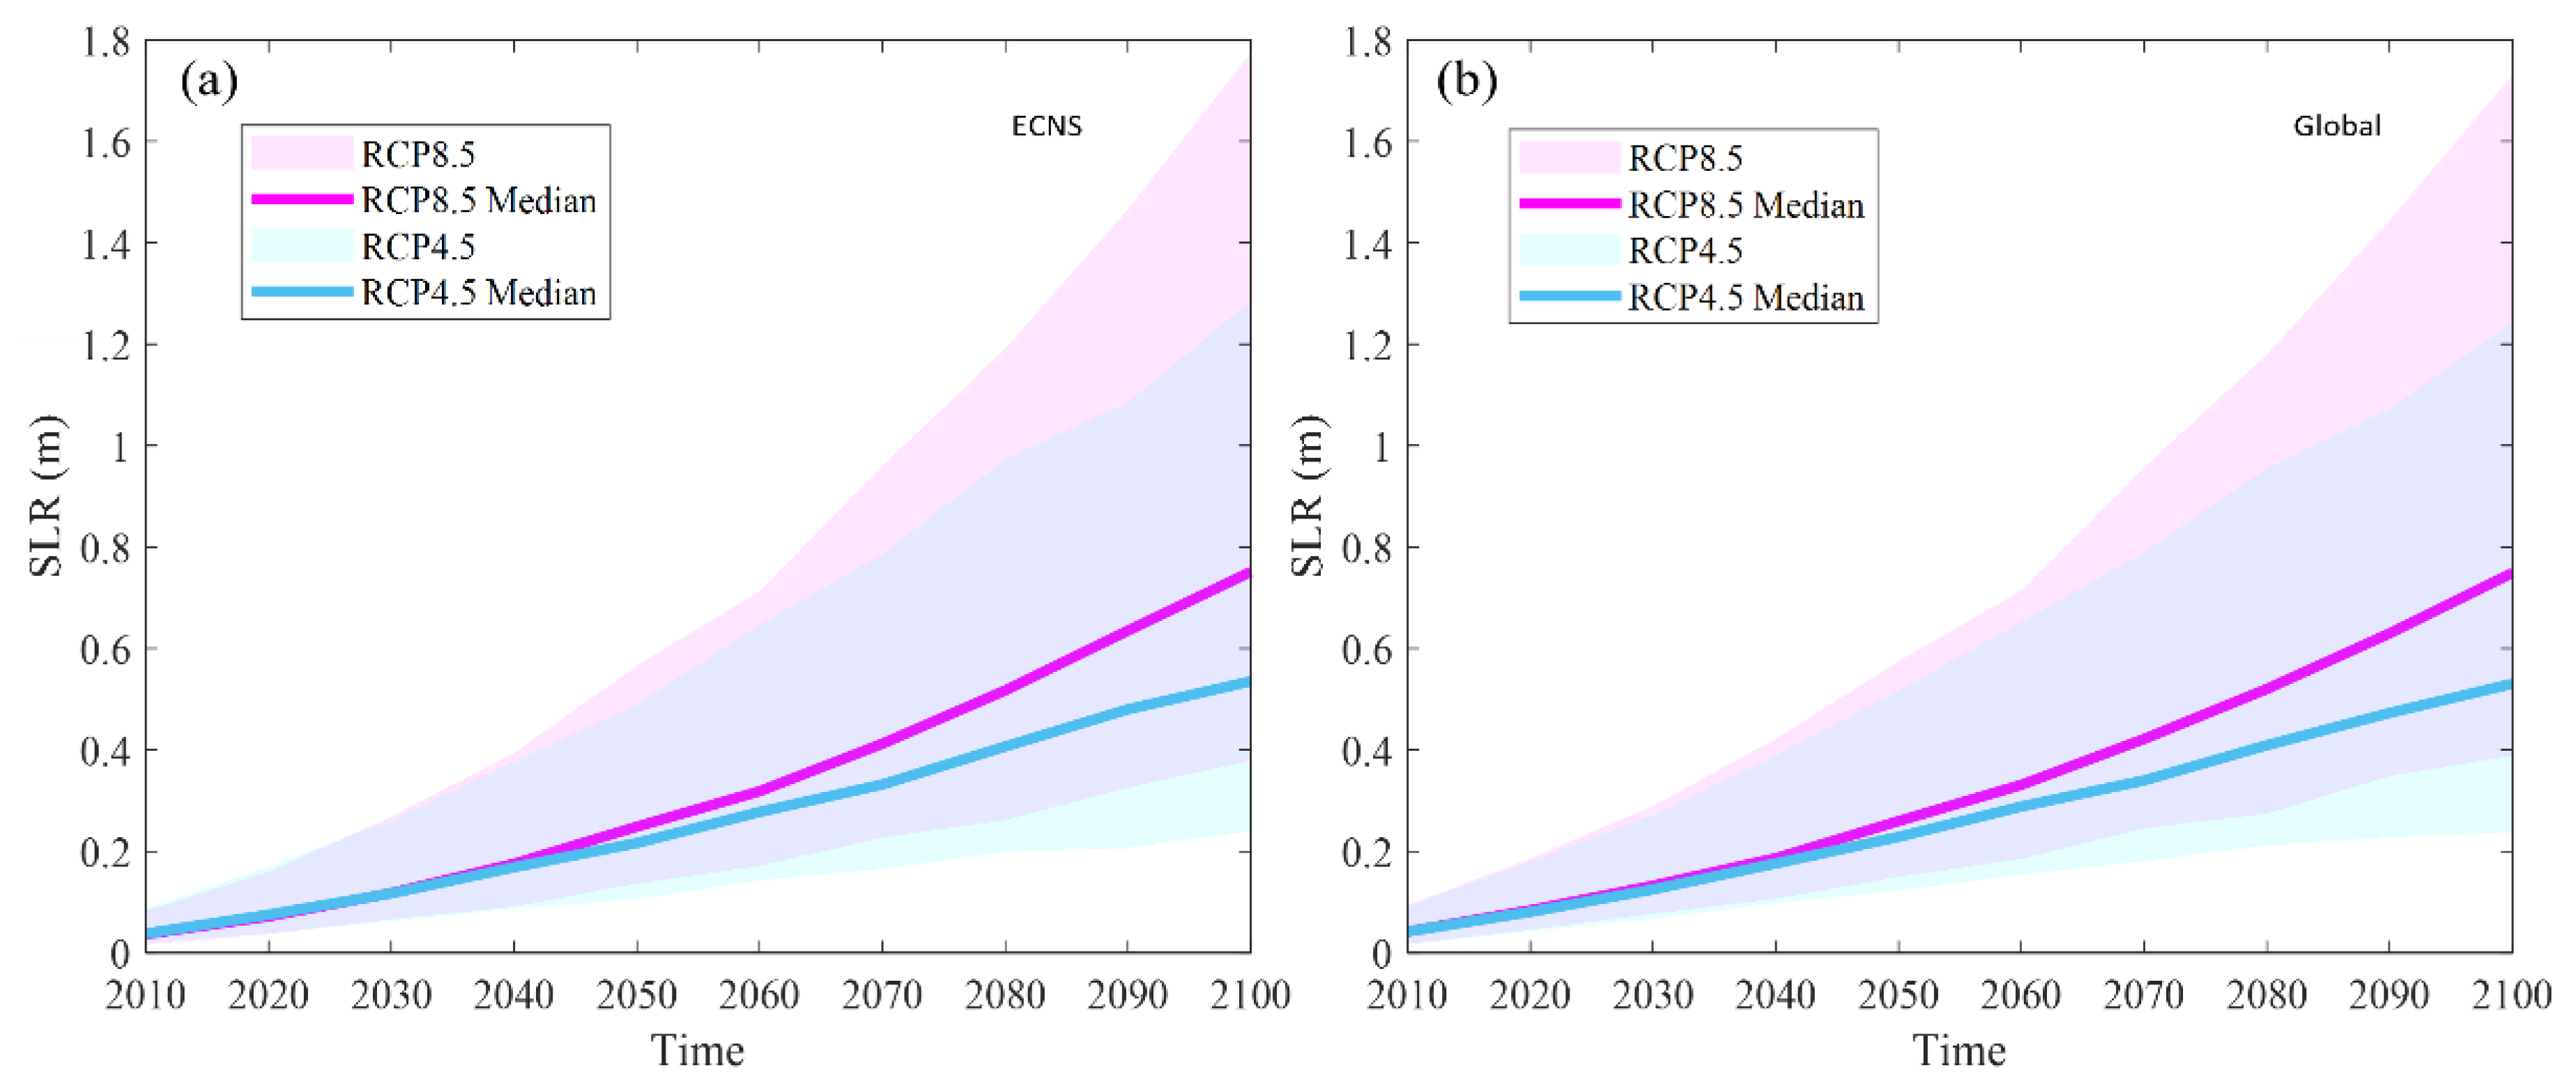
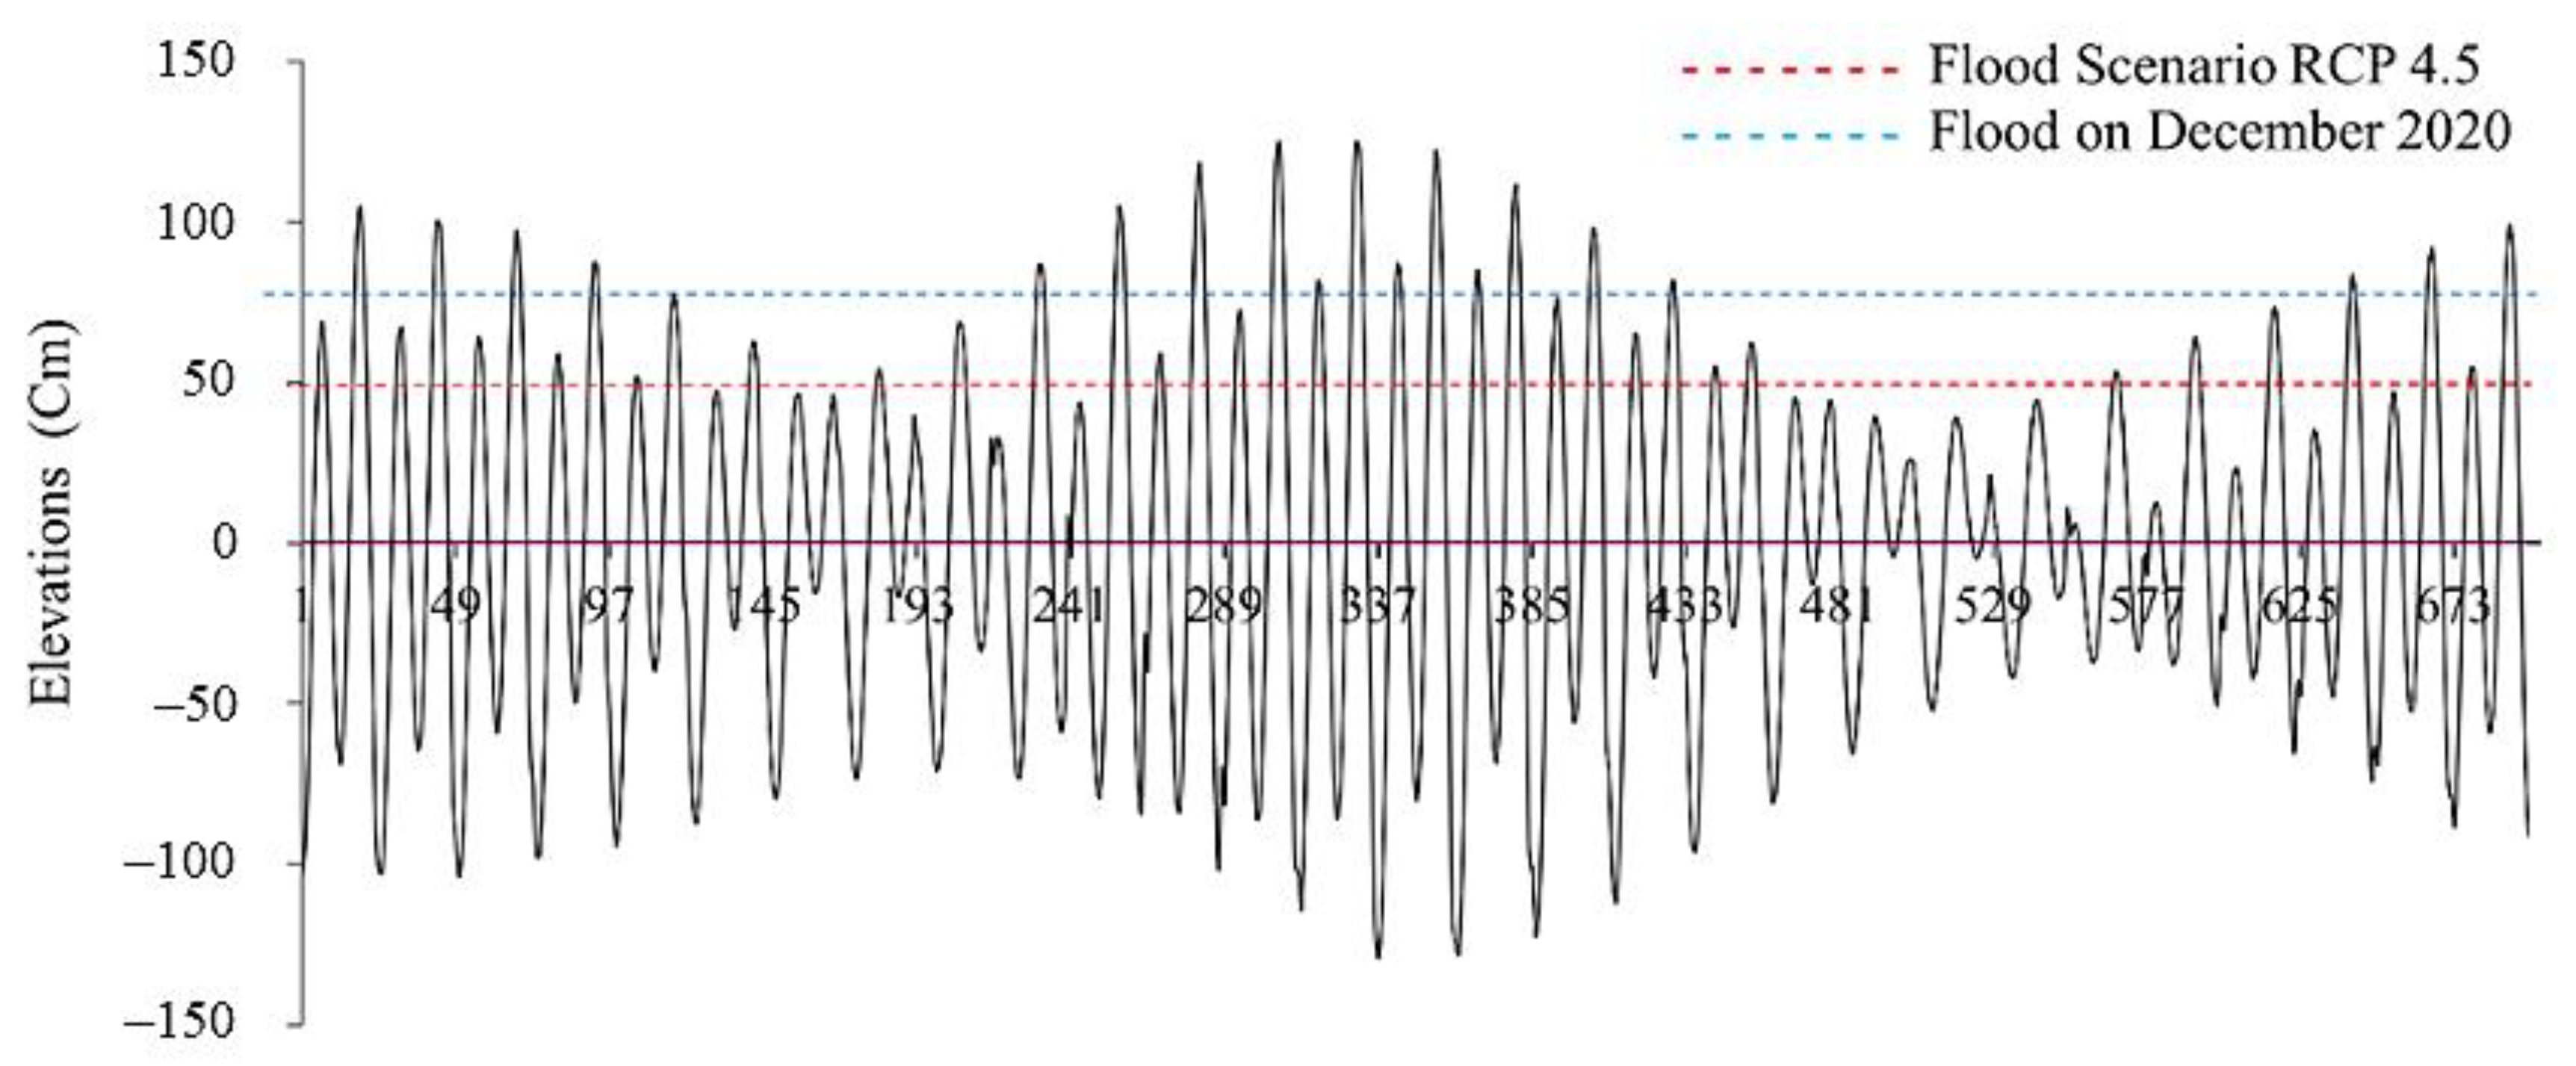
3.1. Trends in Sea Level Rise and Coastal Flooding
3.2. Land Subsidence
3.3. Land Use, Slope, and Soil Type
3.4. Analysis of Hierarchy Process for Flood Vulnerability
4. Discussion
5. Conclusions
Author Contributions
Funding
Data Availability Statement
Acknowledgments
Conflicts of Interest
References
- Church, J.A.; White, N.J. Sea-level rise from the late 19th to the early 21st century. Surv. Geophys. 2011, 32, 585–602. [Google Scholar] [CrossRef]
- Strassburg, M.W.; Hamlington, B.D.; Leben, R.R.; Manurung, P.; Lumban-Gaol, J.; Nababan, B.; Vignudelli, S.; Kim, K.-Y. Sea level trends in Southeast Asian seas. Clim. Past 2015, 11, 743–750. [Google Scholar] [CrossRef]
- Stammer, D.; Cazenave, A.; Ponte, R.M.; Tamisiea, M.E. Causes for contemporary regional sea level changes. Annu. Rev. Mar. Sci. 2013, 5, 21–46. [Google Scholar] [CrossRef] [PubMed]
- Hannah, J.; Bell, R.G. Regional sea level trends in New Zealand. J. Geophys. Res. Ocean. 2012, 117, C01004. [Google Scholar] [CrossRef]
- Nicholls, R.J.; Tol, R.S. Impacts and responses to sea-level rise: A global analysis of the SRES scenarios over the twenty-first century. Philos. Trans. R. Soc. A Math. Phys. Eng. Sci. 2006, 364, 1073–1095. [Google Scholar] [CrossRef] [PubMed]
- Cazenave, A.; Cozannet, G.L. Sea level rise and its coastal impacts. Earth’s Future 2014, 2, 15–34. [Google Scholar] [CrossRef]
- Vitousek, S.; Barnard, P.L.; Fletcher, C.H.; Frazer, N.; Erikson, L.; Storlazzi, C.D. Doubling of coastal flooding frequency within decades due to sea-level rise. Sci. Rep. 2017, 7, 1399. [Google Scholar] [CrossRef] [PubMed]
- Nicholls, R.J. Planning for the impacts of sea level rise. Oceanography 2011, 24, 144–157. [Google Scholar] [CrossRef]
- Dasgupta, S.; Laplante, B.; Meisner, C.; Wheeler, D.; Yan, J. The impact of sea level rise on developing countries: A comparative analysis. Clim. Chang. 2009, 93, 379–388. [Google Scholar] [CrossRef]
- Hinkel, J.; Lincke, D.; Vafeidis, A.T.; Perrette, M.; Nicholls, R.J.; Tol, R.S.; Marzeion, B.; Fettweis, X.; Ionescu, C.; Levermann, A. Coastal flood damage and adaptation costs under 21st century sea-level rise. Proc. Natl. Acad. Sci. USA 2014, 111, 3292–3297. [Google Scholar] [CrossRef]
- Dutta, D. An integrated tool for assessment of flood vulnerability of coastal cities to sea-level rise and potential socio-economic impacts: A case study in Bangkok, Thailand. Hydrol. Sci. J. 2011, 56, 805–823. [Google Scholar] [CrossRef]
- Felsenstein, D.; Lichter, M. Social and economic vulnerability of coastal communities to sea-level rise and extreme flooding. Nat. Hazards 2014, 71, 463–491. [Google Scholar] [CrossRef]
- Sun, H.; Grandstaff, D.; Shagam, R. Land subsidence due to groundwater withdrawal: Potential damage of subsidence and sea level rise in southern New Jersey, USA. Environ. Geol. 1999, 37, 290–296. [Google Scholar] [CrossRef]
- Erban, L.E.; Gorelick, S.M.; Zebker, H.A. Groundwater extraction, land subsidence, and sea-level rise in the Mekong Delta, Vietnam. Environ. Res. Lett. 2014, 9, 084010. [Google Scholar] [CrossRef]
- Aucelli, P.P.C.; Di Paola, G.; Incontri, P.; Rizzo, A.; Vilardo, G.; Benassai, G.; Buonocore, B.; Pappone, G. Coastal inundation risk assessment due to subsidence and sea level rise in a Mediterranean alluvial plain (Volturno coastal plain—Southern Italy). Estuar. Coast. Shelf Sci. 2017, 198, 597–609. [Google Scholar] [CrossRef]
- Antonioli, F.; De Falco, G.; Lo Presti, V.; Moretti, L.; Scardino, G.; Anzidei, M.; Bonaldo, D.; Carniel, S.; Leoni, G.; Furlani, S.; et al. Relative sea-level rise and potential submersion risk for 2100 on 16 coastal plains of the Mediterranean Sea. Water 2020, 12, 2173. [Google Scholar] [CrossRef]
- Sumantyo, J.T.S.; Shimada, M.; Mathieu, P.P.; Abidin, H.Z. Long-term consecutive DInSAR for volume change estimation of land deformation. IEEE Trans. Geosci. Remote Sens. 2011, 50, 259–270. [Google Scholar] [CrossRef]
- Abidin, H.Z.; Andreas, H.; Gumilar, I.; Wibowo, I.R.R. On correlation between urban development, land subsidence and flooding phenomena in Jakarta. Proc. IAHS 2015, 370, 15–20. [Google Scholar] [CrossRef]
- Yastika, P.E.; Shimizu, N.; Abidin, H.Z. Monitoring of long-term land subsidence from 2003 to 2017 in coastal area of Semarang, Indonesia by SBAS DInSAR analyses using Envisat-ASAR, ALOS-PALSAR, and Sentinel-1A SAR data. Adv. Space Res. 2019, 63, 1719–1736. [Google Scholar] [CrossRef]
- Blanco-Sánchez, P.; Mallorquí, J.J.; Duque, S.; Monells, D. The Coherent Pixels Technique (CPT): An Advanced DInSAR Technique for Nonlinear Deformation Monitoring. Pure Appl. Geophys. 2008, 165, 1167–1193. [Google Scholar] [CrossRef]
- Casu, F.; Elefante, S.; Imperatore, P.; Zinno, I.; Manunta, M.; De Luca, C.; Lanari, R. SBAS-DInSAR Parallel Processing for Deformation Time-Series Computation. IEEE J. Sel. Top. Appl. Earth Obs. Remote Sens. 2014, 7, 3285–3296. [Google Scholar] [CrossRef]
- Lakhote, A.; Thakkar, M.G.; Kandregula, R.S.; Jani, C.; Kothyari, G.C.; Chauhan, G.; Bhandari, S. Estimation of active surface deformation in the eastern Kachchh region, western India: Application of multi-sensor DInSAR technique. Quat. Int. 2021, 575–576, 130–140. [Google Scholar] [CrossRef]
- Abidin, H.Z.; Andreas, H.; Djaja, R.; Darmawan, D.; Gamal, M. Land subsidence characteristics of Jakarta between 1997 and 2005, as estimated using GPS surveys. GPS Solut. 2008, 12, 23–32. [Google Scholar] [CrossRef]
- Stramondo, S.; Saroli, M.; Tolomei, C.; Moro, M.; Doumaz, F.; Pesci, A.; Loddo, F.; Baldi, P.; Boschi, E. Surface movements in Bologna (Po plain—Italy) detected by multitemporal DInSAR. Remote Sen. Environ. 2007, 110, 304–316. [Google Scholar] [CrossRef]
- Di Martire, D.; Novellino, A.; Ramondini, M.; Calcaterra, D. A-differential synthetic aperture radar interferometry analysis of a deep seated gravitational slope deformation occurring at Bisaccia (Italy). Sci. Total Environ. 2016, 550, 556–573. [Google Scholar] [CrossRef] [PubMed]
- Nishi, K.; Sumantyo, J.T.S.; Kawai, M.; Waqar, M.M.; Chen, X. Monitoring of land deformation in Kanagawa Prefecture using GNSS and C-band Sentinel-1 based consecutive DInSAR. J. Instrum. Autom. Syst. 2021, 7, 12–21. [Google Scholar]
- Bayuaji, L.; Sumantyo, J.T.S.; Kuze, H. ALOS PALSAR D-InSAR for land subsidence mapping in Jakarta, Indonesia. Can. J. Remote Sens. 2010, 36, 1–8. [Google Scholar] [CrossRef]
- Mohammed, O.I.; Saeidi, V.; Pradhan, B.; Yusuf, Y.A. Advanced differential interferometry synthetic aperture radar techniques for deformation monitoring: A review on sensors and recent research development. Geocarto Int. 2014, 29, 536–553. [Google Scholar] [CrossRef]
- Tarigan, A.P.M.; Zevri, A.; Iskandar, R.; Indrawan, I. A study on the estimation of flood damage in Medan city. In Proceedings of the 6th International Conference of Euro Asia Civil Engineering Forum (EACEF 2017), Seoul, Republic of Korea, 22–25 August 2017; MATEC Web of Conferences. EDP Sciences: Les Ulis, France, 2017; Volume 138. Available online: https://www.matec-conferences.org/articles/matecconf/abs/2017/52/matecconf_eacef2017_06010/matecconf_eacef2017_06010.html (accessed on 7 September 2023).
- Hutapea, S. Assessment of deli watershed flood that caused some damage in Medan City, Indonesia. J. Rangel. Sci. 2019, 9, 300–312. Available online: https://journals.iau.ir/,article_665329_8c0fca2a77ce98058945ede578be3923.pdf (accessed on 15 October 2023).
- Dian, R.; Lismawaty, L.; Pinem, D.E.; Sianipar, B.B. Flood vulnerability and flood-prone area map at Medan City, Indonesia. IOP Conf. Ser. Earth Environ. Sci. 2018, 200, 012039. [Google Scholar] [CrossRef]
- Tempa, K. District flood vulnerability assessment using analytic hierarchy process (AHP) with historical flood events in Bhutan. PLoS ONE 2022, 17, e0270467. [Google Scholar] [CrossRef] [PubMed]
- Ouma, Y.O.; Tateishi, R. Urban flood vulnerability and risk mapping using integrated multi-parametric AHP and GIS: Methodological overview and case study assessment. Water 2014, 6, 1515–1545. [Google Scholar] [CrossRef]
- Kwan, S.C.; Saragih, I.J. Urban environment and cause specific visits to community health centers of Medan city, Indonesia. Sustain. Cities Soc. 2021, 59, 102228. [Google Scholar] [CrossRef]
- Ullo, S.L.; Addabbo, P.; Di Martire, D.D.; Sica, S.; Fiscante, N.; Cicala, L.; Angelino, C.V. Application of DInSAR technique to high coherence Sentinel-1 images for dam monitoring and result validation through in situ measurements. IEEE J. Sel. Top. Appl. Earth Obs. Remote Sens. 2019, 12, 875–890. [Google Scholar] [CrossRef]
- Jevrejeva, S.; Jackson, L.P.; Riva, R.E.M.; Grinsted, A.; Moore, J.C. Coastal Sea Level Rise with Warming above 2 °C. Proc. Natl. Acad. Sci. USA 2016, 113, 13342–13347. [Google Scholar] [CrossRef]
- Jackson, L.P.; Jevrejeva, S. A Probabilistic Approach to 21st Century Regional Sea-Level Projections Using RCP and High-End Scenarios. Glob. Planet. Chang. 2016, 146, 179–189. [Google Scholar] [CrossRef]
- Tampubolon, K. Aplikasi Sistem Informasi Geografis (SIG) sebagai Penentuan kawasan Rawan banjir di Kota Medan. J. Pembang. Perkota. 2018, 6, 63–68, (In Bahasa Indonesia). Available online: https://www.researchgate.net/profile/KokoTampubolon/publication/330934511_APLIKASI_SISTEM_INFORMASI_GEOGRAFIS_SIG_SEBAGAI_PENENTUAN_KAWASAN_RAWAN_BANJIR_DI_KOTA_MEDAN/links/5c5c5085299bf1d14cb33832/APLIKASI-SISTEM-INFORMASI-GEOGRAFIS-SIG-SEBAGAI-PENENTUAN-KAWASAN-RAWAN-BANJIR-DI-KOTA-MEDAN.pdf (accessed on 5 September 2023).
- Papathoma, M.; Dominey-Howes, D.; Zong, Y.; Smith, D. Assessing tsunami vulnerability, an example from Herakleio, Crete. Nat. Hazard Earth Sys. Sci. 2003, 3, 377–389. [Google Scholar] [CrossRef]
- Saaty, T.L. A scaling method for priorities in hierarchical structures. J. Math. Psychol. 1977, 15, 234–281. [Google Scholar] [CrossRef]
- Saaty, T.L. Decision making—The analytic hierarchy and network processes (AHP/ANP). J. Syst. Sci. Syst. Eng. 2004, 13, 1–35. [Google Scholar] [CrossRef]
- Chen, X.; Zhang, X.; Church, J.A.; Watson, C.S.; King, M.A.; Monselesan, D.; Legresy, B.; Harig, C. The increasing rate of global mean sea-level rise during 1993–2014. Nat. Clim. Chang. 2017, 7, 492–495. [Google Scholar] [CrossRef]
- Fasullo, J.T.; Nerem, R.S. Altimeter-era emergence of the patterns of forced sea-level rise in climate models and implications for the future. Proc. Natl. Acad. Sci. USA 2018, 115, 12944–12949. [Google Scholar] [CrossRef] [PubMed]
- Lumban-Gaol, J.; Vignudelli, S.; Nurjaya, I.W.; Natih, N.M.N.; Sinurat, M.E.; Arhatin, R.E.; Kusumaningrum, E.E. Evaluation of altimetry satellite data products and sea level trends in the Indonesian maritime continent. IOP Conf. Ser. Earth Environ. Sci. 2021, 944, 012041. [Google Scholar] [CrossRef]
- Handoko, E.Y.; Fernandes, M.J.; Lázaro, C. Assessment of altimetric range and geophysical corrections and mean sea surface models—Impacts on sea level variability around the Indonesian seas. Remote Sens. 2017, 9, 102. [Google Scholar] [CrossRef]
- Nugroho, H.; Rinaldy. Pemetaan Undulasi Kota Medan Menggunakan Hasil Pengukuran Tinggi Tahun 2010. J. Itenas Rekayasa 2013, 17. (In Bahasa Indonesia). Available online: https://ejurnal.itenas.ac.id/index.php/rekayasa/article/view/471/637 (accessed on 5 July 2023).
- Hermon, D. Geografi Bencana Alam, 1st ed.; Rajawali Pers: Jakarta, Indonesia, 2015; ISBN 978-979-769-820-1. (In Bahasa Indonesia). [Google Scholar]
- Gornitz, V.M.; White, T.W.; Daniels, R.C. A Coastal Hazards Data Base for the US East Coast; Oak Ridge National Lab.: Oak Ridge, TN, USA, 1992.
- Pendleton, E.A.; Thieler, E.R.; Williams, S.J. Importance of coastal change variables in determining vulnerability to sea- and lake-level change. J. Coast. Res. 2010, 261, 176–183. [Google Scholar] [CrossRef]
- Zain, A.F.M. Distribution, Structure and Function of Urban Green Space in Southeast Asian Megacities with Special Reference to Jakarta Metropolitan Region (JABOTABEK). Doctoral Dissertation, Tokyo University, Tokyo, Japan, 2002. Available online: https://ci.nii.ac.jp/naid/500000245635/ (accessed on 10 October 2023).
- Church, J.A.; Clark, P.U.; Cazenave, A.; Gregory, J.M.; Jevrejeva, S.; Levermann, A.; Merrifield, M.A.; Milne, G.A.; Nerem, R.S.; Nunn, P.D.; et al. Chapter 13: Sea level change. In Climate Change, 2013: The Physical Science Basis: Contribution of Working Group I to the Fifth Assessment Report of the Intergovernmental Panel on Climate Change; Cambridge University Press: Cambridge, UK; New York, NY, USA, 2013. [Google Scholar]
- Mancini, F.; Grassi, F.; Cenni, N. A workflow based on SNAP–StaMPS open-source tools and GNSS data for PSI-based ground deformation using dual-orbit sentinel-1 data: Accuracy assessment with error propagation analysis. Remote Sens. 2021, 13, 753. [Google Scholar] [CrossRef]
- Wang, J.; Yi, S.; Li, M.; Wang, L.; Song, C. Effects of sea level rise, land subsidence, bathymetric change and typhoon tracks on storm flooding in the coastal areas of Shanghai. Sci. Total Environ. 2018, 621, 228–234. [Google Scholar] [CrossRef]
- Anzidei, M.; Bosman, A.; Carluccio, R.; Casalbore, D.; D’Ajello Caracciolo, F.; Esposito, A.; Nicolosi, I.; Pietrantonio, G.; Vecchio, A.; Carmisciano, C.; et al. Flooding scenarios due to land subsidence and sea-level rise: A case study for Lipari Island (Italy). Terra Nova 2017, 29, 44–51. [Google Scholar] [CrossRef]
- Rocha, C.; Antunes, C.; Catita, C. Coastal vulnerability assessment due to sea level rise: The case study of the Atlantic coast of mainland Portugal. Water 2020, 12, 360. [Google Scholar] [CrossRef]
- Scardino, G.; Anzidei, M.; Petio, P.; Serpelloni, E.; De Santis, V.; Rizzo, A.; Liso, S.I.; Zingaro, M.; Capolongo, D.; Vecchio, A.; et al. The impact of future sea-level rise on low-lying subsiding coasts: A case study of tavoliere delle puglie (Southern Italy). Remote Sens. 2022, 14, 4936. [Google Scholar] [CrossRef]


| Time | Damage Caused by Flooding | Image |
|---|---|---|
| 3 December 2020 | A significant flooding impacted the city of Medan, Indonesia, affecting 5965 people. Water levels reached alarming heights of 3–5 m. The National Disaster Management Agency confirmed that five people tragically lost their lives, whereas two remain missing. The floodwaters impacted four subdistricts within Medan City: Medan Johor, Medan Maimun, Medan Sunggal, and Medan Tuntungan. | 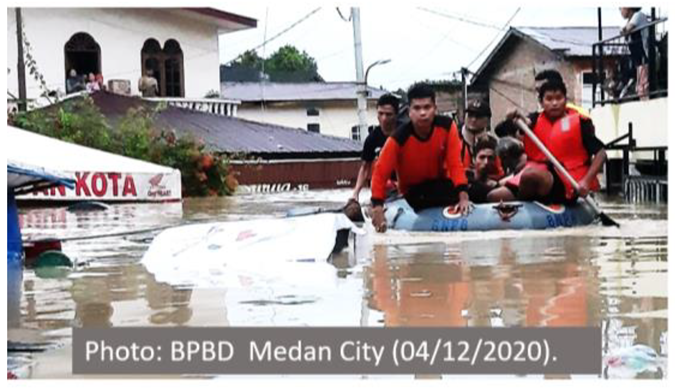 |
| 7 December 2021 | A tidal flooding affected 60,102 people in Belawan and Medan, Indonesia. The high sea tides triggered (“Rob” in local terminology) flood inundated several subdistricts within the administrative areas of Medan and Belawan Districts. Six subdistricts were affected: Belawan I, Belawan II, Sicanang, Bahari, Bahagia, and Bagan Deli. | 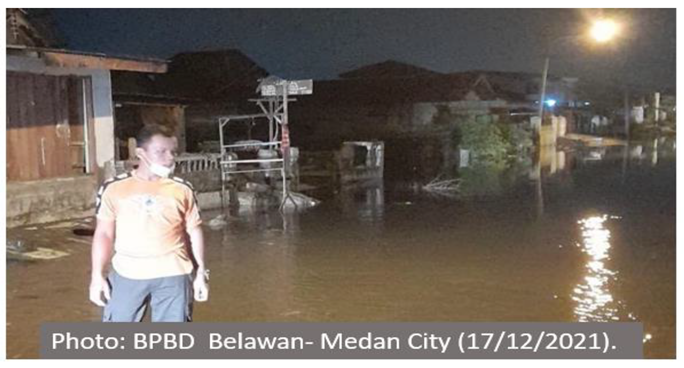 |
| 27 February 2022 | A significant flooding affected 3267 residential houses in Medan, Indonesia. Water levels ranged from 30 cm to 1 m, with some areas in Kampung Aur experiencing flood heights exceeding 2 m. The flood impacted nine subdistricts: Medan Johor, Medan Selayang, Medan Maimun, Medan Baru, Medan Sunggal, Medan Polonia, Medan Denai, Medan Labuhan, and Medan Amplas. | 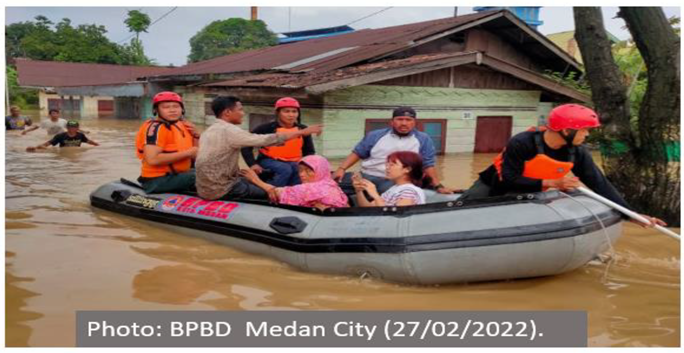 |
| 3 September 2023 | A significant flooding impacted 346 residential houses in Medan City, Indonesia. The floodwaters submerged houses on Perjuangan and Dwikora Streets, Tanjung Rejo Village, Medan Sunggal District. Additionally, residents residing on Karya Dalam Street, Rukun Street, Ayem Street, and Sepakat Street in Karang Berombak Village, West Medan District, were also affected by floodwater inundation. | 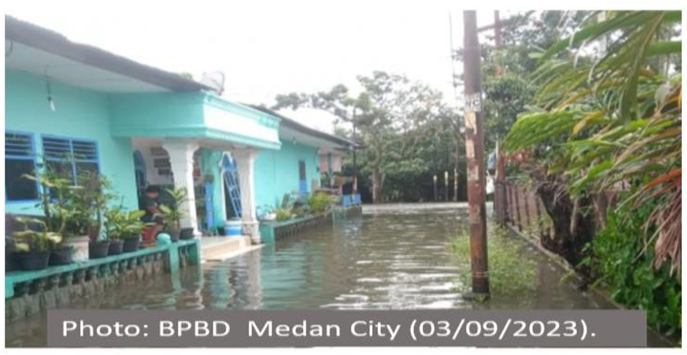 |
| Bench Mark (BM) | Latitude (°N) | Longitude (°E) | Height (m) 2010 [46] | Height (m) 2023 | Difference (m) |
|---|---|---|---|---|---|
| BM 02 | 3.521109 | 98.676373 | 301.517 | 300.775 | −0.742 |
| BM 06 | 3.560994 | 98.697191 | 135.706 | 131.486 | −4.220 |
| BM 07 | 3.560994 | 98.711181 | 116.972 | 88.907 | −28.065 |
| BM 08 | 3.574129 | 98.706511 | 08.902 | 08.903 | −0.012 |
| BM 16 | 3.497786 | 98.648354 | 423.142 | 416.095 | −7.047 |
| BM 21 | 3.498690 | 98.599782 | 523.906 | 523.392 | −0.514 |
| Variables | Slope | Sea Level Rise | Land Subsidence | Land Use | Type of Soil |
|---|---|---|---|---|---|
| Slope | 1 | 2 | 2 | 2 | 2 |
| Sea level rise | 0.5 | 1 | 0.5 | 0.5 | 2 |
| Land subsidence | 0.5 | 2 | 1 | 0.5 | 2 |
| Land use | 0.5 | 2 | 2 | 1 | 2 |
| Type of soil | 0.5 | 0.5 | 0.5 | 0.5 | 1 |
| Parameter | Criteria | Level | Score | Weight |
|---|---|---|---|---|
| Slope (%) modified from [38] | >45 | Very low | 1 | 0.32 |
| 26–45 | Low | 2 | ||
| 16–25 | Moderate | 3 | ||
| 9–15 | High | 4 | ||
| 0–8 | Very high | 5 | ||
| Land use [47] | Forest | Very low | 1 | 0.24 |
| Plantation and bush | Low | 2 | ||
| Agriculture, rice fields, and moor | Moderate | 3 | ||
| Settlement, mixed garden, and yard crop | High | 4 | ||
| Open land, river, reservoir, and swamp | Very high | 5 | ||
| Local subsidence trend (mm year−1) [48] | <−1.0 Land rising | Very low | 1 | 0.19 |
| −1.0–1.0 | Low | 2 | ||
| 1.1–2.0 | Moderate | 3 | ||
| 2.1–4.0 | High | 4 | ||
| >4.0 Land sinking | Very high | 5 | ||
| Relative sea level rise (mm year−1) [49] | <1.80 | Very low | 1 | 0.14 |
| 1.81–2.50 | Low | 2 | ||
| 2.51–3.00 | Moderate | 3 | ||
| 3.01–3.40 | High | 4 | ||
| >3.4 | Very high | 5 | ||
| Soil type [50] | Very low | 1 | 0.11 | |
| Regosol and Podzolk | Low | 2 | ||
| Andosol, Lithosol, and Ferralsol | Moderate | 3 | ||
| High | 4 | |||
| Histosol, Gleysol, Vertisol, Acrisol, and Grumusol | Very high | 5 |
Disclaimer/Publisher’s Note: The statements, opinions and data contained in all publications are solely those of the individual author(s) and contributor(s) and not of MDPI and/or the editor(s). MDPI and/or the editor(s) disclaim responsibility for any injury to people or property resulting from any ideas, methods, instructions or products referred to in the content. |
© 2024 by the authors. Licensee MDPI, Basel, Switzerland. This article is an open access article distributed under the terms and conditions of the Creative Commons Attribution (CC BY) license (https://creativecommons.org/licenses/by/4.0/).
Share and Cite
Lumban-Gaol, J.; Sumantyo, J.T.S.; Tambunan, E.; Situmorang, D.; Antara, I.M.O.G.; Sinurat, M.E.; Suhita, N.P.A.R.; Osawa, T.; Arhatin, R.E. Sea Level Rise, Land Subsidence, and Flood Disaster Vulnerability Assessment: A Case Study in Medan City, Indonesia. Remote Sens. 2024, 16, 865. https://doi.org/10.3390/rs16050865
Lumban-Gaol J, Sumantyo JTS, Tambunan E, Situmorang D, Antara IMOG, Sinurat ME, Suhita NPAR, Osawa T, Arhatin RE. Sea Level Rise, Land Subsidence, and Flood Disaster Vulnerability Assessment: A Case Study in Medan City, Indonesia. Remote Sensing. 2024; 16(5):865. https://doi.org/10.3390/rs16050865
Chicago/Turabian StyleLumban-Gaol, Jonson, Josaphat Tetuko Sri Sumantyo, Efendy Tambunan, David Situmorang, I Made Oka Guna Antara, Maya Eria Sinurat, Ni Putu Asri Ratna Suhita, Takahiro Osawa, and Risti Endriani Arhatin. 2024. "Sea Level Rise, Land Subsidence, and Flood Disaster Vulnerability Assessment: A Case Study in Medan City, Indonesia" Remote Sensing 16, no. 5: 865. https://doi.org/10.3390/rs16050865
APA StyleLumban-Gaol, J., Sumantyo, J. T. S., Tambunan, E., Situmorang, D., Antara, I. M. O. G., Sinurat, M. E., Suhita, N. P. A. R., Osawa, T., & Arhatin, R. E. (2024). Sea Level Rise, Land Subsidence, and Flood Disaster Vulnerability Assessment: A Case Study in Medan City, Indonesia. Remote Sensing, 16(5), 865. https://doi.org/10.3390/rs16050865