Communication

Community-Based Monitoring for Rapid Assessment of Nearshore Coral Reefs Amid Disturbances in Teahupo’o, Tahiti

1
MEGA Lab, Hilo, HI 96720, USA
2
Marine Science, Data Science, and Tropical Conservation Biology and Environmental Science, College of Natural and Health Sciences, University of Hawai’i at Hilo, Hilo, HI 96720, USA
3
Center for Global Discovery and Conservation Science, School of Life Sciences, Arizona State University, Hilo, HI 96720, USA
4
Department of Earth Sciences, School of Ocean & Earth Science & Technology, University of Hawai’i, 1680 East West Rd., Honolulu, HI 96822, USA
5
Vai Ara O Teahupo’o, 98723 Teahupo’o, French Polynesia
*
Author to whom correspondence should be addressed.
Remote Sens. 2024, 16(5), 853; https://doi.org/10.3390/rs16050853
Submission received: 12 December 2023 / Revised: 9 January 2024 / Accepted: 23 February 2024 / Published: 29 February 2024
(This article belongs to the Section Biogeosciences Remote Sensing)

Abstract

:
Nearshore coral reefs at Teahupo’o, Tahiti, are currently threatened by destruction from proposed plans to build a new judging tower in the reef lagoon for the 2024 Olympic surfing event. Local community members were trained to utilize 3D photogrammetry techniques to create high-resolution habitat maps of three sites that will be impacted by dredging and tower construction. The resulting orthomosaics were analyzed to quantify and characterize the coral community structure at each study site. Species diversity, coral colony count, coral colony size, and percent cover of live coral and living benthos were extracted from all survey plots. The resulting data show these sites support healthy and diverse coral communities that contribute to the ecological function of the larger reef system at Teahupo’o. The Hawai’i State Division of Aquatic Resources Penalty Matrix was used to estimate the USD value of the live corals and algae identified among the study sites and the total area that will be impacted by the planned development project. This study highlights the utility of 3D photogrammetry for effective citizen science as well as the large economic and ecological impacts that may occur if this proposed construction occurs.

1. Introduction

Coral reefs provide habitat for highly diverse and productive communities of organisms throughout the world’s tropical and subtropical oceans. Living corals can fix large quantities of carbon dioxide, in large part due to the mutualism between corals and photosynthetic dinoflagellates; thus, coral reefs are among the most productive ecosystems on the planet [1,2]. Coral reefs support the most species-rich marine ecosystem, and it is estimated that the species richness ranges from 650,000 to over 9 million [3]. Additional research indicates that there are potentially 1–8 million undiscovered species of organisms residing on reefs [3,4]. These productive ecosystems are also a source of economic prosperity, generating an estimated USD 375 billion each year through recreation, tourism, waste treatment, coastal protection, and the production of raw materials [5,6]. On a global scale, coral reefs play a vital role in sustaining livelihoods and ensuring the food security of over 500 million individuals across more than 100 countries [7,8,9]. Additionally, they represent an economic asset valued in the trillions of U.S. dollars [8]. Considering that 90% of the 100,000 km of nearshore coral reefs are located <5 km from some of the world’s most densely populated coastlines [9], the goods and services provided by these ecosystems can profoundly affect the standard of living and health of humans. Thus, the social norms, lifestyle, and identity of island and coastal people are inherently tied to coral reefs [9,10,11].
Increasing levels of human-induced stressors, including pollution, coastal development, eutrophication, sedimentation, and excessive recreational activity are adversely affecting the health and function of coral reef ecosystems [6,8,12,13]. Additionally, global stressors such as climate change contribute to the high frequency of occurrence of widespread mortality linked to disease outbreaks and large-scale coral bleaching events [8,9,12,13,14]. With statistical projections indicating an expected heightened intensity for both global and local stressors affecting coral reefs, it is imperative for researchers and managers to utilize effective monitoring strategies. Reef monitoring is crucial for characterizing and tracking changes in coral reef health and ecological function as a proactive response to these evolving threats.
Ecological monitoring of coral reefs provides critically important data for coastal residents, reef management groups, and authorities. The information produced through ecological monitoring enables these groups to understand reef health, the role it plays in supporting sustenance and well-being, and the economic and social implications of reef degradation [7]. There is a strong societal demand for localized reef monitoring tools, and these tools must inform decisions relevant to social–ecological dynamics, prevalent threats, and socio-economic factors.
Reef monitoring has improved in the last several years by integrating new remote-sensing technologies to enhance the spatial scale and resolution of data obtained from underwater marine habitats. As technology advances, the costs linked to acquiring high-resolution imagery of underwater habitats have dramatically reduced while the speed of image collection and data processing has improved [7,15]. The Structure-from-Motion (SfM) range-imaging technique has been widely used with photogrammetry tools to produce three-dimensional (3D) habitat maps from overlapping 2D imagery. SfM techniques enable coral reef monitoring to produce spatially accurate 3D reconstructions at much larger spatial scales than conventional techniques while using simple and affordable single-lens camera systems [7,15,16]. This approach produces 3D reconstructions which can be used to render spatially rectified orthomosaics and digital elevation models, which in turn can be processed in a multitude of ways using various geospatial software tools to analyze the composition and 3D structure of benthic communities [7,15,16,17,18,19,20].
Studies in both terrestrial and marine environments have validated the accuracy and effectiveness of SfM approaches for creating 3D habitat reconstructions that can be used for characterizing ecological and structural features [7,15,16,21,22,23]. Underwater surveys using SfM techniques can be conducted rapidly in the field and require minimal specialized training. One must simply learn the basics of camera operability and be able to acquire overlapping images from a desired survey area. The ability to produce high-quality data with minimal intensive training makes photogrammetry techniques ideal for adoption by citizen science, which is the collection of data by non-formally trained scientists. Citizen science can be used as an innovative approach to enhance the scope of data capture and processing by leveraging regular citizens who are motivated to support scientific endeavors [24,25,26]. Citizen science approaches have been shown to be highly impactful in multiple scientific domains, including ecology, astronomy, microbiology, and social science with a range of activities, from simple observations and data collection to complex experimental analyses [24,25,26,27,28]. Considering the high public interest in coral reefs, and the many communities intricately dependent on reefs for sustenance and well-being, creating mechanisms to involve interested communities in photogrammetry surveys provides a powerful tool for empowering them to monitor reef health and assess the impact of disturbances.
Teahupo’o is a village on the southwestern coast of the island of Tahiti, French Polynesia, in the southern Pacific Ocean (17°51′56″S 149°14′01″W). This area is known for its lush landscapes and vibrant coral reefs, and is a popular destination for surfers as the reef produces a wave that is widely regarded as one of the most powerful surf spots in the world. Teahupo’o has been a regular stop on the World Surf League (WSL) Championship Tour since 1999. In addition to its significance in the surfing world, Teahupo’o holds cultural importance in Tahitian society. The wave and the surrounding area are part of the natural and cultural heritage of the region. The village is rural and isolated at the end of the coastal road from Papeete and supports a population of approximately 1500 people. Most residents of this village are farmers or subsistence fishers, or generate income through tourism.
The community of Teahupo’o, Tahiti, is currently concerned that coastal development to support the 2024 Olympic surfing event will impose harmful ecological impacts on their local coral reefs. This small village adjacent to the lagoon and outer reef has been hosting surfing contests for the highest level of international competition, the WSL Championship Tour. A judging tower is currently used annually for these contests, with concrete pilings established on the reef that are used to assemble a temporary tower structure for each contest. The Paris 2024 Olympic organizers intend to invest approximately USD 5 million to construct a substantially larger tower to provide amenities for judges including toilets, air conditioning, and capacity for 40 people. The development is also altering and hardening the shoreline to provide new pathways to access the lagoon for boat transport to the judging tower. The construction of the tower will also require dredging a path through the reef to allow for barge transport of construction materials. This project clearly poses a major threat to the reef by damaging live coral and living benthos. The construction plans must be carefully studied to ensure the actions do not cause irreversible damage to the reef that detrimentally affects the livelihood and well-being of the local Teahupo’o community.
The goals of this project were to support the concerns of the community and assist with baseline monitoring to characterize the coral reef and determine potential impacts on this environment. Our specific objectives were to (1) conduct training of the local citizens to provide them with the tools and techniques necessary to use 3D photogrammetry for mapping coral reef habitat, (2) analyze the resulting habitat reconstructions to characterize coral communities at three study sites, and (3) utilize a U.S. valuation system applied by the Hawai’i State Division of Aquatic Resources to estimate the USD value of living corals at the locations that will be impacted by the construction of the Olympic judging tower.

2. Materials and Methods

2.1. Citizens’ Science Education and Training

Twelve participants from the Teahupo’o community were provided with several phases of training. The community members were surfers, boat captains, fishers, voyagers, professional photographers, and members who are actively engaged in local conservation activities. Initially, they were provided with a brief technical overview (<30 min) regarding the basics of 3D photogrammetry techniques, including camera operation, survey approach (swim pattern, camera settings, image overlap, metadata collection), the placement of scale bars for orthorectification, and the process of rendering 3D reconstructions using Agisoft software (Metashape 2.1.0). Dry-land surveys were conducted (~1 h) so everyone could utilize the camera in the underwater housing and practice camera operation (e.g., white balance, image settings) and image acquisition. Three-dimensional reconstructions were rendered and shared with the group so they could see the outcome and products from this activity (~1 h). All participants conducted in situ surveys, and they were responsible for camera operation and collecting overlapping images on snorkel from all three study sites: the Tower Footings Plot, Lagoon Plot 1, and Lagoon Plot 2 (Figure 1). These sites were selected to survey the areas that will be impacted by the new judging tower construction (Tower Footings Plot) and the proposed dredging path to access the tower site (Lagoon Plots 1 and 2). The proposed path for the dredging is currently marked with a cable, and the tower construction is planned to remove and replace the existing tower footings. These features were used to determine the locations of the surveys to assess the reef habitat that will be affected by the proposed construction activities. Each participant conducted a survey at all three sites, but only one representative 3D reconstruction was used for the technical analyses of coral community composition for each survey plot.

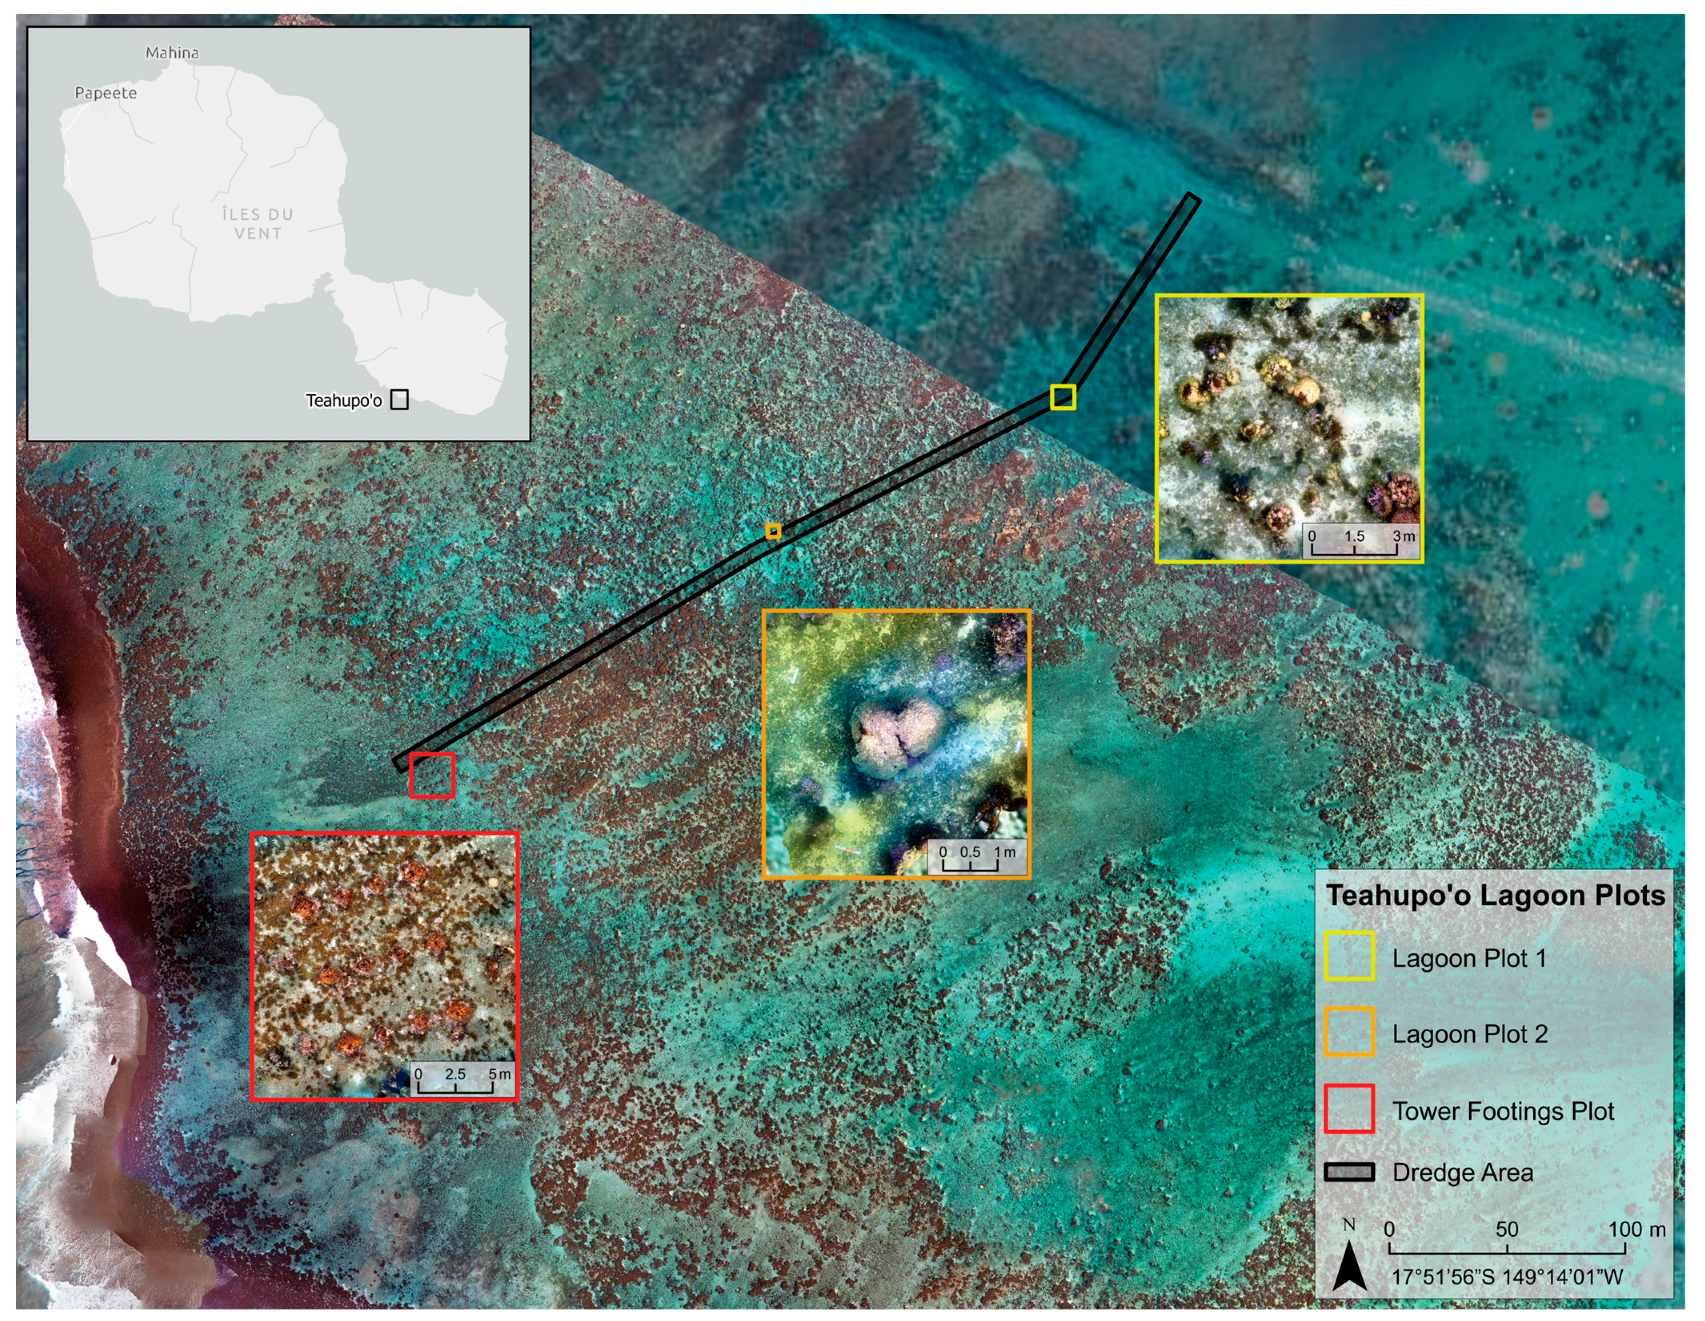
2.2. Three-Dimensional Photogrammetry Surveys

Three survey sites were selected to assess the coral community composition. Two sites were surveyed in the lagoon where a cable was laid to mark the planned path of dredging to the tower pilings. These sites encompass areas of 11 × 6 m and 4 × 4 m. A third site was surveyed at the tower pilings that encompasses the entire piling area, which is an area of 15 × 16 m. The 15 × 16 m area for the Tower Footings Plot was determined by surveying the reef area encompassing all twelve footings with a 2 m buffer around the border of the footings. The proposed footings for the new judging tower may cover a larger area due to the planned size of the new tower, but we used the existing footings to determine our plot area to generate data to examine the currently used tower location. The depth of all the survey areas was approximately 3 m. Overlapping images (70–80%) were collected from both planar and oblique angles of all survey areas. Images were acquired with a full-frame single-lens reflex camera (Sony a7rIII) equipped with a 24 mm lens while snorkeling above the survey sites in a “lawn mower” pattern. Scale bars with ground control points were placed at the corners of each plot for accurate scaling and orthorectification of the resulting 3D reconstructions. It took approximately 15 min to survey the Tower Footings Plot and approximately 5 min to survey each lagoon plot. Data were extracted from all three survey plots to statistically examine patterns in the coral assemblage structure.

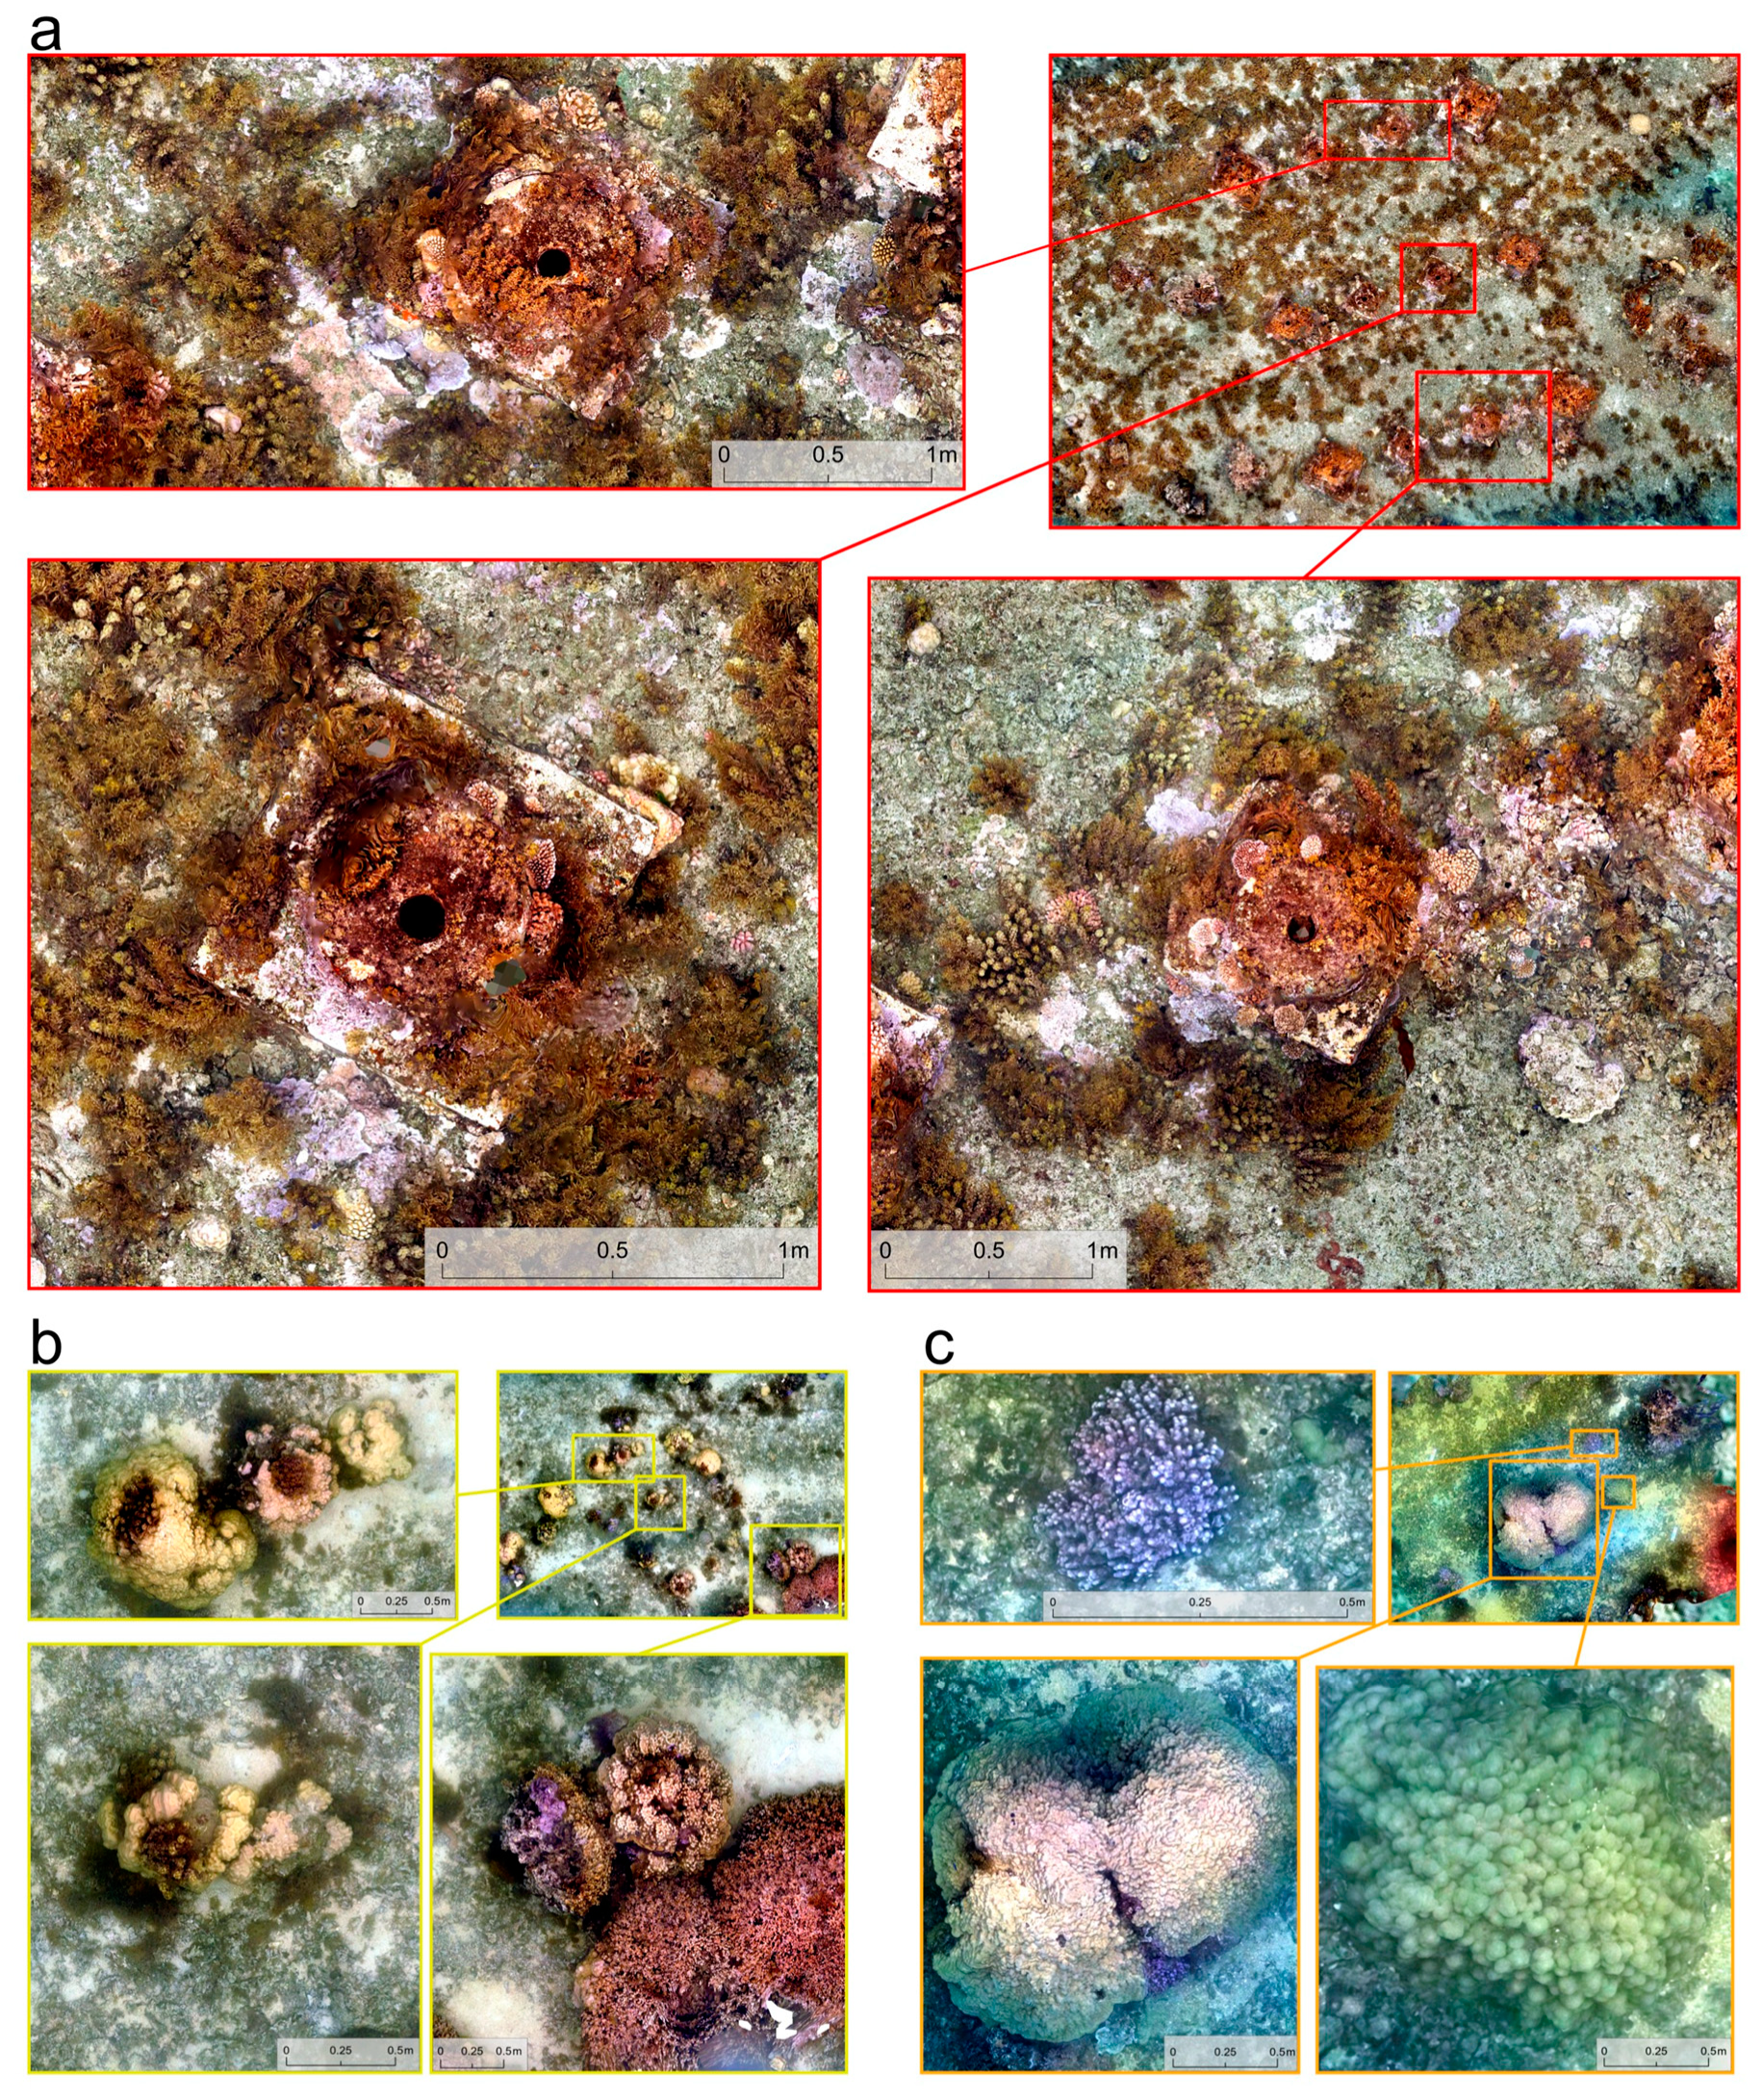
2.3. Three-Dimensional Reconstructions and Annotations

Three-dimensional reconstructions of the three survey plots were rendered using Metashape 2.1.0 Software (Agisoft LLC, St. Petersburg, Russia) following methods described in Burns et al. [15]. The SfM software (Metashape 2.1.0) employs scale-invariant feature transform algorithms to identify static objects (“key points”) automatically shared among a series of images, facilitating the creation of a system of geometrical projective matrices. This system determines the position and orientation of each camera by detecting overlapping key points. The software then reconstructs the 3D geometry on the 2D image plane using the extrinsic parameters derived from the photo alignment (including camera position and feature points), along with intrinsic parameters and the focal length of the camera obtained from the metadata of each image [29,30]. Through the processes of photo alignment and rectification, a 3D point cloud is generated, resulting from the projection and intersection of pixel rays originating from various positions and oriented images within a 3D space. To ensure precise spatial reconstruction at the sub-centimeter scale for the study sites, ground control points and scale markers were placed at the corners of the survey plots and used for orthorectification. The reconstructions were then used to generate high-resolution orthomosaic images that were subsequently integrated into geospatial software tools for annotating the orthomosaics, facilitating the quantification of coral composition. The number and size of coral colonies were manually annotated, and coral diversity, richness, and percentage of live coral cover and living benthos were calculated for all three survey plots. Benthic features were digitally annotated using CoralNet 1.0 software tools [31], and coral colonies were identified down to the species level. Coral diversity was calculated using the Shannon–Wiener diversity index (H′), and richness was calculated as the number of different species identified within each survey plot [32].

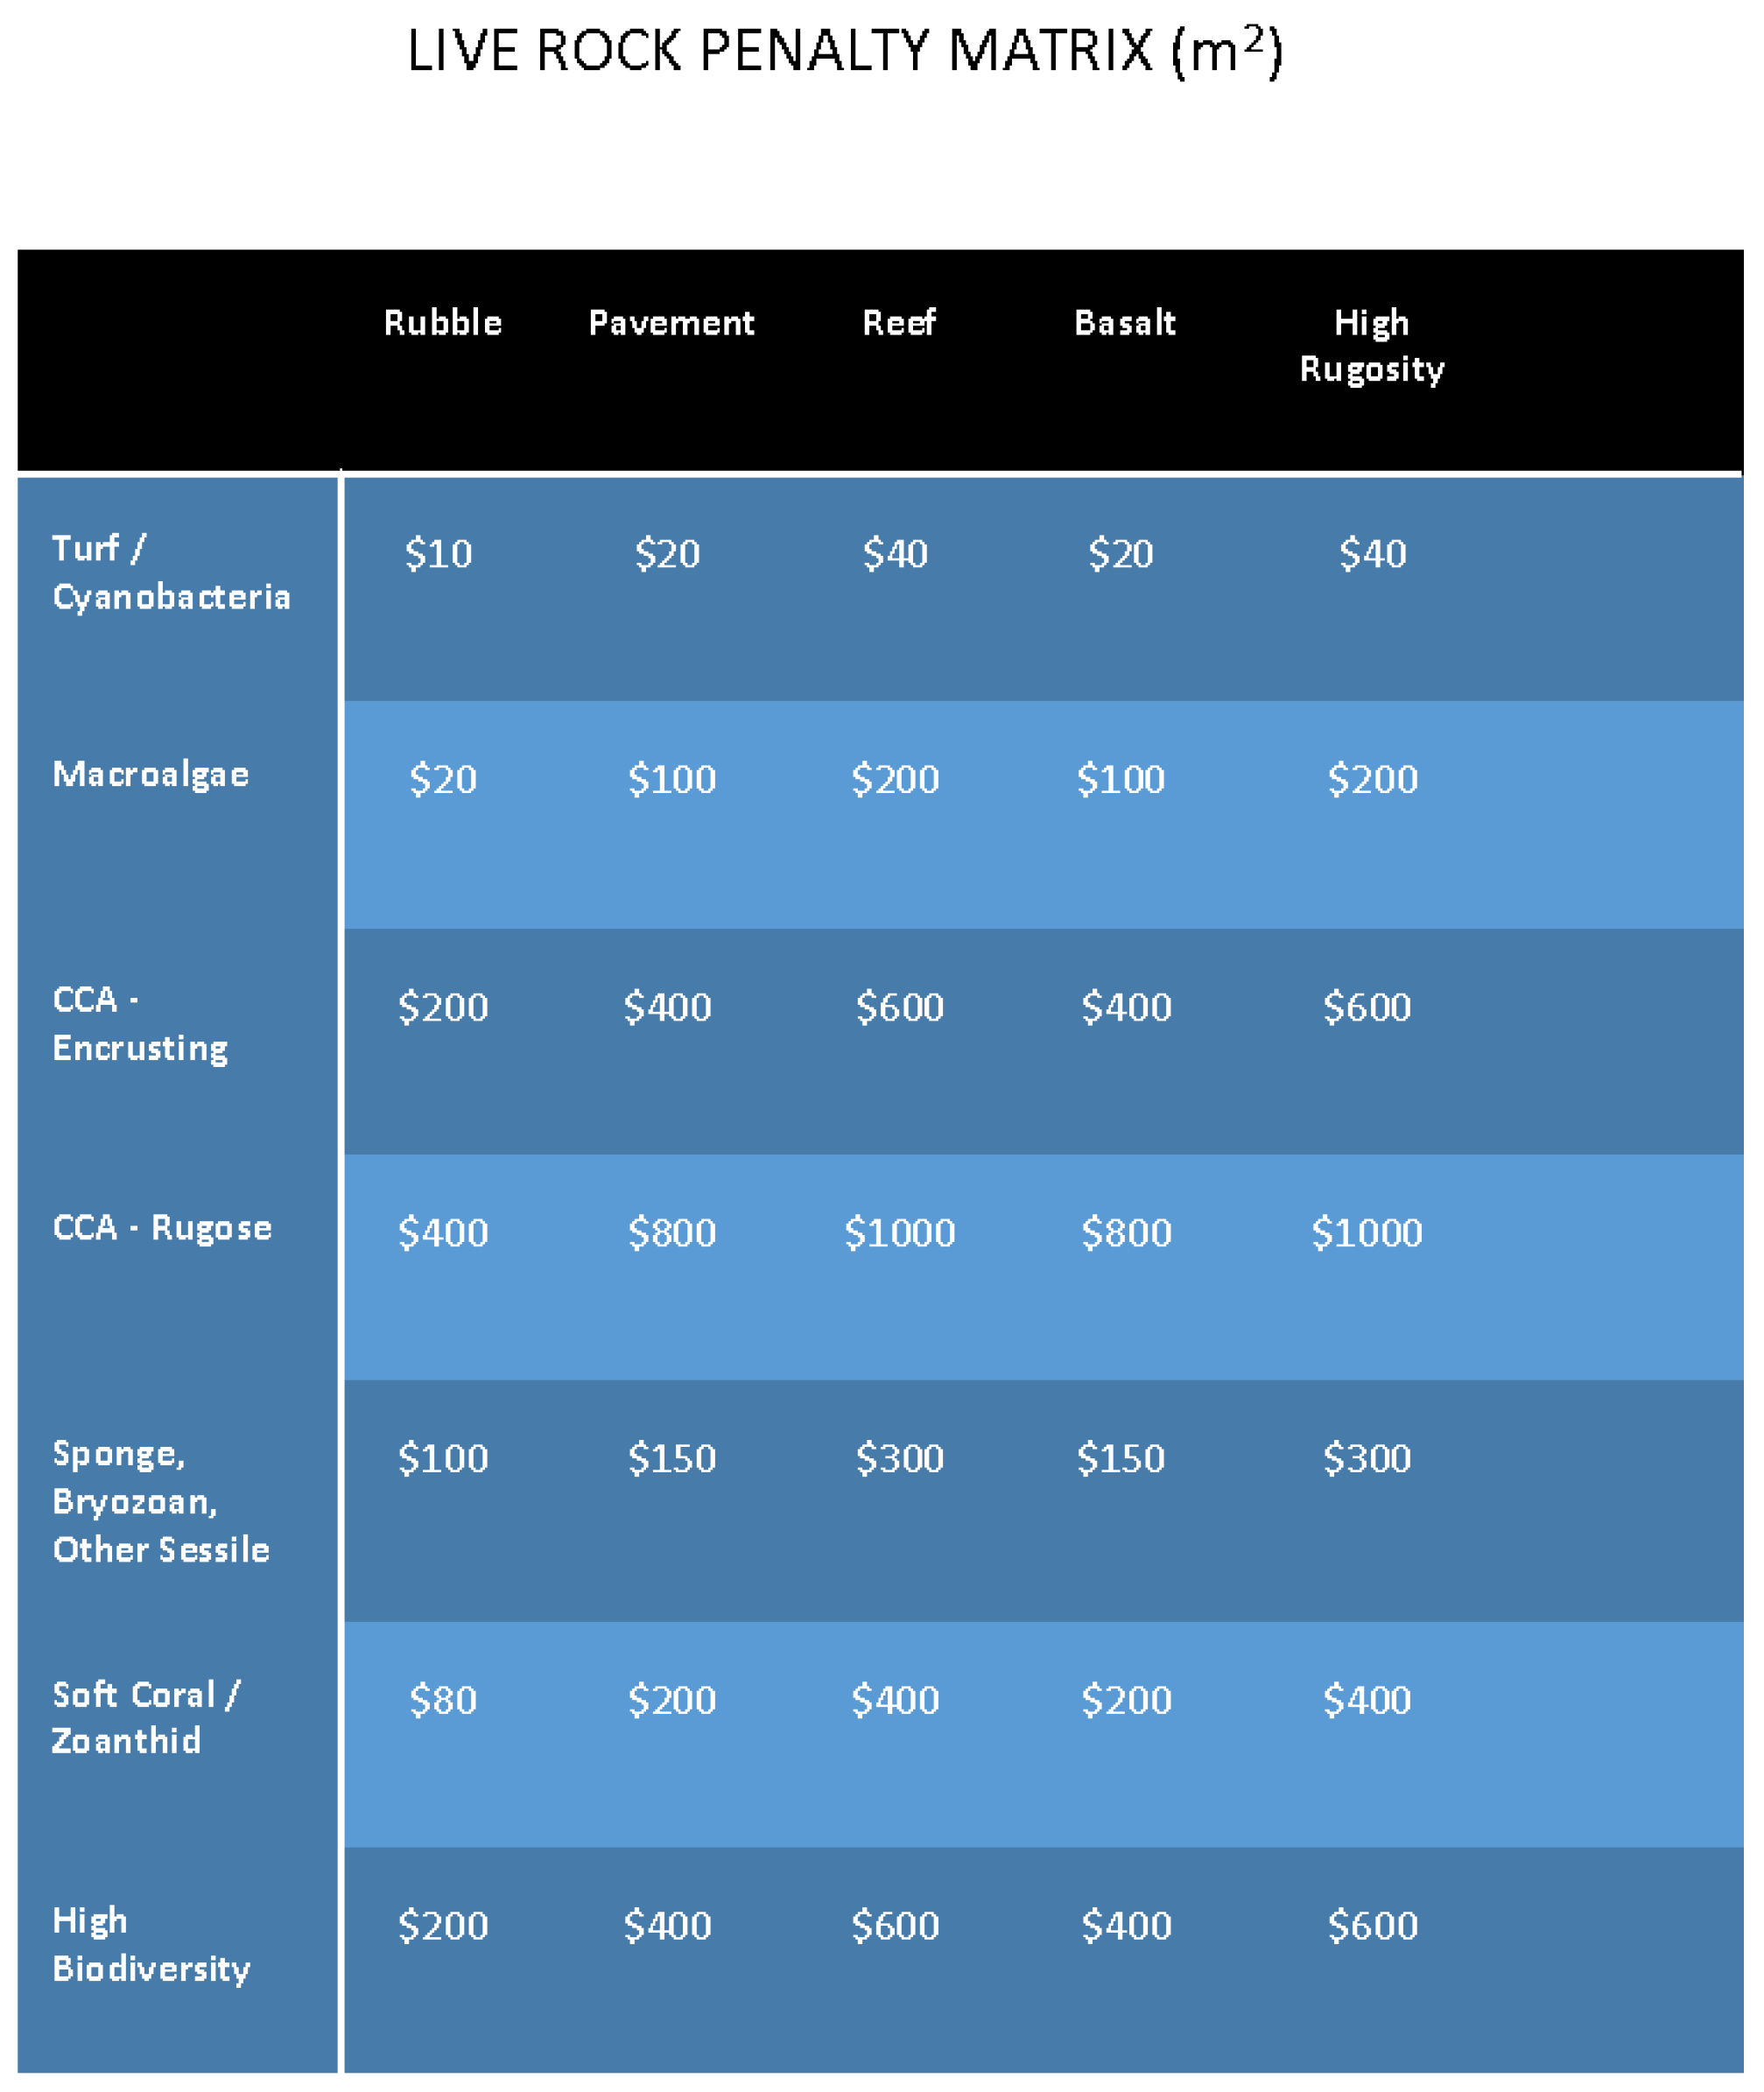
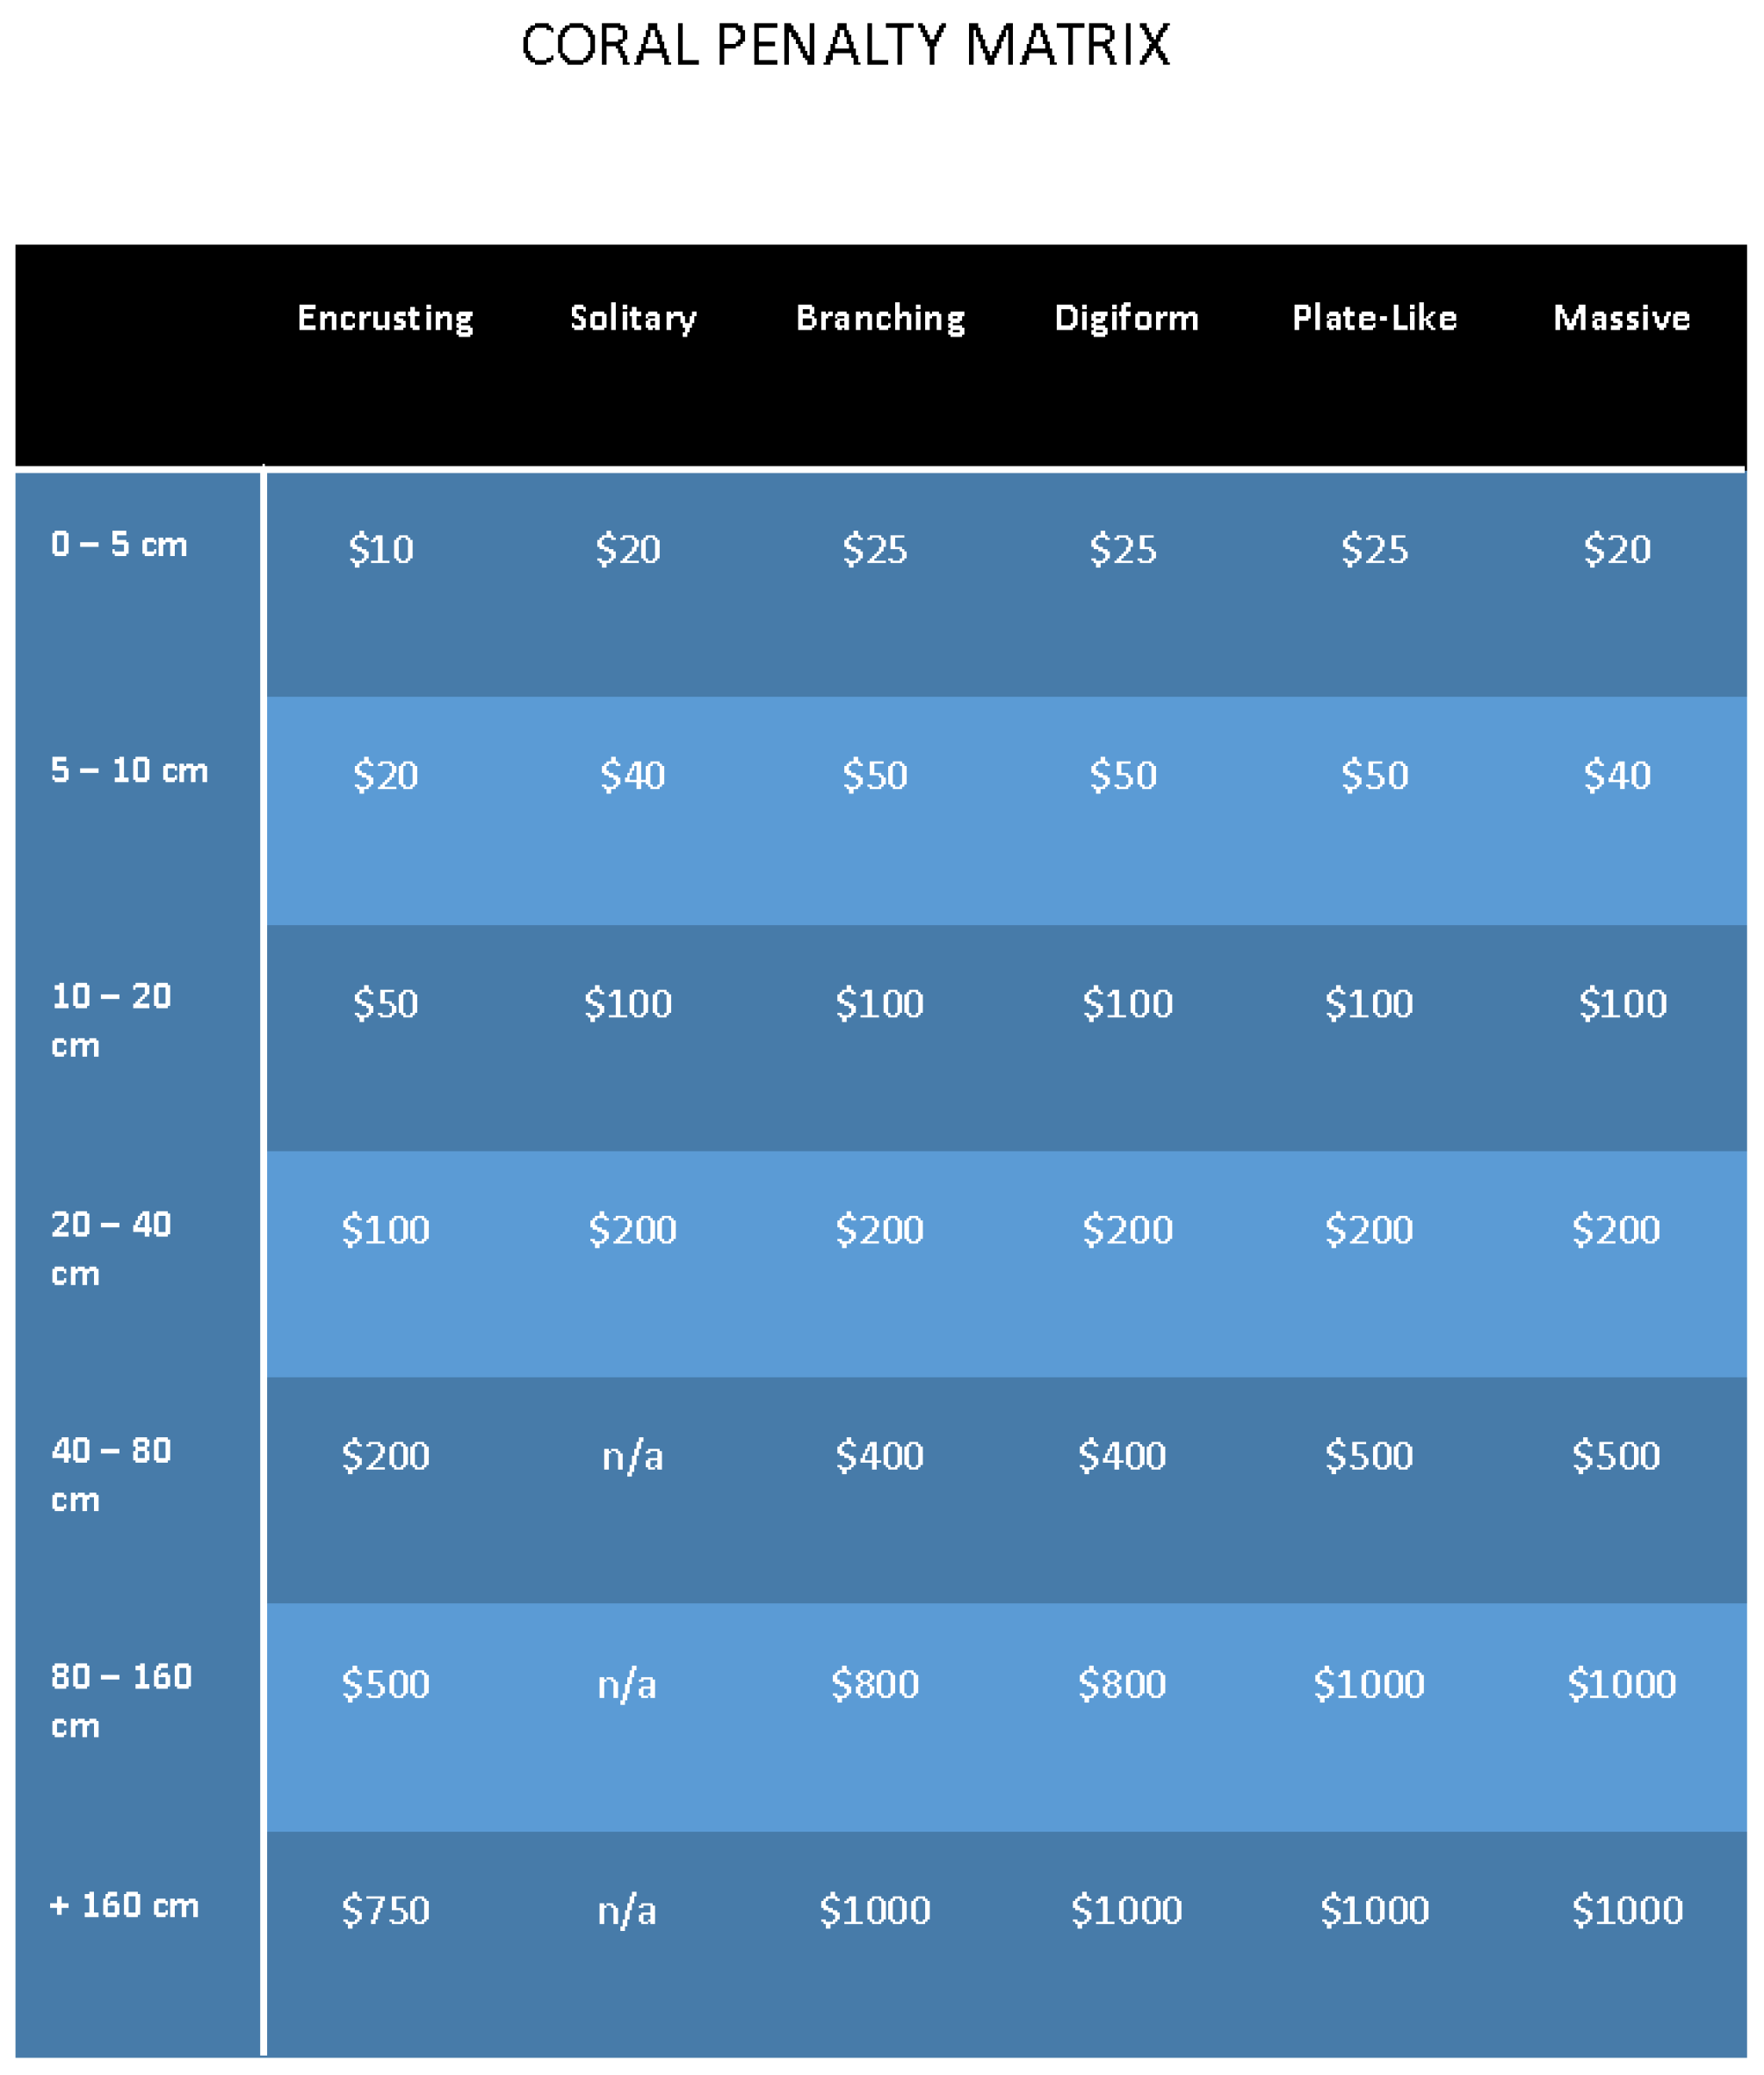
2.4. Valuation of the Living Benthos
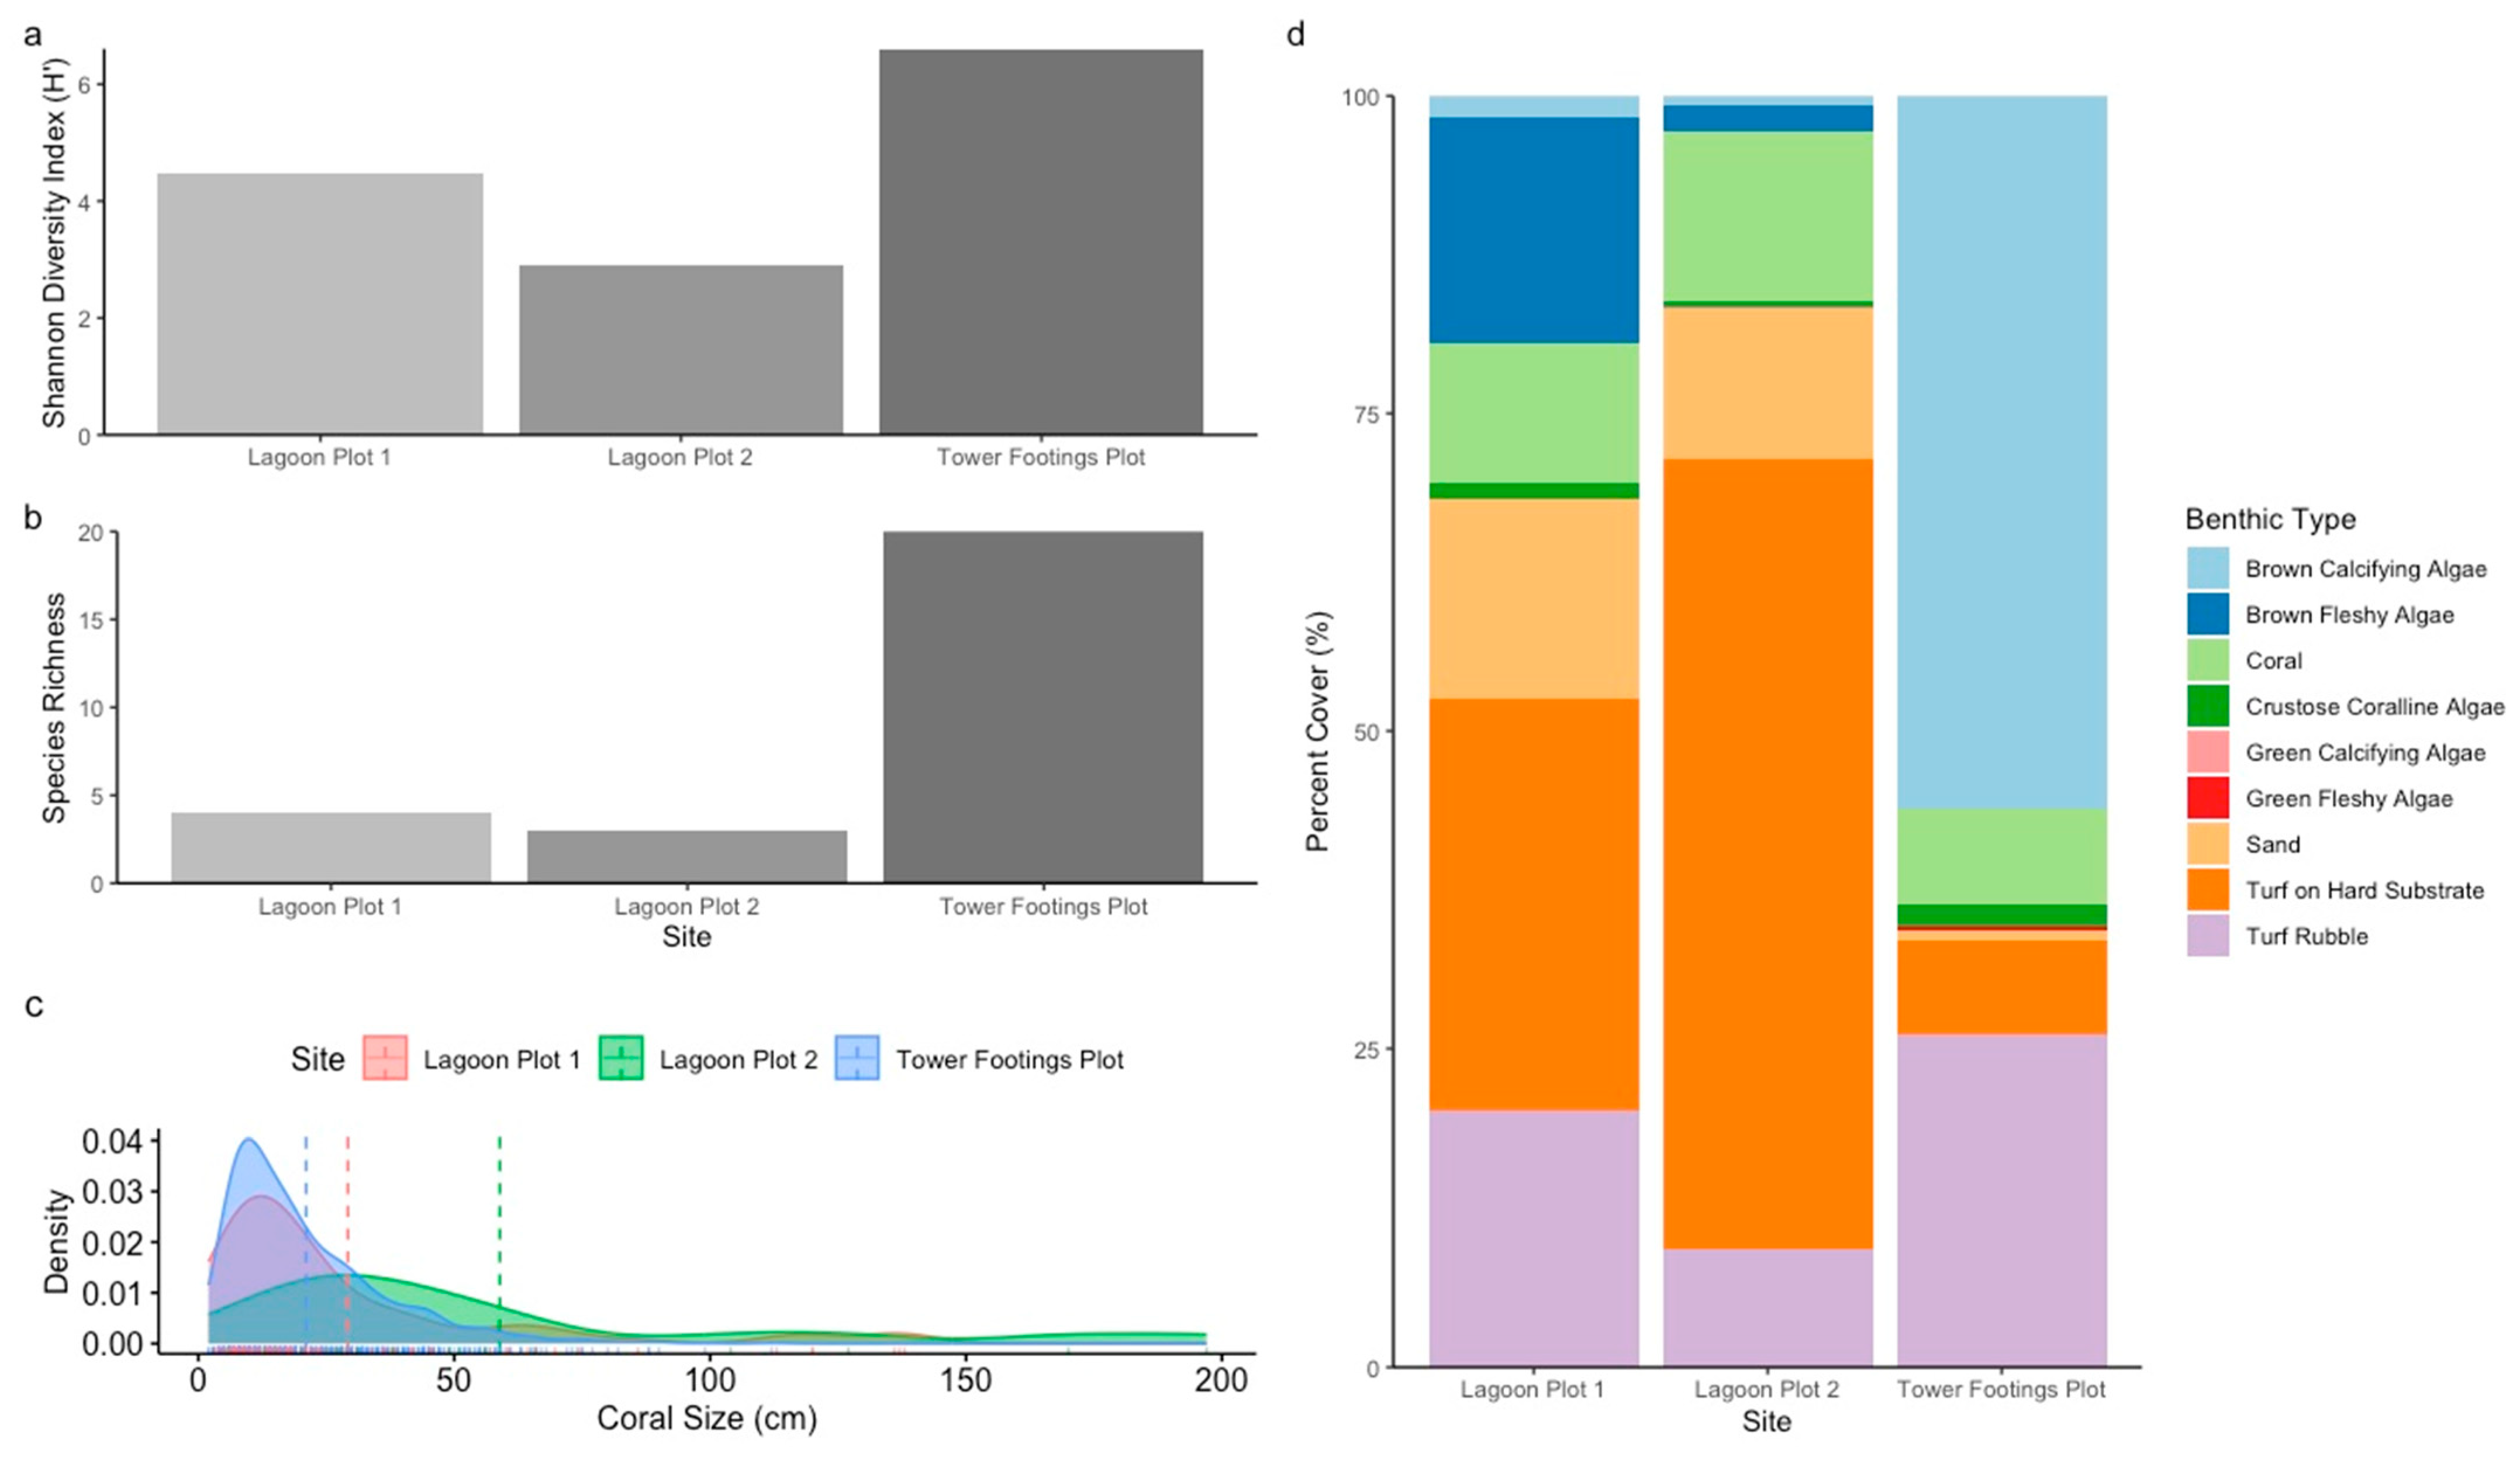
The coral penalty matrix used by the Hawai’i State Division of Aquatic Resources (values set through state law HRS 187A-12.5, ST1 and ST2) was applied to our data to determine an estimated value of the live coral and living benthos within the survey areas. We used the coral penalty matrix (Appendix A), which provides a U.S. dollar penalty for any damage to individual colonies based on morphology and size. Live rock categories (e.g., calcifying algae, macroalgae, turf algae on rubble, turf algae on rock) provide a penalty for damage occurring per m2. The percent cover data produced by the CoralNet analysis was computed using the survey mosaics to determine estimates of m2 area for each live rock category observed in our plots. Values for live coral and live rock were totaled for each survey plot.

3. Results

The survey sites used for the study were Lagoon Plot 1 (66 m2), Lagoon Plot 2 (16 m2), and the Tower Footings Plot (240 m2). The surveys were conducted in three different spatial areas to facilitate community training and to ensure the entire scaffolding location of the judging tower was investigated. One hundred percent of all images were aligned and rendered for the 3D reconstructions at all three sites (Figure 1). Ground sampling distance (GSD) values (resolution/pixel) for the 3D reconstructions generated for this study were 0.406 m/pix for the Tower Footings Plot, 0.554 m/pix for Lagoon Plot 1, and 0.475 m/pix for Lagoon Plot 2. Root mean standard error (RSME) values for ground control points were 0.00462 m for the Tower Footings Plot, 0.0004767 m for Lagoon Plot 1, and 0.000642 m for Lagoon Plot 2. Collectively, 1003 coral colonies were identified from these sites, with 898 coral colonies identified at the Tower Footings Plot, 87 at Lagoon Plot 1, and 18 at Lagoon Plot 2 (Table 1).
The highest value of species richness was observed at the Tower Footings location. Twenty species were identified from genera including Acropora, Hydrophora, Leptastrea, Montipora, Palythoa, Pocillpora, Porites, and Psammocora (Table 1, Figure 2b). Conversely, only Porites and Montipora species were present at both lagoon sites. The Shannon–Wiener diversity index (H′) value at the Tower Footings Plot, Lagoon Plot 1, and Lagoon Plot 2 exhibited values of 6.60, 4.46, and 2.89, respectively (Figure 2a).
The Tower Footings Plot analysis showed an average coral colony size of 21.05 cm (±SD 15.60), with a minimum size of 2.00 cm and a maximum size of 112 cm (Figure 2c). Lagoon Plot 1 showed an average size of 29.22 cm (±SD 32.33), with a minimum size of 3.38 cm and a maximum size of 138 cm (Figure 2c). Lagoon Plot 2 showed an average size of 58.92 cm (±SD 55.02), with a minimum size of 5.50 cm and a maximum size of 197 cm (Figure 2c).
The results from the CoralNet analysis of percent benthic cover found that the Tower Footings site is composed of 48.32% brown calcifying algae, 7.43% coral, 2.14% crustose coralline algae, 1.42% fleshy green algae, 0.51% sand, 11.19% turf algae on hard substrate, and 28.99% turf algae on rubble (Table 1, Figure 2d). Lagoon Plot 1 featured 1.90% brown calcifying algae, 17.63% brown fleshy algae, 8.51% coral, 1.20% crustose coralline algae, 14.31% sand, 36.74% turf algae on hard substrate, and 20.02% turf algae on rubble (Table 1, Figure 2d). Lastly, Lagoon Plot 2 exhibited 3.13% brown calcifying algae, 3.67% brown fleshy algae, 15.66% coral, 1.08% crustose coralline algae, 0.32% green calcifying algae, 13.83% sand, 51.40% turf algae on hard substrate, and 10.91% turf algae on rubble (Table 1, Figure 2d).
Estimated valuations of the living benthos at each site were determined by using the penalty matrix of the Hawai’i State Division of Aquatic Resources (Appendix A). The penalties for live coral are based on individual colonies and are dependent on species and colony size. The results from our survey at the Tower Footings Plot yielded a coral penalty value of USD 113,760. The living benthic categories (e.g., calcifying algae on rock, macroalgae on rock, turf algae on rubble, etc.) are based on m2 area values. Our percent cover data were used to quantify a penalty value for all other recorded living benthos of USD 28,724.31, resulting in a total value of USD 142,484.61 for the Tower Footings Plot (Table 2). The coral penalty value for Lagoon Plot 1 was USD 18,380.00, with a living benthos penalty value of USD 4114.59, contributing to a total value of USD 22,494.59 (Table 2). The coral penalty value for Lagoon Plot 2 was USD 7440.00, with a living benthos penalty value of USD 678.19, totaling USD 8118.19 (Table 2). Considering that the entire surveyed area for this study was 332 m2, the total penalty value if these three survey areas are damaged would be USD 139,580 for living coral and USD 33,517.09 for living benthos, resulting in a grand total of USD 173,097.09.
To obtain perspective on the potential damage of constructing the judging tower, a dredging path area was calculated using the geospatial software ArcMap v.10.8 (ArcGIS 10.8, Environmental Systems Resource Institute, Redlands, CA, USA). This area was determined based on a cable placed by engineers at the site where Lagoon Plot 1 and Lagoon Plot 2 were located (Figure 1). In addition to the dredging path, an impact area was also calculated for the Tower Footings location (Figure 1). The estimated area for the total potential impact caused by dredging through the lagoon and construction at the Tower Footings Plot was 2500 m2. Extrapolating our valuations from our surveyed area of 322 m2, the economic impact if the 2500 m2 area is impacted by these development activities would total USD 1,343,922.

4. Discussion

This study showcases the high value of 3D photogrammetry for rapid assessment of reef ecology and citizen science applications by providing a highly technical tool that requires minimal training for extracting valuable ecological data from underwater habitats. The data derived from analyzing the orthomosaics produced from the 3D reconstructions indicate that the reef habitats at the proposed tower location as well as the lagoon study sites support diverse coral communities (Figure 1, Figure 2 and Figure 3). The Tower Footings site exhibited the highest diversity and number of corals, while the Lagoon sites hosted larger mounding coral colonies (Figure 2 and Figure 3). Collectively, this rapid assessment clearly documents that these sites support healthy and diverse coral communities.
It is important to carefully evaluate any development that may disturb living coral habitat due to corals’ critical role in supporting key ecosystem functions on coral reefs [6,8,12,33]. In this case, the Tower Footings site is the most vulnerable to degradation as the existing concrete footings would be removed to install a new foundation for the proposed tower. The data extracted from the Tower Footings location indicate that this site supports an impressive diversity, with a total of 20 observed coral species (Figure 2). This may be due to the nature of the concrete substrate, which supports high levels of coral growth [19]. The existing concrete pilings have likely stimulated the growth of taxonomically and morphologically diverse corals, which now contribute to the ecology of this reef ecosystem (Figure 3). If these footings are disturbed, it is likely to have detrimental effects on the live coral and associated reef organisms (e.g., fish and invertebrates) at this location.
The values of coral cover ranged from 7.43% at the Tower Footings Plot to 15.66% at Lagoon Plot 2 (Figure 2, Table 1). The high coral cover observed at the Lagoon Plots is likely due to the large mounding Porites corals observed at these locations. In addition to live coral, several species of calcifying algae were observed at each study site (Figure 2, Table 1). It is important to note that calcifying algae also play an important ecological role on coral reefs by cementing the substrate and supporting the settlement and growth of coral [34,35]. Removing hard substrate via dredging and construction would directly impact ecologically important coral and calcifying organisms and would likely have additional harmful impacts on the surrounding reef ecosystem by affecting turbidity and habitat for fish and other reef organisms. For example, previous studies have documented increased sedimentation from dredging projects resulting in decreased coral cover and diversity [36], burial [37], and increased prevalence of disease [38,39]. Furthermore, secondary impacts are not isolated to areas directly dredged but may extend beyond 0.5 km [36,37].
Applying the “Penalty Matrix” valuation system used by the Hawai’i State Division of Aquatic Resources enabled us to provide estimates of the current economic value of the coral reef study sites that the construction of the Olympic judging tower will destroy. Quantifying values based on the number and size of live coral colonies, as well as the m2 area of various algae species and live rock, indicates that the economic value of the three survey areas (322 m2) totals USD 173,097.09. The total economic impact of the project could amount to USD 1,343,922. This value was found by extrapolating the three surveyed values to the potential area of 2500 m2 that may be impacted by dredging and tower construction (Figure 1). We take caution with this estimate as the habitat is likely to vary throughout the reef lagoon, but it is helpful to consider when weighing the consequences of this proposed construction. There is utility in conducting this analysis, as recent research has highlighted how governments and management agencies must consider the economic value of coral reefs, as these systems are threatened by climate change [8,9,10,40]. However, it is also important to note that this approach only captures a capitalistic valuation of the live corals and cannot address how this development may alter the reef ecology on a larger scale at Teahupo’o. While the monetary values help to illustrate the high economic value at stake in this scenario, they cannot capture the impact on local sustenance and cultural value, which one could argue are priceless. Coral reefs in many coastal and island communities like Teahupo’o, Tahiti are inherently tied to the social norms, lifestyle, and identity of their people [10,11].

5. Conclusions

Beyond the data collected by this project, it is impressive how rapidly the participating community members were able to learn 3D photogrammetry techniques and apply these tools to rapidly assess the ecology of this reef system. All survey data used to assess coral diversity and composition were collected by community members. The ecological sciences have a well-established tradition of citizen science, making noteworthy contributions to science, education, and society [27,41]. While multiple studies have utilized citizen science to support coral reef ecology and conservation [42], this approach can be improved by integrating high-resolution remote-sensing tools such as 3D photogrammetry. We believe this particular technique has the potential to be rapidly adopted by citizen science initiatives and will be increasingly more feasible as the costs and computing requirements to use this approach continue to decline [7,15,16]. We hope this study highlights the value of conducting science with purpose and that more scientists will try to engage and equip interested communities with analytical tools that can empower them to protect and preserve the local environments they depend on.

Author Contributions

Conceptualization, J.H.R.B., C.K., H.H.K., C.O. and K.H.P.; methodology, J.H.R.B., C.K., H.H.K., C.O. and K.H.P.; formal analysis, K.H.P., J.W.P.N.III, M.P., S.R.P., R.E.S., K.A.G., M.C., A.H., L.V., B.K.N., K.S. and J.H.R.B.; resources, J.H.R.B., H.H.K. and C.K.; data curation, K.H.P.; writing—original draft preparation, J.H.R.B. and K.H.P.; writing—review and editing, J.H.R.B., K.H.P., H.H.K. and C.K.; project administration, J.H.R.B., H.H.K., K.H.P. and C.K. All authors have read and agreed to the published version of the manuscript.

Funding

Student time analyzing the orthomosaics was supported by the National Science Foundation Award No. 2149133, RII Track-1: Change Hawai’i: Harnessing the Data Revolution for Island Resilience and by the National Aeronautics and Space Administration Award No. 80NSSC21K1656: Quantifying vulnerability to sea level rise across multiple coastal typologies.

Data Availability Statement

Data can be made available upon request. The data will not publicly available until the funding awards are completed and data are archived in public repositories.

Acknowledgments

We thank Shea Perkins and REEF Footwear for their support of our scientific efforts. We thank all members of the Vai Ara O Teahupo’o organization for the participation and support of this project. We also thank the Faafaite Tahitian Voyaging Society for their support of this project.

Conflicts of Interest

The authors declare no conflicts of interest.

Appendix A

Figure A1. Hawai’i Division of Aquatic Resources Coral Penalty Matrix (Hawai’i State law HRS 187A-12.5). Values are shown in U.S. dollar amounts per coral.
Remotesensing 16 00853 g0a1
Figure A2. Hawai’i Division of Aquatic Resources Live Rock Penalty Matrix (Hawai’i State law HRS 187A-12.5). Values are shown in U.S. dollar amounts per m2 area.
Remotesensing 16 00853 g0a2

References

  1. Muscatine, L.; Porter, J.W. Reef corals: Mutualistic symbioses adapted to nutrient-poor environments. Bioscience 1977, 27, 454–460. [Google Scholar] [CrossRef]
  2. Weis, V.M.; Davy, S.K.; Hoegh-Guldberg, O.; Rodriguez-Lanetty, M.; Pringle, J.R. Cell biology in model systems as the key to understanding corals. Trends Ecol. Evol. 2008, 23, 369–376. [Google Scholar] [CrossRef] [PubMed]
  3. Reaka-Kudla, M. The global biodiversity of coral reefs: A comparison with rain forests. In Biodiversity II: Understanding and Protecting our Biological Resources; Reaka-Kudla, M., Wilson, D.E., Wilson, E.O., Eds.; Joseph Henry Press: Washington, DC, USA, 1997; pp. 83–108. [Google Scholar]
  4. Knowlton, N.; Brainard, R.E.; Fisher, R.; Moews, M.; Plaisance, L.; Caley, M.J. Coral reef biodiversity. In Life in the World’s Ocean: Diversity, Distribution, and Abundance; McIntyre, A., Ed.; Wiley-Blackwell: Oxford, UK, 2010; pp. 65–78. [Google Scholar] [CrossRef]
  5. Costanza, R.; d’Arge, R.; de Groot, R.; Farber, S.; Grasso, M.; Hannon, B.; Limburg, K.; Naeem, S.; O’Neill, R.V.; Paruelo, J.; et al. The value of the world’s ecosystem services and natural capital. Nature 1997, 387, 253–260. [Google Scholar] [CrossRef]
  6. Hoegh-Guldberg, O. Climate change, coral bleaching and the future of the world’s coral reefs. Mar. Freshw. Res. 1999, 50, 839–866. [Google Scholar] [CrossRef]
  7. Obura, D.O.; Aeby, G.; Amornthammarong, N.; Appeltans, W.; Bax, N.; Bishop, J.; Brainard, R.E.; Chan, S.; Fletcher, P.; Gordon, T.A.; et al. Coral reef monitoring, reef assessment technologies, and ecosystem-based management. Front. Mar. Sci. 2019, 6, 580. [Google Scholar] [CrossRef]
  8. Hoegh-Guldberg, O. Reviving the Ocean Economy: The Case for Action—2015; WWF International: Gland, Switzerland, 2015; p. 60. [Google Scholar]
  9. Hatcher, B.G.; Hatcher, G.H. Question of mutual security: Exploring interactions between the health of coral reef ecosystems and coastal communities. EcoHealth 2004, 1, 229–235. [Google Scholar] [CrossRef]
  10. Cinner, J. Coral reef livelihoods. Curr. Opin. Environ. Sustain. 2014, 7, 65–71. [Google Scholar] [CrossRef]
  11. Gregg, T.M.; Mead, L.; Burns, J.H.R.; Takabayashi, M. Puka mai he ko ‘a: The significance of corals in Hawaiian culture. In Ethnobiology of Corals and Coral Reefs; Narchi, N., Price, L., Eds.; Springer: Cham, Switzerland, 2015; pp. 103–115. [Google Scholar]
  12. Harvell, D.; Jordán-Dahlgren, E.; Merkel, S.; Rosenberg, E.; Raymundo, L.; Smith, G.; Weil, E.; Weil, B.L. Coral disease, environmental drivers, and the balance between coral and microbial associates. Oceanography 2007, 20, 172–195. [Google Scholar] [CrossRef]
  13. Burns, J.H.R.; Weyenberg, G.; Mandel, T.; Ferreira, S.B.; Gotshalk, D.; Kinoshita, C.K.; Marshall, M.J.; Del Moral, N.A.V.; Murphy, S.J.; Pascoe, K.H.; et al. A Comparison of the Diagnostic Accuracy of in-situ and Digital Image-Based Assessments of Coral Health and Disease. Front. Mar. Sci. 2020, 7, 304. [Google Scholar] [CrossRef]
  14. Ward, J.R.; Kim, K.; Harvell, C.D. Temperature affects coral disease resistance and pathogen growth. Mar. Ecol. Prog. Ser. 2007, 329, 115–121. [Google Scholar] [CrossRef]
  15. Burns, J.H.R.; Delparte, D.; Gates, R.D.; Takabayashi, M. Integrating structure-from-motion photogrammetry with geospatial software as a novel technique for quantifying 3D ecological characteristics of coral reefs. PeerJ 2015, 3, e1077. [Google Scholar] [CrossRef]
  16. Ferrari, R.; McKinnon, D.; He, H.; Smith, R.N.; Corke, P.; González-Rivero, M.; Mumby, P.J.; Upcroft, B. Quantifying multiscale habitat structural complexity: A cost-effective framework for underwater 3D modelling. Remote Sens. 2016, 8, 113. [Google Scholar] [CrossRef]
  17. Fukunaga, A.; Kosaki, R.K.; Pascoe, K.H.; Burns, J.H.R. Fish Assemblage Structure in the Northwestern Hawaiian Islands Is Associated with the Architectural Complexity of Coral-Reef Habitats. Diversity 2020, 12, 430. [Google Scholar] [CrossRef]
  18. Pascoe, K.H.; Fukunaga, A.; Kosaki, R.K.; Burns, J.H.R. 3D assessment of a coral reef at Lalo Atoll reveals varying responses of habitat metrics following a catastrophic hurricane. Sci. Rep. 2021, 11, 12050. [Google Scholar] [CrossRef] [PubMed]
  19. Burns, J.H.R.; Pascoe, K.H.; Ferreira, S.B.; Kane, H.; Kapono, C.A.; Carrell, T.L.; Reyes, A.; Fukunaga, A. How Do Underwater Cultural Heritage Sites Affect Coral Assemblages? Remote Sens. 2023, 15, 2130. [Google Scholar] [CrossRef]
  20. Ferreira, S.B.; Burns, J.H.R.; Pascoe, K.H.; Kapono, C.A.; Reyes, A.J.; Fukunaga, A. Prediction of habitat complexity using a trait-based approach on coral reefs in Guam. Sci. Rep. 2023, 13, 11095. [Google Scholar] [CrossRef]
  21. Javernick, L.; Brasington, J.; Caruso, B. Modeling the topography of shallow braided rivers using structure-from-motion photogrammetry. Geomorphology 2014, 213, 166–182. [Google Scholar] [CrossRef]
  22. Figueira, W.; Ferrari, R.; Weatherby, E.; Porter, A.; Hawes, S.; Byrne, M. Accuracy and precision of habitat structural complexity metrics derived from underwater photogrammetry. Remote Sens. 2015, 7, 16883–16900. [Google Scholar] [CrossRef]
  23. Fukunaga, A.; Burns, J.H.R. Metrics of Coral Reef Structural Complexity Extracted from 3D Mesh Models and Digital Elevation Models. Remote Sens. 2020, 12, 2676. [Google Scholar] [CrossRef]
  24. Theobald, E.J.; Ettinger, A.; Burgess, H.; DeBey, L.; Schmidt, N.; Froehlich, H.; Wagner, C.; HilleRisLambers, J.; Tewksbury, J.; Harsch, M.A.; et al. Global change and local solutions: Tapping the unrealized potential of citizen science for biodiversity research. Biol. Conserv. 2015, 181, 236–244. [Google Scholar] [CrossRef]
  25. Bonney, R.; Phillips, T.B.; Ballard, H.L.; Enck, J.W. Can citizen science enhance public understanding of science? Public Underst. Sci. 2016, 25, 2–16. [Google Scholar] [CrossRef] [PubMed]
  26. Kapono, C.A.; Burns, J.H.R.; Kane, H.H. Branding the MEGA Lab; methods that support science communication and citizen science engagement. Front. Environ. Sci. 2023, 11, 1208683. [Google Scholar] [CrossRef]
  27. Pocock, M.J.O.; Tweddle, J.C.; Savage, J.; Robinson, L.D.; Roy, H.E. The diversity and evolution of ecological and environmental citizen science. PLoS ONE 2017, 12, e0172579. [Google Scholar] [CrossRef] [PubMed]
  28. Tauginienė, L.; Butkevičienė, E.; Vohland, K.; Heinisch, B.; Daskolia, M.; Suškevičs, M.; Portela, M.; Balázs, B.; Prūse, B. Citizen science in the social sciences and humanities: The power of interdisciplinarity. Palgrave Commun. 2020, 6, 89. [Google Scholar] [CrossRef]
  29. Verhoeven, G. Getting computer vision airborne: Using structure from motion for accurate orthophoto production. In Proceedings of the RSPSoc Archaeology Special Interest Group Meeting, Greenwich, UK, 12–14 September 2012; pp. 4–6. [Google Scholar]
  30. Westoby, M.J.; Brasington, J.; Glasser, N.F.; Hambrey, M.J.; Reynolds, J.M. ‘Structure-from-Motion’photogrammetry: A low-cost, effective tool for geoscience applications. Geomorphology 2012, 179, 300–314. [Google Scholar] [CrossRef]
  31. Beijbom, O.; Edmunds, P.J.; Roelfsema, C.; Smith, J.; Kline, D.I.; Neal, B.P.; Dunlap, M.J.; Moriarty, V.; Fan, T.-Y.; Tan, C.-J.; et al. Towards automated annotation of benthic survey images: Variability of human experts and operational modes of automation. PLoS ONE 2015, 10, e0130312. [Google Scholar] [CrossRef]
  32. Shannon, C.E.; Weaver, W. The Mathematical Theory of Communication; University of Illinois Press: Urbana, IL, USA, 1949. [Google Scholar]
  33. Richardson, L.E.; Graham, N.A.; Hoey, A.S. Coral species composition drives key ecosystem function on coral reefs. Proc. R. Soc. B 2020, 287, 20192214. [Google Scholar] [CrossRef]
  34. Goreau, T.F. Calcium carbonate deposition by coralline algae and corals in relation to their roles as reef-builders. Ann. N. Y. Acad. Sci. 1963, 109, 127–167. [Google Scholar] [CrossRef]
  35. Nelson, W.A. Calcified macroalgae–critical to coastal ecosystems and vulnerable to change: A review. Mar. Freshw. Res. 2009, 60, 787–801. [Google Scholar] [CrossRef]
  36. Brown, B.E.; Le Tissier, M.D.A.; Scoffin, T.P.; Tudhope, A.W. Evaluation of the environmental impact of dredging on intertidal coral reefs at Ko Phuket, Thailand, using ecological and physiological parameters. Mar. Ecol. Prog. Ser. 1990, 65, 273–281. [Google Scholar] [CrossRef]
  37. Cunning, R.; Silverstein, R.N.; Barnes, B.B.; Baker, A.C. Extensive coral mortality and critical habitat loss following dredging and their association with remotely-sensed sediment plumes. Mar. Pollut. Bull. 2019, 145, 185–199. [Google Scholar] [CrossRef]
  38. Gintert, B.E.; Precht, W.F.; Fura, R.; Rogers, K.; Rice, M.; Precht, L.L.; D’Alessandro, M.; Croop, J.; Vilmar, C.; Robbart, M.L. Regional coral disease outbreak overwhelms impacts from a local dredge project. Environ. Monit. Assess. 2019, 191, 630. [Google Scholar] [CrossRef]
  39. Pollock, F.J.; Lamb, J.B.; Field, S.N.; Heron, S.F.; Schaffelke, B.; Shedrawi, G.; Bourne, D.G.; Willis, B.L. Sediment and turbidity associated with offshore dredging increase coral disease prevalence on nearby reefs. PLoS ONE 2014, 9, e102498. [Google Scholar] [CrossRef] [PubMed]
  40. Fezzi, C.; Ford, D.J.; Oleson, K.L. The economic value of coral reefs: Climate change impacts and spatial targeting of restoration measures. Ecol. Econ. 2023, 203, 107628. [Google Scholar] [CrossRef]
  41. Kobori, H.; Dickinson, J.L.; Washitani, I.; Sakurai, R.; Amano, T.; Komatsu, N.; Kitamura, W.; Takagawa, S.; Koyama, K.; Ogawara, T.; et al. Citizen science: A new approach to advance ecology, education, and conservation. Ecol. Res. 2016, 31, 1–19. [Google Scholar] [CrossRef]
  42. Branchini, S.; Pensa, F.; Neri, P.; Tonucci, B.M.; Mattielli, L.; Collavo, A.; Sillingardi, M.E.; Piccinetti, C.; Zaccanti, F.; Goffredo, S. Using a citizen science program to monitor coral reef biodiversity through space and time. Biodivers. Conserv. 2015, 24, 319. [Google Scholar] [CrossRef]
Figure 1. Imagery and orthophotos of the Teahupo’o Lagoon and the three study site locations: Tower Footings Plot, Lagoon Plot 1, and Lagoon Plot 2. The inset orthophotos were generated by the community-based surveys and the larger lagoon orthophoto was rendered from UAV imagery. The proposed dredge area is a 6 m wide path from shore to the tower footings, highlighted by the grey rectangle.
Remotesensing 16 00853 g001
Figure 2. Summary statistics detailing coral community characteristics and the percentage of benthic cover among all three survey sites. (a) Shannon–Wiener diversity index (H′) at each site, (b) species richness (count) at each site, (c) coral colony size (dashed lines represent mean values) at each site, and (d) percentage cover of various benthic types identified at each site.
Remotesensing 16 00853 g002
Figure 3. Orthomosaic images of the study plots and individual coral colonies (inset images) at various spatial resolutions rendered from the 3D reconstructions at (a) the Tower Footings Plot, (b) Lagoon Plot 1, and (c) Lagoon Plot 2.
Remotesensing 16 00853 g003
Table 1. Benthic cover (%) values for each living organism identified among the three sites.
Site
Benthic Type Lagoon Plot 1Lagoon Plot 2Tower Footings Plot
Brown Calcifying Algae1.90%3.13%48.32%
Brown Fleshy Algae17.32%3.67%0.0%
Coral8.51%15.66%7.43%
Crustose Coralline Algae1.20%1.08%2.14%
Green Calcifying Algae0.0%0.32%0.0%
Green Fleshy Algae0.0%0.0%1.42%
Sand14.31%13.82%0.51%
Turf on Hard Substrate36.74%51.40%11.19%
Turf Rubble20.02%10.91%28.99%
Table 2. Ecological data and penalty value estimations for coral and live rock among all sites.
SiteTotal Area (m2)No. of CoralsSpecies RichnessShannon–Wiener Diversity Index (H′)Coral Penalty Value (USD)Live Rock
Penalty Value (USD)
Total Penalty Value (USD)
Lagoon Plot 1668744.4618,380.004114.5922,494.59
Lagoon Plot 2 161832.897440.00678.198118.19
Tower Footings Plot 240898206.60113,760.0028,724.31142,484.61
Disclaimer/Publisher’s Note: The statements, opinions and data contained in all publications are solely those of the individual author(s) and contributor(s) and not of MDPI and/or the editor(s). MDPI and/or the editor(s) disclaim responsibility for any injury to people or property resulting from any ideas, methods, instructions or products referred to in the content.

