


Transfer-Learning-Based Human Activity Recognition Using Antenna Array
 ,
,  ,
,
Abstract
1. Introduction
- (1)
- This paper proposes a low-cost, non-intrusive human activity-recognition system called Wi-AR, which uses antenna arrays to detect WiFi signals without the need for any devices.
- (2)
- An activity feature extraction algorithm is proposed to perform the feature segmentation of different activities to detect start and end moments in noisy environments. Using a threshold-based sliding window approach, activity periods can be extracted from CSI data more efficiently.
- (3)
- The transfer learning strategy employs the fine-tuning of the CNN for training small samples in a changing environment, which improves the accuracy and robustness of activity recognition and avoids overfitting during the training process.
2. Proposed Scheme and Preliminaries
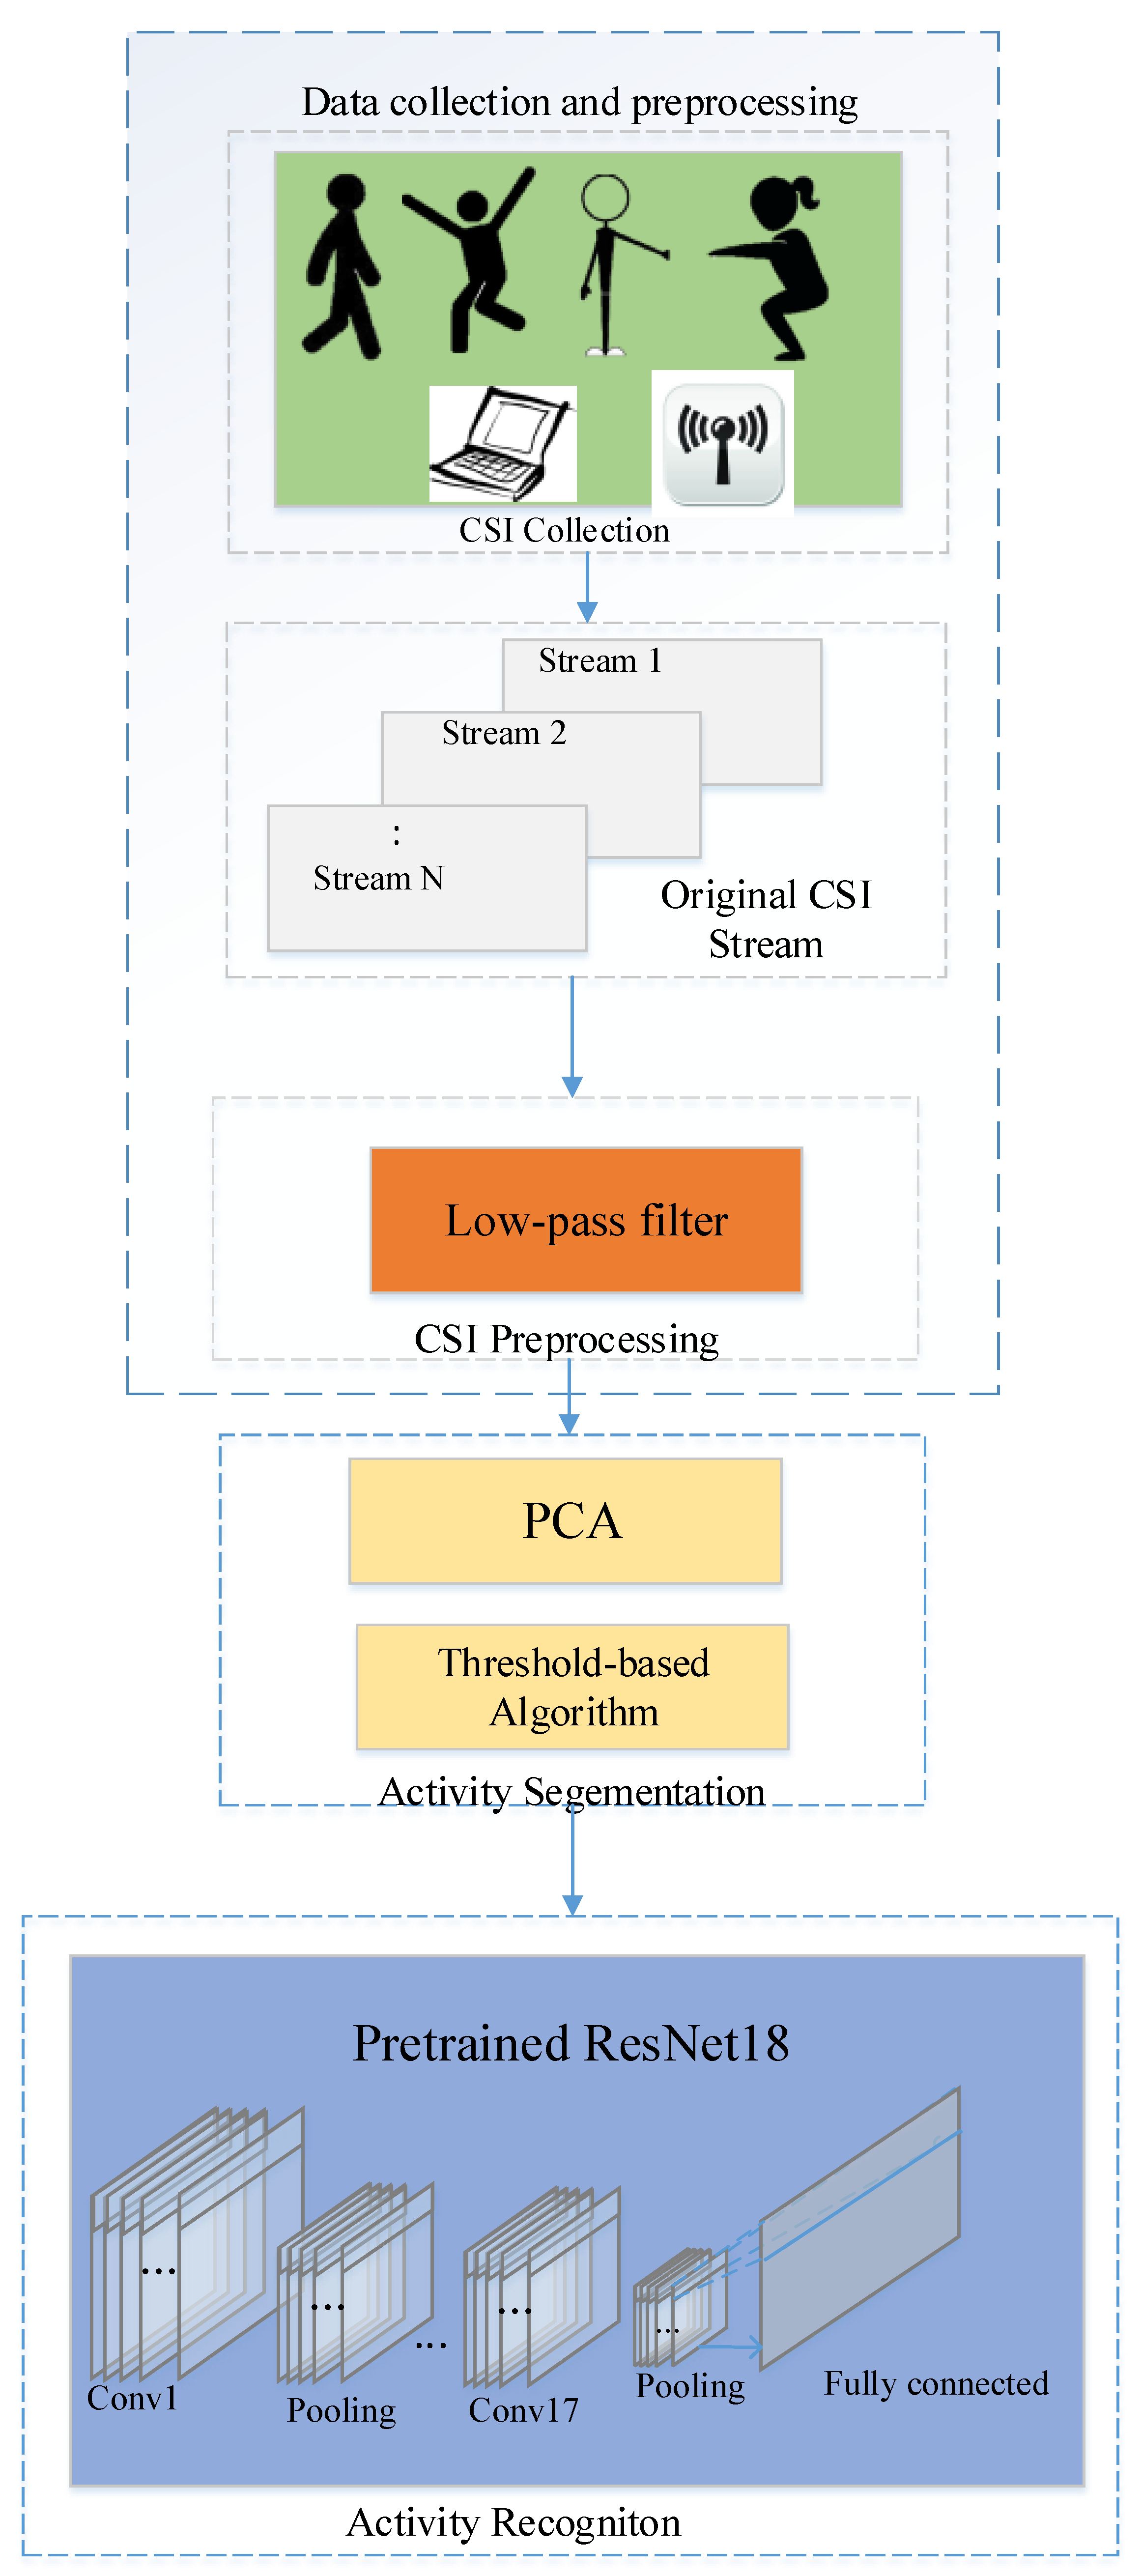
2.1. Proposed Scheme

2.2. Preliminary
3. Data Collection and Preprocessing
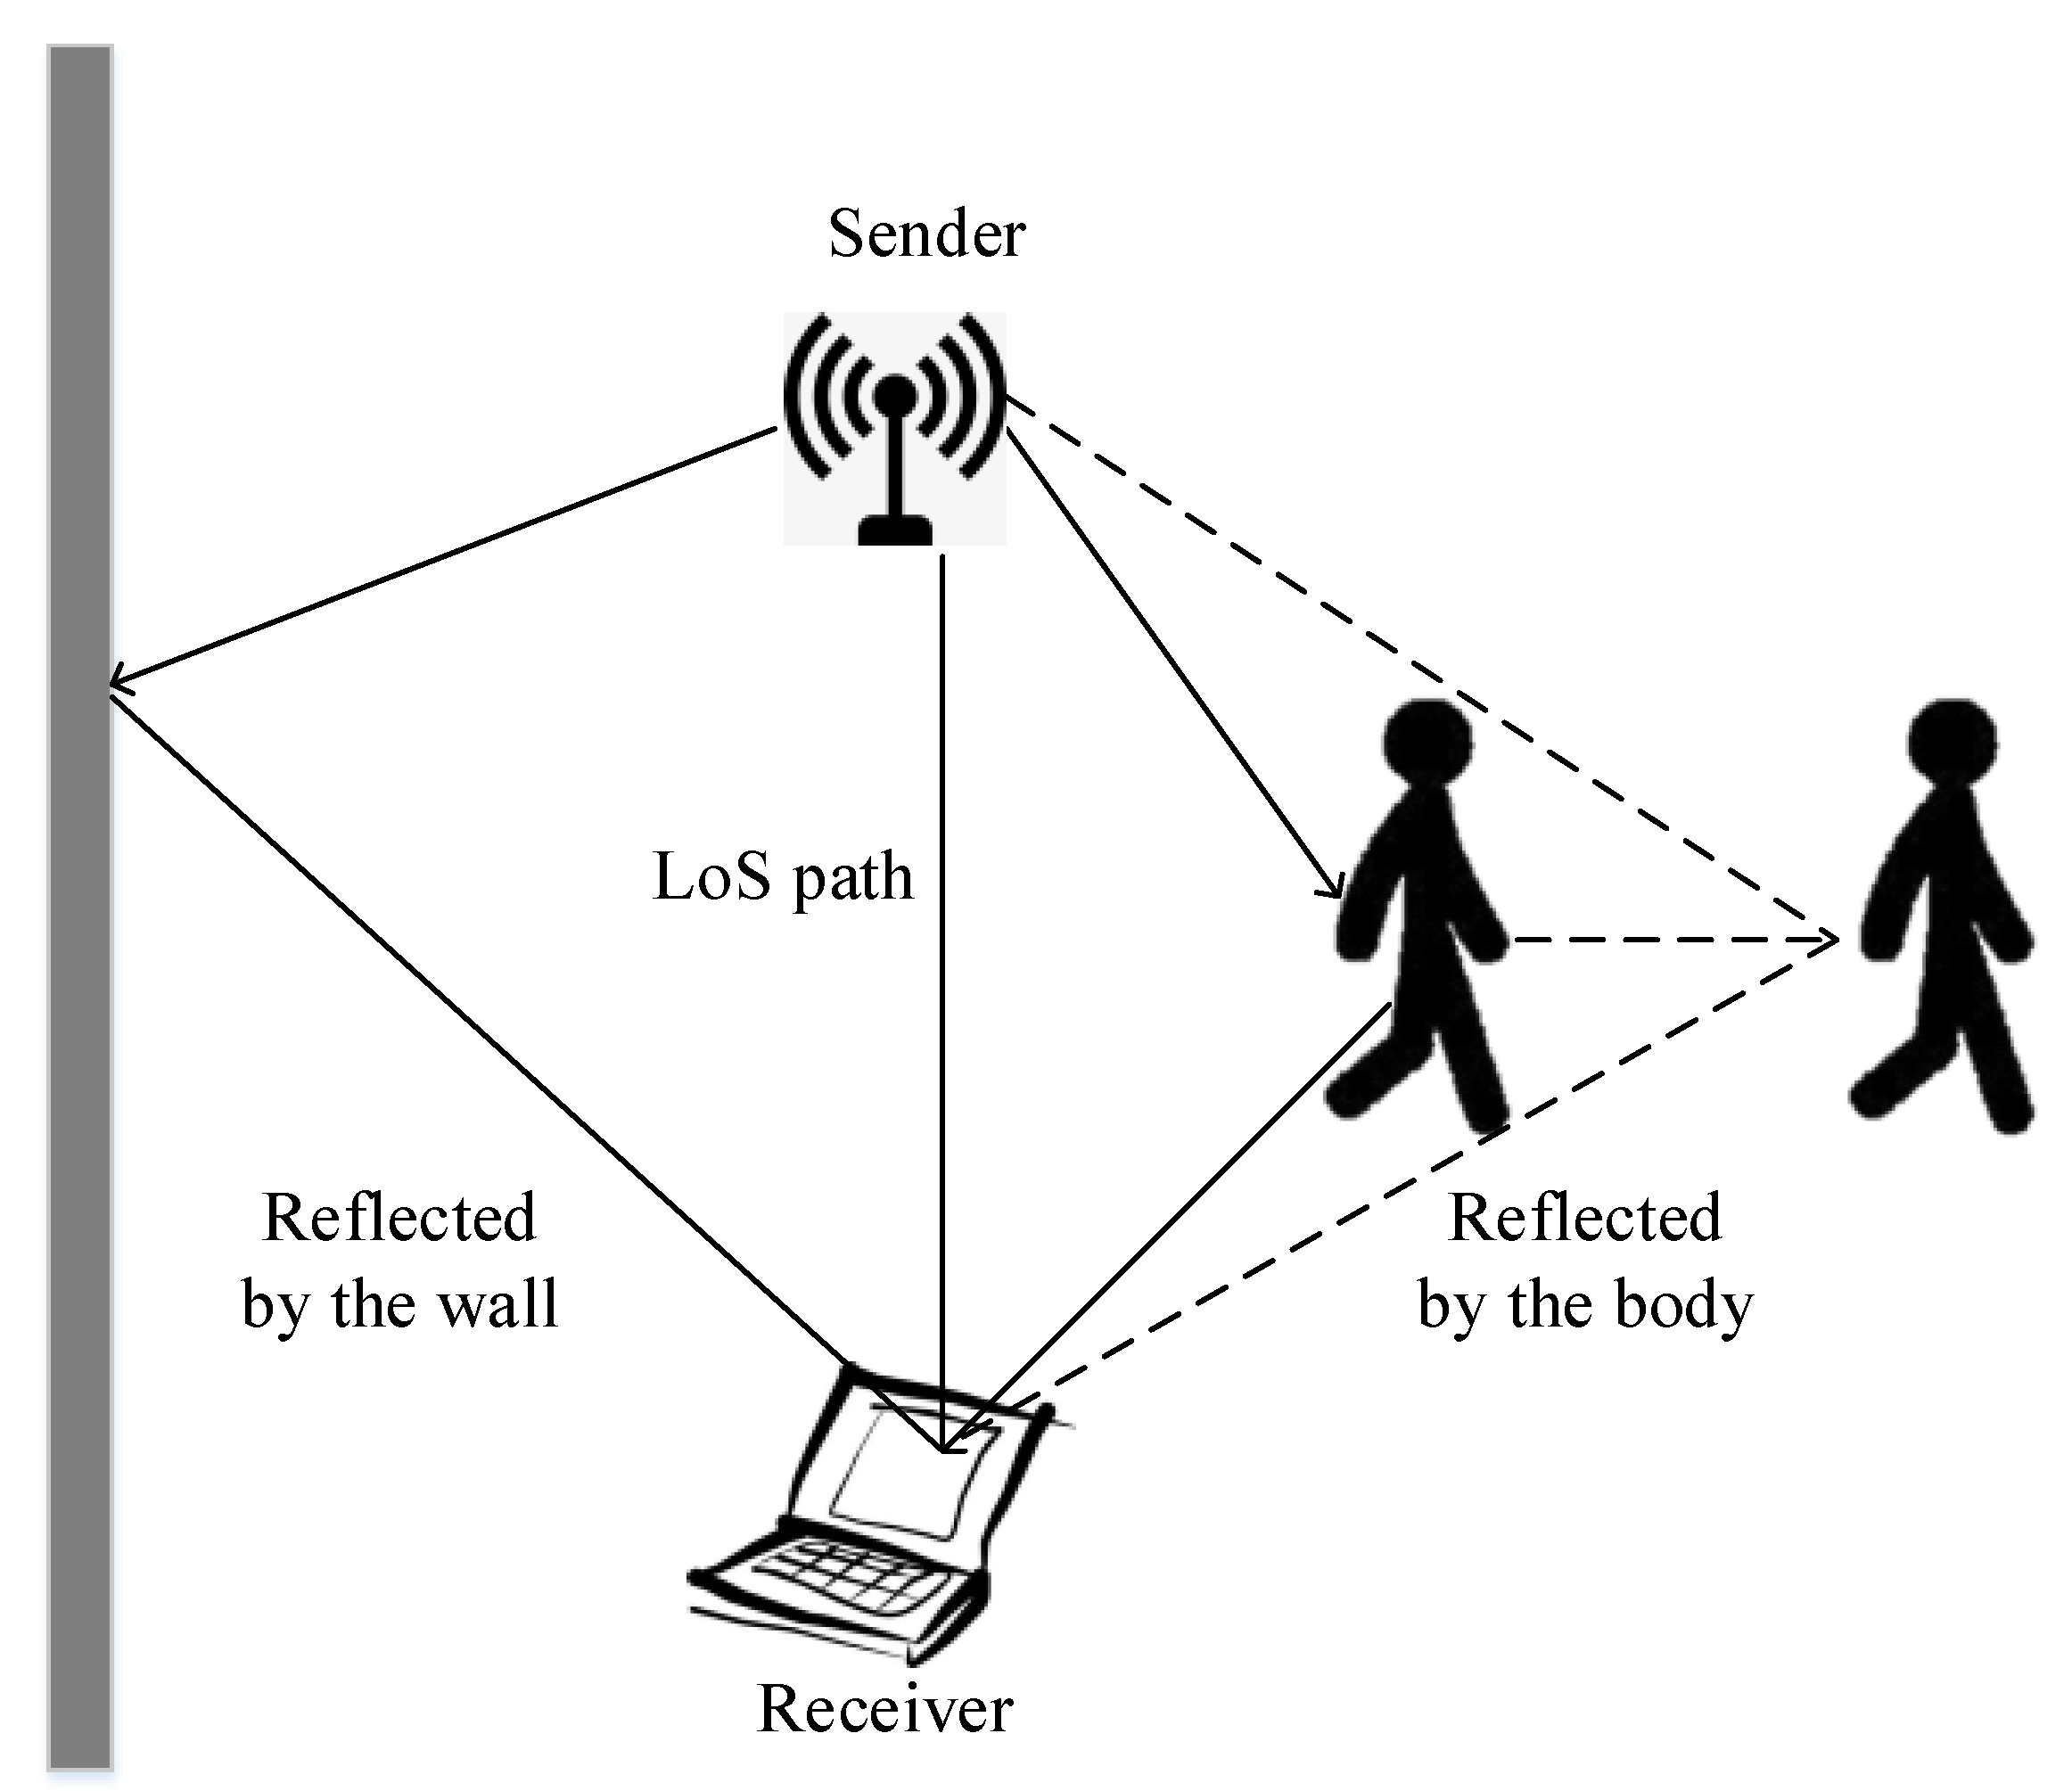
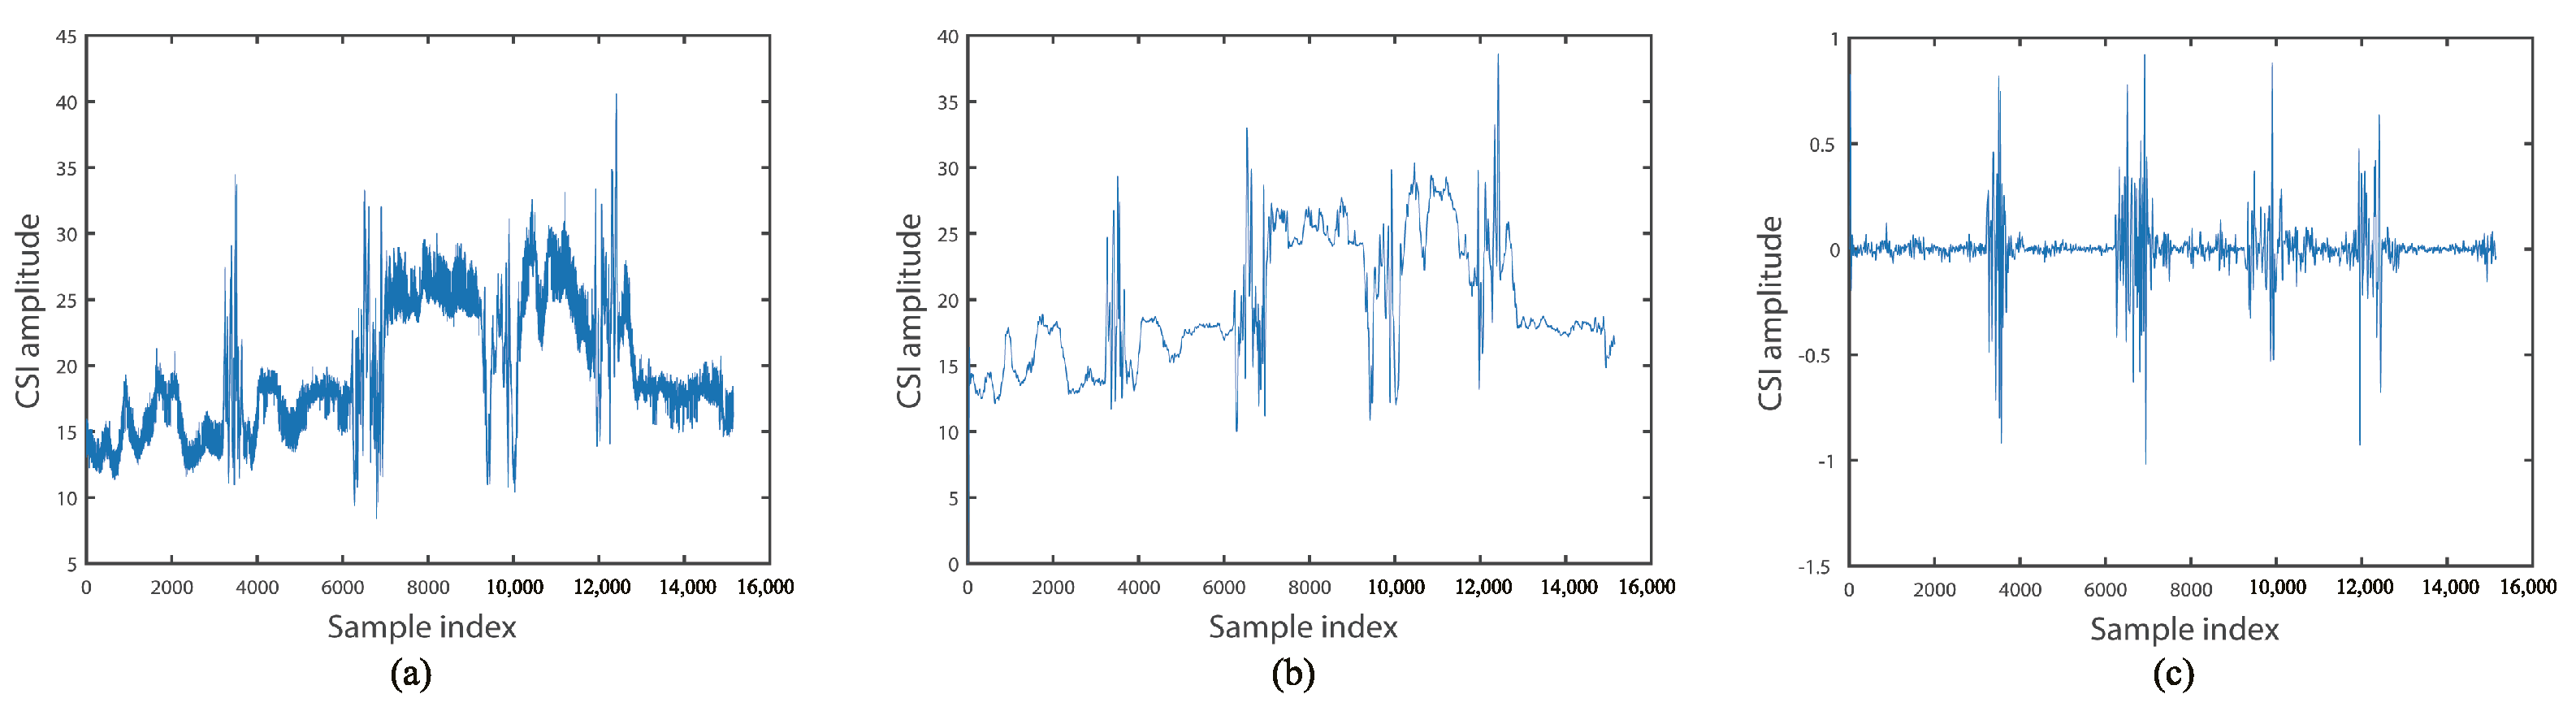
3.1. CSI Collection and Denoising
3.2. Activity Segmentation Based on Domain Adaptation
| Algorithm 1 Activity segmentation algorithm. |
| input: The amplitude ; |
| The length of variance window and stride , ; |
| The length of the median window , ; |
| The Minimum interval between two actions; |
| The variation between the maximum and |
| minimum values of the stationary environment; |
| output: The start and finish time index ,; |
|
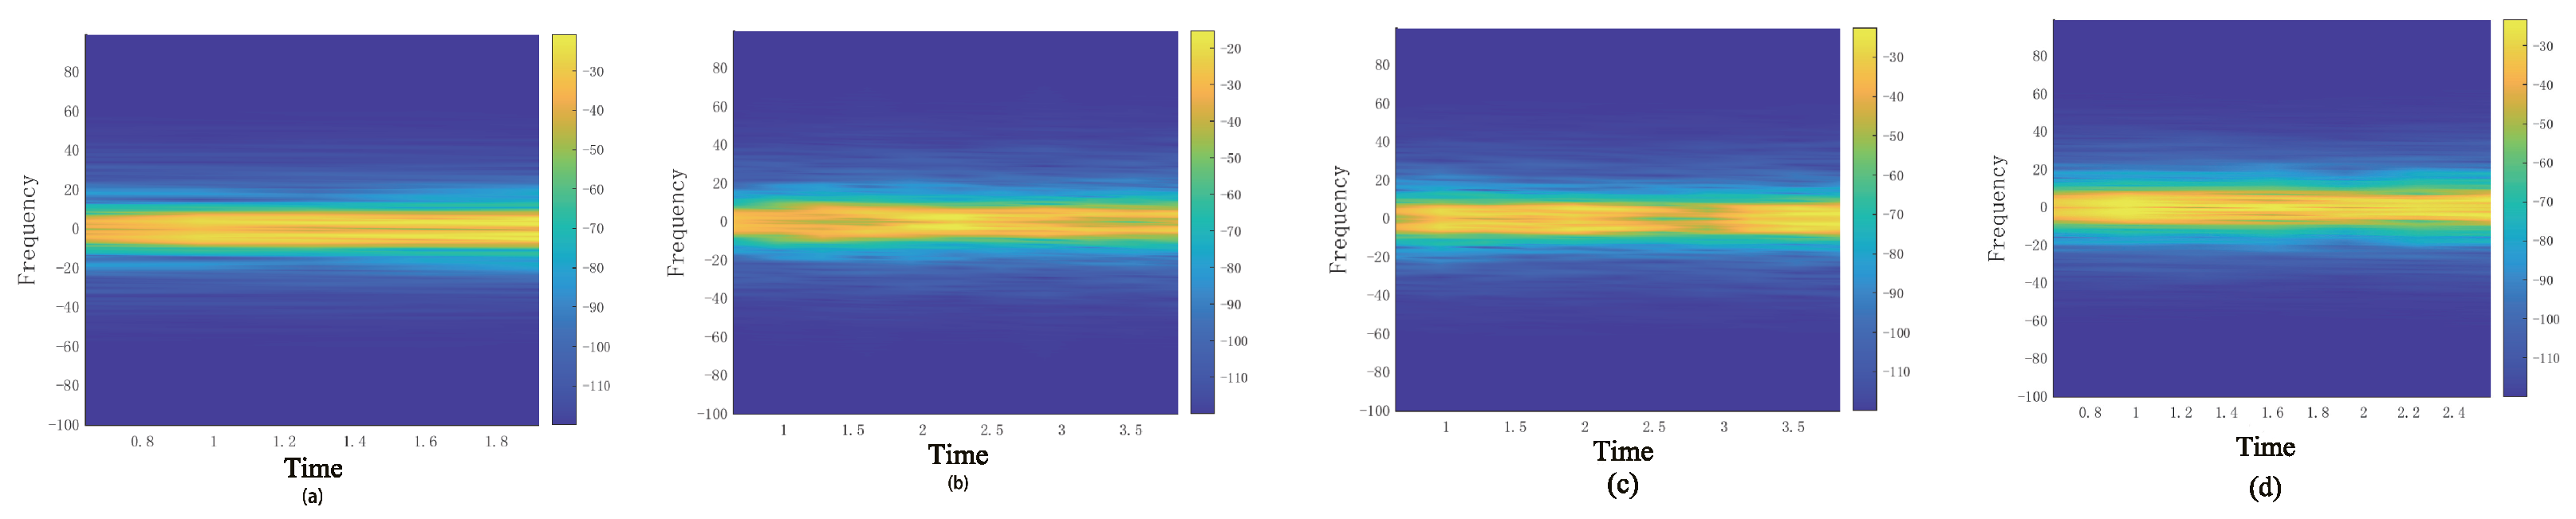
3.3. STFT Transform
4. Activity Recognition Model
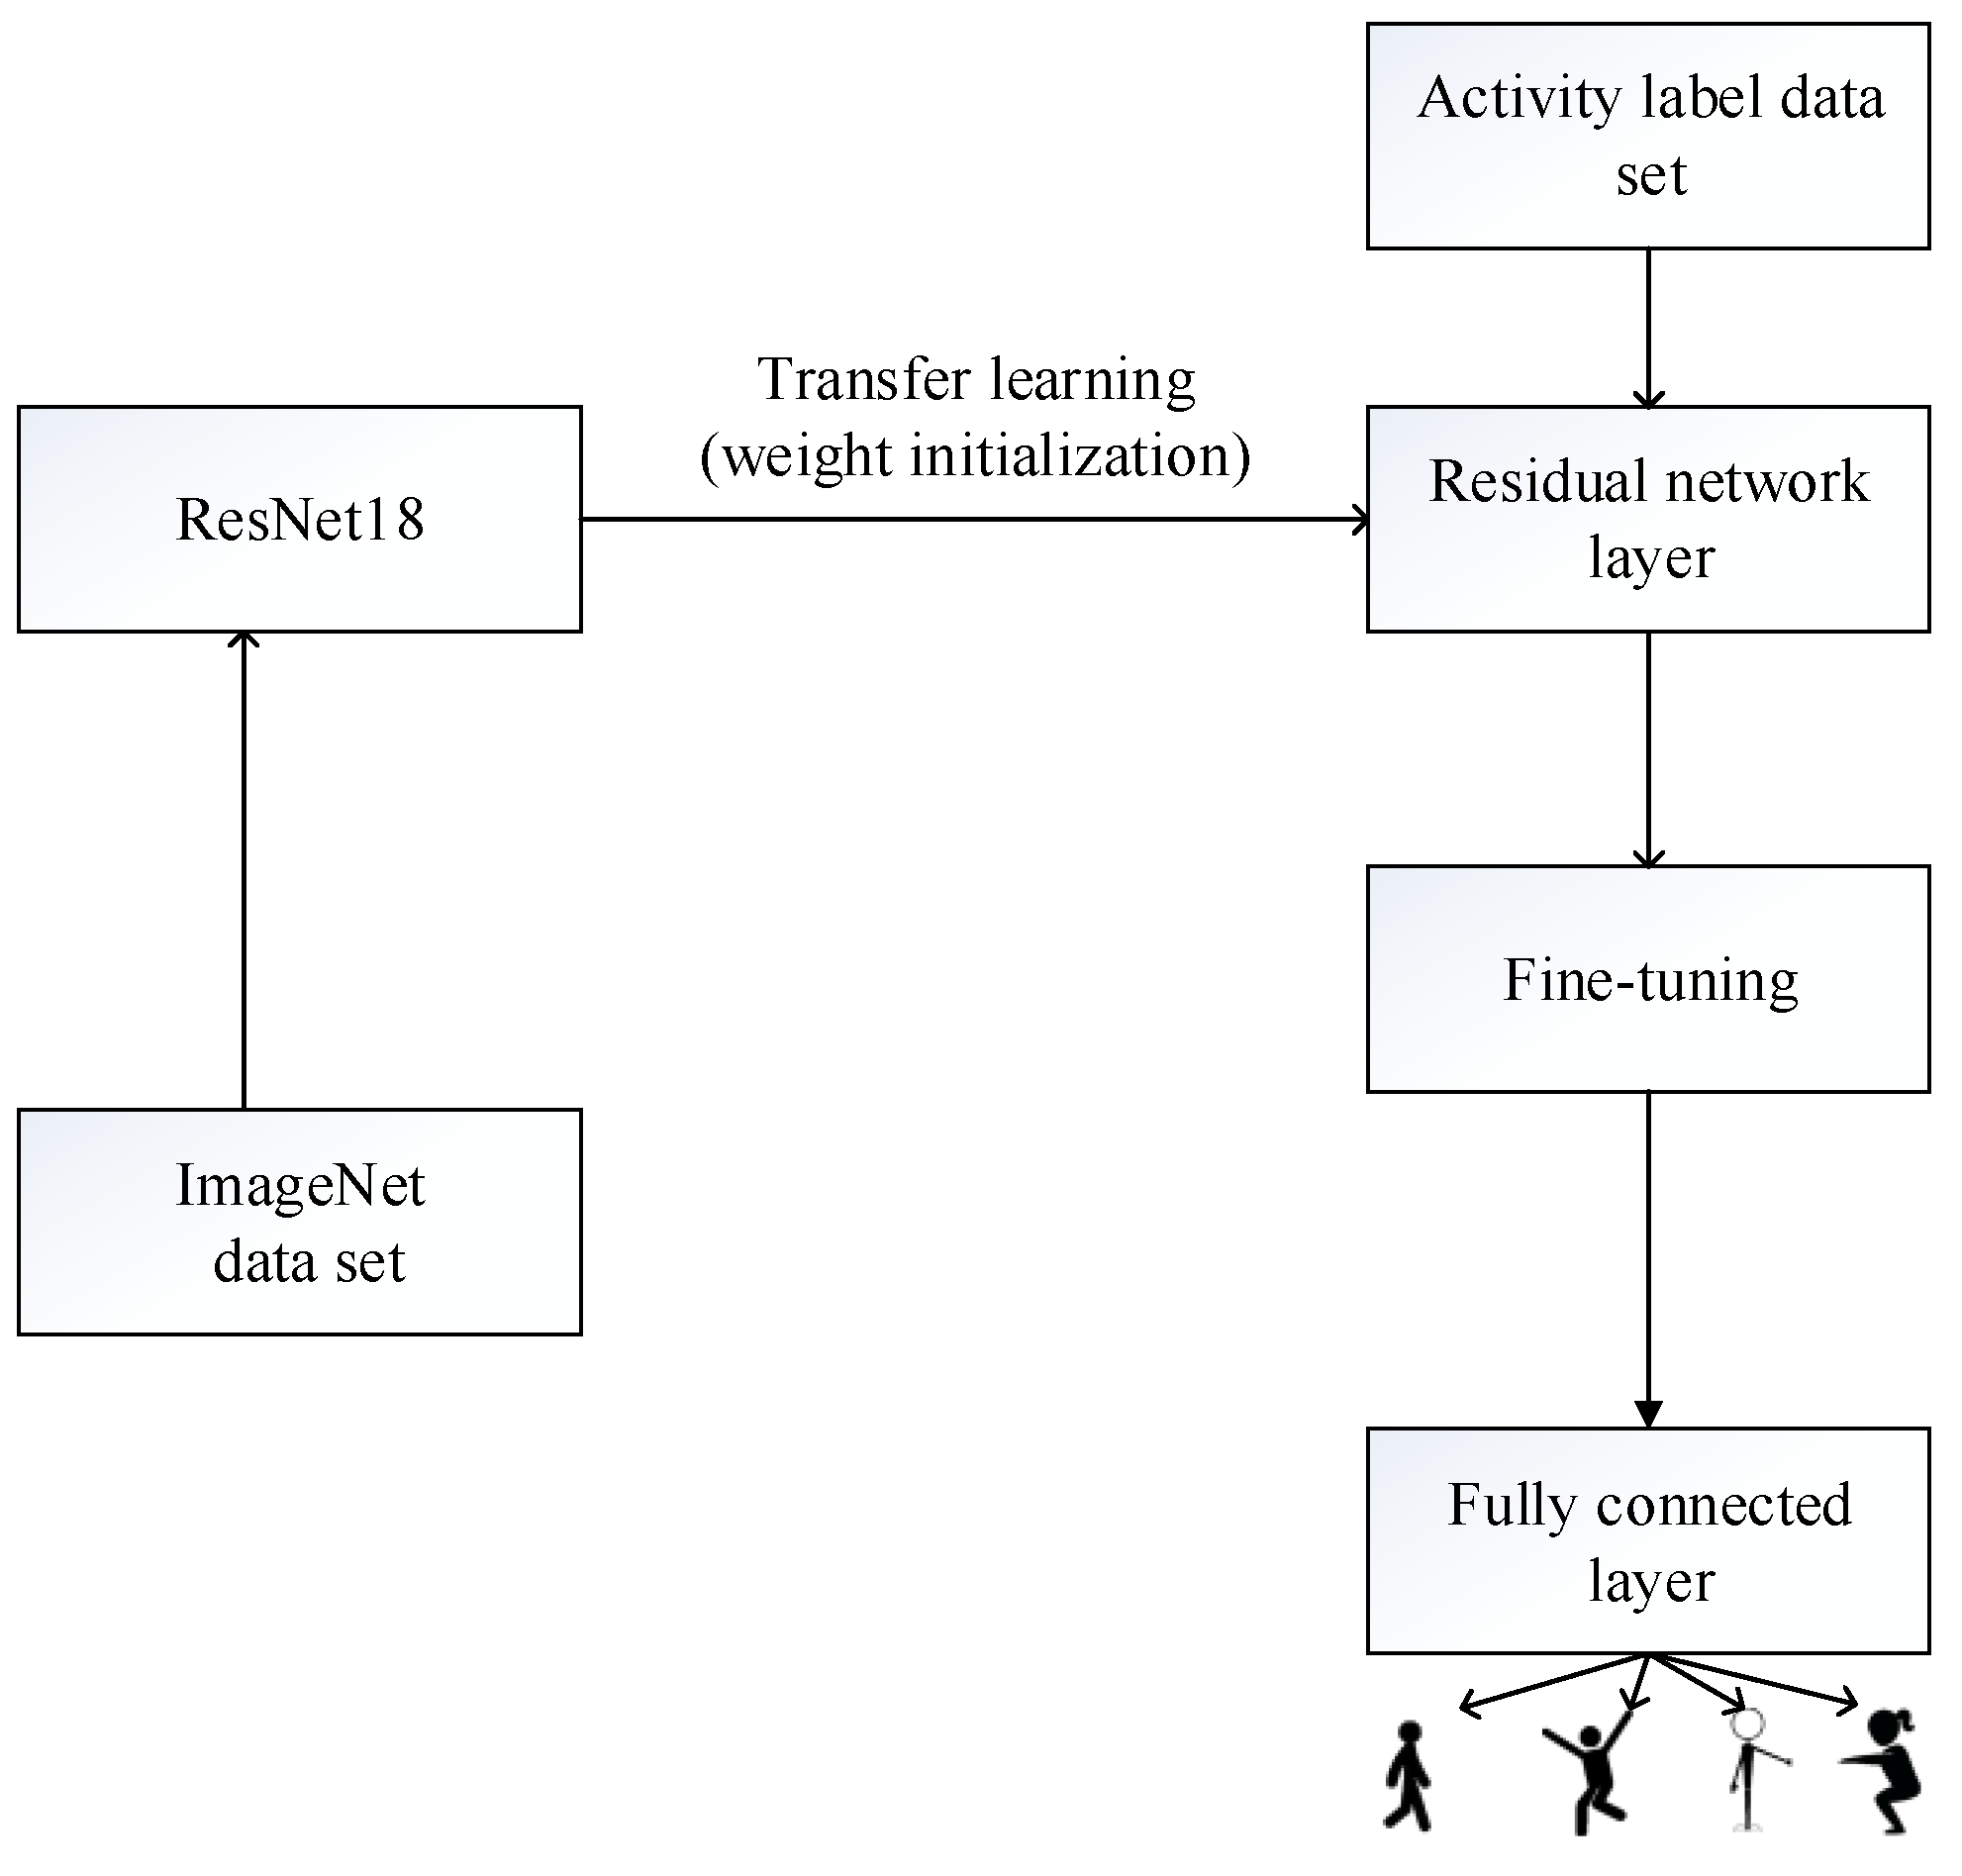
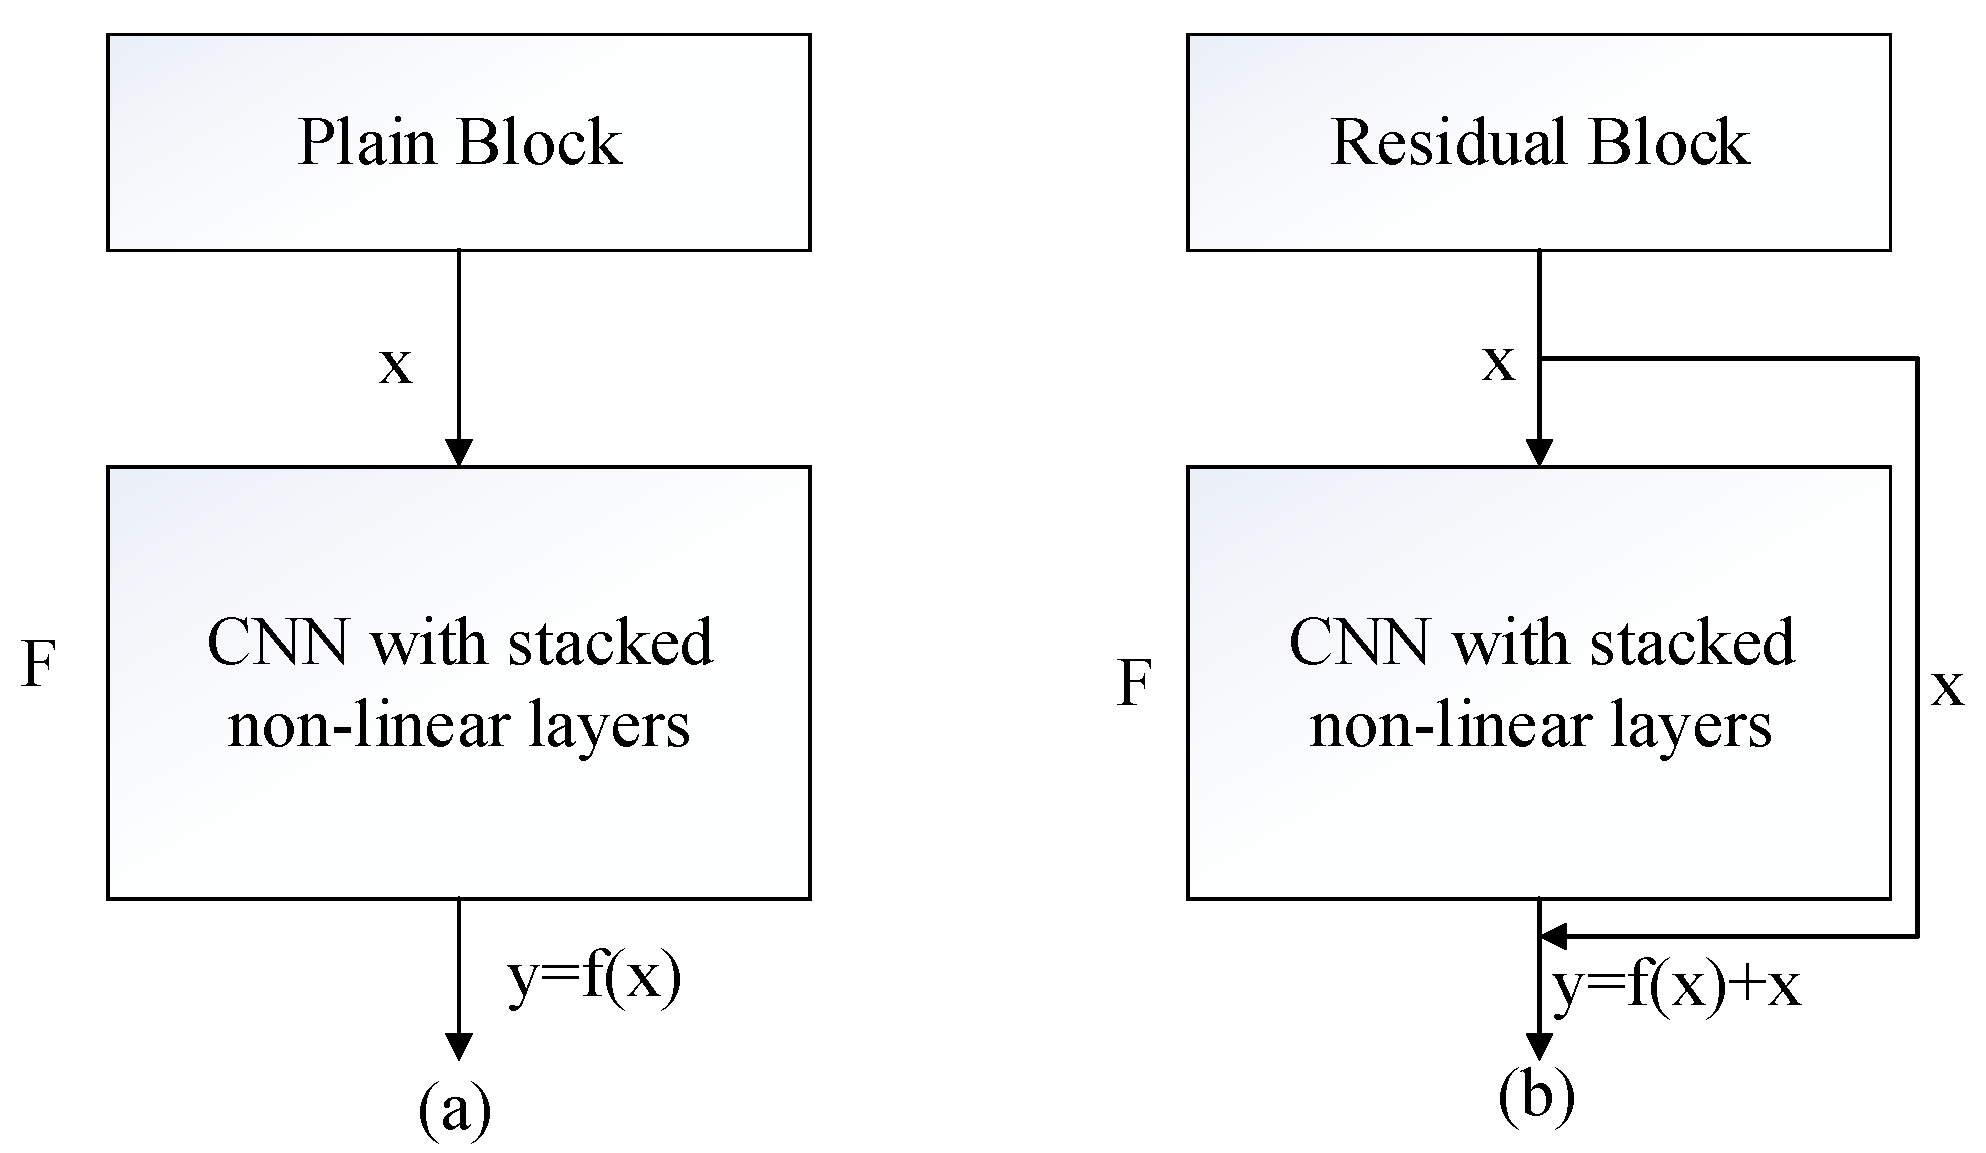
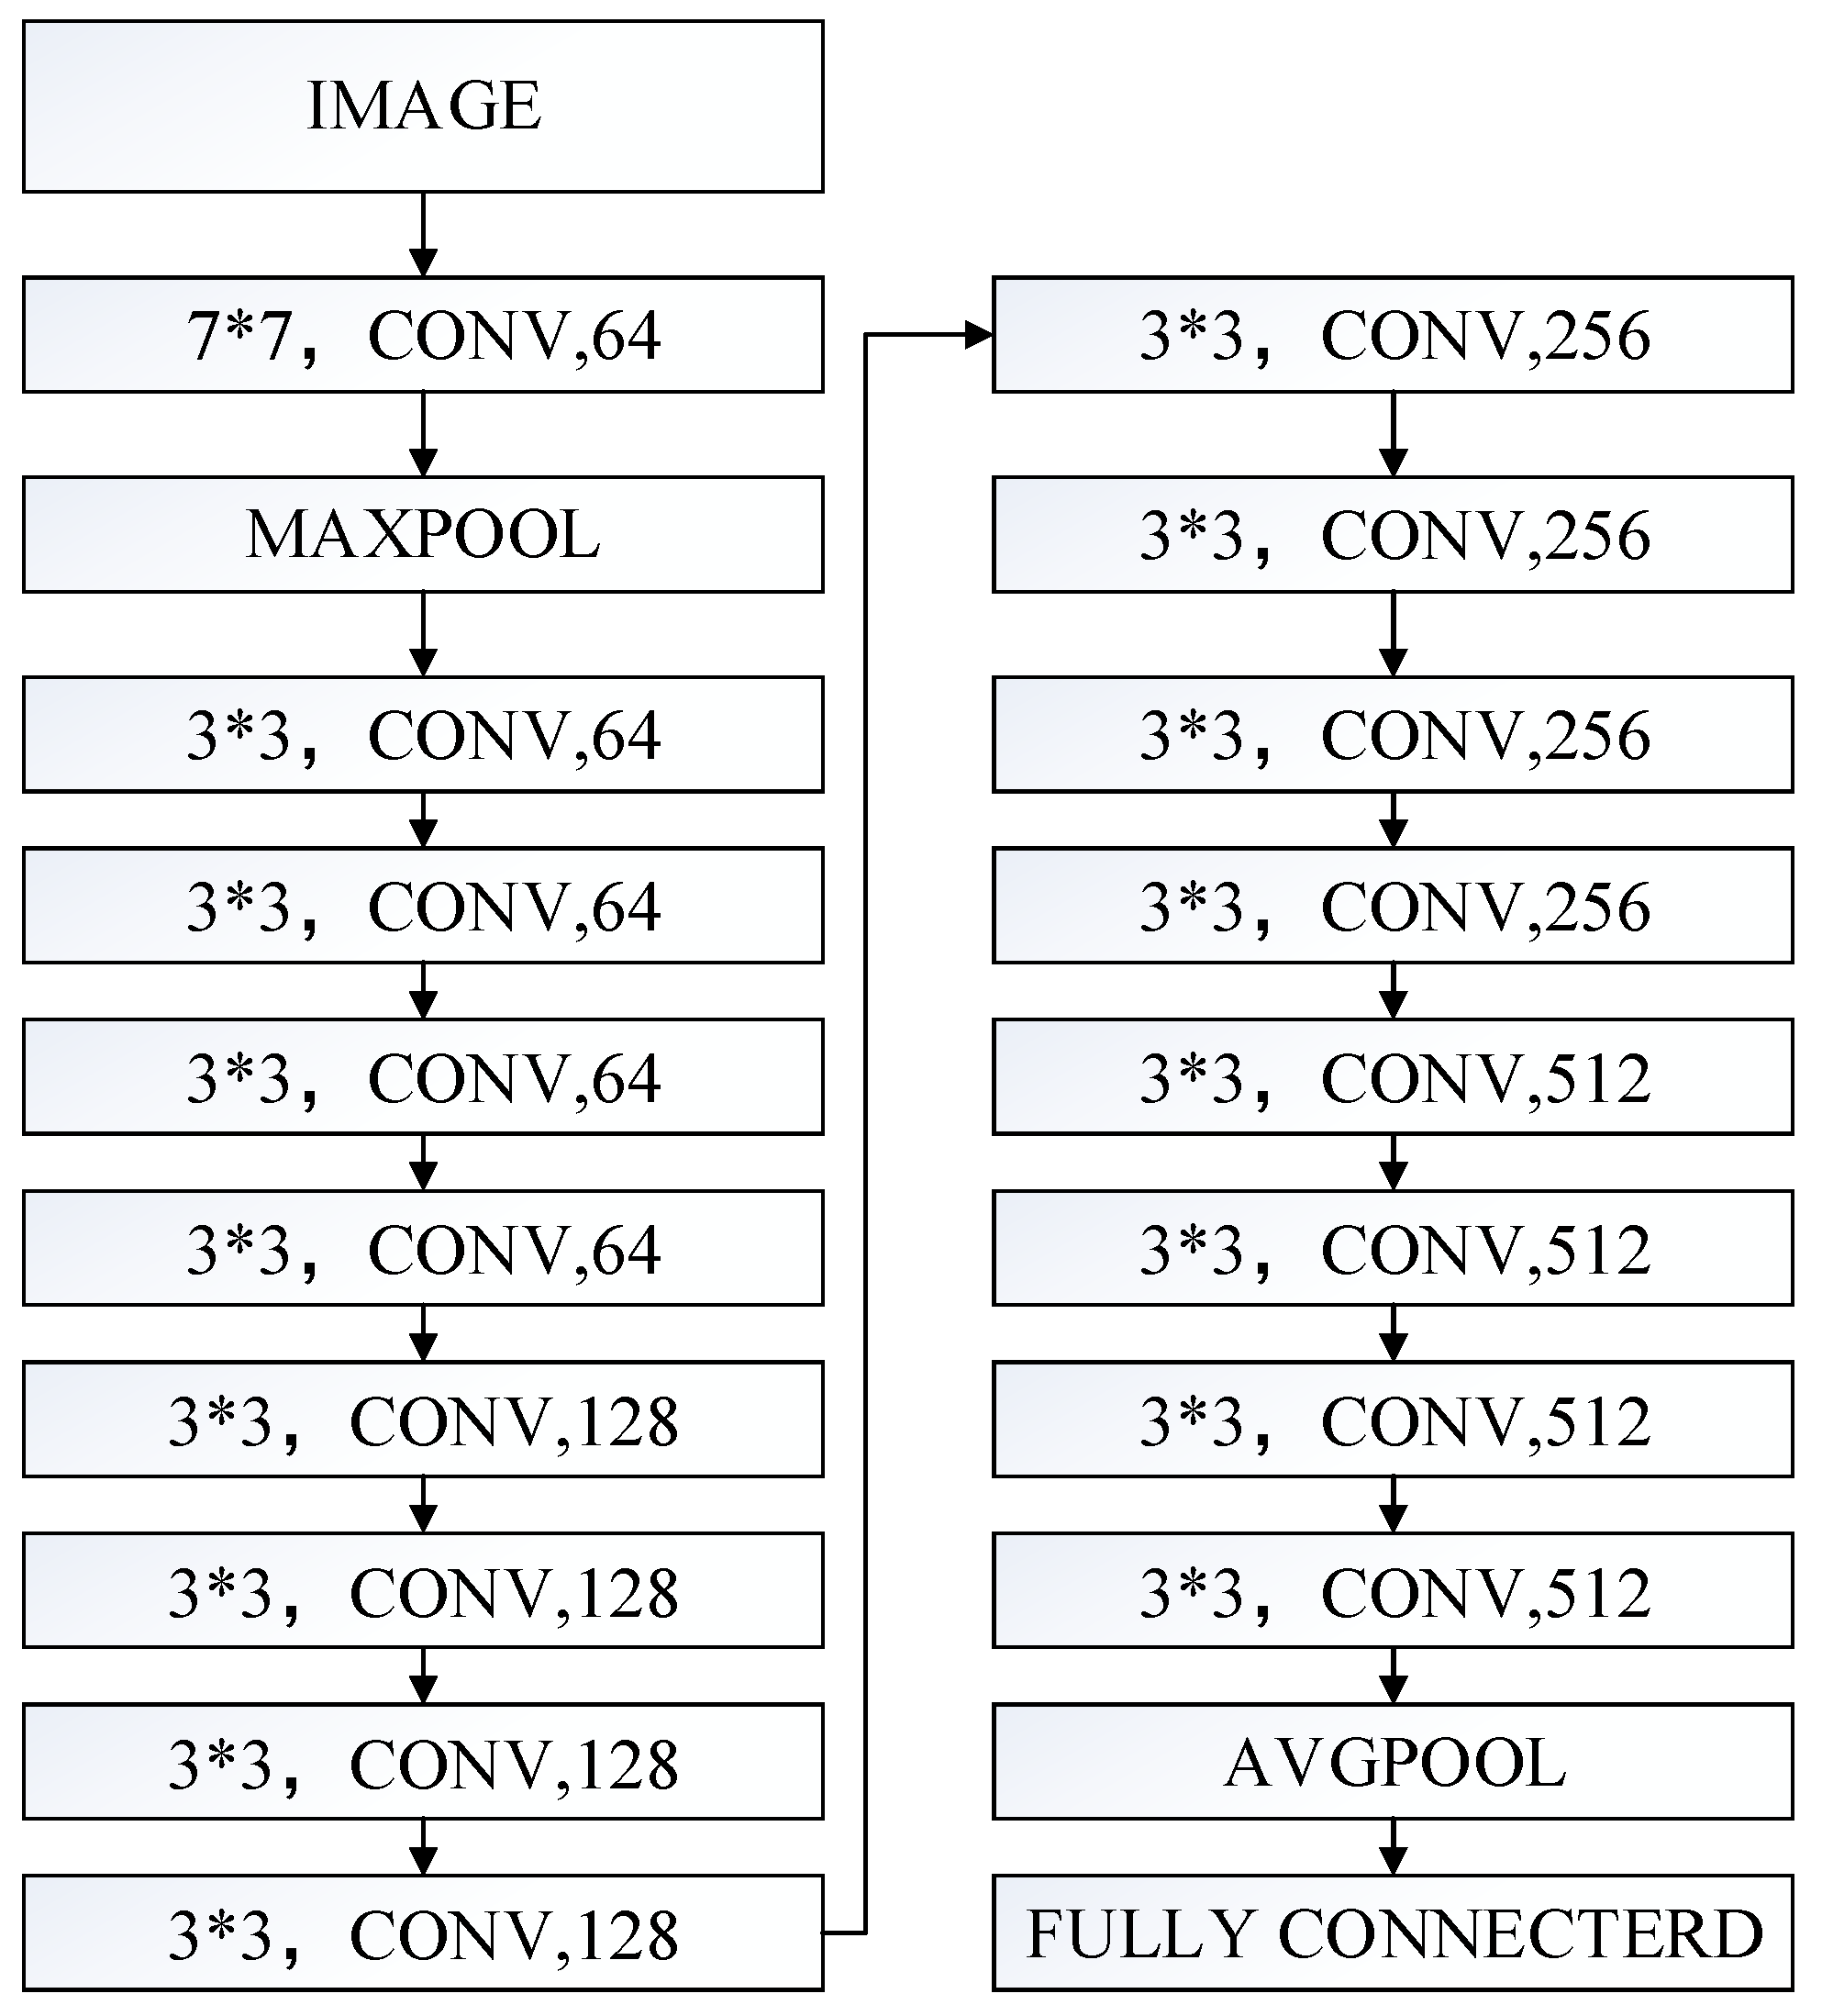
4.1. ResNet18
4.2. Transfer Learning
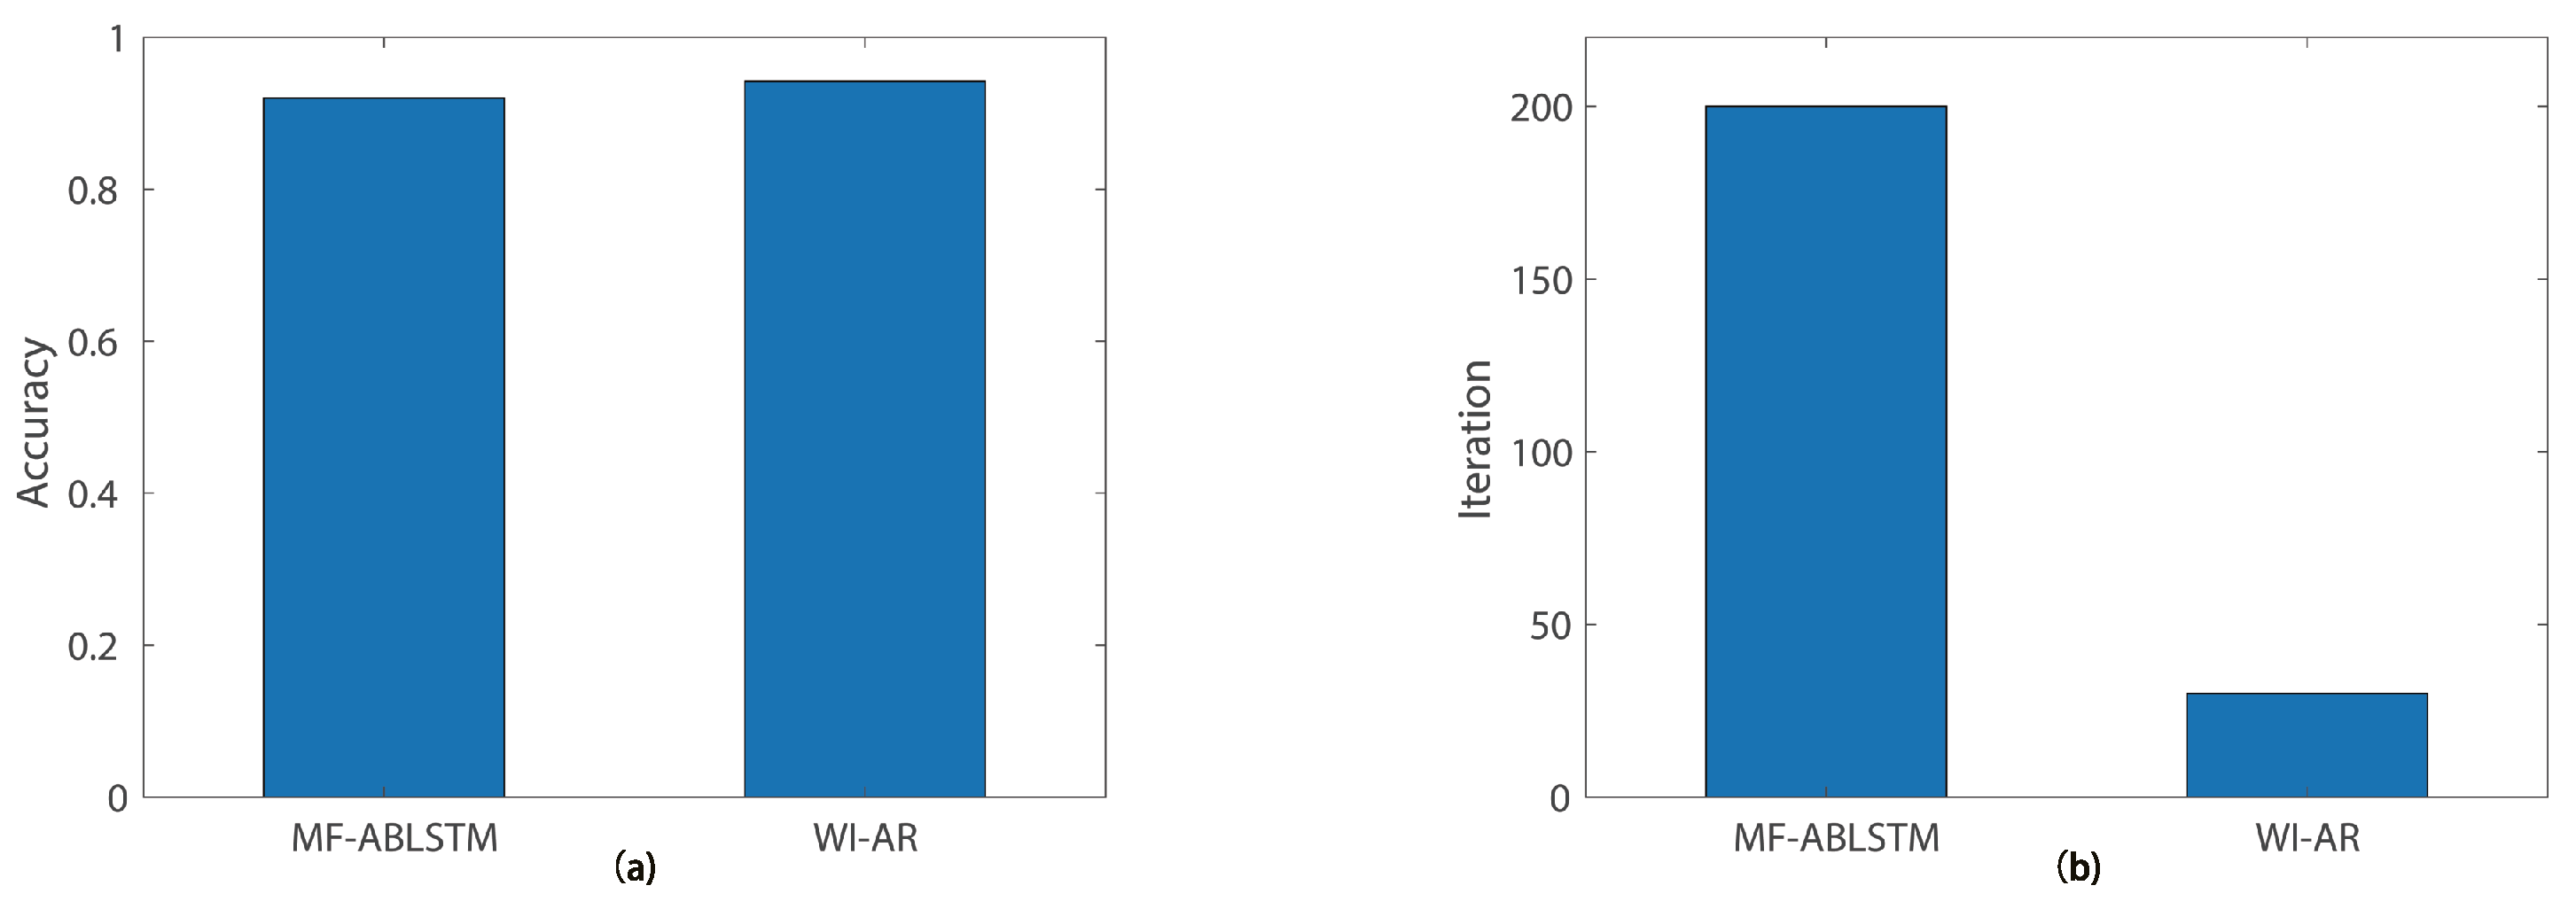
5. Experimental Evaluation
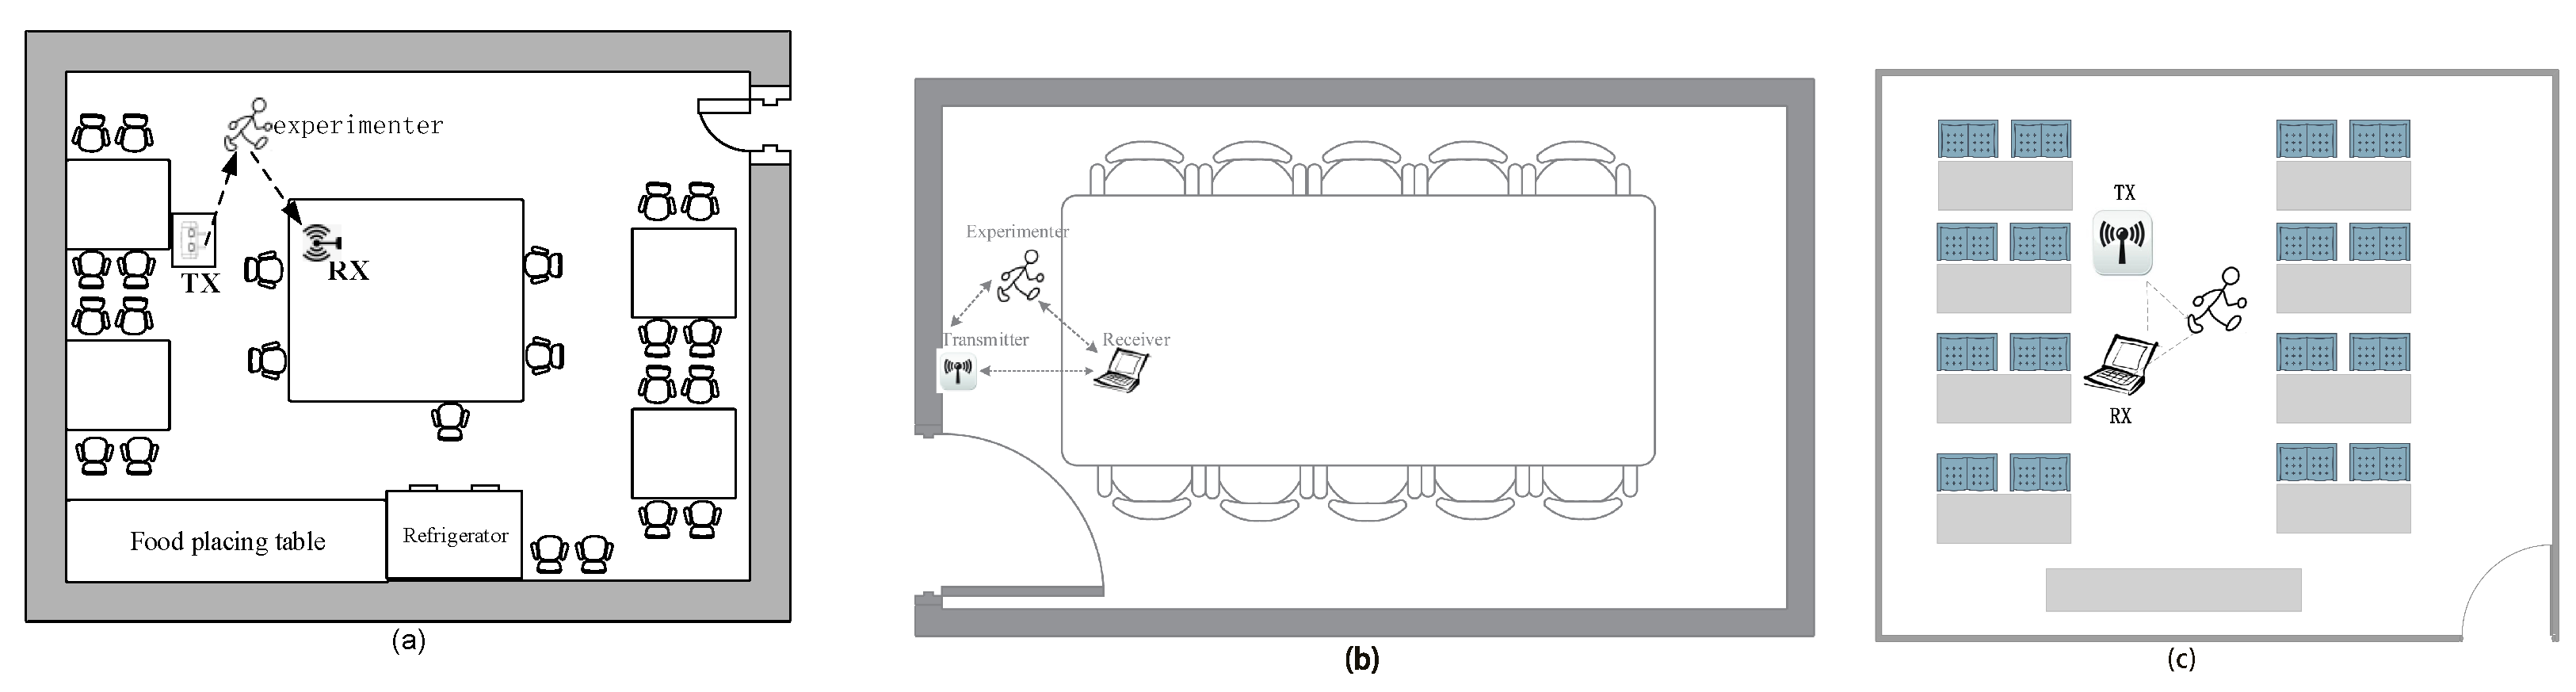
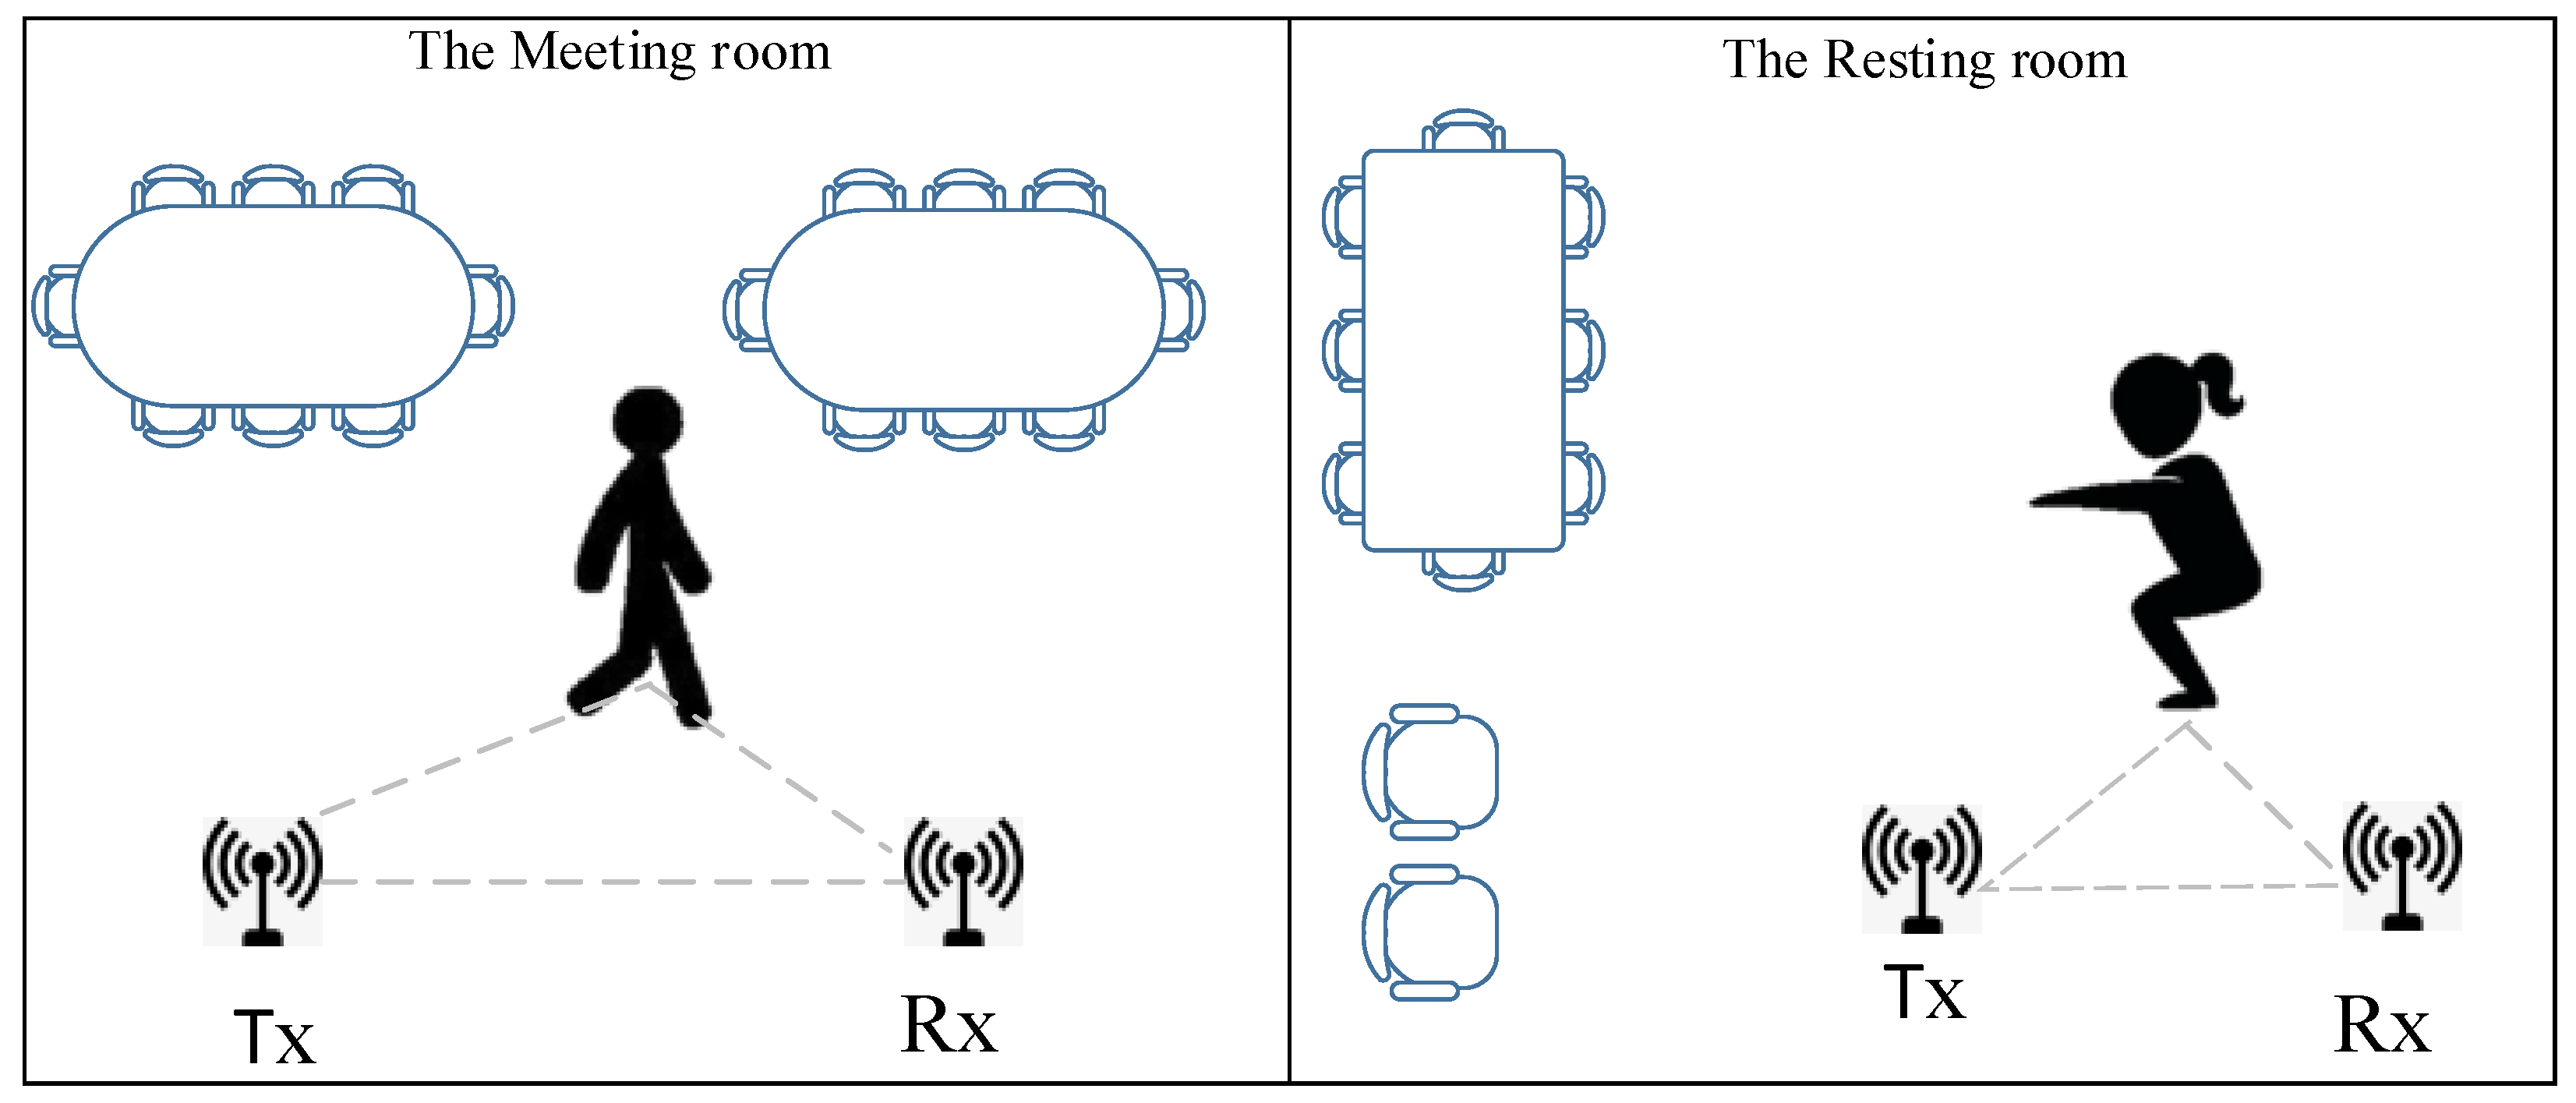
5.1. Experiment Setup
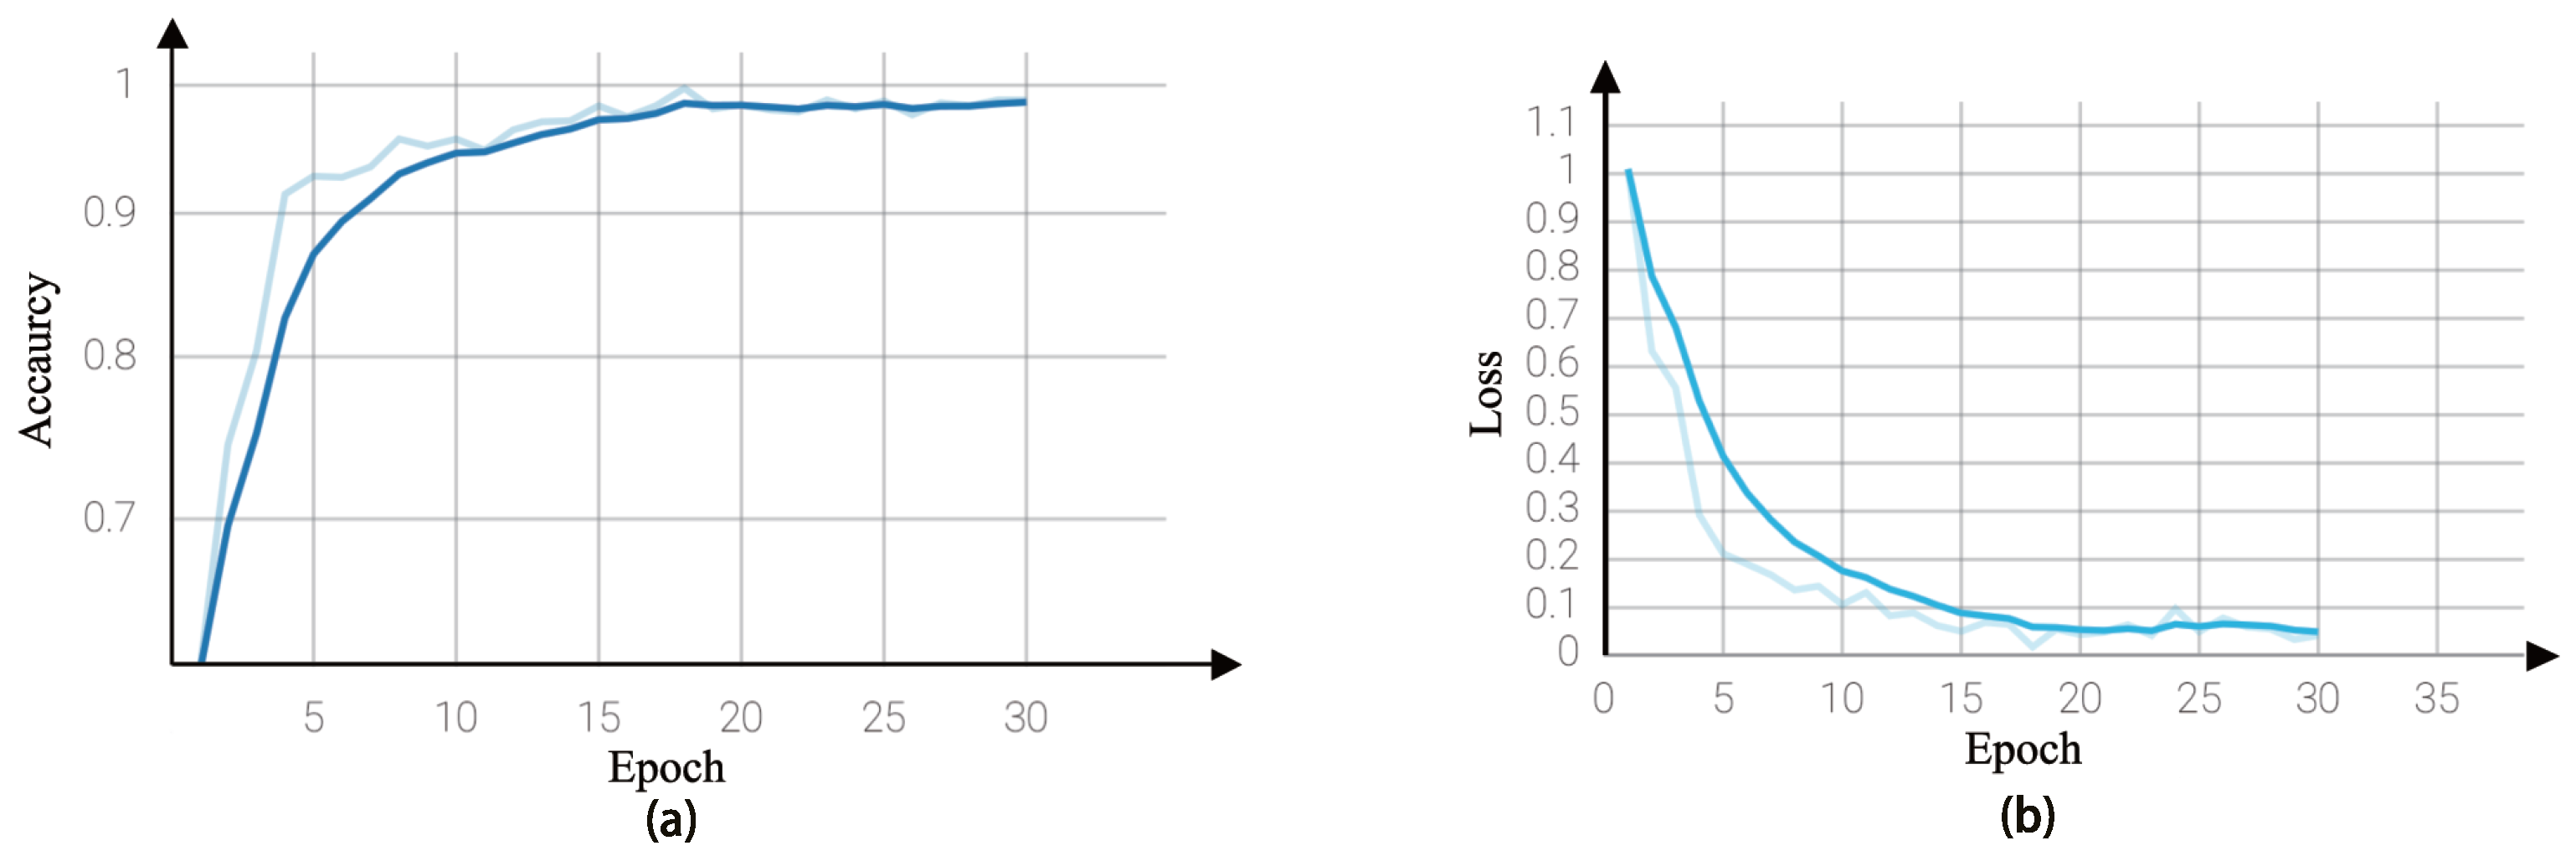
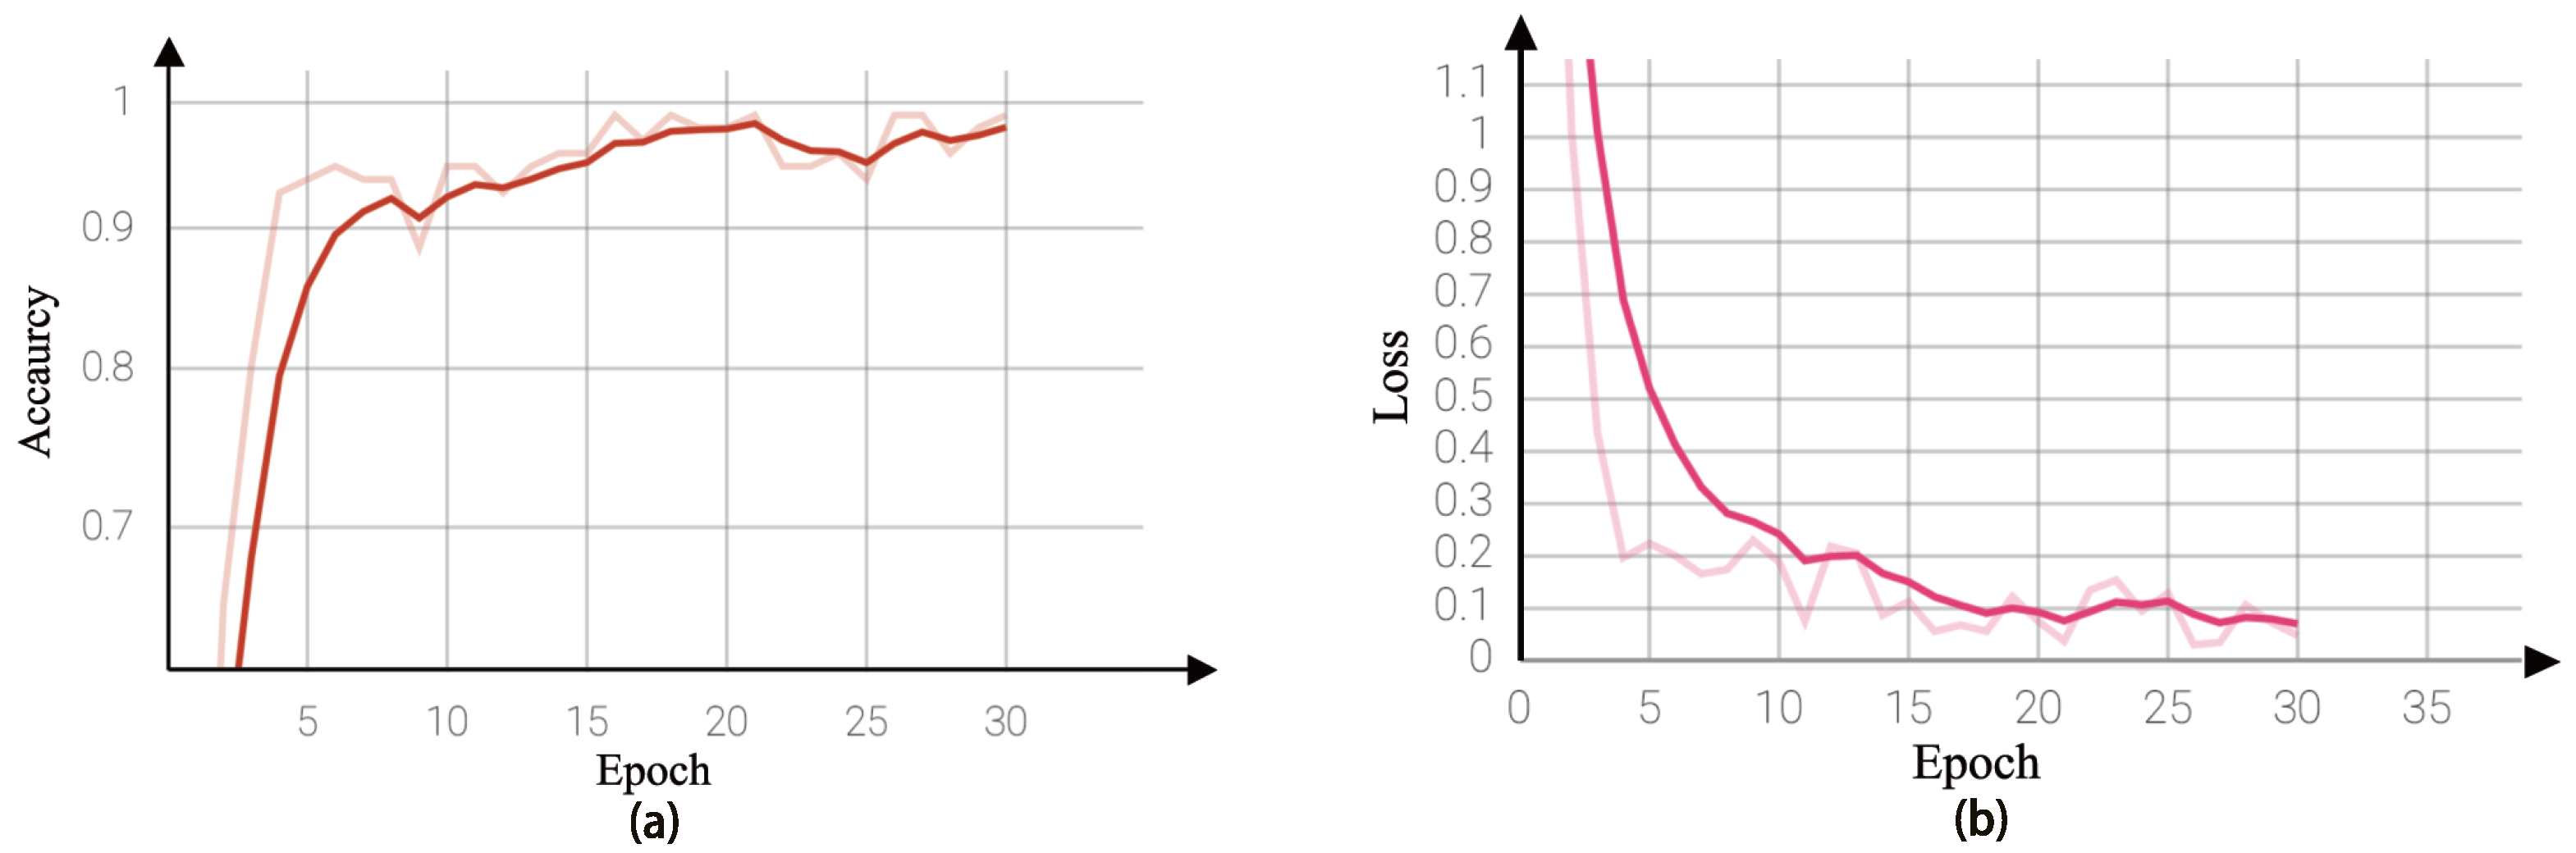
5.2. Experimental Validation
6. Conclusions
Author Contributions
Funding
Data Availability Statement
Conflicts of Interest
References
- Wang, X.; Yang, C.; Mao, S. PhaseBeat: Exploiting CSI phase data for vital sign monitoring with commodity WiFi devices. In Proceedings of the 2017 IEEE 37th International Conference on Distributed Computing Systems (ICDCS), Atlanta, GA, USA, 5–8 June 2017; pp. 1230–1239. [Google Scholar]
- Zou, H.; Zhou, Y.; Yang, J.; Jiang, H.; Xie, L.; Spanos, C.J. WiFi-enabled device-free gesture recognition for smart home automation. In Proceedings of the 2018 IEEE 14th International Conference on Control and Automation (ICCA), Anchorage, AK, USA, 12–15 June 2018; pp. 476–481. [Google Scholar]
- Palipana, S.; Rojas, D.; Agrawal, P.; Pesch, D. FallDeFi: Ubiquitous fall detection using commodity WiFi devices. Proc. ACM Interact. Mob. Wearable Ubiquitous Technol. 2018, 1, 155. [Google Scholar] [CrossRef]
- Yatani, K.; Truong, K.N. Bodyscope: A wearable acoustic sensor for activity recognition. In Proceedings of the 2012 ACM Conference on Ubiquitous Computing, Pittsburgh, PA, USA, 5–8 September 2012; pp. 341–350. [Google Scholar]
- Fortino, G.; Galzarano, S.; Gravina, R.; Li, W. A framework for collaborative computing and multi-sensor data fusion in body sensor networks. Inf. Fusion 2015, 22, 50–70. [Google Scholar] [CrossRef]
- Ghasemzadeh, H.; Panuccio, P.; Trovato, S.; Fortino, G.; Jafari, R. Power-aware activity monitoring using distributed wearable sensors. IEEE Trans. Hum.Mach. Syst. 2014, 44, 537–544. [Google Scholar] [CrossRef]
- Bodor, R.; Jackson, B.; Papanikolopoulos, N. Vision-based human tracking and activity recognition. In Proceedings of the 11th Mediterranean Conference on Control and Automation, Rhodes, Greece, 18–20 June 2003; Volume 1. [Google Scholar]
- De Sanctis, M.; Cianca, E.; Di Domenico, S.; Provenziani, D.; Bianchi, G.; Ruggieri, M. Wibecam: Device free human activity recognition through WiFi beacon-enabled camera. In Proceedings of the 2nd Workshop on Workshop on Physical Analytics, Florence, Italy, 22 May 2015; pp. 7–12. [Google Scholar]
- Gu, Y.; Ren, F.; Li, J. Paws: Passive human activity recognition based on WiFi ambient signals. IEEE Internet Things J. 2015, 3, 796–805. [Google Scholar] [CrossRef]
- Tan, S.; Yang, J. WiFinger: Leveraging commodity WiFi for fine-grained finger gesture recognition. In Proceedings of the 17th ACM International Symposium on Mobile Ad Hoc Networking and Computing, Paderborn, Germany, 5–8 July 2016; pp. 201–210. [Google Scholar]
- Yang, Z.; Zhou, Z.; Liu, Y. From RSSI to CSI: Indoor localization via channel response. ACM Comput. Surv. 2013, 46, 25. [Google Scholar] [CrossRef]
- Chen, Z.; Zhang, L.; Jiang, C.; Cao, Z.; Cui, W. WiFi CSI based passive human activity recognition using attention based BLSTM. IEEE Trans. Mob. Comput. 2018, 18, 2714–2724. [Google Scholar] [CrossRef]
- Wang, W.; Liu, A.X.; Shahzad, M.; Ling, K.; Lu, S. Understanding and modeling of WiFi signal based human activity recognition. In Proceedings of the 21st Annual International Conference on Mobile Computing and Networking, Paris, France, 7–11 September 2015; pp. 65–76. [Google Scholar]
- Wang, X.; Yang, C.; Mao, S. TensorBeat: Tensor decomposition for monitoring multiperson breathing beats with commodity WiFi. ACM Trans. Intell. Syst. Technol. 2017, 9, 8. [Google Scholar] [CrossRef]
- Feng, C.; Arshad, S.; Yu, R.; Liu, Y. Evaluation and improvement of activity detection systems with recurrent neural network. In Proceedings of the 2018 IEEE International Conference on Communications (ICC), Kansas City, MO, USA, 20–24 May 2018; pp. 1–6. [Google Scholar]
- Abdelnasser, H.; Youssef, M.; Harras, K.A. WiGest: A ubiquitous WiFi-based gesture recognition system. In Proceedings of the 2015 IEEE Conference on Computer Communications (INFOCOM), Hong Kong, China, 26 April–1 May 2015; pp. 1472–1480. [Google Scholar]
- Liu, X.; Cao, J.; Tang, S.; Wen, J. Wi-Sleep: Contactless sleep monitoring via WiFi signals. In Proceedings of the 2014 IEEE Real-Time Systems Symposium, Rome, Italy, 2–5 December 2014; pp. 346–355. [Google Scholar]
- Duan, S.; Yu, T.; He, J. WiDriver: Driver activity recognition system based on WiFi CSI. Int. J. Wirel. Inf. Netw. 2018, 25, 146–156. [Google Scholar] [CrossRef]
- Zhang, Y.; Wang, X.; Wang, Y.; Chen, H. Human Activity Recognition Across Scenes and Categories Based on CSI. IEEE Trans. Mob. Comput. 2020, 21, 2411–2420. [Google Scholar] [CrossRef]
- Wang, J.; Chen, Y.; Hu, L.; Peng, X.; Philip, S.Y. Stratified transfer learning for cross-domain activity recognition. In Proceedings of the 2018 IEEE International Conference on Pervasive Computing and Communications (PerCom), Athens, Greece, 19–23 March 2018; pp. 1–10. [Google Scholar]
- Zheng, V.W.; Hu, D.H.; Yang, Q. Cross-domain activity recognition. In Proceedings of the 11th International Conference on Ubiquitous Computing, Orlando, FL, USA, 30 September–3 October 2009; pp. 61–70. [Google Scholar]
- Hu, D.H.; Zheng, V.W.; Yang, Q. Cross-domain activity recognition via transfer learning. Pervasive Mob. Comput. 2011, 7, 344–358. [Google Scholar] [CrossRef]
- Wang, J.; Zhang, L.; Gao, Q.; Pan, M.; Wang, H. Device-free wireless sensing in complex scenarios using spatial structural information. IEEE Trans. Wirel. Commun. 2018, 17, 2432–2442. [Google Scholar] [CrossRef]
- Ding, X.; Jiang, T.; Zhong, Y.; Wu, S.; Yang, J.; Xue, W. Improving WiFi-based Human Activity Recognition with Adaptive Initial State via One-shot Learning. In Proceedings of the 2021 IEEE Wireless Communications and Networking Conference (WCNC), Nanjing, China, 29 March–1 April 2021; pp. 1–6. [Google Scholar]
- Bayraktar, E.; Yigit, C.B.; Boyraz, P. A hybrid image dataset toward bridging the gap between real and simulation environments for robotics: Annotated desktop objects real and synthetic images dataset: ADORESet. Mach. Vis. Appl. 2019, 30, 23–40. [Google Scholar] [CrossRef]
- Bayraktar, E.; Yigit, C.B.; Boyraz, P. Object manipulation with a variable-stiffness robotic mechanism using deep neural networks for visual semantics and load estimation. Neural Comput. Appl. 2020, 32, 9029–9045. [Google Scholar] [CrossRef]
- Liang, H.; Fu, W.; Yi, F. A survey of recent advances in transfer learning. In Proceedings of the 2019 IEEE 19th International Conference on Communication Technology (ICCT), Xi’an, China, 16–19 October 2019; pp. 1516–1523. [Google Scholar]
- Halperin, D.; Hu, W.; Sheth, A.; Wetherall, D. Tool release: Gathering 802.11 n traces with channel state information. ACM SIGCOMM Comput. Commun. Rev. 2011, 41, 53. [Google Scholar] [CrossRef]
- Rappaport, T.S. Wireless Communications–Principles and Practice, (The Book End). Microw. J. 2002, 45, 128–129. [Google Scholar]
- He, K.; Zhang, X.; Ren, S.; Sun, J. Delving deep into rectifiers: Surpassing human-level performance on imagenet classification. In Proceedings of the IEEE International Conference on Computer Vision, Santiago, Chile, 7–13 December 2015; pp. 1026–1034. [Google Scholar]
- Li, Y.; Ding, Z.; Zhang, C.; Wang, Y.; Chen, J. SAR ship detection based on resnet and transfer learning. In Proceedings of the IGARSS 2019—2019 IEEE International Geoscience and Remote Sensing Symposium, Yokohama, Japan, 28 July–2 August 2019; pp. 1188–1191. [Google Scholar]
- He, K.; Zhang, X.; Ren, S.; Sun, J. Deep residual learning for image recognition. In Proceedings of the IEEE Conference on Computer Vision and Pattern Recognition, Las Vegas, NV, USA, 27–30 June 2016; pp. 770–778. [Google Scholar]
- Song, X.; Chen, K.; Cao, Z. ResNet-based Image Classification of Railway Shelling Defect. In Proceedings of the 2020 39th Chinese Control Conference (CCC), Shenyang, China, 27–29 July 2020; pp. 6589–6593. [Google Scholar]
- Zhu, Y.; Chen, Y.; Lu, Z.; Pan, S.J.; Xue, G.R.; Yu, Y.; Yang, Q. Heterogeneous transfer learning for image classification. In Proceedings of the Twenty-Fifth AAAI Conference on Artificial Intelligence, San Francisco, CA, USA, 7–11 August 2011. [Google Scholar]
- Xiao, C.; Lei, Y.; Ma, Y.; Zhou, F.; Qin, Z. DeepSeg: Deep-Learning-Based Activity Segmentation Framework for Activity Recognition Using WiFi. IEEE Internet Things J. 2020, 8, 5669–5681. [Google Scholar] [CrossRef]
- Tian, Y.; Li, S.; Chen, C.; Zhang, Q.; Zhuang, C.; Ding, X. Small CSI Samples-Based Activity Recognition: A Deep Learning Approach Using Multidimensional Features. Secur. Commun. Netw. 2021, 2021, 5632298. [Google Scholar] [CrossRef]


| Parameter | Value |
|---|---|
| Image size | 224 × 224 |
| Epoch | 30 |
| Batch size | 16 |
| Initial learning rate | 0.001 |
| Lr-function | StepLR |
| Human Activity | Precision | Recall | F1-Score |
|---|---|---|---|
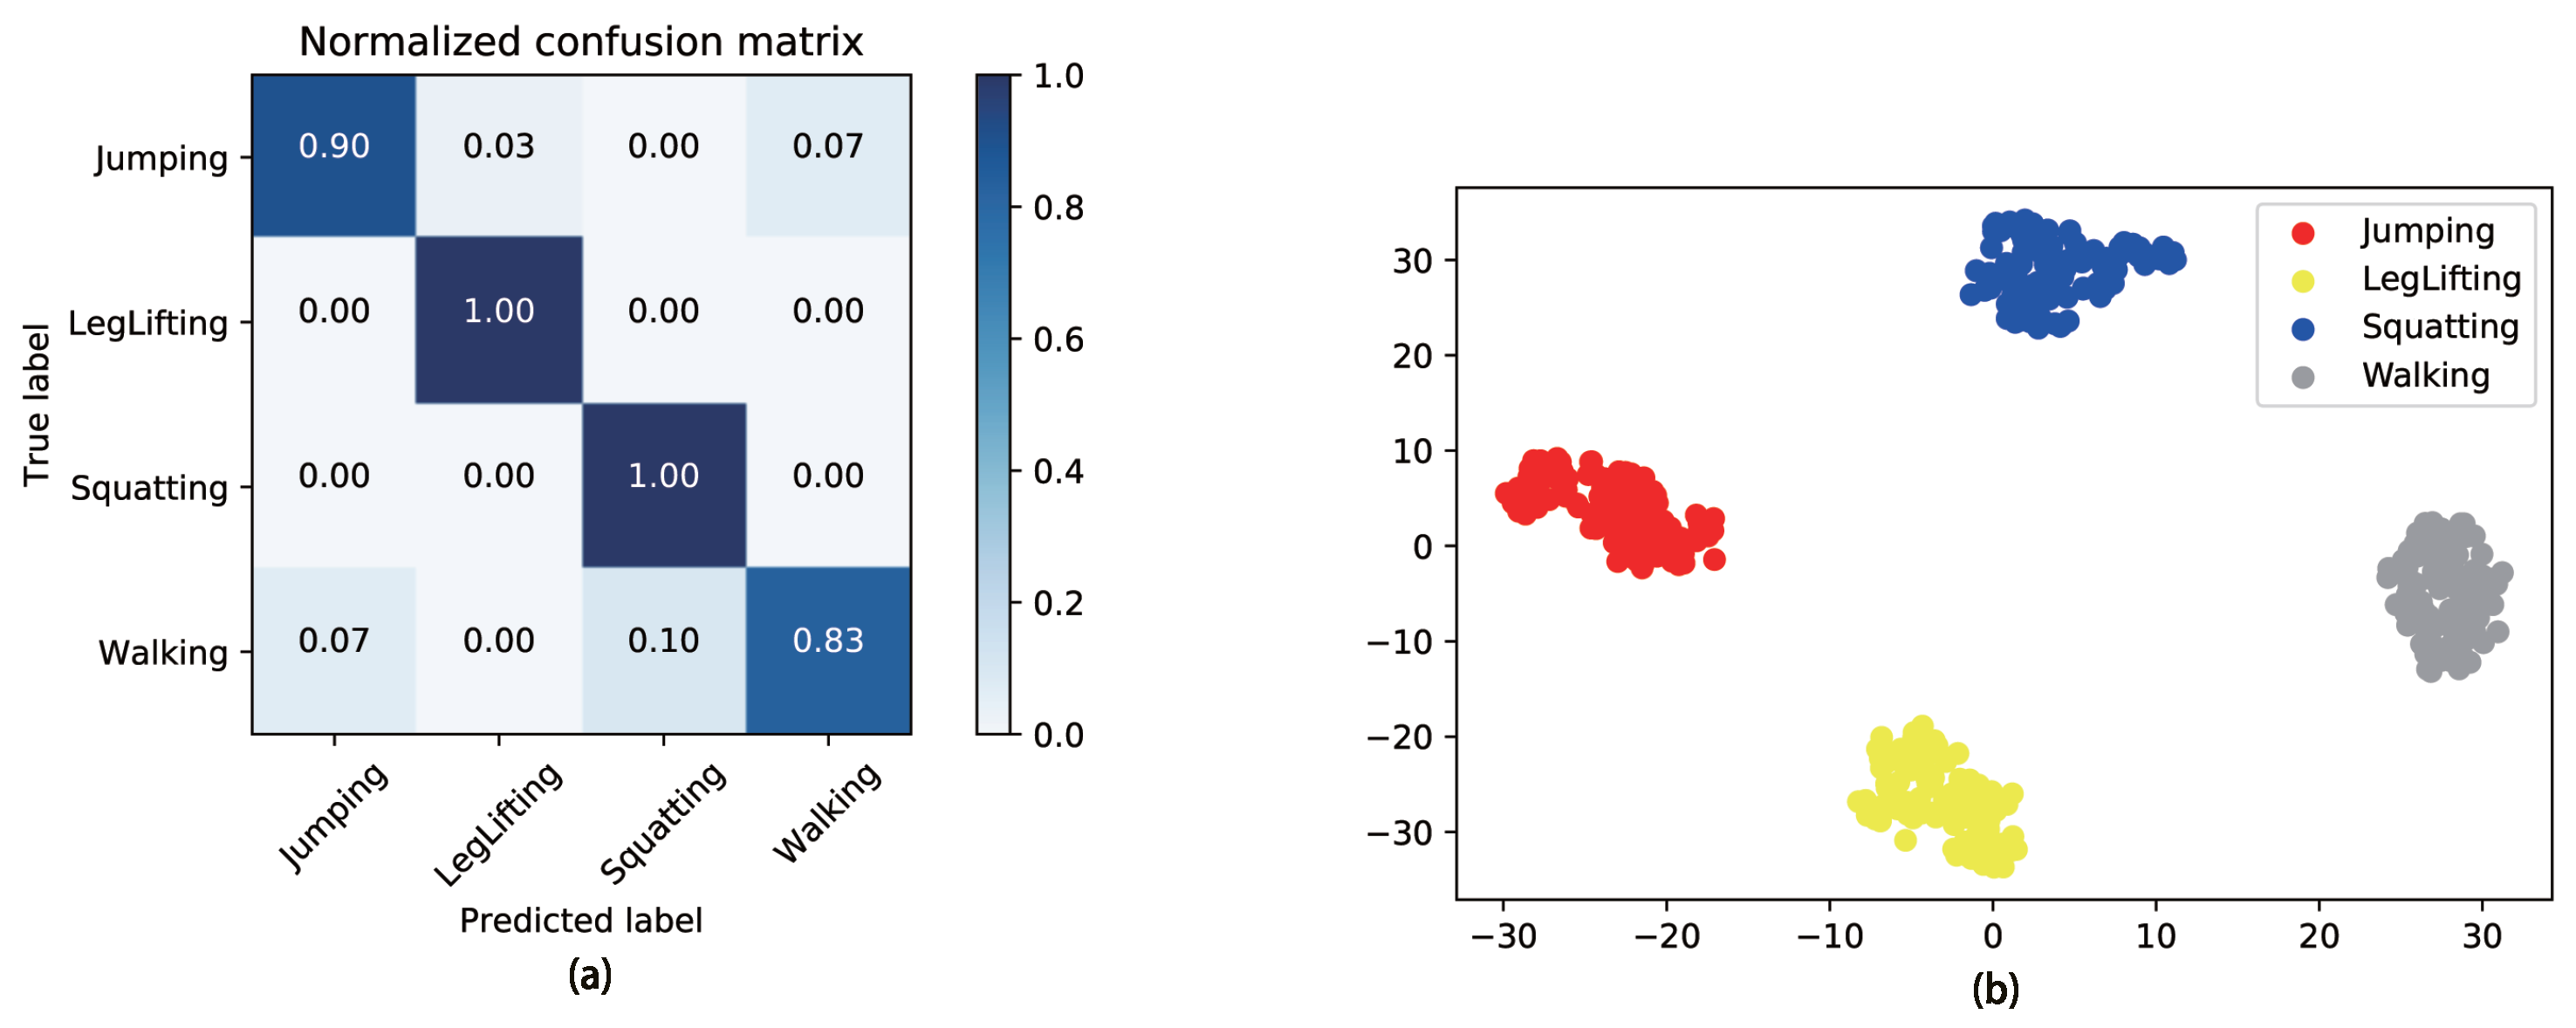
| Jumping | 0.90 | 0.87 | 0.93 |
| Leg Lifting | 1.00 | 0.97 | 0.98 |
| Squatting | 1.00 | 1.00 | 0.97 |
| Walking | 0.83 | 0.93 | 0.92 |
| Human Activity | Precision | Recall | F1-Score |
|---|---|---|---|
| Drawing O | 1.00 | 1.00 | 1.00 |
| Hand Swing | 0.96 | 0.87 | 0.91 |
| Running | 0.94 | 0.97 | 0.95 |
| Squatting | 0.94 | 1.00 | 0.97 |
| CNN Models | Accuracy Rate | Time Consumption |
|---|---|---|
| AlexNet | 85.00% | 4 m 22 s |
| Vgg11 | 91.67% | 7 m 33 s |
| Vgg13 | 92.50% | 9 m 16 s |
| Vgg16 | 92.67% | 10 m 45 s |
| Vgg19 | 93.33% | 13 m 10 s |
| ResNet18 | 94.17% | 3 m 29 s |
| ResNet34 | 90.00% | 5 m 23 s |
| ResNet50 | 84.17% | 6 m 43 s |
| ResNet101 | 86.67% | 8 m 17 s |
| ResNet152 | 92.50% | 10 m 23 s |
| Machine Learning Algorithms | Accuracy Rate |
|---|---|
| Naive Bayesian | 44% |
| KNN | 58% |
| Decision tree | 65% |
| SVM | 74% |
| Proposed | 94% |
Disclaimer/Publisher’s Note: The statements, opinions and data contained in all publications are solely those of the individual author(s) and contributor(s) and not of MDPI and/or the editor(s). MDPI and/or the editor(s) disclaim responsibility for any injury to people or property resulting from any ideas, methods, instructions or products referred to in the content. |
© 2024 by the authors. Licensee MDPI, Basel, Switzerland. This article is an open access article distributed under the terms and conditions of the Creative Commons Attribution (CC BY) license (https://creativecommons.org/licenses/by/4.0/).
Share and Cite
Ye, K.; Wu, S.; Cai, Y.; Zhou, L.; Xiao, L.; Zhang, X.; Zheng, Z.; Lin, J. Transfer-Learning-Based Human Activity Recognition Using Antenna Array. Remote Sens. 2024, 16, 845. https://doi.org/10.3390/rs16050845
Ye K, Wu S, Cai Y, Zhou L, Xiao L, Zhang X, Zheng Z, Lin J. Transfer-Learning-Based Human Activity Recognition Using Antenna Array. Remote Sensing. 2024; 16(5):845. https://doi.org/10.3390/rs16050845
Chicago/Turabian StyleYe, Kun, Sheng Wu, Yongbin Cai, Lang Zhou, Lijun Xiao, Xuebo Zhang, Zheng Zheng, and Jiaqing Lin. 2024. "Transfer-Learning-Based Human Activity Recognition Using Antenna Array" Remote Sensing 16, no. 5: 845. https://doi.org/10.3390/rs16050845
APA StyleYe, K., Wu, S., Cai, Y., Zhou, L., Xiao, L., Zhang, X., Zheng, Z., & Lin, J. (2024). Transfer-Learning-Based Human Activity Recognition Using Antenna Array. Remote Sensing, 16(5), 845. https://doi.org/10.3390/rs16050845