Article

Multi-View Scene Classification Based on Feature Integration and Evidence Decision Fusion

1
School of Remote Sensing and Geomatics Engineering, Nanjing University of Information Science and Technology, Nanjing 210044, China
2
State Key Laboratory of Remote Sensing Science, Beijing Normal University, Beijing 100875, China
3
Department of Environmental Sciences, Emory University, Atlanta, GA 30322, USA
*
Author to whom correspondence should be addressed.
Remote Sens. 2024, 16(5), 738; https://doi.org/10.3390/rs16050738
Submission received: 15 January 2024 / Revised: 14 February 2024 / Accepted: 18 February 2024 / Published: 20 February 2024
(This article belongs to the Special Issue Advances in Deep Learning Approaches in Remote Sensing)

Abstract

:
Leveraging multi-view remote sensing images in scene classification tasks significantly enhances the precision of such classifications. This approach, however, poses challenges due to the simultaneous use of multi-view images, which often leads to a misalignment between the visual content and semantic labels, thus complicating the classification process. In addition, as the number of image viewpoints increases, the quality problem for remote sensing images further limits the effectiveness of multi-view image classification. Traditional scene classification methods predominantly employ SoftMax deep learning techniques, which lack the capability to assess the quality of remote sensing images or to provide explicit explanations for the network’s predictive outcomes. To address these issues, this paper introduces a novel end-to-end multi-view decision fusion network specifically designed for remote sensing scene classification. The network integrates information from multi-view remote sensing images under the guidance of image credibility and uncertainty, and when the multi-view image fusion process encounters conflicts, it greatly alleviates the conflicts and provides more reasonable and credible predictions for the multi-view scene classification results. Initially, multi-scale features are extracted from the multi-view images using convolutional neural networks (CNNs). Following this, an asymptotic adaptive feature fusion module (AAFFM) is constructed to gradually integrate these multi-scale features. An adaptive spatial fusion method is then applied to assign different spatial weights to the multi-scale feature maps, thereby significantly enhancing the model’s feature discrimination capability. Finally, an evidence decision fusion module (EDFM), utilizing evidence theory and the Dirichlet distribution, is developed. This module quantitatively assesses the uncertainty in the multi-perspective image classification process. Through the fusing of multi-perspective remote sensing image information in this module, a rational explanation for the prediction results is provided. The efficacy of the proposed method was validated through experiments conducted on the AiRound and CV-BrCT datasets. The results show that our method not only improves single-view scene classification results but also advances multi-view remote sensing scene classification results by accurately characterizing the scene and mitigating the conflicting nature of the fusion process.

Graphical Abstract

1. Introduction

In the realm of remote sensing, the burgeoning availability of big data and open remote sensing image datasets has significantly enriched the information content in high-resolution remote sensing images [1]. This development has rendered the rapid analysis of inherent laws and characteristics of remote sensing images increasingly crucial, posing a considerable challenge in the application of remote sensing imagery [2]. Remote sensing scene classification, which focuses on extracting semantic features from remote sensing images and assigning appropriate labels based on the content, is pivotal in intelligently interpreting these images. Its relevance is underscored by its extensive range of applications in areas such as urban planning, natural disaster detection, environmental monitoring, and land use classification [3,4].
Current scene classification methodologies encompass a range of features, including manual, unsupervised learning, and deep learning features [5,6]. Methods based on manual features typically concentrate on crafting various manual features to represent key characteristics of scene images, such as color, texture [7,8], and shape [9]. However, these features, designed from prior image knowledge, often fall short in capturing the abstract semantic information in complex remote sensing images [10]. Unsupervised feature-based learning focuses on learning the basis functions for feature encoding from manually created feature descriptors and generating learned features such as raw component analysis, sparse coding, or autoencoders [11]. This creates a new scheme in the place of human-based features, and a large number of current scene classification methods based on unsupervised learning are gradually appearing—e.g., using weighted inverse convolutional networks to learn features from the remote sensing data itself and mapping [12], unsupervised remote sensing analysis tasks based on superpixels and spatially regularized diffusion learning (S2DL) [13], unsupervised representation learning based on multilayer feature fusion fused with Wasserstein GAN [14], and unsupervised material clustering based on diffusion- and volume-maximization-based image clustering (D-VIC) for the task of classifying vegetation and other materials [15]—and have made substantial progress in scene classification. However, these features cannot fully utilize scene recognition information, resulting in poor performance in classification and recognition tasks [16]. Deep learning-based methods mainly utilize convolutional neural networks (CNNs) to automatically learn deep abstract image representations. In recent years, ShipGeoNet [17], IA-Net [18], and other CNN-based methods for feature extraction have also been increasingly proposed for applications in remote sensing. Deep learning techniques are powerful in extracting image features and providing learnable parameters and are gradually becoming a mainstream method for remote sensing scene classification [19,20,21].
The application of multi-view remote sensing images and deep learning features for scene classification is a burgeoning research area, aiming to effectively represent and interpret remote sensing images [22,23,24,25,26]. Scene classification can be divided into single-view and multi-view classifications based on the data source [23]. Single-view classification involves categorizing ground objects from a solitary perspective [10,11,16,25,26], such as using CNNs combined with Wasserstein distance for a novel loss function [25], or multi-frequency and multi-scale features being extracted using multiscale feature fusion covariance networks [26]. However, this approach often overlooks the complementary nature of data from different perspectives, limiting its effectiveness in classifications with weaker differentiation or stronger correlation [22,23,24]. Conversely, multi-view classification integrates information from various perspectives for a more comprehensive categorization. Fusion strategies at the data, feature, and decision levels are employed [27], with feature-level strategies extracting and fusing intermediate features for classification [22,23,24]. However, these strategies are contingent on the image feature extraction method, with inadequate feature learning leading to significant information loss and reduced accuracy.
Decision-level fusion strategies, which summarize predictions from multiple classifiers using diverse fusion rules [28,29,30], have shown promise in multi-view classification [31]. This approach accommodates incorrect predictions from one perspective while still yielding accurate fault-tolerant results, even with poor image quality from one viewpoint [32].
Despite advancements, challenges persist in multi-view remote sensing scene classification. Firstly, with the increase in the number of image views, the quality problem in remote sensing images becomes an important factor limiting the effectiveness of multi-view image classification. Different views, lighting conditions, and other factors may lead to differences in image quality, thus affecting the classification effectiveness. Multi-view remote sensing images need to be simultaneously utilized in the network classification process, and if the feature discrimination ability of the network is not strong, it cannot effectively distinguish the features of remote sensing images from different views. In particular, when images from different views of the same category present different feature elements, the simple network will destroy the features of remote sensing images from different views to a certain extent and cannot make full use of the complementary information of the remote sensing images, which is contrary to the original intention of multi-view scene classification. Secondly, in the process of multi-view information fusion, there will inevitably be conflicts between aerial images and ground images, and the traditional evidence fusion rules cannot effectively deal with this conflicting evidence, resulting in the classification process of certain evidence values running contrary to common sense. Thus, there is a certain bias in intuitive cognition, and the fusion of aerial evidence and ground evidence requires better validity and adaptability and cannot provide a reasonable explanation for the final prediction results. For instance, Zhao et al. [31] incorporated deep evidence learning theory in multi-view classification, but issues remain in terms of inadequate feature expression and unaddressed conflicts during evidence fusion.
In order to solve the above problems, this paper proposes a new multi-view fusion architecture, the Multi-view Evidence Decision Fusion Network (MVEDFN). The main contributions of this paper can be summarized as follows:
  • The proposed MVEDFN method can process multi-view remote sensing images at the same time, enhance the reliability and anti-interference level of scene classification, realize multi-view scene classification end to end, and further improve the accuracy of multi-view remote sensing scene classification.
  • In order to reduce information loss from multi-view images and generate more discriminative and robust classification features, an Asymptotic Adaptive Feature Fusion Module (AAFFM) is proposed. The AAFFM can quickly fuse multi-scale features from multi-view images, which is beneficial for the subsequent classification of multi-view scenes.
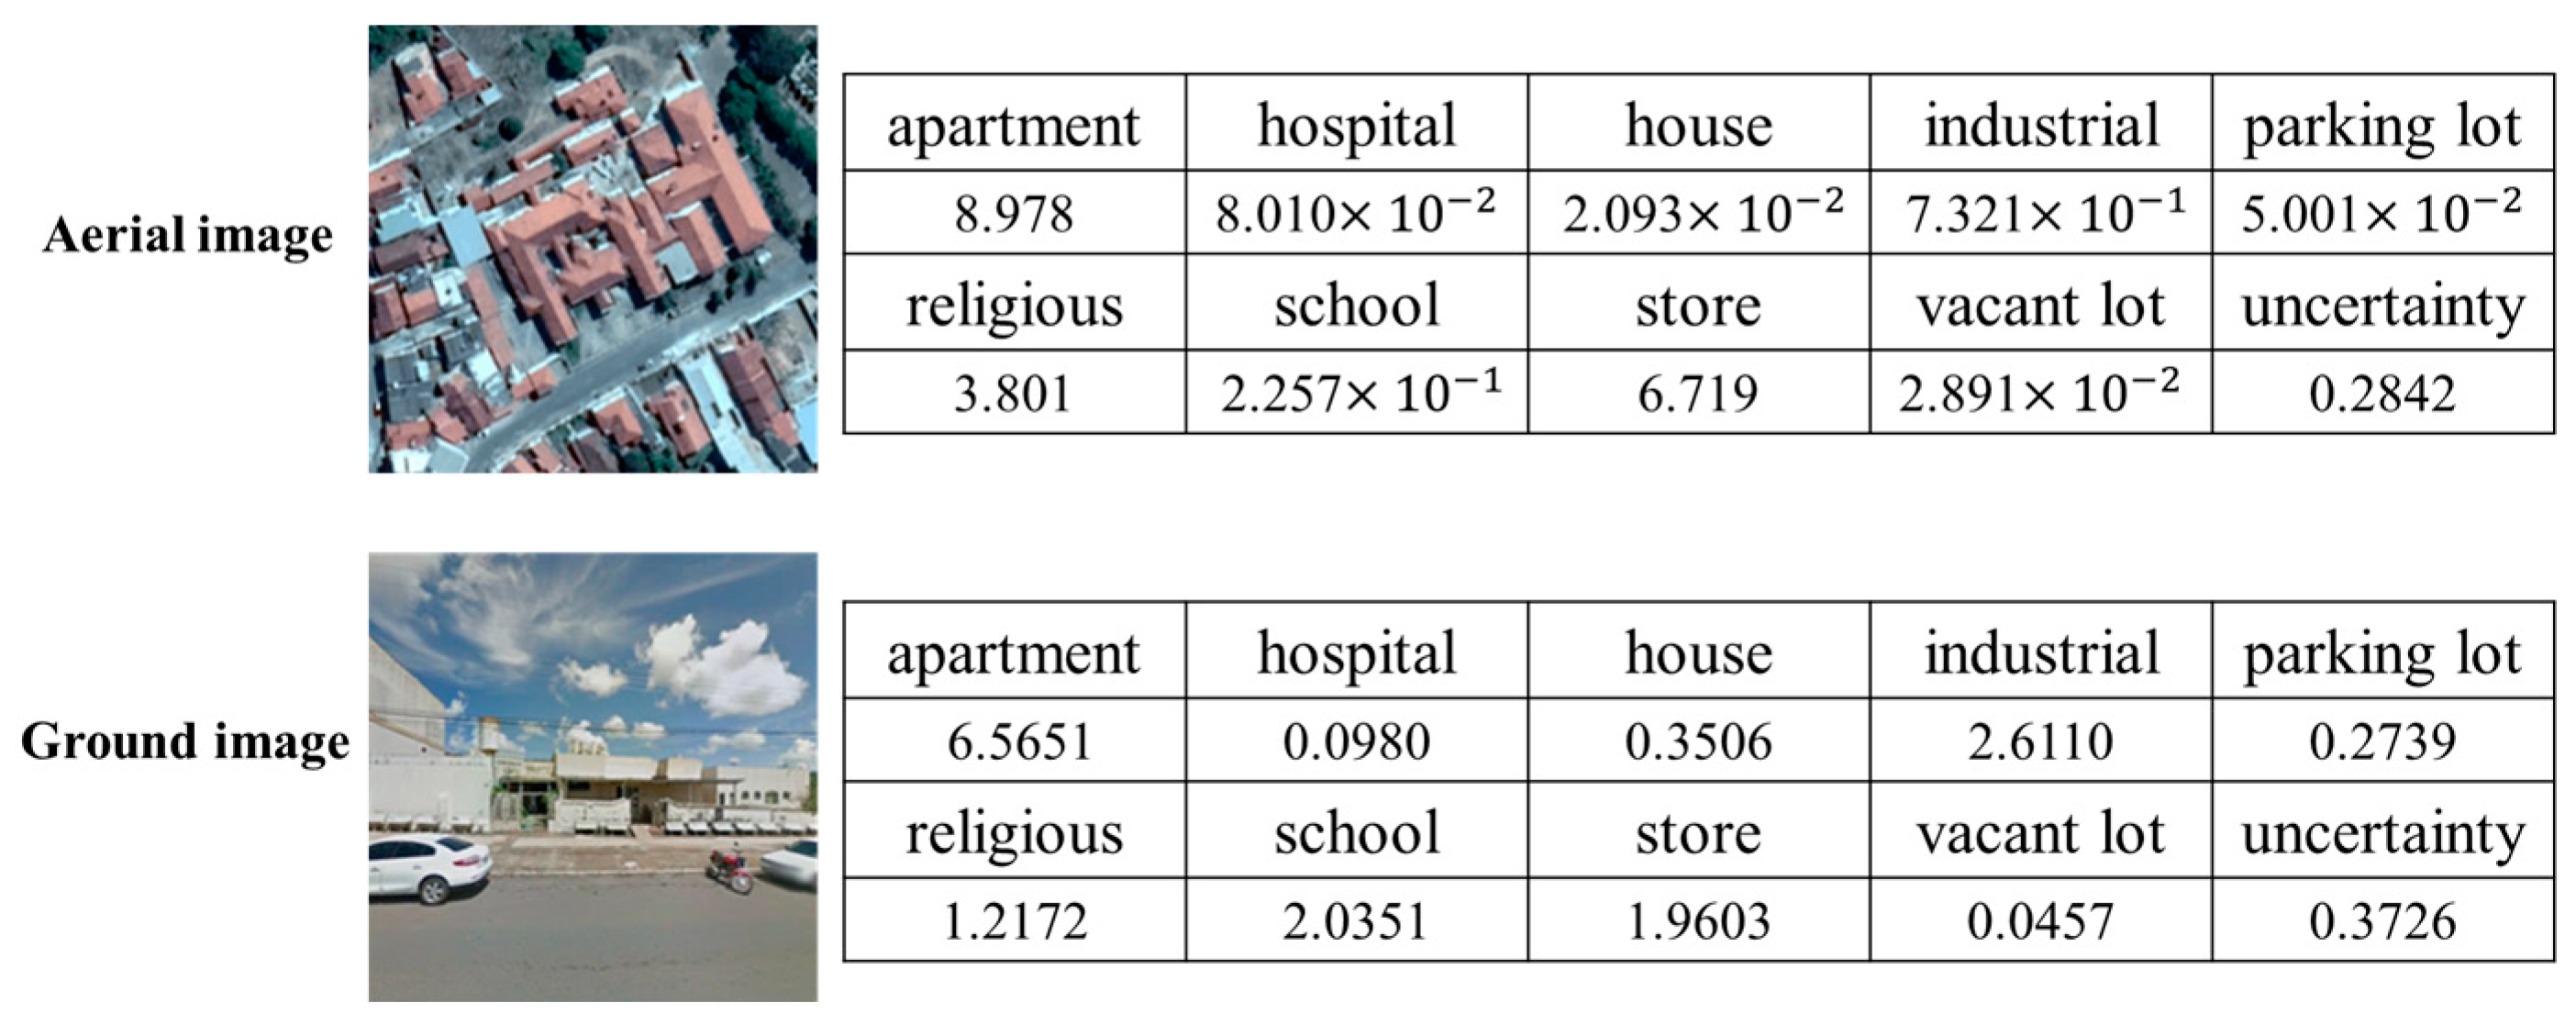
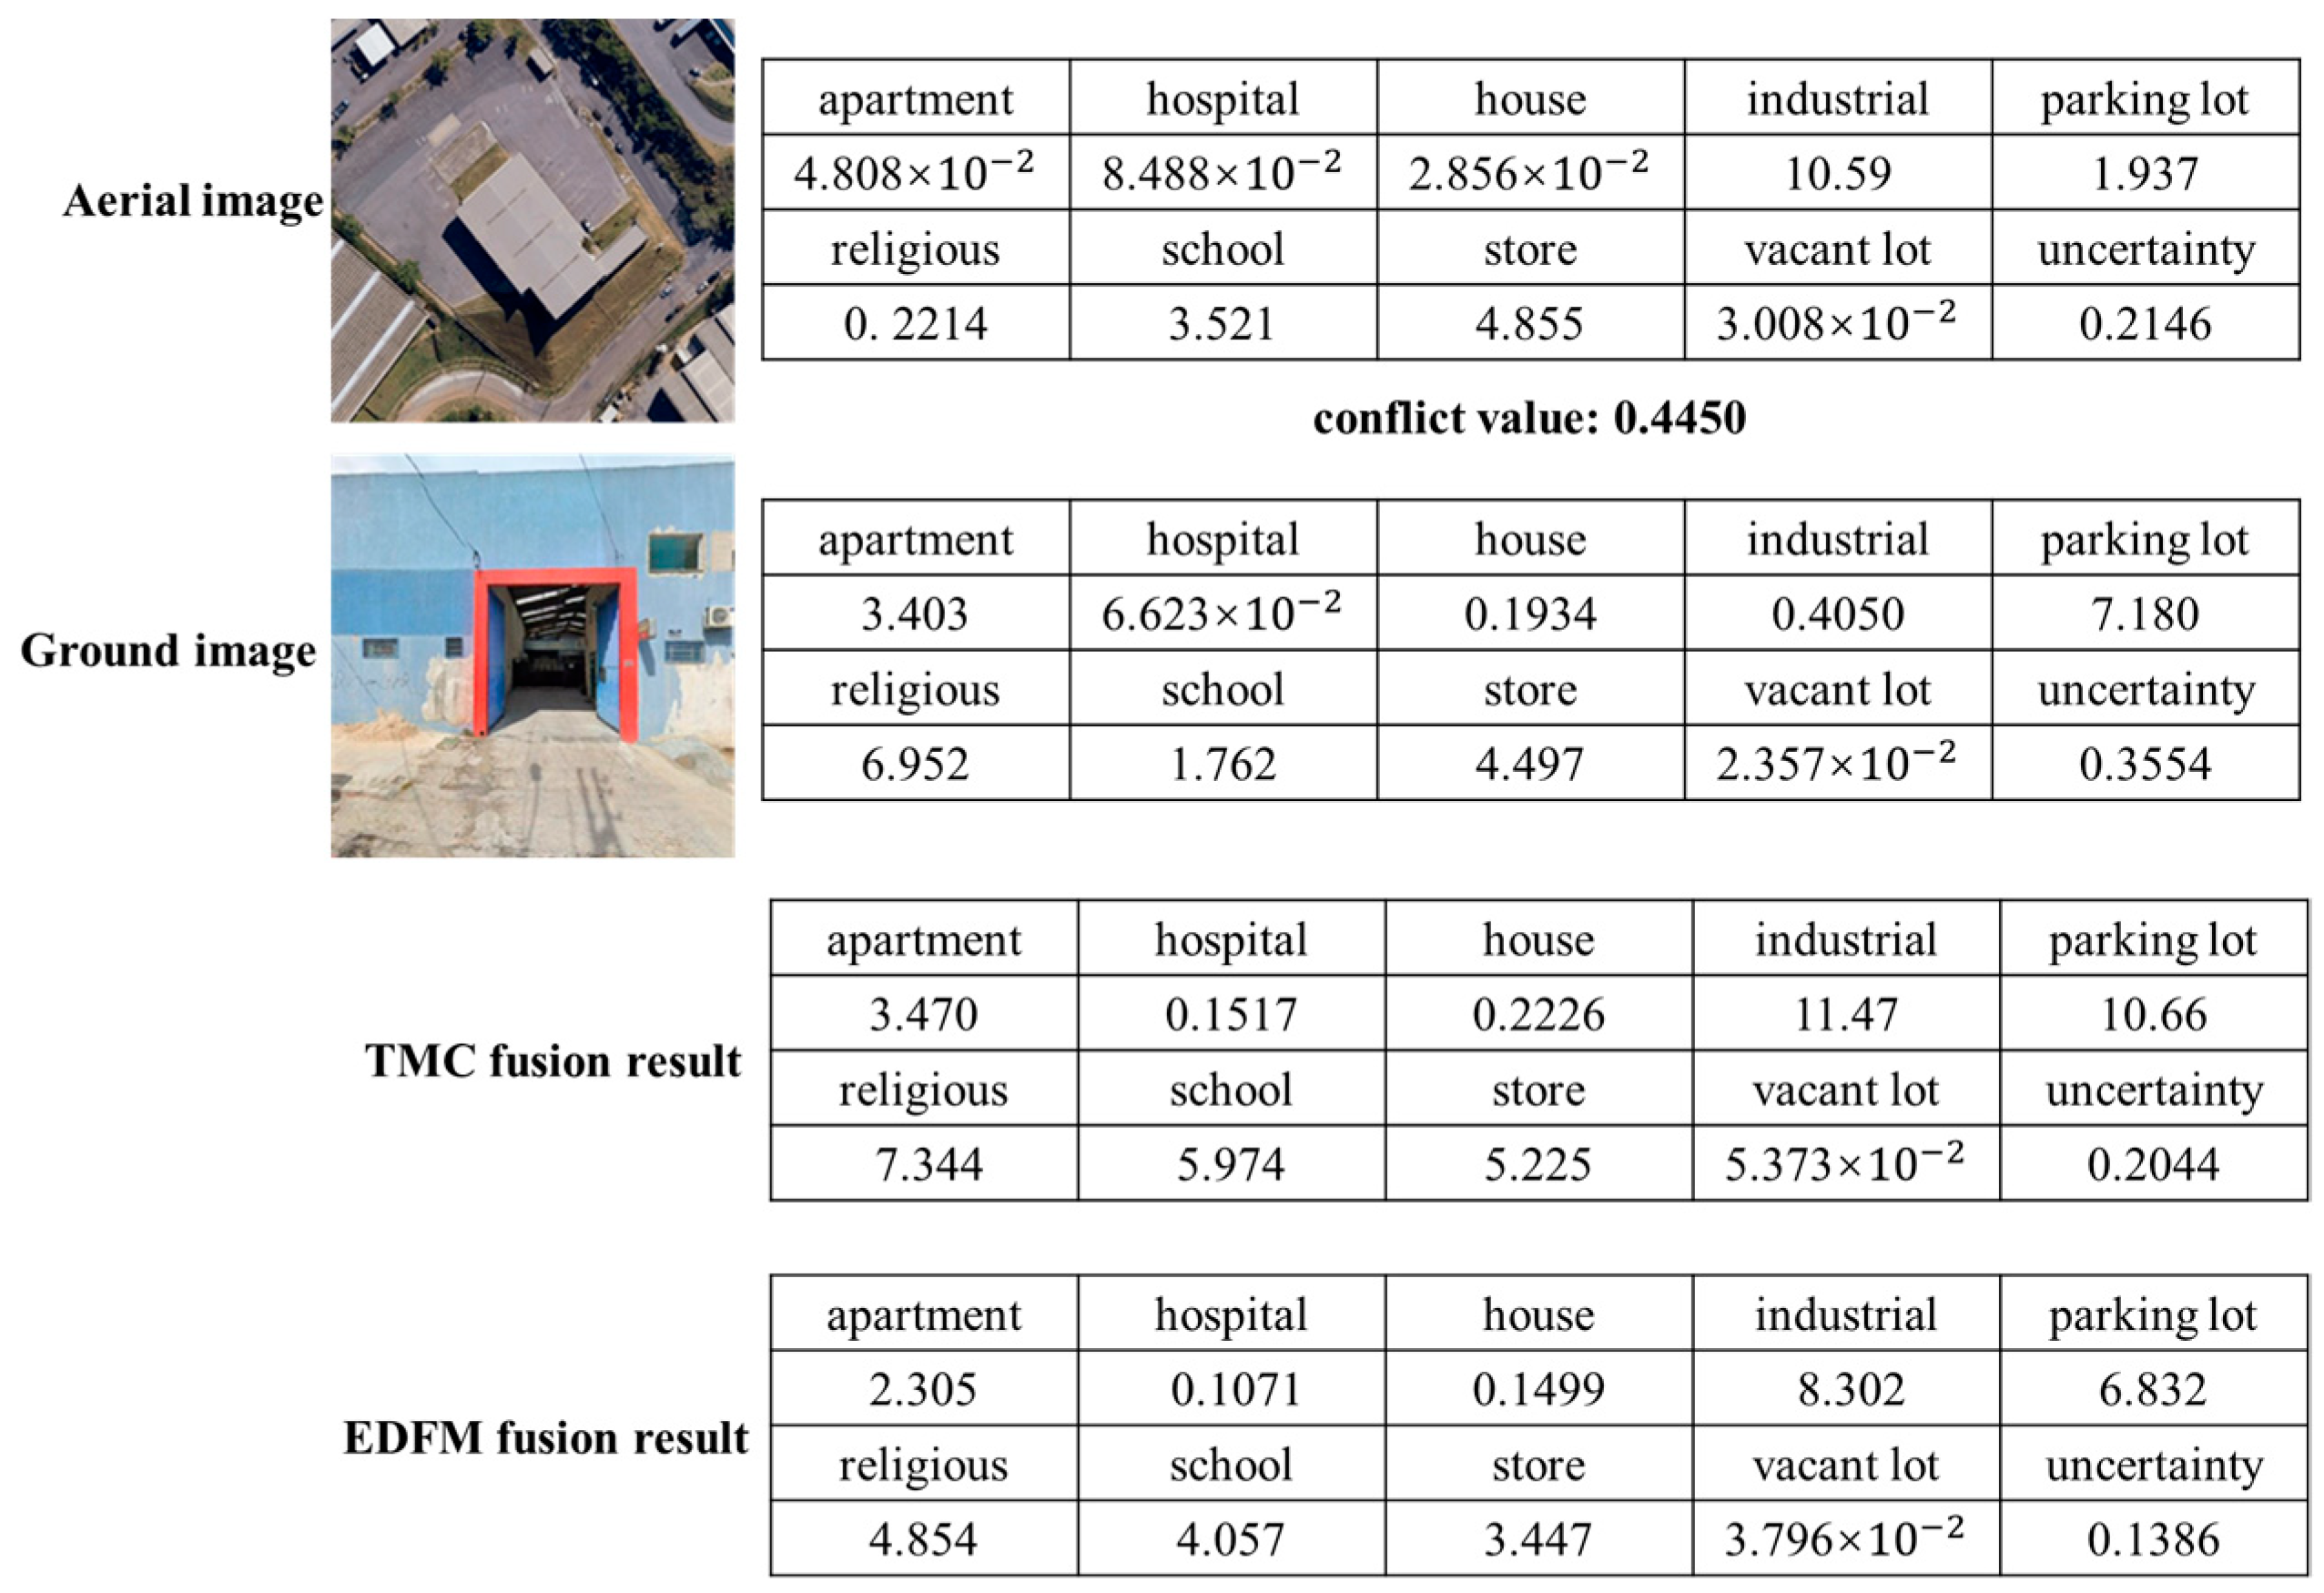
  • An Evidence Decision Fusion Module (EDFM) is proposed based on evidence theory. The module can combine Dirichlet distributions to dynamically evaluate and integrate multi-view feature information, effectively mitigating conflicts between aerial and ground imagery information and rendering the evidentiary data more consistent, with intuition and conclusions to accomplish a reliable classification task performance.
Tested on two public multi-view remote sensing image datasets, the proposed method demonstrates the effective integration of multi-view information and improved accuracy in scene classification compared to other methods.

2. Methods

In this section, we introduce MVEDFN, a novel framework for multi-view scene classification. The discussion is divided into two parts: an overview of MVEDFN’s network architecture (including its key modules) and the loss function used to train the network.

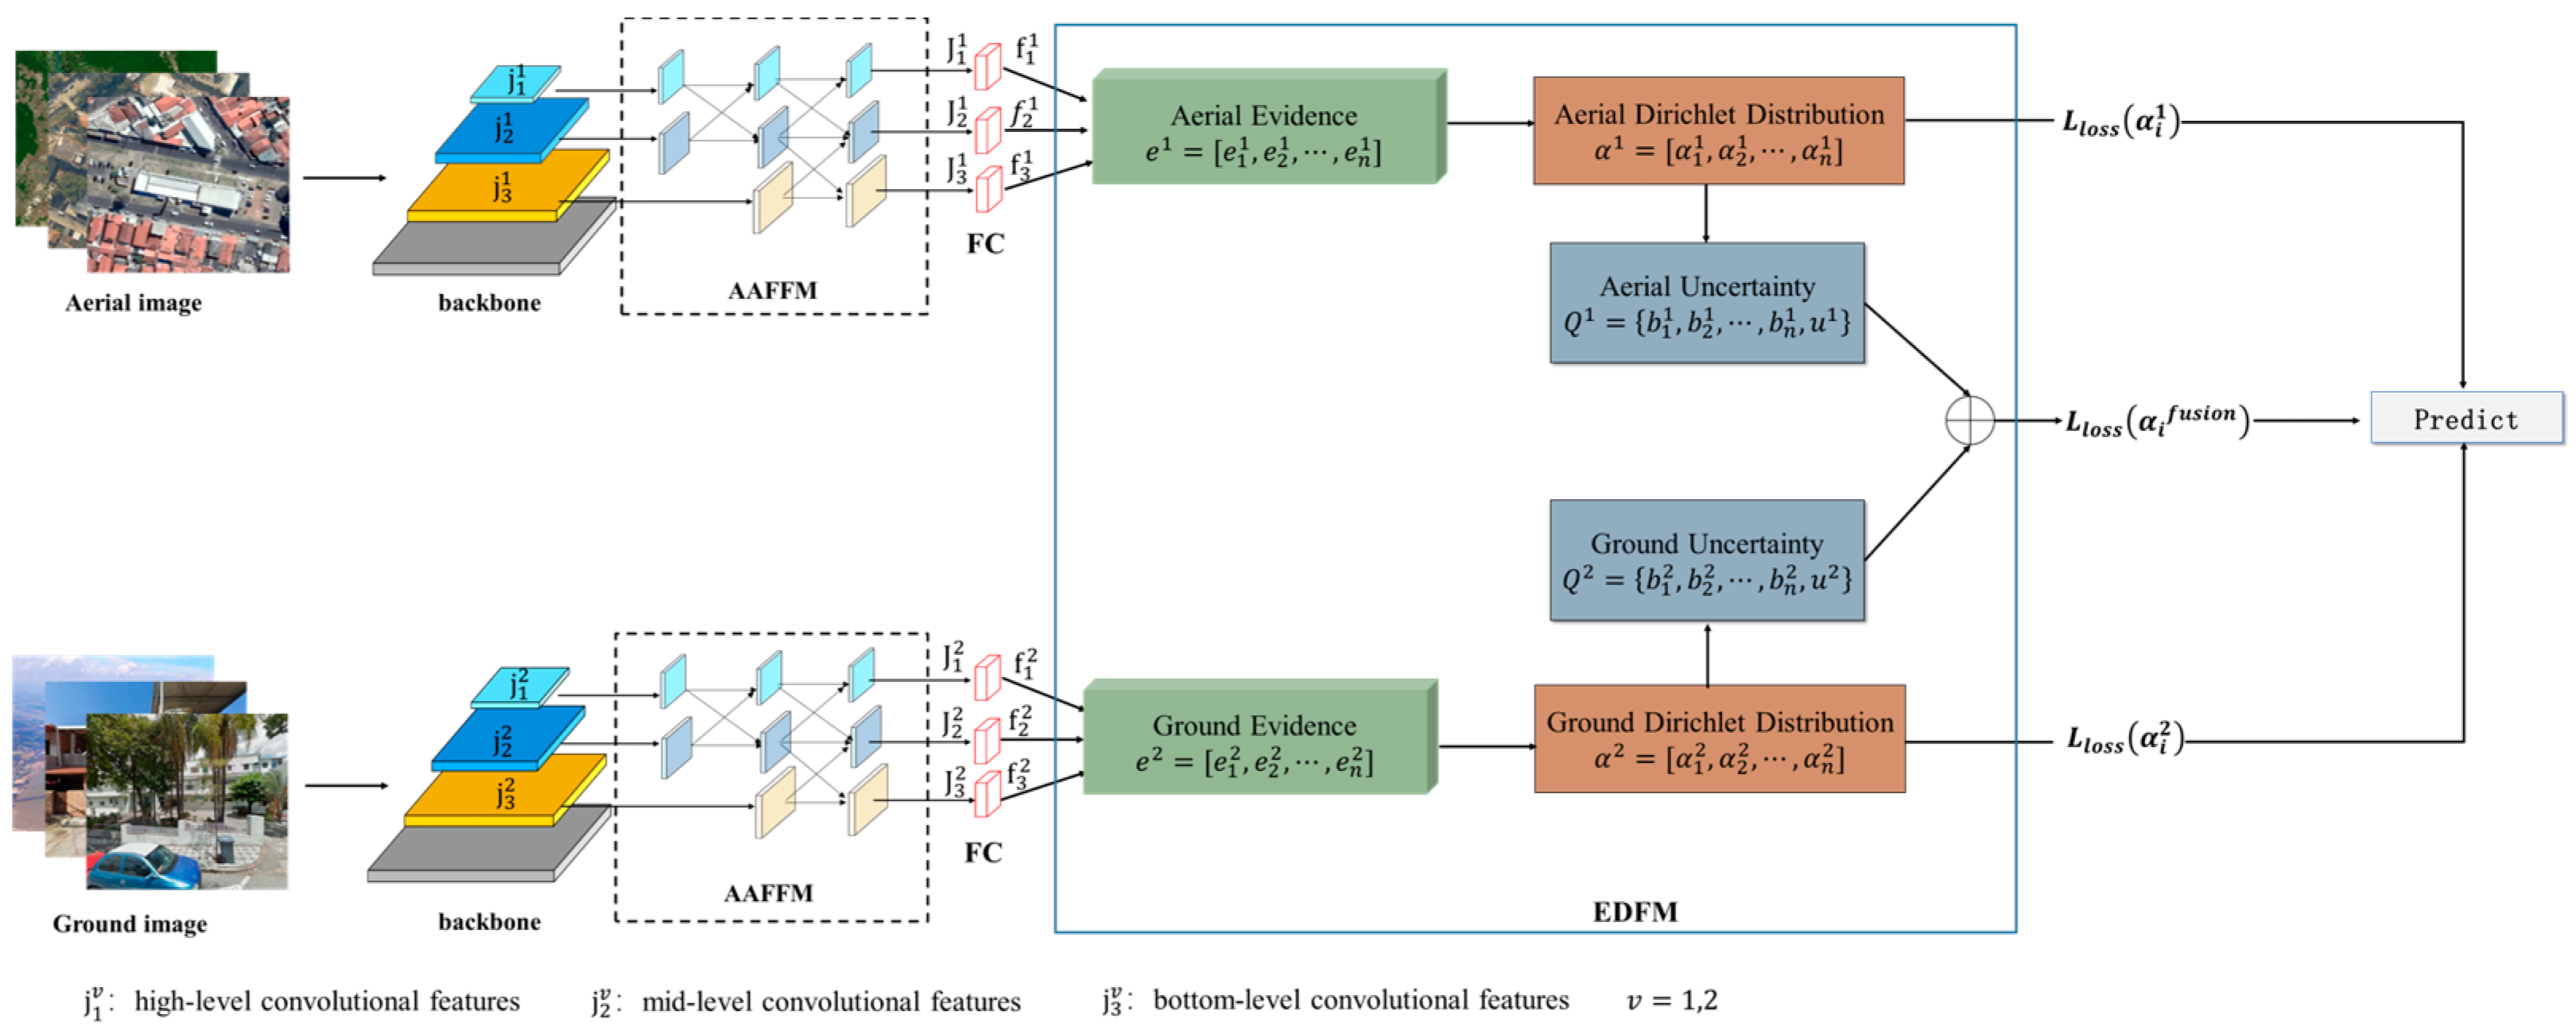
2.1. Methodology Overview

In this paper, the MVEDFN method is proposed for a multi-view remote sensing scene classification task. The MVEDFN method mainly consists of two parts, the AAFFM and the EDFM, which are shown in Figure 1.
The MVEDFN method utilizes aerial and ground images from the same category to create multi-view image pairs as inputs. During the training process, aerial and ground images undergo separate processing via a CNN and an AAFFM. Then, the EDFM is applied to complete the classification of multi-view remote sensing scenes. Specifically, the image is initially processed through a convolutional neural network, which generates multi-scale feature vectors j 1 v , j 2 v , j 3 v v = 1,2 . These vectors are then subjected to feature augmentation and fusion, resulting in the formation of feature vectors  J 1 v , J 2 v , J 3 v v = 1,2 . Next, they pass through a fully connected (FC) layer with a non-negative activation function to produce multi-layer feature vectors f 1 v , f 2 v , f 3 v v = 1,2 , which are subsequently fused in the softplus layer to generate evidence vectors with stronger directionality e v v = 1,2 . The evidence vector e v produced by the AAFFM is mapped to the Dirichlet distribution α v in the EDFM, and the Dirichlet distribution models the credibility and uncertainty of the images. Finally, considering the inherent conflicts that arise during the fusion process from diverse perspectives, the conflict factors generated by the aerial and ground images are determined according to the proportion of the aerial and ground images in the classification of the multi-view scene, and decision-level information fusion is performed on the confidence and uncertainty of the aerial and ground images. The entire process utilizes complementary information from different view images end to end.

2.1.1. Asymptotic Adaptive Feature Fusion Module (AAFFM)

The scene classification task requires features that capture both structural and semantic information in the images to effectively represent the scenes [33]. Therefore, we propose an AAFFM to enhance the performance of existing convolutional neural networks. The AAFFM module integrates features from different scales of remote sensing images, enabling the comprehensive representation of the scenes.
Presently, numerous researchers are dedicated to designing feature fusion modules that enhance or refine the ability to express features to fully explore their potential in remote sensing image scene classification tasks. However, most existing feature fusion modules predominantly employ top–down or bottom–up connections for multi-scale feature fusion. In this process of multi-scale feature propagation and interaction, lower-layer features and high-level features may become lost or degraded, thereby impacting the fusion effect among the lower layer, middle layer, and high-level features [34]. Furthermore, the final three layers of the CNN feature map exemplify enhanced high-level and abstract expressive proficiency, concurrently encompassing an augmented amount of contextual information and semantic associations [33]. Opting for the final three layers of features to construct a feature fusion module facilitates the more comprehensive capture of the interrelationships among distinct segments of the image and full utilization of the network’s abstract features acquired at a deeper level.
Therefore, in this study, we select the final three stages of convolutional features extracted from a CNN as inputs for the AAFFM. We employ an asymptotic connectivity approach to asymptotically integrate feature information across different levels through hierarchical connections. The primary objective is to minimize information loss and mitigate significant semantic gaps between non-adjacent hierarchical features in comparison to adjacent ones.
Moreover, the majority of feature fusion modules, which typically involve a substantial number of computational parameters during network training, are susceptible to overfitting. Consequently, optimizing and adjusting the model becomes challenging, leading to limited generalization capabilities across remote sensing scene images with varying sizes and resolutions. During the end-to-end operation of multi-view scene classification, aerial images and ground images need to be processed at the same time, so, if the network structure is too complex and the operation parameters are large, this will increase the burden of the network, making the network run too slowly and reducing the stability of feature extraction. Therefore, in this study, we employ Adaptive Spatial Fusion (ASFF) [35] to assign distinct spatial weights to the multi-scale convolutional feature maps. This approach aims to amplify the significance of key layers within the convolutional feature maps and alleviate any conflicting information across different layers. The AAFFM initially selects the high-level convolutional features ( j 1 v ), mid-level convolutional features ( j 2 v ), and bottom-level convolutional features ( j 3 v ) from ResNet101 to construct a multi-scale convolutional feature vector { j 1 v , j 2 v , j 3 v } as inputs. Subsequently, these multi-scale convolutional feature vectors { j 1 v , j 2 v , j 3 v } are forwarded to the AAFFM to enhance and refine the features.
The AAFFM employs asymptotic fusion to link multi-scale features, which involves two main steps: aligning the size and number of channels in convolutional features and adaptively fusing multi-layer convolutional features. The alignment of feature sizes and channel numbers is primarily achieved through up-sampling and down-sampling operations. Specifically, during the up-sampling and fusion process from high-level features ( j 1 v ) to mid-level features ( j 2 v ) and bottom-level features ( j 3 v ) , the size and number of channels in multi-scale feature maps are aligned using 1 × 1 convolutions and bilinear interpolation. Specifically, each feature needs to be adjusted to the same size before fusion, and when fusing high-level features and mid-level features, the up-sampling fusion process from high-level features to mid-level features uses bilinear interpolation with a size scaling factor of 2 to adjust the high-level features to the size of the mid-level features, and the down-sampling fusion process from mid-level features to high-level features uses a 3 × 3 convolution kernel with a step size of 2 to adjust the mid-level features to the size of the high-level features. The down-sampling fusion process from mid-level features to high-level features uses a 3 × 3 convolution kernel with a step size of 2 to adjust the mid-level features to the high-level feature size. Similarly, when fusing the high-level features, mid-level features, and bottom-level features, the high-level features are adjusted to the mid-level feature size and bottom-level feature size, respectively, using bilinear interpolation with size scaling factors of 2 and 4, and the mid-level features are adjusted to the mid-level and high-level feature sizes by using a 3 × 3 convolutional kernel with a step size of 2. Finally, 1 × 1 convolution is used to adjust the number of channels of different layer features to the same size.
After aligning the dimensions and number of channels across different layers of features, the multi-scale convolutional features are weighted through adaptive spatial fusion. The equations are as follows:
J x y l = α x y l · j x y 1 l + β x y l · j x y 2 l
M x y l = δ x y l · m x y 1 l + θ x y l · m x y 2 l + γ x y l · m x y 3 l
The high-level feature and mid-level feature are linearly combined using Equation (1) during fusion. Additionally, the high-level feature, mid-level feature, and bottom-level feature are linearly combined using Equation (2) during fusion, where J x y l and M x y l represents the l-th layer’s feature at position (x, y) in the image; let j x y n l and m x y n l denote the feature vector at position (x, y) from level n to level l. The learnable weight parameters α, β, δ , θ and γ are utilized to represent the importance of each layer’s feature map in different levels of fusion, where α x y l , β x y l , δ x y l , θ x y l  and γ x y l indicate their respective values at position (x, y). Equation (1) satisfies α x y l + β x y l = 1 with  α x y l and β x y l constrained within [0, 1], while Equation (2) satisfies   δ x y l + θ x y l + γ x y l = 1   w i t h   δ x y l ,   θ x y l ,   a n d   γ x y l  constrained within [0, 1].
Finally, after asymptotic fusion to obtain the high-, middle-, and bottom-level multi-scale features  J 1 v , J 2 v , J 3 v connected to the fully connected layer, respectively, they are fused again in the softplus layer, which is used to initially output the evidence containing category labels. The AAFFM enhances the adaptability of the convolutional neural network to both aerial and ground view images. Moreover, this fusion module introduces minimal additional parameters, resulting in a lightweight structure and fast training speed. The evidence vector obtained through the AAFFM exhibits enhanced feature expression, thereby facilitating subsequent classification tasks.

2.1.2. Evidence Decision Fusion Module (EDFM)

Currently, in most scene classification tasks, the maximum output of the SoftMax classification layer is commonly used as an indicator of confidence for predicting the target value. However, it should be noted that SoftMax can only provide a single estimate of the probability associated with an image category and fails to capture any uncertainty in the prediction [36]. Consequently, this approach may lead to risky categorization results with low confidence levels and a higher likelihood of erroneous predictions. The Dirichlet distribution is increasingly being employed in diverse classification tasks owing to its capacity to yield more plausible predictions [37]. The EDFM is employed to map the credibility and uncertainty of multi-view remote sensing images by utilizing the Dirichlet distribution [37,38].
Specifically, the evidence vector e v = [ e 1 v , e 2 v , , e n v ] is transformed into the Dirichlet distribution α v = [ α 1 v , α 2 v , , α n v ] , based on the subjective logic theory. The parameters of the Delicacy distribution and the evidence vector are specified as shown in the following equation:
α n v = e n v + 1
where α n v denotes the Dirichlet distribution of the v-th viewpoint image and e n v denotes the evidence vector of the v-th viewpoint image.
Secondly, the confidence and uncertainty of the aerial view and ground view images are acquired utilizing the subjective logic theory, as depicted in the following equation:
n = 1 n b n v + u v = 1
where v specifically denotes the number of views, v = 1 for aerial view images, v = 2 for ground view images, n is the number of categories, b n v denotes the confidence that the classification result belongs to the n-th category, and u v denotes the overall uncertainty.
Therefore, the relationship between the image Dirichlet distribution and credibility and uncertainty can be specifically written as shown in Equations (5) and (6):
b n v = e n v α 0 v = α n v 1 i = 1 n α i v
u v = n α 0 v = n i = 1 n α i v
where α 0 v = i = 1 n ( e i v + 1 ) = i = 1 n α i v denotes the overall energy of the Dirichlet distribution. Thus, the parameters of the Dirichlet distribution are interconnected with every evidence point in the image.
Finally, a novel decision fusion rule is proposed based on Q 1 and Q 2 to accomplish the integration of aerial and ground images, looking at each of the credibility and uncertainty points in the aerial and ground imagery as a whole. From the initial point of how conflict factors arise in the fusion process of the two perspectives, it is essential to devise a simple and effective approach to assigning them. In the fusion process of aerial and ground images, we propose the multiplication and addition of non-conflicting Q 1 and Q 2 . Instead, Q 1 and Q 2 , which give rise to conflicts during the fusion of aerial and ground images, are allocated to the corresponding viewpoint images in proportion to the conflict confidence percentage b n v , thereby enhancing the confidence level and reducing uncertainty, specifically, as shown in Equations (7) and (8):
b n = b n 1 b n 2 + b n 1 u 2 + b n 2 u 1 + b n 1 + b n 2 i j b i 1 b i 2 2
u = u 1 u 2 + u 1 + u 2 i j b i 1 b i 2 2
where i j b i 1 b i 2 is the conflict factor generated when fusing aerial and ground images. From Equations (7) and (8), it can be seen that when the uncertainty of the classification results from two views is high, the confidence of the final classification results is low. When the uncertainty of the classification result from one view is low, the confidence of the final classification result is high.

2.2. Loss Function

The most commonly used loss function for scene classification tasks is the cross-entropy loss function. Unlike the traditional scene classification task, the loss function of MVEDFN is computed by integrating the Dirichlet distribution. To ensure that both perspectives can offer reasonable guidance for multi-view scene classification, the loss function of MVEDFN incorporates a hybrid approach by combining the aerial view Dirichlet distribution integral loss L l o s s α i 1 , the ground view Dirichlet distribution integral loss L l o s s α i 2 , and the fusion of multi-view with the Dirichlet distribution integral loss L l o s s α i f u s i o n during network training [31], specifically, as shown in Equations (9) and (10):
L o s s = i = 1 K L l o s s α i f u s i o n + L l o s s α i 1 + L l o s s α i 2
L l o s s α i = i = 1 n q i · φ α i n φ α i 0 i = 1 n ( 1 q i ) · 1 φ α i n φ α i 0
where φ ·   denotes a monotonically increasing digamma function, n refers to the number of image categories, K refers to the number of images, q i is the real label of the remotely sensed image, and α i n refers to the airborne, terrestrial, and fused Dirichlet distributions, respectively.

3. Experiment and Result Analysis

In this section, we present the experimental results and analysis of the MVEDFN method for classification. It is divided into three main sections: firstly, the dataset used for the classification task is described; secondly, the experimental parameters of MVEDFN are presented; and, finally, the results of the experiments are summarized and analyzed (including the results and analysis of the MVEDFN classification, the results and analysis of the ablation experiments, and the results and analysis of the comparison tests).

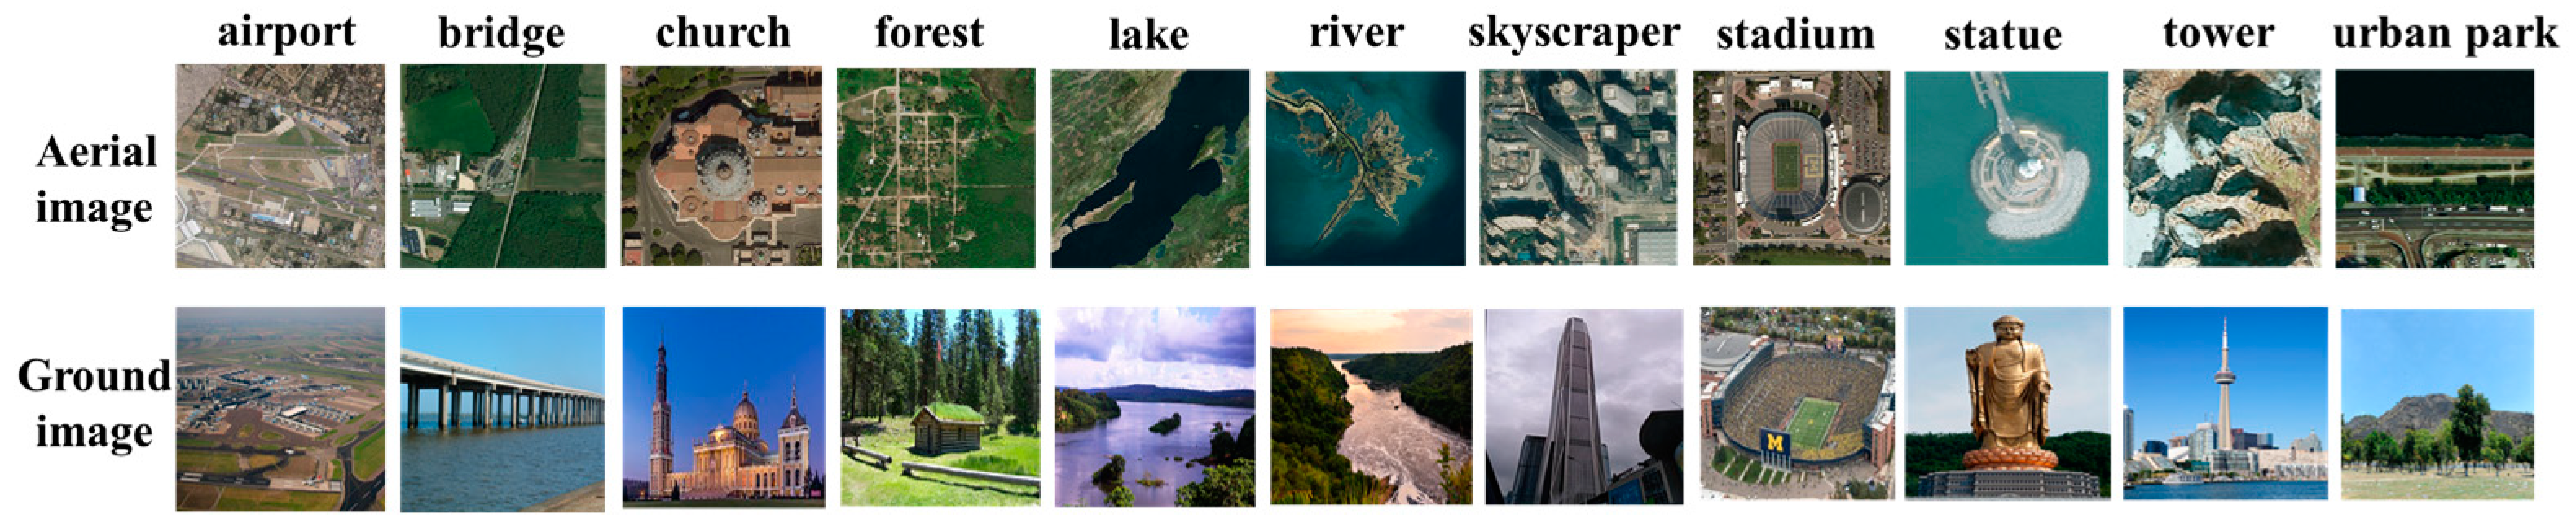
3.1. Dataset Descriptions

The experimental validation of MVEDFN involves two datasets provided by Machado et al. [22]. The first, the AiRound dataset, encompasses 11 categories, featuring 11,753 images across various scenes such as airports, bridges, churches, forests, lakes, rivers, skyscrapers, stadia, statues, towers, and urban parks. AiRound consists of images from three different perspectives: ground images, high-resolution RGB aerial images, and Sentinel-2 satellite images. The sizes of a Sentinel-2 image and an aerial image are 224 × 224 and 500 × 500 pixels, respectively. The ground images are obtained in two different ways, in different sizes. In this paper, aerial images and ground images from the AiRound dataset are selected for the multi-view scene classification task.
The second dataset, CV-BrCT, includes 9 categories with a total of 24,000 image pairs, covering scenes like apartments, hospitals, houses, industrial areas, parking lots, religious sites, schools, stores, and vacant lots. Each category in this dataset comprises images captured from two distinct perspectives, aerial and ground views, both of which comprise 500 × 500 RGB images. Illustrations of selected image pairs from these datasets are provided in Figure 2 and Figure 3.

3.2. Experimental Parameters

For dataset partitioning, 60% of the images from each category in the AiRound and CV-BrCT datasets are randomly assigned to the training set, 20% to the validation set, and the remaining 20% to the test set. The aerial and ground images are resized to dimensions of 224 × 224. The deep learning framework PyTorch is employed to construct the MVEDFN. Compared with other pre-trained networks, such as ResNet50 [39], ResNet101 [39] shows better performance on the datasets used in our experiments (the results are not provided in the article). Therefore, we selected ResNet101 pretrained on ImageNet as the backbone of the AAFFM and kept its parameters as the initialized weights in our network. The MVEDFN is trained using the stochastic gradient descent (SGD) optimizer, configured with a momentum value of 0.9 and a weight decay coefficient of 0.0001. The specific number of iterations, batch size, and learning rate for the training process are detailed in Table 1.

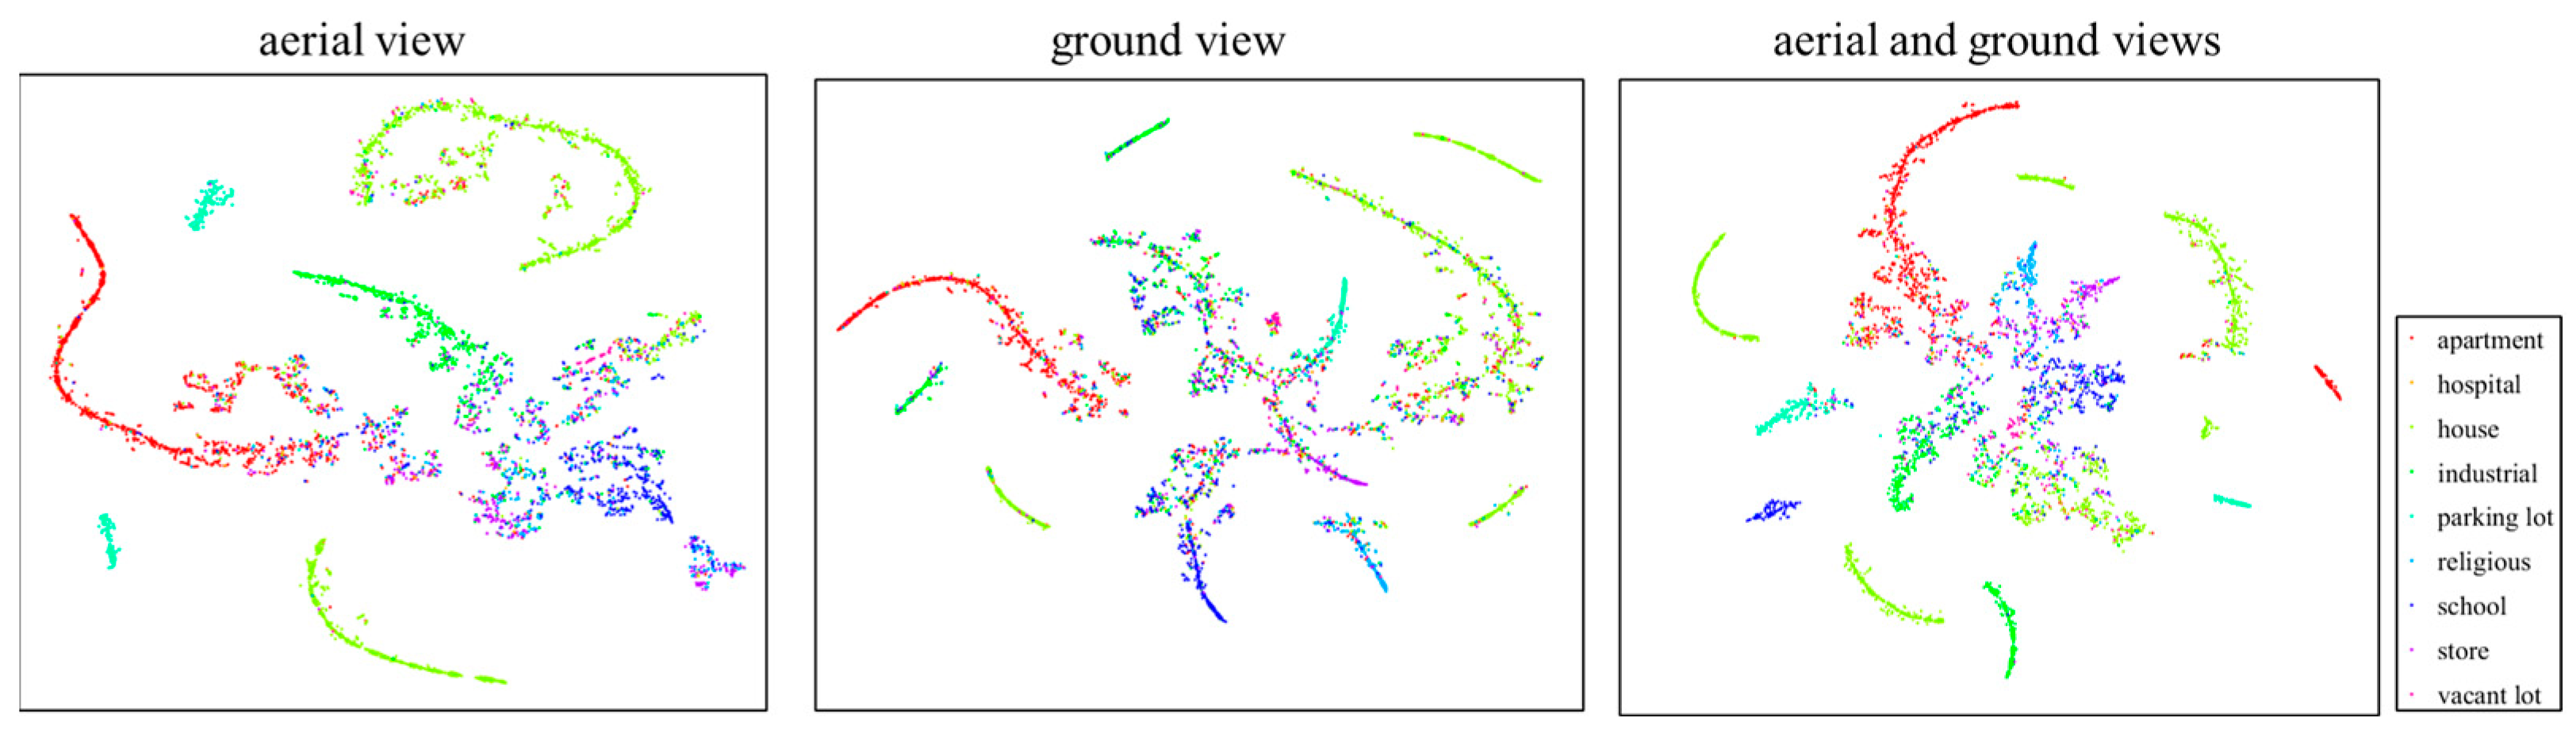
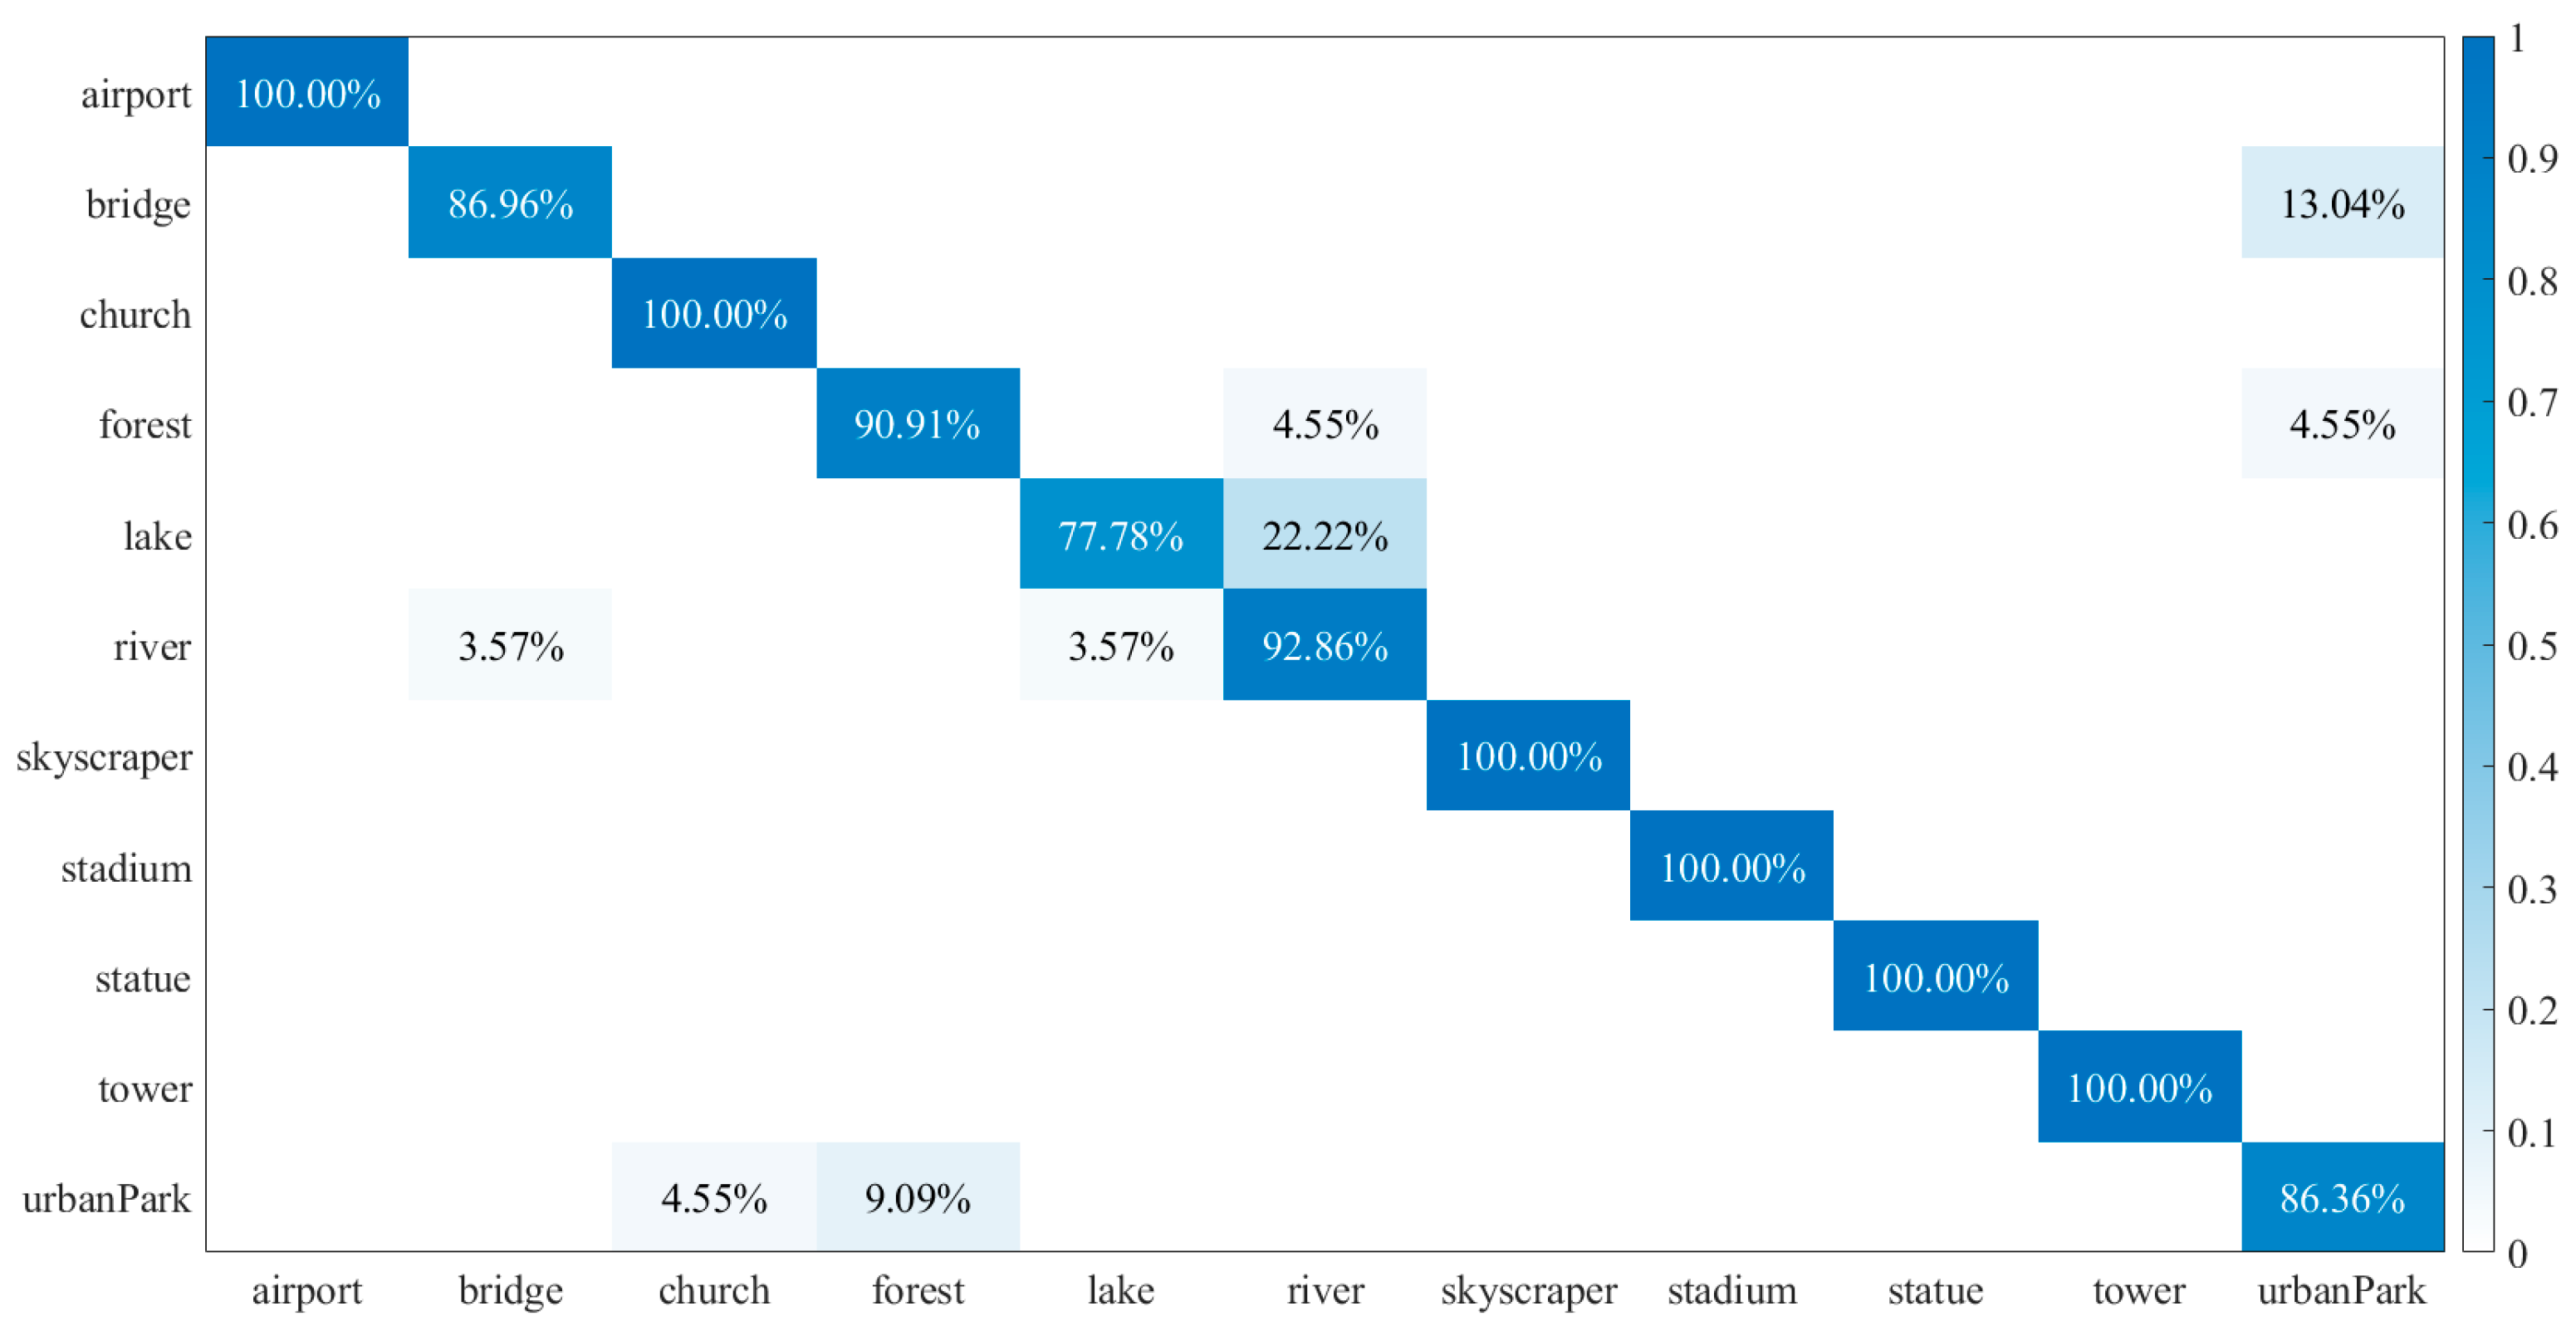
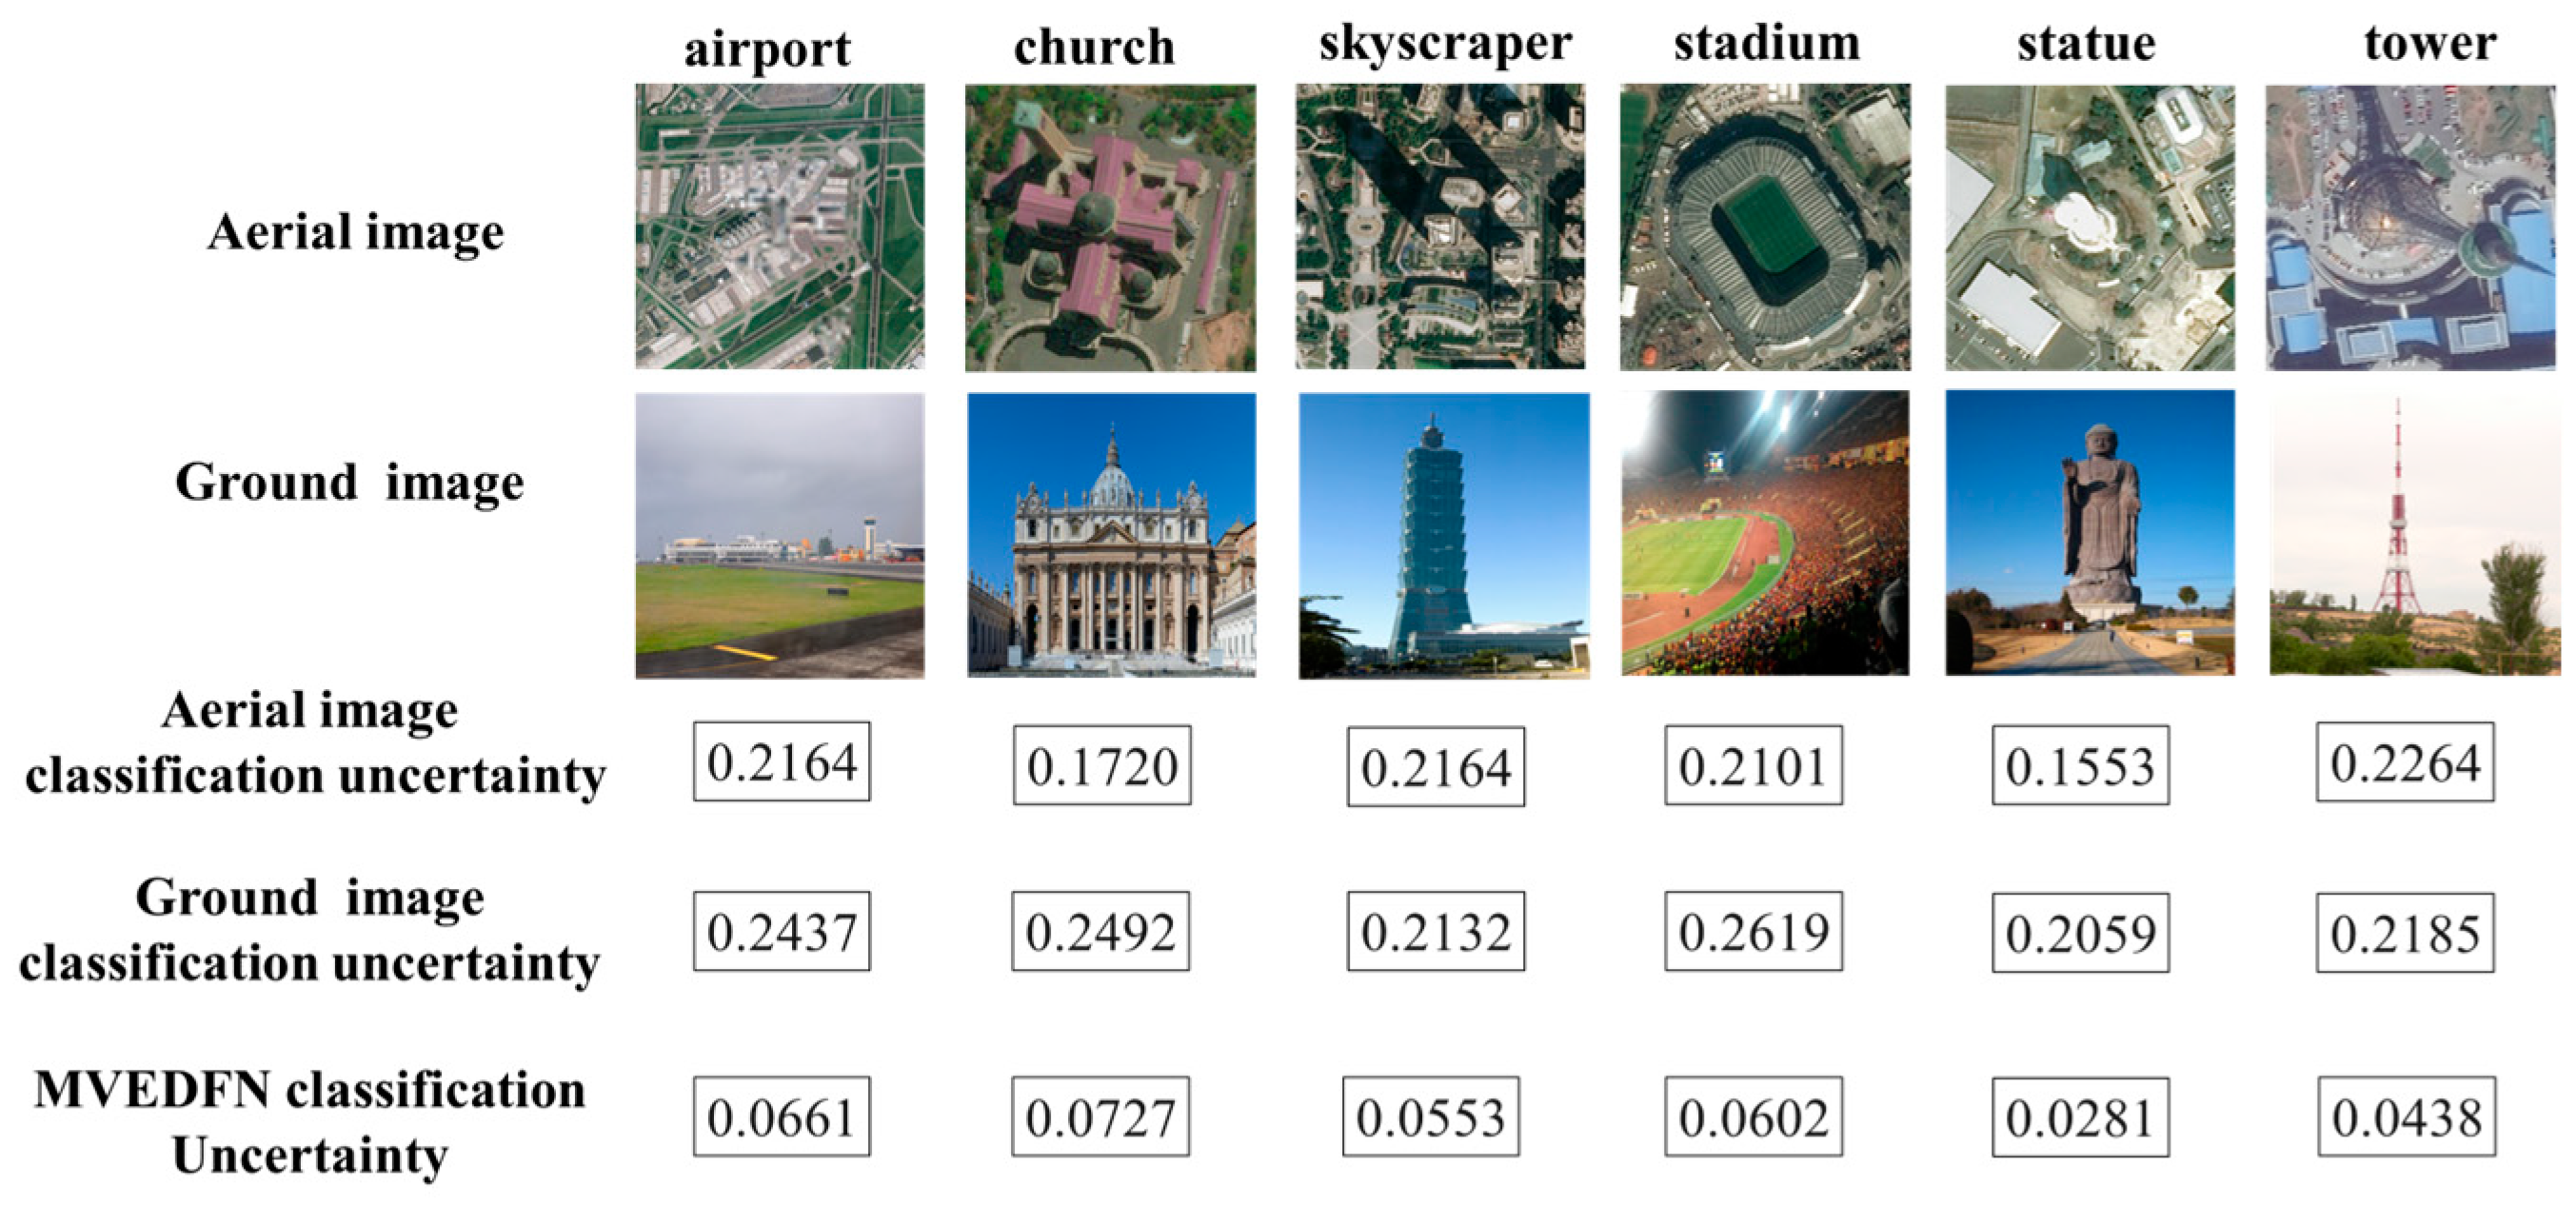
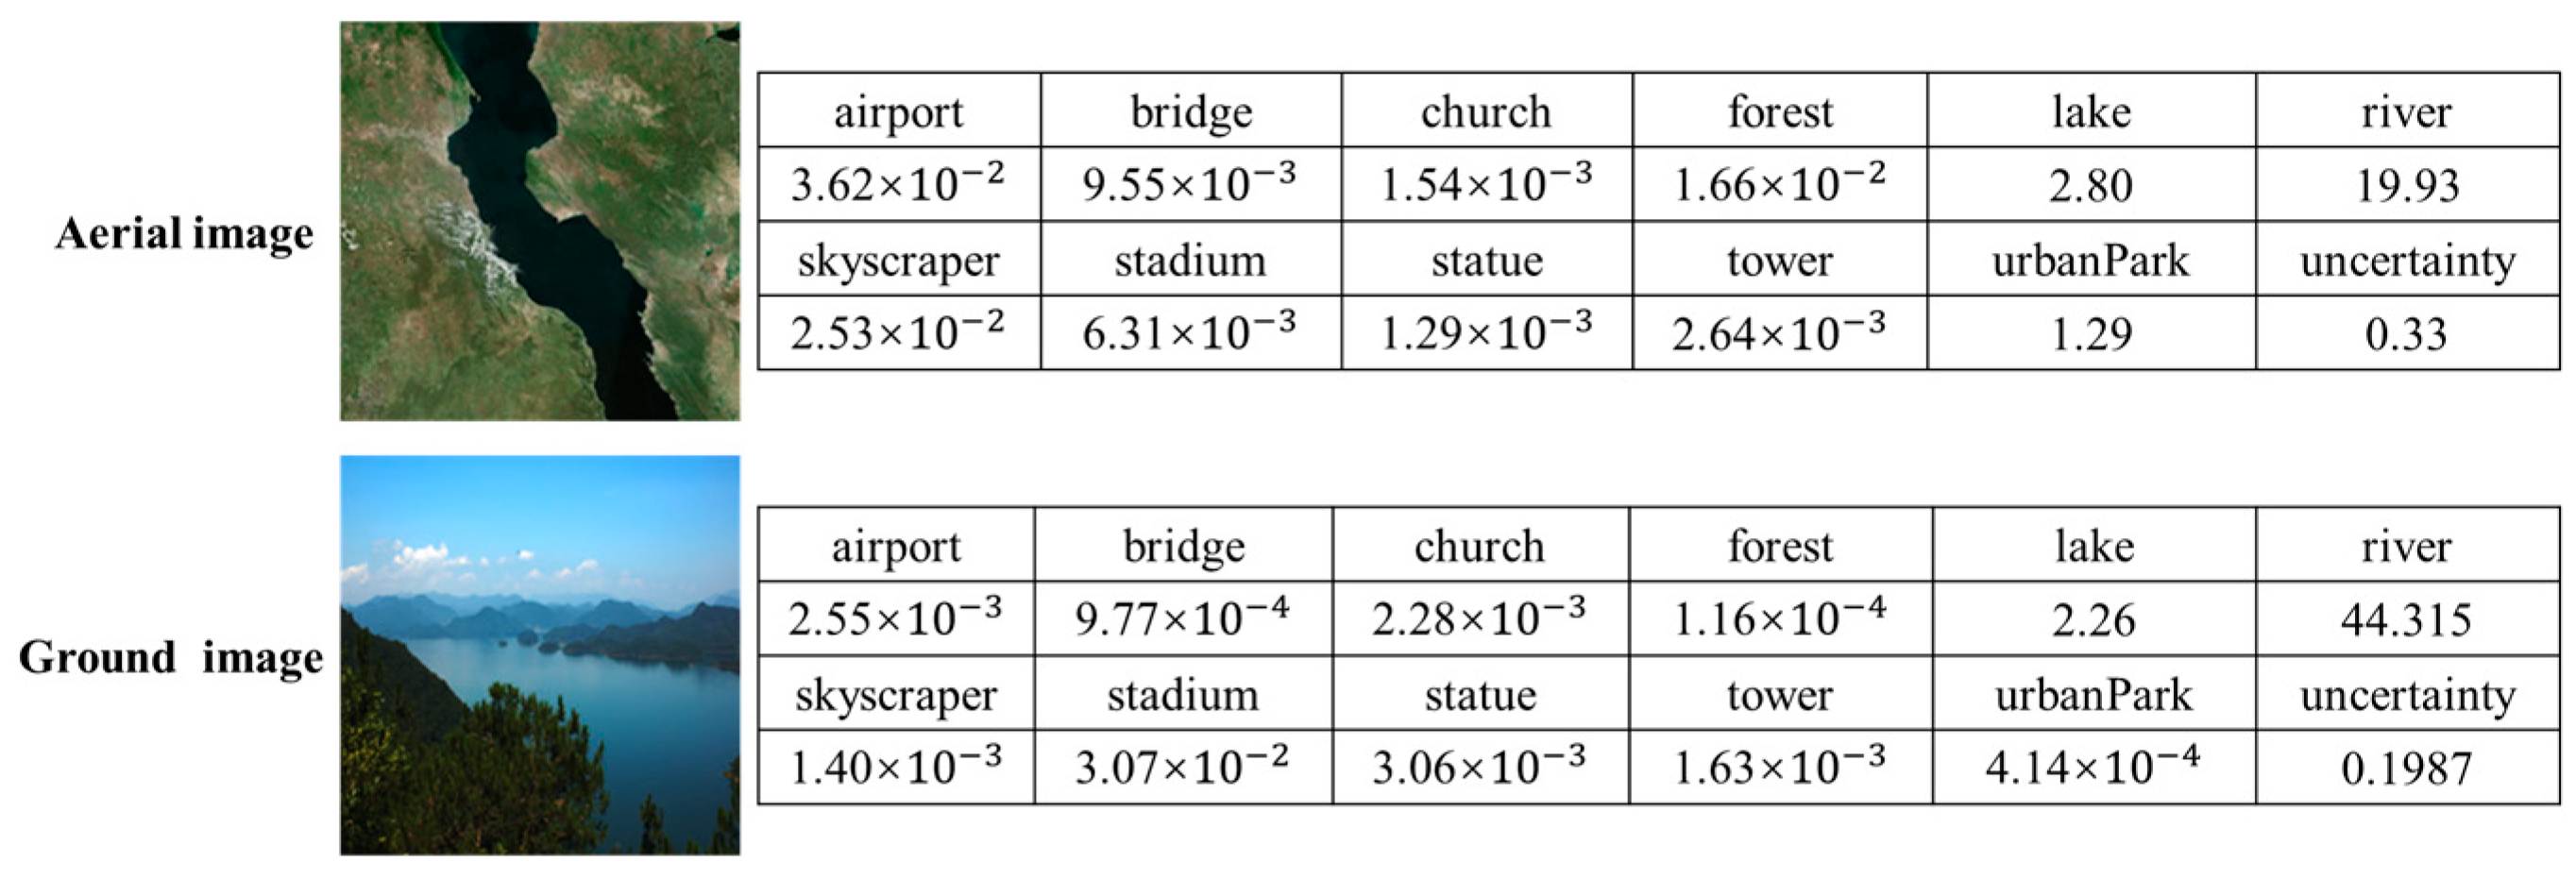
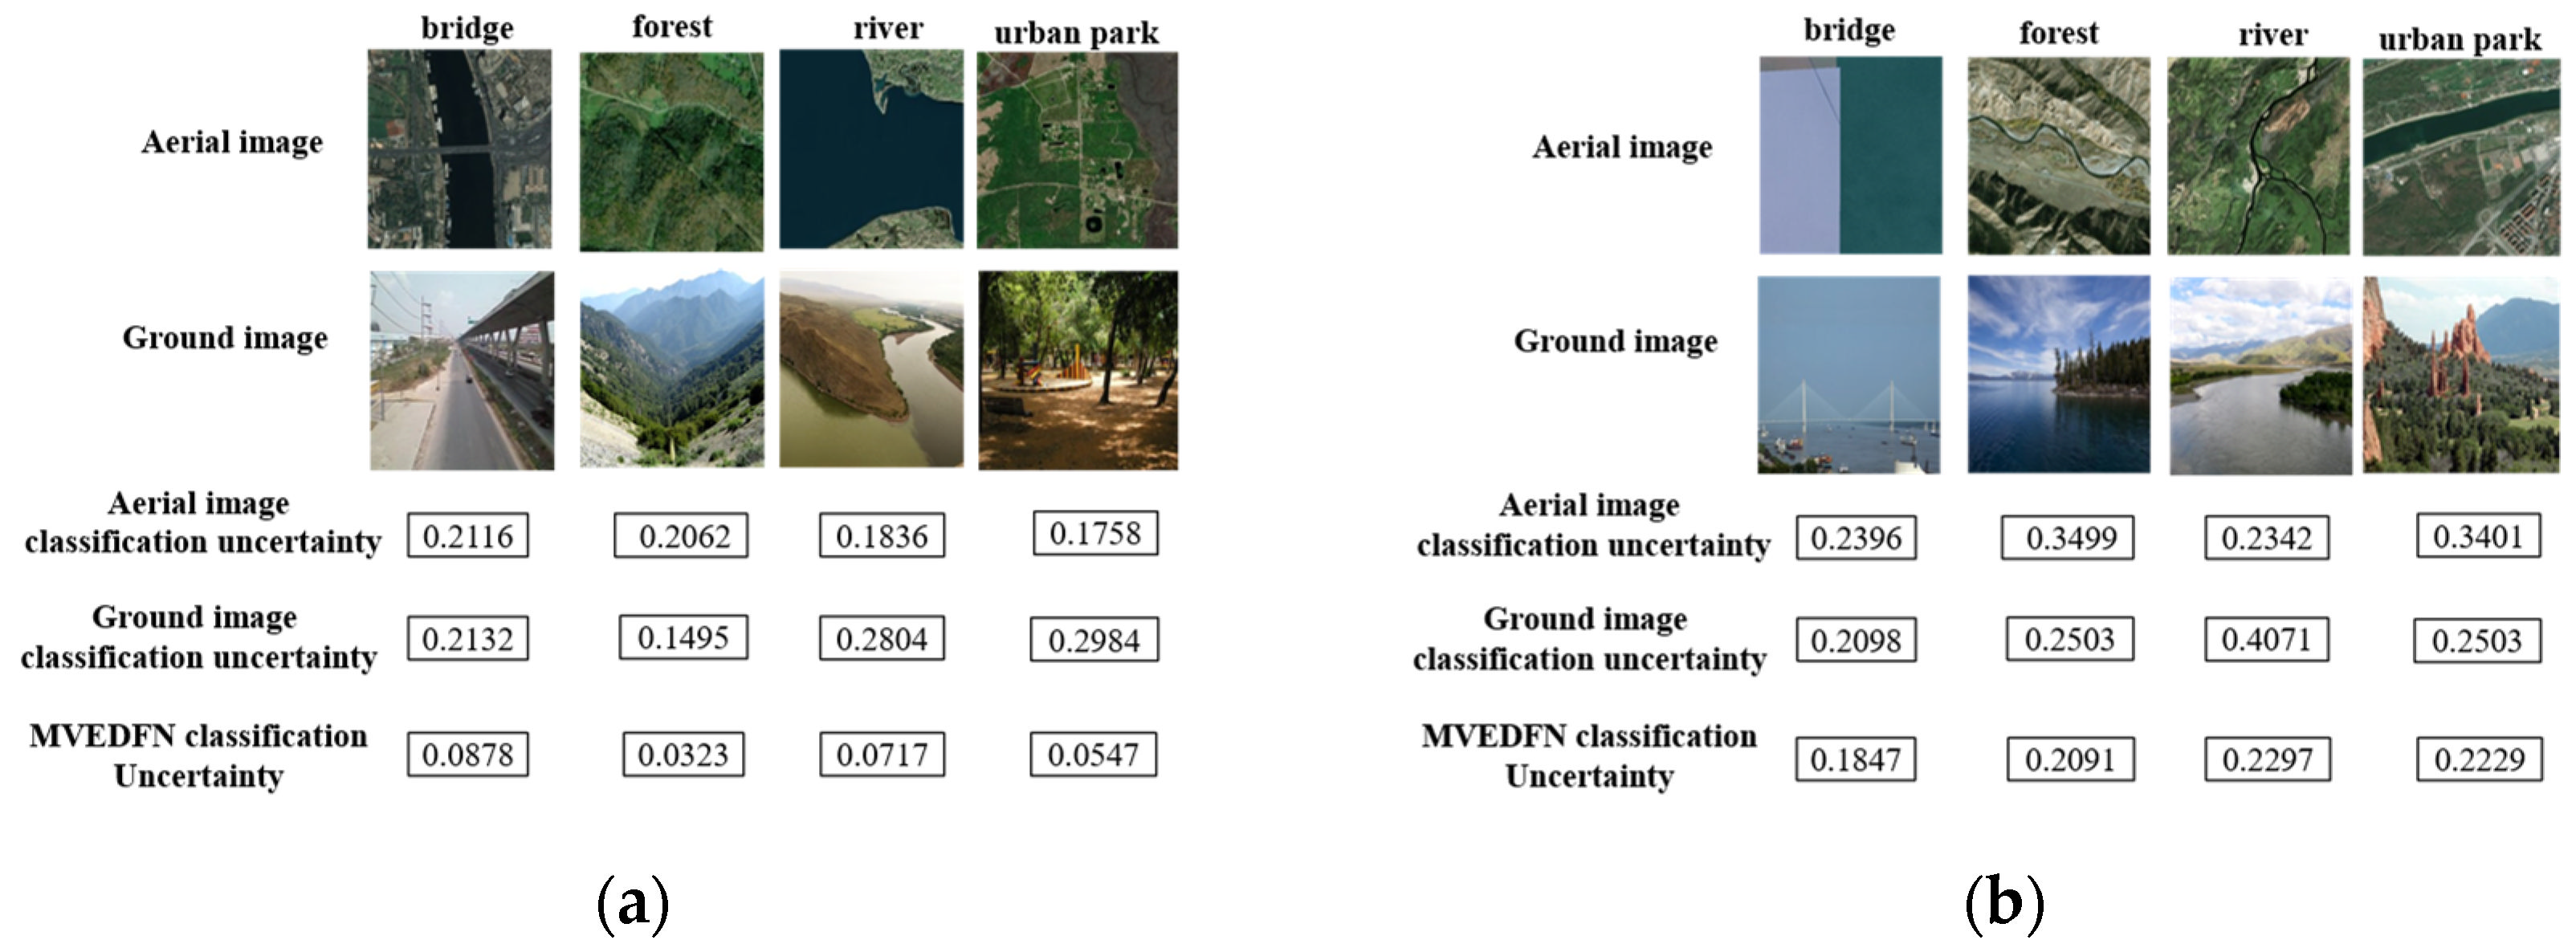
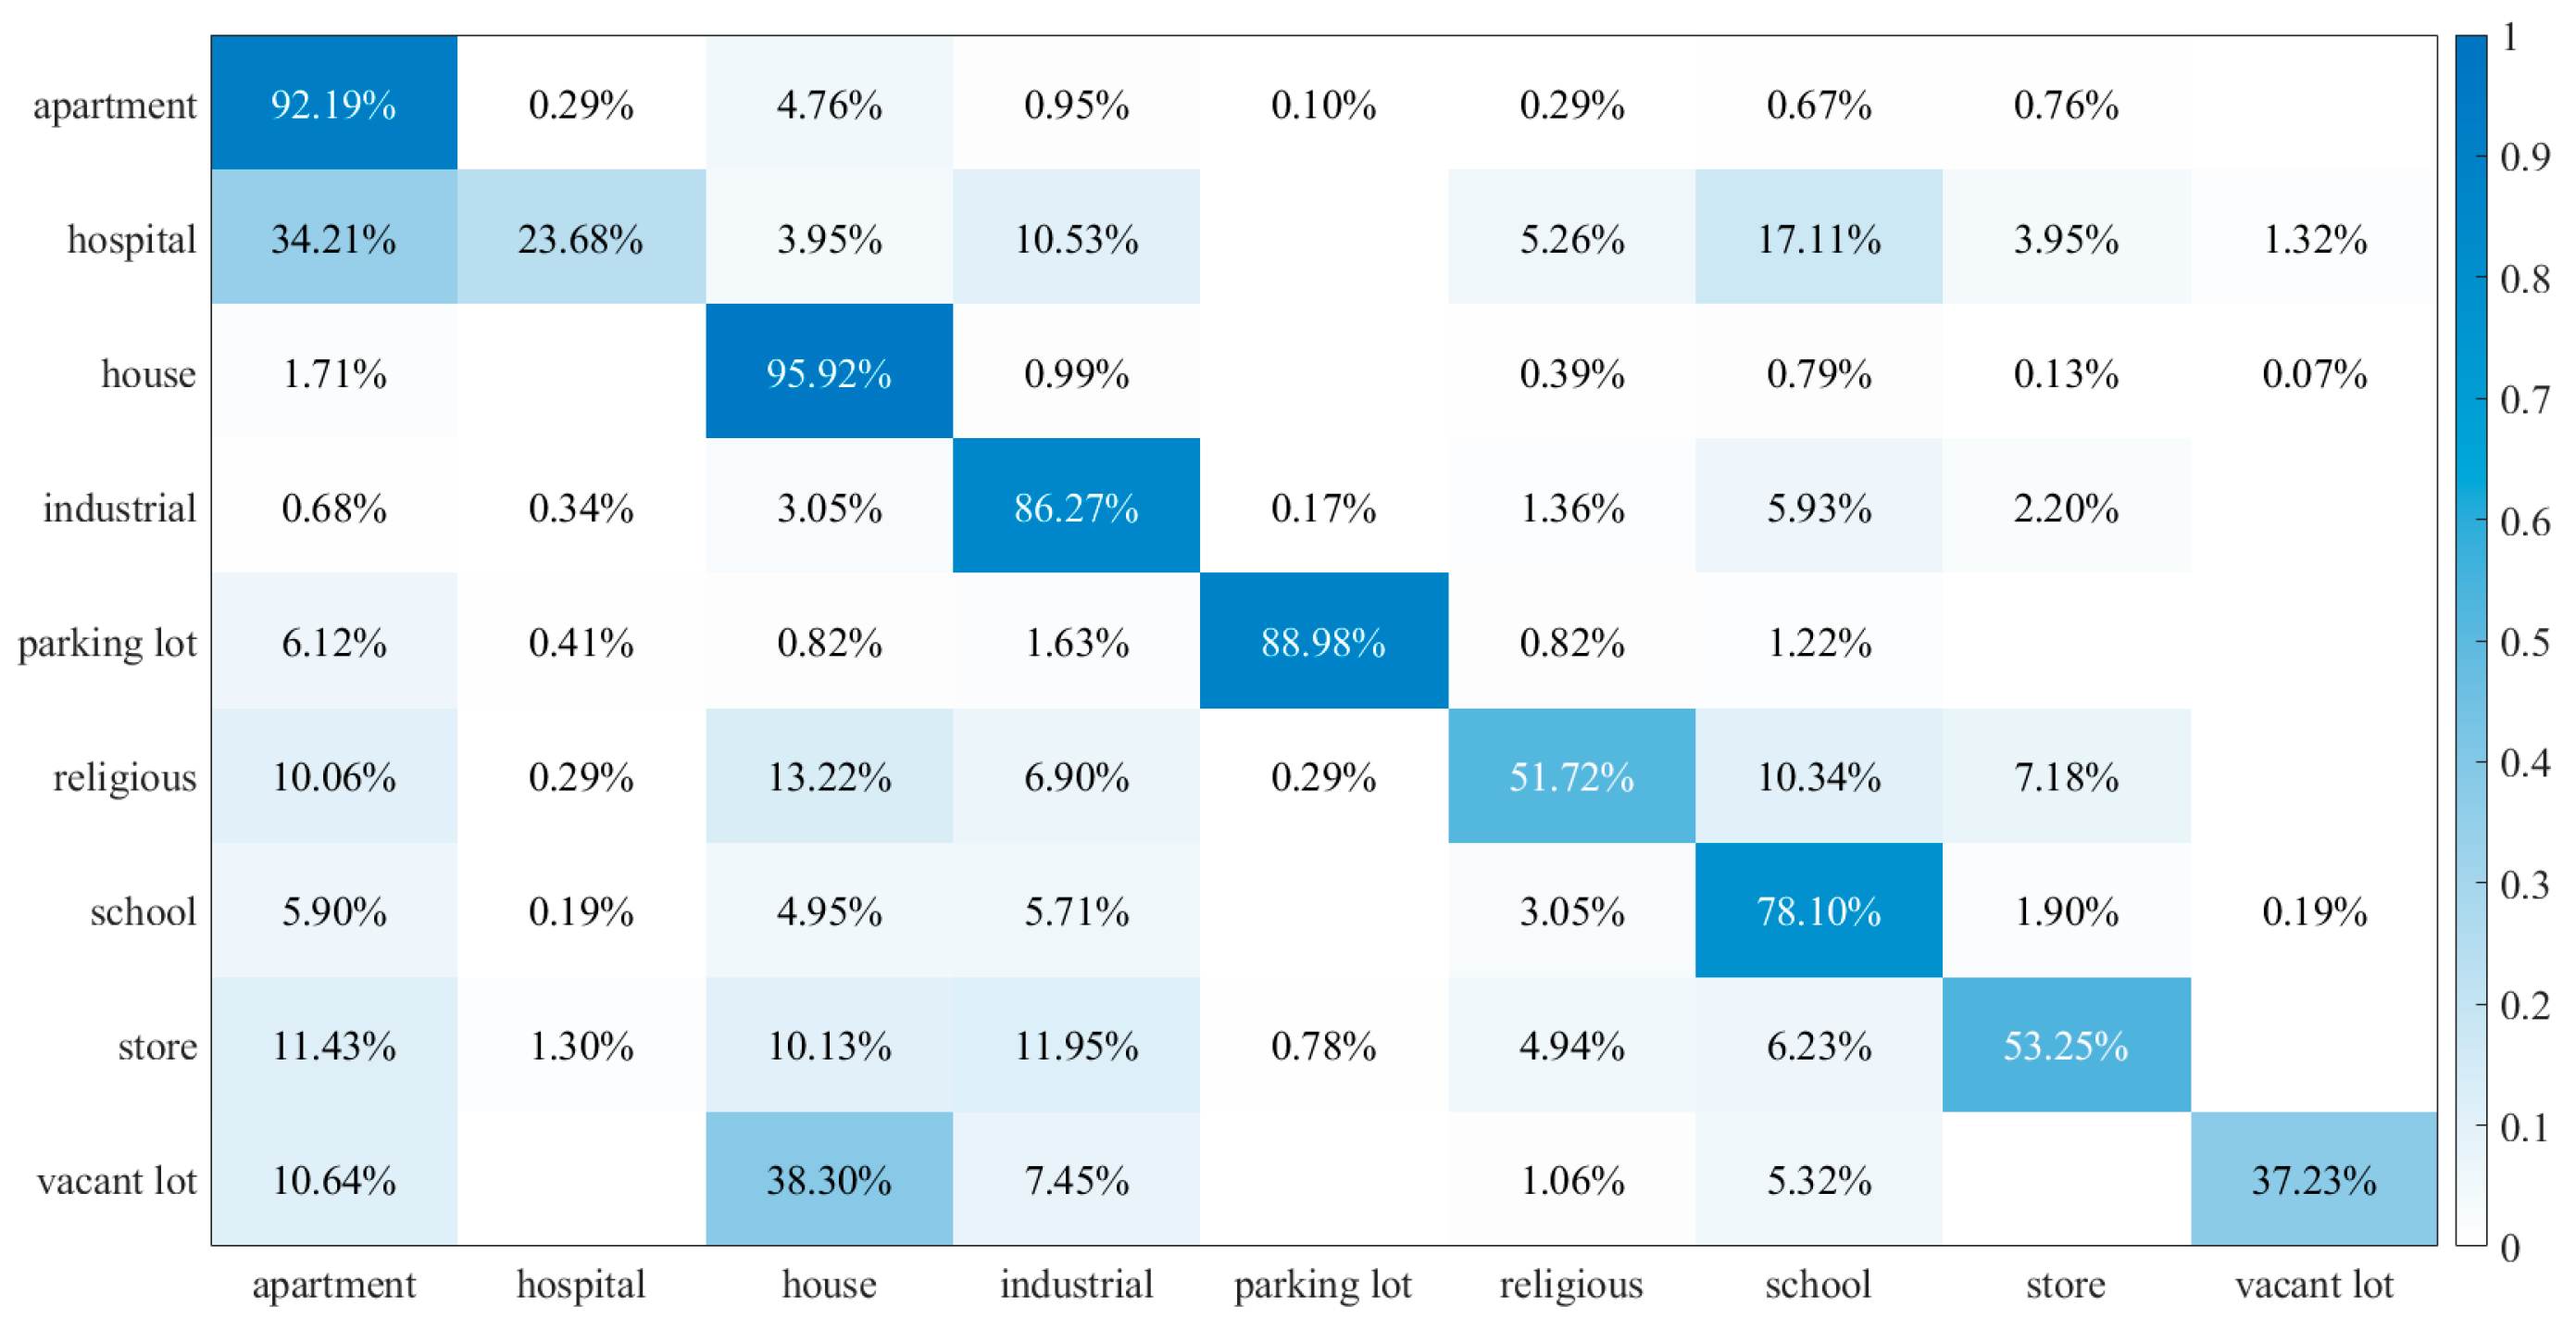
3.3. MVEDFN Classification Results and Analysis

The MVEDFN methodology employs an end-to-end approach to leverage the uncertainty and confidence level inherent to both aerial and ground images for enhanced multi-view scene classification. The outcomes of this process are systematically presented in Table 2.
Furthermore, Table 3 provides the outcomes of the deep evidence learning classification utilizing single-view images. In this process, a single-view image serves as the input. Features are extracted via the backbone network and the AAFFM. These features are then transformed into measures of confidence and uncertainty based on the Dirichlet distribution, specifically tailored for the single-view classification task. Notably, the backbone network employed in this methodology is ResNet101.
Table 2 and Table 3 illustrate that the multi-view classification results consistently surpass those of single-view classification. This suggests that integrating information from multi-view imagery significantly enhances the accuracy of scene classification tasks. Moreover, the t-SNE [40] algorithm is used to visualize the output features for single-view and multi-view classification, and the specific visualization results are illustrated in Figure 4 and Figure 5, respectively. These figures reveal that, in multi-view scene classification, features belonging to the same category demonstrate a higher degree of aggregation, whereas features from different categories are more distinctly separated, thus facilitating more effective classification. Specifically, within the AiRound dataset, both single-view aerial and ground images show proficient segregation of the ‘stadium’ category from others. However, when utilizing the MVEDFN for multi-view categorization, there is a notable improvement in classification, with a clear demarcation across all distinct categories and a consolidation of similar categories. In contrast, for the CV-BrCT dataset, classifications from single-view aerial and ground imagery, while generally dispersed, reveal a tendency for the ‘school’ category to intermingle with other categories. This mixing is particularly pronounced in ground images. Employing the MVEDFN for multi-view classification, however, results in a distinct separation of the ‘school’ category from others. Overall, multi-view scene categorization exhibits greater clustering for features within the same category and increased dispersion for features in different categories. Additionally, in both the AiRound and CV-BrCT datasets, aerial image features demonstrate superior aggregation compared to ground image features for similar feature categories.
Moreover, the MVEDFN achieves a classification accuracy of up to 94.85% on the AiRound dataset, with a kappa coefficient of 93.86%, which is better for classification and means that the results predicted by MVEDFN are in perfect agreement with the actual classification results, as depicted in Figure 6, which showcases the corresponding confusion matrix. The confusion matrix indicates that the categories of airport, church, skyscraper, stadium, statue, and tower exhibit the highest level of accuracy in classification.
Figure 7 illustrates the uncertainty values associated with the classification process for accurately identified images pertaining to airports, churches, skyscrapers, stadia, statues, and towers. This figure highlights that both aerial and ground-view images demonstrate significant uncertainty prior to the integration of multi-view classification, thereby compromising the reliability and increasing the risk of direct predictions. Following the application of the MVEDFN, there is a notable reduction in the uncertainty values for categorization. Consequently, the final categorization outcomes for the airport, church, skyscraper, stadium, statue, and tower categories become more credible and safer to predict.
It is also important to note that the classification accuracy for lakes was comparatively lower, with a 22% misclassification rate where lake category images were incorrectly identified as rivers. Figure 8 presents the evidence vector values and corresponding uncertainty values observed during the classification of a pair of images within the lake category. The figure clearly demonstrates that the evidence vector values for the aerial image are more dispersed, while those for the ground image are notably concentrated. This dispersion results in a higher uncertainty and increased classification risk for the aerial view image. Additionally, the evidence vector values for both the aerial and ground images in the lake category are disproportionately skewed towards the river category. This bias fails to provide complementary information, leading to an inadequate evidence base for the ensuing multi-view scene fusion process. As a consequence, this imbalance contributes to a reduced classification accuracy.
The categories of bridge, forest, river, and urban park also exhibit minor confusion in their classification. Figure 9a displays the uncertainty values for correctly categorized image pairs from these categories, whereas Figure 9b shows the uncertainty values for incorrectly categorized image pairs from the same categories. Notably, the uncertainty associated with the classification of bridge, forest, river, and park in Figure 9a is considerably diminished following application of the MVEDFN, resulting in more trustworthy outcomes. Conversely, the reduction in classification uncertainty observed in Figure 9b post-MVEDFN application is marginal compared to Figure 9a. This suggests that the aerial and ground images in Figure 9b have lower classification credibility during multi-view scene analysis. Consequently, it implies that the image pairs in Figure 9b are characterized by a higher uncertainty and a relatively inferior quality, rendering them more susceptible to misclassification in the process.
With the CV-BrCT dataset, the MVEDFN classification accuracy reaches 82.79%, with a kappa coefficient of 78.47% and a high degree of agreement between the predicted and actual classification results. Figure 10 demonstrates the confusion matrix for the CV-BrCT dataset. The confusion matrix reveals that the house category accuracy classification shows the highest level, followed by the parking lot category, industrial category and the apartment category.
Figure 11 depicts the uncertainty values associated with the classification process for correctly identified images in the categories of house, parking lot, industrial, and apartment. The figure shows a noticeable decrease in these uncertainty values following the implementation of the MVEDFN method. However, the classification accuracy for the hospital category is notably low, at only 23.68%, indicating the poorest performance among the categories. Figure 12 further elaborates on this issue by displaying the evidence vector values and uncertainty values for image pairs within the hospital category, which are mistakenly classified as apartments. The figure reveals that the evidence vector values for ground images display greater dispersion across categories, as opposed to the more concentrated values seen in aerial images. This indicates that images taken from a ground perspective are associated with a higher degree of uncertainty. Furthermore, both aerial and ground images consistently show that the highest evidence vector values align more with the apartment category rather than the expected hospital category. This observation underscores a critical limitation: neither aerial nor ground images provide sufficiently accurate evidence to support effective classification in subsequent tasks, thereby leading to a lower overall classification accuracy.
In addition, the religious, school, store, and vacant lot categories also show a small amount of confusion in categorization. Figure 13a illustrates the uncertainty values for the correct category of categorization in some of the image pairs for the religious, school, store, and vacant lot categories. Figure 13b illustrates the uncertainty values for the incorrect category of categorization in some of the image pairs for the religious, school, store, and vacant lot categories.
The examination of imagery from the AiRound and CV-BrCT datasets elucidates a significant correlation between image uncertainty and classification precision, with this reduction in uncertainty paralleling an enhancement in image fidelity and thereby fostering more accurate classification. This interplay between uncertainty and image quality is further substantiated by instances of misclassification within both datasets. A pattern emerges whereby images marked by elevated uncertainty frequently align with those experiencing misclassifications. This trend suggests that the measure of uncertainty can act as a proxy for gauging image quality and its consequential effect on classification accuracy. Additionally, a comparative evaluation of the two datasets indicates a generally lower degree of uncertainty in images from the CV-BrCT dataset in contrast to those in the AiRound dataset. This difference implies that, on balance, the AiRound dataset comprises images of a higher caliber, which bears significance for the effectiveness of the classification methodologies utilized for these datasets.

3.4. Ablation Study

To further substantiate the efficacy of the Multi-view Evidence Decision Fusion Network (MVEDFN) in classification tasks, a series of ablation studies were conducted. These experiments maintained consistent parameter settings while focusing on two key variables: the inclusion or exclusion of the AAFFM and the utilization of the EDFM. The MVEDFN ablation study compares three distinct decision-level fusion methodologies: Decision Sum Classification [22], Decision Product Classification [22], and TMC Fusion Rule Decision Classification [41]. In this context, ‘ResNet101 + AAFFM’ signifies the integration of the AAFFM with the ResNet101 network. ‘SoftMax product’ denotes the application of the SoftMax decision multiplication method in deep learning for multi-view image classification, bypassing the evidential decision fusion module. Conversely, ‘SoftMax sum’ refers to the use of the SoftMax decision sum method in deep learning for multi-view image classification, also excluding the evidential decision fusion module. ‘TMC fusion’ indicates the adoption of TMC fusion rules, as proposed by Han et al. [41], within the EDFM of this study, rather than employing the original fusion rules of the EDFM method proposed in this paper. The detailed results of these experiments are systematically presented in Table 4.
The results presented in Table 4 demonstrate that utilization of the EDFM and the AAFFM yields higher classification accuracies compared to the other three decision fusion strategies, thereby providing further empirical validation for the efficacy of the proposed method in this study. In addition, Figure 14 and Figure 15 illustrate the comparison of the fusion rules of the EDFM method with the fusion rules of the TMC method [41] in this paper.
In our analysis, we observed a notable conflict in the classification of ground and aerial images. For instance, Figure 14 displays a conflict value of 0.3452, indicating a significant discrepancy. Both aerial and ground images exhibit high credibility in the housing category. However, the evidence value for this category, as computed using the TMC fusion rule, appears to be excessively high. This discrepancy does not align with intuitive assessments and complicates the derivation of convincing results from image quantization. Conversely, application of the EDFM proposed in this study significantly mitigates this issue, yielding predictions with enhanced authenticity and interpretability. A similar situation is presented in Figure 15, where the conflict value between ground and aerial images is 0.4450, denoting a high level of conflict. The aerial image registers a substantial evidence value in the industrial category, while the ground image shows a significant evidence value in the parking lot category. Intriguingly, the evidence value for the industrial category, as calculated via the TMC fusion rule, exceeds the combined evidence for both the aerial and ground images. Although the final classification is accurate, the interpretability of this result is limited. This observation further substantiates the effectiveness of the EDFM fusion rule introduced in this paper. It demonstrates our method’s capability to alleviate the inherent conflict in the classification process of aerial and ground images, thereby rendering the predictions of multi-view remote sensing scene classification more logical and reliable.
Additionally, this paper includes ablation experiments to further substantiate the efficacy of the AAFFM and evidence-based deep learning for single-view image classification. These experiments involve comparing scenarios with and without the use of the AAFFM, as well as classifications conducted using both SoftMax deep learning methods and evidence deep learning methods. The specific outcomes of these comparisons are detailed in Table 5. The results from both Table 4 and Table 5 consistently demonstrate higher accuracy levels when employing the AAFFM method compared to scenarios where it is not used. This underscores the effectiveness of the AAFFM in enhancing the adaptability of convolutional neural networks to remote sensing images captured from varying viewpoints. Furthermore, the AAFFM is shown to be adept at extracting more comprehensive features from these images, which in turn contributes to an improved classification performance. Regarding the comparison of deep learning methods in Table 4, the SoftMax deep learning approach exhibits a slightly higher accuracy than the evidence deep learning method. This difference can be attributed to the evidence deep learning method’s primary focus on accurately estimating image uncertainty, especially in aerial or ground images with high uncertainty levels. While this focus on uncertainty estimation is crucial, it can sometimes lead to a compromise in classification accuracy. In cases where images exhibit high uncertainty, often indicative of poor quality, it becomes more meaningful to quantify the uncertainty of these images rather than solely striving for accurate classification results.

3.5. Comparison Experiment

A comparison of the MVEDFN with the seven other methods is given in Table 6. The existing methods for the fusion classification of multi-view remote sensing scene images can be broadly classified into three levels: data level, feature level, and decision level. Therefore, the MVEDFN method proposed in this paper is compared with a data-level fusion method (the six-channel method [42]), two feature-level fusion methods (CILM [23] and MSAN [24]), and four decision-level fusion methods (SoftMax product [22], SoftMax sum [22], EFN [31], and TMC [41]). The following techniques are briefly outlined.
  • Six-channel: The method involves fusing pairs of aerial and ground images into six channels and then performing a multi-view remote sensing scene classification task.
  • CILM: The proposed method integrates the cross-entropy loss function and contrast loss function, presenting a novel information-based learning model for extracting and fusing two viewpoint image features without weight sharing in a CNN.
  • MSAN: The method is a convolutional neural network fusing multi-scale attention, based on feature fusion and an attention mechanism to achieve multi-scale feature extraction and fusion from aerial and ground images.
  • SoftMax product: The method involves generating category probability vectors by inputting aerial and ground images separately into CNNs. Subsequently, the viewpoint probability vectors from both perspectives are fused using an element-wise multiplication operation. Finally, the prediction is determined based on the largest element in the fused vector.
  • SoftMax sum: The method involves generating category probability vectors by inputting aerial and ground images separately into CNNs. Subsequently, the viewpoint probability vectors from both perspectives are fused using an element-wise sum operation. Finally, the prediction is determined based on the largest element in the fused vector.
  • EFN: The method proposes a simpler and easier-to-train loss function for multi-view scene classification in conjunction with evidence theory.
  • TMC: The method employs evidence fusion theory to generate plausible classification decisions for aerial and ground image data, with a specific focus on decision making through the integration of uncertainty from multiple-viewpoint images.
Analysis of the results in Table 6 indicates that among the seven methodologies evaluated, the six-channel fusion approach yields the lowest accuracy, achieving only 77.68% on the AiRound dataset. This underscores a substantial gap in fusion performance compared to both feature-level and decision-level fusion techniques. The MSAN method, with its advanced network fusion attention mechanism, demonstrates commendable accuracy, achieving 93.56% on the AiRound dataset and 81.69% on the CV-BrCT dataset. This method’s ability to extract and complementarily fuse multi-layer features contributes to an enhanced scene classification accuracy. However, when juxtaposed with the seven compared methods, the MVEDFN method proposed in this study emerges as the most effective. It registers an impressive accuracy of 94.85% on the AiRound dataset, which is 1.29% higher than that of the MSAN method. Furthermore, on the CV-BrCT dataset, it achieves an accuracy of 82.79%, surpassing that of the MSAN method by 1.1%. A notable aspect of the MVEDFN method is its capability to quantify the credibility and uncertainty of multi-view images, providing a rational and comprehensive explanation for the prediction outcomes in multi-view scene classification tasks. This evidences the robustness and reliability of the MVEDFN approach in handling complex multi-view remote sensing data.

4. Conclusions

Multi-view scene classification can achieve a more comprehensive and accurate classification task, but with the increase in the number of remote sensing image views, there are difficulties and challenges in many aspects, such as the existence of differences in image quality, the effectiveness of the multi-view image fusion strategy, uncertainty, and interpretability between images. Solving these problems will help us to improve the accuracy and reliability of multi-view remote sensing scene classification. In this research, we introduce a novel multi-view decision fusion network aimed at enhancing multi-view scene classification. This method diverges from conventional scene classification techniques by leveraging evidence deep learning theory. To address the above issues, we propose the novel Multi-view Evidence Decision Fusion Network (MVEDFN) designed to enhance multi-view scene classification. This approach differs from traditional scene classification techniques in that it utilizes evidence-based deep learning theory to quantify the image quality and effectively integrates the uncertainties inherent in aerial and ground imagery to obtain more reliable decision classification. This approach maximizes the utility of multi-view image data and provides insightful explanations for the prediction outcomes.
The structure of the network consists of two key components that process the corresponding classes of aerial and ground images, respectively. Firstly, an Asymptotic Adaptive Feature Fusion Module (AAFFM) is constructed to fuse the multi-scale features of remote sensing images, enhance the discriminative ability of remote sensing image features, and alleviate the quality difference between different images. Secondly, an Evidence Decision Fusion Module (EDFM) is utilized to perform the decision-level fusion of aerial and ground images, effectively integrating multi-view remote sensing image information and processing and providing a clear explanation of the classification results. The empirical results demonstrate the effectiveness of our method, with accuracy rates of 94.85% on the AiRound dataset and 82.79% on the CV-BrCT dataset, respectively. These outcomes represent a substantial improvement in the accuracy of multi-view remote sensing scene classification. Looking ahead, our research will continue to investigate various methodologies applicable to multi-view remote sensing scene classification, aiming to achieve more precise and comprehensive results in this field.

Author Contributions

Conceptualization, W.Z. and Y.S.; methodology, W.Z. and Y.S.; software, Y.S.; validation, Y.S.; formal analysis, Y.S. and X.H.; investigation, Y.S.; resources, W.Z.; data curation, Y.S.; writing—original draft preparation, Y.S.; writing—review and editing, W.Z. and X.H.; visualization, Y.S.; supervision, W.Z. and X.H.; project administration, W.Z.; funding acquisition, W.Z. All authors have read and agreed to the published version of the manuscript.

Funding

This research was funded by the National Key Research and Development Program of China (grant number 2023YFB3906103), Open Fund of State Key Laboratory of Remote Sensing Science (grant number OFSLRSS202215), and Postgraduate Research Practice Innovation Program of Jiangsu Province (grant number KYCX23_1377).

Data Availability Statement

The data used are publicly available for research purpose. Readers should refer to the corresponding reference.

Acknowledgments

We would like to thank the authors for collecting the multi-view datasets.

Conflicts of Interest

The authors declare no conflicts of interest.

Correction Statement

This article has been republished with a minor correction to the readability of figures. This change does not affect the scientific content of the article.

References

  1. Cheng, G.; Xie, X.; Han, J.; Guo, L.; Xia, G. Remote sensing image scene classification meets deep learning: Challenges, methods, benchmarks, and opportunities. IEEE J. Sel. Top. Appl. Earth Obs. Remote Sens. 2020, 13, 3735–3756. [Google Scholar] [CrossRef]
  2. Wang, J.; Li, W.; Zhang, M.; Tao, R.; Chanussot, J. Remote sensing scene classification via multi-stage self-guided separation network. IEEE Trans. Geosci. Remote Sens. 2023, 61, 1–12. [Google Scholar]
  3. Miao, W.; Geng, J.; Jiang, W. Multigranularity Decoupling Network with Pseudolabel Selection for Remote Sensing Image Scene Classification. IEEE Trans. Geosci. Remote Sens. 2023, 61, 1–13. [Google Scholar] [CrossRef]
  4. Li, E.; Xia, J.; Du, P.; Samat, A. Integrating multilayer features of convolutional neural networks for remote sensing scene classification. IEEE Trans. Geosci. Remote Sens. 2017, 55, 5653–5665. [Google Scholar] [CrossRef]
  5. Cheng, G.; Yang, C.; Yao, X.; Guo, L.; Han, J. When deep learning meets metric learning: Remote sensing image scene classification via learning discriminative CNNs. IEEE Trans. Geosci. Remote Sens. 2018, 56, 2811–2821. [Google Scholar] [CrossRef]
  6. Wang, Q.; Liu, S.; Chanussot, J.; Li, X. Scene classification with recurrent attention of VHR remote sensing images. IEEE Trans. Geosci. Remote Sens. 2018, 57, 1155–1167. [Google Scholar] [CrossRef]
  7. Chen, C.; Zhang, B.; Su, H.; Li, W.; Wang, L. Land-use scene classification using multi-scale completed local binary patterns. Signal Image Video Process. 2016, 10, 745–752. [Google Scholar] [CrossRef]
  8. Bian, X.; Chen, C.; Tian, L.; Du, Q. Fusing local and global features for high-resolution scene classification. IEEE J. Sel. Top. Appl. Earth Obs. Remote Sens. 2017, 10, 2889–2901. [Google Scholar] [CrossRef]
  9. Chaib, S.; Liu, H.; Gu, Y.; Yao, H. Deep feature fusion for VHR remote sensing scene classification. IEEE Trans. Geosci. Remote Sens. 2017, 55, 4775–4784. [Google Scholar] [CrossRef]
  10. He, N.; Fang, L.; Li, S.; Plaza, J.; Plaza, A. Skip-connected covariance network for remote sensing scene classification. IEEE Trans. Neural Netw. Learn. Syst. 2019, 31, 1461–1474. [Google Scholar] [CrossRef]
  11. Chen, X.; Ma, M.; Li, Y.; Cheng, W. Fusing deep features by kernel collaborative representation for remote sensing scene classification. IEEE J. Sel. Top. Appl. Earth Obs. Remote Sens. 2021, 14, 12429–12439. [Google Scholar] [CrossRef]
  12. Lu, X.; Zheng, X.; Yuan, Y. Remote sensing scene classification by unsupervised representation learning. IEEE Trans. Geosci. Remote Sens. 2017, 55, 5148–5157. [Google Scholar] [CrossRef]
  13. Cui, K.; Li, Y.; Polk, S.L.; Lin, Y.; Zhang, H.; Murphy, J.M.; Plemmons, R.J.; Chan, R.H. Superpixel-based and Spatially-regularized Diffusion Learning for Unsupervised Hyperspectral Image Clustering. arXiv 2023, arXiv:2312.15447. [Google Scholar]
  14. Wei, Y.; Luo, X.; Hu, L.; Peng, Y.; Feng, J. An improved unsupervised representation learning generative adversarial network for remote sensing image scene classification. Remote Sens. Lett. 2020, 11, 598–607. [Google Scholar] [CrossRef]
  15. Polk, S.L.; Cui, K.; Chan, A.H.; Coomes, D.A.; Plemmons, R.J.; Murphy, J.M. Unsupervised Diffusion and Volume Maximization-Based Clustering of Hyperspectral Images. Remote Sens. 2022, 15, 1053. [Google Scholar] [CrossRef]
  16. Yu, D.; Xu, Q.; Guo, H.; Lu, J.; Lin, Y.; Liu, X. Aggregating features from dual paths for remote sensing image scene classification. IEEE Access 2022, 10, 16740–16755. [Google Scholar] [CrossRef]
  17. Yasir, M.; Liu, S.; Xu, M.; Wan, J.; Pirasteh, S.; Dang, K.B. ShipGeoNet: SAR Image-Based Geometric Feature Extraction of Ships Using Convolutional Neural Networks. IEEE Trans. Geosci. Remote Sens. 2024, 62, 1–13. [Google Scholar] [CrossRef]
  18. Yang, M.; Wang, H.; Hu, K.; Yin, G.; Wei, Z. IA-Net: An inception–attention-module-based network for classifying underwater images from others. IEEE J. Ocean. Eng. 2022, 47, 704–717. [Google Scholar] [CrossRef]
  19. Han, X.; Zhong, Y.; Cao, L.; Zhang, L. Pre-trained alexnet architecture with pyramid pooling and supervision for high spatial resolution remote sensing image scene classification. Remote Sens. 2017, 9, 848. [Google Scholar] [CrossRef]
  20. Ma, A.; Wan, Y.; Zhong, Y.; Wang, J.; Zhang, L. SceneNet: Remote sensing scene classification deep learning network using multi-objective neural evolution architecture search. ISPRS J. Photogramm. Remote Sens. 2021, 172, 171–188. [Google Scholar] [CrossRef]
  21. Wang, G.; Fan, B.; Xiang, S.; Pan, C. Aggregating rich hierarchical features for scene classification in remote sensing imagery. IEEE J. Sel. Top. Appl. Earth Obs. Remote Sens. 2017, 10, 4104–4115. [Google Scholar] [CrossRef]
  22. Machado, G.; Ferreira, E.; Nogueira, K.; Oliveira, H.; Brito, M.; Gama, P.H.T.; Santos, J.A.d. AiRound and CV-BrCT: Novel multiview datasets for scene classification. IEEE J. Sel. Top. Appl. Earth Obs. Remote Sens. 2020, 14, 488–503. [Google Scholar] [CrossRef]
  23. Geng, W.; Zhou, W.; Jin, S. Multi-view urban scene classification with a complementary-information learning model. Photogramm. Eng. Remote Sens. 2022, 88, 65–72. [Google Scholar] [CrossRef]
  24. Shi, Y.; Zhou, W.; Shao, Z. Multi-view remote sensing image scene classification by fusing multi-scale attention. Geomat. Inf. Sci. Wuhan Univ. 2024, 49, 366–375. [Google Scholar]
  25. Liu, X.; Zhou, Y.; Zhao, J.; Yao, R.; Liu, B.; Zheng, Y. Siamese convolutional neural networks for remote sensing scene classification. IEEE Geosci. Remote Sens. Lett. 2019, 16, 1200–1204. [Google Scholar] [CrossRef]
  26. Bai, L.; Liu, Q.; Li, C.; Ye, Z.; Hui, M.; Jia, X. Remote sensing image scene classification using multiscale feature fusion covariance network with octave convolution. IEEE Trans. Geosci. Remote Sens. 2022, 60, 5620214. [Google Scholar] [CrossRef]
  27. Baltrušaitis, T.; Ahuja, C.; Morency, L.P. Multimodal machine learning: A survey and taxonomy. IEEE Trans. Pattern Anal. Mach. Intell. 2018, 41, 423–443. [Google Scholar] [CrossRef]
  28. Fauvel, M.; Chanussot, J.; Benediktsson, J.A. Decision fusion for the classification of urban remote sensing images. IEEE Trans. Geosci. Remote Sens. 2006, 44, 2828–2838. [Google Scholar] [CrossRef]
  29. Liu, X.; He, J.; Yao, Y.; Zhang, J.; Liang, H.; Wang, H.; Hong, Y. Classifying urban land use by integrating remote sensing and social media data. Int. J. Geogr. Inf. Sci. 2017, 31, 1675–1696. [Google Scholar] [CrossRef]
  30. Tu, W.; Hu, Z.; Li, L.; Cao, J.; Li, Q.; Li, Q. Portraying urban functional zones by coupling remote sensing imagery and human sensing data. Remote Sens. 2018, 10, 141. [Google Scholar] [CrossRef]
  31. Zhao, K.; Gao, Q.; Hao, S.; Sun, J.; Zhou, L. Credible remote sensing scene classification using evidential fusion on aerial-ground dual-view images. Remote Sens. 2023, 15, 1546. [Google Scholar] [CrossRef]
  32. Sensoy, M.; Kaplan, L.; Kandemir, M. Evidential Deep Learning to Quantify Classification Uncertainty. In Proceedings of the International Conference on Neural Information Processing Systems (NeurIPS), Montréal, QC, Canada, 3–8 December 2018; pp. 3183–3193. [Google Scholar]
  33. Lu, X.; Sun, H.; Zheng, X. A feature aggregation convolutional neural network for remote sensing scene classification. IEEE Trans. Geosci. Remote Sens. 2019, 57, 7894–7906. [Google Scholar] [CrossRef]
  34. Yang, G.; Lei, J.; Zhu, Z.; Cheng, S.; Feng, Z.; Liang, R. AFPN: Asymptotic Feature Pyramid Network for Object Detection. arXiv 2023, arXiv:2306.15988. [Google Scholar]
  35. Liu, S.; Huang, D.; Wang, Y. Learning spatial fusion for single-shot object detection. arXiv 2019, arXiv:1911.09516. [Google Scholar]
  36. Van Amersfoort, J.; Smith, L.; Teh, Y.W.; Gal, Y. Uncertainty Estimation Using a Single Deep Deterministic Neural Network. In Proceedings of the PMLR International Conference on Machine Learning (ICML), Online, 13–18 July 2020; Volume 119, pp. 9690–9700. [Google Scholar]
  37. Moon, J.; Kim, J.; Shin, Y.; Hwang, S. Confidence-Aware Learning for Deep Neural Networks. In Proceedings of the PMLR International Conference on Machine Learning (ICML), Online, 13–18 July 2020; Volume 119, pp. 7034–7044. [Google Scholar]
  38. Lin, J. On the Dirichlet Distribution. Master’ Thesis, Department of Mathematics and Statistics, Queens University, Kingston, ON, Canada, 2016; pp. 10–11. [Google Scholar]
  39. He, K.; Zhang, X.; Ren, S.; Jin, S. Deep residual learning for image recognition. In Proceedings of the IEEE Conference on Computer Vision and Pattern Recognition, Las Vegas, NV, USA, 27–30 June 2016; pp. 770–778. [Google Scholar]
  40. Maaten, L.V.; Hinton, G.E. Visualizing Data using t-SNE. J. Mach. Learn. Res. 2008, 9, 2579–2605. [Google Scholar]
  41. Han, Z.; Zhang, C.; Fu, H.; Zhou, T. Trusted multi-view classification. arXiv 2021, arXiv:2102.02051. [Google Scholar]
  42. Vo, N.N.; Hays, J. Localizing and orienting street views using overhead imagery. In Proceedings of the European Conference on Computer Vision (ECCV), Amsterdam, The Netherlands, 11–14 October 2016; pp. 494–509. [Google Scholar]
Figure 1. Architecture of the proposed Multi-view Evidence Decision Fusion Network (MVEDFN).
Remotesensing 16 00738 g001
Figure 2. Some examples of aerial and ground images from the AiRound dataset.
Remotesensing 16 00738 g002
Figure 3. Some examples of aerial and ground images from the CV-BrCT dataset.
Remotesensing 16 00738 g003
Figure 4. Feature visualization results for single-view and multi-view images in the AiRound dataset.
Remotesensing 16 00738 g004
Figure 5. Feature visualization for single-view and multi-view images in the CV-BrCT dataset.
Remotesensing 16 00738 g005
Figure 6. Confusion matrix for multi-view classification of the AiRound dataset.
Remotesensing 16 00738 g006
Figure 7. Classification uncertainty for single-view and multi-view image classification.
Remotesensing 16 00738 g007
Figure 8. Evidence vector and uncertainty values for lakes misclassified as rivers.
Remotesensing 16 00738 g008
Figure 9. (a) Uncertainty values for correct classification into the bridge, forest, river, and urban park categories; (b) uncertainty values for misclassification into the bridge, forest, river, and urban park categories.
Remotesensing 16 00738 g009
Figure 10. Confusion matrix for the multi-view classification of the CV-BrCT dataset.
Remotesensing 16 00738 g010
Figure 11. Uncertainty values for correct classification into the apartment, house, parking lot, and industrial categories.
Remotesensing 16 00738 g011
Figure 12. Evidence vector and uncertainty values for hospital misclassified as an apartment building.
Remotesensing 16 00738 g012
Figure 13. (a) Uncertainty values for correct classification into the religious, school, store, and vacant lot categories; (b) uncertainty values for misclassification into the religious, school, store, and vacant lot categories.
Remotesensing 16 00738 g013
Figure 14. Comparison of the EDFM and TMC fusion rules for the house category.
Remotesensing 16 00738 g014
Figure 15. Comparison of the EDFM and TMC fusion rules for the industrial category.
Remotesensing 16 00738 g015
Table 1. Experimental training parameters.
DatasetBatch SizeLearning RateIterations
AiRound161 × 10−4first 100
1 × 10⁻⁵last 50
CV-BrCT161 × 10−4first 100
1 × 10⁻⁵last 50
Table 2. MVEDFN classification results.
DatasetAlgorithmAccuracy (%)Kappa (%)
AiRoundMVEDFN94.85%93.86%
CV-BrCTMVEDFN82.79%78.47%
Table 3. Single-view deep evidence learning scene classification results.
Single ViewDataset
AiRoundCV-BrCT
Accuracy (%)Kappa (%)Accuracy (%)Kappa (%)
Aerial image82.40%78.9878.11%65.74%
Ground image83.69%80.03%73.62%56.76%
Table 4. Multi-view deep evidence learning ablation results.
AlgorithmsAiRoundCV-BrCT
Resnet101 + SoftMax product86.40%78.98%
Resnet101 + SoftMax sum90.13%79.98%
Resnet101 + TMC fusion91.84%80.87%
Resnet101 + EDFM92.70%81.28%
Resnet101 + AAFMM + SoftMax product87.27%79.79%
Resnet101 + AAFMM + SoftMax sum91.42%80.56%
Resnet101 + AAFMM + TMC fusion93.13%81.94%
Resnet101 + AAFMM + EDFM (MVEDFN)94.85%82.79%
Table 5. Single-view deep evidence learning ablation results.
AlgorithmsAiRoundCV-BrCT
Aerial
Image
Ground
Image
Aerial
Image
Ground
Image
ResNet101 + SoftMax82.22%83.31%77.65%64.77%
ResNet101 + AAFFM + SoftMax83.26%84.54%78.98%66.13%
ResNet101 + evidential81.12%81.40%77.13%63.57%
ResNet101 + AAFFM + evidential82.40%83.69%78.11%65.74%
Table 6. Results for the comparison of MVEDFN with other fusion algorithms (%).
AlgorithmsDatasets
AiRoundCV-BrCT
Six-Ch.77.68%74.62%
MSAN93.56%81.69%
CILM92.27%81.28%
SoftMax product87.27%79.79%
SoftMax sum91.42%80.56%
EFN91.84%80.87%
TMC92.70%81.47%
MVEDFN94.85%82.79%
Disclaimer/Publisher’s Note: The statements, opinions and data contained in all publications are solely those of the individual author(s) and contributor(s) and not of MDPI and/or the editor(s). MDPI and/or the editor(s) disclaim responsibility for any injury to people or property resulting from any ideas, methods, instructions or products referred to in the content.

