Abstract
Glacial lake outburst floods (GLOFs) are one of the most severe disasters in alpine regions, releasing a large amount of water and sediment that can cause fatalities and economic loss as well as substantial damage to downstream infrastructures. The risk of GLOFs in the Himalayas is exacerbated by glacier retreat caused by global warming. Critical economic corridors, such as the Rongxer Watershed, are threatened by GLOFs, but the lack of risk assessment specific to the watershed hinders hazard prevention. In this study, we propose a novel model to evaluate the risk of GLOF using a combination of remote sensing observations, GIS, and hydrological models and apply this model to the GLOF risk assessment in the Rongxer Watershed. The results show that (1) the area of glacial lakes in the Rongxer Watershed increased by 31.19% from 11.35 km2 in 1990 to 14.89 km2 in 2020, and (2) 18 lakes were identified as potentially dangerous glacial lakes (PDGLs) that need to be assessed for the GLOF risk, and two of them were categorized as very high risk (Niangzongmajue and Tsho Rolpa). The proposed model was robust in a GLOF risk evaluation by historical GLOFs in the Himalayas. The glacial lake data and GLOF risk assessment model of this study have the potential to be widely used in research on the relationships between glacial lakes and climate change, as well as in disaster mitigation of GLOFs.
1. Introduction
Glacial lakes, as one of the most vital water resources, are sensitive to climate change and can result in glacial lake outburst floods (GLOFs). Glacial lakes are defined as natural water bodies formed due to glaciation and primarily sustained by contemporary glacial meltwater [1]. GLOF refers to a flood event caused by the sudden release of water from a glacial lake or the failure of a dam [2]. Glacier retreat facilitates the formation of glacial lakes [3], thereby increasing the risk of GLOFs [4]. As a kind of natural hazard, GLOFs not only inflict severe devastation upon the downstream infrastructures but also have the potential to obstruct downstream river channels, causing further damage [5,6,7,8,9]. In the Himalayas, there have been numerous historical GLOFs that have caused catastrophic consequences. For example, the Cirenmaco GLOF in 1981 caused severe damage to the China–Nepal Friendship Bridge and the Sun Kosi hydropower plant, resulting in the deaths of 200 people [10]. The Dig Tsho GLOF, on 4 August 1985, demolished 14 bridges, 30 residences, and one hydropower plant [11,12,13]. On 5 July 2016, the GLOF caused by Gongbatongsha Tsho destroyed 77 dwellings, three bridges, and one road, and it caused damage to the upper Bhotekoshi hydropower plant in Nepal, resulting in economic losses amounting to USD 70 million [14,15]. The Rongxer Watershed has recorded three GLOFs, encompassing the 1991 Chubung GLOF [16], the 1992 Upper Langbu Tsho [17], and another GLOF event in 2018 [18]. As a critical trade channel in the developmental link between China and Nepal, this basin faces threats from GLOFs. The absence of specific research endeavors highlights the urgent need for glacial lake monitoring and GLOF risk assessment. Field investigations are dangerous due to the complex terrain and remote location of glacial lakes in the high-altitude area. However, it is essential to obtain critical parameters for GLOFs [3] and unveil the outburst mechanism, such as an overlooked tunneling-triggered event [9]. Remote sensing techniques and geographical information technologies are crucial for monitoring existing glacial lakes.
Multi-source remote sensing data has significantly accelerated glacial lake monitoring and GLOF risk assessment advancements. Wang et al. used Landsat TM and ETM+ images to monitor glacial lake changes from 1970 to 2009 in Boshula Mountain [19]. The Himalayan glacial lakes between 1990 and 2015 were mapped using Landsat remote sensing images and the NDWI thresholding method [20]. Landsat images and manual mapping methods were used to investigate glacial lakes throughout the Third Pole region [21]. In the China–Pakistan Economic Corridor (CPEC), a dataset of glacial lakes was created using the NDWI mapping method on Landsat remote sensing imagery from 1990 to 2020 [22].
The evaluation of GLOF risk involves evaluating glacial lake hazards and downstream vulnerability. The International Centre for Integrated Mountain Development (ICIMOD) has proposed a comprehensive framework for assessing GLOF risk optimized by customizing and fine-tuning existing models in various regions [23]. For example, assessing GLOF risk in the Sagarmatha region of Nepal involves simulations of GLOFs and the assessment of downstream impacts [11]. An integrated approach was employed in Nepal, which combines considerations of glacial lake hazards and downstream impacts [24]. An automated assessment of glacial lake hazards was proposed in a comprehensive regional study conducted in the Tibetan Plateau region, which used four core determinants: lake area, the potential for ice and rock avalanches to strike a lake, the total watershed area upstream of the lake, and the downstream slope of the dam [25]. Gyirong, Nyalam, and Tingri counties in the central Himalayas have been determined to be hotspots for the occurrence of GLOFs [25]. Various indicators are used in the earlier assessment models, resulting in different results when evaluating GLOFs in specific regions. Previous studies have focused on the risk level of glacial lakes at specific periods, but the risk dynamics of glacial lakes are less considered. This study highlights the necessity of a new model to assess GLOF dynamical risk and selects the Rongxer Watershed as a case study to demonstrate its robustness.
This study aims to achieve the following: (1) create a dataset that encompasses glacial lakes in the Rongxer Watershed from 1990 to 2020 using Landsat images and analyze the dynamics of glacial lakes in the Rongxer Watershed; (2) identify potentially dangerous glacial lakes (PDGLs) based on selected three parameters; (3) assess the GLOF risk for PDGLs.
2. Materials and Methods
2.1. Study Area
The Rongxer Watershed is situated in the south of the Himalayas and the south of the Tibet Autonomous Region, which covers a total area of 5264 km2 (85°54′E to 86°34′E, 27°18′N to 28°19′N) (Figure 1). As one of the shortest pathways to Nepal’s capital, Kathmandu (166 km), the Rongxer Watershed is a crucial trade route between China and Nepal [26]. The Rongxer Watershed’s landscape is characterized by rugged, high-mountain terrain and deep valleys, accompanied by a warm, humid climate and ample precipitation [27,28]. Its topography varies from elevated areas in the north to lower terrain in the south, showcasing numerous peaks surpassing 5000 m, with the highest point reaching an elevation of 7310 m [29]. The hydrological network of the basin is well-developed. The Tamakoshi River, with two main tributaries, the Lapche River and the Rongxer River, is the major river that runs across the study area [30]. A total of 66 glaciers cover an area of 50 km2. Although the basin encompasses China and Nepal, most glacial lakes are found in the Chinese territory. The study area has ten villages with Tamakoshi Hydropower, and a diverse infrastructure is being built [31]. The past GLOF events have caused severe socio-economic losses, and PDGLs still threaten local communities and infrastructure. By researching glacial lake evolution and the risk of GLOFs within the basin, it is possible to improve the safety and sustainable development of the China–Nepal trade route.
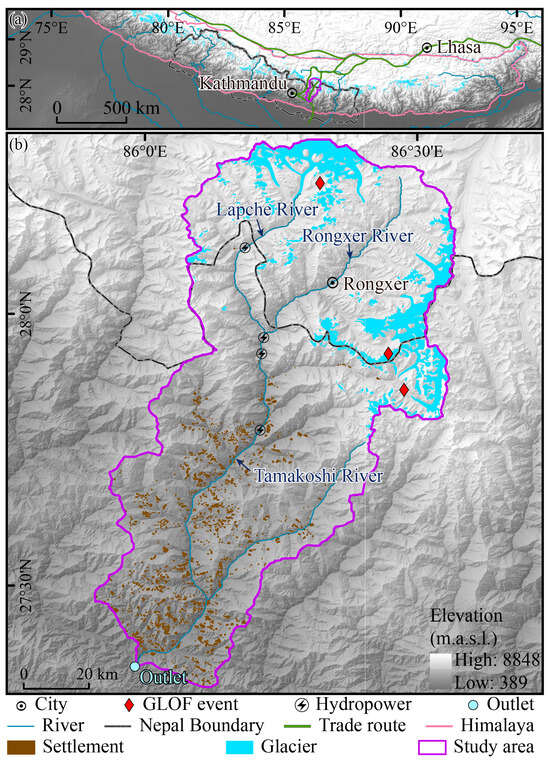
Figure 1.
Distribution of study area. Location of Rongxer watershed in the Himalayas (a) and distribution of settlements, glaciers, rivers, GLOF source lakes, and hydropower project in Rongxer watershed (b).
2.2. Data
A total of 29 Landsat TM/ETM/OLI images with a spatial resolution of 30 m were collected from the United States Geological Survey (USGS) (https://www.usgs.gov/) for mapping glacial lakes at five time periods (1990, 2000, 2010, 2015, and 2020) (Table 1). Since optical images are susceptible to cloud interference, the primary images with less than 30% cloud coverage were used to extract glacial lakes in each period. These images were processed to unzip and stack bands before being used. To avoid interference, we extended the primary reference year by two years, as this provides enough high-quality images to compensate for the challenges posed by cloud/cloud shadows, mountain shadows, and seasonal snow. The study used images acquired primarily between September and November to minimize seasonal variations in glacial lakes.

Table 1.
Landsat images used for glacial lake mapping in the study.
Auxiliary data, including the Randolph Glacial Inventory (RGI) 6.0 dataset [32], Digital Elevation Model (DEM), hydropower plants [4,33], and geospatial data from OpenStreetMap (https://www.openstreetmap.org, accessed on 11 April 2023) were utilized to calculate the attributes of glacial lakes and to evaluate the hazard risk of GLOFs. The RGI 6.0 was used to classify glacial lake types based on the spatial relationship between glaciers and glacial lakes. After a series of tests, we used different DEMs to extract the parameters. The Advanced Land Observing Satellite (ALOS) DEM with 12.5 m resolution (https://asf.alaska.edu/, accessed on 12 June 2023) was used to calculate the probability of ice or snow avalanches entering the lake. The Shuttle Radar Topography Mission Digital Elevation Model (SRTM DEM) (http://srtm.csi.cgiar.org, accessed on 12 June 2023) with a spatial resolution of 30 m was used to extract critical indicators for the glacial lake hazard assessment, including the dam front slope gradient and the upper catchment area of glacial lakes. The SRTM DEM was also employed to extract the elevation of glacial lakes and simulate the exposure of downstream areas to GLOFs. The data on roads, farmland, infrastructure, settlements, and buildings from OpenStreetMap were refined and corrected using high-resolution images in Google Earth and employed to evaluate the downstream impact of GLOFs associated with simulated inundation areas.
2.3. Methods
2.3.1. Glacial Lake Mapping
A semi-automated approach [22] is employed for mapping glacial lakes based on the Normalized Difference Water Index (NDWI) [34] and expert knowledge. The NDWI value of glacial lakes is higher than that of other non-water land surfaces, making it an ideal indicator for extracting the boundary of glacial lakes from remote sensing images. A 10 km buffer zone along RGI 6.0 glacier boundaries [35] was created to assist lake mapping, as recommended by previous studies [22,36]. The study’s minimum mapping unit (MMU) is 5 pixels, equivalent to a 4500 m2 area.
where is the green band and is the near-infrared band.
Uncertainty of glacial lake mapping is calculated using an improved Hanshaw’s algorithm [22]. The calculation formula is as follows:
where denotes the perimeter of a glacial lake; denotes the pixel size of the Landsat image, which is 30 m for multispectral bands; denotes the number of inner nodes for each lake; denotes the percentage of uncertainty in the lake mapping; and denotes the glacial lake area. The coefficient of 0.6872 is determined by assuming that a lake error is in line with the Gaussian distribution.
Preliminary results of the glacial lake outline were obtained using a semi-automated approach, and a rigorous quality control process was carried out to ensure the accuracy and quality of the glacial lake inventory. A point file is first generated to select all five-period glacier lakes. The second step is to perform a spatial join to connect the attributes of the five-period glacier lakes with the point file, ensuring that the attributes in the exact point file match those lakes. Chronological changes in glacier lakes were checked individually, and abnormal changes in glacial lakes were revised or remapped using the previous mapping method. Finally, the boundaries of glacial lakes in Google Earth images were extracted as reference data and evaluated for accuracy in the glacial lake inventory extracted in this study.
In this study, we employ two glacial lake classification systems (GLCS) as proposed by Lesi et al. [22]. In the first glacial lake classification system (GLCS1), glacial lakes are categorized as supraglacial, ice-contact, unconnected-glacier-fed lakes, and non-glacier-fed lakes based on the spatial relationship between glaciers and glacial lakes (Table 2). In the second glacial lake classification system (GLCS2), glacial lakes are categorized into supraglacial, end-moraine-dammed, lateral-moraine-dammed, and glacial-erosion lakes according to the mechanisms that control their formation (Table 3). Landsat images and RGI 6.0 glacier data make it easy to implement GLCS1. Distinguishing glacial-erosion lakes from Landsat imagery is a challenge for GLCS2, which was finally successfully identified based on our interpretation examples and with high-resolution images from Google Earth. These two classifications of glacial lakes benefit in selecting PDGLs and analyzing glacial lake risk.
Table 2.
The first glacial lake classification system (GLCS1).
Table 3.
The second glacial lake classification system (GLCS2).
2.3.2. Identification of PDGLs
Three criteria are used to filter glacial lakes for risk assessment based on their potential susceptibility and downstream impact. All the selected glacial lakes impact downstream socio-economic activities in the study area and are defined as PDGLs as proposed by previous studies [25,37]. All three parameters were obtained using Google Earth images, RGI 6.0, and Landsat images.
- (1)
- Lakes are dammed by end-moraine because they are prone to causing dam failure and dominate the Himalayan historical GLOFs [15,17,37].
- (2)
- Lakes are either in contact with glaciers or within a distance of less than 500 m from an upstream glacier and are nourished by glacier meltwater [38]. Rockfall, ice or snow avalanches, or landslides are the most common causes of Himalayan GLOFs [39]. These lakes are prone to being triggered by slope movement.
- (3)
- The lake’s size is greater than 0.1 km2, which is likely to cause significant damage [25,40,41].
2.3.3. GLOF Risk Assessment
The risk assessment of GLOFs involves three steps: (1) glacial lake hazard estimation, (2) downstream impact evaluation, and (3) risk assessment.
GLOF risk assessment workflow is shown in Figure 2. The selection criteria for PDGLs initially include glacial lake area, lake type, and the relationship between the glacial lake and its parent glacier. This step serves to identify the glacial lakes that require a comprehensive risk assessment. The expert-based Analytic Hierarchy Process (AHP) [42,43] is employed to determine the weight of various indicators for the glacial lake hazard and the downstream impacts. The geometric interval method is used to categorize each parameter. This method combines the equal interval, natural breakpoints, and percentile methods to suit non-normally distributed data [44]. The geometric interval method is employed to categorize the values of each parameter into three classes: high, medium, and low, with corresponding values of 1, 0.5, and 0.25, respectively (Table 4). Numerical values are generated by weighting the values for glacial lake hazard and the downstream impact of GLOFs using the provided formula (4). These numerical values are then further classified into five distinct levels: very low (0.25–0.40), low (0.40–0.55), medium (0.55–0.70), high (0.70–0.85), and very high (>0.85) [45,46]. Combined with the GLOF risk assessment matrix [47,48], the GLOF risk level can be determined.
where Ci is the value of each parameter, and Wi is the weight assigned to each parameter.
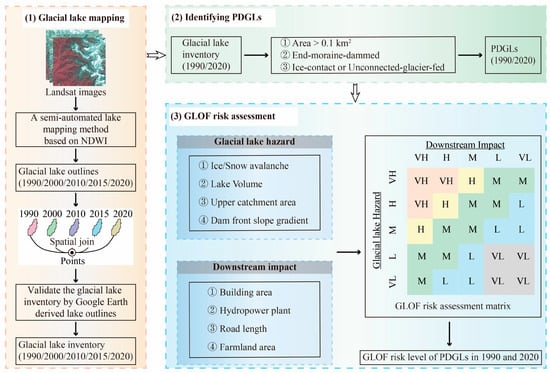
Figure 2.
Workflow for GLOF risk assessment.
Table 4.
The selected factors, their threshold, assigned value, and weight.
The assessment of glacial lake hazards considers the likelihood and potential magnitude of a lake outburst and the availability of parameters and relevance to GLOFs, as proposed by Allen et al. [25] and Zheng et al. [37]. The parameters used in this study include mass movement (ice or snow avalanches) entering into the lake, glacial lake volume, dam front slope gradient, and its upper catchment area. We replaced lake area [25] with lake volume as a factor to reflect the potential flood magnitude.
Ice and/or snow avalanches: This parameter assesses the potential for ice and snow avalanches entering a glacial lake, determining their likelihood of causing a GLOF [19]. The parameter is calculated using the Modified single-flow-direction (MSF) [49] model and DEM, employing an angle threshold of 17° [50]. Lakes susceptible to avalanches are classified as high rank if they exceed the threshold, and vice versa [45,46].
Lake volume: An empirical formula derived from previous research in the Himalayan region is used to calculate the volume of a glacial lake [51]. In this study, lake volume is used as a critical parameter for hazard assessment because it directly reflects the potential release of water volume [37], and larger lakes are more prone to sudden outburst floods [52], unlike the lake area as a factor to measure lake size.
Upper catchment area: The hydrological analysis module in ArcGIS is utilized to calculate this parameter. Large upstream catchment areas of glacial lakes can gather more rainfall and snowmelt, potentially leading to GLOFs [53]. The parameter is divided into three groups using the geometric interval method: high, medium, and low.
Dam front slope gradient: The slope of the dam front is a critical factor for assessing its stability. Historical GLOF events in the Himalayas have revealed that lakes with dam front slopes exceeding 10° are prone to outbursts [54]. Conversely, when the front slope of the dam is less than 10°, it is less likely to cause a dam failure [55].
The downstream impact of PDGLs was estimated by combining the simulated flood route and potential socio-economic losses in the affected area. The Monte Carlo Least Cost Path (MC-LCP) [56] is used to simulate the outburst flood paths of PDGLs within the study area because it is efficient in contrast to the FLO-2D [57] and the MSF model [49]. The MC-LCP model [56] was run in the Model Builder module of ArcGIS with input data, such as DEM, river path, the outlet of a glacial lake, and the cutoff distance from the lake outlet. A cutoff distance of 50 km was set to assess the downstream impact for each lake [50]. Spatial data, including buildings, hydropower plants, roads, and farmland, is used to estimate downstream socio-economic losses after obtaining the simulated flood outburst paths. Each parameter was given a specific value and weight (Table 4). Finally, the hazard and risk levels of individual glacial lakes were calculated.
3. Results
3.1. Accuracy of Glacial Lake Mapping
Our dataset has a high level of accuracy according to the validation result. To validate the accuracy of the extracted boundaries of glacial lakes, 63 glacial lakes were randomly selected for manual digitization based on high-resolution images in Google Earth. The validation process involved comparing the areas of these lakes in our lake dataset with their manually digitized areas from Google Earth. The mean difference in the glacial lake area between our lake dataset and Google Earth is 0.003 km2. 90% of samples (57/63) fall within the 95% confidence interval (Figure 3). These findings demonstrate that the semi-automatic method for extracting glacial lakes using the Normalized Difference Water Index (NDWI) achieves high accuracy in mapping glacial lakes.
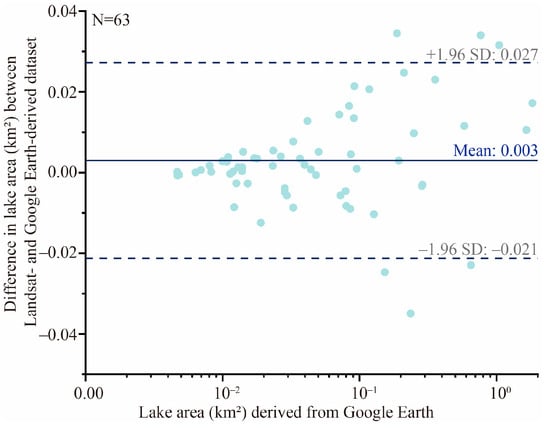
Figure 3.
A Scatter plot shows the area differences between the validation samples from our glacial lake dataset and the manually digitized glacial lakes from Google Earth.
3.2. Distribution and Dynamics of Glacial Lakes in the Rongxer Watershed
3.2.1. Distribution of Glacial Lakes
A total of 309 glacial lakes have been mapped using Landsat-8 images since 2020, covering an area of 14.89 ± 2.15 km2. Glacial lakes are widely distributed in both northern and eastern regions, with the highest density of 0.6 lakes per km2 in the northern region (Figure 4). The number and area of glacial lakes show different distributions in two lake-type classification systems. In GLCS1, unconnected glacier-fed lakes dominate in number, followed by non-glacier-fed, supraglacial, and ice-contact lakes. Ice-connected lakes dominate the area, followed by unconnected glacier-fed, non-glacier-fed, and supraglacial lakes. In GLCS2, end-moraine-dammed lakes dominated in number (182) and area (12.67 km2), followed by glacial-erosion, supraglacial, and lateral-moraine-dammed lakes. The end-moraine-dammed nineteen ice-contact lakes cover an area of 6.96 km2. One hundred sixty-one lakes were end-moraine-dammed and fed by glacier meltwater, while the other two were not fed by glacial meltwater. Most glacial lakes (265, which comprise 85.76%) are smaller than 0.05 km2 and account for 25.72% of the total area. Nineteen lakes larger than 0.1 km2 contribute to 61.18% of the total area (14.89 km2), making up 6.15% of the total number.
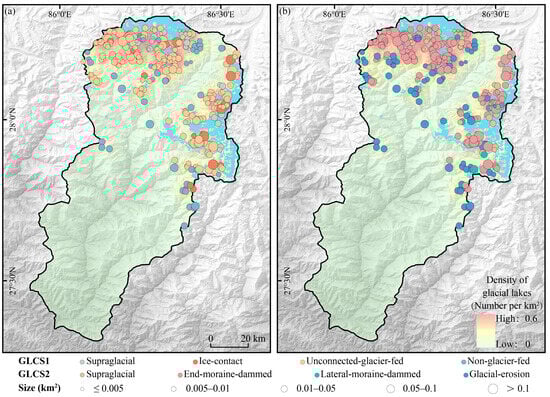
Figure 4.
The distribution of glacial lakes and their Kernel density in 2020 classified by GLCS1 (a) and GLCS2 (b).
3.2.2. Dynamics of Glacial Lakes
Between 1990 and 2020, the number and area of glacial lakes in the study increased (Figure 5a). In 1990, 215 glacial lakes covered an area of 11.35 ± 1.70 km2. The number of glacial lakes increased by 94 (43.72%), and the area increased by 3.54 km2 (31.19%) from 1990 to 2020. Small lakes (<0.05 km2) continuously increased in count and area. Lakes with an area range of 0.05−0.1 km2 fluctuated significantly. The total area of glacial lakes greater than 0.1 km2 increased by 2.39 km2 and contributed to an increase of 67.51% in the total lake expansion (Figure 5b). A total of 85 glacial lakes have recently appeared in the Rongxer Watershed with an area of 1.27 km2 (Figure 5c), while five glacial lakes disappeared with an area of 0.06 km2 (Figure 5d). The newly formed glacial lakes are mainly distributed in an altitudinal range between 4800 m and 5600 m, which exceeded the average altitude of the glacial lakes that disappeared (4987 m). The formation of new glacial lakes at higher altitudes resulted from warming-induced glacial retreat, increasing the average altitude of glacial lakes in the study area.
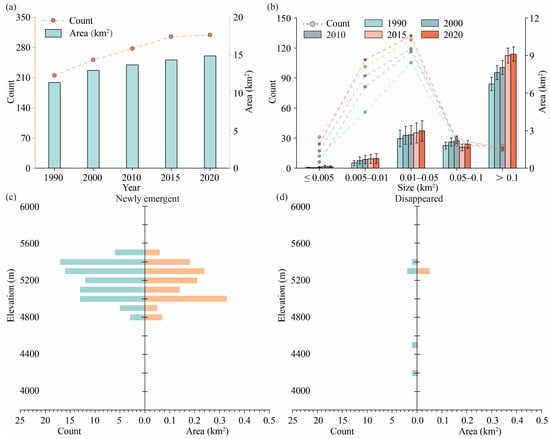
Figure 5.
Changes in count and area of glacial lakes between 1990 and 2022. The count and area of glacial lakes in the Rongxer Watershed were recorded in five periods (a) and various sizes between 1990 and 2020 (b). Altitudinal characteristics of newly emergent lakes (c) and disappeared lakes (d) between 1990 and 2020 by count and area are shown.
In the GLCS1, the number of unconnected glacier-fed lakes increased by 73 and was the most significant increase (77.66% of the total increasing number) between 1990 and 2020. The counts of ice-contact lakes and non-glacier-fed lakes were stable, but the expansion of ice-contact lakes by 3.03 km2 resulted in an 85.59% increase in total expansion. Unconnected-glacier-fed lakes expanded by 1.22 km2, accounting for 34.46% of the total expansion. Non-glacier-fed lakes remained relatively stable in area (Figure 6a,b). In the GLCS2, end-moraine-dammed lakes increased obviously in both count and area and contributed the most to the expansion of the glacial lake. From 1990 to 2020, the count of end-moraine-dammed lakes increased by 63, accounting for 67.02% of the increase. The area of end-moraine-dammed glacial lakes increased by 3.91 km2 (Figure 6c,d). The count and area of lateral-moraine-dammed lakes remained relatively stable, while glacial-erosion lakes increased slightly in number and area. Supraglacial lakes reduced by 0.82 km2 are attributed to the expansion of two supraglacial lakes after 1990, transforming into ice-contact or unconnected-glacier-fed lakes in the GLCS1 and converting into end-moraine-dammed lakes in the GLCS2.
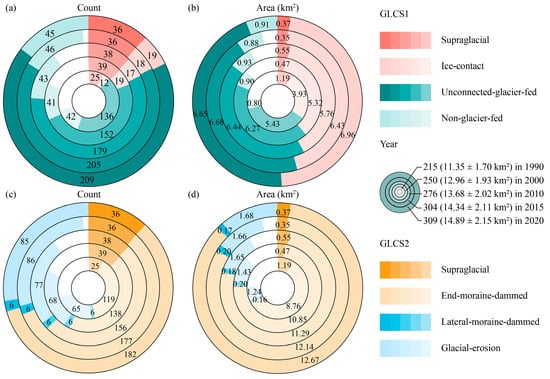
Figure 6.
Count (a) and area (b) of glacial lakes between 1990 and 2020 based on the GLCS 1. Count (c) and area (d) of glacial lakes between 1990 and 2020 based on the GLCS 2.
The dynamics of glacial lakes exhibit intricate changes, encompassing the disappearance of existing lakes and the formation of new ones. Ice-contact glacial lakes are chosen as a case study to demonstrate the change. Eight ice-contact glacial lakes existed over five time periods, expanding from 3.77 km2 in 1990 to 4.92 km2 in 2020, which played the most significant role in the expansion of glacial lakes (Table 5). In 2000, the presence of two ice-contact glacial lakes was attributed to the transition process from supraglacial lakes to end-moraine-dammed lakes, which occurs during the expansive phase of glacial lakes. These lakes were discrete supraglacial lakes in 1990, but they evolved into large end-moraine-dammed lakes later. A total of 10 ice-contact glacial lakes have recently formed since 2000, with an area of 0.22 km2. The total area of glacial lakes that disappeared and have recently emerged is smaller than that of ice-contact glacial lakes in five different periods.
Table 5.
Changing patterns of ice-contact lakes in Rongxer Watershed between 1990 and 2020.
3.3. GLOF Risk Assessment and Validation
Glacial lake hazard levels have risen between 1990 and 2020. The filter criterion determined that 16 lakes were identified for assessment of hazards in 1990, and 18 lakes within the Rongxer watershed were chosen in 2020 (Table 6). In 1990, four glacial lakes were categorized as very high-hazard, five were high-hazard glacial lakes, three were medium-hazard glacial lakes, two were low-hazard glacial lakes, and two were very low-hazard glacial lakes. In 2020, six glacial lakes were classified as very high-hazard, along with seven high-hazard, three medium-hazard, and two very low-hazard lakes. Two PDGLs were added from 1990 to 2020, and the hazard level of two PDGLs increased. The increase in hazard level is due to the significantly increasing volume of the glacial lake and the increasing probability of ice avalanche material entering the lake. As shown in Figure 7a,b, lakes with high and very high hazards were concentrated around the northeastern glaciers in the watershed in 1990 and 2020.
Table 6.
Hazard and risk of PDGLs in 1990 and 2020.
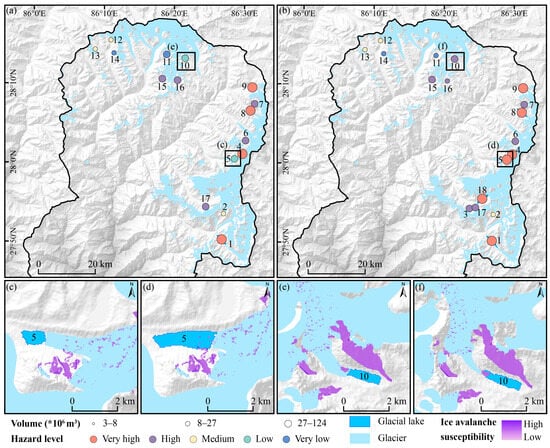
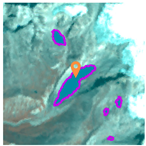
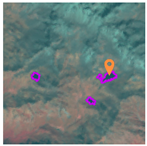
Figure 7.
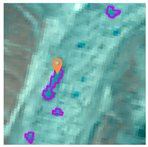
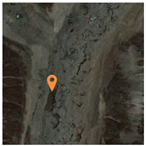
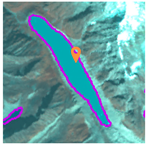
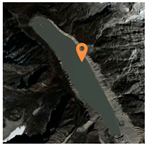
Distribution of hazard levels for PDGLs in 1990 and 2020, and ice avalanche trajectories of typical PDGLs. The distribution of glacial lake hazard levels from 1990 (a) to 2020 (b). The ice avalanche trajectories of Lake 5 in 1990 (c) and 2020 (d). The ice avalanche trajectories of Lake 10 in 1990 (e) and 2020 (f).
Glacial lakes with a very high hazard level have large volumes. PDGL, with a Lake ID of 5, as seen in Figure 7c,d, underwent a significant glacial lake expansion. The expansion led to a significant increase in the volume of the glacial lake, which resulted in a shift from a low to a very high hazard level from 1990 to 2020. The glacial lake with a Lake ID of 10 also had a significant expansion in area, which increases the probability of ice avalanche material entering the lake. The results show that ice avalanche mass in 1990 could not enter the lake (Figure 7e), while the expansion of the glacial lake between 1990 and 2020 led to ice avalanches entering the lake (Figure 7f). The hazard level of this lake has risen from low to high.
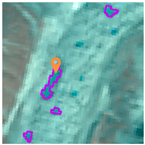
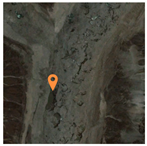
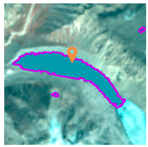
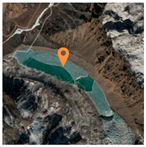
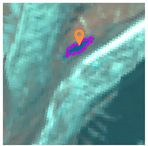
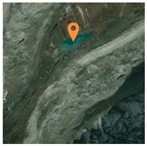
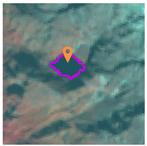
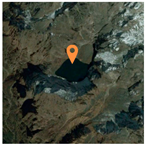
Following a comprehensive risk assessment for PDGLs in 1990 and 2020, Niangzongmajue (Lake ID = 9, 28.19°N, 86.53°E) and Tsho Rolpa (Lake ID = 1, 27.86°N, 86.48°E) lakes were both categorized as very high risk. One glacial lake was classified as high-risk in 2020, along with eight as medium risk, five as low risk, and two as very low risk (Table 6). Figure 8a shows the distribution of glacial lake risk levels in 2020, with very high-risk and high-risk glacial lakes located in the eastern part of the basin. Niangzongmajue and Tsho Rolpa were recognized as very high risk due to their significant water volumes, high probability of slope mass entering, and significant downstream impacts. Selecting Niangzongmajue, for example, the trajectory of ice avalanches into the lake can be visualized through MSF model simulations (Figure 8b). Two photographs taken in July 2023 show that the lake is in direct contact with the glacier, and the outlet of the glacial lake is relatively tiny (Figure 8c,d). Figure 8e shows the inundation path from the lake, which directly impacts the Upper Tamakoshi hydropower project. The current amount of water from Niangzongmajue is enormous, and a flood would have a significant and potentially devastating effect on the downstream infrastructure. Our model’s accuracy is confirmed by the field investigation that confirms Niangzongmajue’s high disaster risk.
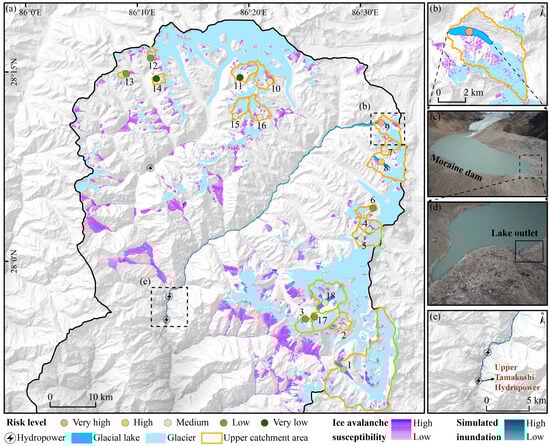
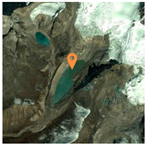
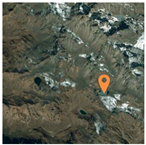
Figure 8.
The risk level, upper catchment boundary, and ice avalanche susceptibility of each PDGL. The distribution of PDGLs and their risk levels in 2020 (a). The trajectory of ice avalanches into Lake Niangzongmajue is simulated by the MSF model (b). Photos of Lake Niangzongmajue were taken on 30 July 2023 (c,d), and the path of simulated inundation from Niangzongmajue (e).
To validate the assessment method of this study, 14 historical GLOFs in the Himalayas and Nyainqentanglha Mountain were selected, and their hazard levels were estimated (Table 7). Our proposed method is used to extract the hazard parameters of glacial lakes before disasters occur and determine their hazard levels. The historical GLOF source lakes were categorized as high to very high hazards, including 3 lakes at very high-hazard levels and 11 lakes at high-hazard levels. The hazard assessment method for glacial lakes used in this study reveals a high probability of outbursts from historical GLOFs, which indicates its credibility.
Table 7.
The hazard levels of historical GLOF source lakes determined using our proposed method.
4. Discussion
A significant increase in the number and total area of glacial lakes in the study area was observed from 1990 to 2020, consistent with other studies in the Himalayas. We mapped a total area of glacial lakes with coverage of 13.68 km2 in 2010 and 14.89 km2 in 2020. The area is in accordance with another study conducted in the same watershed in 2020 that mapped glacial lakes with an area of 14.4 km2 [18]. The number of glacial lakes increased from 215 in 1990 to 309 in 2020, representing an increase of 93 lakes. The total glacial lake area increased by 31.19% from 11.35 km2 to 14.89 km2 between 1990 and 2020. The expansion is in line with glacial lake changes in the Himalayas observed by remote sensing imagery. For instance, the area of glacial lakes in the Himalayas increased by 30.53% from 1990 to 2020 [58] and 25% for the Nepal Himalayas from 1987 to 2017 [59].
Global warming plays a prominent role in the rapid expansion of glacial lakes and the increasing risk of GLOF. The retreat of glaciers has been caused by increased temperatures and decreased precipitation [4,27,59,60], exacerbating interactions between glaciers and lakes. This interaction leads to more ice mass loss, which ultimately results in the expansion of glacial lakes [61,62]. The temperature increase rate was measured at 0.01 °C a-1 from 1979 to 2019 in the Rongxer watershed [18]. In the context of increasing temperature, end-moraine-dammed lakes are expanding significantly as the primary type of GLOF events [60]. In the Rongxer watershed, end-moraine-dammed lakes in contact with glaciers have expanded by 3.06 km2 over the past 30 years and will continue to expand. This ongoing expansion poses an increased GLOF risk [37] and increases threats to people and infrastructure [63]. Therefore, there is an urgent need for monitoring of glacial lakes and risk dynamics studies.
The GLOF risk dynamics of the Rongxer watershed were analyzed to reveal an increasing risk of PDGLs between 1990 and 2020. Between 1990 and 2020, there was an increase in the number of PDGLs from 16 to 18, and the hazard level of two PDGLs increased due to the expansion of glacial lakes. Lake expansion increased the water volume of the glacial lake and increased the likelihood of ice avalanches entering the lake. Niangzongmajue and Tsho Rolpa, which were at a very high-risk level in both 1990 and 2020, should be paid more attention. Simulation of the potential outburst paths from these two glacial lakes reveals that the lakes could cause serious consequences. The downstream Upper Tamakoshi Hydropower project, a critical component of Nepal’s energy infrastructure and the primary source of electricity for more than half of the country’s population, would face a substantial threat [28]. The dam failure floods would lead to housing shortages and extensive damage to the local infrastructure. The Rongxer watershed was a hotspot for GLOFs in earlier studies [13,37,48,64] as it is a crucial trade route on the China–Nepal corridor and faces threats from GLOFs. Monitoring the status of PDGLs based on satellite observations and reducing the risk of outbursts plays a critical role in protecting local communities and contributing to the sustainable development of the region’s infrastructure and economy. In our study, we conducted dynamic monitoring and risk assessment of glacial lakes in the Rongxer Watershed using remote sensing imagery. It is beneficial for local decision-making on reducing GLOF.
The results of risk evaluations are determined by the parameter selection and weight used in hazard and downstream impact assessments. In GLOF’s research, a standardized model for assessing glacial lake risks has not yet been developed. The scheme we used to define risk in this study was based on the probabilities of hazard (susceptibility) and the downstream impact [37,50]. Parameters, including ice and snow avalanches entering the lake, glacial lake volume, dam front slope gradient, and upper catchment area, were selected as factors for the hazard index that combines the likelihood and potential magnitude of a GLOF [25,37]. The risk assessment considers only the outburst mechanism of moraine dam failures via overtopping, excluding other outburst mechanisms such as tunneling and thawing of ice-cored moraine dams [3,9]. Some studies consider that the slope of the dam is a crucial control of the dam’s stability and the potential for self-destruction [25]. Buried ice controls dam stability and self-destruction [47], which cannot be accurately determined by remote sensing observations. One limitation of our study is that we lack enough fieldwork to validate our results and related parameters, such as whether there is buried ice in the moraine dam. So, the slope of the dam is given a lower weight using the expert-based AHP. The factors in downstream impact assessment, including buildings, hydroelectric plants, roads, and farmlands, were selected to analyze the potential impact of glacial lake outbursts, given the reality of the study area and previous studies. The MC-LCP model was selected to simulate the affected area as exposure to GLOFs in this study. The critical inputs, such as the cutoff distance, vary between different studies and regions [47,50] and should be set considering the characteristics of the study area. Manual work is still required for some of the methods used in this study. In future research, it is necessary to have an automated algorithm that is robust and can extract each parameter in the risk assessment model.
5. Conclusions
This study first systematically reveals glacial lake dynamics in the Rongxer Watershed from 1990 to 2020 at five periods using Landsat imagery and completes a risk assessment of PDGLs using an improved method that combines the hazard level and downstream impact.
The Rongxer Watershed contains 309 glacial lakes in 2020, with the majority concentrated in the northern part of the watershed. The area of glacial lakes increased by an average of 0.12 km2 per year from 1990 to 2020, with ice-contact lakes contributing the most.
A GLOF risk assessment was conducted on 18 glacial lakes in 2020, which were selected based on our setting criteria. Niangzongmajue and Tsho Rolpa were identified as being highly risky. The Rongxer Watershed is experiencing an increased risk of glacial lake outbursts between 1990 and 2020. Our assessment results were validated by hazard assessment of historical outburst glacial lakes. Our findings and assessment methods benefit local GLOF reduction. Satellite observations play an essential role in monitoring the status of PDGLs to minimize the risk of GLOFs in the Rongxer Watershed, which positively sustains local communities and develops the economic corridor between China and Nepal.
Author Contributions
Conceptualization, Y.N. and S.Z.; Methodology, Y.N. and S.Z.; Software, Y.N. and S.Z.; Validation, S.Z.; Resources, Y.N.; Data Curation, S.Z.; Writing—Original Draft Preparation, S.Z.; Writing—Review and Editing, Y.N. and H.Z.; Visualization, S.Z.; Supervision, Y.N.; Project Administration, Y.N.; Funding Acquisition, Y.N. All authors have read and agreed to the published version of the manuscript.
Funding
This work was funded by the Science and Technology Department of Tibet (grant No. XZ202301ZY0016G) and the National Natural Science Foundation of China (Grant Nos. 41971153, 42171086).
Data Availability Statement
Data will be made available on request.
Acknowledgments
We thank the GloVis, ASF, and NASA for sharing archival Landsat images, ALOS-PALSAR DEMs, and SRTM DEMs, respectively. Thanks to Muchu Lesi for her suggestions on the paper’s Discussion section. We thank three anonymous referees for their constructive and valuable comments, significantly improving this manuscript.
Conflicts of Interest
The authors declare no conflicts of interest.
References
- Yao, X.; Liu, S.; Han, L.; Sun, M.; Zhao, L. Definition and classification system of glacial lake for inventory and hazards study. J. Geogr. Sci. 2018, 28, 193–205. [Google Scholar] [CrossRef]
- Allen, S.K.; Linsbauer, A.; Randhawa, S.S.; Huggel, C.; Rana, P.; Kumari, A. Glacial lake outburst flood risk in Himachal Pradesh, India: An integrative and anticipatory approach considering current and future threats. Nat. Hazards 2016, 84, 1741–1763. [Google Scholar] [CrossRef]
- Haritashya, U.; Kargel, J.; Shugar, D.; Leonard, G.; Strattman, K.; Watson, C.; Shean, D.; Harrison, S.; Mandli, K.; Regmi, D. Evolution and Controls of Large Glacial Lakes in the Nepal Himalaya. Remote Sens. 2018, 10, 798. [Google Scholar] [CrossRef]
- Nie, Y.; Pritchard, H.D.; Liu, Q.; Hennig, T.; Wang, W.; Wang, X.; Liu, S.; Nepal, S.; Samyn, D.; Hewitt, K.; et al. Glacial change and hydrological implications in the Himalaya and Karakoram. Nat. Rev. Earth Environ. 2021, 2, 91–106. [Google Scholar] [CrossRef]
- Anacona, P.I.; Mackintosh, A.; Norton, K. Reconstruction of a glacial lake outburst flood (GLOF) in the Engaño Valley, Chilean Patagonia: Lessons for GLOF risk management. Sci. Total Environ. 2015, 527–528, 1–11. [Google Scholar] [CrossRef]
- Carrivick, J.L.; Tweed, F.S. A global assessment of the societal impacts of glacier outburst floods. Glob. Planet. Chang. 2016, 144, 1–16. [Google Scholar] [CrossRef]
- Majeed, U.; Rashid, I.; Sattar, A.; Allen, S.; Stoffel, M.; Nüsser, M.; Schmidt, S. Recession of Gya Glacier and the 2014 glacial lake outburst flood in the Trans-Himalayan region of Ladakh, India. Sci. Total Environ. 2021, 756, 144008. [Google Scholar] [CrossRef] [PubMed]
- Wang, W.; Nie, Y.; Zhang, H.; Wang, J.; Deng, Q.; Liu, L.; Liu, F.; Zhang, S.; Lyu, Q.; Zhang, L. A generic framework for glacial lake outburst flood investigation: A case study of Zalai Tsho, Southeast Tibet. Catena 2024, 234, 107614. [Google Scholar] [CrossRef]
- Schmidt, S.; Nüsser, M.; Baghel, R.; Dame, J. Cryosphere hazards in Ladakh: The 2014 Gya glacial lake outburst flood and its implications for risk assessment. Nat. Hazards 2020, 104, 2071–2095. [Google Scholar] [CrossRef]
- Kattelmann, R. Glacial Lake Outburst Floods in the Nepal Himalaya: A Manageable Hazard. Nat. Hazards 2003, 28, 145–154. [Google Scholar] [CrossRef]
- Bajracharya, B.; Shrestha, A.B.; Rajbhandari, L. Glacial Lake Outburst Floods in the Sagarmatha Region. Mt. Res. Dev. 2007, 27, 336–344. [Google Scholar] [CrossRef]
- Gurung, D.R.; Khanal, N.R.; Bajracharya, S.R.; Tsering, K.; Joshi, S.; Tshering, P.; Chhetri, L.K.; Lotay, Y.; Penjor, T. Lemthang Tsho glacial Lake outburst flood (GLOF) in Bhutan: Cause and impact. Geoenviron. Disasters 2017, 4, 17. [Google Scholar] [CrossRef]
- Taylor, C.; Robinson, T.R.; Dunning, S.; Rachel Carr, J.; Westoby, M. Glacial lake outburst floods threaten millions globally. Nat. Commun. 2023, 14, 487. [Google Scholar] [CrossRef] [PubMed]
- Liu, M.; Chen, N.; Zhang, Y.; Deng, M. Glacial Lake Inventory and Lake Outburst Flood/Debris Flow Hazard Assessment after the Gorkha Earthquake in the Bhote Koshi Basin. Water 2020, 12, 464. [Google Scholar] [CrossRef]
- Nie, Y.; Liu, Q.; Wang, J.; Zhang, Y.; Sheng, Y.; Liu, S. An inventory of historical glacial lake outburst floods in the Himalayas based on remote sensing observations and geomorphological analysis. Geomorphology 2018, 308, 91–106. [Google Scholar] [CrossRef]
- Reynolds, J.M. Glacial hazard assessment at Tsho Rolpa, Rolwaling, central Nepal. Q. J. Eng. Geol. Hydrogeol. 1999, 32, 209–214. [Google Scholar] [CrossRef]
- Veh, G.; Korup, O.; von Specht, S.; Roessner, S.; Walz, A. Unchanged frequency of moraine-dammed glacial lake outburst floods in the Himalaya. Nat. Clim. Chang. 2019, 9, 379–383. [Google Scholar] [CrossRef]
- Zhong, Y.; Liu, Q.; Sapkota, L.; Luo, Y.; Wang, H.; Liao, H.; Wu, Y. Rapid glacier Shrinkage and Glacial Lake Expansion of a China-Nepal Transboundary Catchment in the Central Himalayas, between 1964 and 2020. Remote Sens. 2021, 13, 3614. [Google Scholar] [CrossRef]
- Wang, W.; Yao, T.; Gao, Y.; Yang, X.; Kattel, D.B. A First-order Method to Identify Potentially Dangerous Glacial Lakes in a Region of the Southeastern Tibetan Plateau. Mt. Res. Dev. 2011, 2, 122–130. [Google Scholar] [CrossRef]
- Nie, Y.; Sheng, Y.; Liu, Q.; Liu, L.; Liu, S.; Zhang, Y.; Song, C. A regional-scale assessment of Himalayan glacial lake changes using satellite observations from 1990 to 2015. Remote Sens. Environ. 2017, 189, 1–13. [Google Scholar] [CrossRef]
- Zhang, G.; Yao, T.; Xie, H.; Wang, W.; Yang, W. An inventory of glacial lakes in the Third Pole region and their changes in response to global warming. Glob. Planet. Chang. 2015, 131, 148–157. [Google Scholar] [CrossRef]
- Lesi, M.; Nie, Y.; Shugar, D.H.; Wang, J.; Deng, Q.; Chen, H.; Fan, J. Landsat- and Sentinel-derived glacial lake dataset in the China–Pakistan Economic Corridor from 1990 to 2020. Earth Syst. Sci. Data 2022, 14, 5489–5512. [Google Scholar] [CrossRef]
- ICIMOD. Glacial Lakes and Glacial Lake Outburst Floods in Nepal; ICIMOD: Kathmandu, Nepal, 2011. [Google Scholar]
- Rounce, D.; Watson, C.; Mckinney, D. Identification of Hazard and Risk for Glacial Lakes in the Nepal Himalaya Using Satellite Imagery from 2000–2015. Remote Sens. 2017, 9, 654. [Google Scholar] [CrossRef]
- Allen, S.K.; Zhang, G.; Wang, W.; Yao, T.; Bolch, T. Potentially dangerous glacial lakes across the Tibetan Plateau revealed using a large-scale automated assessment approach. Sci. Bull. 2019, 64, 435–445. [Google Scholar] [CrossRef]
- Wu, S.; Yan, J.; Zhang, Y.; Peng, T.; Su, K. Evolutionary process and development implications of traditional trade routes in the Himalayan region. J. Geogr. Sci. 2022, 32, 1847–1865. [Google Scholar] [CrossRef]
- Khadka, N.; Chen, X.; Sharma, S.; Shrestha, B. Climate change and its impacts on glaciers and glacial lakes in Nepal Himalayas. Reg. Environ. Chang. 2023, 23, 143. [Google Scholar] [CrossRef]
- Shrestha, S.; Bajracharya, A.R.; Babel, M.S. Assessment of risks due to climate change for the Upper Tamakoshi Hydropower Project in Nepal. Clim. Risk Manag. 2016, 14, 27–41. [Google Scholar] [CrossRef]
- Khadka, D.; Babel, M.S.; Shrestha, S.; Tripathi, N.K. Climate change impact on glacier and snow melt and runoff in Tamakoshi basin in the Hindu Kush Himalayan (HKH) region. J. Hydrol. 2014, 511, 49–60. [Google Scholar] [CrossRef]
- Wu, S.; Yao, Z.; Huang, H.; Liu, Z.; Liu, G. Responses of glaciers and glacial lakes to climate variation between 1975 and 2005 in the Rongxer basin of Tibet, China and Nepal. Reg. Environ. Chang. 2012, 12, 887–898. [Google Scholar] [CrossRef]
- Khadka, M.; Kayastha, R.B.; Kayastha, R. Future projection of cryospheric and hydrologic regimes in Koshi River basin, Central Himalaya, using coupled glacier dynamics and glacio-hydrological models. J. Glaciol. 2020, 66, 831–845. [Google Scholar] [CrossRef]
- Pfeffer, W.T.; Arendt, A.A.; Bliss, A.; Bolch, T.; Cogley, J.G.; Gardner, A.S.; Hagen, J.; Hock, R.; Kaser, G.; Kienholz, C.; et al. The Randolph Glacier Inventory: A globally complete inventory of glaciers. J. Glaciol. 2014, 60, 537–552. [Google Scholar] [CrossRef]
- Zarfl, C.; Lumsdon, A.E.; Berlekamp, J.; Tydecks, L.; Tockner, K. A global boom in hydropower dam construction. Aquat. Sci. 2015, 77, 161–170. [Google Scholar] [CrossRef]
- Mcfeeters, S.K. The use of the Normalized Difference Water Index (NDWI) in the delineation of open water features. Int. J. Remote Sens. 1996, 17, 1425–1432. [Google Scholar] [CrossRef]
- RGI Consortium. Randolph Glacier Inventory—A Dataset of Global Glacier Outlines, 6th ed.; National Snow and Ice Data Center: Boulder, CO, USA, 2017. [Google Scholar]
- Wang, X.; Guo, X.; Yang, C.; Liu, Q.; Wei, J.; Zhang, Y.; Liu, S.; Zhang, Y.; Jiang, Z.; Tang, Z. Glacial lake inventory of high-mountain Asia in 1990 and 2018 derived from Landsat images. Earth Syst. Sci. Data 2020, 12, 2169–2182. [Google Scholar] [CrossRef]
- Zheng, G.; Allen, S.; Bao, A.; Antonio Ballesteros-Cánovas, J.; Huss, M.; Zhang, G.; Li, J.; Ye, Y.; Jiang, L.; Yu, T.; et al. Increasing risk of glacial lake outburst floods from future Third Pole deglaciation. Nat. Clim. Chang. 2021, 5, 411–417. [Google Scholar] [CrossRef]
- Wang, X.; Liu, S.; Ding, Y.; Guo, W.; Jiang, Z.; Lin, J.; Han, Y. An approach for estimating the breach probabilities of moraine-dammed lakes in the Chinese Himalayas using remote-sensing data. Nat. Hazards Earth Syst. Sci. 2012, 12, 3109–3122. [Google Scholar] [CrossRef]
- Zheng, G.; Bao, A.; Allen, S.; Antonio Ballesteros-Cánovas, J.; Yuan, Y.; Jiapaer, G.; Stoffel, M. Numerous unreported glacial lake outburst floods in the Third Pole revealed by high-resolution satellite data and geomorphological evidence. Sci. Bull. 2021, 66, 1270–1273. [Google Scholar] [CrossRef] [PubMed]
- Cui, P.; Ma, D.; Chen, N.; Jiang, Z. The initiation, motion and mitigation of debris flow caused by glacial lake outburst. Quat. Sci. 2003, 6, 621–628. [Google Scholar]
- Fan, J.; An, C.; Zhang, X.; Li, X.; Tan, J. Hazard assessment of glacial lake outburst floods in Southeast Tibet based on RS and GIS technologies. Int. J. Remote Sens. 2019, 40, 4955–4979. [Google Scholar] [CrossRef]
- Saaty, T. Decision Making with the Analytic Hierarchy Process; Springer: Amsterdam, The Netherlands, 1990. [Google Scholar]
- Emmer, A.; Allen, S.K.; Carey, M.; Frey, H.; Huggel, C.; Korup, O.; Mergili, M.; Sattar, A.; Veh, G.; Chen, T.Y.; et al. Progress and challenges in glacial lake outburst flood research (2017–2021): A research community perspective. Nat. Hazards Earth Syst. Sci. 2022, 22, 3041–3061. [Google Scholar] [CrossRef]
- Francisci, D. A Python Script for Geometric Interval Classification in QGIS: A Useful Tool for Archaeologists. Environ. Sci. Proc. 2021, 511, 49–60. [Google Scholar]
- Khadka, N.; Chen, X.; Nie, Y.; Thakuri, S.; Zheng, G.; Zhang, G. Evaluation of Glacial Lake Outburst Flood Susceptibility Using Multi-Criteria Assessment Framework in Mahalangur Himalaya. Front. Earth Sci. 2021, 8, 601288. [Google Scholar] [CrossRef]
- Rawat, M.; Jain, S.K.; Ahmed, R.; Lohani, A.K. Glacial lake outburst flood risk assessment using remote sensing and hydrodynamic modeling: A case study of Satluj basin, Western Himalayas, India. Environ. Sci. Pollut. Res. 2023, 30, 41591–41608. [Google Scholar] [CrossRef] [PubMed]
- Rounce, D.R.; Mckinney, D.C.; Lala, J.M.; Byers, A.C.; Watson, C.S. A new remote hazard and risk assessment framework for glacial lakes in the Nepal Himalaya. Hydrol. Earth Syst. Sci. 2016, 20, 3455–3475. [Google Scholar] [CrossRef]
- Zhang, T.; Wang, W.; Gao, T.; An, B.; Yao, T. An integrative method for identifying potentially dangerous glacial lakes in the Himalayas. Sci. Total Environ. 2022, 806, 150442. [Google Scholar] [CrossRef]
- Huggel, C.; Kääb, A.; Haeberli, W.; Krummenacher, B. Regional-scale GIS-models for assessment of hazards from glacier lake outbursts; evaluation and application in the Swiss Alps. Nat. Hazards Earth Syst. Sci. 2003, 3, 647–662. [Google Scholar] [CrossRef]
- Dubey, S.; Goyal, M.K. Glacial Lake Outburst Flood Hazard, Downstream Impact, and Risk Over the Indian Himalayas. Water Resour. Res. 2020, 56, e2019WR026533. [Google Scholar] [CrossRef]
- Qi, M.; Liu, S.; Wu, K.; Zhu, Y.; Xie, F.; Jin, H.; Gao, Y.; Yao, X. Improving the accuracy of glacial lake volume estimation: A case study in the Poiqu basin, central Himalayas. J. Hydrol. 2022, 610, 127973. [Google Scholar] [CrossRef]
- Fischer, M.; Korup, O.; Veh, G.; Walz, A. Controls of outbursts of moraine-dammed lakes in the greater Himalayan region. Cryosphere 2021, 15, 4145–4163. [Google Scholar] [CrossRef]
- Allen, S.K.; Sattar, A.; King, O.; Zhang, G.; Bhattacharya, A.; Yao, T.; Bolch, T. Glacial lake outburst flood hazard under current and future conditions: Worst-case scenarios in a transboundary Himalayan basin. Nat. Hazards Earth Syst. Sci. 2022, 22, 3765–3785. [Google Scholar] [CrossRef]
- Fujita, K.; Sakai, A.; Takenaka, S.; Nuimura, T.; Surazakov, A.B.; Sawagaki, T.; Yamanokuchi, T. Potential flood volume of Himalayan glacial lakes. Nat. Hazards Earth Syst. Sci. 2013, 13, 1827–1839. [Google Scholar] [CrossRef]
- Koike, T.; Takenaka, S. Scenario Analysis on Risks of Glacial Lake Outburst Floods on the Mangde Chhu River, Bhutan. Glob. Environ. Res. 2012, 1, 41–49. [Google Scholar]
- Watson, C.S.; Carrivick, J.; Quincey, D. An improved method to represent DEM uncertainty in glacial lake outburst flood propagation using stochastic simulations. J. Hydrol. 2015, 529, 1373–1389. [Google Scholar] [CrossRef]
- O’Brien, J.S.; Julien, P.Y.; Fullerton, W.T. Two-Dimensional Water Flood and Mudflow Simulation. J. Hydraul. Eng. 1993, 119, 244–261. [Google Scholar] [CrossRef]
- Mohanty, L.; Maiti, S.; Dixit, A. Spatio-temporal assessment of regional scale evolution and distribution of glacial lakes in Himalaya. Front. Earth Sci. 2023, 10, 1038777. [Google Scholar] [CrossRef]
- Khadka, N.; Zhang, G.; Thakuri, S. Glacial Lakes in the Nepal Himalaya: Inventory and Decadal Dynamics (1977–2017). Remote Sens. 2018, 10, 1913. [Google Scholar] [CrossRef]
- Prakash, C.; Nagarajan, R. Outburst susceptibility assessment of moraine-dammed lakes in Western Himalaya using an analytic hierarchy process. Earth Surf. Process. Landf. 2017, 42, 2306–2321. [Google Scholar] [CrossRef]
- King, O.; Dehecq, A.; Quincey, D.; Carrivick, J. Contrasting geometric and dynamic evolution of lake and land-terminating glaciers in the central Himalaya. Glob. Planet. Chang. 2018, 167, 46–60. [Google Scholar] [CrossRef]
- Zhang, G.; Bolch, T.; Allen, S.; Linsbauer, A.; Chen, W.; Wang, W. Glacial lake evolution and glacier–lake interactions in the Poiqu River basin, central Himalaya, 1964–2017. J. Glaciol. 2019, 65, 347–365. [Google Scholar] [CrossRef]
- Nie, Y.; Deng, Q.; Pritchard, H.D.; Carrivick, J.L.; Ahmed, F.; Huggel, C.; Liu, L.; Wang, W.; Lesi, M.; Wang, J.; et al. Glacial lake outburst floods threaten Asia’s infrastructure. Sci. Bull. 2023, 68, 1361–1365. [Google Scholar] [CrossRef] [PubMed]
- Wang, S.; Qin, D.; Xiao, C. Moraine-dammed lake distribution and outburst flood risk in the Chinese Himalaya. J. Glaciol. 2015, 61, 115–126. [Google Scholar]
Disclaimer/Publisher’s Note: The statements, opinions and data contained in all publications are solely those of the individual author(s) and contributor(s) and not of MDPI and/or the editor(s). MDPI and/or the editor(s) disclaim responsibility for any injury to people or property resulting from any ideas, methods, instructions or products referred to in the content. |
© 2024 by the authors. Licensee MDPI, Basel, Switzerland. This article is an open access article distributed under the terms and conditions of the Creative Commons Attribution (CC BY) license (https://creativecommons.org/licenses/by/4.0/).