Article

Two-Decadal Glacier Changes in the Astak, a Tributary Catchment of the Upper Indus River in Northern Pakistan

1
Institute of Mountain Hazards and Environment, Chinese Academy of Sciences, Chengdu 610299, China
2
University of Chinese Academy of Sciences, Beijing 100049, China
*
Author to whom correspondence should be addressed.
Remote Sens. 2024, 16(9), 1558; https://doi.org/10.3390/rs16091558
Submission received: 25 March 2024 / Revised: 20 April 2024 / Accepted: 25 April 2024 / Published: 27 April 2024

Abstract

:
Snow and ice melting in the Upper Indus Basin (UIB) is crucial for regional water availability for mountainous communities. We analyzed glacier changes in the Astak catchment, UIB, from 2000 to 2020 using remote sensing techniques based on optical satellite images from Landsat and ASTER digital elevation models. We used a surface feature-tracking technique to estimate glacier velocity. To assess the impact of climate variations, we examined temperature and precipitation anomalies using ERA5 Land climate data. Over the past two decades, the Astak catchment experienced a slight decrease in glacier area (−1.8 km2) and the overall specific mass balance was −0.02 ± 0.1 m w.e. a−1. The most negative mass balance of −0.09 ± 0.06 m w.e. a−1 occurred at elevations between 2810 to 3220 m a.s.l., with a lesser rate of −0.015 ± 0.12 m w.e. a−1 above 5500 m a.s.l. This variation in glacier mass balance can be attributed to temperature and precipitation gradients, as well as debris cover. Recent glacier mass loss can be linked to seasonal temperature anomalies at higher elevations during winter and autumn. Given the reliance of mountain populations on glacier melt, seasonal temperature trends can disturb water security and the well-being of dependent communities.

1. Introduction

The economy centered around agriculture in Pakistan relies significantly on the water supply through the Indus Basin irrigation system, and the upstream mountainous regions largely depend on snow and ice melt [1]. These snow and ice masses are in the region that is likely to be affected by climate change, but to what extent is yet to be determined [2]. The connection between climate change, snow/glacier melt, and associated hazards is well-established and substantiated by robust scientific evidence [3]. Recent studies highlighted the negative net mass balance in High Mountain Asia with an acceleration in recent decades [4]. However, some regional anomalies do exist such as the Karakoram and Pamir regions; therefore, there is a need for more localized studies to improve our understanding of ongoing glacier dynamics and melt characteristics [5]. Several studies have shown that the changes in the glacier mass budget are expected to have a significant impact on the water availability and the increasing number of cryosphere-associated hazards in the region [6,7,8,9]. Glacial Lake Outburst Floods (GLOFs) are the most reported hazards in recent years in the region and possess a high potential for devastating impacts and can inflict substantial damage, leading to extensive loss [10,11].
Despite the scarcity of in-situ measurements of glacier mass balance in the Karakoram region, remote sensing datasets and numerical models have been reliable sources to develop a better understanding of spatial and temporal variations [4,12]. Remotely sensed glacier elevation change refers to the extent of glacier mass balance, which is influenced by the interplay of energy and mass exchanges between the glacier surface and the atmosphere [13,14,15]. These exchanges are influenced by climatic factors and glacier surface properties [16]. The critical factors influencing glacier response to climate change also include the distribution of supraglacial debris thickness. The elevation-based distribution of supra-glacial debris plays a crucial role in determining the rate of glacier melt [17].
The glacier in Central Karakoram displays a situation of general stability, known as the ‘Karakoram Anomaly’, meanwhile a negative net mass balance was reported for the glacier in the HKH region between 2000 and 2016 [14]. A recent study based on laser altimetry and gravimetry estimated a mass balance of (−0.1 ± 0.1 m w.e. a−1) for the period of 2003 to 2019 in the Karakoram region [18], and Fan, et al. [19] estimated a balance from 2000 to 2021. Recent research indicates that anomalous glacier mass balance has likely extended to the adjacent West Kunlun Mountains and Pamir region [20,21]. The specific mass balance measured on HKH glaciers over 2003–2008 was less negative than the global average for glaciers and ice caps outside Greenland and Antarctica of around −0.75 m a−1 [2]. Because of the wide range of contrasting climatic conditions from east to west of the Himalayan range, variability in glacier response within the region is large [2]. Azam, et al. [22] estimated balance mass budgets (0.00 to 0.11 m w.e. a−1) for the Karakoram glaciers since the 1970s, and a more sensitive glacier response to changes in temperature compared to precipitation unlike the central and eastern Himalayas was also reported [23,24]. However, recent studies suggest that regional glacier changes are significantly affected by variations in precipitation [25]. The amount of precipitation in the glacial region required to sustain the existing glacier mass must be greater than the precipitation recorded at valley-based stations and from satellite-derived products [25,26]. Increases in winter temperature and decreasing summer temperature with an increasing number of wet days have been acknowledged [23,27,28]. A slight positive surface mass balance (0.12 ± 0.14 m w.e. a−1) was estimated for Central Karakoram, and eastern Karakoram glaciers displayed a slight negative value (−0.24 ± 0.12 m w.e. a−1) [20]. The surface mass balances of the surge- and non-surge-type glaciers were not statistically different [20]. Zhou, et al. [29] estimated a slight negative mean annual surface mass balance (−0.11 m w.e. a−1) for the entire Karakoram region from 1973 to 2000.
Glacier velocity plays significant role in glacier dynamics by regulating the glacier mass, and climate change can influence the variation in glacier velocity [30]. Understanding the variability of the glacial velocity is viable in comprehending the response of glaciers to climate change and provides information on the probable effects on the glacial hazards as a number of glaciers in the region are known to surge and produce GLOFs [31,32,33]. The once stable and slow-moving glaciers have now become unstable, leading to a series of glacial hazards such as glacial lake outbursts, glacier surges, glacial collapses, and glacial debris flows [34]. Glacier velocity helps in estimating the potential damages associated with glacial movements [35].
The accelerated glacier mass loss in recent decades is expected to reduce the glacier cover in the region. Manual delineation of glacier boundaries in remotely sensed images has been regarded as a precise approach for mapping glacier area change over time [36]. Landsat images from various periods, especially during the melting season, can be utilized to delineate glacier areas. It is essential to select images with minimal snow cover and cloud cover for accurate mapping [37]. Our understanding of the coverage and characteristics of High Mountain Asia remains limited. To calculate glacial length, flow velocities, and area change accurately, precise outlines of glacier extent are necessary [38].
The status of glaciers is primarily influenced by the precipitation and temperature profiles. Additionally, factors such as topographic shading and debris cover play dominant roles in determining glacier mass change [39]. Approximately 10% of the total glacier area in High Mountain Asia is covered by a debris layer. In certain regions like Karakoram and the Himalayas, the ablation zone has extended to around 40% [40]. The Karakoram and Himalayan glaciers, situated in high-altitude regions, are mainly of the valley type, with many covered in debris. The challenging terrain and harsh weather conditions have posed limitations on field-based studies. However, these gaps are being addressed through the use of remote sensing-based satellite data, which allow for studying the glacier parameters effectively [41]. Debris-free glaciers exhibit greater sensitivity to both topographic and atmospheric factors compared to glaciers covered in debris. The application of the Normalized Difference Snow Index (NDSI) on Landsat images facilitated the manual mapping of a debris-covered glacier area [36].
In this study, we analyzed glacier change in the Astak catchment located in the southern Karakoram region, Upper Indus Basin, Gilgit-Baltistan. We investigated glacier mass balance using the Advanced Spaceborne Thermal Emission and Reflection Radiometer (ASTER) Digital Elevation Model (DEM) from 2000 to 2020. Elevation change was estimated using the geodetic method. The glacier area change was estimated using Landsat images from 2000 to 2020, and we also analyzed the change in debris cover and clean ice area changes. Landsat image selection was done carefully, ensuring minimal cloud cover and snow cover when selecting images from the ablation season. Mean temperature, precipitation, and climate anomalies were estimated using ERA5 Land climate data. The velocity of the glacier was estimated using a feature-tracking technique (in Co-registration of Optically Sensed Images and Correlation software) using Landsat images from 2000 to 2020.

2. Study Area

The Astak catchment (35.65°N, 74.90°E to 35.85°N, 75.15°E) is geographically located in the southern Karakoram region, Upper Indus Basin, Pakistan (Figure 1). The geographical location of the Astak catchment within the High Mountain Asia subregion is highlighted in Figure S8. The catchment covers an area of 531.97 km2, with glaciers occupying 163.75 km2 of the basin. The elevation range of glaciers within the catchment varies from 2800 to 7397 m above sea level (m a.s.l.). The catchment is covered by both clean ice and debris-covered glaciers. The largest glacier in the catchment is Kutiah Lungma Glacier, with an area of 51 km2 and measuring 18.5 km in length. In addition to the main glacier, Kutiah Lungma, there are several other smaller glaciers present in the catchment. Goropah Glacier measures 8.7 km in length, and Tuklah Glacier spans 4.8 km in length. The catchment area under discussion has received relatively little attention, although earlier research has documented both the Kutiah Lungma Glacier surge and the subsequent outburst of an ice dam lake in 1953; minor damages to the nearby villages were reported resulting from these events [42,43]. In 1953, Kutiah Lungma Glacier surged 12 km within a span of two months (March to early May), advancing at a rate of 113 m per day [42]. The debris flow event in the Tuklah village in August 1999 damaged the road, water channels, potable water supply, and houses in lower Tuklah (Gamba Tuklah). In 2020, the debris flow in the Rejing village damaged agricultural land. In 2023, the debris flowed towards infrastructure and the residential area, causing severe damage to the infrastructure and the agricultural land. In addition, the debris flow in the Goropah village also damaged the agricultural land and roads.

3. Materials and Methods

3.1. Climate Data and Analysis

Monthly mean temperature and precipitation as well as temperature and precipitation anomalies for the Astak catchment over the period of 2000 to 2020 were extracted from the fifth-generation European Centre for Medium-Range Weather Forecasts (ECMWF) global climate and weather reanalysis v5 (ERA5) data. ERA5 Land climate data is a comprehensive global reanalysis gridded dataset derived from the fifth generation of the European Centre for Medium-Range Weather Forecasts (ECMWF) with a temporal uncertainty of 3 h and 60 km horizontal resolution [44]. The ERA5 Land reanalysis dataset is obtained by combining physics-based model data with observations from around the world [45]. The uncertainties are lower for recent periods than earlier periods, with an increase in the number of in-situ observation stations and enhanced computational capacity in recent decades. This combination of data sources ensures the ERA5 Land dataset is complete and consistent, allowing the analysis of temperature and precipitation variations. The reanalysis process involved a comprehensive integration of model data and observations worldwide, resulting in a consistent dataset. From this dataset, we extracted temperature and precipitation data for the Astak catchment from the period spanning 1990 to 2020. We used air temperature at 2 m above the land surface (in degrees Celsius (°C)) and total precipitation (mm) for the same period (1990 to 2020). The precipitation data include the accumulated amount of liquid and frozen water, such as rain and snow that falls on the Earth’s surface, while excluding phenomena like fog, dew, or moisture that evaporates before reaching the Earth’s surface.

3.2. Mapping Glacier Area Change

For the estimation of glacier area change, we selected optical satellite images with 30 m spatial resolution from Landsat 4, 5, 7, and 8 for the period of 2000 to 2020 with a temporal resolution of 5 years. Each image was carefully selected to ensure minimal cloud and snow cover during the ablation season. Based on the climate setting of the study area, minimum snow cover is expected to be low during the summer season [46]. We estimated the glacier area change by supervised classification of Landsat images using opensource software, QGIS 3.4.1., followed by post manual digitization of glacier boundaries in the corresponding Landsat image. Post manual delineation of remotely sensed images is regarded as the precise technique for mapping glaciers [36]. Debris cover and clean ice change for the study period were also delineated and analyzed. The supervised classification with the Maximum Likelihood Classifier (MLC) was employed with a suitable number of observed training points to classify debris cover and clean ice. We selected training points from various locations on the glacier, including both clean glacier areas and debris-covered regions, to capture the maximum spectral variation in both classes. To remove the misclassified land features, they were manually excluded during the post manual digitization of the supervised classification results. The method employed in this study has been widely adopted in previous study [47,48]. Details of satellite images used for the estimation of glacier area change are provided in Table S1.

3.3. Estimation of Glacier Surface Elevation Change (SEC)

The geodetic technique, widely employed in prior research, was utilized to estimate the surface elevation change of each glacier [29,49,50]. We adopted the void-free SRTM DEM as our reference dataset. To complement this, ASTER DEMs with a spatial resolution of 30 m were employed. Details of the ASTER DEMs used to estimate glacier elevation change in this study are provided in Table S2. These ASTER DEMs were co-registered with the reference SRTM DEM, using the method developed by [51,52]. The outliers in SEC were identified by a robust regression method [53]. Due to the absence of ground control points for DEM generation, we calculated the Surface Elevation Change (SEC) relative to the reference DEM. After acquiring remote sensing images, we delineated the boundaries of both clean and debris-covered glaciers. These glacier boundaries were then applied to the Digital Elevation Models (DEMs) with a buffer of 150 m, allowing us to estimate the Surface Elevation Change (SEC) of the glaciers. We applied penetration depth corrections for clean ice and subsequently computed the Surface Elevation Change (SEC) separately for the clean and debris-covered parts of the glaciers. Estimating snow and ice penetration depths is challenging due to density variations. To address this issue, we applied the penetration depth correction method introduced by [51] for the Himalayas and upper Indus basin. This correction accounts for density variations and yields a value of 3.4 m for the C-band in SRTM DEM, which is elevation-dependent. By analyzing the temporal and spatial variations of the Surface Elevation Change (SEC), we aimed to identify any potential influence of glacier SEC on glacial hazards. We used a mean glacier density value of 850 kg/m3 [54]. This value is commonly employed in glacier mass balance studies in the region [18].

3.4. Estimation of Glacier Velocity

Monitoring mountain glacier velocity serves as a valuable approach to detecting environmental changes and understanding the dynamics of glaciers [55]. In order to assess potential changes in glacier surface velocity between 2000 and 2020, we calculated annual glacier velocities by using feature-tracking techniques on optical satellite images. Details of the Landsat images used for the estimation of glacier surface velocity are given in Table S3. We utilized optical satellite images with a resolution of 30 m. Image-to-image correlation was employed to derive surface velocities, and the processing was performed using Co-registration of Optically Sensed Images and Correlation software, a widely-used tool in glacier surface velocity estimation in previous studies [56].
The correlation involves a two-step procedure: initially operating at a multipixel level, it utilizes the correlation matrix of the images to ascertain the shift between them. Subsequently, the second step functions at a subpixel scale, employing phase correlation to estimate the slope difference based on the Fourier shift theorem. Through the implementation of surface feature tracking, the displacement of the surface feature was computed, co-registered, and correlated. According to [57], the estimated glacier displacement accuracy using the adopted feature-tracking method is reported to be approximately a quarter of a pixel. To estimate velocities, we utilized high-resolution orthorectified Landsat images with minimal cloud and snow cover, ensuring a temporal resolution of ≤1 year.
For optimizing the accuracy of estimated velocities, we employed initial and final statistical correlation windows of 64 × 64 pixels, employing a frequency correlation engine along with X and Y step values of 2 for Landsat MSS and Landsat 5 images with a spatial resolution of 30 m. In the case of Landsat 7 and 8 images, correlation windows of 64 × 64 pixels and 32 × 32 pixels were used, and a mask threshold of 0.9 was applied for noise reduction. The surface velocity was calculated based on the resulting north–south and east–west displacements. To eliminate noise and anomalies from the resultant velocities, a nonlinear mean filter was utilized.

4. Results

4.1. Glacier Area Changes

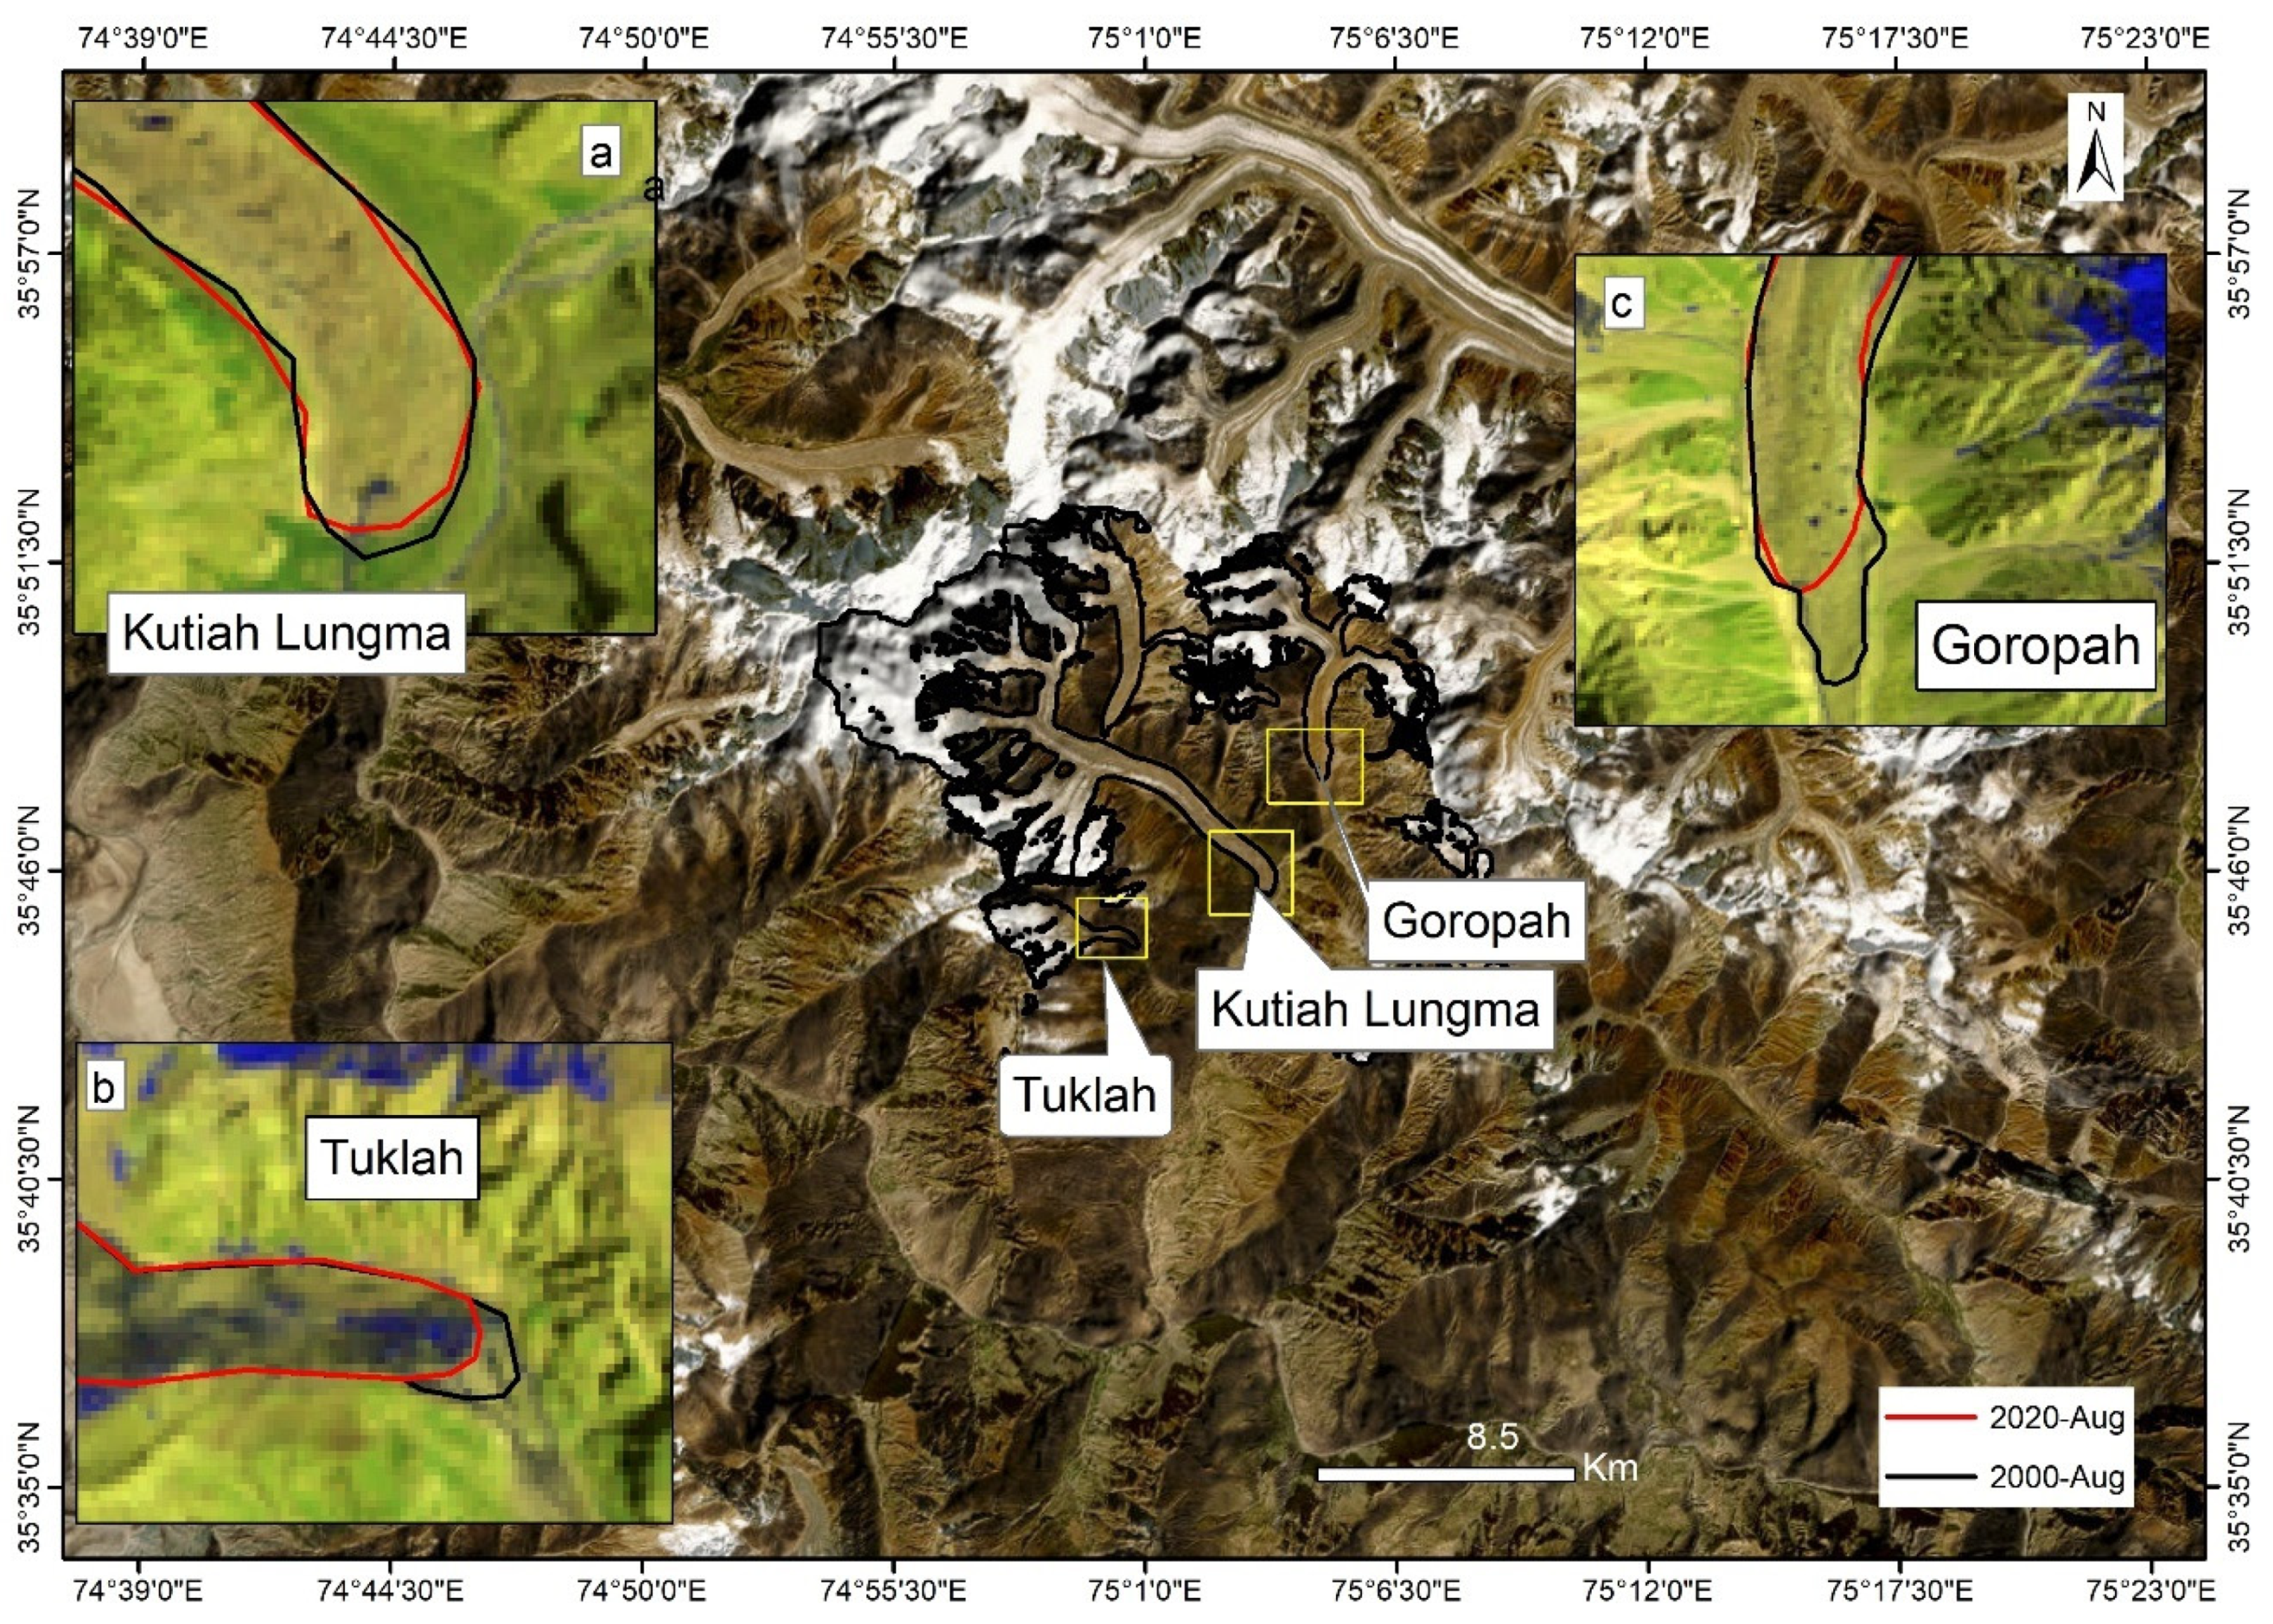
The glacier area in the Astak catchment has slightly reduced and can be observed in Figure 2 and Figure 3, and most of the changes are observed towards the terminus of all glaciers. The total changes in the glacier area of the catchment are estimated to be approximately −1.08 km2 from 2000 to 2020. During this period, the terminus boundary of Kutiah Lungma Glacier remains unchanged, while the terminus areas of Goropah and Tuklah Glaciers have slightly decreased. Kutiah Lungma Glacier has undergone an area change of −0.5 km2. Similarly, Goropah Glacier has experienced an area change of −0.32 km2 during the same period. Tuklah Glacier area has reduced by −0.24 km2, also presented in Figure 2.
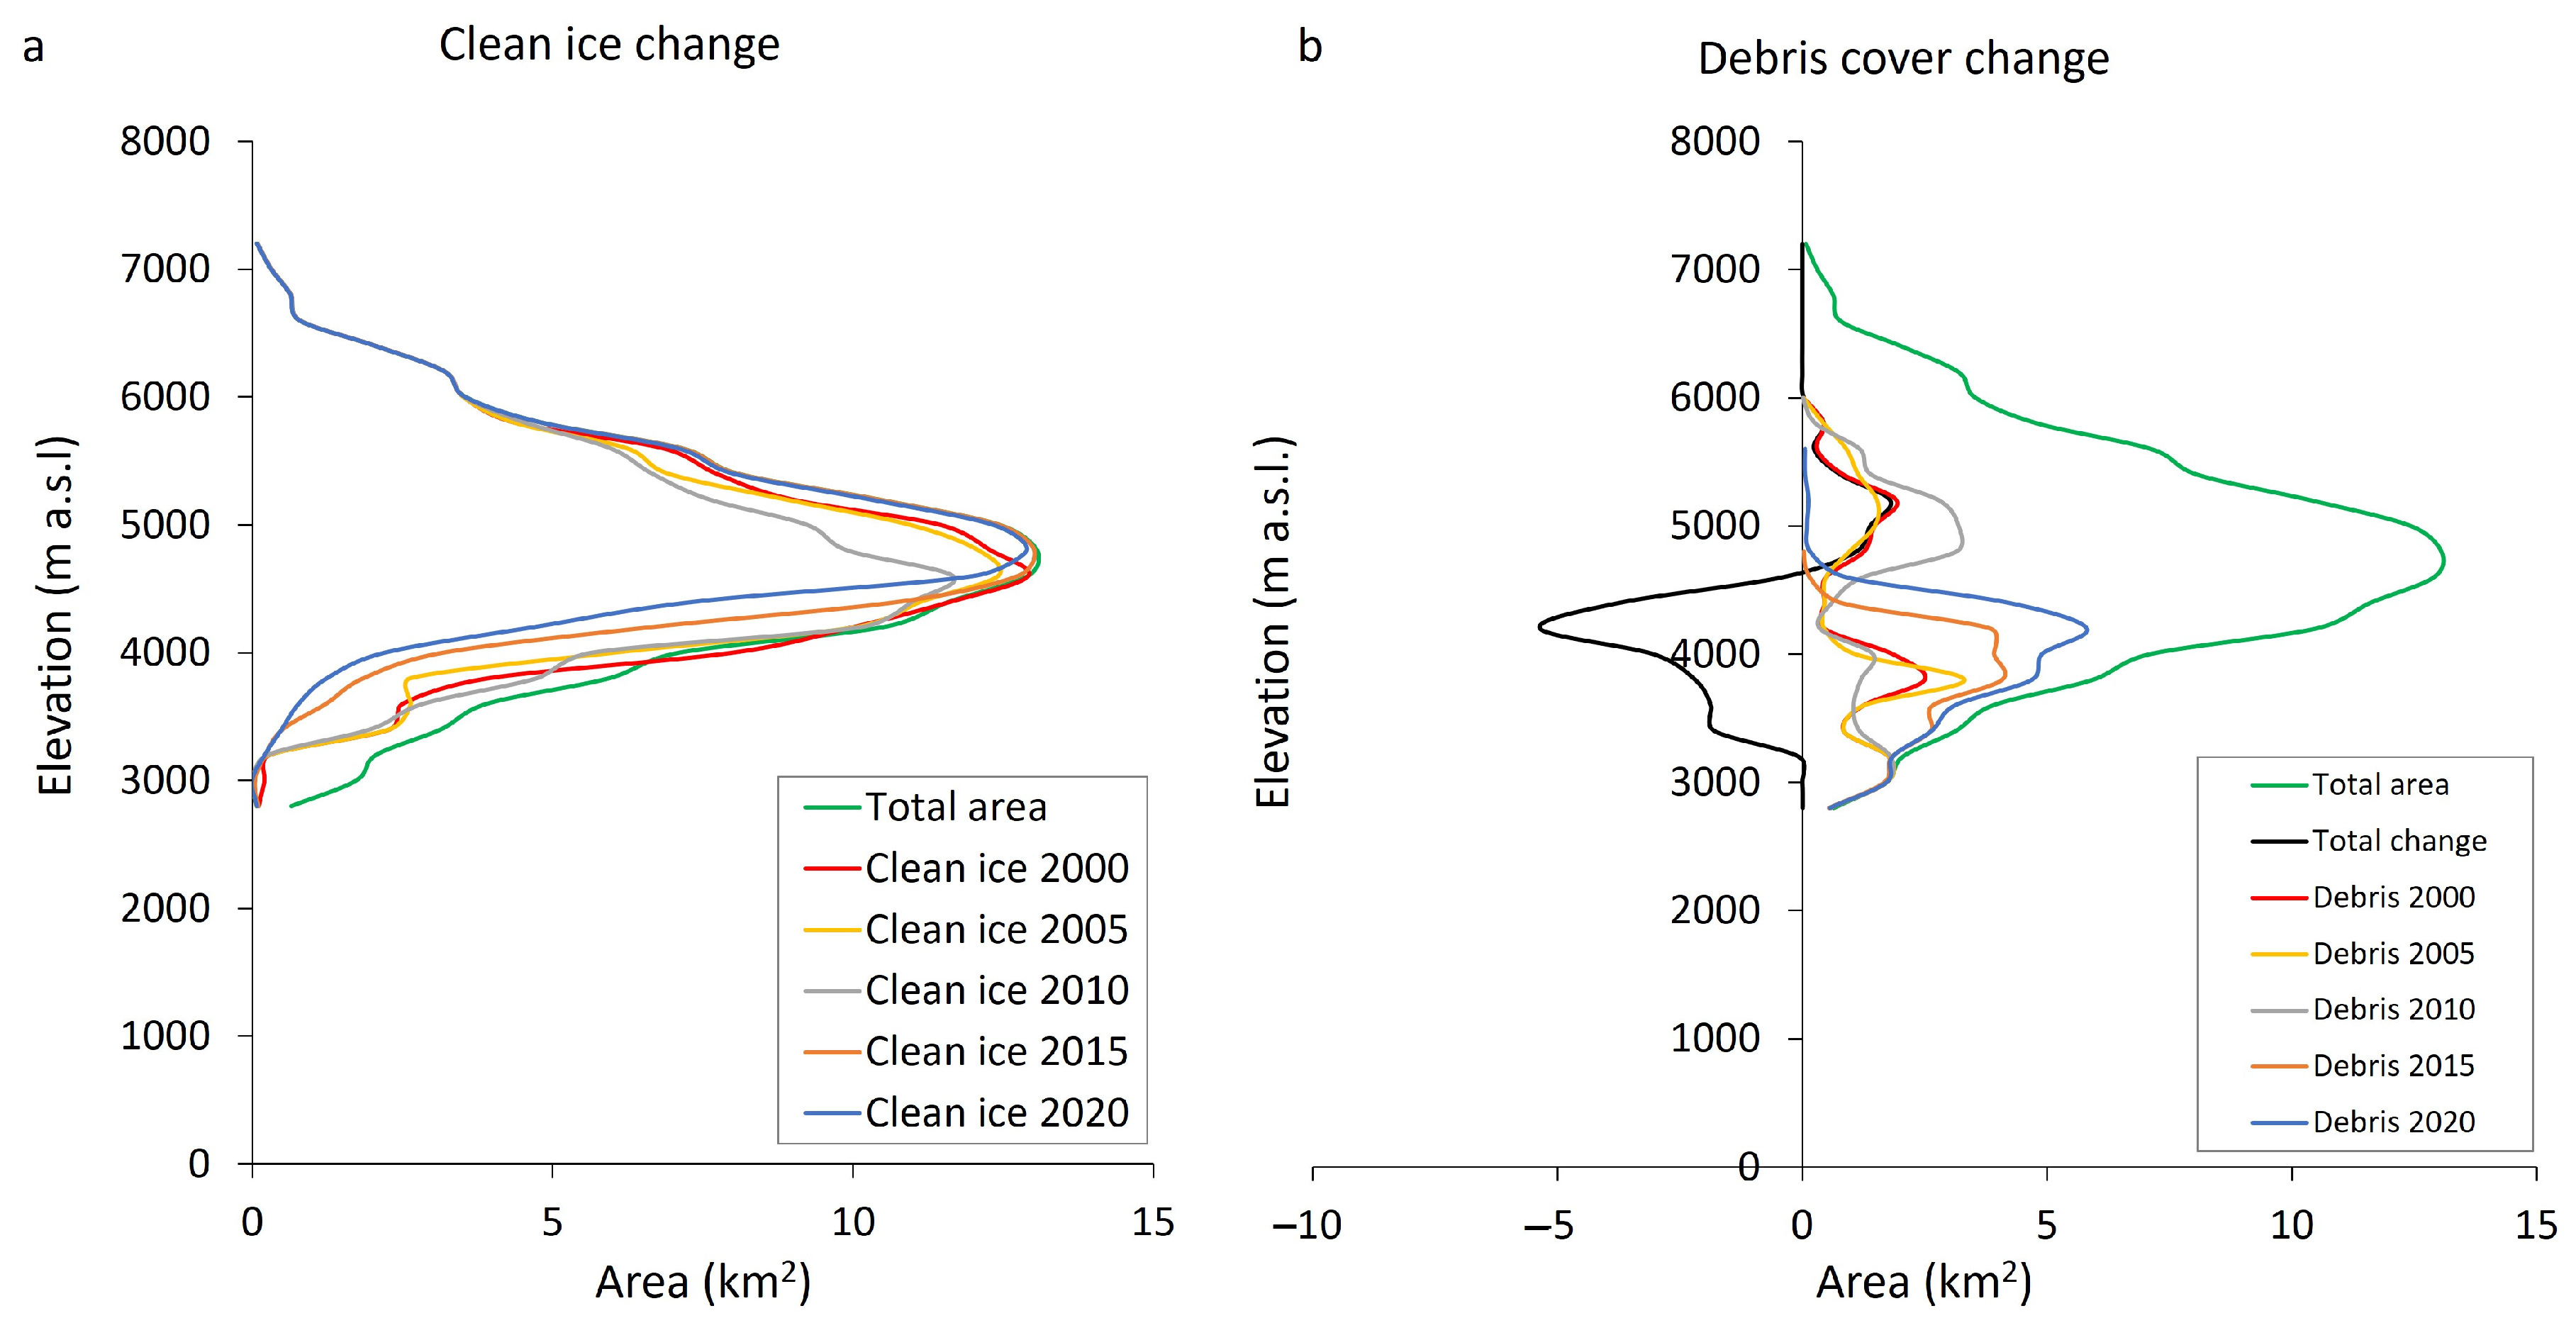
The proportion of debris-covered ice to clean glacier ice has experienced variations over the study period. In the year 2000, this proportion was 35 km2 of debris-covered ice to 70 km2 of clean glacier ice. All of the glaciers in the catchment are debris covered towards the lower terminus; the debris-covered part of the glaciers extends up to the elevation of 5800 m a.s.l., with heavy cover towards the terminus. The debris-covered and clean glacier ice proportion during 2020 compared to 2000 increased by 2.4 km2. This increase in the debris-covered part of glacier ice can be attributed to the change in surface characteristics caused either by the melting of snow and ice or the enhanced accumulation of sediments derived from avalanches, rockfall, and landslides. Temporal variations in glacier area change for the catchment are shown in Figure S7.

4.2. Glacier Mass Balance in the Catchment

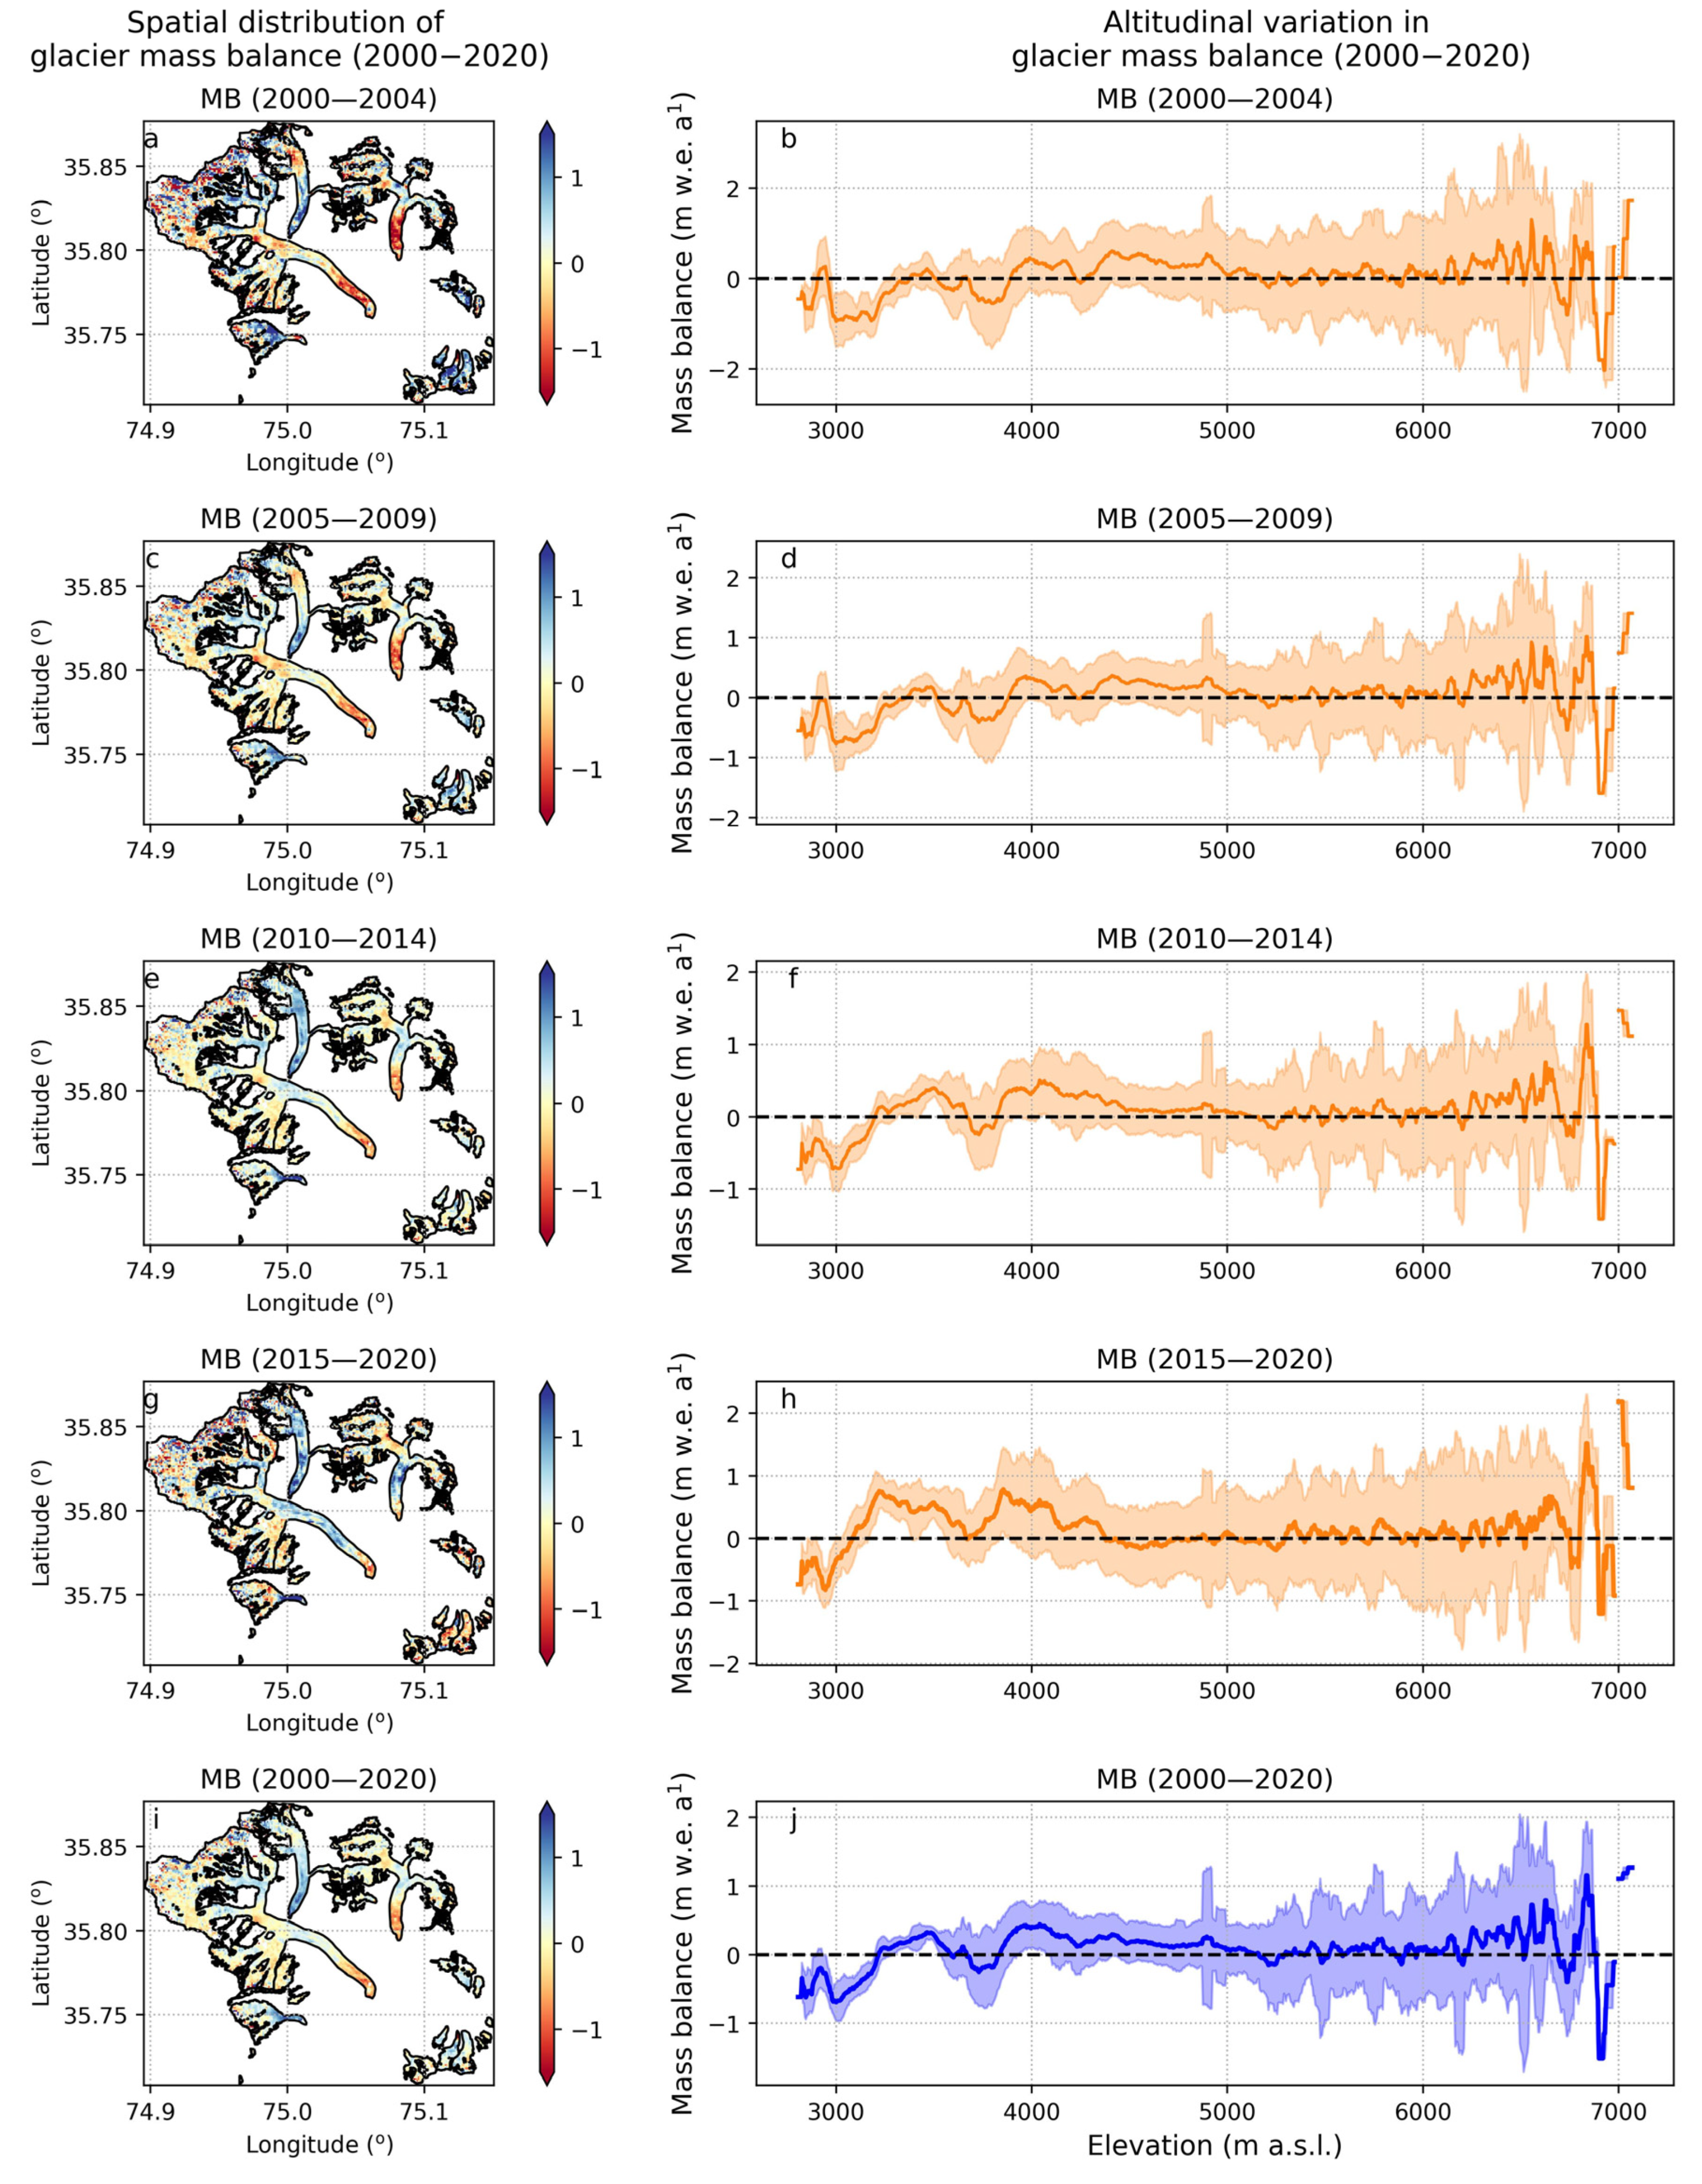
Glaciers in the Astak catchment are experiencing negative mass balance. We estimated a negative mass balance of −0.02 ± 0.1 m w.e. a−1 with a mean surface elevation change of −0.02 ± 0.1 m a−1 from the year 2000 to 2020. Glacier elevation change for the entire catchment is shown in the Figure 4 and Figure 5 along with the altitudinal variations in glacier mass balance. Specifically, between 2810 and 3220 m a.s.l., the glaciers experience the most negative mass balance of −0.1 ± 0.05 m w.e. a−1. In the lower elevations between 3675 and 3830 m a.s.l., we estimated a negative mass balance of −0.03 ± 0.10 m w.e. a−1, which can be attributed to the higher temperatures at lower elevations. Altitudinally, glaciers in the catchment show varying glacier mass balances depending on the range of elevation and surface characteristics. As 53% of the catchment area is located above 4500 m a.s.l., which hosts 72% of the glacier area and the glacier area debris covers up to ~5500 m a.s.l., a glacier between 3835 to 5105 m a.s.l. exhibits a slightly positive mass balance of 0.04 ± 0.08 m w.e. a−1. This slightly positive mass balance in this elevation bin is consistent throughout the study period from 2000 to 2020 (Figure 4i,j). In the narrow elevation band of 5110 to 5330 m a.s.l., the glaciers experience a slight loss in mass, with a value of −0.005 ± 0.12 m w.e. a−1. Above the elevation of 5500 m a.s.l., glaciers in the catchment show a consistent positive mass balance of 0.036 ± 0.16 m w.e. a−1. The positive mass gain is prominent above 6000 m a.s.l., i.e., 0.2162 ± 0.0243 m w.e. a−1. Based on the obtained results throughout the study period, the equilibrium line for altitude remains relatively stable, ranging between 5000 and 5300 m a.s.l.
Temporally, glaciers in the catchment do not show any significant variations; however, smaller glaciers show more negative mass balance compared to the large glaciers. The largest glacier in the catchment, Kutiah Lungma Glacier, exhibits a slightly negative mass balance of −0.01 ± 0.07 m w.e. a−1, corresponding to a surface elevation change of −0.015 ± 0.08 m a−1 during the period from 2000 to 2010. In the subsequent time frame of 2010 to 2020, the glacier mass balance is more notably negative compared to the earlier period from 2000 to 2009, measuring −0.012 ± 0.056 m w.e. a−1 and −0.015 ± 0.07 m w.e. a−1, respectively. The equilibrium line altitude for the years 2000 to 2010 was recorded at 5000 to 5300 m a.s.l., while for the period 2010 to 2020, it was approximately 3166 to 3168 m a.s.l. as shown in Figure S2.
Conversely, Goropah Glacier experienced slightly more negative mass balance compared to the Kutiah Lungma Glacier surface elevation changes, i.e., −0.013 ± 0.06 m w.e. a−1 and −0.015 ± 0.07 m a−1, respectively, between 2000 and 2010. In the subsequent period from 2010 to 2020, the glacier mass balance decreased slightly, −0.01 ± 0.04 m w.e. a−1. The equilibrium line altitude for Goropah Glacier between 2000 to 2010 was situated between 5000 and 5200 m a.s.l., and for the period 2010 to 2020, it moved up to 5400 m a.s.l. as shown in Figure S3.
Tuklah Glacier demonstrated a negative mass balance of −0.03 ± 0.05 m w.e. a−1 with surface elevation change between −1.04 ± 0.5 m a−1 and 2.0 m a−1 from 2000 to 2010. Over the subsequent period of 2010 to 2020, the glacier mass balance became slightly more negative, measuring −0.1 ± 0.04 m w.e. a−1, which corresponds to the surface elevation change of −0.08 ± 0.04 m a−1. The equilibrium line altitude (ELA) during 2000 to 2010 was recorded at 4200 to 4500 m a.s.l., whereas for the period 2010 to 2020, ELA fluctuated between 4300 to 4500 m a.s.l., as shown in Figure S4.

4.3. Glacier Velocity

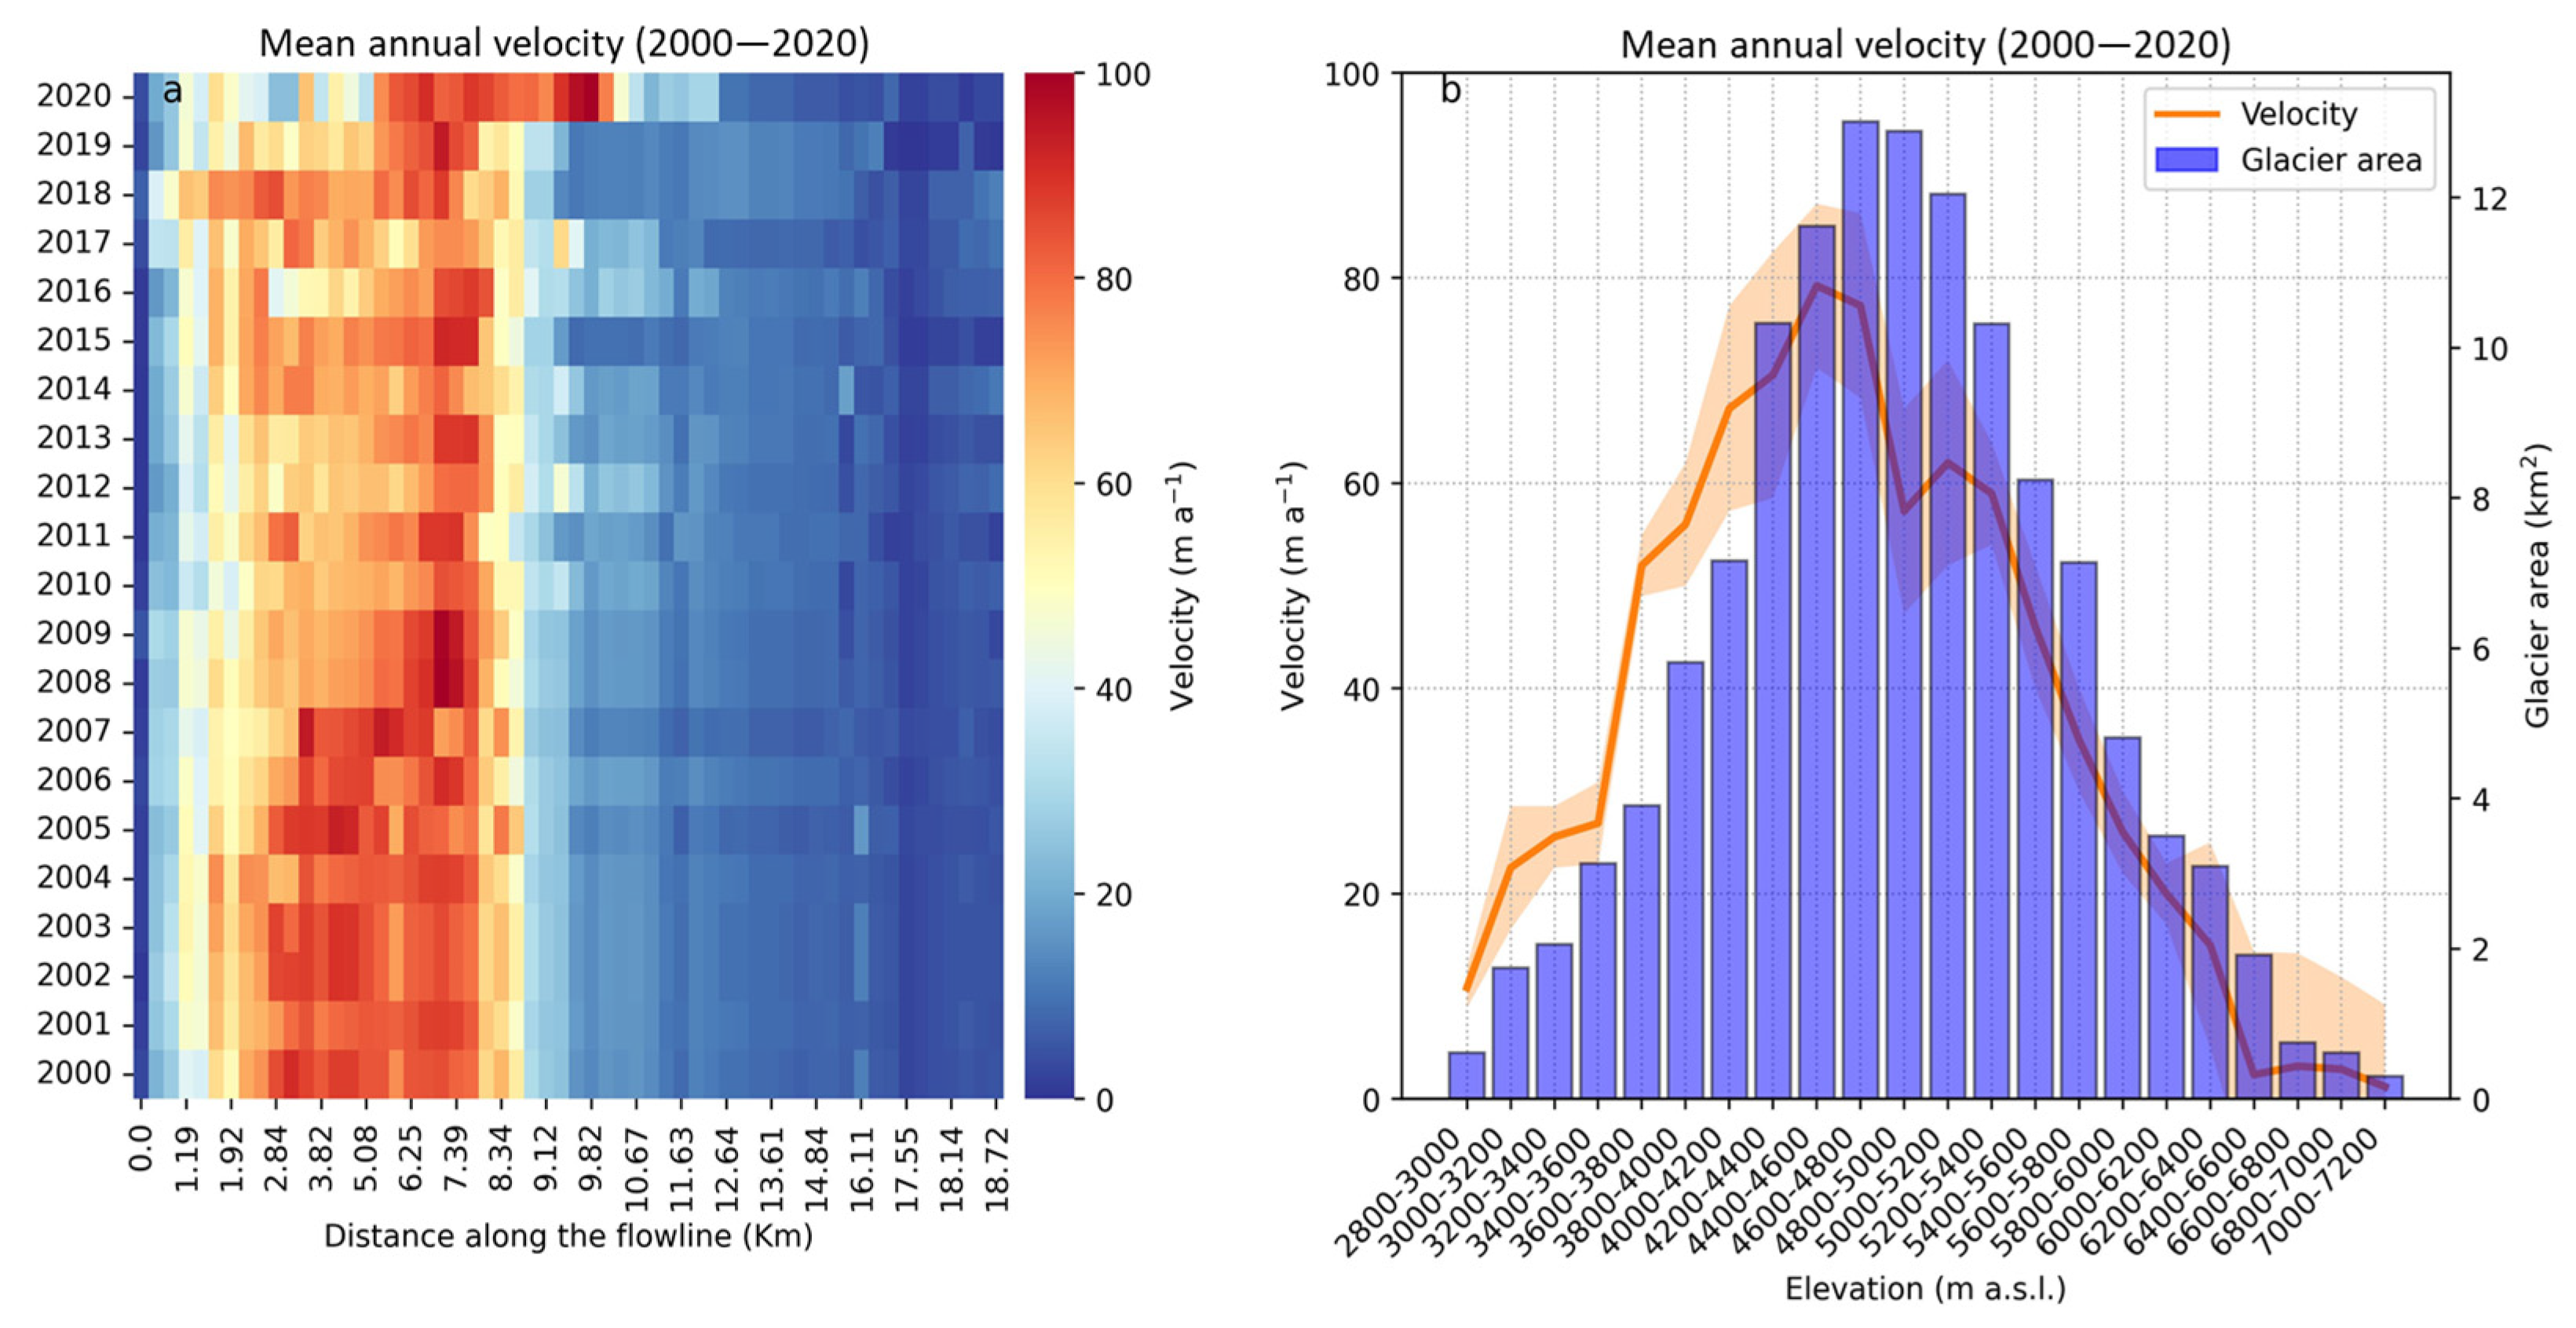
The mean annual velocity of glaciers in the catchment range is between 74 m a−1 for Kutiah Lungma Glacier and 12 m a−1 for Tuklah glacier. Kutiah Lungma Glacier, with a total length of 19 km, shows the maximum velocity between 2 and 8 km from the glacier terminus. The mean annual velocity of Kutiah Lungma Glacier fluctuated between 45 and 80 m a−1 (Figure 6a,b). Progressing further upstream, between 9.82 and 18.72 km, the mean annual velocity ranges from 5 to 20 m a−1. The highest mean velocity is observed for the period of 2000 to 2008, reaching approximately 37 m a−1. The elevation zone between 4000 to 5600 m a.s.l. hosts most of the glacier area, and the mean annual velocity of the glaciers is higher (55 to 80 m a−1) in this elevation bin as shown in Figure 6b. The velocity of Kutiah Lungma-B Glacier adjacent to Kutiah Lungma Glacier, spanning a total length of about 8 km, varies across the glacier upstream. Within 0 to 0.37 km from the terminus, the velocity ranges from 3 to 8 m a−1. Notably, the highest velocity is observed up to 5 km from the glacier terminus, ranging from 32 to 50 m a−1. Ascending to higher altitudes at 5 to 7 km from the terminus, the velocity falls within the range of 2 to 25 m a−1.
The maximum annual velocity of the glacier during the years 2000 to 2012 falls within the range of 16 to 20 m a−1. In the subsequent years from 2000 to 2020, the mean velocity ranges from 5 to 14 m a−1 (Figure S7). Variations in the mean annual velocity of Goropah Glacier, with a total length of 7.9 km, are observed at range of 0 to 1.9 km from the terminus, and the velocity fluctuates between 1.4 and 18 m a−1. Remarkably, the glacier attains its maximum velocity within a distance of 2.2 to 5.4 km from the glacier terminus (Figure S6), with a range of 20 to 50 m a−1. Between the distances of 5.4 to 7.6, the glacier velocity ranges from 2 to 10 m a−1. The highest average velocity is documented during the years 2000 to 2008, falling within the range of 20 to 25 m a−1. Throughout the remaining years within the 2000 to 2020 period, the mean velocity fluctuates between 4 and 17 m a−1 (Figure S6). Tuklah Glacier, with a length of 6 km, exhibits varying surface velocities with a range of 2 to 15 m a−1. The highest surface velocity is observed between 1.7 and 3.3 km from the glacier terminus, ranging from 10 to 18 m a−1. In the upper part of the glacier between 3.7 and 4.5 km from the terminus, the velocity varies from 1.2 to 10 m a−1. The peak mean annual velocity of the glacier is observed during the years 2000 to 2009, within the range of 5 to 10 m a−1, compared to the mean annual surface velocity of 2 to 8 m a−1 during 2000 to 2020. The variation in the Tuklah Glacier’s velocity is shown in Figure S7.

4.4. Climate Change Anomalies

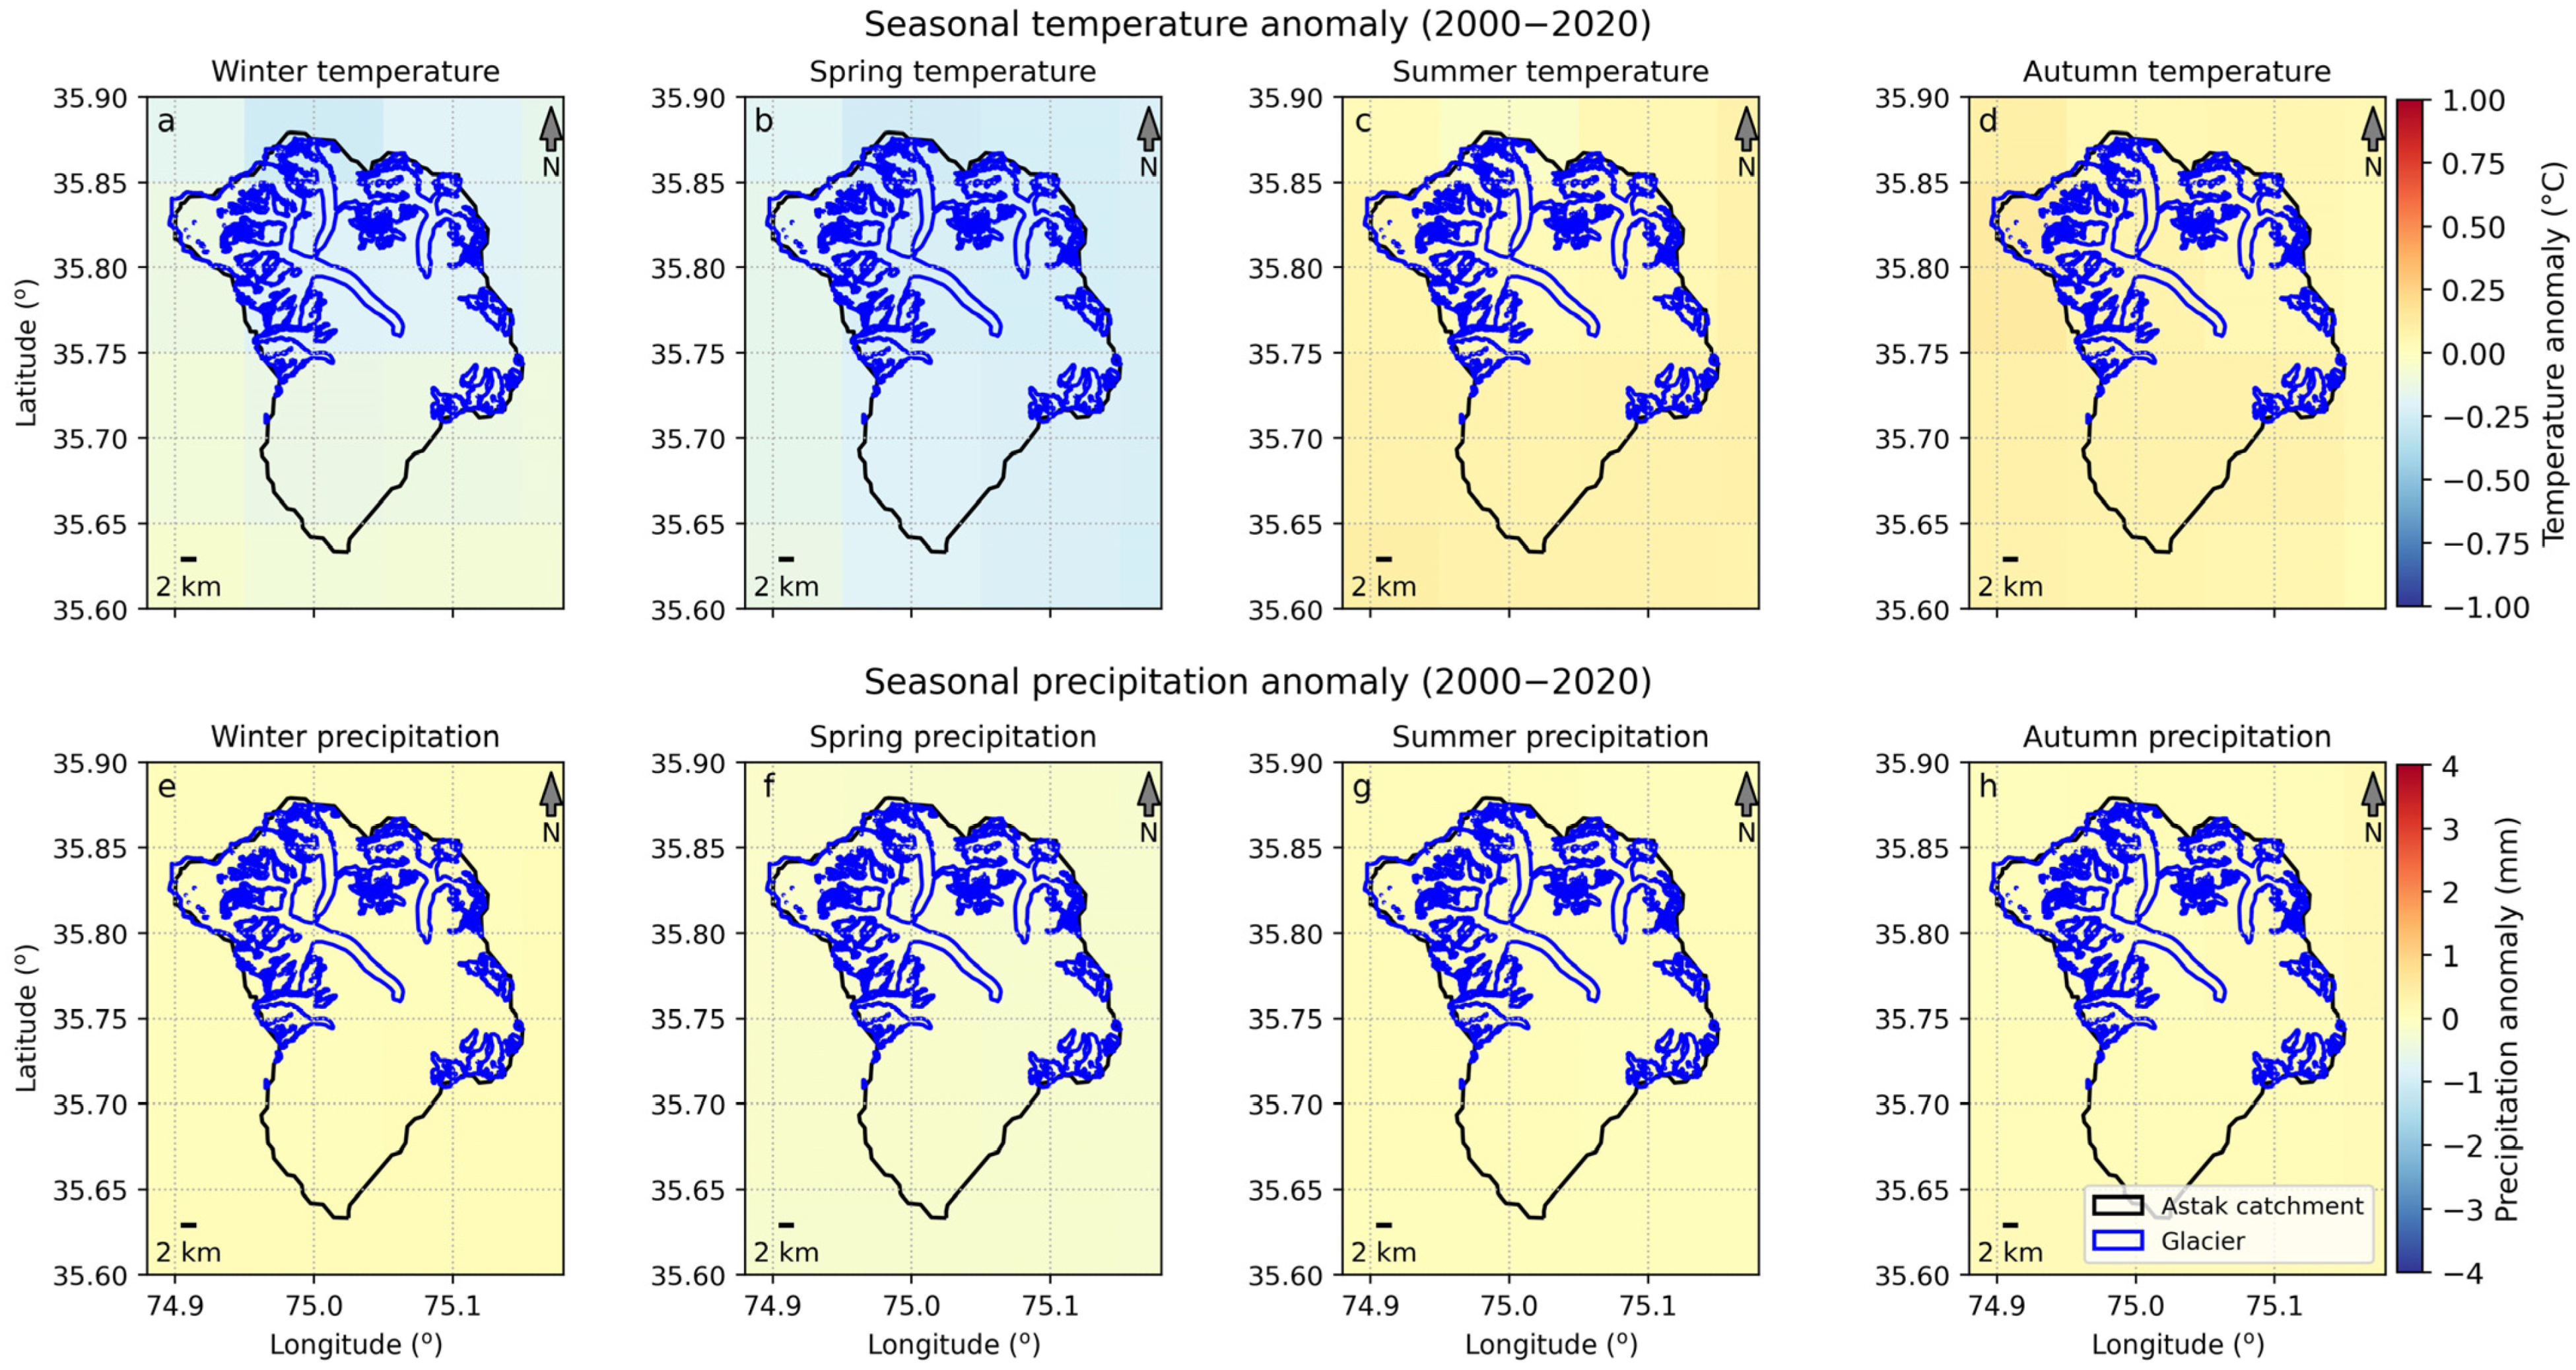
The estimated mean annual temperature for the catchment from 2000 to 2022 remained at 11.7 °C, and the mean annual temperature over the glacier area was estimated to be about −5.8 °C. The highest mean annual temperature was observed during 2009, reaching approximately 12.3 °C in the catchment, while the lowest in 2003 and 2011 was at around 10.5 °C. From 2000 to 2022, the mean annual temperature remained between 10 °C and 12 °C for the catchment. From 2000 to 2009, the temperature remained at 11.58 °C in the catchment and over the glacier area, about −5.61 °C. During 2015 to 2020, we observed an increasing mean annual temperature in the catchment (11.71 °C) and also over the glaciated regions of the catchment (−5.03 °C). Based on the reanalysis climate data from ERA5 Land, we estimated a mean annual temperature anomaly of +0.2 °C to −0.08 °C and precipitation anomaly of −0.8 mm to +0.3 mm in the catchment from 2000 to 2020 compared to the baseline period of 1990 to 2000 (Figure 7). The seasonal temperature anomalies in the catchment show a warming trend during summer and autumn months but a slightly decreasing trend during spring and winter months. During the winter and spring months, we estimated temperature anomalies between 0 °C and 0.25 °C, whereas for summer and autumn, the temperature anomaly was estimated up to 0.50 °C. The precipitation anomalies in the catchment rival the declining precipitation during winter and spring months. The decreasing precipitation during the spring months is more prominent compared to that during winter months (Figure 7e,f).
Across the span of 2000 to 2020, a precipitation anomaly in the catchment is very low, also shown in Figure 7e–h. Based on seasonal precipitation anomalies from 2000 to 2020 compared to the baseline period, the catchment experiences slightly higher precipitation during winter and autumn seasons with slightly higher during the autumn season. Precipitation is in a decline during the spring season, but the changes are not statistically significant.

5. Discussion

Ongoing changes in climatic conditions are expected to have severe consequences on the snow and ice melt characteristics, which ultimately affect the seasonal water availability and the effects of cryospheric hazards in the Hindu Kush Himalaya region [58]. Snow and ice masses in the high mountains of northern Pakistan contribute significantly to streamflow [59,60]. The agriculture-oriented economy associated with the tributaries of the upper Indus Basin irrigation system largely depends on the upstream snow and ice reserves for water availability [1].
Meanwhile, a negative net mass balance has been reported for the High Mountain Asia glaciers between 2000 and 2016 [14]. Some regional anomalies exist, and future cryospheric change is still unknown and needs more localized studies to evaluate glacier dynamics and melt characteristics [2,26]. In the current study, we estimated that the glacier in the Astak catchment are experiencing negative mass balance, which in turn leads to reduced snow and ice reserves. The estimated mass balance of −0.02 ± 0.1 m w.e. a−1 is less negative compared to the regional mass loss in extended High Mountain Asia. Our estimated less negative mass balance for the Astak catchment is consistent with the previous studies in the region. Because of the wide range of contrasting climatic conditions from east to west of the Himalayan range, variability in glacier mass balance within the region is large. Based on the climate data analysis in the current study, the seasonal increasing temperature and expansion of higher temperatures to higher elevations reported in previous studies [61] can be attributed to the negative glacier mass balance in the study area. Changes in the temperature induced by climate change could have significant impacts on the glacier mass balance in the region due to the glacier response in the study area, located in the Karakoram region, which is more sensitive to changes in temperature compared to precipitation, unlike the Central and eastern Himalayas, which was also reported in [23,24]. Increases in winter temperature and decreasing summer temperatures with increasing numbers of wet days have been acknowledged [23,28]. Less negative surface mass balance is estimated for the Central Karakoram and eastern Karakoram glaciers during the first decade of the 21st century (−0.24 ± 0.12 m w.e. a−1) [20]. However, the surface mass balances of the surge- and non-surge-type glaciers were not reported to be statistically different [20]. Zhou, Li and Li [29] estimated a slight negative mean annual surface mass balance (−0.11 m w.e. a−1) for the entire Karakoram region from 1973 to 2000.
Our analysis of glacier mass balance is in agreement with the previous estimates supporting the hypothetical anomalous mass balance behavior, the so-called ‘Karakoram Anomaly’ of positive glacier mass balances [5]. However, we found a slightly reduced glacier area in the catchment that is more visible in the lower elevations towards the terminus of glaciers (Figure 2 and Figure 3). The temperature anomalies show a slightly increasing temperature range in the lower elevations that is more prominent during summer and autumn seasons (Figure 7), which may lead to a reduced glacier area in lower elevations of the catchment. Meanwhile, the reduction in the glacier area is not significant, i.e., −1.08 km2 from 2000 to 2020. Glaciers in the study maintained the surface velocity with no significant variation during the study period of 2000 to 2020. Kutiah Lungma Glacier in the Astak catchment has been reported to surge in the past [32]; however, we did not find anomalies in the glacier surface velocity during the study period, and the glacier has not been reported to surge during the study periods in previous regional studies. In the past two decades, the region has shown balanced to slightly positive glacier budgets and an increase in glacier velocity [21]. The dynamic adjustments with a stable or advancing terminus in response to a positive mass balance are also reported in the region [62]. Dehecq, et al. [63] reported a sustained slowdown of the glacier velocity in regions of ice thinning in HMA, while the Karakoram and West Kunlun regions have experienced slightly accelerated glacier flow despite having stable or thickening glaciers. The slightly positive mass budgets in parts of the Karakoram region are also indirectly confirmed by long-term trends in glacier velocities from 2000–2016. Regional averages for the Karakoram region are on the order of +3.6 ± 1.2% per decade [21]. However, interpreting single glacier-specific velocity variations is challenging due to large seasonal and interannual variabilities induced by various factors such as ice deformation, basal sliding, and variations in flow induced by changes in the glacier ice thermal regime. We observed an increasing trend in the mean annual velocity of Kutiah Lungma Glacier from 2000 to 2020.
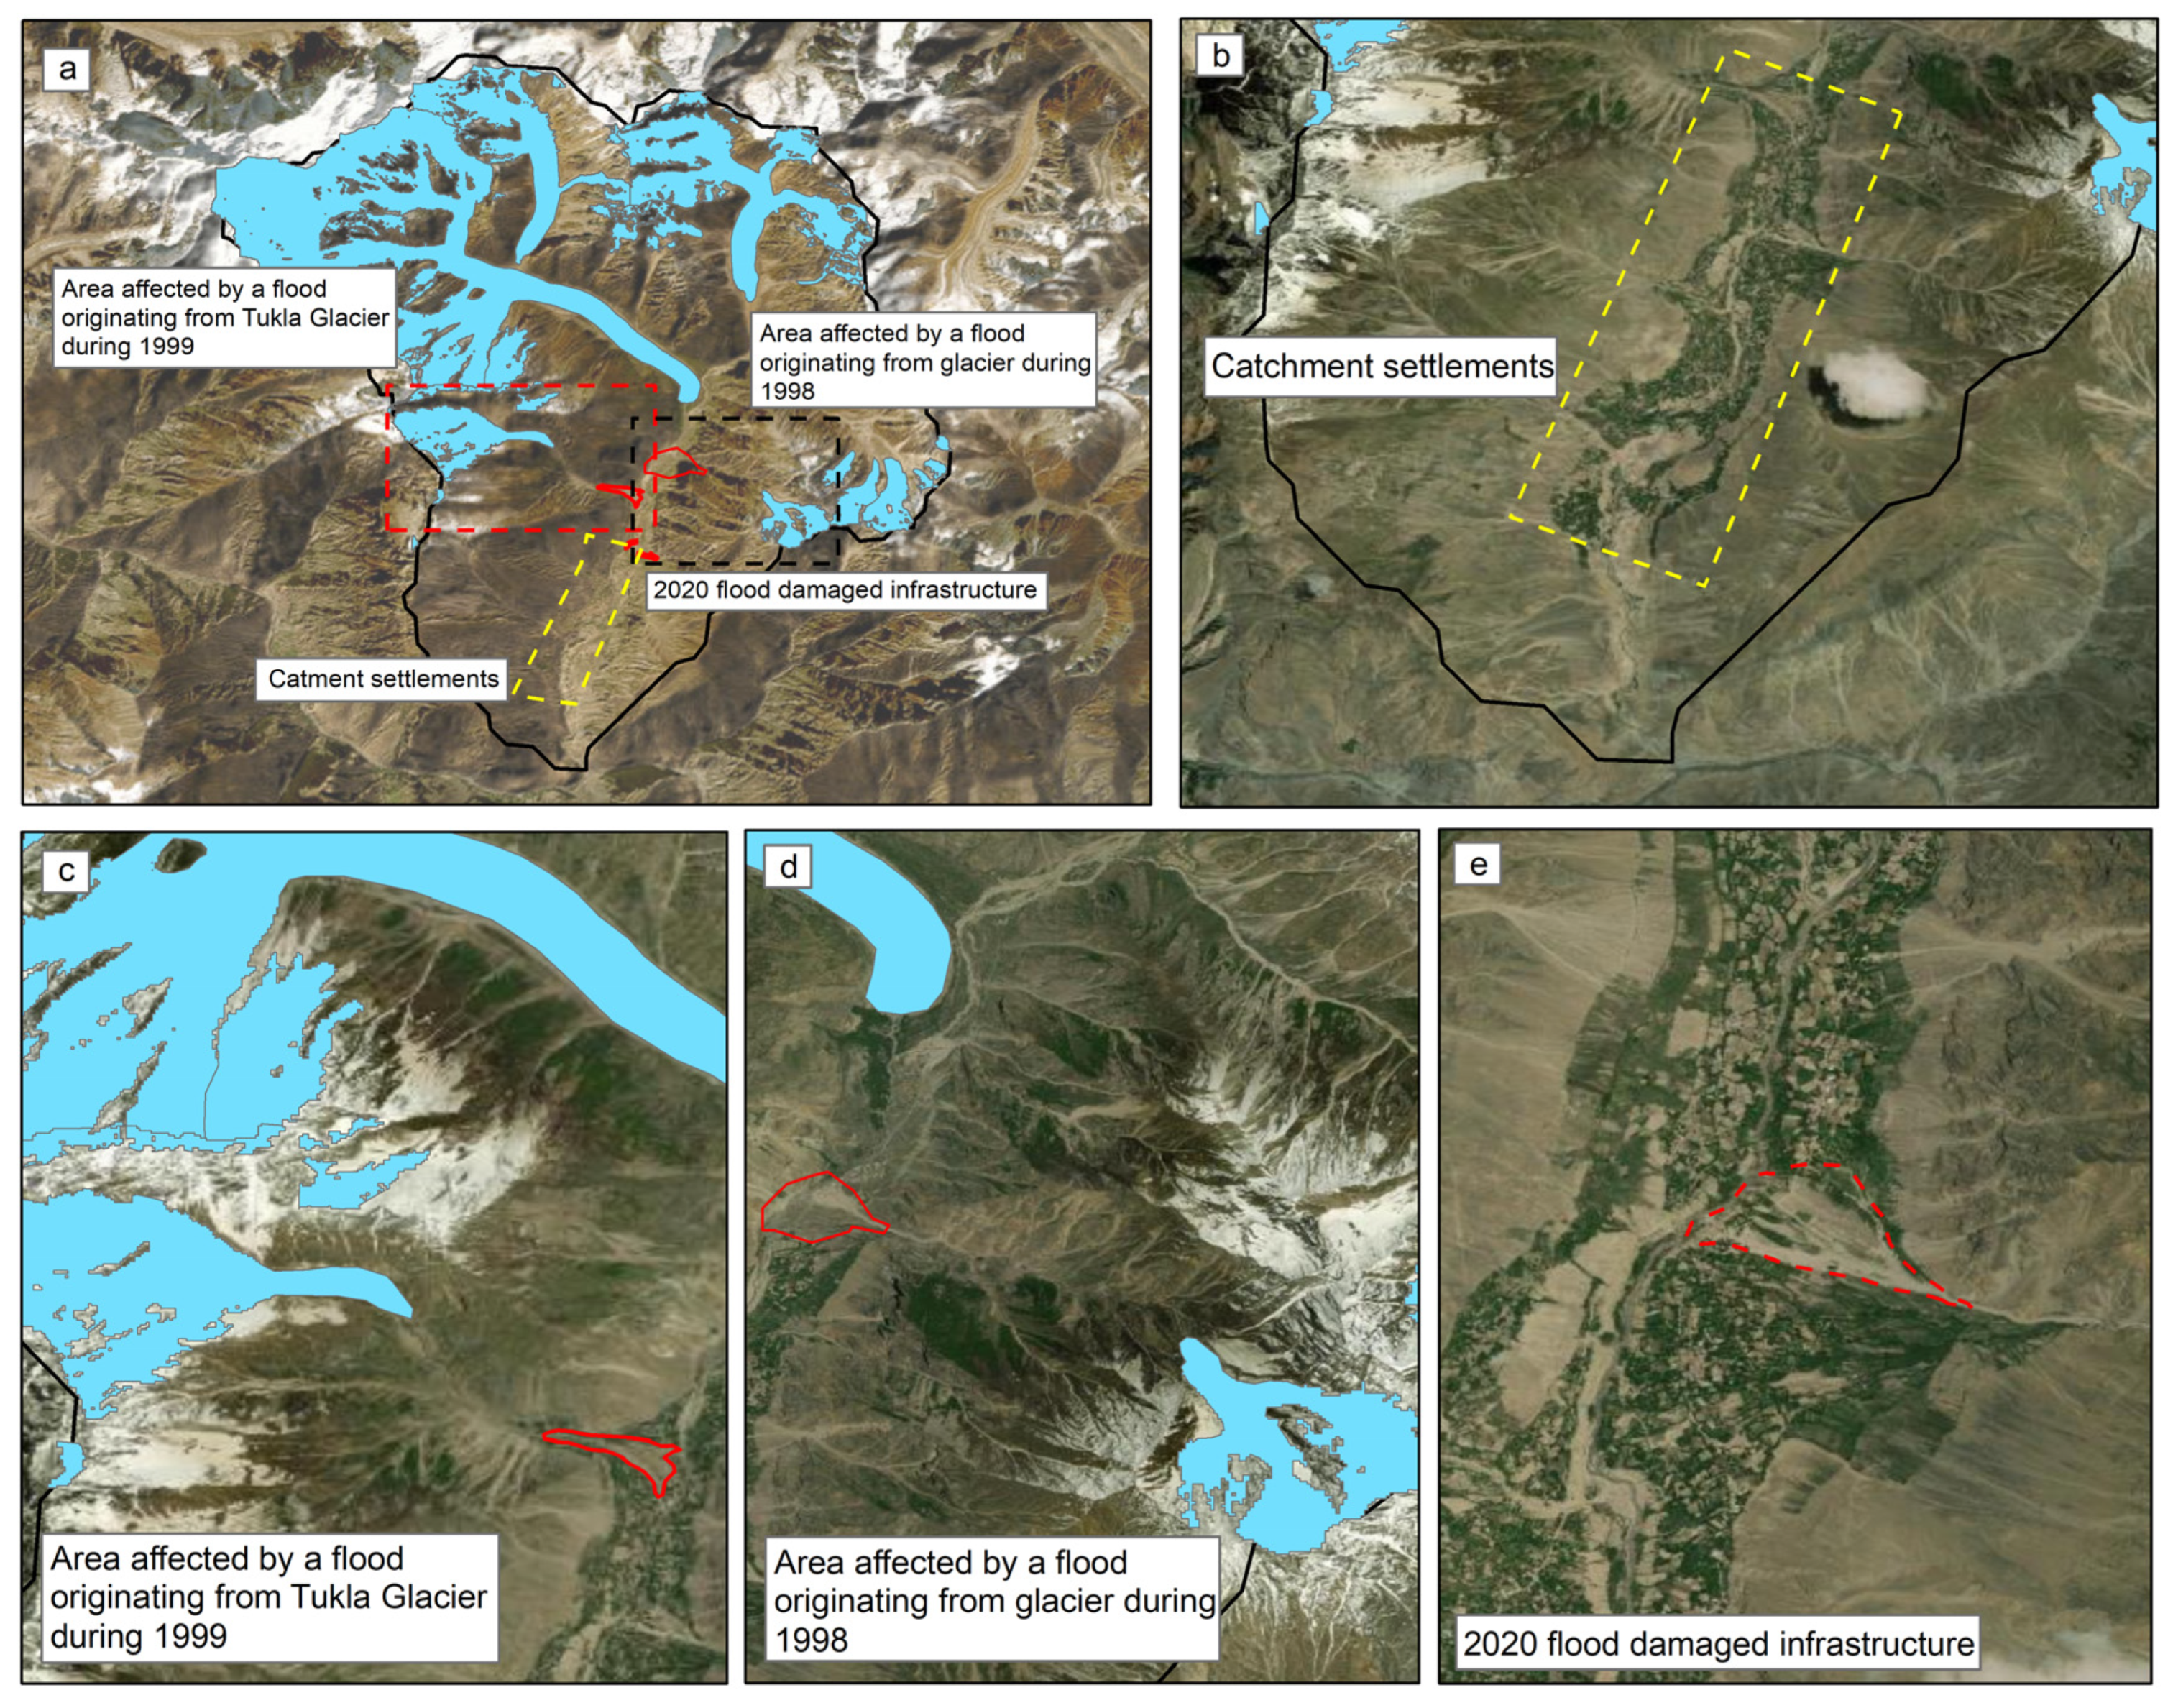
Changes in glacier melt and permafrost thaw characteristics play a vital role in the occurrence of disasters in mountainous regions [8,64]. Especially, the regions where human activities often intersect with the mountain cryosphere are at increasing risk, and such occurrences are common in the Hindu Kush Himalaya region [65]. In general, during rain storms, snow/ice melt above a critical discharge threshold, and runoff from low-permeability surfaces mobilizes loose sediments downslope into debris flows [66]. The occurrence and re-occurrence of debris flows in mountainous catchments depend on different factors; these include the presence of and changes in permafrost and glacial moraines and the accumulation of loose sediments on steep slopes [67]. Moraines adjacent to retreating glaciers and the degradation of permafrost in the glaciated region can also serve as significant sources of sediments for debris flows [8]. Future changes in climatic conditions may also potentially affect the glacier flow regime and mass balance. Recent regional studies based on both in-situ measurements and remotely sensed results highlighted the acceleration in glacier mass loss and increasing temperature regimes. The increasing summer and autumn temperatures prolong glacier ablation and can contribute to a more negative glacier mass balance. The enhanced glacier melt in the study area presents a threat to the downstream population, as the majority of the population in the study area settled along the streams from the glacier upstream (Figure 8). The catchment has previously experienced glacial lake outburst floods, erosion, and extreme stream flow (Figure 8c–e). Local authorities reported that the floods during the summer seasons of 1998, 1999, and 2020 caused extensive damages to the infrastructure and agricultural land. The locations of the affected region are highlighted in Figure 8. Similarly, regions along the Himalayas are experiencing glacier-originated disasters [9]. Model projections suggest increasing temperature and significant variations in future climatic conditions, which are expected to have an impact of the glacier melt characteristics [58,68]. Changes in the glacier mass budget and variations in stream flow in the Astak catchment are expected to significantly influence the water availability and cryospheric hazards in the catchment.

6. Conclusions

Based on the estimates of the current study from 2000 to 2020, glacier mass balance in the catchment is slightly negative. However, the glaciers in the catchment maintained a less negative mass balance compared to the glacier mass balance reported in other regions of High Mountain Asia. The glacier area was reduced by only 1.8 km2 during 2000 to 2020 in the catchment, which is only 1% of the total glacier area. We found an enhanced glacier mass loss/negative mass balance during recent years after 2010–2020 compared to 2000–2009, which can be attributed to the increasing temperature and change in precipitation patterns. Increasing seasonal temperature trends during summer and autumn seasons are expected to expand the length of the ablation period, which in turn enhances the glacier mass loss in the catchment. The expanded length of glacier ablation can reduce the accumulation and remove snow and firn from glacier surfaces at higher elevations. We also reported a slightly shifting equilibrium line for altitude that corresponds to the enhanced ablation during summer and autumn seasons. The negative glacier mass balance is also reflected in terms of the glacier area change, which is more dominant at lower elevations towards the glacier terminus. The debris cover and clean ice ratio of the glaciers was approximately the same for the years 2000 and 2020; however, we observed a slight change in between. The estimated glacier velocity over the study period did not show any significant change. Based on the results of the current study, the glaciers have been able to maintain a less negative mass balance, the change in glacier melt characteristics induced by varying climatic conditions could enhance glacier melt, and future changes in climate could turn the less negative mass balance to a negative one. The enhanced glacier mass loss in the catchment poses significant GLOF hazards to the adjacent downstream population along the stream.

Supplementary Materials

The following supporting information can be downloaded at: https://www.mdpi.com/article/10.3390/rs16091558/s1, Figure S1: Mean annual climate change anomalies for the Astak catchment from 2000 to 2020 compared to the baseline period 1990 to 2000. (a) Temperature anomalies, and (b) precipitation anomalies. Boundary of Astak catchment is shown in black and glacier boundaries are shown in blue.; Figure S2: (a) Spatially distributed elevation change for Kutiah Glaceir and tributaries from 2000 to 2010. The changes in color corresponds to the change in glacier surface elevation shown in the color bar. (b) Altitudinal variations in glacier elevation change shown with the blue line at each 50 m interval. Range of error at each point is shown in the blue shaded line. And the glacier elevation changes for the period of 2010 to 2020 is shown in panel c and d; Figure S3: (a) Spatially distributed elevation change for Goropah Glaceir and tributaries from 2000 to 2010. The changes in color corresponds to the change in glacier surface elevation shown in the color bar. (b) Altitudinal variations in glacier elevation change shown with the blue line at each 50 m interval. Range of error at each point is shown in the blue shaded line. And the glacier elevation changes for the period of 2010 to 2020 is shown in panel c and d; Figure S4: (a) Spatially distributed elevation changes for Tuklah Glaceir and tributaries from 2000 to 2010. The changes in color corresponds to the change in glacier surface elevation shown in the color bar. (b) Altitudinal variations in glacier elevation change shown with the blue line at each 50 m interval. Range of error at each point is shown in the blue shaded line. And the glacier elevation changes for the period of 2010 to 2020 is shown in panel c and d; Figure S5: (a) Variation in Kutiah Lungma Glaicer velocity from 2000 to 2020. Distacne away from the glacier terminus is presnted along x-axis and the mean annual velocity is shown in y-axis. (b) Altitudinal variation in glacier velocity is is shown with the brown line corresponds to the primary y-axis and the glacier area at each 200 m elevation bin is shown with the blue bar corresponds to the secondary y-axis; Figure S6: (a) Variation in Goropah Glaicer velocity from 2000 to 2020. Distacne away from the glacier terminus is presnted along x-axis and the mean annual velocity is shown in y-axis. (b) Altitudinal variation in glacier velocity is is shown with the brown line corresponds to the primary y-axis and the glacier area at each 200 m elevation bin is shown with the blue bar corresponds to the secondary y-axis; Figure S7: (a) Variation in Tuklah Glaicer velocity from 2000 to 2020. Distacne away from the glacier terminus is presnted along x-axis and the mean annual velocity is shown in y-axis. (b) Altitudinal variation in glacier velocity is is shown with the brown line corresponds to the primary y-axis and the glacier area at each 200 m elevation bin is shown with the blue bar corresponds to the secondary y-axis; Figure S8: (a) The geographical extent of High Mountain Asia (HMA) with all subregions highlighted by black boundaries. The location of the Astak catchment within HMA is indicated by the red polygon. (b) The boundary of the Astak catchment is outlined in red, with glaciers highlighted by gray boundaries; Table S1: Details of the optical satellite images from Landsat images used for the estimation of glacier area change in Astak catchment; Table S2: Details of the ASTER DEMs used for the estimation of glacier surface elevation change from 2000 to 2020 for the Astak catchment; Table S3: Details of satellite images used for the extraction of glacier surface velocity in the Astak catchment from 2000 to 2020.

Author Contributions

M.A. and Q.L. conceptualized and designed this study, performed, analyzed, and visualized results, and completed the manuscript; Q.L. and W.H. helped with analysis and visualization of the results, manuscript writing and editing, and improvement of the quality of the research. All authors have read and agreed to the published version of the manuscript.

Funding

This work was funded by the National Natural Science Foundation of China Sustainable Development International Cooperation Program (NSFC-SDIC Key Program 42361144874) and the Chinese MOST key projects of “International Cooperation in Science and Technology Innovation between Governments” (2023YFE0102800).

Data Availability Statement

The ASTER DEM used in the current study can be obtained from (https://urs.earthdata.nasa.gov/home), accessed on 5 May 2023. Landsat images are available at (https://earthexplorer.usgs.gov/), accessed on 1 May 2023 Climate data from the ERA5 Land model is available at: (https://cds.climate.copernicus.eu/cdsapp), accessed on 21 April 2023. Python code for the figures can be obtained on request from Muzaffar Ali.

Acknowledgments

The authors are especially grateful to the United States Geological Survey for making the satellite imagery available. We are thankful to the COSI-Corr team for developing and making the tool available for research. We are thankful to the scientific community for the open source policy on Python libraries. This research has been undertaken as part of an international master scholarship supported by the Alliance of International Science Organizations (ANSO), Chinese Academy of Sciences.

Conflicts of Interest

The authors declare that the research was conducted in the absence of any commercial or financial relationships that could be construed as a potential conflicts of interest. The authors declare that they have no conflicts of interest.

References

  1. Immerzeel, W.W.; Van Beek, L.P.; Bierkens, M.F. Climate change will affect the Asian water towers. Science 2010, 328, 1382–1385. [Google Scholar] [CrossRef] [PubMed]
  2. Kääb, A.; Berthier, E.; Nuth, C.; Gardelle, J.; Arnaud, Y. Contrasting patterns of early twenty-first-century glacier mass change in the Himalayas. Nature 2012, 488, 495. [Google Scholar] [CrossRef] [PubMed]
  3. Molden, D.J.; Shrestha, A.B.; Immerzeel, W.W.; Maharjan, A.; Rasul, G.; Wester, P.; Wagle, N.; Pradhananga, S.; Nepal, S. The Great Glacier and Snow-Dependent Rivers of Asia and Climate Change: Heading for Troubled Waters. In Water Security under Climate Change; Water Resources Development and Management; Springer: Berlin/Heidelberg, Germany, 2022; pp. 223–250. [Google Scholar]
  4. Hugonnet, R.; McNabb, R.; Berthier, E.; Menounos, B.; Nuth, C.; Girod, L.; Farinotti, D.; Huss, M.; Dussaillant, I.; Brun, F.; et al. Accelerated global glacier mass loss in the early twenty-first century. Nature 2021, 592, 726–731. [Google Scholar] [CrossRef] [PubMed]
  5. Hewitt, K. The Karakoram anomaly? Glacier expansion and the ‘elevation effect,’ Karakoram Himalaya. Mt. Res. Dev. 2005, 25, 332–341. [Google Scholar] [CrossRef]
  6. Immerzeel, W.; Pellicciotti, F.; Bierkens, M. Rising river flows throughout the twenty-first century in two Himalayan glacierized watersheds. Nat. Geosci. 2013, 6, 742–745. [Google Scholar] [CrossRef]
  7. Hassan, J.; Chen, X.-Q.; Kayastha, R.B.; Nie, Y. Multi-model assessment of glacio-hydrological changes in central Karakoram, Pakistan. J. Mt. Sci. 2021, 18, 1995–2011. [Google Scholar] [CrossRef]
  8. Hassan, W.; Su, F.-H.; Liu, W.-M.; Hassan, J.; Hassan, M.; Bazai, N.A.; Wang, H.; Yang, Z.-W.; Ali, M.; Castellanos, D.G. Impact of glacier changes and permafrost distribution on debris flows in Badswat and Shishkat catchments, Northern Pakistan. J. Mt. Sci. 2023, 20, 3687–3702. [Google Scholar] [CrossRef]
  9. Shugar, D.H.; Jacquemart, M.; Shean, D.; Bhushan, S.; Upadhyay, K.; Sattar, A.; Schwanghart, W.; McBride, S.; Vries, M.V.W.d.; Mergili, M.; et al. A massive rock and ice avalanche caused the 2021 disaster at Chamoli, Indian Himalaya. Science 2021, 373, 300–306. [Google Scholar] [CrossRef]
  10. Carey, M. Disasters, development, and glacial lake control in twentieth-century Peru. In Mountains: Sources of Water, Sources of Knowledge; Springer: Berlin/Heidelberg, Germany, 2008; pp. 181–196. [Google Scholar]
  11. Emmer, A.; Harrison, S.; Mergili, M.; Allen, S.; Frey, H.; Huggel, C. 70 years of lake evolution and glacial lake outburst floods in the Cordillera Blanca (Peru) and implications for the future. Geomorphology 2020, 365, 107178. [Google Scholar] [CrossRef]
  12. Rounce, D.R.; Hock, R.; Maussion, F.; Hugonnet, R.; Kochtitzky, W.; Huss, M.; Berthier, E.; Brinkerhoff, D.; Compagno, L.; Copland, L.; et al. Global glacier change in the 21st century: Every increase in temperature matters. Science 2023, 379, 78–83. [Google Scholar] [CrossRef]
  13. Nicholson, L.; Benn, D. Calculating ice melt beneath a debris layer using meteorological data. J. Glaciol. 2006, 52, 463–470. [Google Scholar] [CrossRef]
  14. Brun, F.; Berthier, E.; Wagnon, P.; Kääb, A.; Treichler, D. A spatially resolved estimate of High Mountain Asia glacier mass balances from 2000 to 2016. Nat. Geosci. 2017, 10, 668–673. [Google Scholar] [CrossRef] [PubMed]
  15. Chen, J.; Xue, X.; Du, W. Short communication: Extreme glacier mass loss triggered by high temperature and drought during hydrological year 2022/2023 in Qilian Mountains. Res. Cold Arid Reg. 2024, 16, 1–4. [Google Scholar] [CrossRef]
  16. Shen, C.; Jia, L.; Ren, S. Inter- and Intra-Annual Glacier Elevation Change in High Mountain Asia Region Based on ICESat-1&2 Data Using Elevation-Aspect Bin Analysis Method. Remote Sens. 2022, 14, 1630. [Google Scholar] [CrossRef]
  17. Hassan, S.N.U.; Reba, M.N.; Hussain, D.; Ali, A. Elevation dependent thickness and ice-volume estimation using satellite derived DEM for mountainous glaciers of Karakorum range. Earth Environ. Sci. 2018, 169, 012115. [Google Scholar] [CrossRef]
  18. Wang, Q.; Yi, S.; Sun, W. Continuous Estimates of Glacier Mass Balance in High Mountain Asia Based on ICESat-1,2 and GRACE/GRACE Follow-On Data. Geophys. Res. Lett. 2021, 48, e2020GL090954. [Google Scholar] [CrossRef]
  19. Fan, Y.; Ke, C.-Q.; Zhou, X.; Shen, X.; Yu, X.; Lhakpa, D. Glacier mass-balance estimates over High Mountain Asia from 2000 to 2021 based on ICESat-2 and NASADEM. J. Glaciol. 2022, 69, 500–512. [Google Scholar] [CrossRef]
  20. Berthier, E.; Brun, F. Karakoram geodetic glacier mass balances between 2008 and 2016: Persistence of the anomaly and influence of a large rock avalanche on Siachen Glacier. J. Glaciol. 2019, 65, 494–507. [Google Scholar] [CrossRef]
  21. Farinotti, D.; Immerzeel, W.W.; de Kok, R.J.; Quincey, D.J.; Dehecq, A. Manifestations and mechanisms of the Karakoram glacier Anomaly. Nat. Geosci. 2020, 13, 8–16. [Google Scholar] [CrossRef] [PubMed]
  22. Azam, M.F.; Wagnon, P.; Berthier, E.; Vincent, C.; Fujita, K.; Kargel, J.S. Review of the status and mass changes of Himalayan-Karakoram glaciers. J. Glaciol. 2018, 64, 61–74. [Google Scholar] [CrossRef]
  23. Hassan, J.; Kayastha, R.B.; Shrestha, A.; Bano, I.; Ali, S.H.; Magsi, H.Z. Predictions of future hydrological conditions and contribution of snow and ice melt in total discharge of Shigar River Basin in Central Karakoram, Pakistan. Sci. Cold Arid Reg. 2017, 9, 0511–0524. [Google Scholar]
  24. Shrestha, M.; Koike, T.; Hirabayashi, Y.; Xue, Y.; Wang, L.; Rasul, G.; Ahmad, B. Integrated simulation of snow and glacier melt in water and energy balance-based, distributed hydrological modeling framework at Hunza River Basin of Pakistan Karakoram region. J. Geophys. Res. Atmos. 2015, 120, 4889–4919. [Google Scholar] [CrossRef]
  25. Wang, Q.; Yi, S.; Sun, W. Precipitation-driven glacier changes in the Pamir and Hindu Kush mountains. Geophys. Res. Lett. 2017, 44, 2817–2824. [Google Scholar] [CrossRef]
  26. Yao, T.; Thompson, L.; Yang, W.; Yu, W.; Gao, Y.; Guo, X.; Yang, X.; Duan, K.; Zhao, H.; Xu, B. Different glacier status with atmospheric circulations in Tibetan Plateau and surroundings. Nat. Clim. Chang. 2012, 2, 663. [Google Scholar] [CrossRef]
  27. Minora, U.; Bocchiola, D.; D’Agata, C.; Maragno, D.; Mayer, C.; Lambrecht, A.; Mosconi, B.; Vuillermoz, E.; Senese, A.; Compostella, C. 2001–2010 glacier changes in the Central Karakoram National Park: A contribution to evaluate the magnitude and rate of the “Karakoram anomaly”. Cryosphere Discuss. 2013, 7, 2891–2941. [Google Scholar] [CrossRef]
  28. Bocchiola, D.; Diolaiuti, G.; Soncini, A.; Mihalcea, C.; D’agata, C.; Mayer, C.; Lambrecht, A.; Rosso, R.; Smiraglia, C. Prediction of future hydrological regimes in poorly gauged high altitude basins: The case study of the upper Indus, Pakistan. Hydrol. Earth Syst. Sci. 2011, 15, 2059–2075. [Google Scholar] [CrossRef]
  29. Zhou, Y.; Li, Z.; Li, J.I.A. Slight glacier mass loss in the Karakoram region during the 1970s to 2000 revealed by KH-9 images and SRTM DEM. J. Glaciol. 2017, 63, 331–342. [Google Scholar] [CrossRef]
  30. Huang, D.; Zhang, Z.; Jiang, L.; Zhang, R.; Lu, Y.; Shahtahmassebi, A.; Huang, X. Variability of Glacier Velocity and the Influencing Factors in the Muztag-Kongur Mountains, Eastern Pamir Plateau. Remote Sens. 2023, 15, 620. [Google Scholar] [CrossRef]
  31. Ke, C.-Q.; Kou, C.; Ludwig, R.; Qin, X. Glacier velocity measurements in the eastern Yigong Zangbo basin, Tibet, China. J. Glaciol. 2017, 59, 1060–1068. [Google Scholar] [CrossRef]
  32. Copland, L.; Sylvestre, T.; Bishop, M.P.; Shroder, J.F.; Seong, Y.B.; Owen, L.A.; Bush, A.; Kamp, U. Expanded and recently increased glacier surging in the Karakoram. Arct. Antarct. Alp. Res. 2011, 43, 503–516. [Google Scholar] [CrossRef]
  33. Bazai, N.A.; Cui, P.; Carling, P.A.; Wang, H.; Hassan, J.; Liu, D.; Zhang, G.; Jin, W. Increasing glacial lake outburst flood hazard in response to surge glaciers in the Karakoram. Earth-Sci. Rev. 2021, 212, 103432. [Google Scholar] [CrossRef]
  34. Zhang, Y.; Zhang, L.; He, Y.; Yao, S.; Yang, W.; Cao, S.; Sun, Q. Analysis of the future trends of typical mountain glacier movements along the Sichuan-Tibet Railway based on ConvGRU network. Int. J. Digit. Earth 2023, 16, 762–780. [Google Scholar] [CrossRef]
  35. Wang, X.; Shangguan, D.; Li, D.; Anjum, M.N. Spatiotemporal Variability of Velocity and Influence of Glacier Thickness Using Landsat Imagery: Hunza River Basin, Karakoram Range. IEEE Access 2021, 9, 72808–72819. [Google Scholar] [CrossRef]
  36. Burns, P.; Nolin, A. Using atmospherically-corrected Landsat imagery to measure glacier area change in the Cordillera Blanca, Peru from 1987 to 2010. Remote Sens. Environ. 2014, 140, 165–178. [Google Scholar] [CrossRef]
  37. Tian, H.; Yang, T.; Liu, Q. Climate change and glacier area shrinkage in the Qilian mountains, China, from 1956 to 2010. Ann. Glaciol. 2017, 55, 187–197. [Google Scholar] [CrossRef]
  38. Mölg, N.; Bolch, T.; Rastner, P.; Strozzi, T.; Paul, F. A consistent glacier inventory for Karakoram and Pamir derived from Landsat data: Distribution of debris cover and mapping challenges. Earth Syst. Sci. Data 2018, 10, 1807–1827. [Google Scholar] [CrossRef]
  39. Lhakpa, D.; Fan, Y.; Cai, Y. Continuous Karakoram Glacier Anomaly and Its Response to Climate Change during 2000–2021. Remote Sens. 2022, 14, 6281. [Google Scholar] [CrossRef]
  40. Che, Y.; Wang, S.; Yi, S.; Wei, Y.; Cai, Y. Summer Mass Balance and Surface Velocity Derived by Unmanned Aerial Vehicle on Debris-Covered Region of Baishui River Glacier No. 1, Yulong Snow Mountain. Remote Sens. 2020, 12, 3280. [Google Scholar] [CrossRef]
  41. Singh, K.K.; Negi, H.S.; Singh, D.K. Assessment of glacier stored water in Karakoram Himalaya using satellite remote sensing and field investigation. J. Mt. Sci. 2019, 16, 836–849. [Google Scholar] [CrossRef]
  42. Diolaiuti, G.; Pecci, M.; Smiraglia, C. Liligo Glacier, Karakoram, Pakistan: A reconstruction of the recent history of a surge-type glacier. Ann. Glaciol. 2017, 36, 168–172. [Google Scholar] [CrossRef]
  43. Hewitt, K. Glacier surges in the Karakoram Himalaya (Central Asia). Can. J. Earth Sci. 1969, 6, 1009–1018. [Google Scholar] [CrossRef]
  44. Hersbach, H.; Bell, B.; Berrisford, P.; Hirahara, S.; Horányi, A.; Muñoz-Sabater, J.; Nicolas, J.; Peubey, C.; Radu, R.; Schepers, D.; et al. The ERA5 global reanalysis. Q. J. R. Meteorol. Soc. 2020, 146, 1999–2049. [Google Scholar] [CrossRef]
  45. Muñoz Sabater, J. ERA5-Land hourly data from 1950 to present. In Copernicus Climate Change Service (C3S) Climate Data Store (CDS). 2021. Available online: https://cds.climate.copernicus.eu/cdsapp#!/dataset/10.24381/cds.e2161bac (accessed on 21 April 2023).
  46. Bocchiola, D.; Soncini, A. Water Resources Modeling and Prospective Evaluation in the Indus River Under Present and Prospective Climate Change. In Indus River Basin; Elsevier: Amsterdam, The Netherlands, 2019; pp. 17–56. [Google Scholar]
  47. Khanbilvardi, R.; Ganju, A.; Rajawat, A.S.; Chen, J.M.; Tiwari, R.K.; Garg, P.K.; Saini, V.; Shukla, A. Comparisons of different methods for debris covered glacier classification. In Proceedings of the Land Surface and Cryosphere Remote Sensing III, New Delhi, India, 4–7 April 2016. [Google Scholar]
  48. Shukla, A.; Gupta, R.P.; Arora, M.K. Delineation of debris-covered glacier boundaries using optical and thermal remote sensing data. Remote Sens. Lett. 2010, 1, 11–17. [Google Scholar] [CrossRef]
  49. Muhammad, S.; Tian, L.; Khan, A. Early twenty-first century glacier mass losses in the Indus Basin constrained by density assumptions. J. Hydrol. 2019, 574, 467–475. [Google Scholar] [CrossRef]
  50. Paul, F.; Bolch, T.; Kääb, A.; Nagler, T.; Nuth, C.; Scharrer, K.; Shepherd, A.; Strozzi, T.; Ticconi, F.; Bhambri, R.; et al. The glaciers climate change initiative: Methods for creating glacier area, elevation change and velocity products. Remote Sens. Environ. 2015, 162, 408–426. [Google Scholar] [CrossRef]
  51. Muhammad, S.; Tian, L.; NÜSser, M. No significant mass loss in the glaciers of Astore Basin (North-Western Himalaya), between 1999 and 2016. J. Glaciol. 2019, 65, 270–278. [Google Scholar] [CrossRef]
  52. Nuth, C.; Kääb, A. Co-registration and bias corrections of satellite elevation data sets for quantifying glacier thickness change. Cryosphere 2011, 5, 271–290. [Google Scholar] [CrossRef]
  53. Bogale Begashaw, G.; Berihun Yohannes, Y. Review of Outlier Detection and Identifying Using Robust Regression Model. Int. J. Syst. Sci. Appl. Math. 2020, 5, 4–11. [Google Scholar] [CrossRef]
  54. Huss, M. Density assumptions for converting geodetic glacier volume change to mass change. Cryosphere 2013, 7, 877–887. [Google Scholar] [CrossRef]
  55. Zhang, J.; Jia, L.; Menenti, M.; Ren, S. Interannual and Seasonal Variability of Glacier Surface Velocity in the Parlung Zangbo Basin, Tibetan Plateau. Remote Sens. 2020, 13, 80. [Google Scholar] [CrossRef]
  56. Moragues, S.; Lenzano, M.G.; Lo Vecchio, A.; Falaschi, D.; Lenzano, L. Velocidades superficiales del glaciar Upsala, Andes Patagónicos Sur, mediante el uso de correlación cruzada en imágenes satelitales: Periodo 2013–2014. Andean Geol. 2017, 45, 87–103. [Google Scholar] [CrossRef]
  57. Ayoub, F.; Leprince, S.; Avouac, J.-P. Co-registration and correlation of aerial photographs for ground deformation measurements. ISPRS J. Photogramm. Remote Sens. 2009, 64, 551–560. [Google Scholar] [CrossRef]
  58. Huss, M.; Hock, R. Global-scale hydrological response to future glacier mass loss. Nat. Clim. Chang. 2018, 8, 135. [Google Scholar] [CrossRef]
  59. Wester, P.; Chaudhary, S.; Chettri, N.; Maharjan, A.; Nepal, S.; Steiner, J. Water, Ice, Society, and Ecosystems in the Hindu Kush Himalaya: An outlook; International Centre for Integrated Mountain Development (ICIMOD): Kathmandu, Nepal, 2023. [Google Scholar] [CrossRef]
  60. Wester, P.; Mishra, A.; Mukherji, A.; Shrestha, A. The Hindu Kush Himalaya Assessment: Mountains, Climate Change, Sustainability and People; Springer: Berlin/Heidelberg, Germany, 2019. [Google Scholar]
  61. You, Q.; Chen, D.; Wu, F.; Pepin, N.; Cai, Z.; Ahrens, B.; Jiang, Z.; Wu, Z.; Kang, S.; AghaKouchak, A. Elevation dependent warming over the Tibetan Plateau: Patterns, mechanisms and perspectives. Earth-Sci. Rev. 2020, 210, 103349. [Google Scholar] [CrossRef]
  62. Rankl, M.; Kienholz, C.; Braun, M. Glacier changes in the Karakoram region mapped by multimission satellite imagery. Cryosphere 2014, 8, 977–989. [Google Scholar] [CrossRef]
  63. Dehecq, A.; Gourmelen, N.; Gardner, A.S.; Brun, F.; Goldberg, D.; Nienow, P.W.; Berthier, E.; Vincent, C.; Wagnon, P.; Trouvé, E. Twenty-first century glacier slowdown driven by mass loss in High Mountain Asia. Nat. Geosci. 2019, 12, 22–27. [Google Scholar] [CrossRef]
  64. Shugar, D.H.; Burr, A.; Haritashya, U.K.; Kargel, J.S.; Watson, C.S.; Kennedy, M.C.; Bevington, A.R.; Betts, R.A.; Harrison, S.; Strattman, K. Rapid worldwide growth of glacial lakes since 1990. Nat. Clim. Chang. 2020, 10, 939–945. [Google Scholar] [CrossRef]
  65. IPCC; Masson-Delmotte, V.; Zhai, P.; Pirani, A.; Connors, S.L.; Péan, C.; Berger, S.; Caud, N.; Chen, Y.; Goldfarb, L.; et al. Climate Change 2021: The Physical Science Basis; Contribution of working group I to the sixth assessment report of the intergovernmental panel on climate change; Cambridge University Press: Cambridge, UK, 2021; Volume 2. [Google Scholar] [CrossRef]
  66. Kean, J.W.; McCoy, S.W.; Tucker, G.E.; Staley, D.M.; Coe, J.A. Runoff-generated debris flows: Observations and modeling of surge initiation, magnitude, and frequency. J. Geophys. Res. Earth Surf. 2013, 118, 2190–2207. [Google Scholar] [CrossRef]
  67. Kääb, A.; Reynolds, J.M.; Haeberli, W. Glacier and Permafrost Hazards in High Mountains. In Global Change and Mountain Regions: An Overview of Current Knowledge; Huber, U.M., Bugmann, H.K.M., Reasoner, M.A., Eds.; Springer Netherlands: Dordrecht, The Netherlands, 2005; pp. 225–234. [Google Scholar]
  68. Soncini, A.; Bocchiola, D.; Confortola, G.; Bianchi, A.; Rosso, R.; Mayer, C.; Lambrecht, A.; Palazzi, E.; Smiraglia, C.; Diolaiuti, G. Future hydrological regimes in the upper indus basin: A case study from a high-altitude glacierized catchment. J. Hydrometeorol. 2015, 16, 306–326. [Google Scholar] [CrossRef]
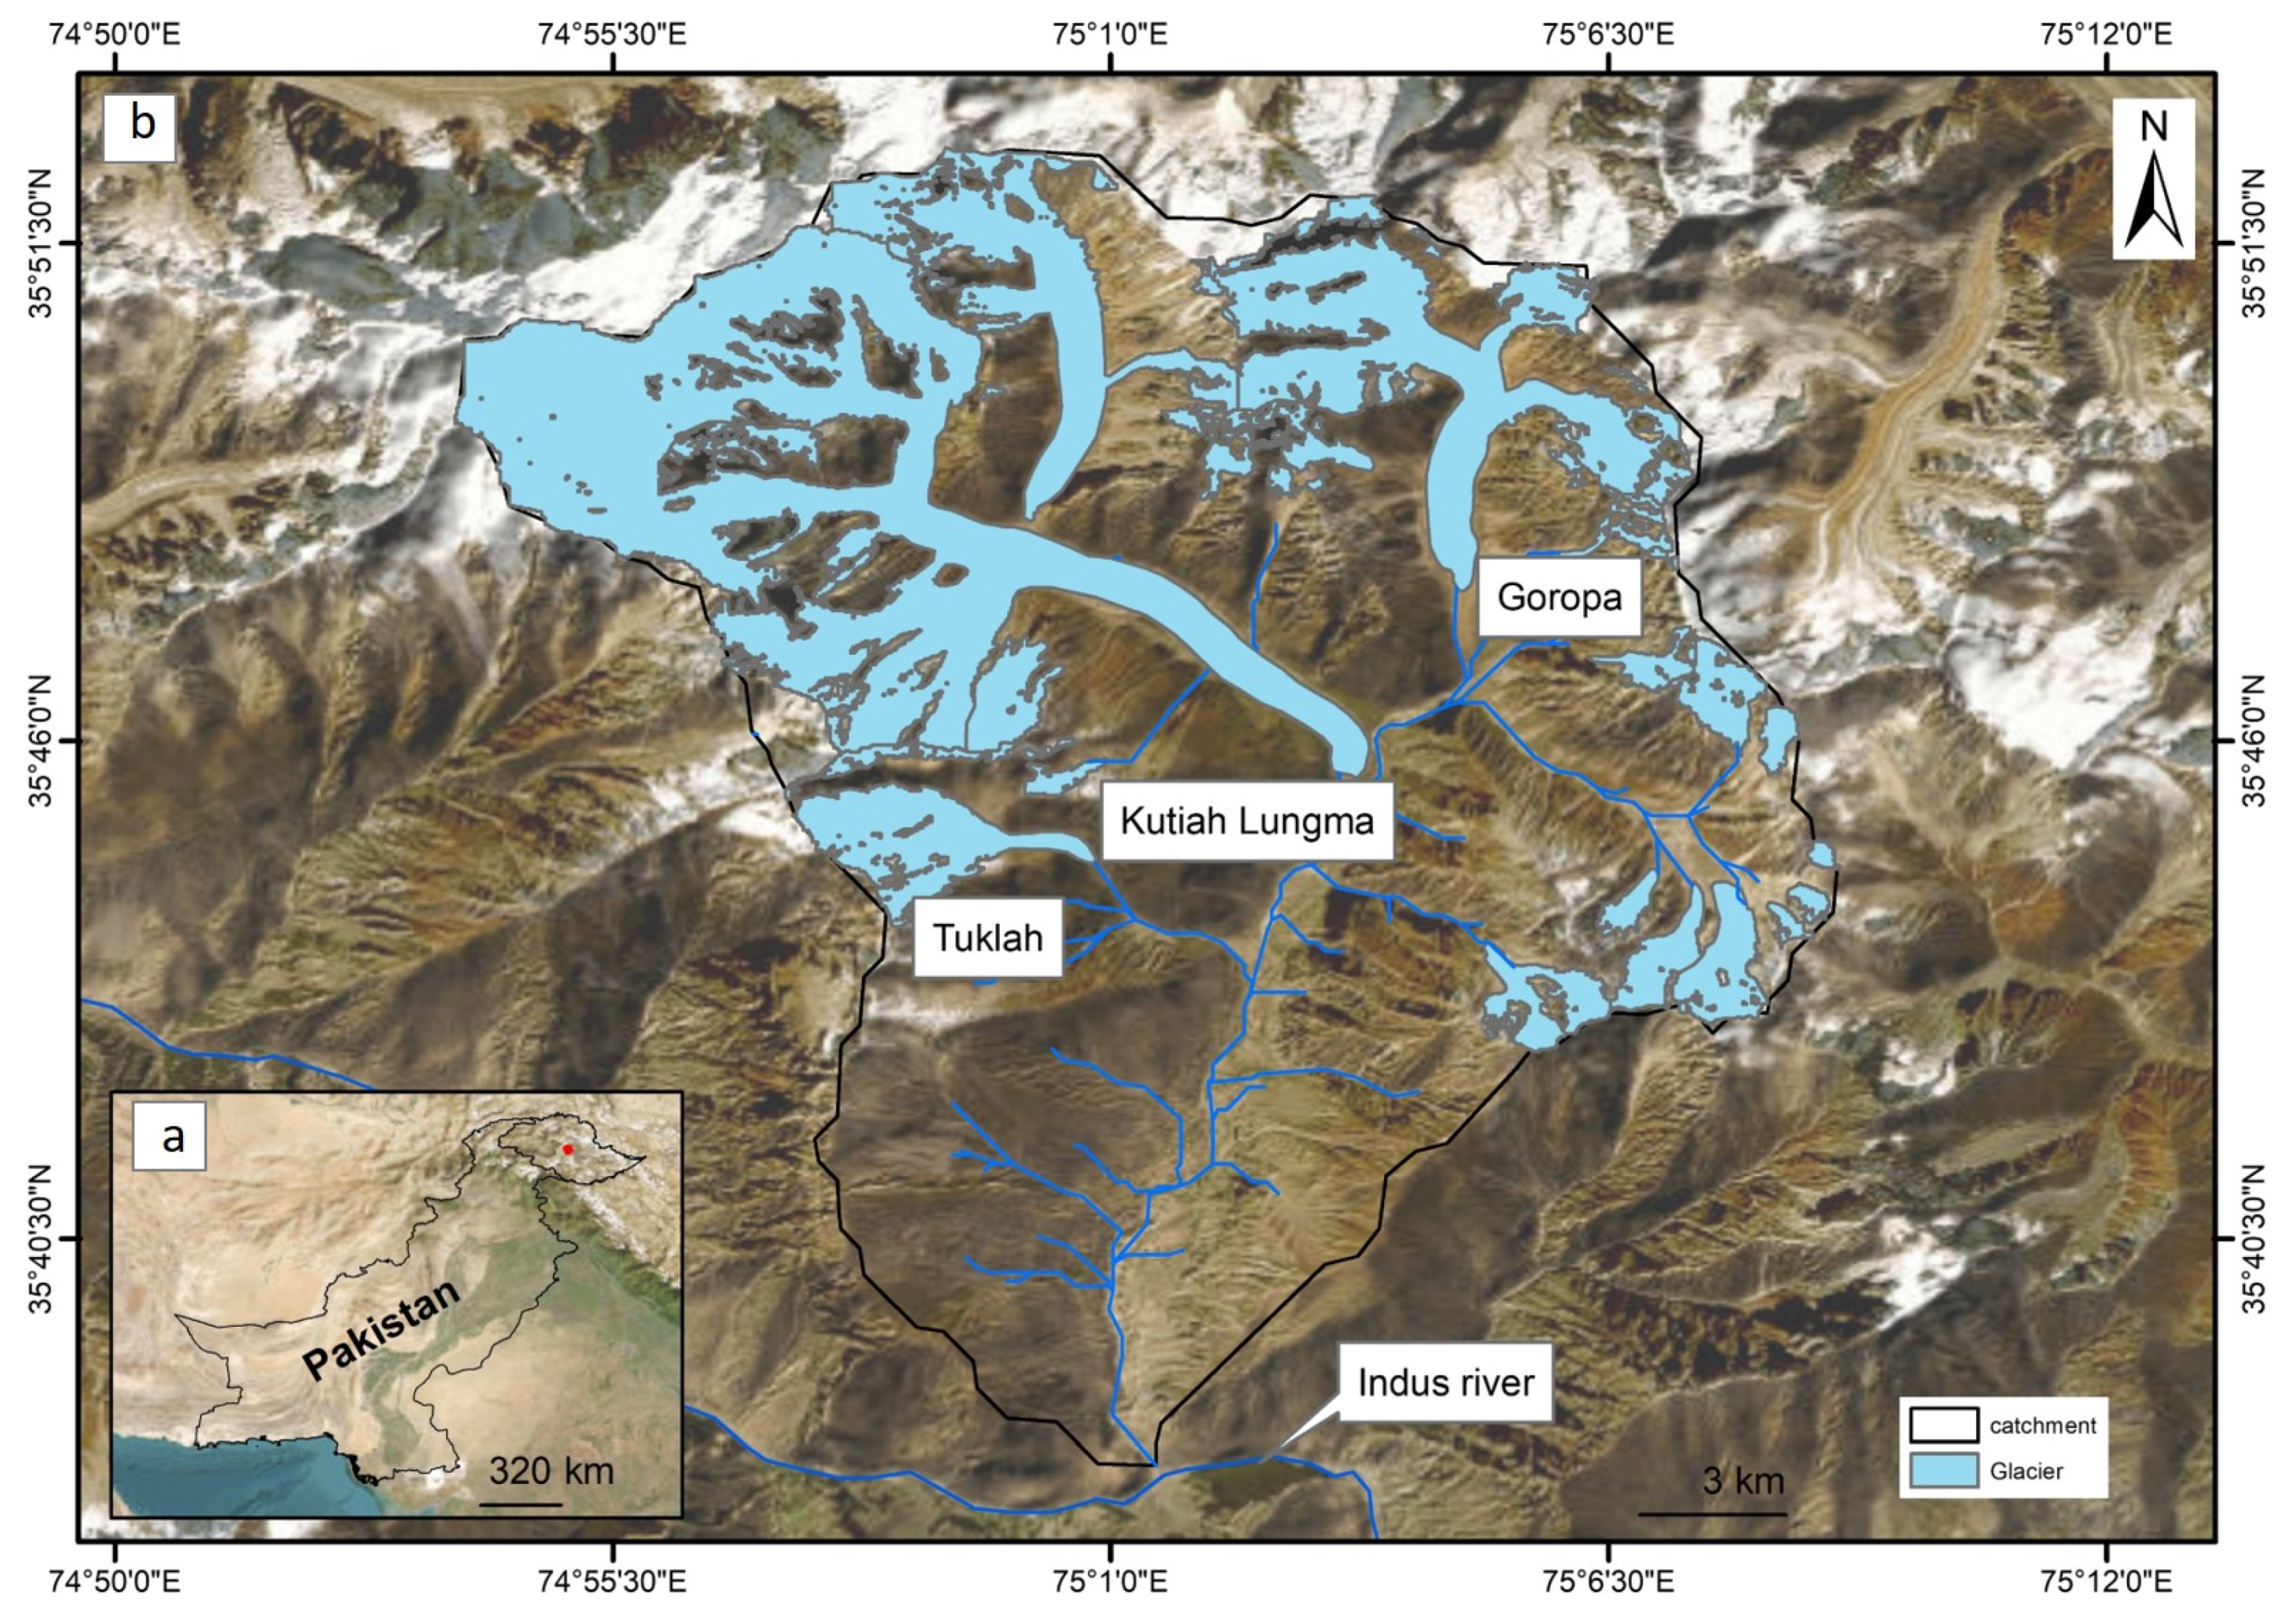
Figure 1. (a) The Astak catchment location with red dot in northern Pakistan. (b) The boundary of the study area (Astak catchment) is highlighted with the black line, and glaciers in the catchment are highlighted with a blue color; the stream network is shown with a blue line. Major glaciers in the Astak catchment are highlighted in panel (b).
Remotesensing 16 01558 g001
Figure 2. Altitudinal variations in glacier area change for clean glacier ice are shown in panel (a) and for debris cover, in panel (b). Total glacier area during 2020 is highlighted with a blue line. The total change from 2000 to 2020 is highlighted with a black line in panel (b).
Remotesensing 16 01558 g002
Figure 3. Glacier area changes in the Astak catchment from 2000 to 2020. Area changes in the terminus of the glacier are highlighted in the panels (ac) for Kutiah Lungma Glacier, Tuklah Glacier, and Goropah Glacier, respectively.
Remotesensing 16 01558 g003
Figure 4. Variation in glacier mass balance for all the glaciers in the Astak catchment. Subplots in the first column show the spatially distributed glacier mass balance, and the second column shows altitudinal variations in glacier mass balance for each time period from 2000 to 2020. (a,c,e,g) show glacier mass balance for the periods of 2000–2004, 2005–2009, 2010–2014, and 2015–2020, respectively. The color variation corresponds to the color bar in each subplot. (b,d,f,h) altitudinal variations in glacier mass balance, with the shaded area in each subplot indicating the range of error. (i,j) Mean annual mass balance and altitudinal variations in mean annual mass balance from 2000–2020, respectively.
Remotesensing 16 01558 g004
Figure 5. (a) Variation in glacier mass elevation change (m) corresponds to the color bar for all the glaciers in the Astak catchment. (b) Altitudinal variations in glacier mass balance (m w.e. a−1).
Remotesensing 16 01558 g005
Figure 6. (a) Variations in mean annual surface velocity of Kutiah Lungma Glacier from 2000 to 2020. Distance from the terminus of the glacier is shown on the horizontal x-axis. (b) Variation in mean glacier surface velocity from 2000 to 2020 is shown as the brown line over the corresponding glacier area, with 200 m internal elevation bins shown with blue bars. The range of error in the estimated velocity is highlighted with the brown shaded line.
Remotesensing 16 01558 g006
Figure 7. Seasonal temperature and precipitation anomalies for the Astak catchment from 2000 to 2020 compared to the baseline period from 1990 to 2000. (ad) Temperature anomalies for winter, spring, summer, and autumn months and (eh) precipitation anomalies for the winter, spring, summer, and autumn months. The boundary of the Astak catchment is shown in black, and glacier boundaries are shown in blue.
Remotesensing 16 01558 g007
Figure 8. (a) Areas affected by a flood that originated from glaciers are highlighted with red and black dotted lines, and the settlements of the Astak catchment are shown by the yellow line. (b) Settlements in the Astak catchment are located along the stream from glaciers. (c) Location of the area affected by a previous flood from the Tuklah Glacier catchment during 1999 is highlighted with the red line. (d) Area affected by a flood from the upstream glacier during 1998 is highlighted with the red line. (e) Flood-affected areas during a recent flood in 2020 are highlighted with the red dotted line.
Remotesensing 16 01558 g008
Disclaimer/Publisher’s Note: The statements, opinions and data contained in all publications are solely those of the individual author(s) and contributor(s) and not of MDPI and/or the editor(s). MDPI and/or the editor(s) disclaim responsibility for any injury to people or property resulting from any ideas, methods, instructions or products referred to in the content.