
Precise Drought Threshold Monitoring in Winter Wheat Using the Unmanned Aerial Vehicle Thermal Method


Abstract
1. Introduction
2. Materials and Methods
2.1. Study Area
2.2. Methods
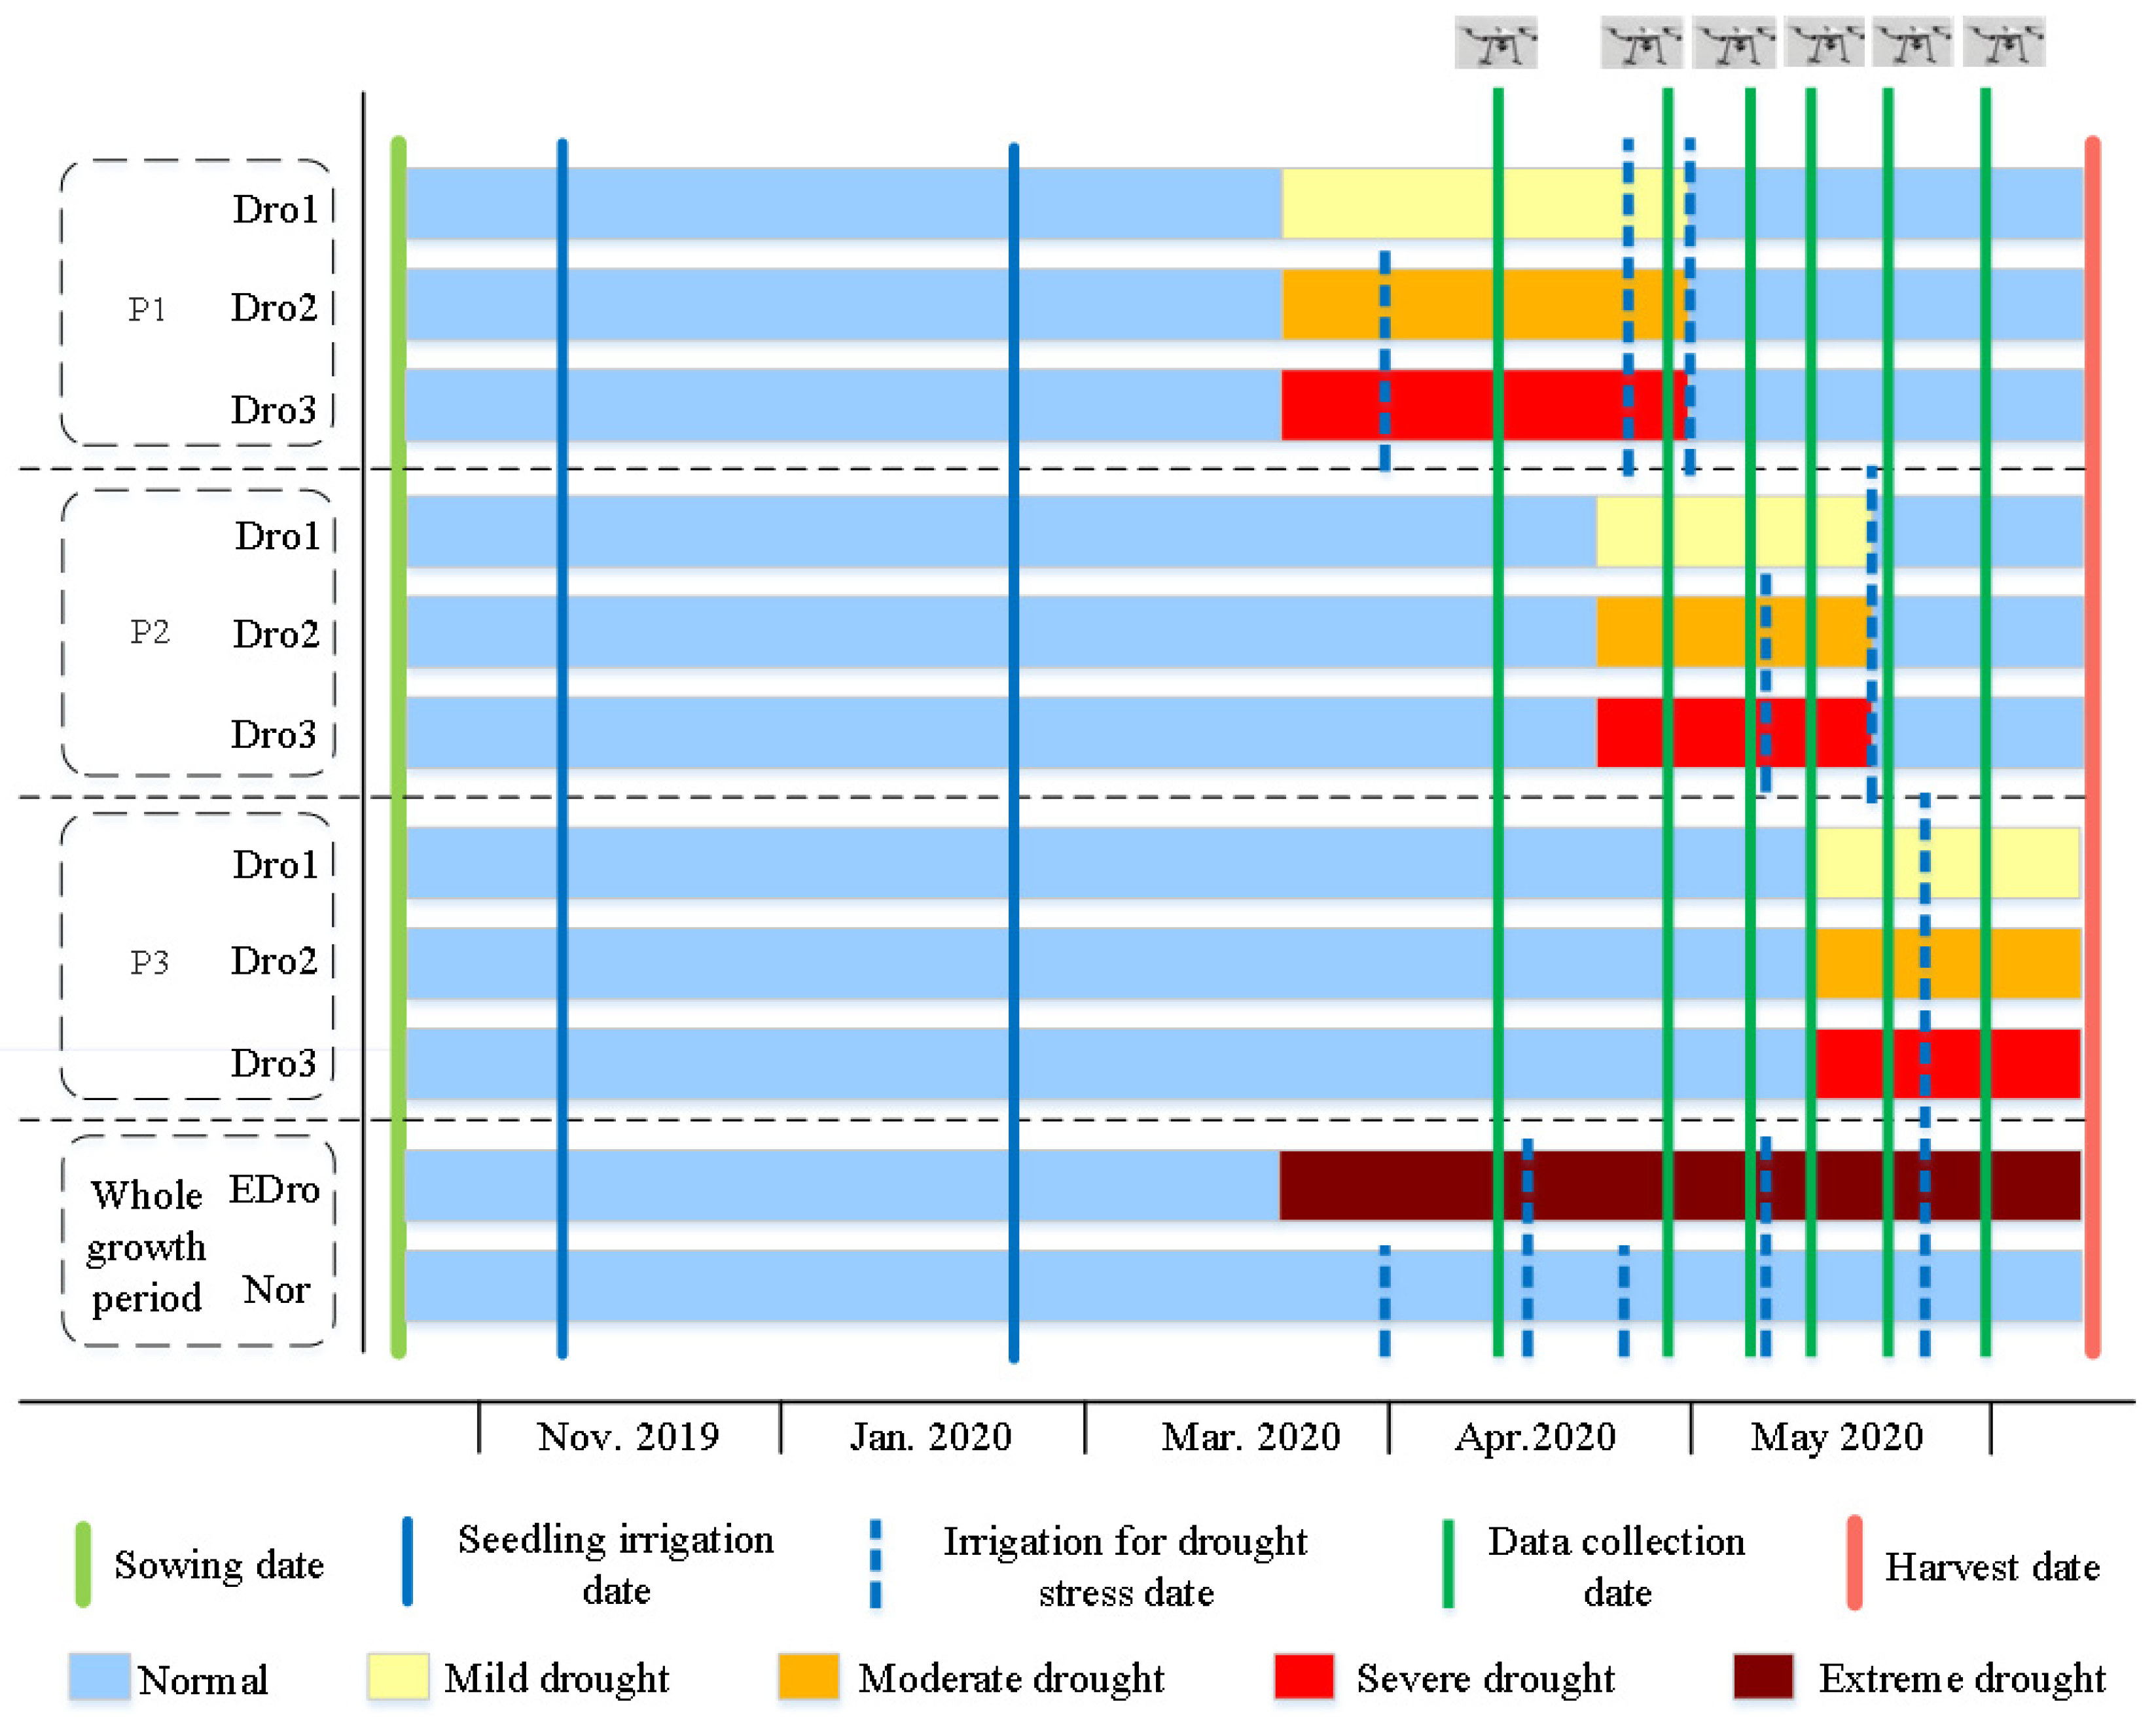
2.2.1. Experimental Method
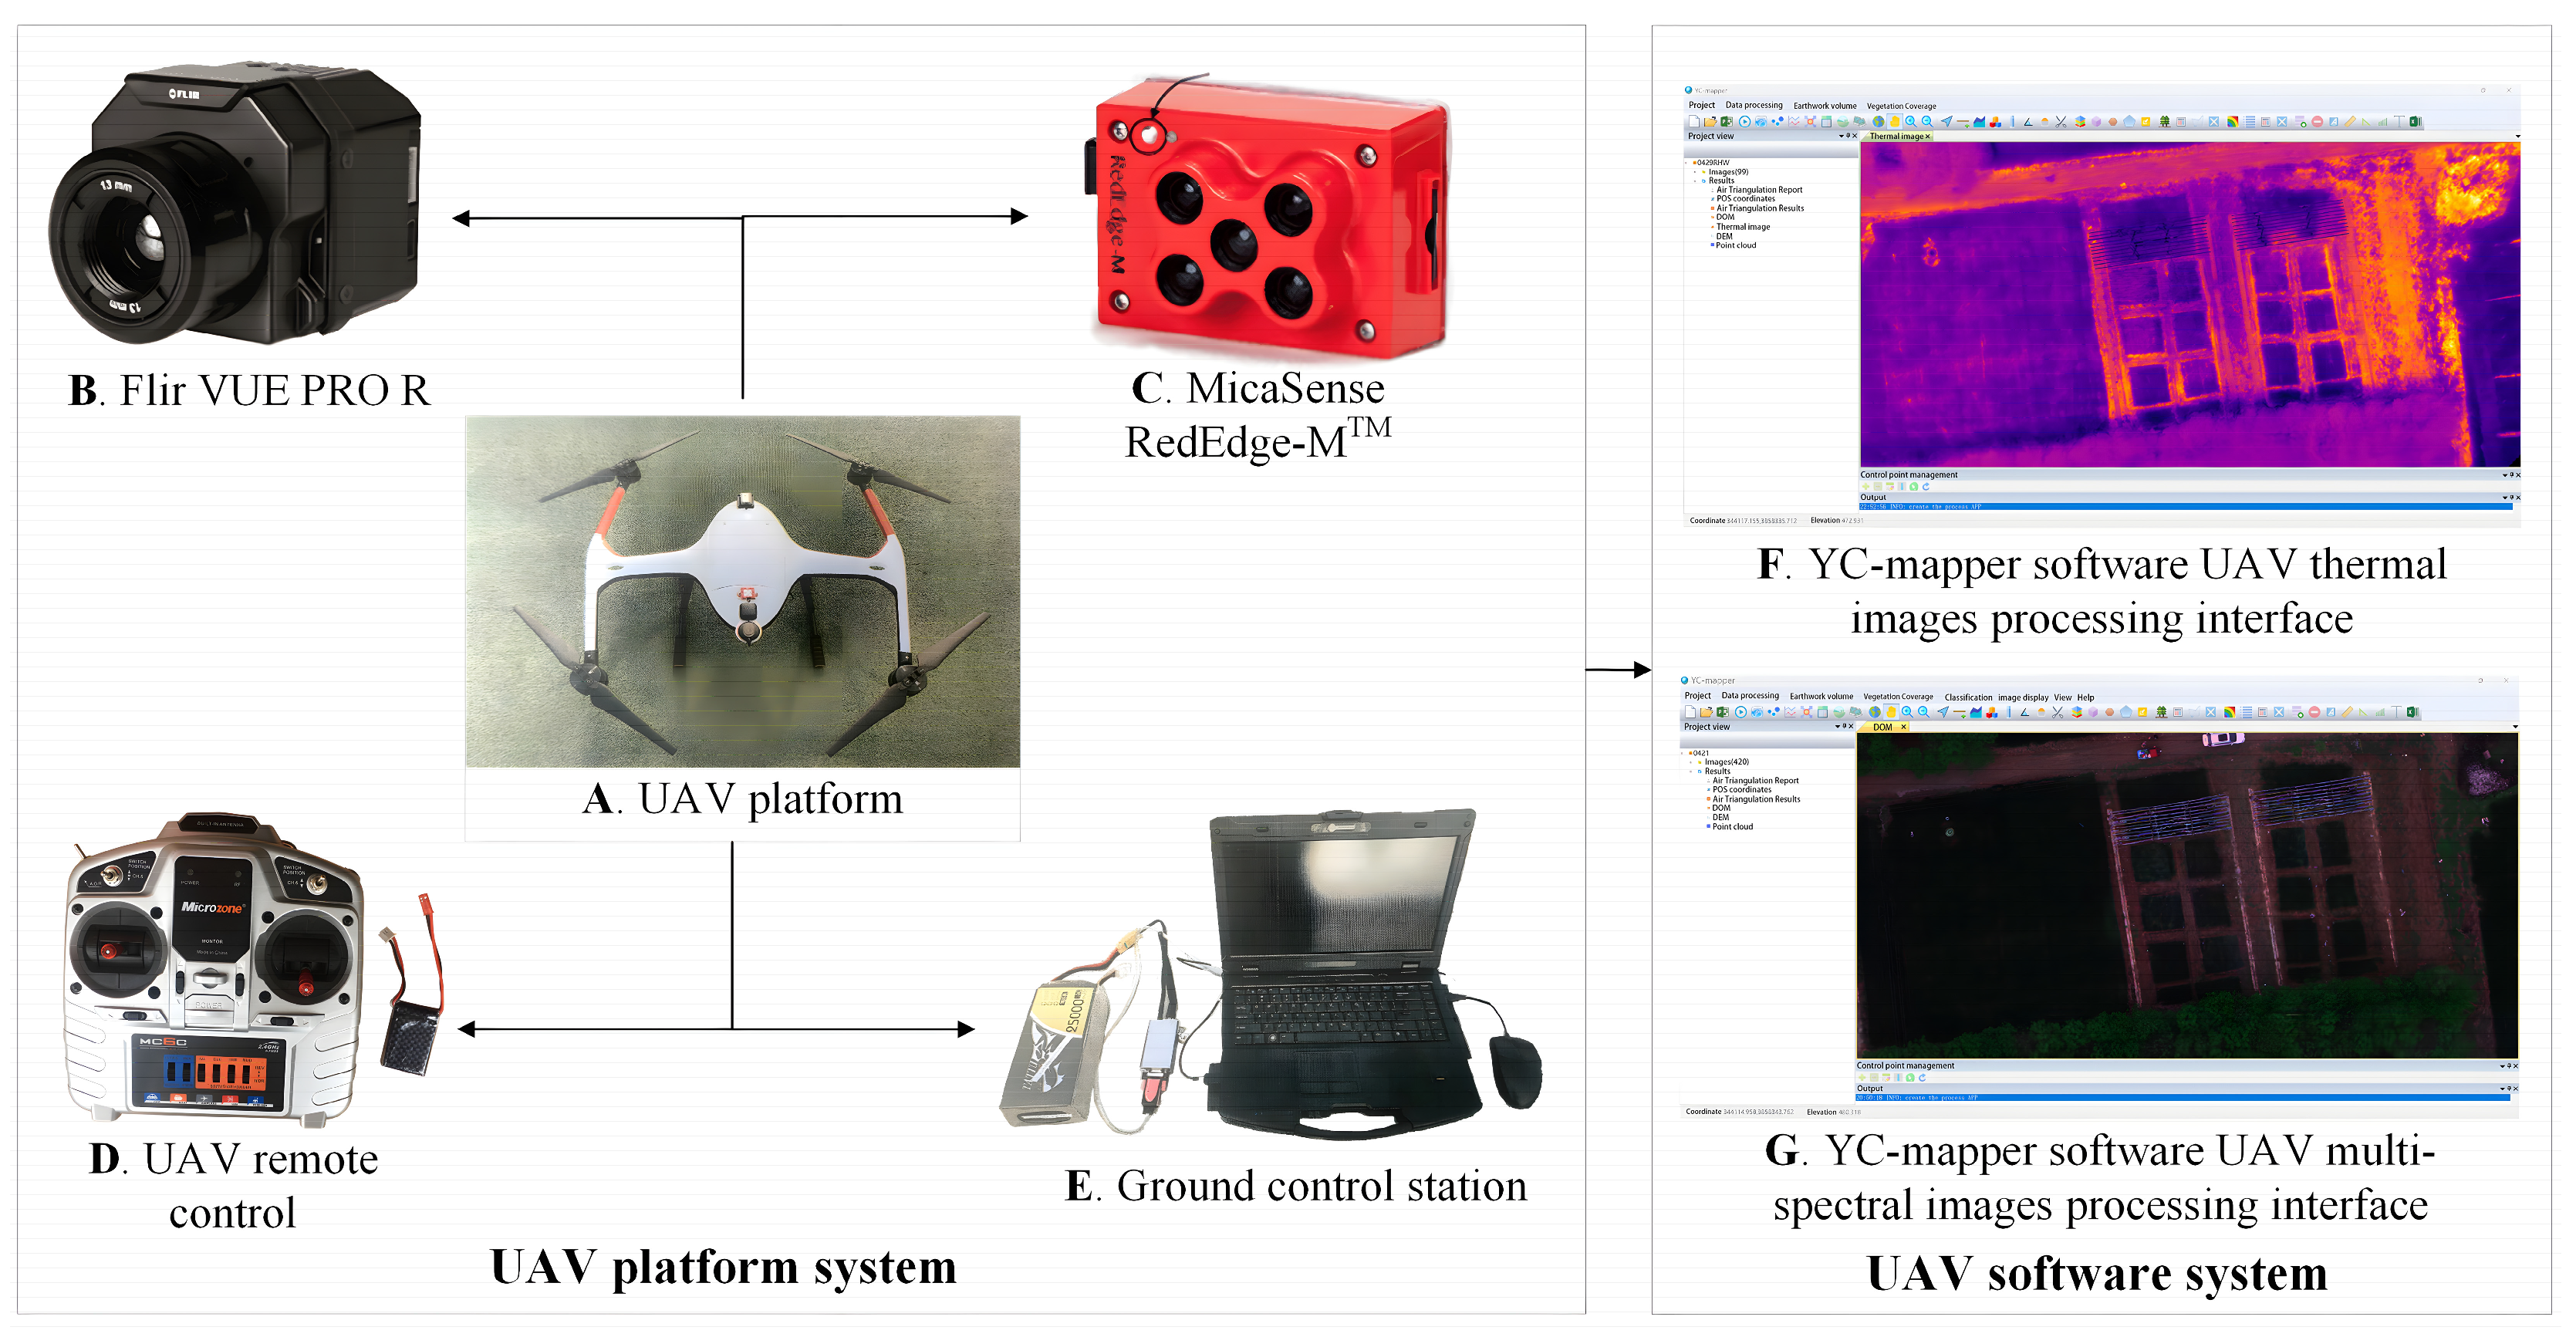
2.2.2. UAV Method
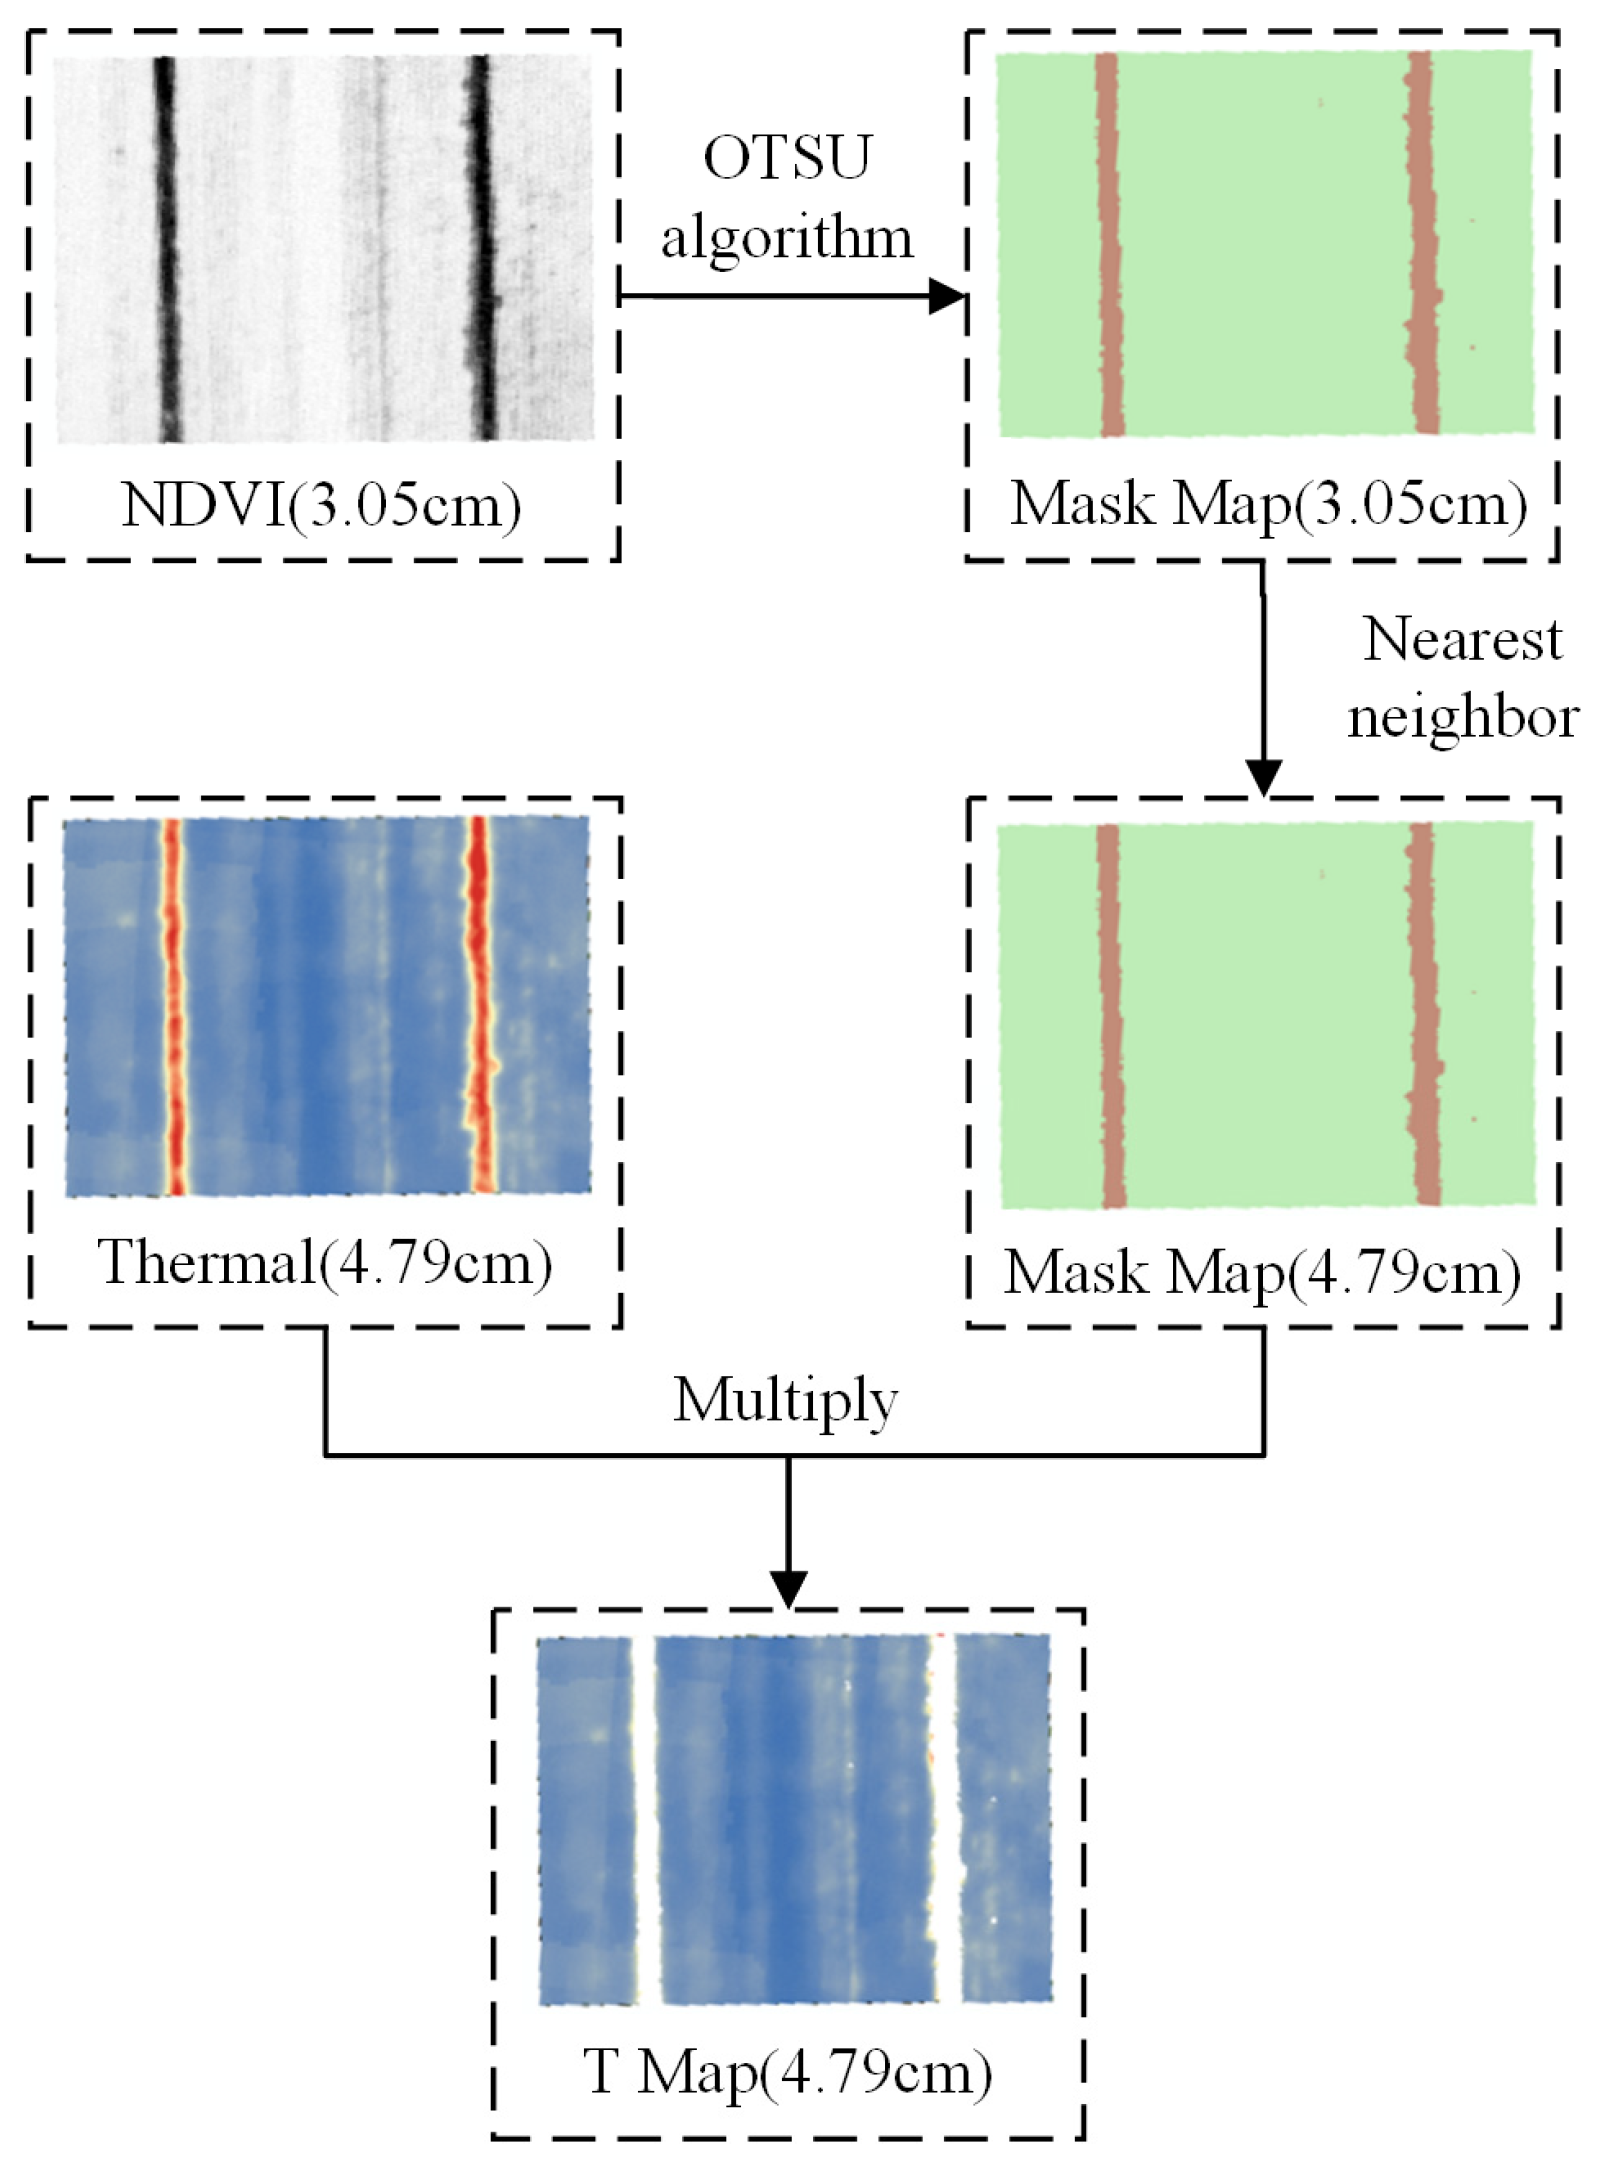
2.2.3. Tc Extraction Method
2.2.4. Tc-Based Crop Water Stress Indicators
2.2.5. Yield Calculation Method
2.2.6. Statistical Methods
2.3. Data Collection
2.3.1. UAV Data Collection
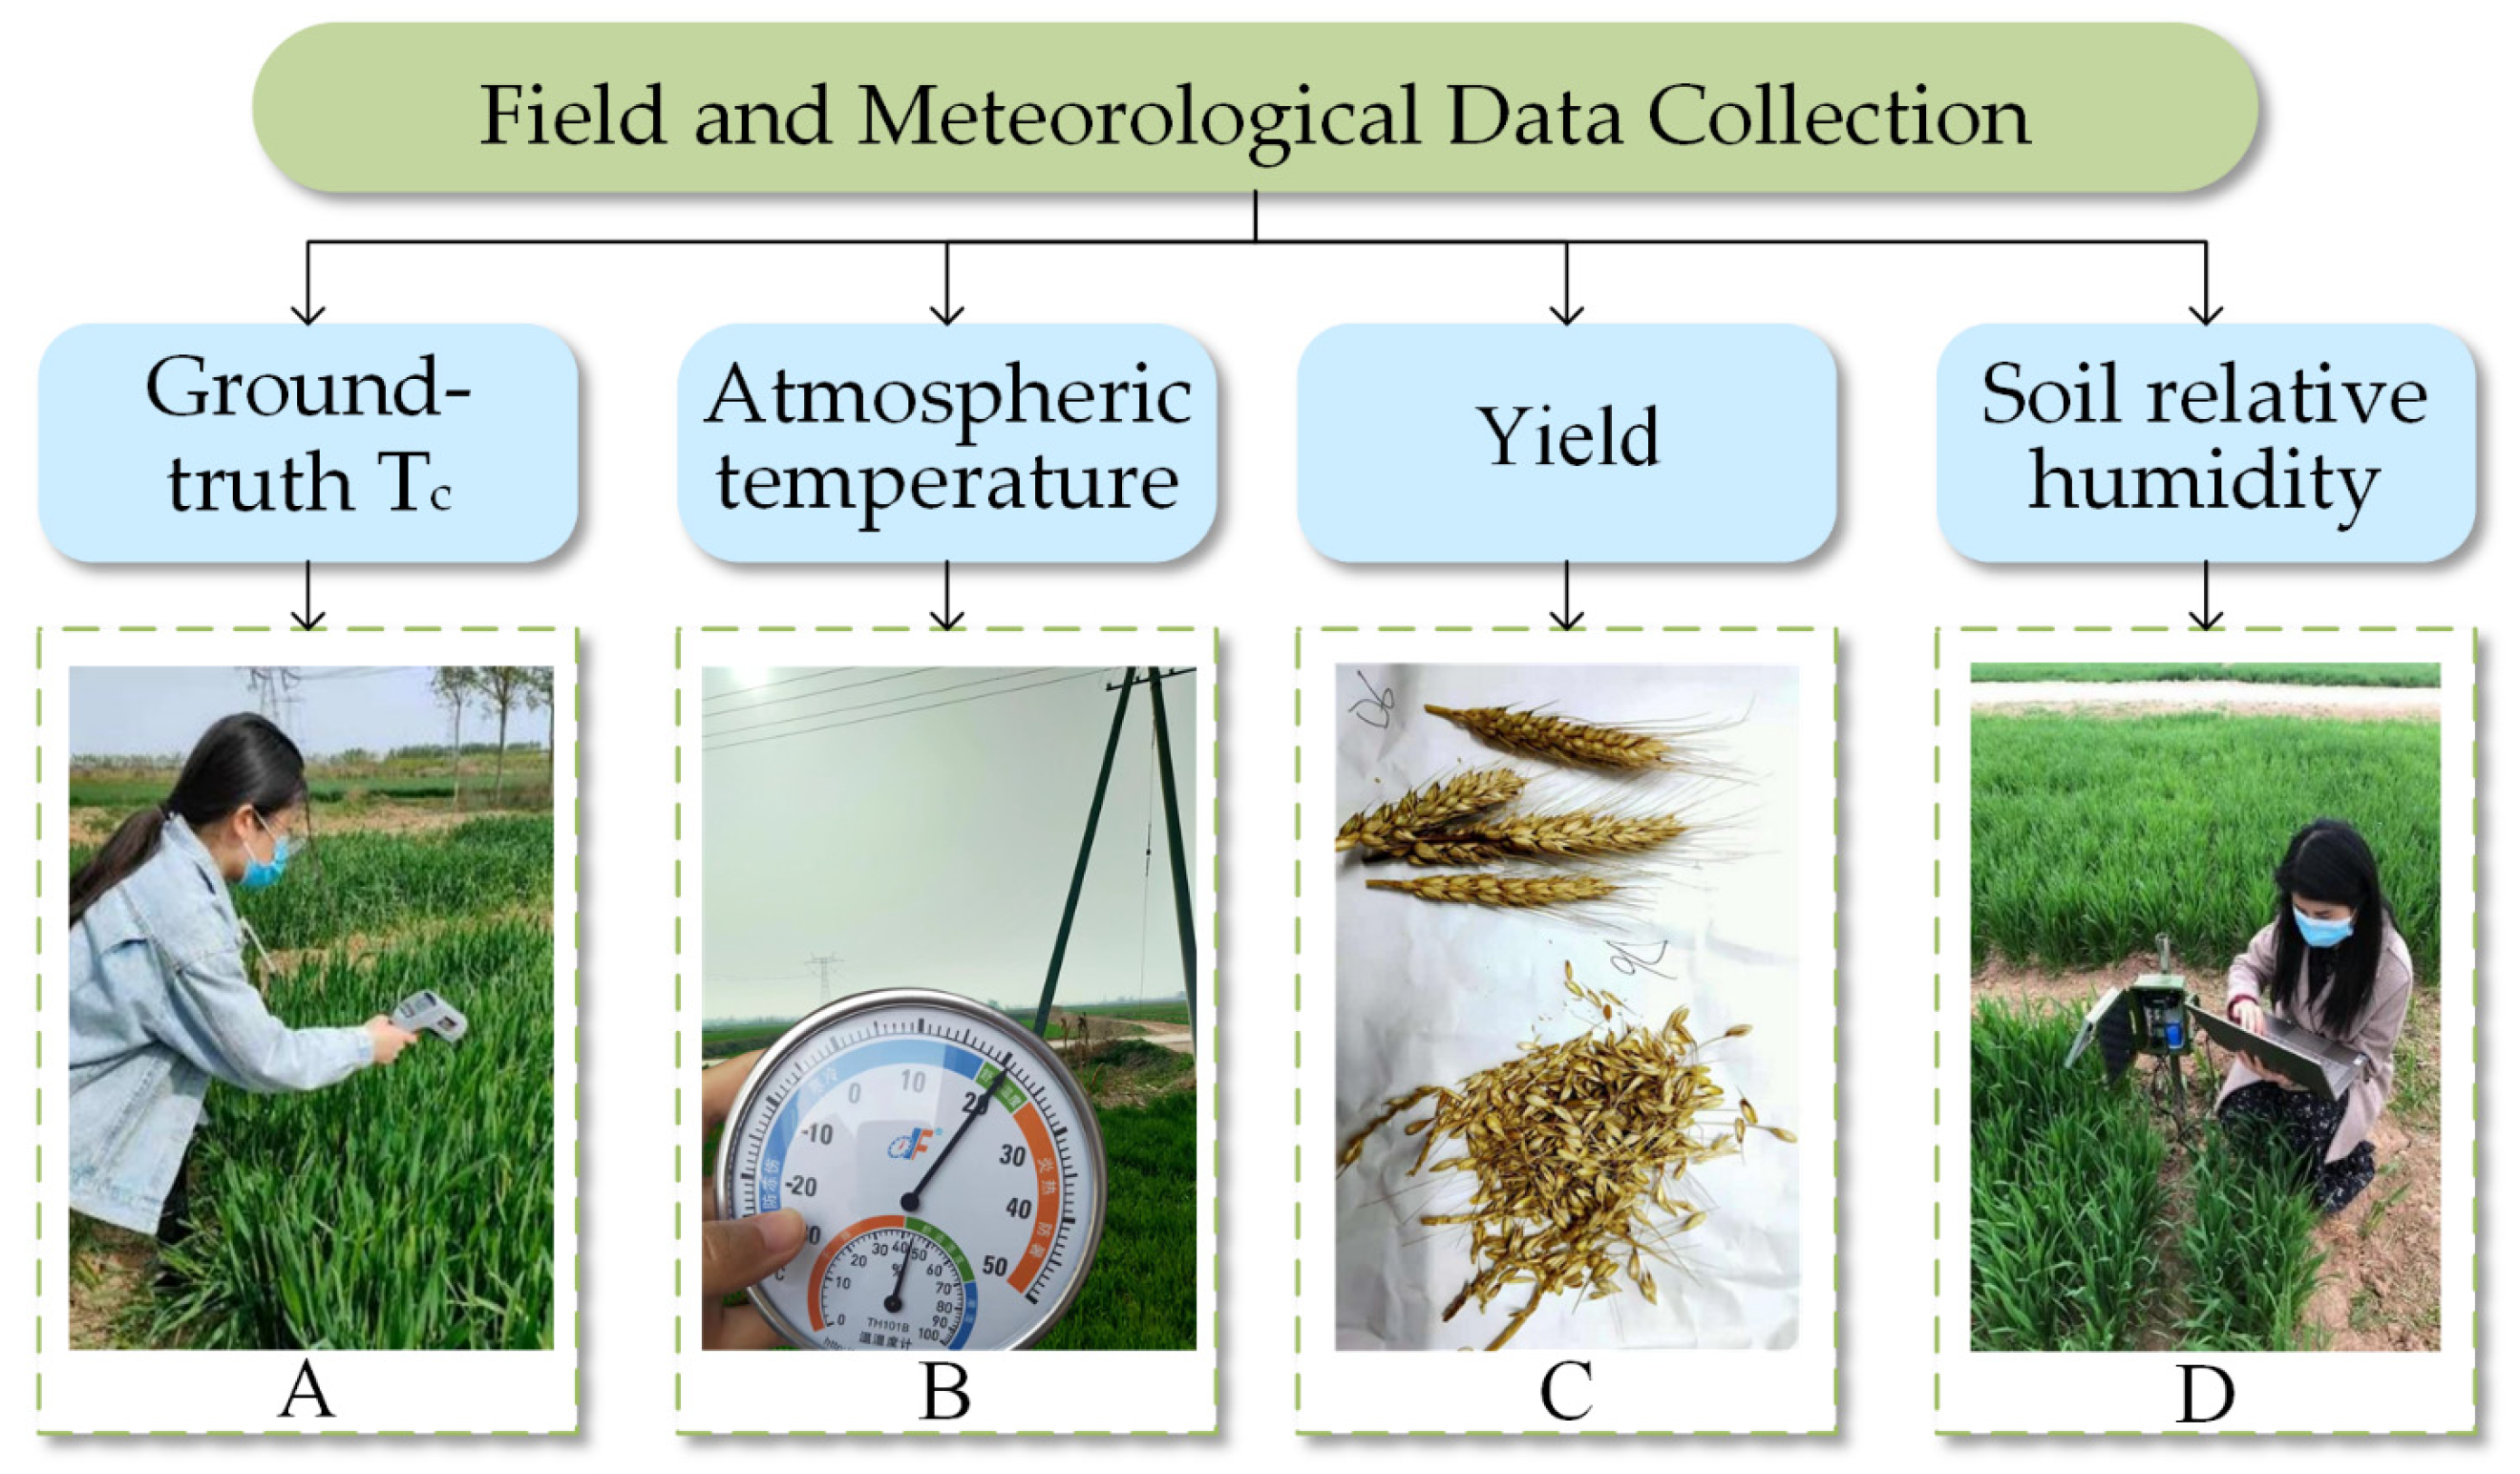
2.3.2. Field and Meteorological Data Collection
3. Results
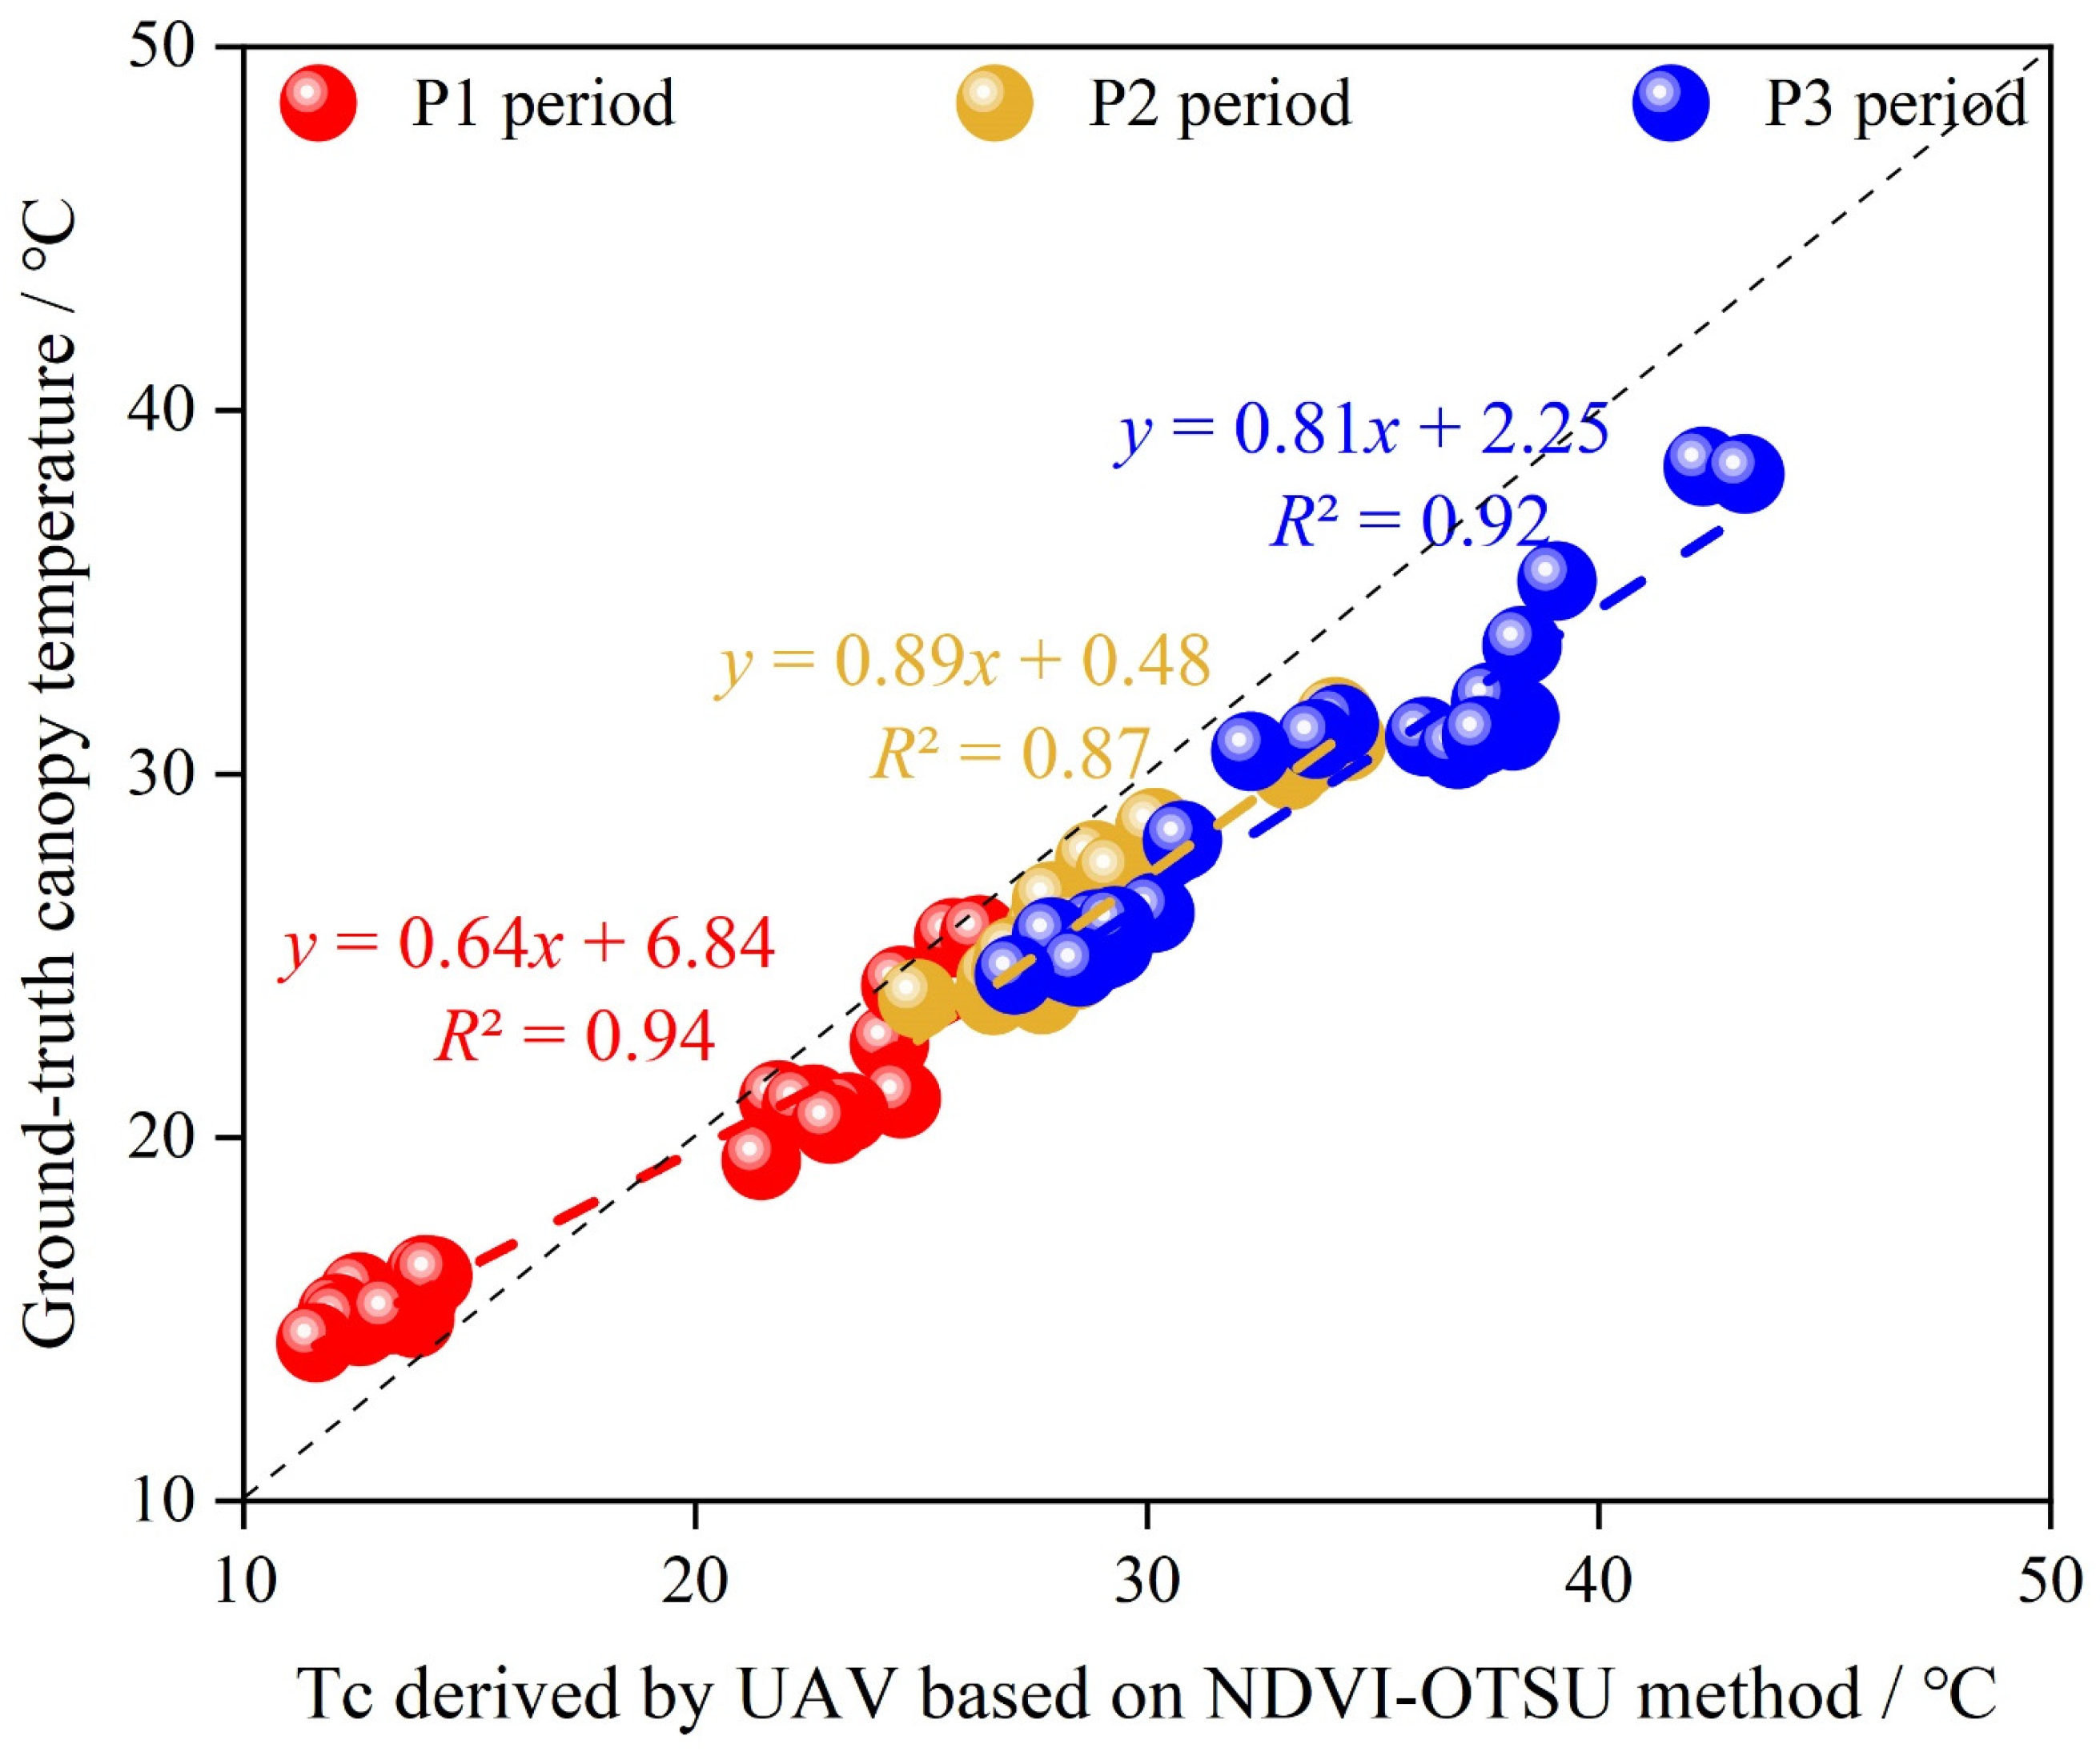
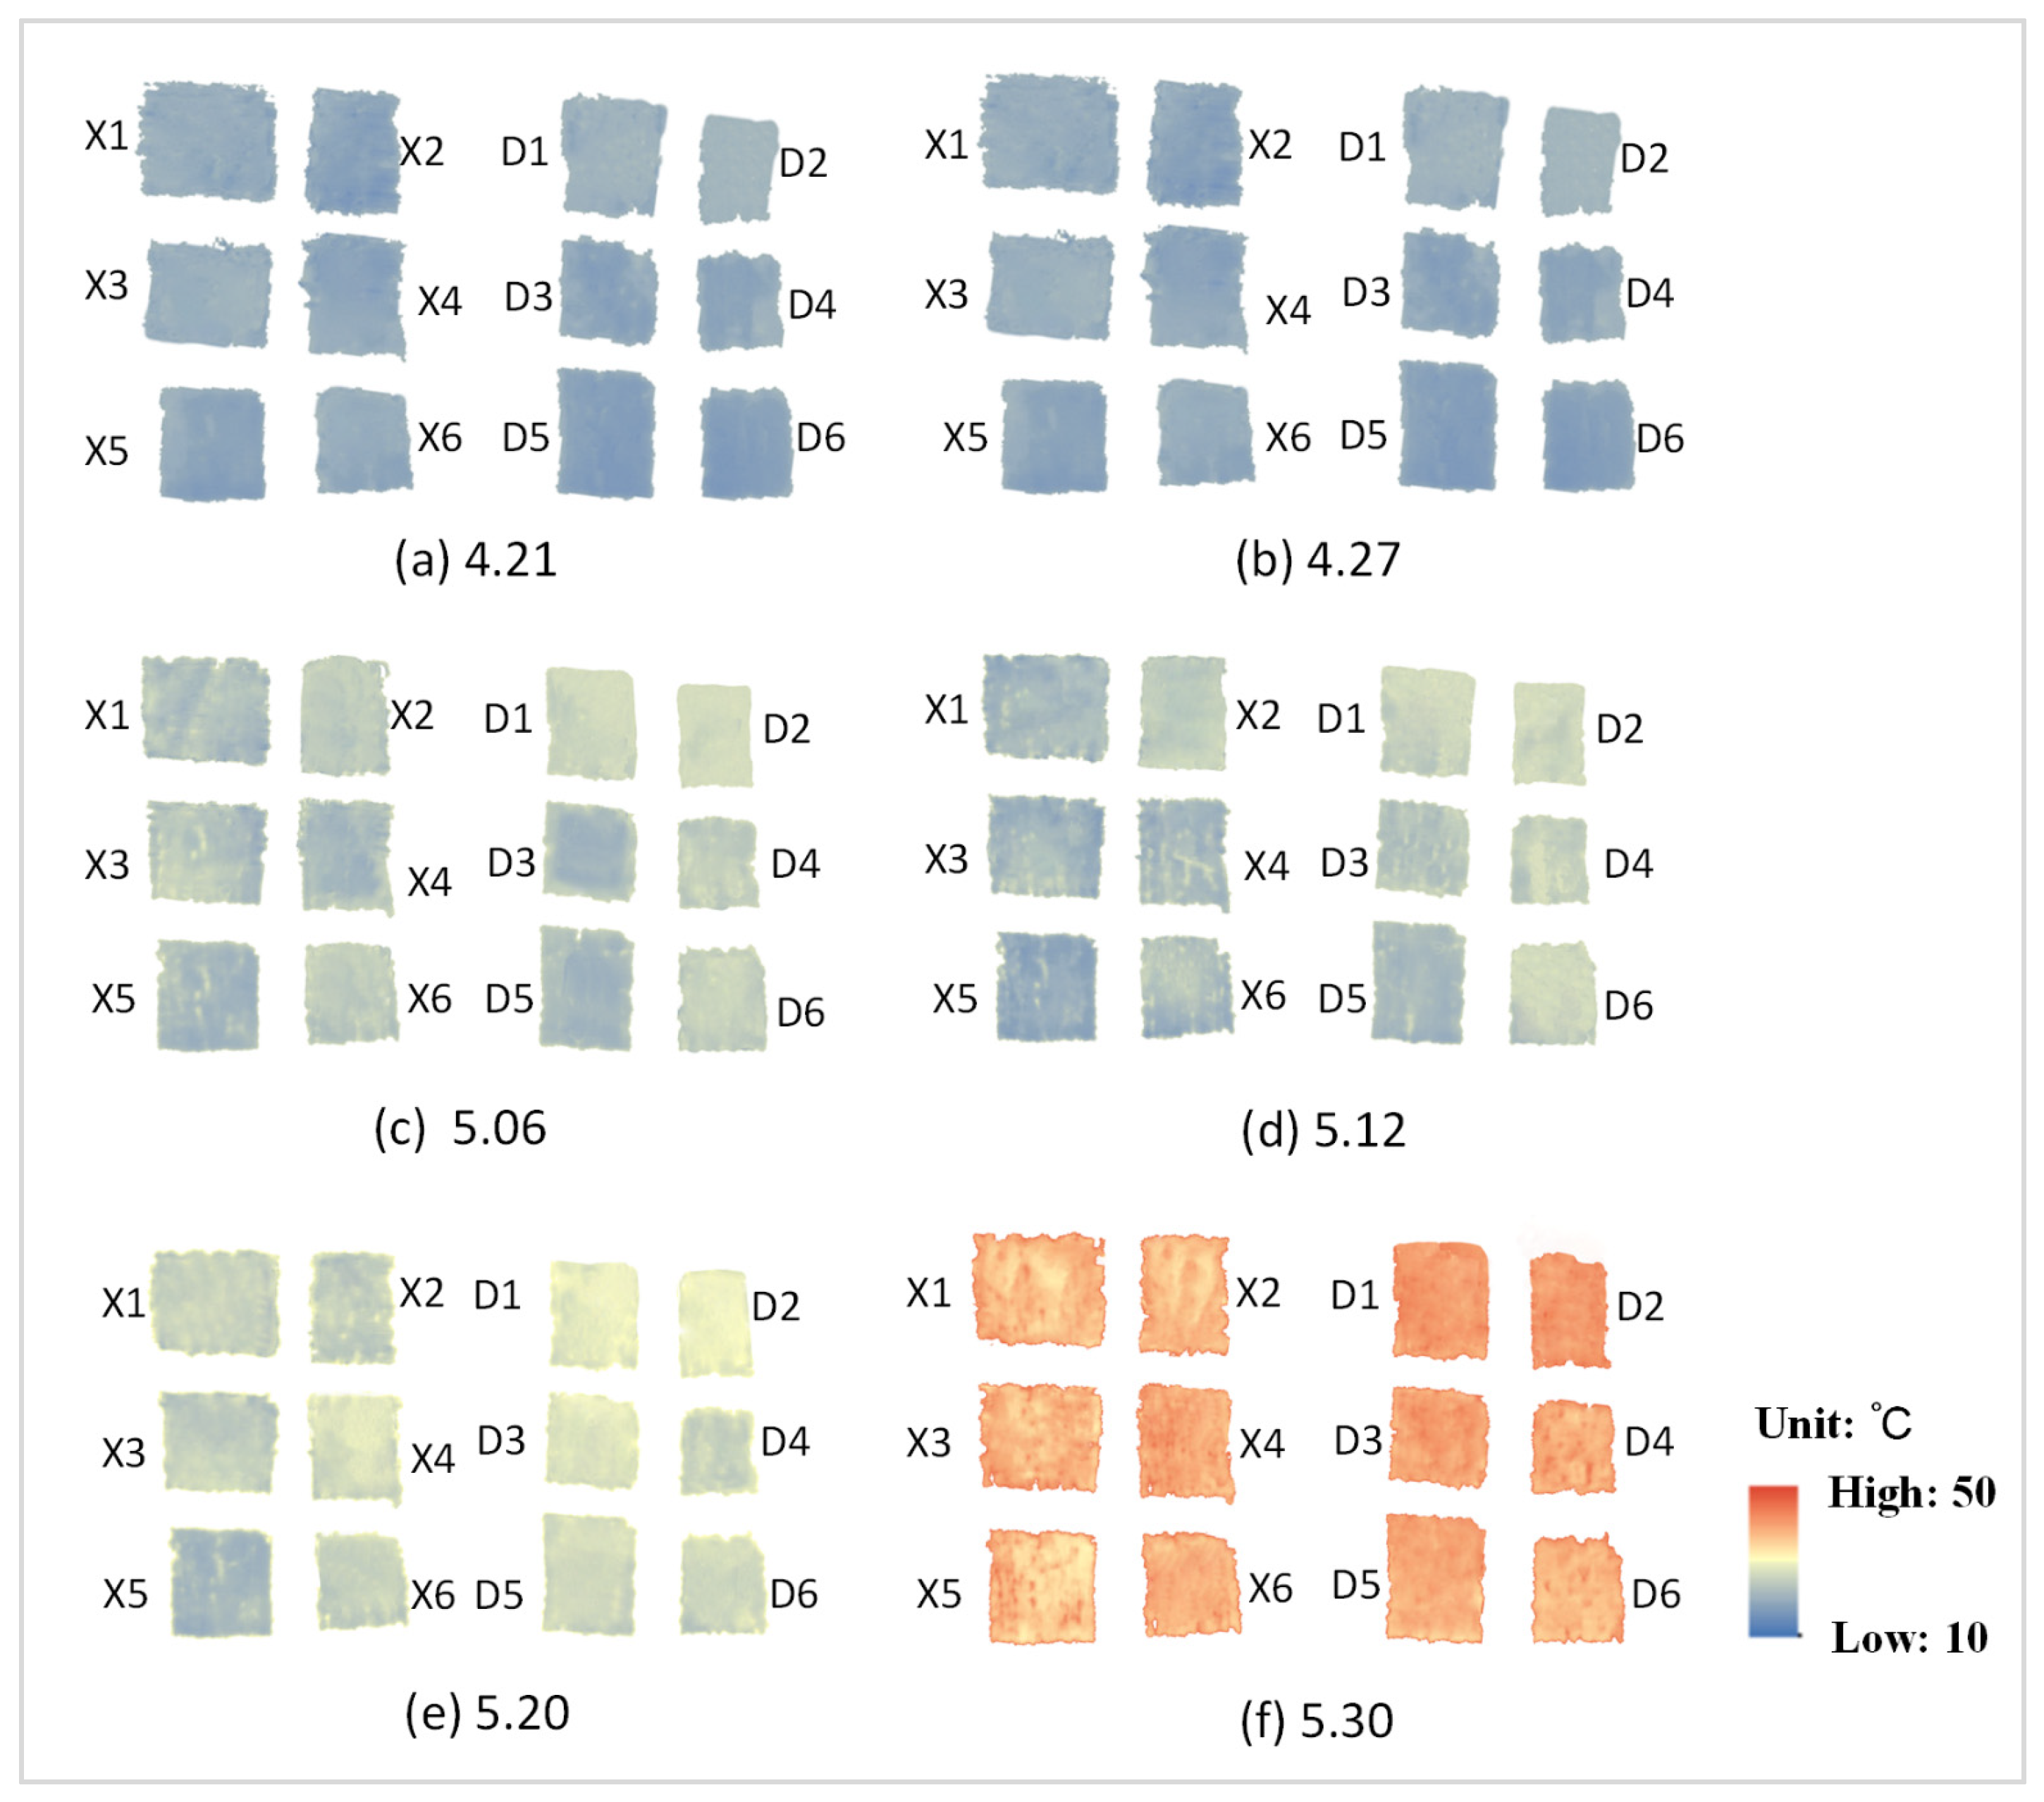
3.1. Extraction of Winter Wheat Tc
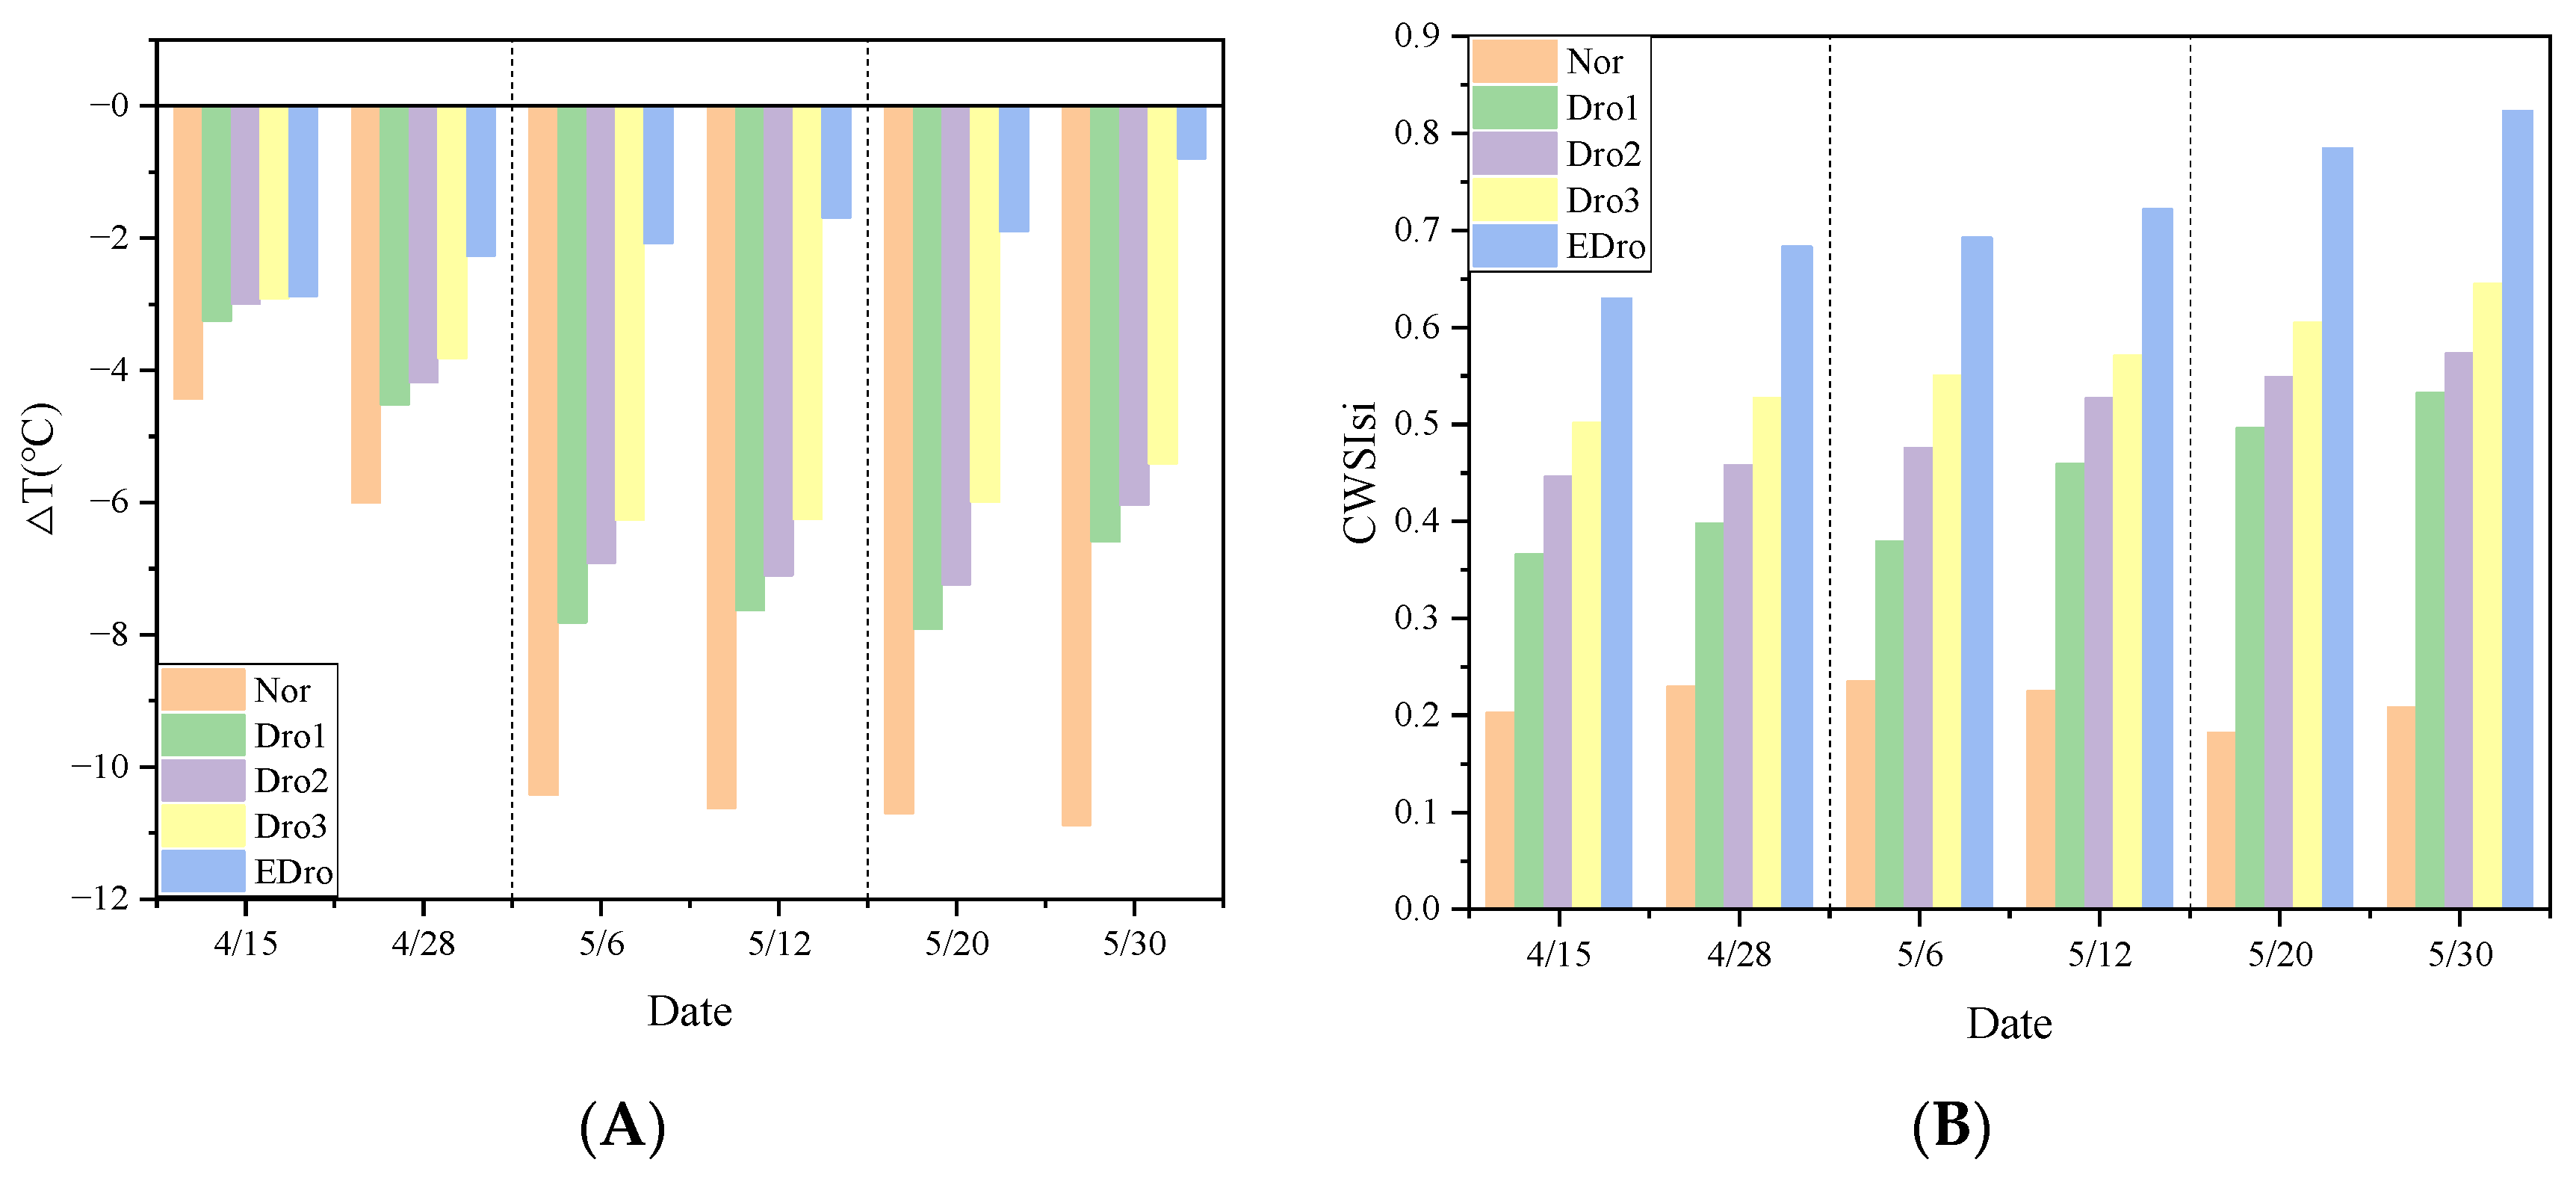
3.2. Construction of Tc-Based Crop Water Stress Indicators
3.3. Threshold of Tc-Based Crop Water Stress Indicators
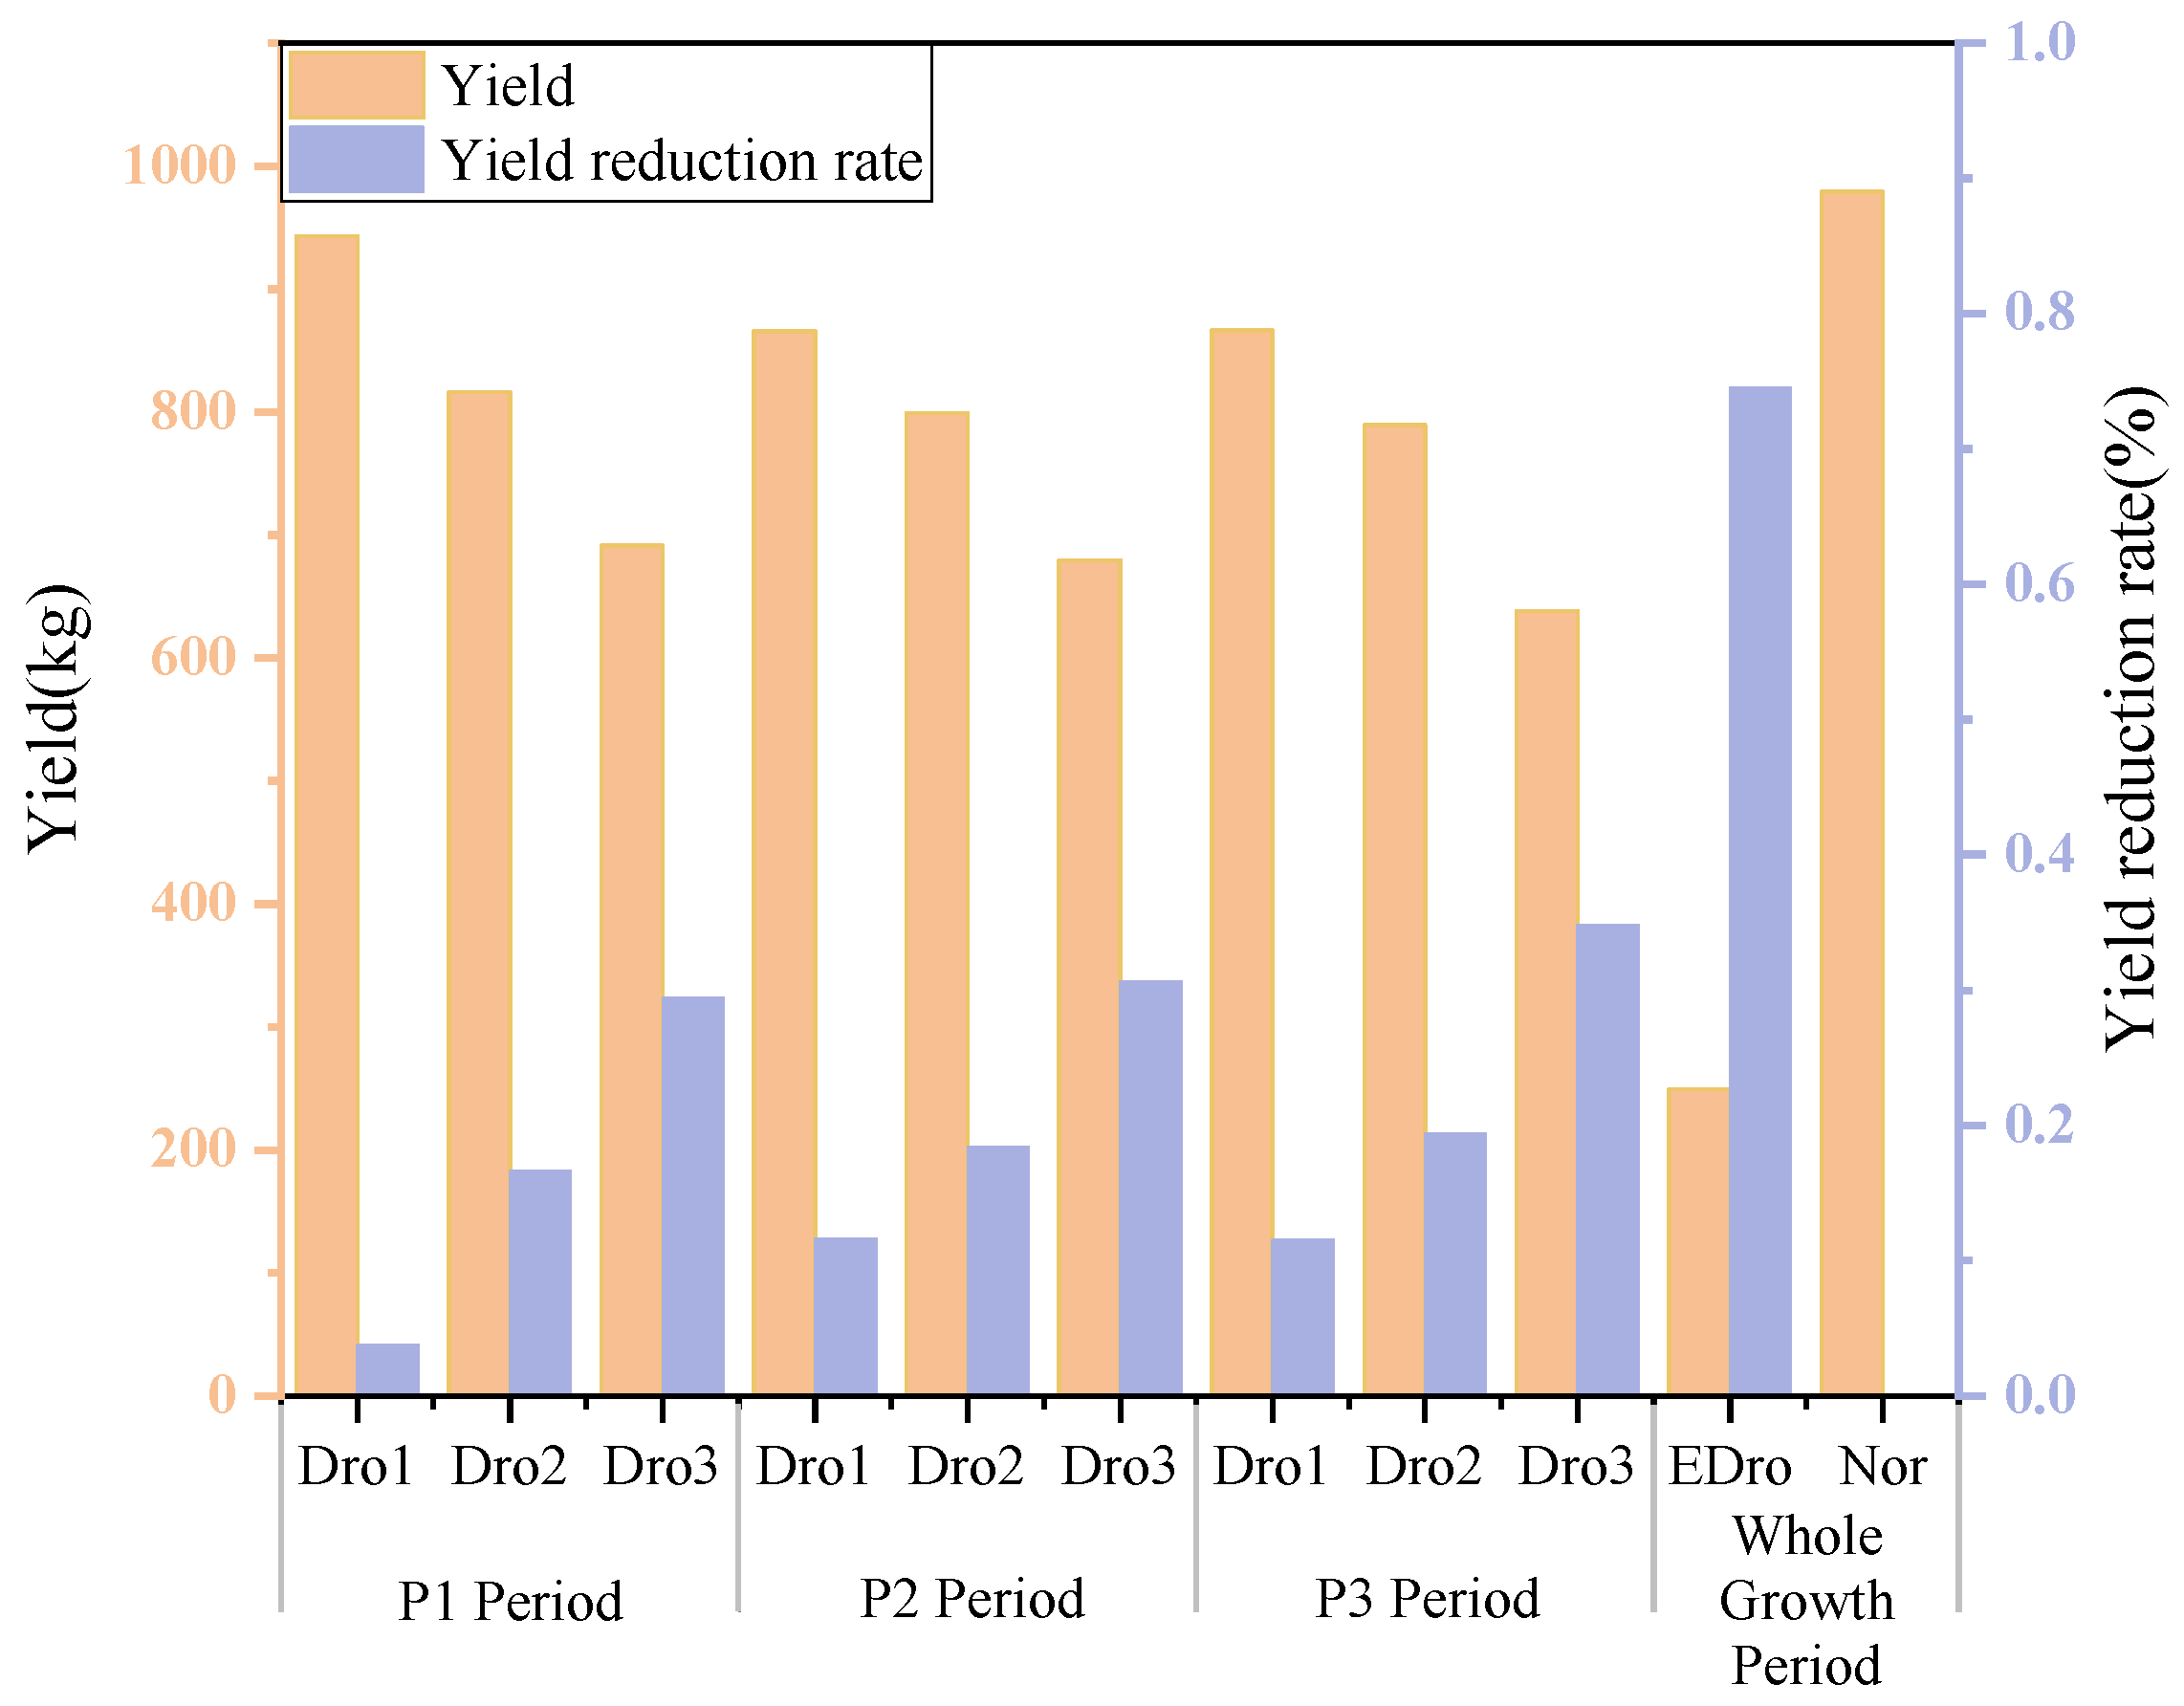
3.4. Yield
4. Discussion
4.1. Tc-Based Crop Water Stress Indicators Determined by UAV
4.2. Thresholds of Tc-Based Crop Water Stress Indicators Determined Using the UAV
4.3. Drought Disaster Monitoring
5. Conclusions
Author Contributions
Funding
Data Availability Statement
Acknowledgments
Conflicts of Interest
References
- Cai, F.; Zhang, Y.; Mi, N.; Ming, H.; Zhang, S.; Zhang, H.; Zhao, X. Maize (Zea mays L.) Physiological Responses to Drought and Rewatering, and the Associations with Water Stress Degree. Agric. Water Manag. 2020, 241, 106379. [Google Scholar] [CrossRef]
- Zhang, Q.; Shi, R.; Xu, C.-Y.; Sun, P.; Yu, H.; Zhao, J. Multisource Data-Based Integrated Drought Monitoring Index: Model Development and Application. J. Hydrol. 2022, 615, 128644. [Google Scholar] [CrossRef]
- Jiang, T.; Dou, Z.; Liu, J.; Gao, Y.; Malone, R.W.; Chen, S.; Feng, H.; Yu, Q.; Xue, G.; He, J. Simulating the Influences of Soil Water Stress on Leaf Expansion and Senescence of Winter Wheat. Agric. For. Meteorol. 2020, 291, 108061. [Google Scholar] [CrossRef]
- Livneh, B.; Badger, A.M. Drought Less Predictable under Declining Future Snowpack. Nat. Clim. Chang. 2020, 10, 452–458. [Google Scholar] [CrossRef]
- Pokhrel, Y.; Felfelani, F.; Satoh, Y.; Boulange, J.; Burek, P.; Gädeke, A.; Gerten, D.; Gosling, S.N.; Grillakis, M.; Gudmundsson, L.; et al. Global Terrestrial Water Storage and Drought Severity under Climate Change. Nat. Clim. Chang. 2021, 11, 226–233. Available online: https://www.nature.com/articles/s41558-020-00972-w (accessed on 30 November 2023). [CrossRef]
- Dorling, D. World Population Prospects at the UN: Our Numbers Are Not Our Problem? In The Struggle for Social Sustainability; Policy Press: Bristol, UK, 2021; pp. 129–154. ISBN 978-1-4473-5612-7. [Google Scholar]
- Mao, Q.; Peng, J.; Wang, Y. Resolution Enhancement of Remotely Sensed Land Surface Temperature: Current Status and Perspectives. Remote Sens. 2021, 13, 1306. [Google Scholar] [CrossRef]
- Radoglou-Grammatikis, P.; Sarigiannidis, P.; Lagkas, T.; Moscholios, I. A Compilation of UAV Applications for Precision Agriculture. Comput. Netw. 2020, 172, 107148. [Google Scholar] [CrossRef]
- Karthikeyan, L.; Chawla, I.; Mishra, A.K. A Review of Remote Sensing Applications in Agriculture for Food Security: Crop Growth and Yield, Irrigation, and Crop Losses. J. Hydrol. 2020, 586, 124905. [Google Scholar] [CrossRef]
- Chakraborty, S.; Newton, A.C. Climate Change, Plant Diseases and Food Security: An Overview. Plant Pathol. 2011, 60, 2–14. Available online: https://bsppjournals.onlinelibrary.wiley.com/doi/full/10.1111/j.1365-3059.2010.02411.x (accessed on 30 November 2023). [CrossRef]
- Laimighofer, J.; Laaha, G. How Standard Are Standardized Drought Indices? Uncertainty Components for the SPI & SPEI Case. J. Hydrol. 2022, 613, 128385. [Google Scholar] [CrossRef]
- McKee, T.B.; Doesken, N.J.; Kleist, J. The Relationship of Drought Frequency and Duration to Time Scales. In Proceedings of the Eighth Conference on Applied Climatology, Anaheim, CA, USA, 17–22 January 1993. [Google Scholar]
- Hao, Z.; AghaKouchak, A. Multivariate Standardized Drought Index: A Parametric Multi-Index Model. Adv. Water Resour. 2013, 57, 12–18. [Google Scholar] [CrossRef]
- Xie, F.; Fan, H. Deriving Drought Indices from MODIS Vegetation Indices (NDVI/EVI) and Land Surface Temperature (LST): Is Data Reconstruction Necessary? Int. J. Appl. Earth Obs. Geoinf. 2021, 101, 102352. [Google Scholar] [CrossRef]
- Ding, Y.; He, X.; Zhou, Z.; Hu, J.; Cai, H.; Wang, X.; Li, L.; Xu, J.; Shi, H. Response of Vegetation to Drought and Yield Monitoring Based on NDVI and SIF. CATENA 2022, 219, 106328. [Google Scholar] [CrossRef]
- Kirkham, M.B.; Ahring, R.M. Leaf Temperature and Internal Water Status of Wheat Grown at Different Root Temperatures1. Agron. J. 1978, 70, 657–662. Available online: https://acsess.onlinelibrary.wiley.com/doi/abs/10.2134/agronj1978.00021962007000040031x (accessed on 30 November 2023). [CrossRef]
- Zhang, R.; Zhou, Y.; Yue, Z.; Chen, X.; Cao, X.; Ai, X.; Jiang, B.; Xing, Y. The Leaf-Air Temperature Difference Reflects the Variation in Water Status and Photosynthesis of Sorghum under Waterlogged Conditions. PLoS ONE 2019, 14, e0219209. [Google Scholar] [CrossRef]
- Jiao, W.; Tian, C.; Chang, Q.; Novick, K.A.; Wang, L. A New Multi-Sensor Integrated Index for Drought Monitoring. Agric. For. Meteorol. 2019, 268, 74–85. [Google Scholar] [CrossRef]
- Bodner, G.; Nakhforoosh, A.; Kaul, H.-P. Management of Crop Water under Drought: A Review; Springer: Berlin/Heidelberg, Germany, 2015; Available online: https://link.springer.com/article/10.1007/s13593-015-0283-4 (accessed on 30 November 2023).
- Hu, T.; van Dijk, A.I.J.M.; Renzullo, L.J.; Xu, Z.; He, J.; Tian, S.; Zhou, J.; Li, H. On Agricultural Drought Monitoring in Australia Using Himawari-8 Geostationary Thermal Infrared Observations. Int. J. Appl. Earth Obs. Geoinf. 2020, 91, 102153. [Google Scholar] [CrossRef]
- Anderson, M.C.; Hain, C.; Otkin, J.; Zhan, X.; Mo, K.; Svoboda, M.; Wardlow, B.; Pimstein, A. An Intercomparison of Drought Indicators Based on Thermal Remote Sensing and NLDAS-2 Simulations with U.S. Drought Monitor Classifications. J. Hydrometeorol. 2013, 14, 1035–1056. Available online: https://journals.ametsoc.org/view/journals/hydr/14/4/jhm-d-12-0140_1.xml (accessed on 30 November 2023). [CrossRef]
- Stark, B.; Smith, B.; Chen, Y. Survey of Thermal Infrared Remote Sensing for Unmanned Aerial Systems. In Proceedings of the 2014 International Conference on Unmanned Aircraft Systems (ICUAS), Orlando, FL, USA, 27–30 May 2014; pp. 1294–1299. [Google Scholar]
- Zhang, Z.; Xu, W.; Shi, Z.; Qin, Q. Establishment of a Comprehensive Drought Monitoring Index Based on Multisource Remote Sensing Data and Agricultural Drought Monitoring. IEEE J. Sel. Top. Appl. Earth Obs. Remote Sens. 2021, 14, 2113–2126. [Google Scholar] [CrossRef]
- Liu, X.; Zhu, X.; Pan, Y.; Li, S.; Liu, Y.; Ma, Y. Agricultural Drought Monitoring: Progress, Challenges, and Prospects. J. Geogr. Sci. 2016, 26, 750–767. [Google Scholar] [CrossRef]
- Park, S.; Im, J.; Jang, E.; Rhee, J. Drought Assessment and Monitoring through Blending of Multi-Sensor Indices Using Machine Learning Approaches for Different Climate Regions. Agric. For. Meteorol. 2016, 216, 157–169. [Google Scholar] [CrossRef]
- Park, S.; Im, J.; Park, S.; Rhee, J. Drought Monitoring Using High Resolution Soil Moisture through Multi-Sensor Satellite Data Fusion over the Korean Peninsula. Agric. For. Meteorol. 2017, 237–238, 257–269. [Google Scholar] [CrossRef]
- Wang, Z.; Li, J.; Lai, C.; Huang, Z.; Zhong, R.; Zeng, Z.; Chen, X. Increasing Drought Has Been Observed by SPEI_pm in Southwest China during 1962–2012. Theor. Appl. Climatol. 2018, 133, 23–38. Available online: https://link.springer.com/article/10.1007/s00704-017-2152-3 (accessed on 1 December 2023). [CrossRef]
- Crocetti, L.; Forkel, M.; Fischer, M.; Jurečka, F.; Grlj, A.; Salentinig, A.; Trnka, M.; Anderson, M.; Ng, W.-T.; Kokalj, Ž.; et al. Earth Observation for Agricultural Drought Monitoring in the Pannonian Basin (Southeastern Europe): Current State and Future Directions. Reg Environ. Chang. 2020, 20, 123. [Google Scholar] [CrossRef]
- Matese, A.; Baraldi, R.; Berton, A.; Cesaraccio, C.; Di Gennaro, S.F.; Duce, P.; Facini, O.; Mameli, M.G.; Piga, A.; Zaldei, A. Estimation of Water Stress in Grapevines Using Proximal and Remote Sensing Methods. Remote Sens. 2018, 10, 114. [Google Scholar] [CrossRef]
- Berger, K.; Machwitz, M.; Kycko, M.; Kefauver, S.C.; Van Wittenberghe, S.; Gerhards, M.; Verrelst, J.; Atzberger, C.; van der Tol, C.; Damm, A.; et al. Multi-Sensor Spectral Synergies for Crop Stress Detection and Monitoring in the Optical Domain: A Review. Remote Sens. Environ. 2022, 280, 113198. [Google Scholar] [CrossRef]
- Bian, Z.; Roujean, J.L.; Fan, T.; Dong, Y.; Hu, T.; Cao, B.; Li, H.; Du, Y.; Xiao, Q.; Liu, Q. An Angular Normalization Method for Temperature Vegetation Dryness Index (TVDI) in Monitoring Agricultural Drought. Remote Sens. Environ. 2023, 284, 113330. [Google Scholar] [CrossRef]
- Veysi, S.; Naseri, A.A.; Hamzeh, S.; Bartholomeus, H. A Satellite Based Crop Water Stress Index for Irrigation Scheduling in Sugarcane Fields. Agric. Water Manag. 2017, 189, 70–86. [Google Scholar] [CrossRef]
- Asner, G.P.; Brodrick, P.G.; Anderson, C.B.; Vaughn, N.; Knapp, D.E.; Martin, R.E. Progressive Forest Canopy Water Loss during the 2012–2015 California Drought. Proc. Natl. Acad. Sci. USA 2016, 113, E249–E255. [Google Scholar] [CrossRef]
- Yang, Y.; Anderson, M.C.; Gao, F.; Wood, J.D.; Gu, L.; Hain, C. Studying Drought-Induced Forest Mortality Using High Spatiotemporal Resolution Evapotranspiration Data from Thermal Satellite Imaging. Remote Sens. Environ. 2021, 265, 112640. [Google Scholar] [CrossRef]
- Javed, T.; Li, Y.; Rashid, S.; Li, F.; Hu, Q.; Feng, H.; Chen, X.; Ahmad, S.; Liu, F.; Pulatov, B. Performance and Relationship of Four Different Agricultural Drought Indices for Drought Monitoring in China’s Mainland Using Remote Sensing Data. Sci. Total Environ. 2021, 759, 143530. [Google Scholar] [CrossRef]
- Liu, Y.; Shan, F.; Yue, H.; Wang, X.; Fan, Y. Global Analysis of the Correlation and Propagation among Meteorological, Agricultural, Surface Water, and Groundwater Droughts. J. Environ. Manag. 2023, 333, 117460. [Google Scholar] [CrossRef]
- Liu, Y.; Dang, C.; Yue, H.; Lyu, C.; Dang, X. Enhanced Drought Detection and Monitoring Using Sun-Induced Chlorophyll Fluorescence over Hulun Buir Grassland, China. Sci. Total Environ. 2021, 770, 145271. [Google Scholar] [CrossRef]
- Liu, Y.; Shan, F.; Yue, H.; Wang, X. Characteristics of Drought Propagation and Effects of Water Resources on Vegetation in the Karst Area of Southwest China. Sci. Total Environ. 2023, 891, 164663. [Google Scholar] [CrossRef]
- Liu, Y.; Yu, X.; Dang, C.; Yue, H.; Wang, X.; Niu, H.; Zu, P.; Cao, M. A dryness index TSWDI based on land surface temperature, sun-induced chlorophyll fluorescence, and water balance. ISPRS J. Photogramm. Remote Sens. 2023, 202, 581–598. [Google Scholar] [CrossRef]
- Ghazaryan, G.; Dubovyk, O.; Graw, V.; Kussul, N.; Schellberg, J. Local-Scale Agricultural Drought Monitoring with Satellite-Based Multi-Sensor Time-Series. GIScience Remote Sens. 2020, 57, 704–718. [Google Scholar] [CrossRef]
- Ashraf, M.; Ullah, K.; Adnan, S. Satellite Based Impact Assessment of Temperature and Rainfall Variability on Drought Indices in Southern Pakistan. Int. J. Appl. Earth Obs. Geoinf. 2022, 108, 102726. [Google Scholar] [CrossRef]
- Sagan, V.; Maimaitijiang, M.; Sidike, P.; Eblimit, K.; Peterson, K.T.; Hartling, S.; Esposito, F.; Khanal, K.; Newcomb, M.; Pauli, D.; et al. UAV-Based High Resolution Thermal Imaging for Vegetation Monitoring, and Plant Phenotyping Using ICI 8640 P, FLIR Vue Pro R 640, and thermoMap Cameras. Remote Sens. 2019, 11, 330. [Google Scholar] [CrossRef]
- Mulla, D.J. Twenty Five Years of Remote Sensing in Precision Agriculture: Key Advances and Remaining Knowledge Gaps-ScienceDirect. Biosyst. Eng. 2013, 114, 358–371. Available online: https://www.sciencedirect.com/science/article/abs/pii/S1537511012001419 (accessed on 1 December 2023). [CrossRef]
- Zaman-Allah, M.; Vergara, O.; Araus, J.L.; Tarekegne, A.; Magorokosho, C.; Zarco-Tejada, P.J.; Hornero, A.; Albà, A.H.; Das, B.; Craufurd, P.; et al. Unmanned Aerial Platform-Based Multi-Spectral Imaging for Field Phenotyping of Maize. Plant Methods 2015, 11, 35. Available online: https://plantmethods.biomedcentral.com/articles/10.1186/s13007-015-0078-2 (accessed on 1 December 2023). [CrossRef]
- Das, S.; Christopher, J.; Roy Choudhury, M.; Apan, A.; Chapman, S.; Menzies, N.W.; Dang, Y.P. Evaluation of Drought Tolerance of Wheat Genotypes in Rain-Fed Sodic Soil Environments Using High-Resolution UAV Remote Sensing Techniques. Biosyst. Eng. 2022, 217, 68–82. [Google Scholar] [CrossRef]
- Cheng, M.; Sun, C.; Nie, C.; Liu, S.; Yu, X.; Bai, Y.; Liu, Y.; Meng, L.; Jia, X.; Liu, Y.; et al. Evaluation of UAV-Based Drought Indices for Crop Water Conditions Monitoring: A Case Study of Summer Maize. Agric. Water Manag. 2023, 287, 108442. [Google Scholar] [CrossRef]
- Tucci, G.; Parisi, E.I.; Castelli, G.; Errico, A.; Corongiu, M.; Sona, G.; Viviani, E.; Bresci, E.; Preti, F. Multi-Sensor UAV Application for Thermal Analysis on a Dry-Stone Terraced Vineyard in Rural Tuscany Landscape. ISPRS Int. J. Geo-Inf. 2019, 8, 87. [Google Scholar] [CrossRef]
- Quebrajo, L.; Perez-Ruiz, M.; Pérez-Urrestarazu, L.; Martínez, G.; Egea, G. Linking Thermal Imaging and Soil Remote Sensing to Enhance Irrigation Management of Sugar Beet. Biosyst. Eng. 2018, 165, 77–87. [Google Scholar] [CrossRef]
- Su, J.; Coombes, M.; Liu, C.; Zhu, Y.; Song, X.; Fang, S.; Guo, L.; Chen, W.-H. Machine Learning-Based Crop Drought Mapping System by UAV Remote Sensing RGB Imagery. Unmanned Syst. 2020, 08, 71–83. [Google Scholar] [CrossRef]
- Sun, Z.; Wang, X.; Wang, Z.; Yang, L.; Xie, Y.; Huang, Y. UAVs as Remote Sensing Platforms in Plant Ecology: Review of Applications and Challenges. J. Plant Ecol. 2021, 14, 1003–1023. Available online: https://academic.oup.com/jpe/article/14/6/1003/6355612?login=false (accessed on 4 February 2024). [CrossRef]
- Guo, Y.; Chen, S.; Li, X.; Cunha, M.; Jayavelu, S.; Cammarano, D.; Fu, Y. Machine Learning-Based Approaches for Predicting SPAD Values of Maize Using Multi-Spectral Images. Remote Sens. 2022, 14, 1337. [Google Scholar] [CrossRef]
- Pádua, L.; Marques, P.; Adão, T.; Guimarães, N.; Sousa, A.; Peres, E.; Sousa, J.J. Vineyard Variability Analysis through UAV-Based Vigour Maps to Assess Climate Change Impacts. Agronomy 2019, 9, 581. [Google Scholar] [CrossRef]
- Zhou, J.; Zhou, J.; Ye, H.; Ali, M.L.; Nguyen, H.T.; Chen, P. Classification of Soybean Leaf Wilting Due to Drought Stress Using UAV-Based Imagery. Comput. Electron. Agric. 2020, 175, 105576. [Google Scholar] [CrossRef]
- Qin, W.; Wang, J.; Ma, L.; Wang, F.; Hu, N.; Yang, X.; Xiao, Y.; Zhang, Y.; Sun, Z.; Wang, Z.; et al. UAV-Based Multi-Temporal Thermal Imaging to Evaluate Wheat Drought Resistance in Different Deficit Irrigation Regimes. Remote Sens. 2022, 14, 5608. [Google Scholar] [CrossRef]
- NY/T 2283-2012; Technical Specifications for Field Investigation and Leveling of Winter Wheat Disasters. Chinese Academy of Agricultural Sciences: Beijing, China, 2012.
- Otsu, N. A Threshold Selection Method from Gray-Level Histograms. IEEE Trans. Syst. Man Cybern. 1979, 9, 62–66. [Google Scholar] [CrossRef]
- Freden, S.C.; Mercanti, E.P.; Becker, M.A. Third Earth Resources Technology Satellite-1 Symposium: Section A-B. Technical Presentations; Scientific and Technical Information Office, National Aeronautics and Space Administration: Washington, DC, USA, 1974.
- Li, S.; Xu, L.; Jing, Y.; Yin, H.; Li, X.; Guan, X. High-Quality Vegetation Index Product Generation: A Review of NDVI Time Series Reconstruction Techniques. Int. J. Appl. Earth Obs. Geoinf. 2021, 105, 102640. [Google Scholar] [CrossRef]
- Zhou, Z.; Majeed, Y.; Diverres Naranjo, G.; Gambacorta, E.M.T. Assessment for Crop Water Stress with Infrared Thermal Imagery in Precision Agriculture: A Review and Future Prospects for Deep Learning Applications. Comput. Electron. Agric. 2021, 182, 106019. [Google Scholar] [CrossRef]
- Gutiérrez, S.; Diago, M.P.; Fernández-Novales, J.; Tardaguila, J. Vineyard Water Status Assessment Using On-the-Go Thermal Imaging and Machine Learning. PLoS ONE 2018, 13, e0192037. Available online: https://journals.plos.org/plosone/article?id=10.1371/journal.pone.0192037 (accessed on 4 December 2023). [CrossRef]
- Jackson, R.D.; Idso, S.B.; Reginato, R.J.; Pinter, P.J., Jr. Canopy Temperature as a Crop Water Stress Indicator. Water Resour. Res. 1981, 17, 1133–1138. Available online: https://agupubs.onlinelibrary.wiley.com/doi/abs/10.1029/WR017i004p01133 (accessed on 5 February 2024). [CrossRef]
- Idso, S.B.; Jackson, R.D.; Pinter, P.J.; Reginato, R.J.; Hatfield, J.L. Normalizing the Stress-Degree-Day Parameter for Environmental Variability. Agric. Meteorol. 1981, 24, 45–55. [Google Scholar] [CrossRef]
- García-Tejero, I.F.; Rubio, A.E.; Viñuela, I.; Hernández, A.; Gutiérrez-Gordillo, S.; Rodríguez-Pleguezuelo, C.R.; Durán-Zuazo, V.H. Thermal Imaging at Plant Level to Assess the Crop-Water Status in Almond Trees (Cv. Guara) under Deficit Irrigation Strategies. Agric. Water Manag. 2018, 208, 176–186. [Google Scholar] [CrossRef]
- Jones, H.G.; Stoll, M.; Santos, T.; de Sousa, C. Use of Infrared Thermography for Monitoring Stomatal Closure in the Field: Application to Grapevine. J. Exp. Bot. 2002, 53, 2249–2260. Available online: https://academic.oup.com/jxb/article/53/378/2249/426550 (accessed on 4 December 2023). [CrossRef] [PubMed]
- Jones, H.G. Use of Infrared Thermometry for Estimation of Stomatal Conductance as a Possible Aid to Irrigation Scheduling. Agric. For. Meteorol. 1999, 95, 139–149. [Google Scholar] [CrossRef]
- Bian, J.; Zhang, Z.; Chen, J.; Chen, H.; Cui, C.; Li, X.; Chen, S.; Fu, Q. Simplified Evaluation of Cotton Water Stress Using High Resolution Unmanned Aerial Vehicle Thermal Imagery. Remote Sens. 2019, 11, 267. [Google Scholar] [CrossRef]
- Xing, J.; Tian, L.Z. Summary of yield measurement methods of Ganoderma lucidum wheat. Anhui Agric. Sci. Bull. 2011, 17, 94–95. [Google Scholar]
- Bai, H.; Purcell, L.C. Aerial Canopy Temperature Differences between Fast- and Slow-wilting Soya Bean Genotypes. J. Agron. Crop Sci. 2018, 204, 243–251. Available online: https://onlinelibrary.wiley.com/doi/abs/10.1111/jac.12259 (accessed on 7 December 2023). [CrossRef]
- Cotton Moisture Stress Diagnosis Based on Canopy Temperature Characteristics Calculated from UAV Thermal Infrared Image. Available online: https://www.cabdirect.org/cabdirect/abstract/20183327313 (accessed on 7 December 2023).
- Cohen, Y.; Alchanatis, V.; Saranga, Y.; Rosenberg, O.; Sela, E.; Bosak, A. Mapping Water Status Based on Aerial Thermal Imagery: Comparison of Methodologies for Upscaling from a Single Leaf to Commercial Fields; Springer: Berlin/Heidelberg, Germany, 2017; Available online: https://link.springer.com/article/10.1007/s11119-016-9484-3 (accessed on 4 December 2023).
- Espinoza, C.Z.; Khot, L.R.; Sankaran, S.; Jacoby, P.W. High Resolution Multispectral and Thermal Remote Sensing-Based Water Stress Assessment in Subsurface Irrigated Grapevines. Remote Sens. 2017, 9, 961. [Google Scholar] [CrossRef]
- Poblete, T.; Ortega-Farías, S.; Ryu, D. Automatic Coregistration Algorithm to Remove Canopy Shaded Pixels in UAV-Borne Thermal Images to Improve the Estimation of Crop Water Stress Index of a Drip-Irrigated Cabernet Sauvignon Vineyard. Sensors 2018, 18, 397. [Google Scholar] [CrossRef] [PubMed]
- Nhamo, L.; Magidi, J.; Nyamugama, A.; Clulow, A.D.; Sibanda, M.; Chimonyo, V.G.P.; Mabhaudhi, T. Prospects of Improving Agricultural and Water Productivity through Unmanned Aerial Vehicles. Agriculture 2020, 10, 256. [Google Scholar] [CrossRef]
- Gago, J.; Douthe, C.; Coopman, R.E.; Gallego, P.P.; Ribas-Carbo, M.; Flexas, J.; Escalona, J.; Medrano, H. UAVs Challenge to Assess Water Stress for Sustainable Agriculture. Agric. Water Manag. 2015, 153, 9–19. Available online: https://www.sciencedirect.com/science/article/abs/pii/S0378377415000293 (accessed on 7 December 2023). [CrossRef]
- Abbe, C. Drought. Mon. Weather Rev. 1894, 22, 323–324. [Google Scholar]
- Lv, J.; Qu, Y.; Su, Z. Drought Disaster Risk Assessment Methods and Empirical Research; Changjiang Press: Wuhan, China, 2019; ISBN 978-7-5492-2998-7. [Google Scholar]
- SL/T 663-2014; Drought Grade Standard. Ministry of Water Resources: Beijing, China, 2014.
- Zhao, J.; Zhang, Q.; Zhu, X.; Shen, Z.; Yu, H. Quantitative assessment of drought risk in China. Acta Ecol. Sin. 2021, 41, 1021–1031. [Google Scholar]
- Carrão, H.; Naumann, G.; Barbosa, P. Mapping Global Patterns of Drought Risk: An Empirical Framework Based on Sub-National Estimates of Hazard, Exposure and Vulnerability. Glob. Environ. Chang. 2016, 39, 108–124. [Google Scholar] [CrossRef]


| Number | P1 Period | P2 Period | P3 Period |
|---|---|---|---|
| X6 | Dro1 | Nor | Nor |
| X1 | Dro2 | Nor | Nor |
| X3 | Dro3 | Nor | Nor |
| X2 | Nor | Dro1 | Nor |
| D4 | Nor | Dro2 | Nor |
| D6 | Nor | Dro3 | Nor |
| D5 | Nor | Nor | Dro1 |
| X4 | Nor | Nor | Dro2 |
| D3 | Nor | Nor | Dro3 |
| D1 | EDro | EDro | EDro |
| X5 | Nor | Nor | Nor |
| Drought Levels | Soil Relative Humidity Content | Soil Relative Humidity (%) | ||||
|---|---|---|---|---|---|---|
| P1 | P2 | P3 | P1 | P2 | P3 | |
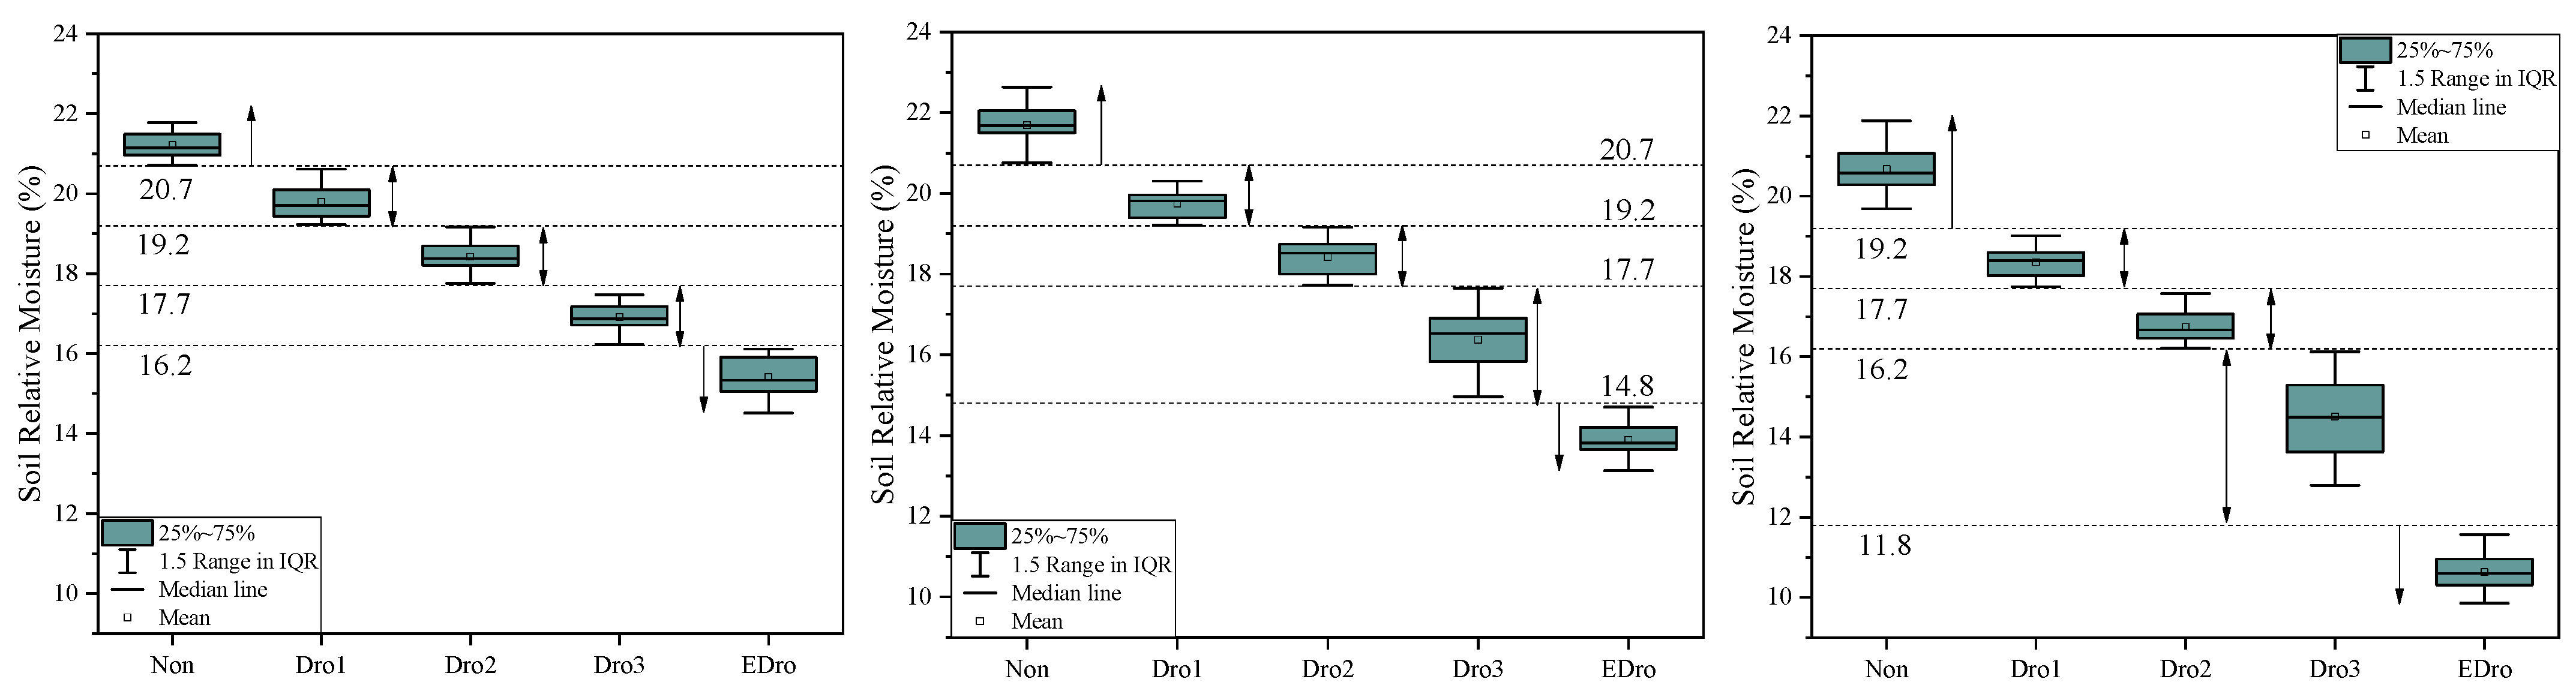
| Dro1 | 65–70% | 65–70% | 60–65% | 19.2–20.7 | 19.2–20.7 | 17.7–19.2 |
| Dro2 | 60–65% | 60–65% | 55–60% | 17.7–19.2 | 17.7–19.2 | 16.2–17.7 |
| Dro3 | 55–60% | 50–60% | 45–55% | 16.2–17.7 | 14.8–17.7 | 11.8–16.2 |
| EDro | <55% | <55% | <45% | <16.2 | <16.2 | <11.8 |
| Nor | >70% | >70% | >65% | >20.7 | >20.7 | >19.2 |
| UAV Platform | Load | 1 kg | |
| Endurance time | ≥40 min (No load)/≥30 min (Full load) | ||
| Wind resistance | Four level (Normal execution task) | ||
| Rain resistance | Can fly in light rain | ||
| Takeoff and landing method | Manual/Automatic | ||
| Full system deployment and retraction time | ≤3 min | ||
| UAV load | Thermal infrared camera | Sensor resolution | 336 × 256 |
| Thermal sensitivity | <50 mk | ||
| Spectral range | 7.5–13.5 μm | ||
| Measurement accuracy | +/− 5 °C or 5% of reading | ||
| Multispectral camera | Spectral bands | Blue, Green, Red, Red Edge, Near Red | |
| Spatial resolution | 8 cm per pixel at 120 m | ||
| Capture rate | Captured every second (All bands) | ||
| Field of view | 47.2° HFOV | ||
| Date | Date Type | Equipment | Date Number | Method |
|---|---|---|---|---|
| UAV date | Thermal images | FL-81 (From China Institute of Water Resources and Hydropower Research in Beijing, China) | 603 | VUE PRO thermal camera |
| Multispectral images | 3075 | MicaSense RedEdge-MTM Multispectral Camera | ||
| Ground data | Ground-truth Tc | Raytek ST80+ (From Fluke Corporatioin in Everett, Washington, USA) | 648 | Measure 9 sample points evenly within the plot and take the average |
| Atmospheric temperature | DeFu temperature and humidity recorder (From Defu Hardware products Co., Ltd. in Shenzhen, Guangdong Province, China Ltd.), | 12 | Record the two atmospheric temperatures before and after the ground-truth Tc measurement and calculate the average | |
| Yield | Scales, ropes, etc. | 12 | Calculated based on monitoring points | |
| Soil relative humidity data | BS-3555 soil temperature and humidity recorder (From Beijing Yugen Technology Co., Ltd. in Beijing, China) | 3792 | Copy using data cable |
| Nor | Dro1 | Dro2 | Dro3 | ||
|---|---|---|---|---|---|
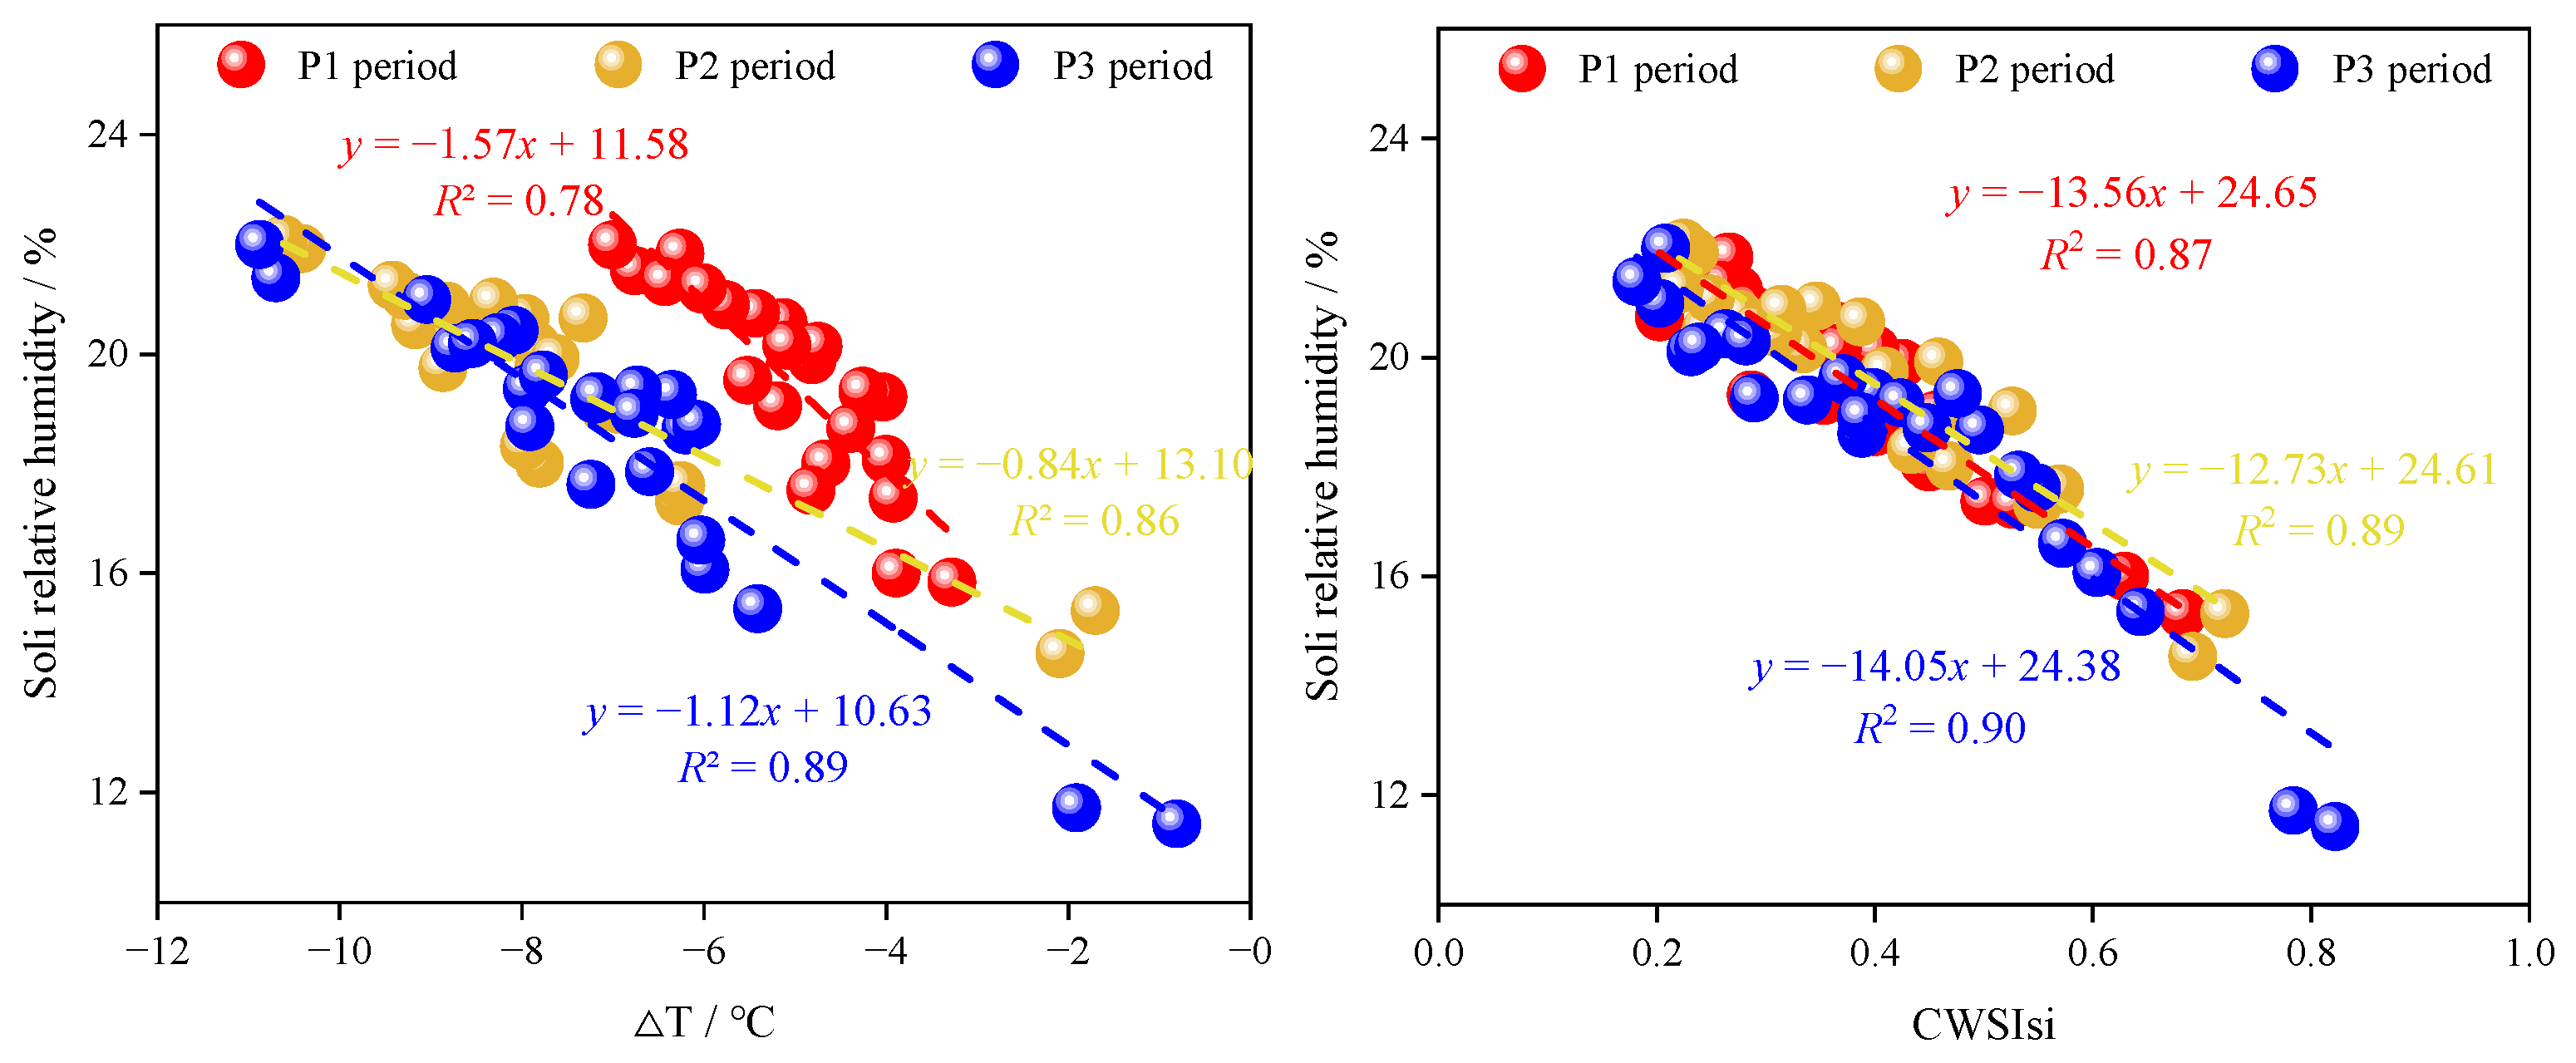
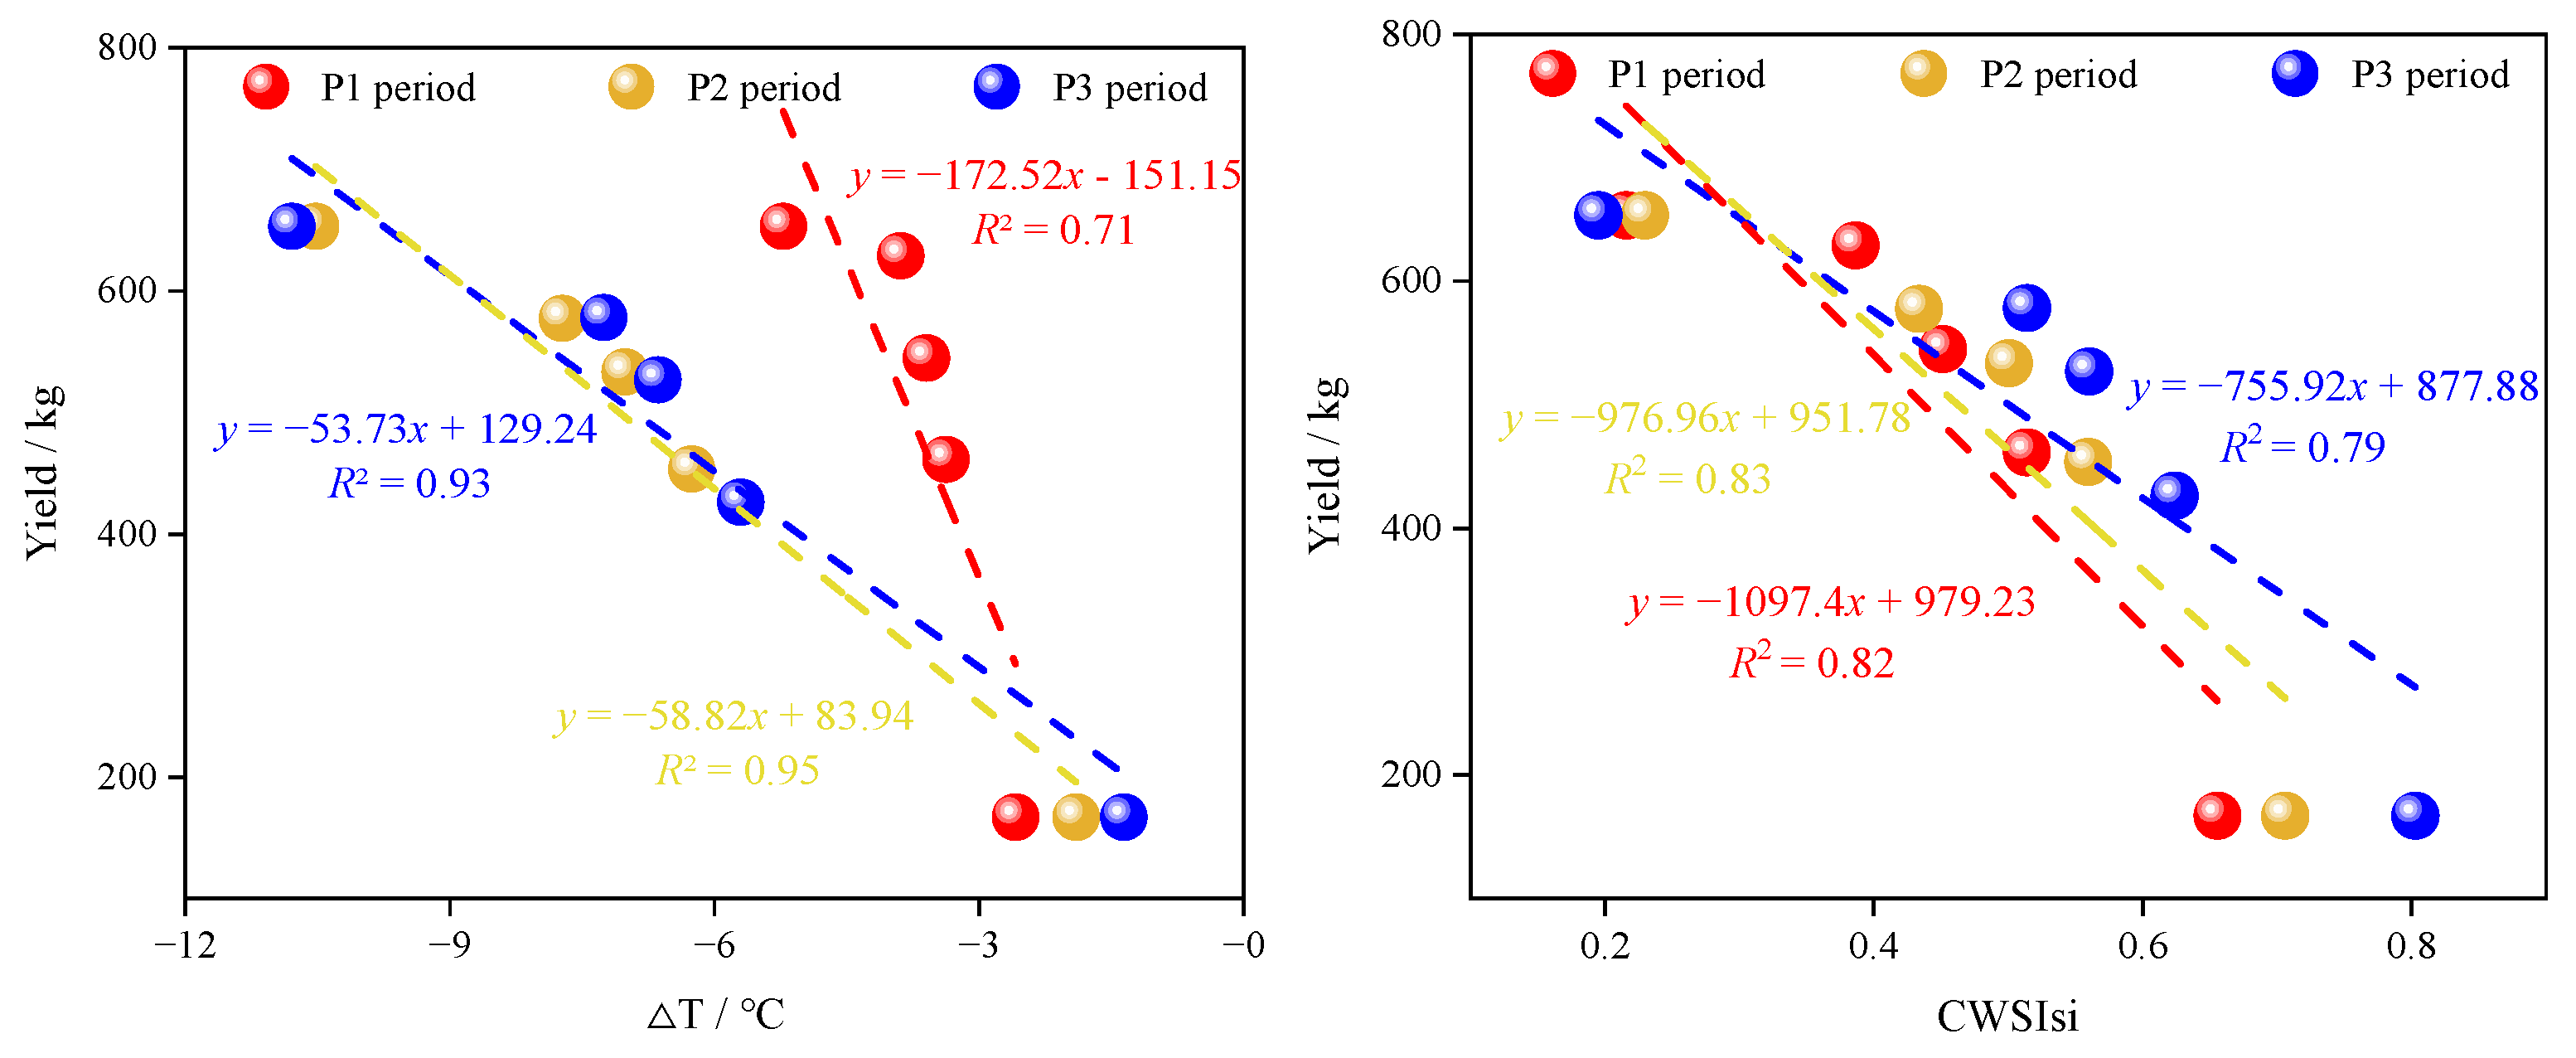
| △T/℃ | P1 period | ≤−5.6 °C | −5.6 ℃ to −5.1 °C | −5.1 ℃ to −4 °C | ≥−4 °C |
| P2 period | ≤−7.6 °C | −7.6℃ to −5.4 °C | −5.4 ℃ to −3.4 °C | ≥−3.4 °C | |
| P3 period | ≤−8 °C | −8 ℃ to −5.5 °C | −5.5 ℃ to −1.5 °C | ≥−1.5 °C | |
| CWSIsi | P1 period | <0.30 | 0.30–0.42 | 0.42–0.48 | >0.48 |
| P2 period | <0.33 | 0.33–0.47 | 0.44–0.53 | >0.53 | |
| P3 period | <0.41 | 0.41–0.54 | 0.54–0.59 | >0.59 |
Disclaimer/Publisher’s Note: The statements, opinions and data contained in all publications are solely those of the individual author(s) and contributor(s) and not of MDPI and/or the editor(s). MDPI and/or the editor(s) disclaim responsibility for any injury to people or property resulting from any ideas, methods, instructions or products referred to in the content. |
© 2024 by the authors. Licensee MDPI, Basel, Switzerland. This article is an open access article distributed under the terms and conditions of the Creative Commons Attribution (CC BY) license (https://creativecommons.org/licenses/by/4.0/).
Share and Cite
Liu, H.; Song, W.; Lv, J.; Gui, R.; Shi, Y.; Lu, Y.; Li, M.; Chen, L.; Chen, X. Precise Drought Threshold Monitoring in Winter Wheat Using the Unmanned Aerial Vehicle Thermal Method. Remote Sens. 2024, 16, 710. https://doi.org/10.3390/rs16040710
Liu H, Song W, Lv J, Gui R, Shi Y, Lu Y, Li M, Chen L, Chen X. Precise Drought Threshold Monitoring in Winter Wheat Using the Unmanned Aerial Vehicle Thermal Method. Remote Sensing. 2024; 16(4):710. https://doi.org/10.3390/rs16040710
Chicago/Turabian StyleLiu, Hongjie, Wenlong Song, Juan Lv, Rongjie Gui, Yangjun Shi, Yizhu Lu, Mengyi Li, Long Chen, and Xiuhua Chen. 2024. "Precise Drought Threshold Monitoring in Winter Wheat Using the Unmanned Aerial Vehicle Thermal Method" Remote Sensing 16, no. 4: 710. https://doi.org/10.3390/rs16040710
APA StyleLiu, H., Song, W., Lv, J., Gui, R., Shi, Y., Lu, Y., Li, M., Chen, L., & Chen, X. (2024). Precise Drought Threshold Monitoring in Winter Wheat Using the Unmanned Aerial Vehicle Thermal Method. Remote Sensing, 16(4), 710. https://doi.org/10.3390/rs16040710