Article

Approximation of a Convective-Event-Monitoring System Using GOES-R Data and Ensemble ML Models

by
Rodrigo Dávila-Ortiz
1,
José Noel Carbajal-Pérez
1,
Juan Alberto Velázquez-Zapata
2 and
José Tuxpan-Vargas
3,*
1
Instituto Potosino de Investigación Científica y Tecnológica, A.C. División de Geociencias Aplicadas, Camino a la Presa San José 2055, San Luis Potosí, Mexico
2
CONAHCYT-El Colegio de San Luis, A.C., Parque Macul 155, San Luis Potosí, Mexico
3
CONAHCYT-Instituto Potosino de Investigación Científica y Tecnológica, A.C. División de Geociencias Aplicadas, Camino a la Presa San José 2055, San Luis Potosí, Mexico
*
Author to whom correspondence should be addressed.
Remote Sens. 2024, 16(4), 675; https://doi.org/10.3390/rs16040675
Submission received: 19 December 2023 / Revised: 26 January 2024 / Accepted: 8 February 2024 / Published: 14 February 2024

Abstract

:
The presence of deep convective clouds is directly related to potential convective hazards, such as lightning strikes, hail, severe storms, flash floods, and tornadoes. On the other hand, Mexico has a limited and heterogeneous network of instruments that allow for efficient and reliable monitoring and forecasting of such events. In this study, a quasi-real-time framework for deep convective cloud identification and modeling based on machine learning (ML) models was developed. Eight different ML models and model assembly approaches were fed with Interest Fields estimated from Advanced Baseline Imager (ABI) sensor data on the Geostationary Operational Environmental Satellite-R Series (GOES-R) for one region in central Mexico and another in northeastern Mexico, both selected for their intense convective activity and high levels of vulnerability to severe weather. The results indicate that a simple approach such as Logistic Regression (LR) or Random Forest (RF) can be a good alternative for the identification and simulation of deep convective clouds in both study areas, with a probability of detection of (POD) ≈ 0.84 for Los Mochis and POD of ≈ 0.72 for Mexico City. Similarly, the false alarm ratio (FAR) ≈ 0.2 and FAR ≈ 0.4 values were obtained for Los Mochis and Mexico City, respectively. Finally, a post-processing filter based on lightning incidence (Lightning Filter) was applied with data from the Geostationary Lightning Mapper (GLM) of the GOES-16 satellite, showed great potential to improve the probability of detection (POD) of the ML models. This work sets a precedent for the implementation of an early-warning system for hazards associated with intense convective activity in Mexico.

1. Introduction

Convective hazards, which are characterized by dynamic atmospheric processes involving the vertical movement of air masses, pose significant challenges to human safety and infrastructure resilience. These hazards encompass a spectrum of high-impact phenomena such as thunderstorms, wind, hail, tornadoes, lightning, and floods [1,2,3,4]. Due to the rapid evolution and microscale variability of deep convection events, the task of forecasting and implementing early mitigation measures becomes inherently complex. In addition, many countries, like Mexico, lack reliable observation networks and short-range weather forecasting systems [5].
In this context, several studies have focused on the development of algorithms for convective initiation (CI) nowcasts, i.e., short-term weather forecasting that specifically focuses on predicting the initiation and development of deep moist convective activity [6]. Convective initiation nowcasts utilize various observational data, such as radar imagery (e.g., the Thunderstorm Identification, Tracking, Analysis, and Nowcasting; TITAN [7]), satellite data [1,8,9,10], atmospheric instability indices (e.g., [11]), numerical weather predictions (NWP, e.g., the Corridor Integrated Weather System; CIWS [12]), and other meteorological parameters to identify favorable conditions for the initiation of thunderstorms. For example, the Satellite Convection Analysis and Tracking (SATCAST [13]) is a CI nowcasting expert system that uses eight predictors, called “Interest Fields” based on infrared Geostationary Operational Environmental Satellite (GOES) data, to forecast CI with 0–1 h lead times [14]. In this work, CI is defined as the first detection of Weather Surveillance Radar-1988 Doppler (WSR-88D) reflectivities ≥ 35 dBZ produced by convective clouds and satellite-derived atmospheric motion vectors (AMVs) for tracking individual cumulus clouds. Subsequently, a second upgrade of this system, SATCAST version 2 (STACASTv2), was proposed by [15] and includes object-tracking approaches used to compute temporal changes in brightness temperature. Later additions include the integration of NWP data [12].
Recently, with the rise of ML approaches in the field of geosciences [16] and the availability of higher-quality satellite information, several research works based on the use of ML techniques for CI identification have emerged. For example, ref. [17] proposed a CI algorithm that combines Interest Fields derived from GOES-R and NWP model data. This study relied on Logistic Regression (LR) and Random Forest (RF) models that provided better predictions than previous approaches, in addition to probabilistic rather than binary classification predictions. Through experimentation, they validated the performance of these CI algorithms in the United States, with a FAR of 0.1–0.18 lower than existing deterministic CI detection algorithms for GOES (FAR ≈ 0.48–0.6 [15]).
In the related literature, several researches have reported the development and implementation of CI nowcast algorithms based on ML approaches for different geostationary satellites, such as Himawari-8 [3,18], the Communication, Ocean, and Meteorological Satellite (COMS [2]), and Meteosat [19]. Other forecasting systems based on satellite data were developed to aid in diagnosing the characteristics of the preconvective environment, and deep moist convection are the convective occurrence (CO) algorithms. CO approaches include modeling convective initiation/decay and advection of existing storms [14], the 0–9 h NearCast model, [9,20], object tracking techniques such as optical flow [21], and thunderstorm occurrence (TO [22,23,24]).
Overshooting cloud top (OT) detection approaches consist of algorithms designed to identify and analyze cloud formations, with a particular focus on overshooting cloud tops (also called anvil domes and are defined as domelike clouds forming above a cumulonimbus cloud top or penetrating the tropopause [25]). OT clouds form when strong updrafts in thunderstorms push cloud tops above their equilibrium height (level of neutral buoyancy). These OT cloud tops are often associated with severe weather events. OT cloud detection approaches can be based on cloud top temperature thresholds (e.g., [26,27]), but also on ML and Deep Learning (DL) approaches. For example, in [28], three machine learning techniques, RF, LR, and extremely randomized trees (ERT), were used to develop OT classification models, achieving an average POD = 0.77 and FAR = 0.36 with the RF model. In another study, a new approach for OT detection was proposed using a Convolutional Neural Network (CNN), reporting a POD = 0.79 and a FAR = 0.09 [29].
This study proposes a quasi-real-time framework for deep convective clouds identification and modeling based on Machine Learning (ML) models and ABI-GOES data. The objectives of the study are first, to develop a deep convective cloud identification framework based on three principles: the use of open-source software and open-access products, automation, and scalability; second, to compare different ML approaches to determine which is optimal in terms of performance and computational cost; third, to quantify and examine relative variable importance and model contribution; and finally, to integrate a post-processing filter based on lightning incidence to improve the ability to detect deep convection events. The previously analyzed algorithms and approaches for the prediction of intense convective events or the identification of deep convective clouds were designed to integrate multi-source meteorological information, especially from radars. The proposed framework in this study presents an alternative for the implementation of early-warning systems in areas with high levels of vulnerability to convective hazards in the context of limited meteorological monitoring infrastructure.
The structure of this paper is as follows: The test zones are described in Section 2; Section 3 presents the data and methods. The main findings and discussion are described in Section 4. Finally, the conclusions are presented in Section 5.

2. Test Sites

2.1. Los Mochis, Sin

Los Mochis is the main city of Ahome municipality, situated in the northeastern region of the Mexican state of Sinaloa. This city is positioned within the North American monsoon (NAM) core domain, leading to a notable occurrence of convective activity [30,31,32] and a substantial increase in summer rainfall [33]. Ref. [34] claims that the precipitation distribution in this zone is mainly related to the deep convective cloud pattern.
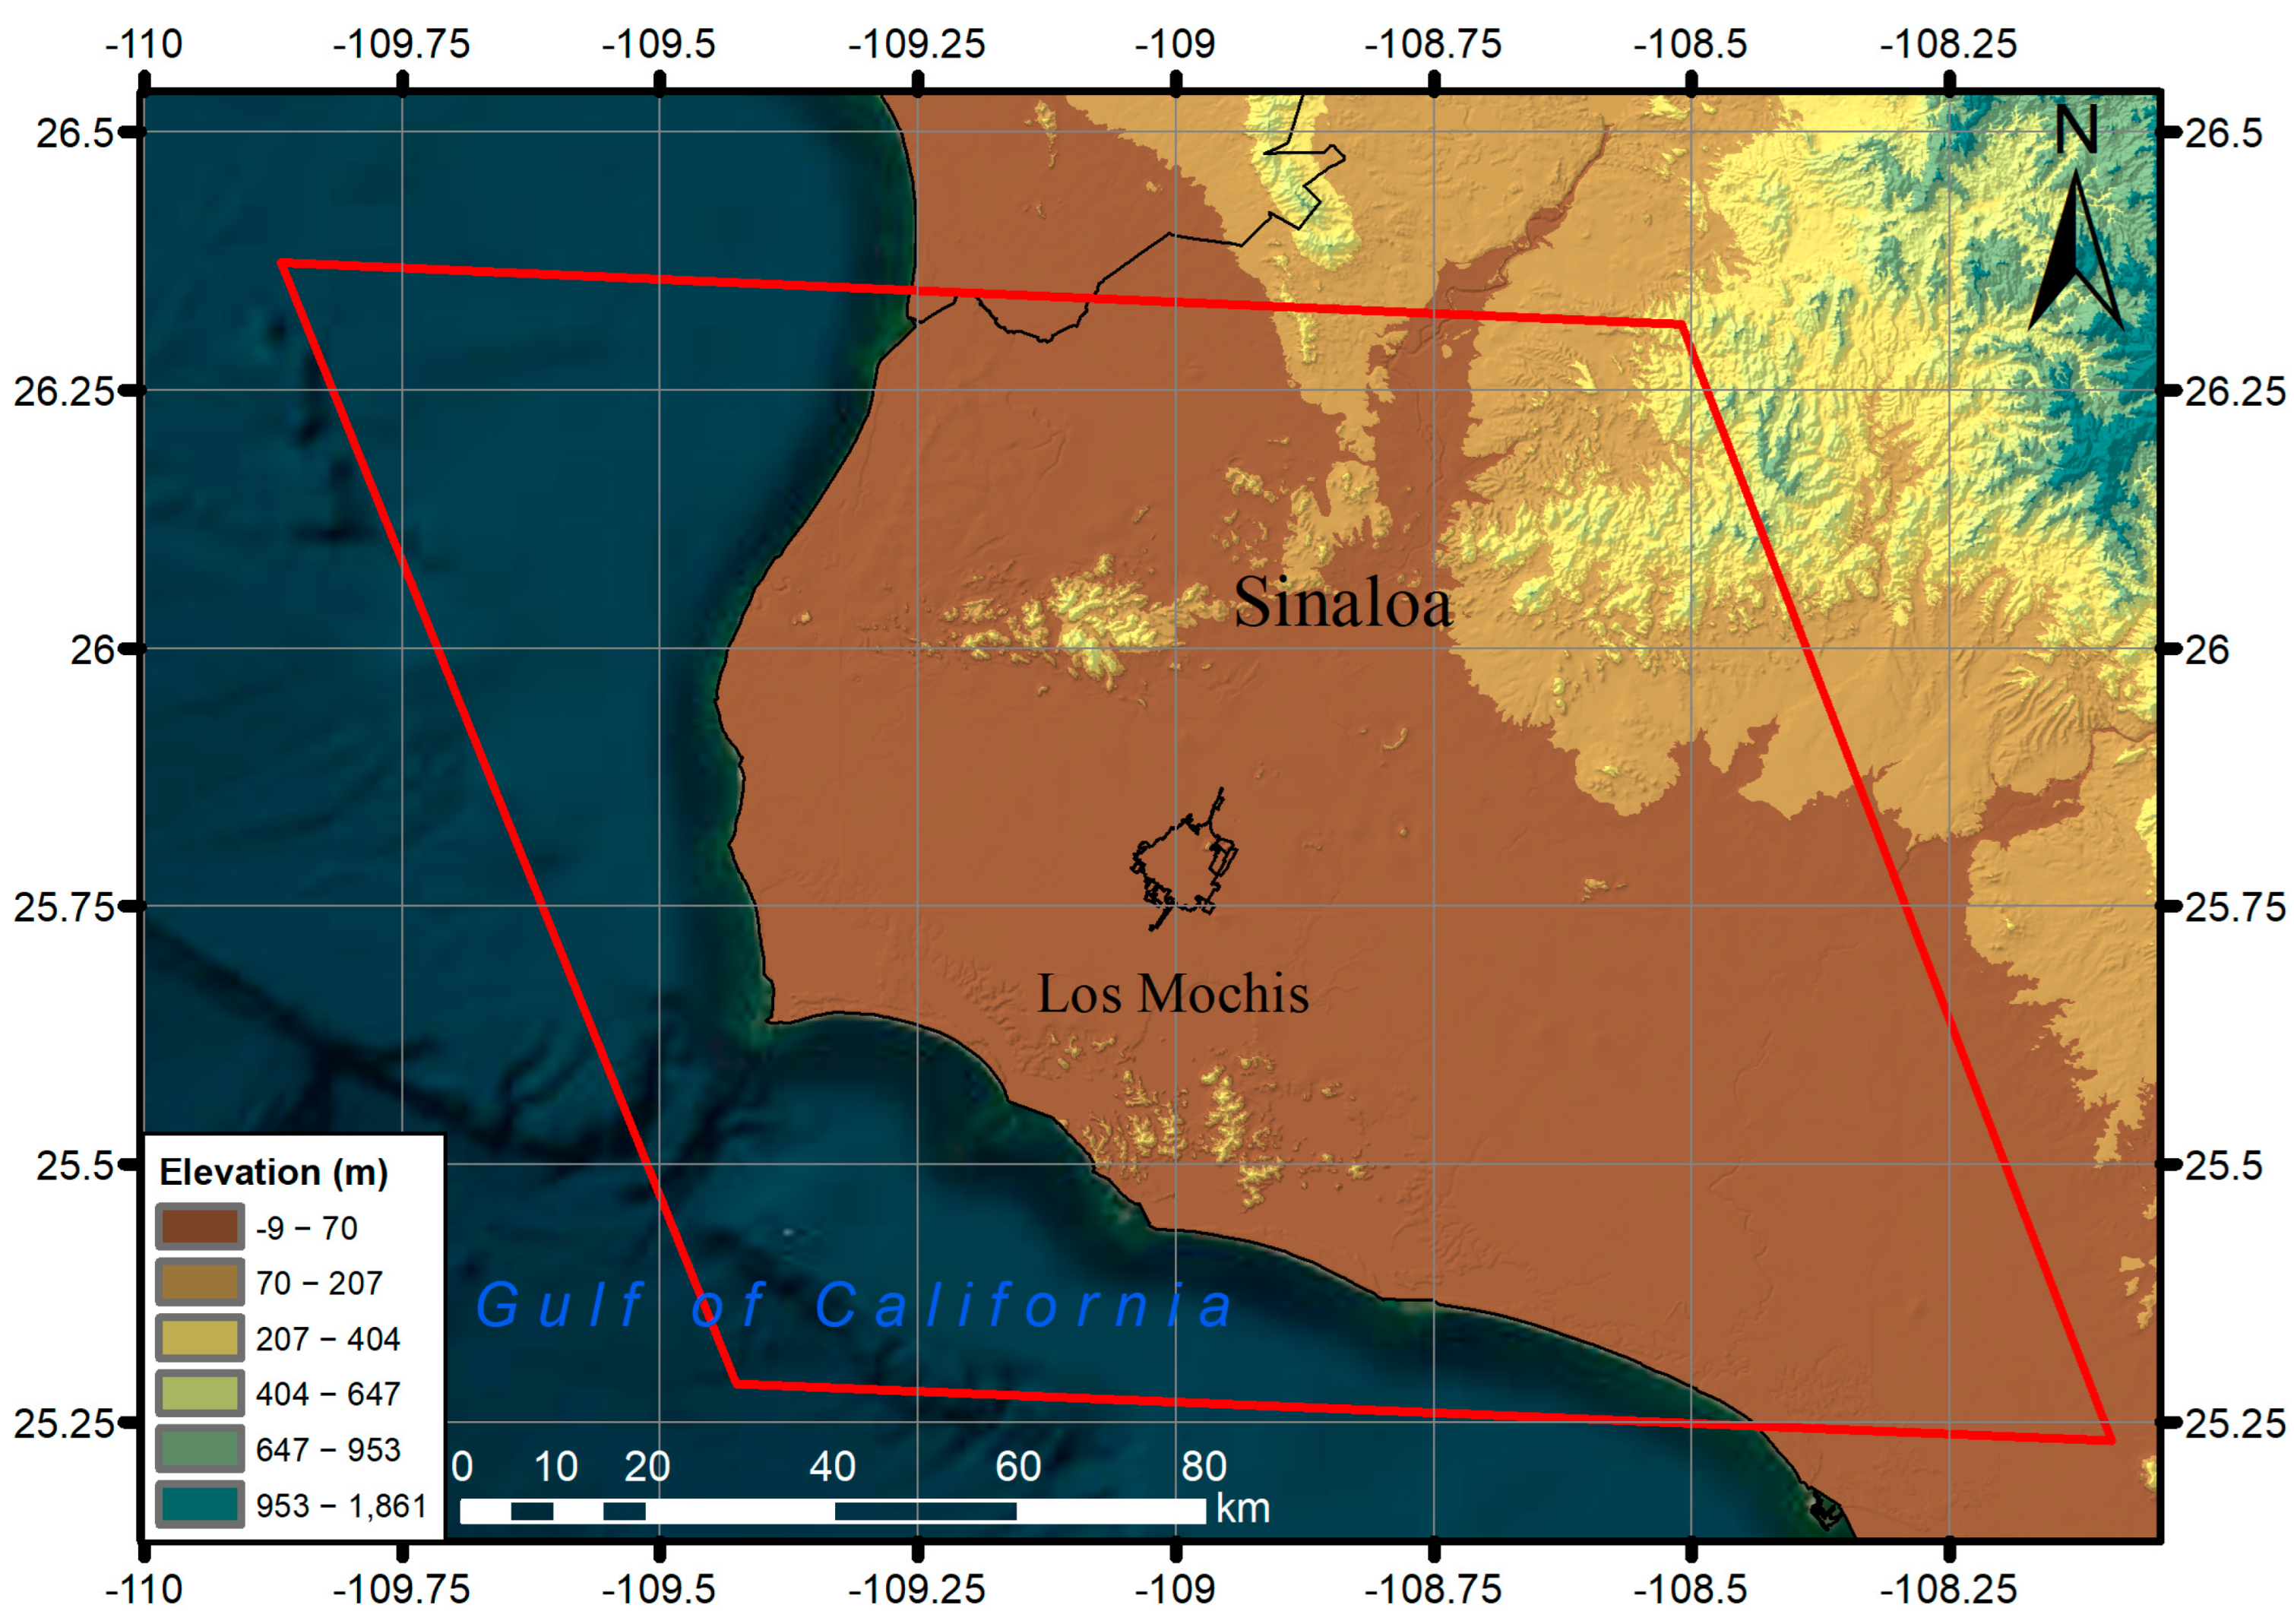
Figure 1 illustrates the geographic location of Los Mochis, which is positioned between the Gulf of Mexico to the west and the Sierra Madre Occidental (SMO) to the east. The simulation area, comprising a grid of 50 × 50 ABI-GOES cells, is situated within the latitudinal range of 25.25° to 26.5° and the longitudinal range of −110° to −108°. The topography of this region is primarily flat, but there are also mountain systems at the edge of the SMO. This region is categorized as a Hot Desert climate (BWh [35]), with a mean annual precipitation of 335 mm, primarily concentrated during a pronounced wet season spanning from July to September. The precipitation patterns are significantly influenced by large-scale climatic phenomena such as El Niño–Southern Oscillation (ENSO) and hurricanes [36].

2.2. Mexico City

Mexico City is Mexico’s capital and largest city in the country and one of its main population centers. It is located in central Mexico, within the physiographic province called the Trans-Mexican Volcanic Belt, which crosses the country from the Pacific Ocean to the Gulf of Mexico, presenting a complex topography that ranges from 0 to 5000 m above sea level. The combination of different factors such as its latitudinal position, complex topography, the influence of tropical cyclones, cold fronts, and easterly waves [38], and even the effect of urbanization [39], cause this area to present intense convective activity. These conditions are a source of convective risk associated with the presence of tornadoes [38,40], floods [41], hailstorms, and thunderstorms [5]. In addition, socioeconomic conditions in this area cause a high degree of social vulnerability [42].
Figure 2 shows the geographic location of the Mexican City area, (the simulation spatial domain comprises the México and Morelos states) which is composed of a grid of 50 × 50 ABI-GOES cells and is situated within the north latitude range of 20° to 19° and the longitude range of −99.75° to −98.5°. The mean annual precipitation in Mexico City ranges between 621 and 1200 mm, and this zone presents a Subhumid Temperate climate type (Cw [35]).

3. Materials and Methods

3.1. Data

3.1.1. GOES-R Advanced Baseline Imager (ABI) Data

The GOES-R series of satellite instruments provide high-resolution and rapid-refresh observations of Earth’s atmosphere and surface. This passive imaging radiometer has 16 spectral bands, including two visible channels, four near-infrared channels, and ten infrared channels [43]. Eight of the 16 ABI-GOES bands were used to generate 12 predictors based on the spectral properties of vertically developing clouds (Table 1).

3.1.2. GOES-R Geostationary Lightning Mapper (GLM) Data

GLM is a single-channel, near-infrared optical transient detector that can detect momentary changes in an optical scene, indicating the presence of lightning [44]. The GLM sensor captures high-resolution images of lightning flashes, including cloud-to-ground, intra-cloud, and cloud-to-cloud lightning. It provides valuable data on lightning strikes’ frequency, location, and intensity. A post-processing filter was generated using the presence of lightning as an indicator of convective activity, which usually occurs during the deep convection process.

3.1.3. Moderate-Resolution Imaging Spectroradiometer (MODIS) Data

MODIS is a passive imager mounted on both the Terra and Aqua sun-synchronous polar-orbiting satellites. This sensor provides pixel-level retrievals of cloud-top properties and cloud optical properties [45]. For target label generation, the variables “Cloud_Top_Preassure” and “Cloud_Optical_Thickness” (related to the optical and microphysical properties of deep convective clouds) from Collection 6 (C6) of MODIS products were collected. MODIS C6 introduces several improvements and refinements over the previous versions of the MODIS data products.

3.2. Methodology

3.2.1. Preparation of Training Dataset

Combinations of the brightness temperatures (Tbs) of the eight ABI bands were calculated to generate prediction variables called “Interest Fields” (Table 2). A wide variety of Interest Fields are used in deep convective cloud detection algorithms, adapted for various sensors, such as ABI-GOES [9,17], Advanced Himawari Imager (AHI [3,18]), Meteorological Imager (MI), a payload of the COMS [2], among others. These represent various physical properties of the cloud such as cloud-top temperature, cloud-top cooling rate, cloud optical depth, cloud-top height, etc.
The Interest Fields used as predictors in this study are similar to those in [3,18]. On the other hand, using the variables “Cloud_Optical_Thickness” (COT) and “cloud_top_pression_1km” (CtP) from MODIS C6, the set of Target Labels was built. As criteria for the labeling of Convective Cells (CC) within the MODIS survey, the well-established classification of the International Satellite Cloud Climatology Project (ISCCP; Ref. [46]) was selected, where cells with values of COT > 23 and CtP < 440 mb were considered as deep convective clouds.
For the construction of the reference dataset, all MODIS images available in the period 2018–2022 were analyzed between the months of greatest precipitation from May to September, for the two spatial domains of interest, Los Mochis and Mexico City. The MODIS images were cut according to the special domain of the study areas, and only sections with a percentage greater than 30% of labeled CC were selected to build the Target Label Dataset to avoid training the ML models with unbalanced class distribution data.
All sections were resampled with the pyresample function (python package for resampling geospatial image data) to homogenize them with the spatial domain of the Interest Fields, which has a size of 50 × 50 cells in both domains (Figure 1 and Figure 2). The training dataset for Mexico City was generated with 24 reference events (60,000 examples), while the test dataset had 31 events (77,500 examples). On the other hand, for Los Mochis, 6 (15,000 examples) and 8 events (20,000 examples) were used for the training and testing datasets, respectively.

3.2.2. Machine Learning Approaches

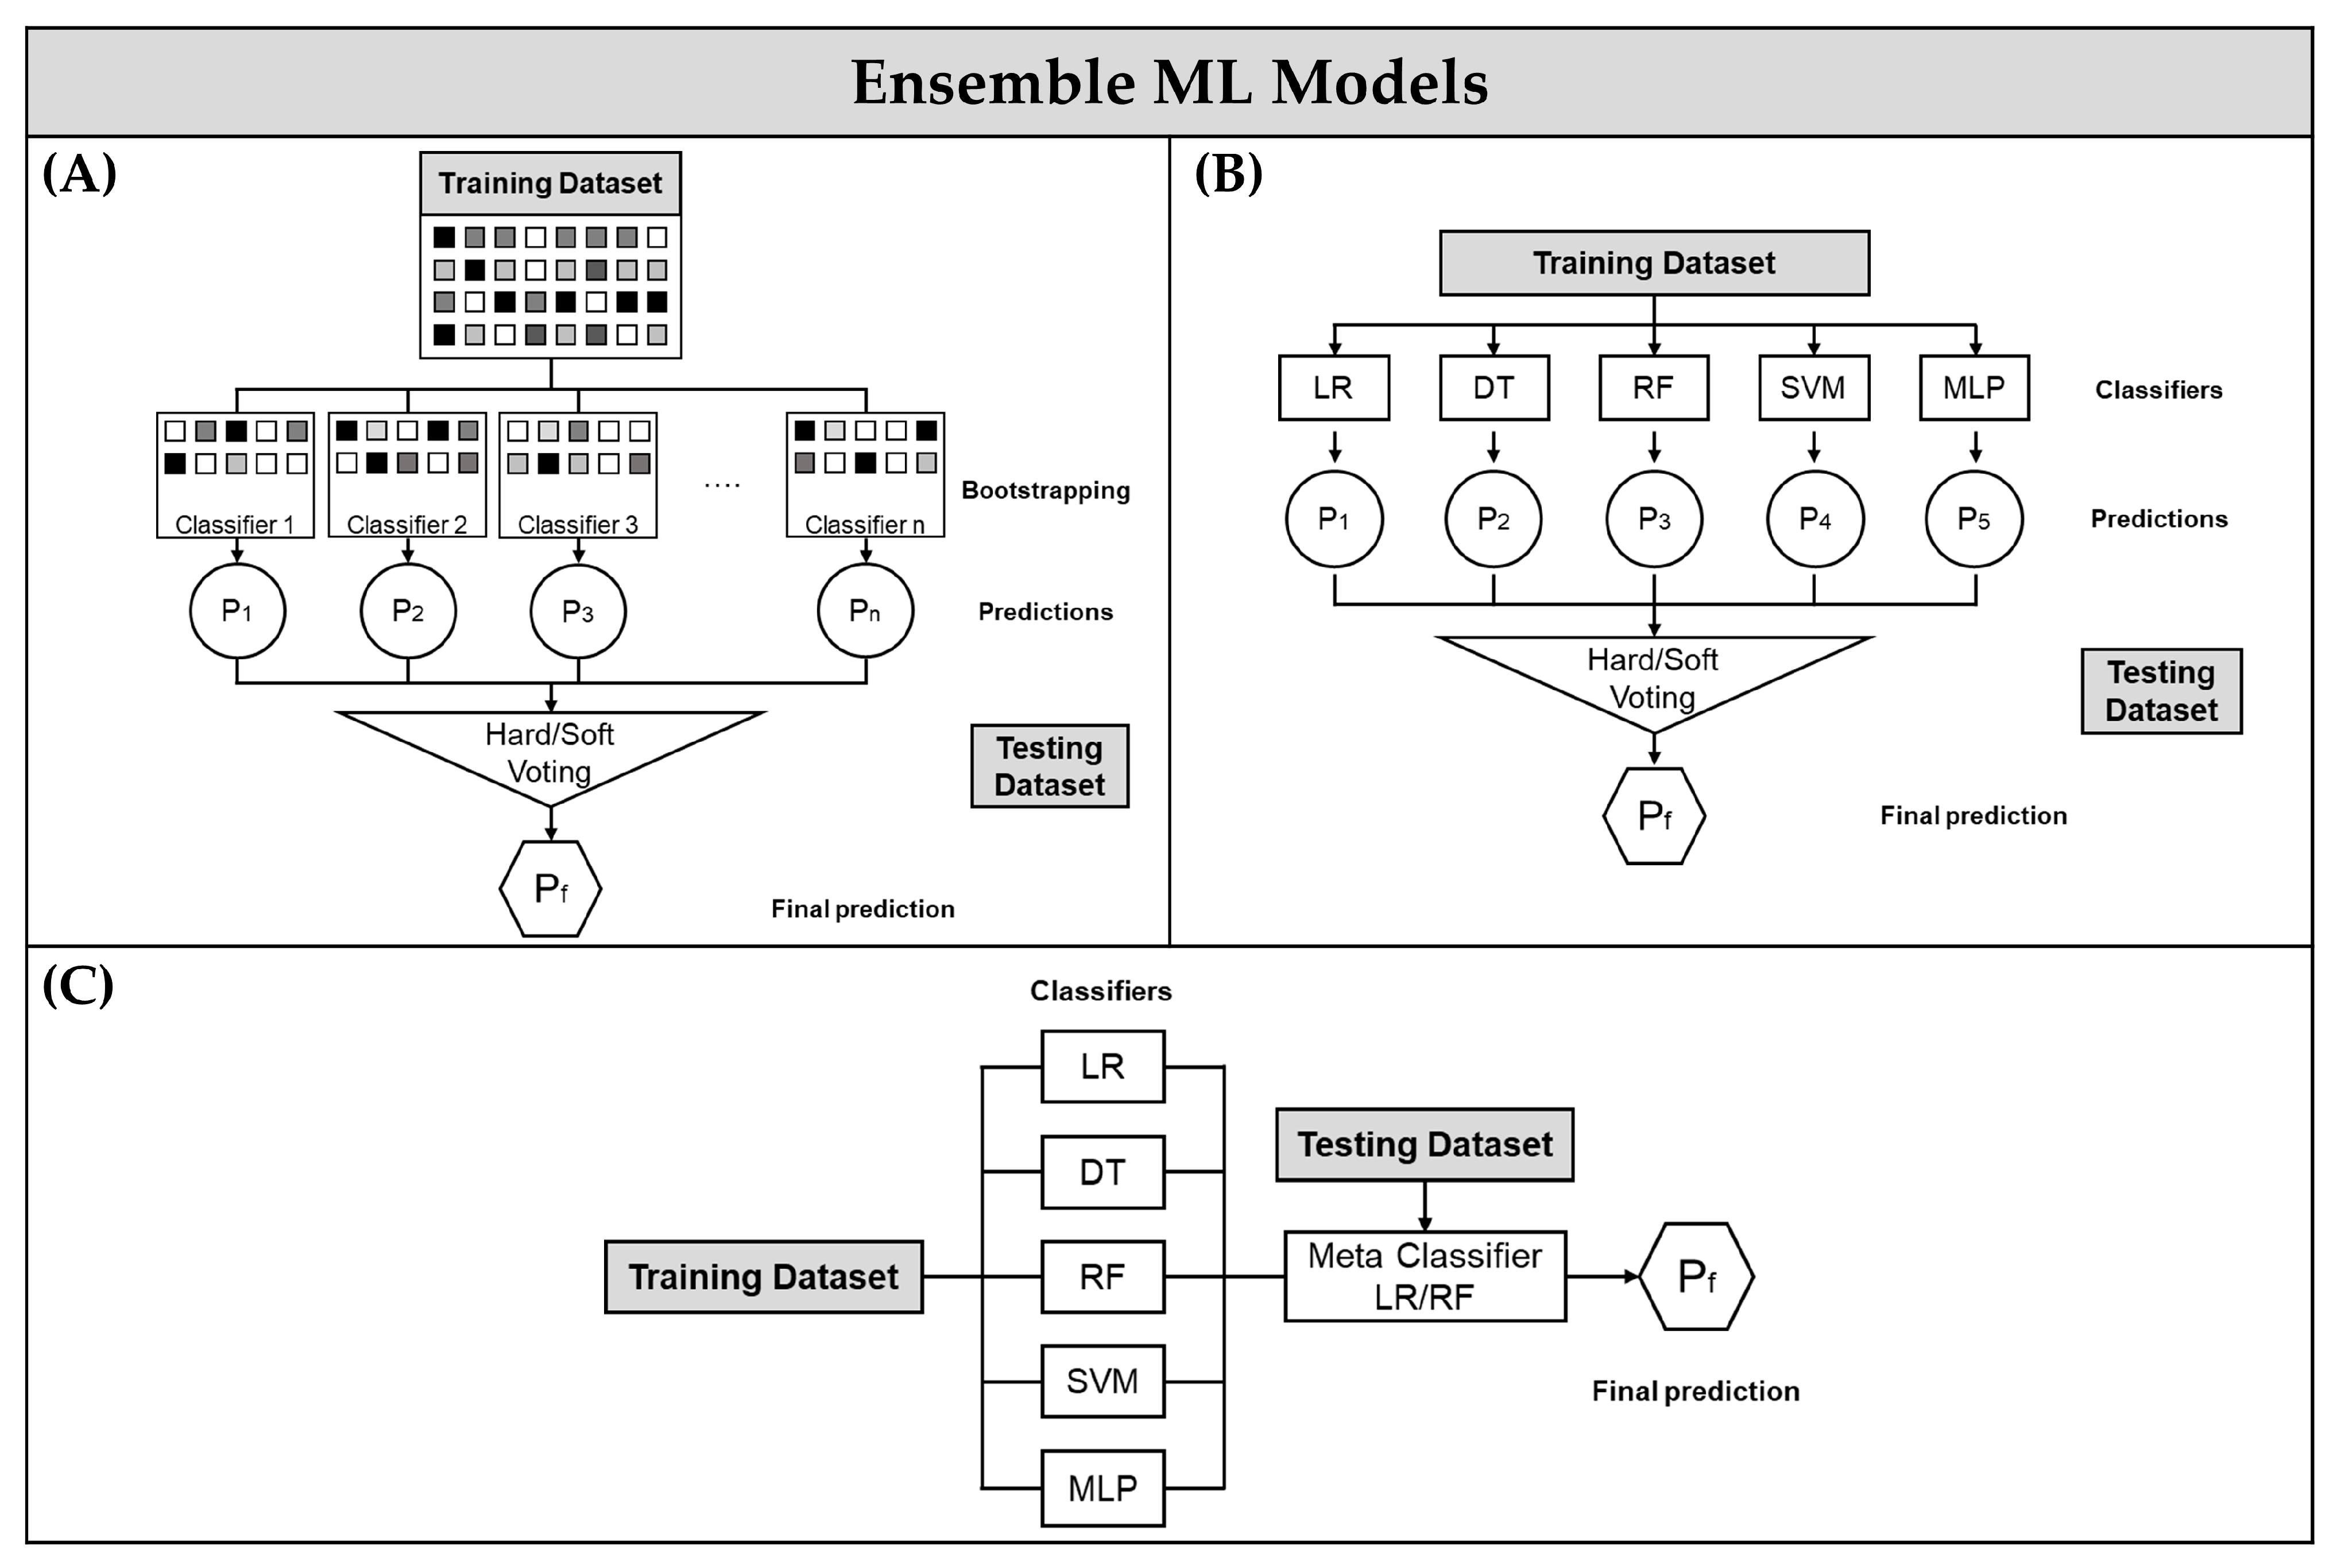
In this study, eight different ML approaches are compared (Table 3), such as LR, RF, and Multi-layer perceptron (MLP), which are widely used in convective-hazard forecasting (e.g., [14,17,22,47,48]), along with ML approaches based on Ensemble Learning techniques (i.e., a group of predictors, called an ensemble, are trained together to improve predictive ability; Figure 3). All ML models, assembly strategies, metric estimation, and preprocessing methods were taken from scikit-learn, a free software ML library for the Python programming language (https://scikit-learn.org/stable/, accessed on 5 December 2023).
  • Logistic regression
LR is a statistical model used to predict a binary variable (here, CC or noCC) from one or more independent variables or predictors [49]. The LR formula is given using
E Y = 1 1 + e x p β 0 + j = i k β j X j  
where E is the expected value of the dependent variable Y, which has values of 0 and 1, equivalent to noCC and CC, respectively; k is the number of predictors; and Xj is the value of the j th predictor. The parameters β0,…, βj are linear coefficients or weights for the predictor variables. Despite its simplicity, LR performs well in several real-world problems, including nonlinear problems in atmospheric science such as convection [23].
  • Decision Tree
A DT is a non-parametric supervised learning method used for classification purposes. The goal is to generate a model that predicts the value of an independent variable by learning simple decision rules inferred from the data features [50]. Additional examples of convective-hazard forecasting with DT are the works of [2,51].
  • Support Vector Machine
Developed by [52], SVM is a versatile supervised ML algorithm used for classification tasks. SVM works by finding an optimal hyperplane in a high-dimensional feature space to separate different classes of data points. The margin, which is the distance between the hyperplane and the nearest data points of each class (called support vectors), is found by minimizing the norm of the weight vector. Once the hyperplane is determined during the training phase, SVM can classify new, unseen data points by placing them on one side or the other of the decision boundary.
SVM is widely used in various convective-hazard forecasting applications, for example, in tornado prediction [53,54] or convective thunderstorm forecasting [47,55,56].
  • Multi-layer perceptron
A MLP is a type of artificial feedforward neural network (ANN; the first conceptual model of an artificial neural network was developed by [57]) and consists of three kinds of layers of interconnected nodes called neurons. The layers that conform to the MLP have specific functions that allow the model to learn complex non-linear relationships between the input and output variables. These are the input layer, which receives the raw input data, so its number of neurons depends on the number of features or predictors. On one or more hidden layers is where the extraction of relevant features and the learning of complex patterns are performed. Finally, in the output layer, the observations are classified according to their class probability. In this case, the output layer has two neurons, because it is a binary classification task between CC and noCC.
MLPs have been widely used in several convective-hazard and precipitation forecasting studies (e.g., [58,59]); however, the application of Deep Neural Network architectures has been preponderant recently in this domain, i.e., Deep Neural Networks (DNN; e.g., [4,60,61], Recurrent Neural Networks (RNN; e.g., [62,63]), and CNN (e.g., [29,64,65]) are the most common). The implementation of Deep Learning techniques in deep convective cloud research will be addressed in later sections.
  • Bagging and Random Forest
Bootstrap Aggregation, better known as the Bagging method, is a technique used to improve accuracy, reduce variance, and avoid overfitting by combining the predictions of multiple models trained on different subsets of the training data created through bootstrap sampling, where data points are randomly selected with replacements. (Figure 3a [66]). When sampling is performed without replacement, it is called pasting [67,68].
RF is a nonparametric ensemble model based on the consensus of a collection of DTs on different bootstrap samples. The outputs of the individual trees are then aggregated through voting to make the final prediction. Along with LR, RF is one of the most widely used ML models in issues related to convective-hazard forecasting, mostly because of its ability to capture non-linear association patterns between predictor and predictand, such as a convective storm system or precipitation [69]. Examples of RF applications in the literature are the works of [2,3,4,17,22,28,47,48,70,71,72].
In this study, two Bagging approaches were implemented, RF, and a Bagging method that used LR as the predictor in the bootstrap samples instead of DT (henceforth referred to as Bagging; Table 3 and Figure 3). The number of subsets of the training data corresponding to the number of estimators for RF was determined using a hyperparameter analysis for Los Mochis and Mexico City datasets. In the case of Bagging, the default number of estimators (represented with the parameter n_estimators) in the scikit-learn library was set to 10.
  • Voting
The voting method refers to an assembly strategy used to make predictions by integrating the collective predictions of multiple models or classifiers that are trained independently and in parallel on the same dataset. This technique aggregates the prediction of each classifier (here LR, DT, RF, SVM, and MLP; Figure 3b) and predicts the class that receives the most votes. This majority-vote classifier is called a hard voting classifier (Hvoting), otherwise, it is a soft-voting classifier (Svoting), where the class with the highest averaged class probability is selected as the final prediction [68]. Voting mitigates the impact of individual model biases and errors, leading to improved overall accuracy and robustness. For instance, the work of [3] found that majority voting effectively removed salt-and-pepper noise in its results for Convective Initiating objects predicted with DT and RF.
  • Stacking
Also known as stacked generalization or stacked ensemble, this technique is used to combine predictions from multiple models to improve overall performance [73]. In this assembly strategy, the aggregate models called base models (LR, DT, RF, SVM, and MLP; Figure 3c) are used according to their weights to produce an output that is taken using a Meta-Classifier as the input. Each prediction from the base models becomes a new feature in the Meta-Classifier Dataset. The main purpose of the stacking method is that the Meta-classifier learns to combine the predictions of the base models optimally, leveraging their individual strengths. In this work, LR and RF were used as Meta-Classifiers, because both models reported the best performance metrics individually (LRstacking and RFstacking).

3.2.3. Machine Learning Process

In order to compare the performance between the different ML approaches, they were trained and tested with the same dataset configuration for each of the test sites. Before training and testing each of the ML approaches, a feature importance analysis or relative variable importance analysis was performed to estimate the degree of contribution of each of the interest fields in the prediction stage. In this context, RF and LR provide the relative importance of input variables when developing models such as attribute usage, Mean Decrease Impurity (MDI), and the absolute value of weighting coefficients, respectively [3]. In particular, feature importances of RF are provided by the fitted attribute feature_importances_ (of the scikit-learn python library). This approach evaluates the importance of each feature by measuring how much it contributes to reducing impurity, specifically Gini impurity, as part of the iterative process of feature-based splitting. The relative feature importance analysis helps to reduce dimensionality, improve model efficiency, and mitigate the risk of overfitting from the selection of predictor variables with the highest degree of contribution to the identification of the CC class. A lower dimensionality dataset improves model performance by removing noise from lower weight attributes, while computational costs are substantially reduced. In this sense, Los Mochis and Mexico City datasets were delimited by reducing to six the number of features used as predictor variables. For this task, the predictor selection criteria were the values with the greatest relative variable importance in LR and RF.
After selecting the predictors and scaling the data, hyperparameter tuning was performed using GridSearchCV, a function provided by the scikit-learn library that performs an exhaustive search over a specified parameter grid to find the best combination of hyperparameters for a machine learning model. In this work, the cross-validation strategy was used during the hyperparameter search which selected 5 k folds. The resulting optimal hyperparameter values are presented in Table 4. Finally, the performance of the models was evaluated using various accuracy metrics.

3.2.4. Workflow and Implementation

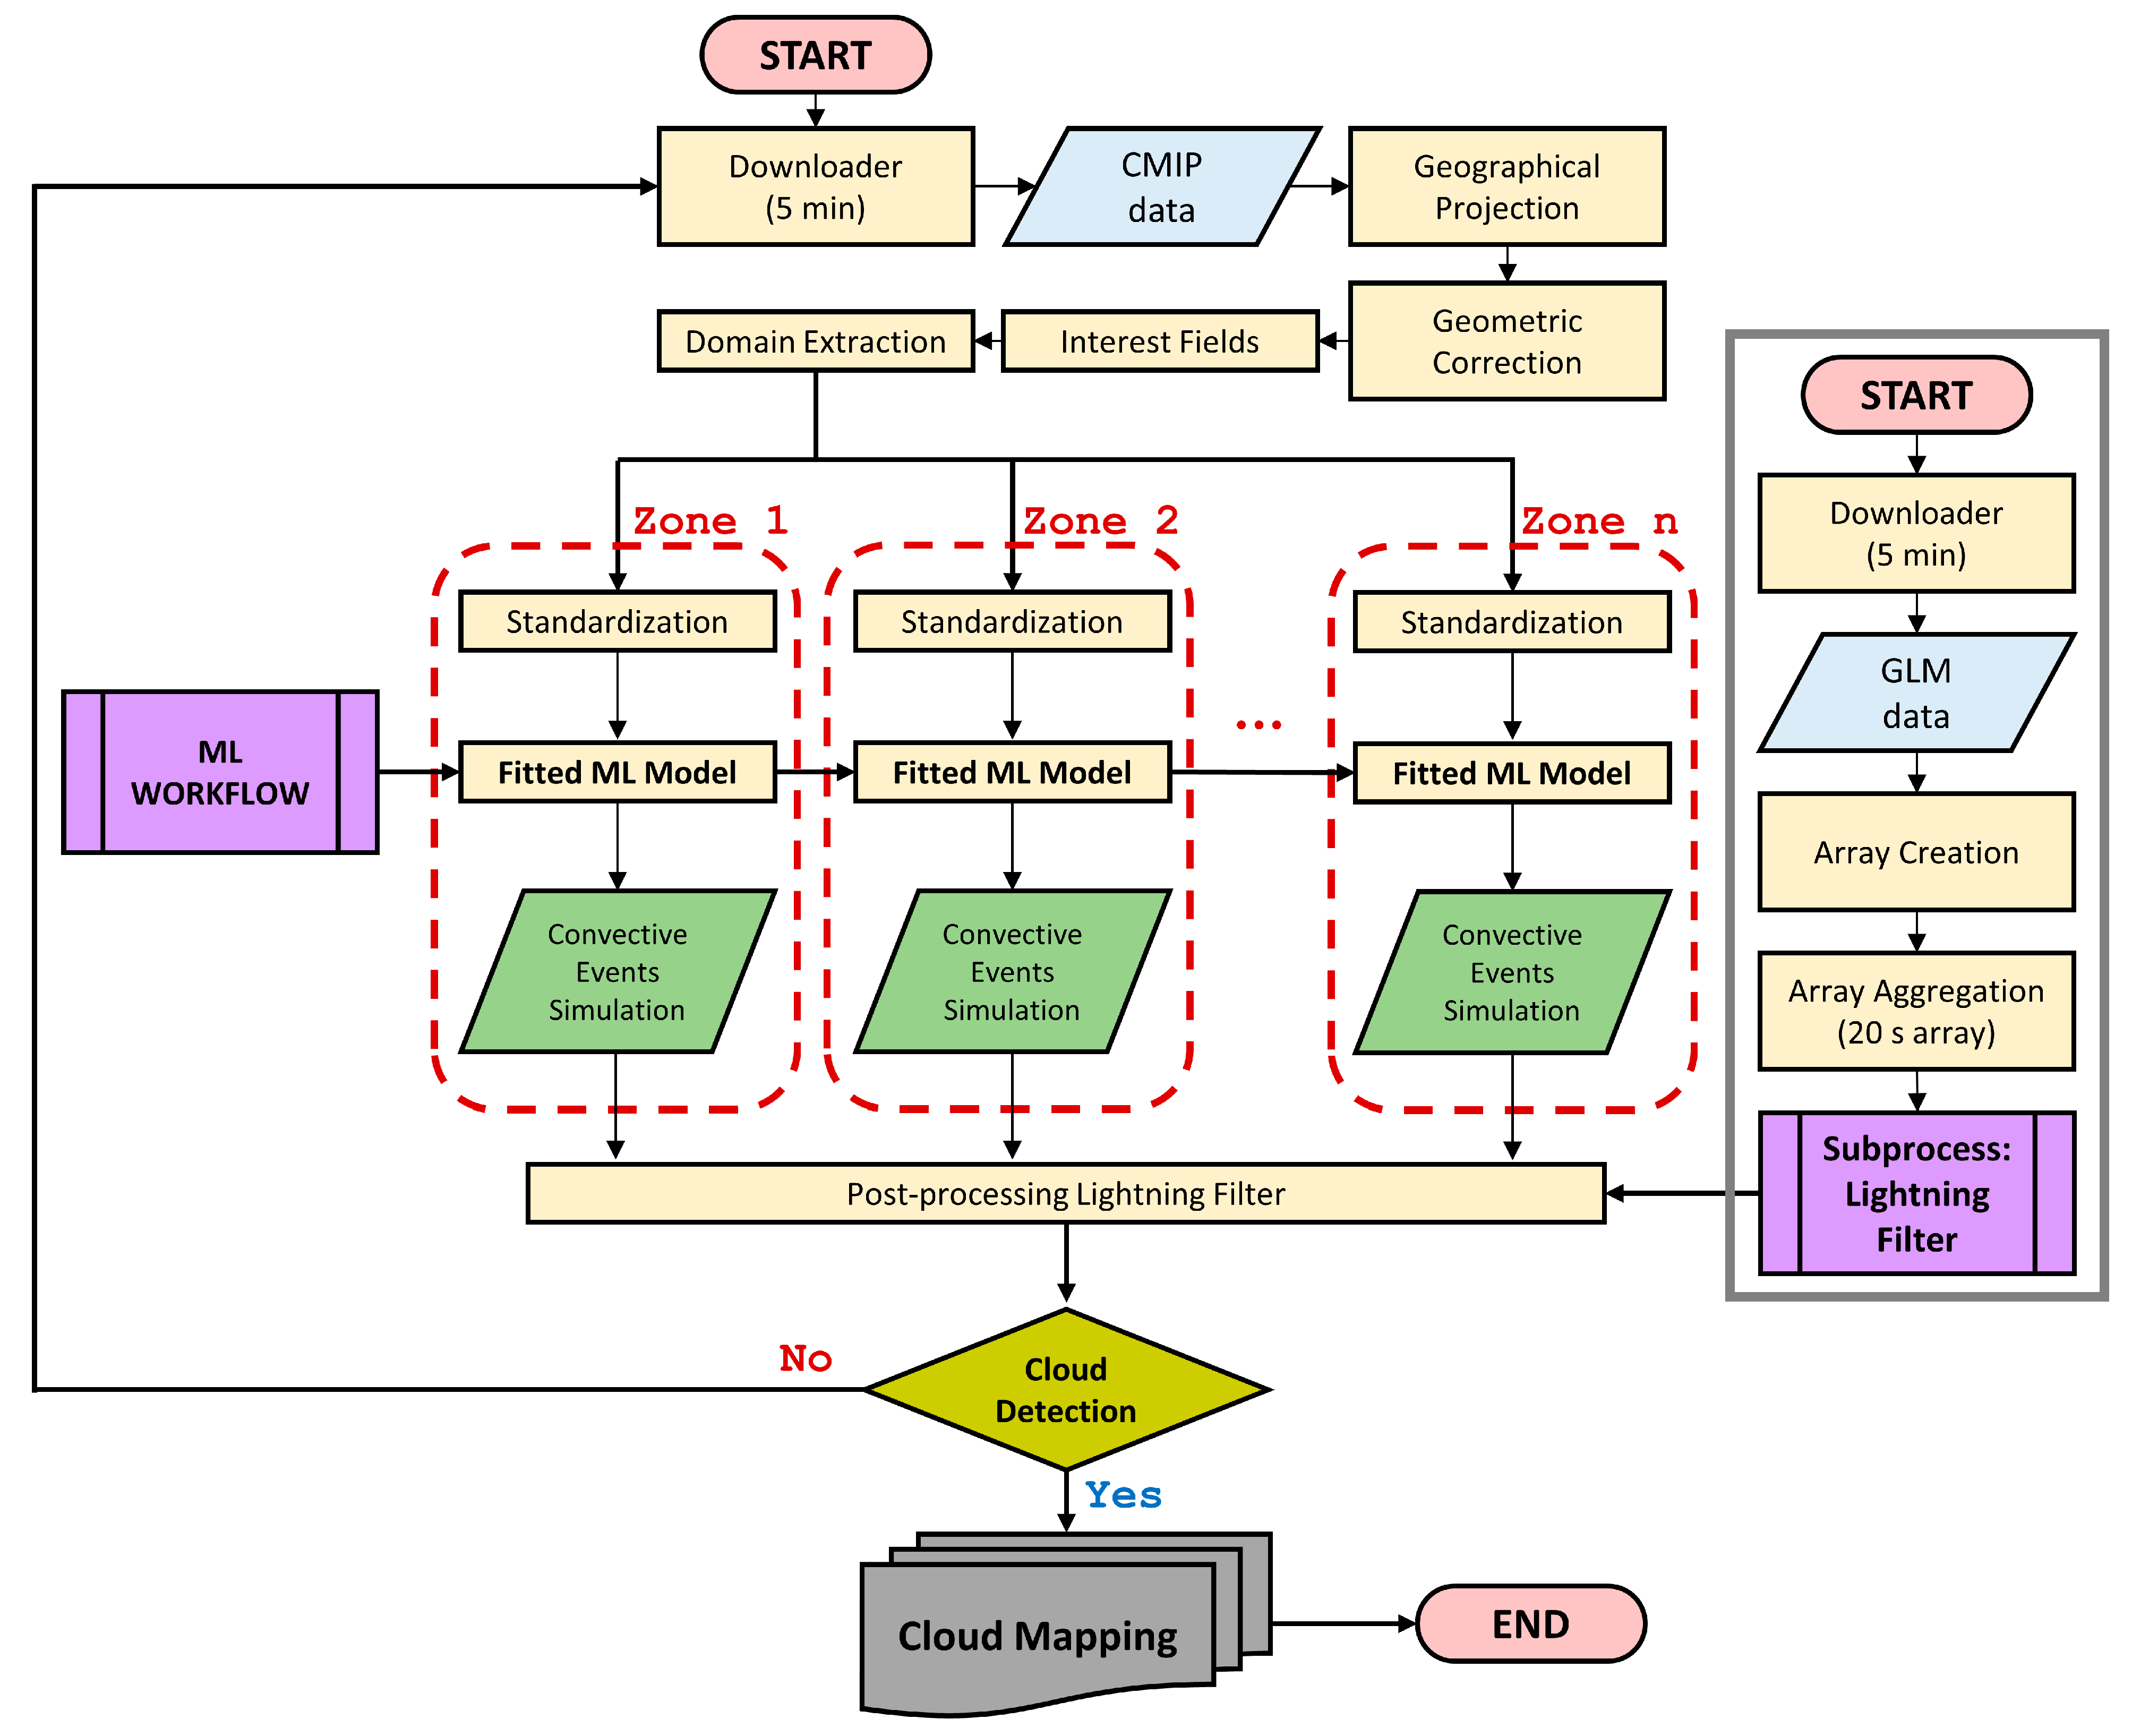
A quasi-real-time modeling framework was designed by considering the following three principles: the use of open-source software and open-access products, automation, and scalability (Figure 4). Regarding the principle of using only free-access products, all processes and the workflow were implemented with Python 3.8 programming and were designed using ABI and GLM products from GOES R as inputs.
The workflow runs cyclically and automatically every 5 min, corresponding to the temporal resolution of the ABI bands, and it begins with the download of ABI and GLM information from Amazon Web Service (AWS) S3 Storage (https://registry.opendata.aws/noaa-goes/, accessed on 5 December 2023) using Boto3, the AWS Software Development Kit (SDK) for Python. Concerning scalability, this novel methodology contemplates spatial extrapolation to the entire country of Mexico, following the principles of open access and automation, due to the availability of modeling inputs within the entire territory. However, for the training and testing phase of the ML models, zones with a homogeneous convective behavior must be delimited.
The spectral information that this framework is fed with (Table 1) is found in the GOES level 2 product, Cloud and Moisture Imagery (CMIP), which contains the information of the geostationary ABI bands in a NetCDF file [74]. Applying the parameters and attributes of the ABI instrument specified in the NetCDF file, projection to a mapping spatial domain is performed. Subsequently, the Interest Fields are calculated and spatial extraction of the study domains is performed.
In the second step, the pipelines (i.e., assembly of sequential data manipulation operations) of preprocessing and modeling are fed with the Interest Fields. Previously, at each site of interest, the models were trained and tested based on the creation of a set of reference historical events. When the optimal models and hyperparameters, as well as the significant variables that will be used as predictors, are identified, these configurations are stored in a pipeline (dashed red border Figure 4). The processing pipeline considers the scaling phase of the predictors from the StandardScaler method. The pipeline methods were taken from scikit-learn.
Pipeline outputs are mapped using the Python Matplotlib Basemap Toolkit library, which displays the geospatial information. A lightning incidence-based post-processing filter is additively integrated to identify potential deep convection zones not detected by ML models. The process runs iteratively again after 5 min.

3.3. Post-Processing Lighting Filter

To strengthen the output of the models, a post-processing lightning incidence-based filter has been integrated into the CC identification and monitoring framework. According to [2], the presence of lightning is a reliable indicator of intense convective activity typical of storm cloud formation environments. Several studies related to the detection of deep convective clouds include lightning data [3,22,23,24,64,75,76].
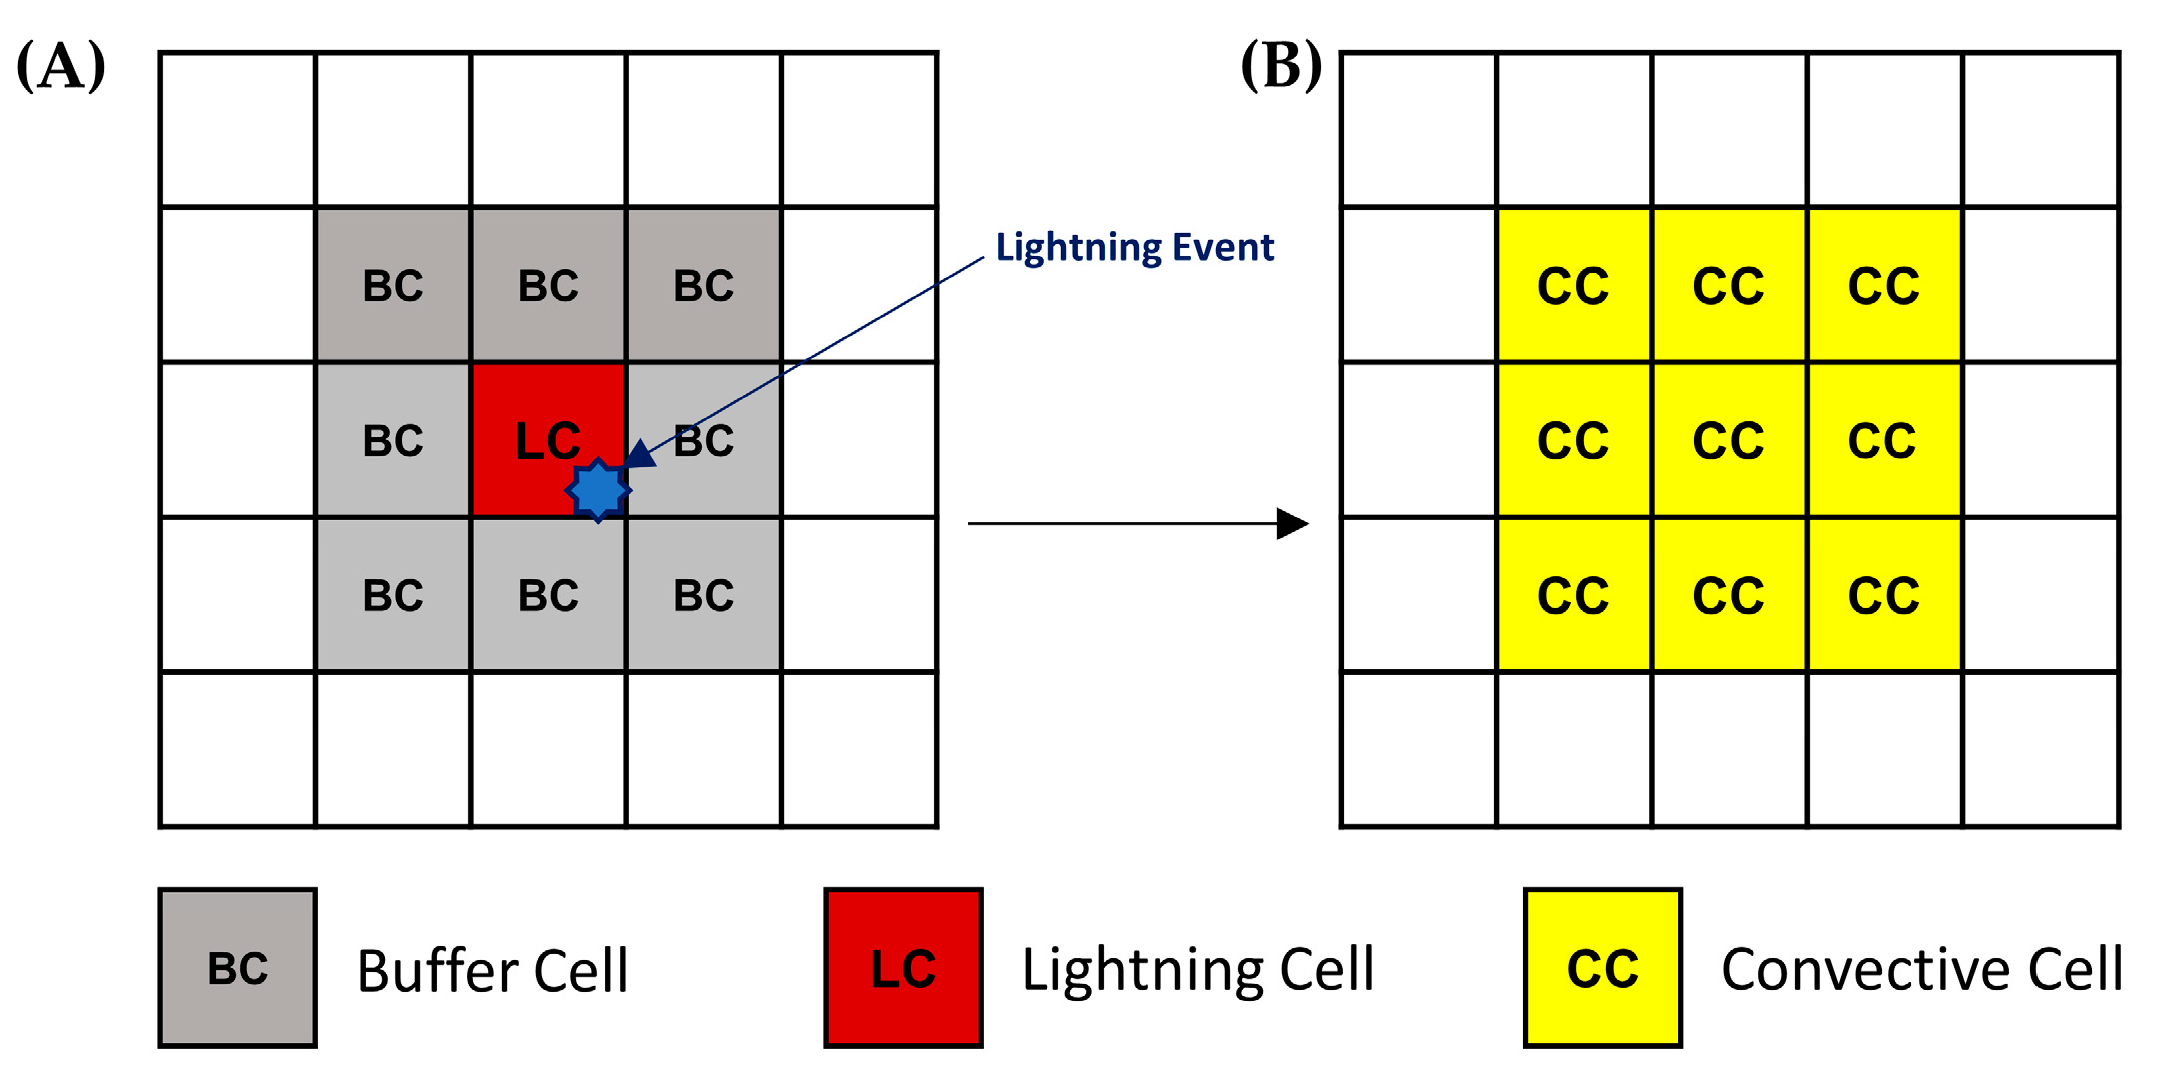
The GLM GOES data are used to generate a lightning matrix that is additively integrated into the output of the ML models to increase the probability of detection (POD) of the models. The GLM variable “Event” was selected, which represents the occurrence of a single-pixel exceeding the brightness detection threshold during one ~2 ms frame [77]. These products contain geospatial information on the incidence of lightning with a temporal resolution of 20 s. In this framework, the density or number of lightning strikes is not considered, and only the presence or absence of the meteor is taken as an indicator of CC. From the spatial location where the lightning is detected, an algorithm based on Euclidean distance (Equation (2)) is applied to associate it with the nearest cell center of the spatial domain of the Interest Field.
  D i s t a n c e L I , C e = L o n g i t u d e C e L o n g i t u d e L I 2 + L a t i t u d e C e L a t i t u d e L I 2
where Ce is the cell center of the Interest Field spatial domain and LI is the coordinate where the Lightning Event was registered. In addition, a 3 × 3 cell buffer was designated around the CC cell identified from the lightning filter (Figure 5).

3.4. Accuracy Metrics

To assess the performance of the different ML approaches, well-known classification metrics were calculated from the confusion matrix, including the Probability of Detection (POD), False Alarm Ratio (FAR), Critical Success Index (CSI), Total Classification Accuracy (Acc), Bias (BIAS), Precision, F1 Score (F1), and Intersection Over Union (IoU):
P O D = T P T P + F N
F A R = F P F P + T P
C S I = T P T P + F P + F N
A c c = T P + T N T P + T N + F P + F N
B I A S = T P + F P T P + F N
P r e c i s i o n = T P T P + F P
F 1 = 2 · P r e c i s i o n · P O D P r e c i s i o n + P O D
I o U = T P T P + F P + F N
where TP is the number of CC pixels that were correctly classified as CC (i.e., true positives), FP indicates the number of CC pixels that were incorrectly detected as CC (i.e., false positives), FN is the number of CC pixels that were incorrectly marked as noCC (i.e., false negative), and TN is all the remaining pixels that were correctly classified as noCC.

4. Results and Discussion

4.1. Selection of Interest Fields

Table 5 shows the Interest Fields selected according to their relative variable importance for CC cell detection with the LR and RF models for Los Mochis and Mexico City. In both study areas, according to the principal component analysis (PCA), the number of principal components that collectively explain 95% of the total variance in the datasets was five, which means that the dimensionality of the datasets is potentially reduced to five components while still retaining a significant amount of information from the original dataset. Here, the first five Interest Fields with the highest weighting coefficients in LR and highest MDI values in RF were selected. In both cases, the Interest Fields with the highest degree of contribution in the detection of CC cells coincided with four predictor variables, CtT, CtH01, CtH02, and CtH03. Accordingly, the dimensionality of the original datasets was reduced from 12 to 6 components.
The Interest Fields that recur in both models and zones are the most significant for the detection of deep convective clouds. For example, the Interest Field CtT, corresponding to the values of cloud-top temperature detected using the ABI-GOES 14 channel (11.2 µm TB), is one of those with the highest degree of contribution in both study sites, because the temperature at the top of the cloud is cooler than the surrounding environment being a typical property of deep convective clouds. During the convection process, this type of cloud reaches significant altitudes to regions where the atmospheric pressure is lower, giving way to the adiabatic cooling process, where the rising air expands and cools as it moves upward through the atmosphere [78], resulting in the temperature at the top of the cloud presenting significantly lower values. CtT is the Interest Field with a high degree of importance that is recurrent in other works; for example, Refs. [3,17,18] reported that CtT greatly contributed to the identification of Convective Initiation event (i.e., the probability that a given cumulus cloud object will develop into a ≥35-dBZ-intensity radar echo at −10 °C altitude [9]). In addition, in [28,79], CtT was identified as the most contributing variable to overshooting convective cloud tops’ (OTs) classification using RF and LR models.
The following Interest Fields in order of importance are CtH01, CtH02, and CtH03. These spectral differences between ABI-GOES channels provide information on cloud-top height (cloud depth [3]). Similar to CtT, CtH01 is one of the variables with a higher degree of contribution in the detection of CC cells. This Interest Field is used to determine lower stratospheric moisture, and it is positive when water vapor is present above the cloud tops, which is an indicator of the presence of OTs [28]. For the glaciation indicators, only CtG01 was determined as one of the most significant variables.
Despite the time trend variables proposed as Interest Fields providing information on the rate of vertical cloud-top growth, in general, these variable predictors resulted in relatively lower contributions in both LR and RF models (except TChCtH03 in the Mexico City site).
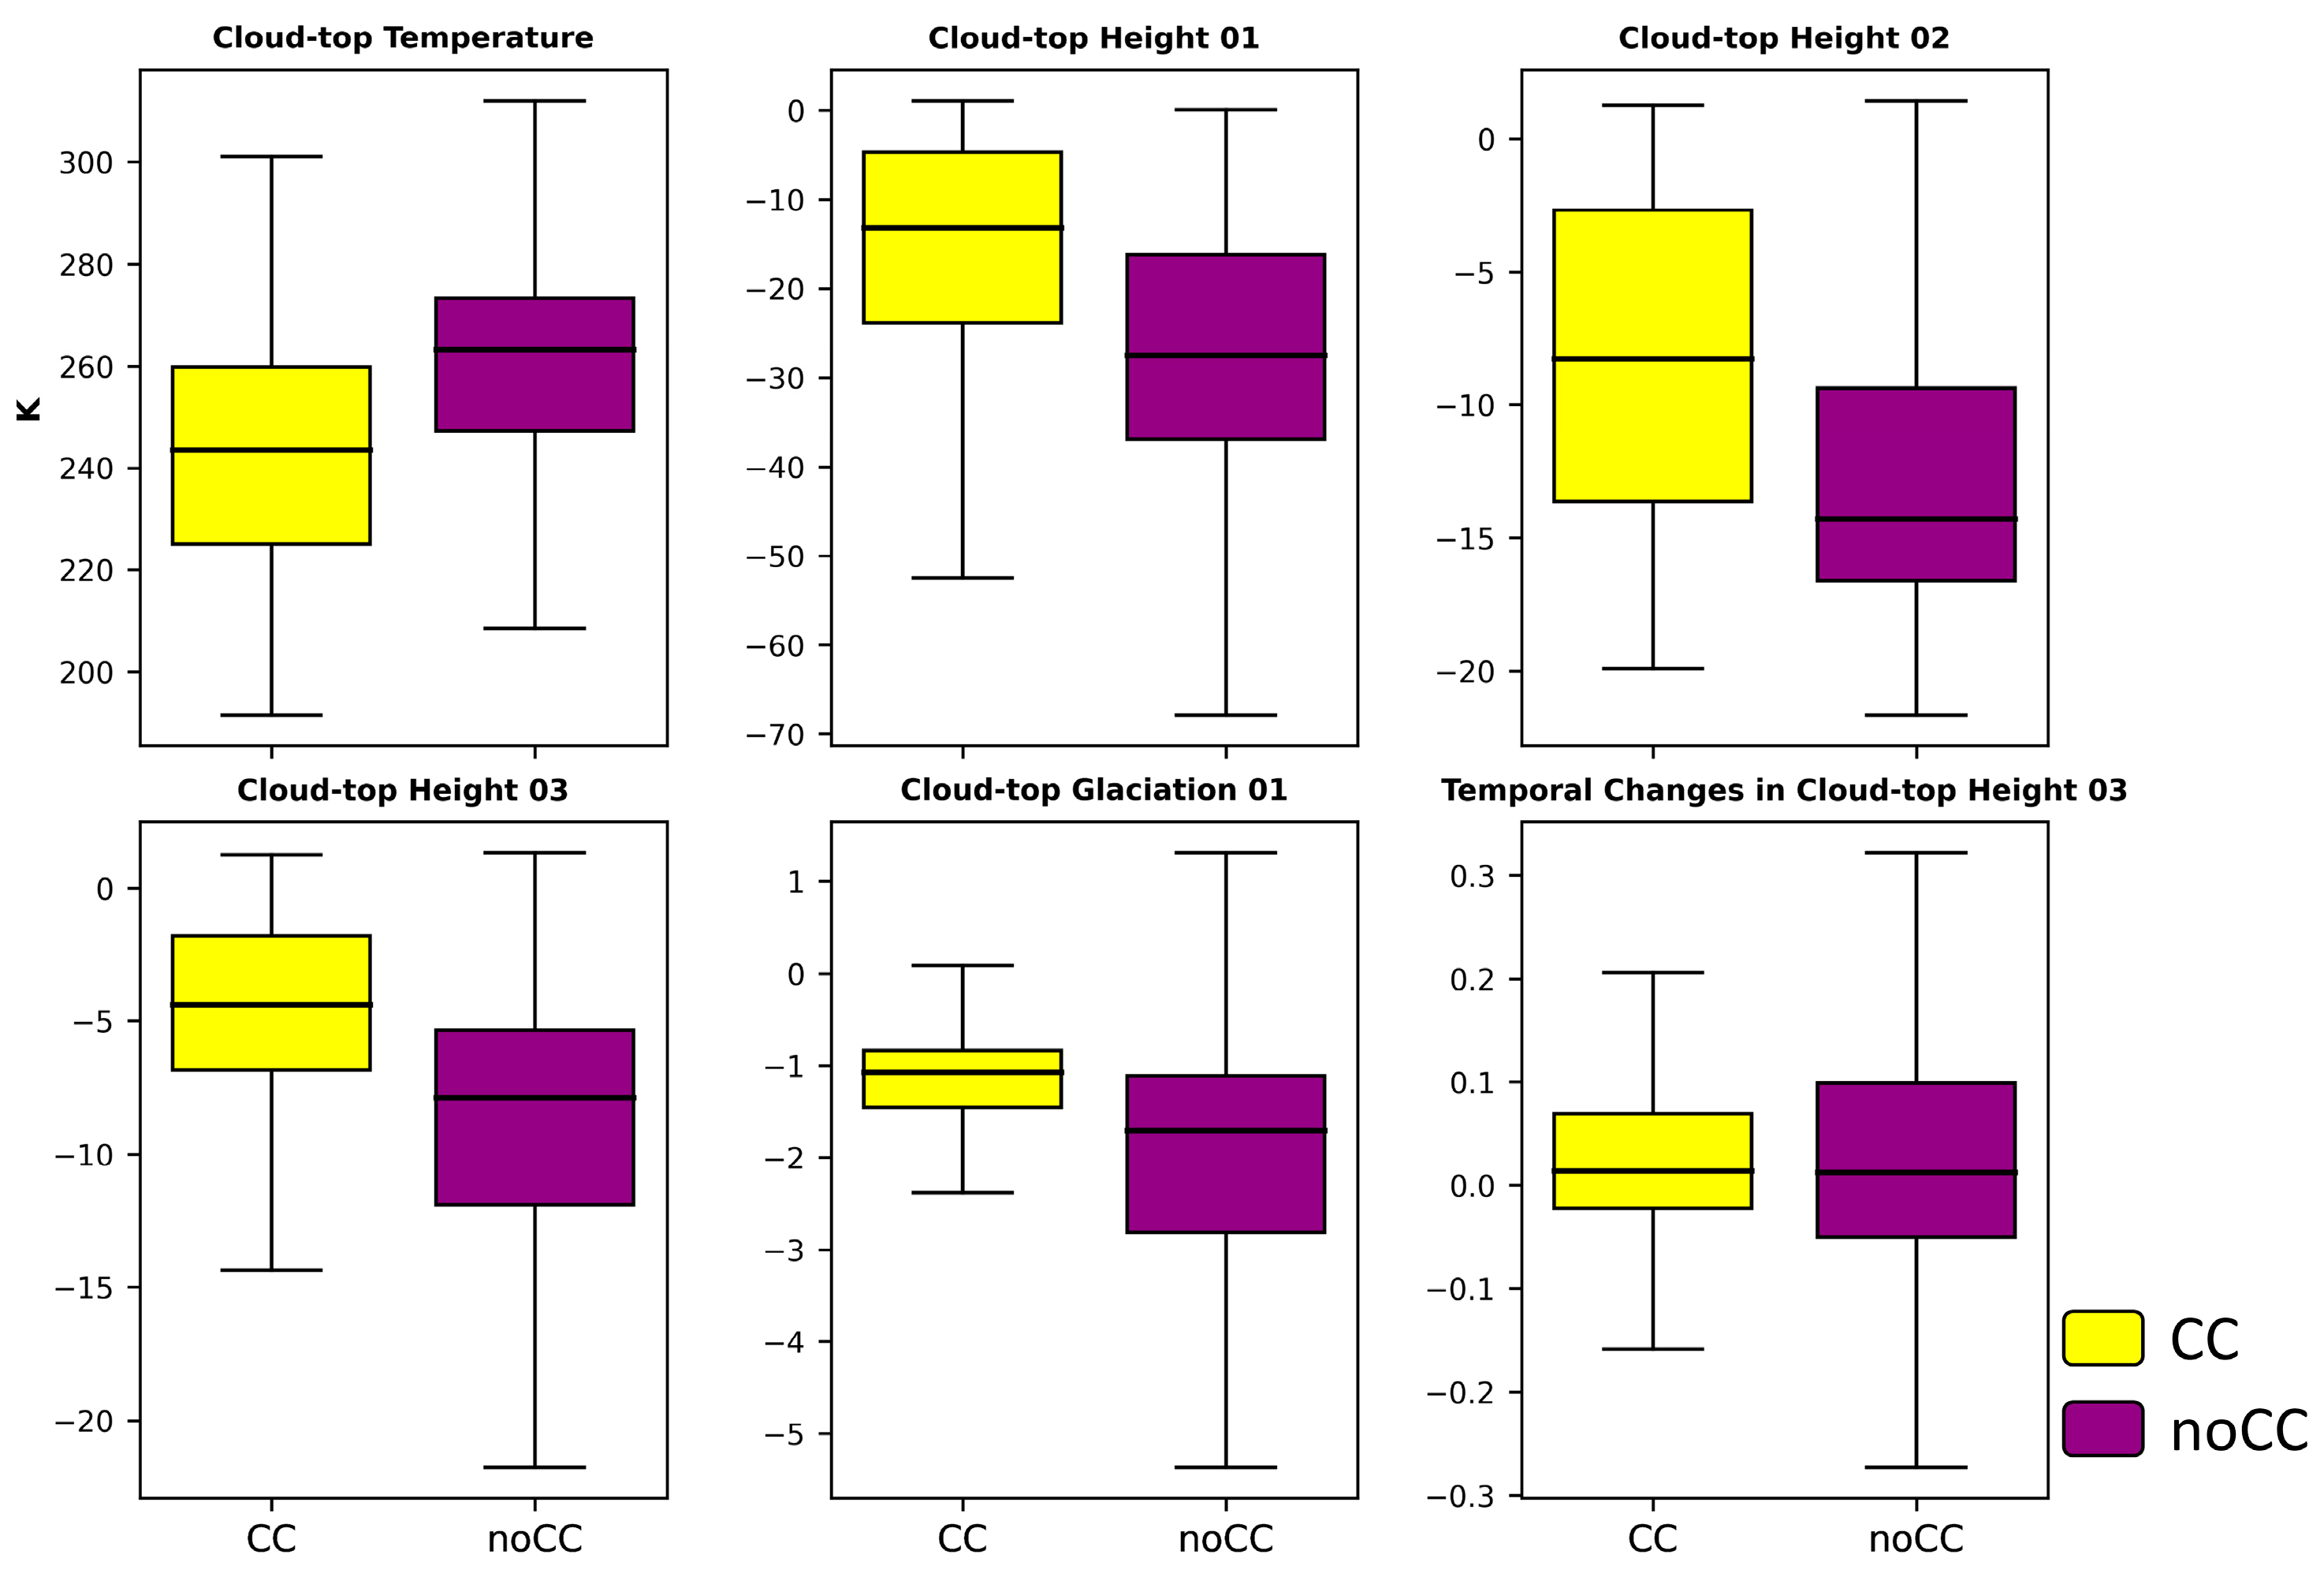
The distribution of Interest Fields selected after feature importance analysis for Los Mochis and Mexico City are shown in Figure 6 and Figure 7, respectively. CC and noCC sets are statistically differentiable in the six selected Interest Fields (which improves the classification task in the ML models) for the Los Mochis area. For the CC class, there are extremely small Inter Interquartile Ranges (IQRs) with a median close to 0 in the case of the spectral difference fields, and in that sense, ref. [28] claims that as a cloud reaches its local equilibrium level or the height of the tropopause, all channel differences will be almost zero. On the other hand, with the noCC class, the data distribution is much broader. In the case of the cloud-top temperature (CtT) field, the cells present higher values because the tops of the deep convection clouds are colder due to adiabatic cooling. In the case of the spectral difference fields, these mostly present negative values.
For the case study of Mexico City, overlapping distributions can be seen in the boxplots of the selected Interest Fields, which are reflected in the performance metrics of the ML models, which are notably lower than the metrics in the case of Los Mochis (Section 4.2). However, the general trends are preserved, and the CtT values are lower for the CC class; moreover, in the spectral difference fields of both height and glaciation, the noCC values are lower. Concerning the IQRs of the predictors, the distributions are more balanced for both classes, which, together with the distribution overlap, allows us to infer greater complexity in the modeling of CC events than at the Los Mochis site. Returning to the CtT Interest Field, its high degree of contribution to the detection of the CC class has been clearly shown, and cells with lower temperature values are associated with the presence of potential storm clouds. In this context, ref. [80] lists some cloud-top temperature thresholds reported in studies related to the identification of deep convection clouds, for example, 241 and 221 °K [81], 221 °K [82], 225 °K [83], 255 and 206 °K [84]. Here, it was estimated that storm clouds manifest at a CtT threshold of <220 °K for the Los Mochis study site and <260 °K for Mexico City.

4.2. Performance and Validation of Detection Models

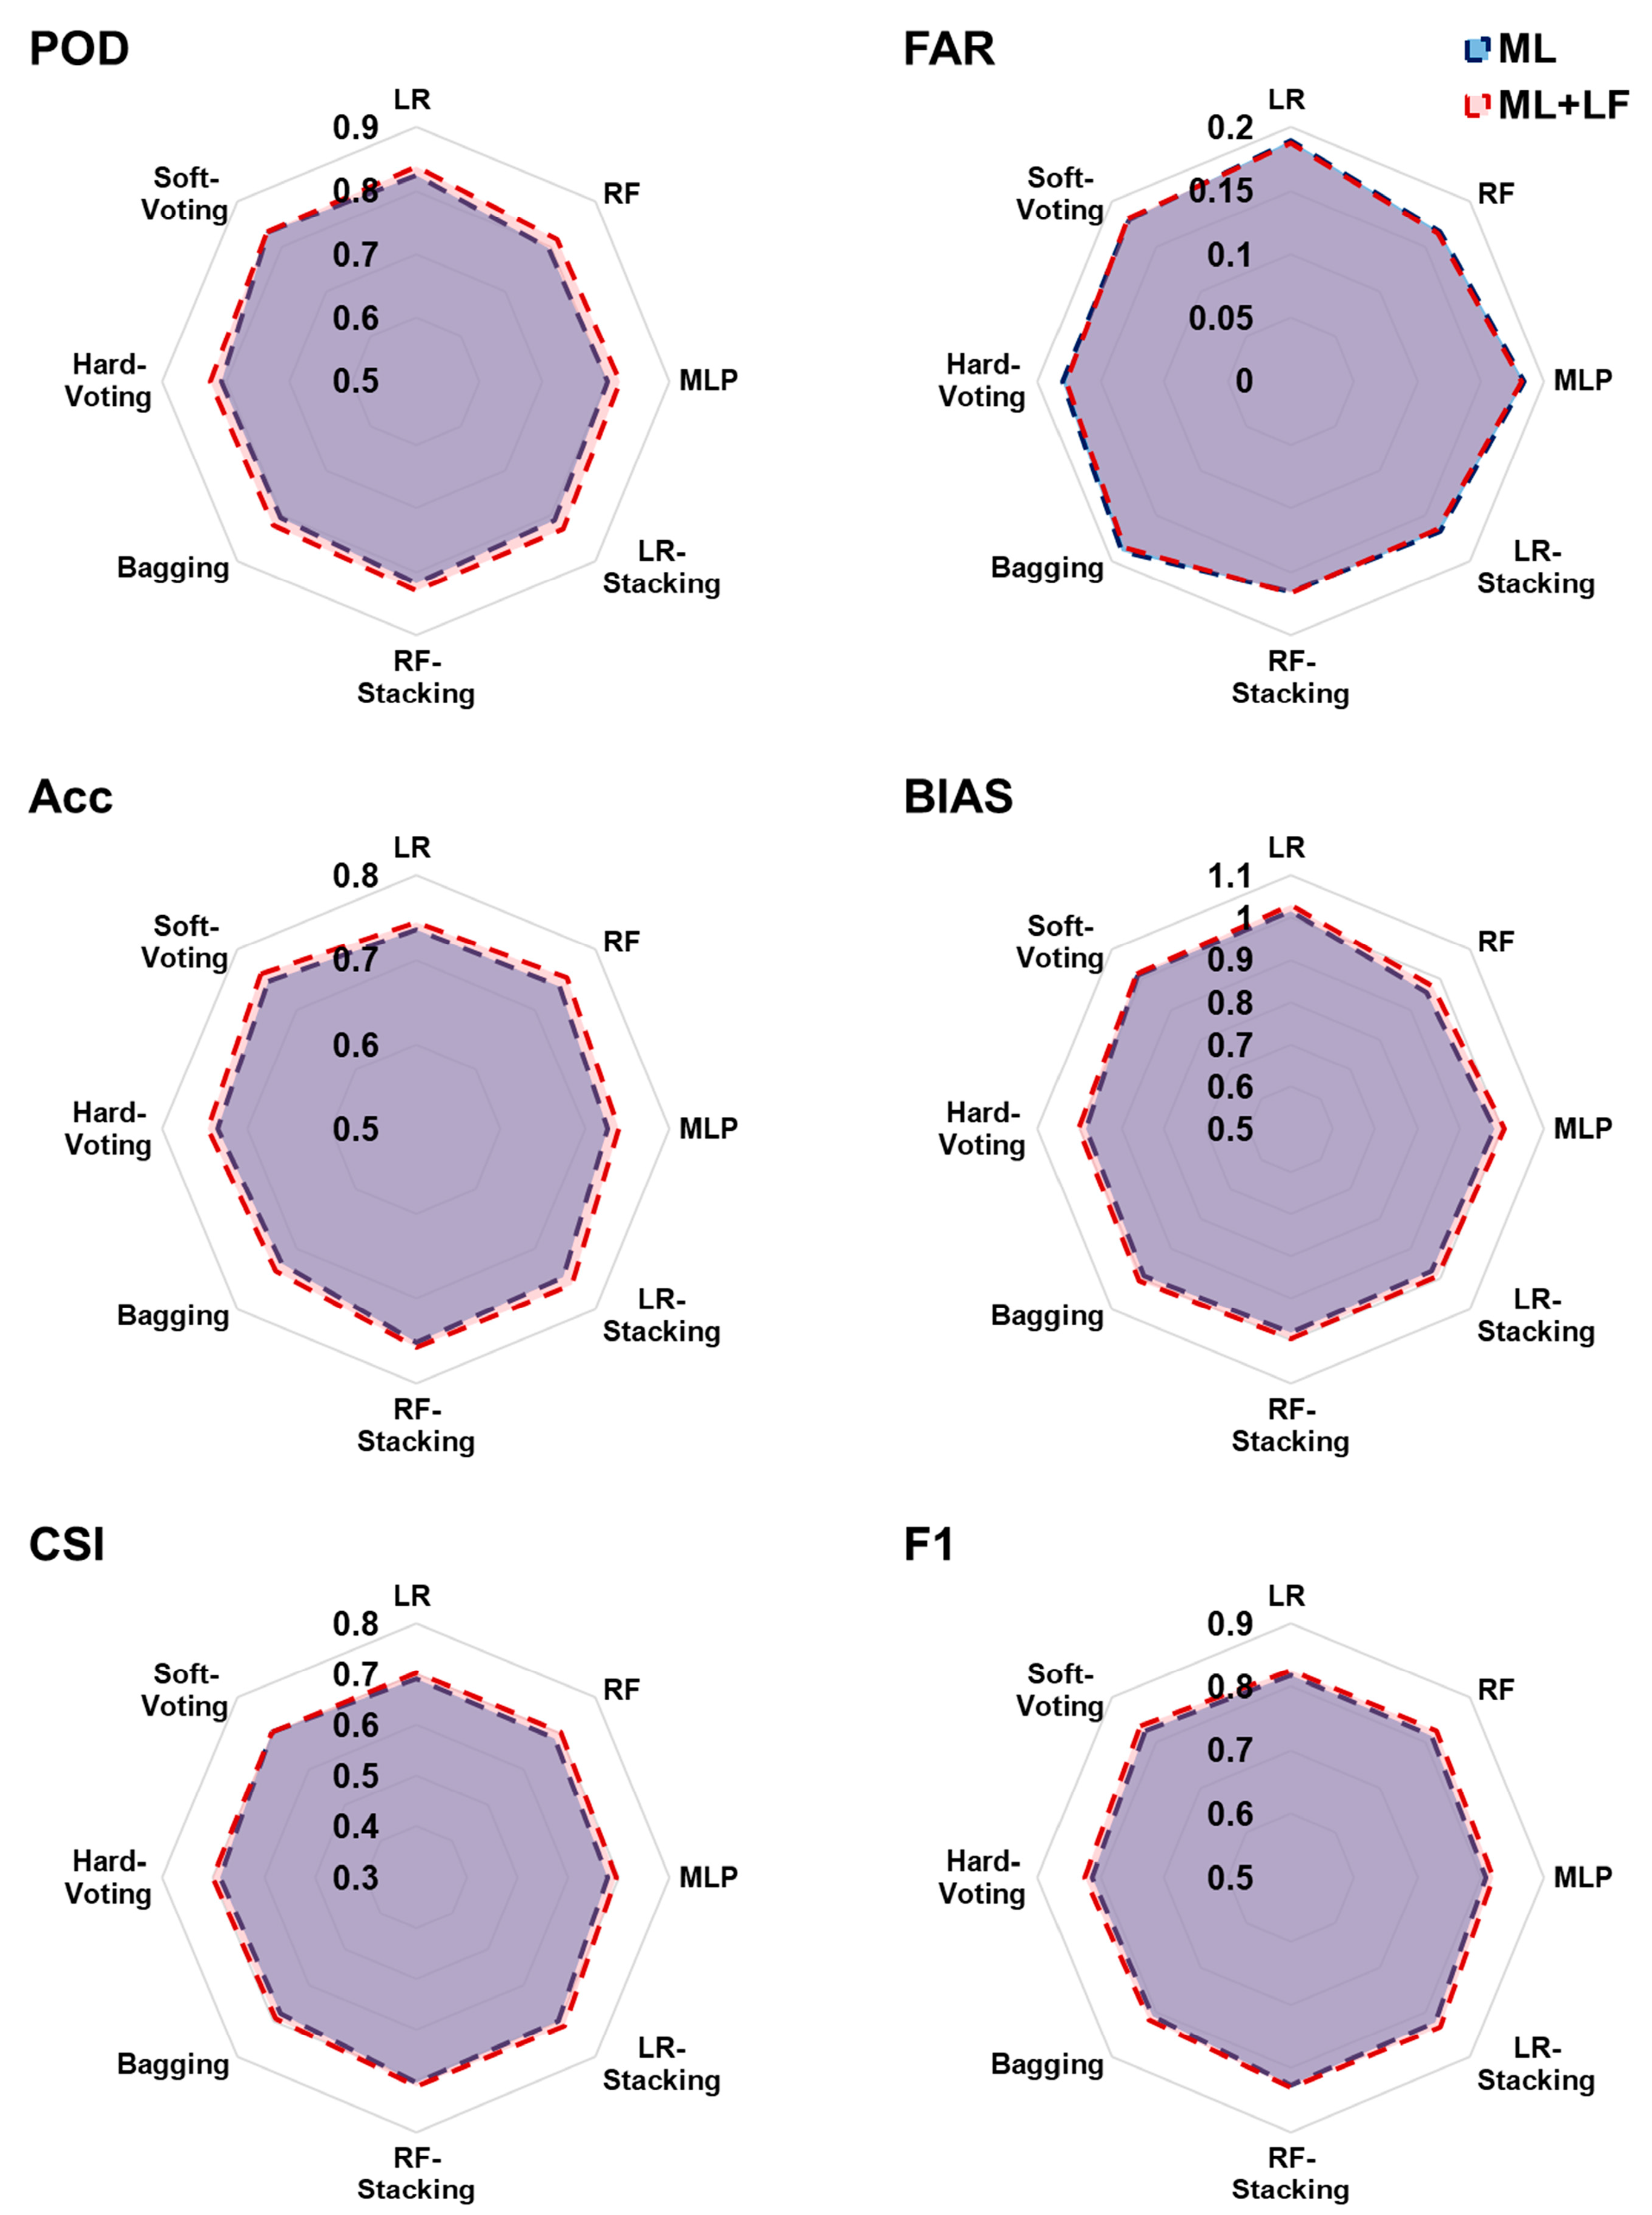
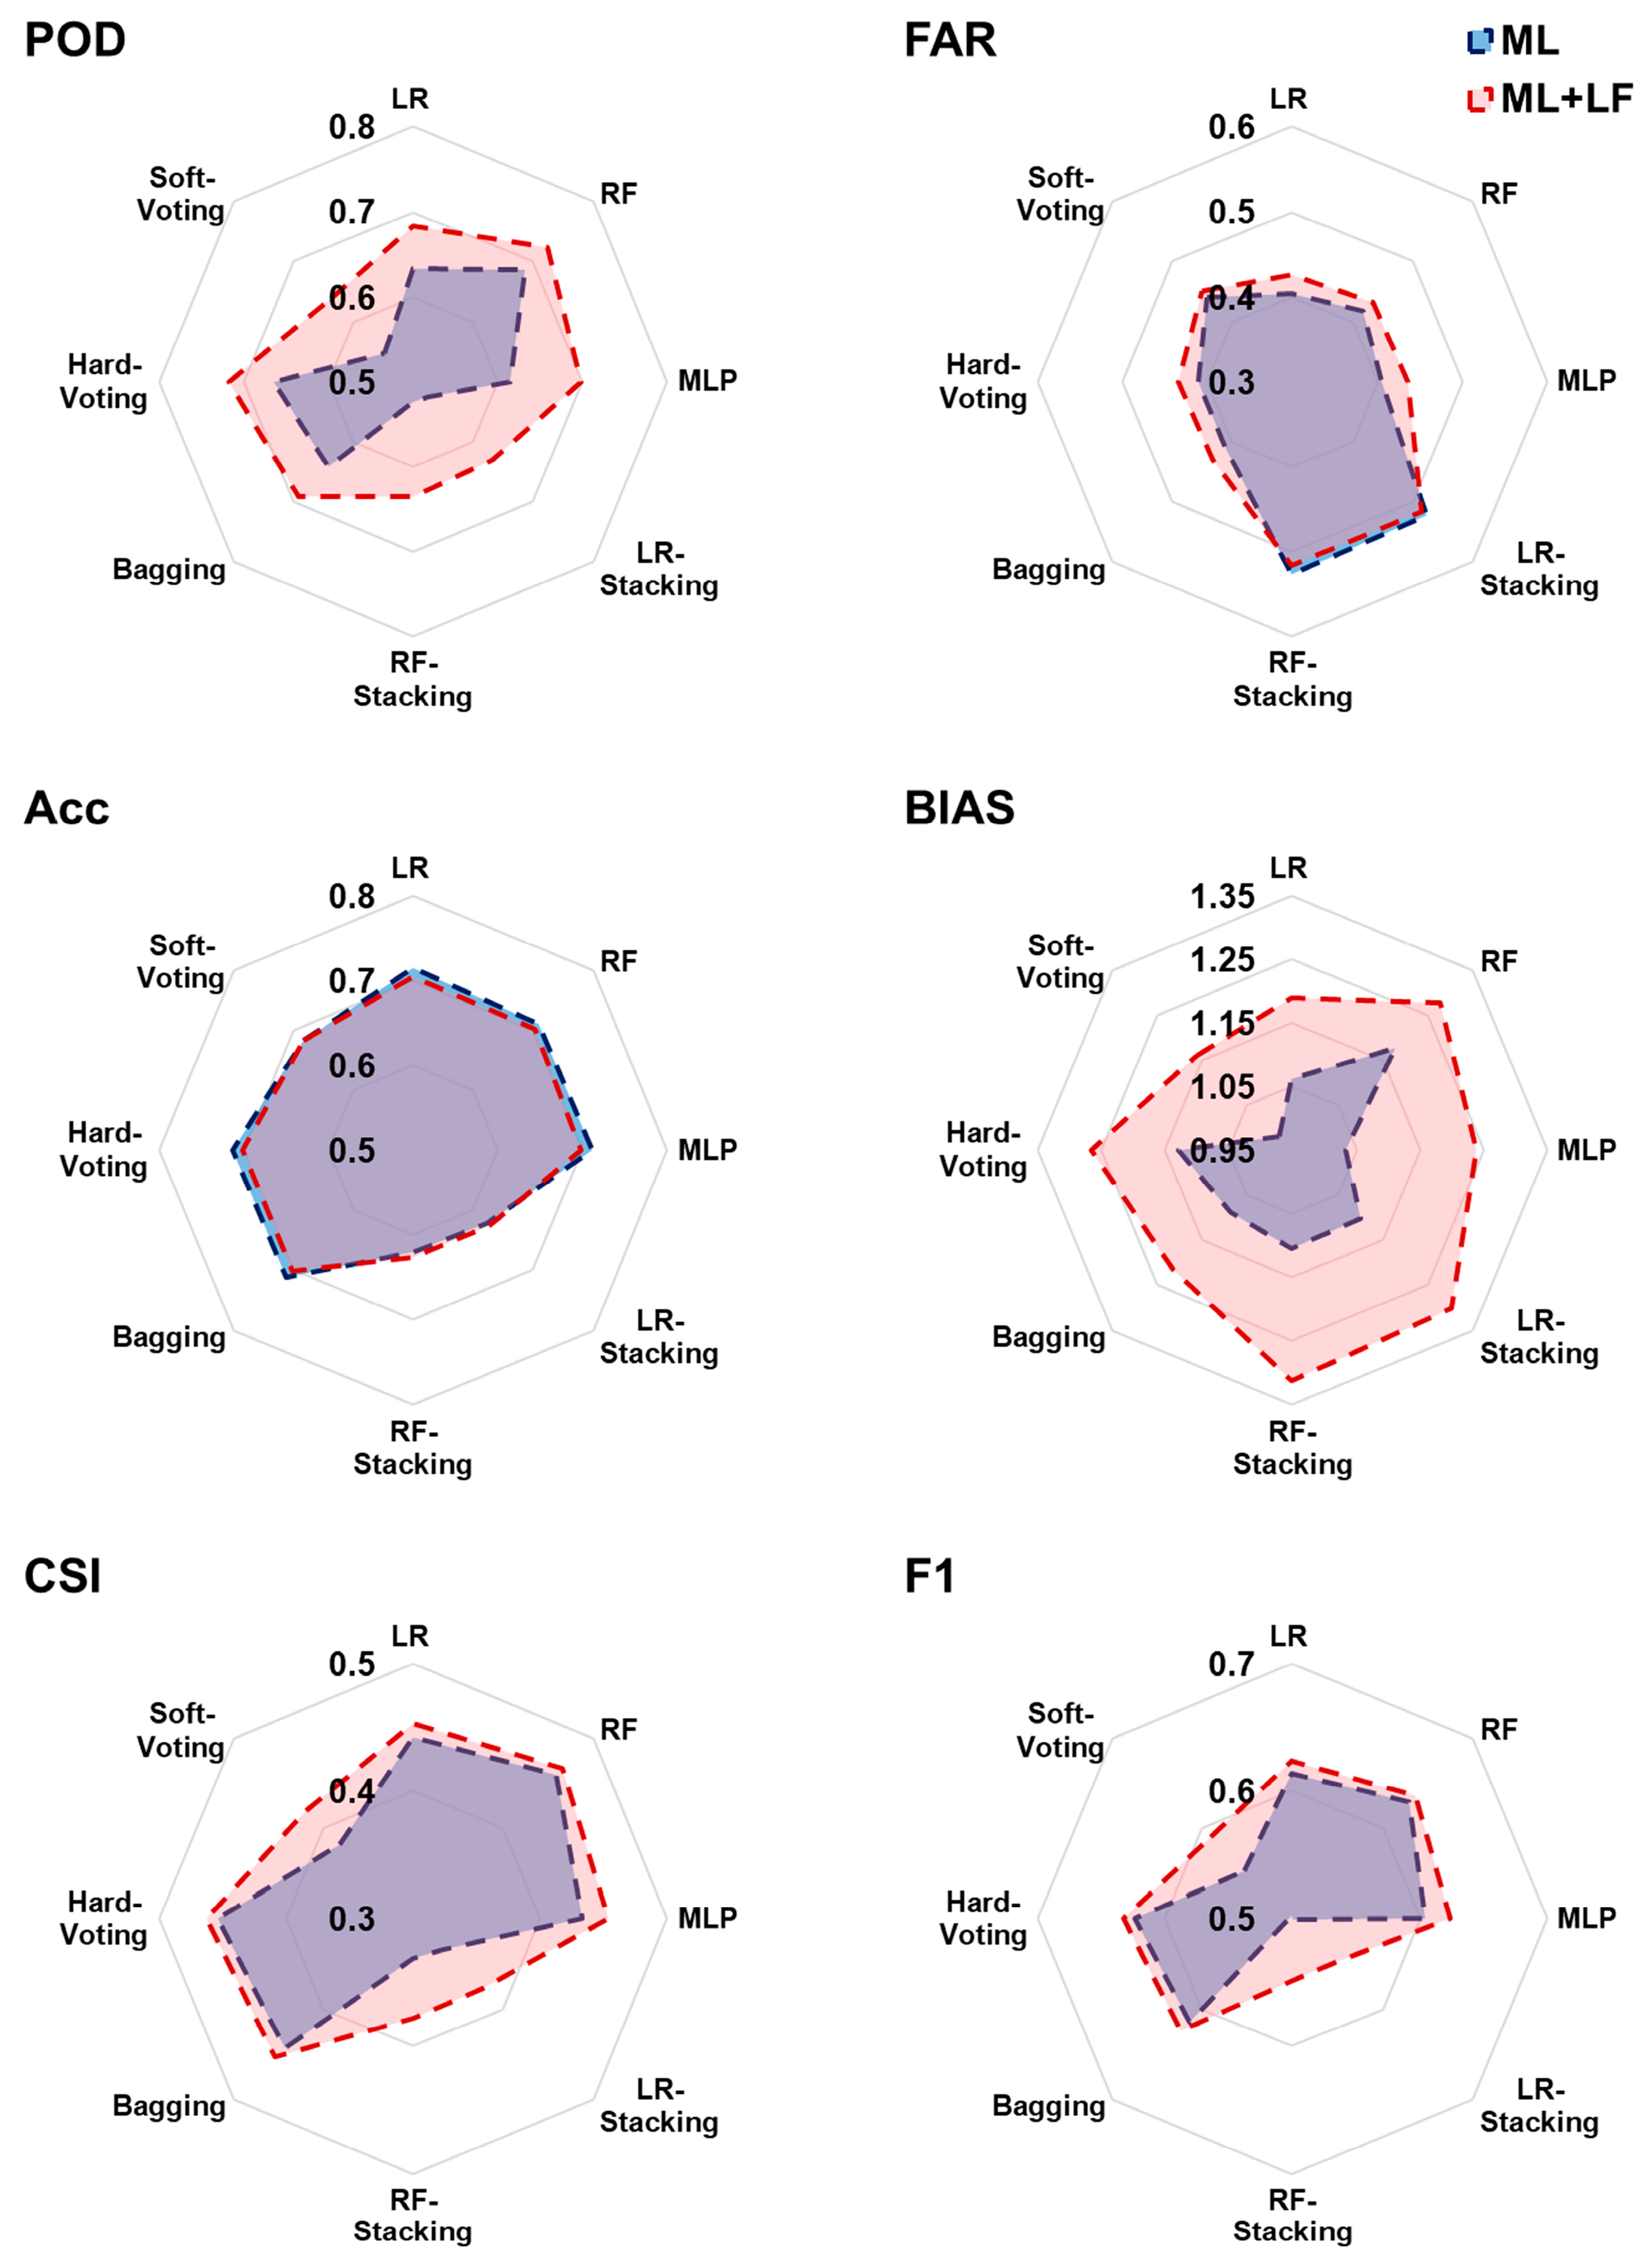
Each ML approach was evaluated on the basis of six performance metrics that indicate each model’s ability to detect convective cells, false alarm rates, etc. The effect of a post-processing filter based on lightning incidence was also evaluated. Figure 8 and Figure 9 show the results for datasets corresponding to Los Mochis and Mexico City, respectively.
For the Los Mochis site, there is a small difference between the results of the ML approach (ML series) and those with the integrated post-processing filter (ML + LF). In this regard, the ability of the models to detect the CC class, represented by the POD metric, presents values close to 0.8, while the false alarm ratio (FAR) in all the ML approaches is lower than 0.2. This means that the presence of potential deep convection events can be efficiently detected without the need to integrate the lightning incidence data. However, this does not indicate that the presence of lightning is uncommon in this zone; on the contrary, Ref. [85] reported a significant lightning strike density in northeastern Mexico. The region with the highest presence of lightning activity is in the narrow strip between the Sierra Madre Occidental and the Gulf of California, with a maximum in the months of July and August, corresponding to the dates used to construct the datasets of this research work. In addition, the presence of lightning strikes from the GLM-GOES was detected in 8 of the 14 images used to construct the training and test datasets.
Nevertheless, the Mexico City site shows significant changes when the Lightning Filter is integrated, especially favoring the POD, CSI, and F1 metrics. For example, the highest value was POD = 0.68, obtained using RF, which increased to POD = 0.72 after post-processing. The second-highest POD was achieved with LR, which increased from POD = 0.63 to POD = 0.7 with the integration of the Lightning Filter. Comparatively to the Los Mochis dataset, in Mexico City the integration of GLM data significantly improves the system’s ability to detect the CC class in all ML approaches because lightning strike incidence is a reliable indicator of a deep convection event generation, and, like the Los Mochis site, this zone has intense lightning activity. In addition to POD, the CSI and F1 metrics increased in ML approaches with lower overall performances, such as LRstacking and Soft-Voting. On the other hand, LF has a negative impact on the BIAS metric, increasing the values above the optimum of 1. This metric ranges from 0 to infinity and allows us to assess whether the forecasting method tends to underestimate the CC (BIAS < 1) or overestimate it (BIAS > 1 [86]). In this sense, this metric, by presenting values greater than 1 when integrating the Lightning Filter, could reveal one of the limitations of labeling convective cells with the MODIS sensor, which has a lower resolution than the ABI-GOES products, since there are areas labeled as noCC that present lightning activity that clearly indicates the generation of a convective environment. Therefore, in future work, it will be proposed to include unsupervised learning approaches that simplify the task of generating a reference set with another sensor.
Overall, for the Los Mochis dataset, no significant differences were found between the use of model ensembles and simpler approaches such as LR, which is consistent with the findings of [17,23,28], who reported that this model is a robust alternative for convective-hazard modeling and detection. In contrast, for the Mexico City dataset, significant differences in the performance of each ML approach were observed. These differences are variable for each metric, but it is perceivable that LRstacking, RFstacking, and Soft-Voting are the ML approaches with the poorest performances. Instead, for all six metrics, LR, RF, MLP, Bagging, and Hard-Voting showed similar performance.
Regarding the POD values, ultimately, the acceptable level of POD may vary depending on the specific goals and requirements of the forecasting or detection system. However, a high POD may be necessary to minimize the risk of missing hazardous events. In this sense, for the Los Mochis dataset, the highest value was POD = 0.84, while in the Mexico City dataset it was POD = 0.72, with both estimated with LR after post-processing filtering. In this context, Refs. [28] and [29] report performances of POD = 0.77 and POD = 0.79, respectively, in their work on Ots’ detection, while [3] and [2], who studied CI detection, obtained values of POD ≈ 0.8 and POD > 0.7. Other examples are [87] with their proposed pre-convective-environment alerting and monitoring system, which obtained a POD between 0.66 and 0.7; on the other hand, [88] with his convective storm nowcasting based on CNN, POD values were close to 0.7.
The FAR metric provides information about how often the classifier makes incorrect positive predictions when it should not. In the case of Los Mochis, the FAR values were below 0.2, and these indices did not show significant variations among the different ML approaches, with values between 0.16 and 0.18. In contrast, in Mexico City, significant variations were observed, with the highest values being LRstacking and RFstacking with FAR = 0.51. For the rest of the ML approaches, it can be seen that LF increased the number of false alarms, but to a lesser extent. For example, for LR, a change from FAR = 0.40 to 0.42 was estimated, whereas for RF, the change was from FAR = 0.41 to 0.43. In the literature, FAR values vary significantly depending on the type of convective forecasting performed. For example, [28] and [29] reported FAR values = 0.3 and 0.09, whereas [89] obtained FAR values between 0.01 and 0.18. For CI detection, ref. [2] estimated FAR values between 0.46 and 0.83; [3] a FAR ≈ 0.2; in [17] the FAR ranges between 0.22 and 0.36; and in [18] 0.46 to 0.37.
Accuracy provides an overview of how effective a model is at correctly classifying samples. In the Los Mochis dataset, there are no significant differences between the Acc values of the ML approaches, which generally have values slightly higher than 0.7. In this case, the addition of LF increases the Acc value, but not substantially. In Mexico City, the lowest values were recorded for LRstacking and RFstacking with Acc = 0.62, while LR, RF, Bagging, and Hard-Voting had Acc values of 0.7. This metric is susceptible to bias in datasets with class imbalance because it does not consider the distribution of classes in the dataset. Therefore, it is important to complement the performance analyses of the models with other performance metrics. Here, the Acc values between Los Mochis and Mexico City were more similar than the other metrics because there was more class imbalance in the Los Mochis (CC class = 69%, noCC class = 31%) than in the Mexico City dataset (CC class = 42%, noCC class = 58%).
BIAS is another common metric in studies related to the detection of convective events (e.g., [86]), as well as in the forecasting of convective hazards such as lightning strikes (e.g., [24]) because it evaluates whether the forecast method tends to underestimate or overestimate the CC occurrence. The estimated BIAS values for Los Mochis range from 0.97 to 1.03, showing a relatively good performance in terms of false alarms and misses. In contrast, in Mexico City, there is an important variation between the ML approaches, with values up to BIAS > 1.15 for RF, which increases to BIAS > 1.25 after LF. The analysis of different metrics allows for the evaluation of the forecasting framework proposed in this study. In this sense, the integration of data from the GLM increases the overestimation rate of the CC class concerning the reference target dataset, but it favors the ability of the system to detect the occurrence of CC.
CSI measures the accuracy of a forecast in predicting the occurrence of a specific event (e.g., severe thunderstorms) relative to observations. It is particularly useful in situations where false alarms or missed events can have significant consequences, such as severe weather forecasting. For Los Mochis, the dataset values close to 0.7 have been found; therefore, a CSI value greater than 0.7 indicates a good classification model. This means that the model is reasonably accurate in identifying positive cases while minimizing false alarms and misses. The CSI results for the Mexico City dataset range between 0.4 and 0.5, with a slight increase after LF, which is higher for the worst-performing metrics such as LRstacking, RFstacking, and Soft-Voting. A CSI between 0.4 and 0.7 indicates a moderate level of success in the classification task. Although the model makes correct positive predictions, there is scope for enhancement in reducing false alarms.
Regarding the F1 metric, a high F1 score (closer to 1) indicates that the model has high levels of precision and recall. In other words, it correctly classifies positive instances while avoiding false positives and false negatives. From the performance of Los Mochis, it can be concluded that all ML approaches can correctly classify positive cases, controlling false positives and false negatives. Similar to the CSI metric, in the Mexico City dataset, the post-processing LF improves the F1 score of the models with the lowest performance, whereas in the ML approaches, LR, RF, MLP, Bagging, and Hard-Voting, F1 values are estimated at F1 = 0.63.
Figure 10 presents the Receiver Operating Characteristic (ROC) curves for the ML approaches for the Los Mochis and Mexico City datasets. The ROC curves demonstrate the trade-off between sensitivity and specificity at different threshold values. A classifier with a curve closer to the upper-left corner indicates superior performance because it achieves high true-positive rates while maintaining low false-positive rates. For Los Mochis, homogeneous behavior was observed among the ML approaches, except for RFstacking, which showed a lower discrimination capacity. The area under the ROC curve (AUC) values is higher than 0.7, which means that, in general, the ML approaches have an acceptable discrimination capacity between classes. In the case of Mexico City, the ROC curve analysis revealed that LR, RF, MLP, Bagging, and Hard-Voting consistently outperformed the other classifiers across various threshold values. Their ROC curves exhibit a steeper ascent, indicating better discrimination between CC and noCC cases. This result suggests that these ML approaches are well suited for CC detection in this particular dataset. However, it is essential to consider the information provided by the other metrics.
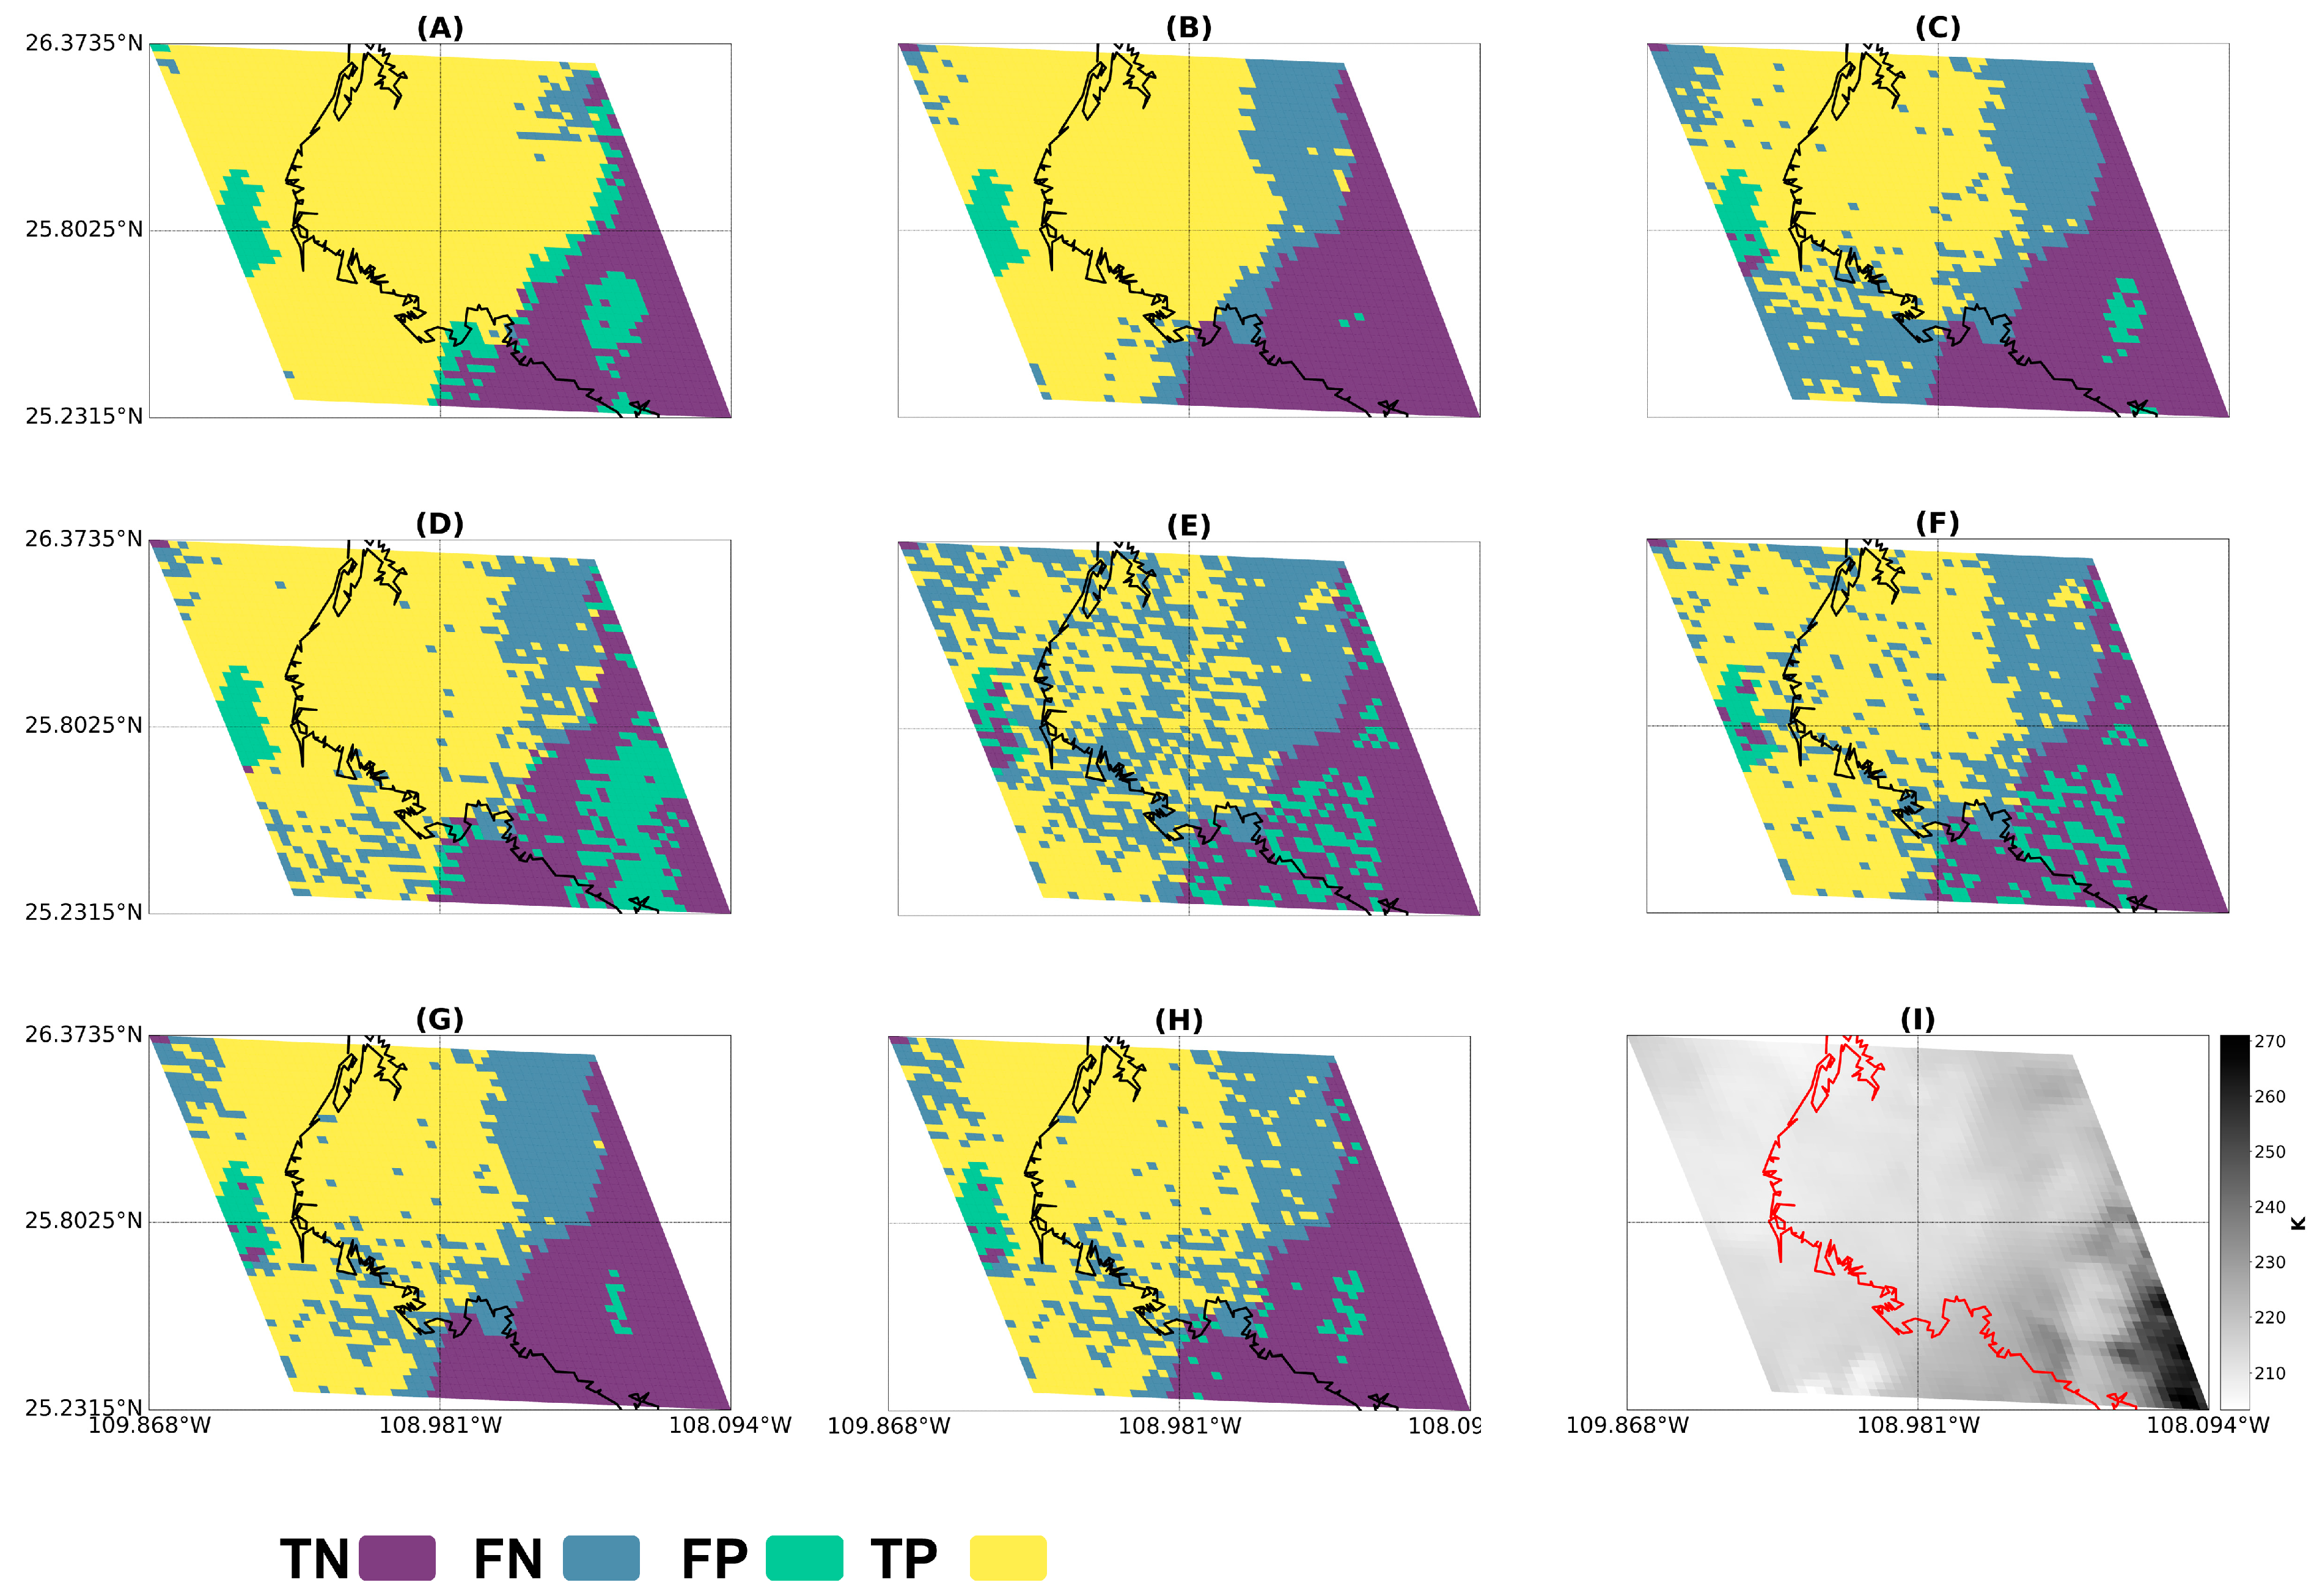
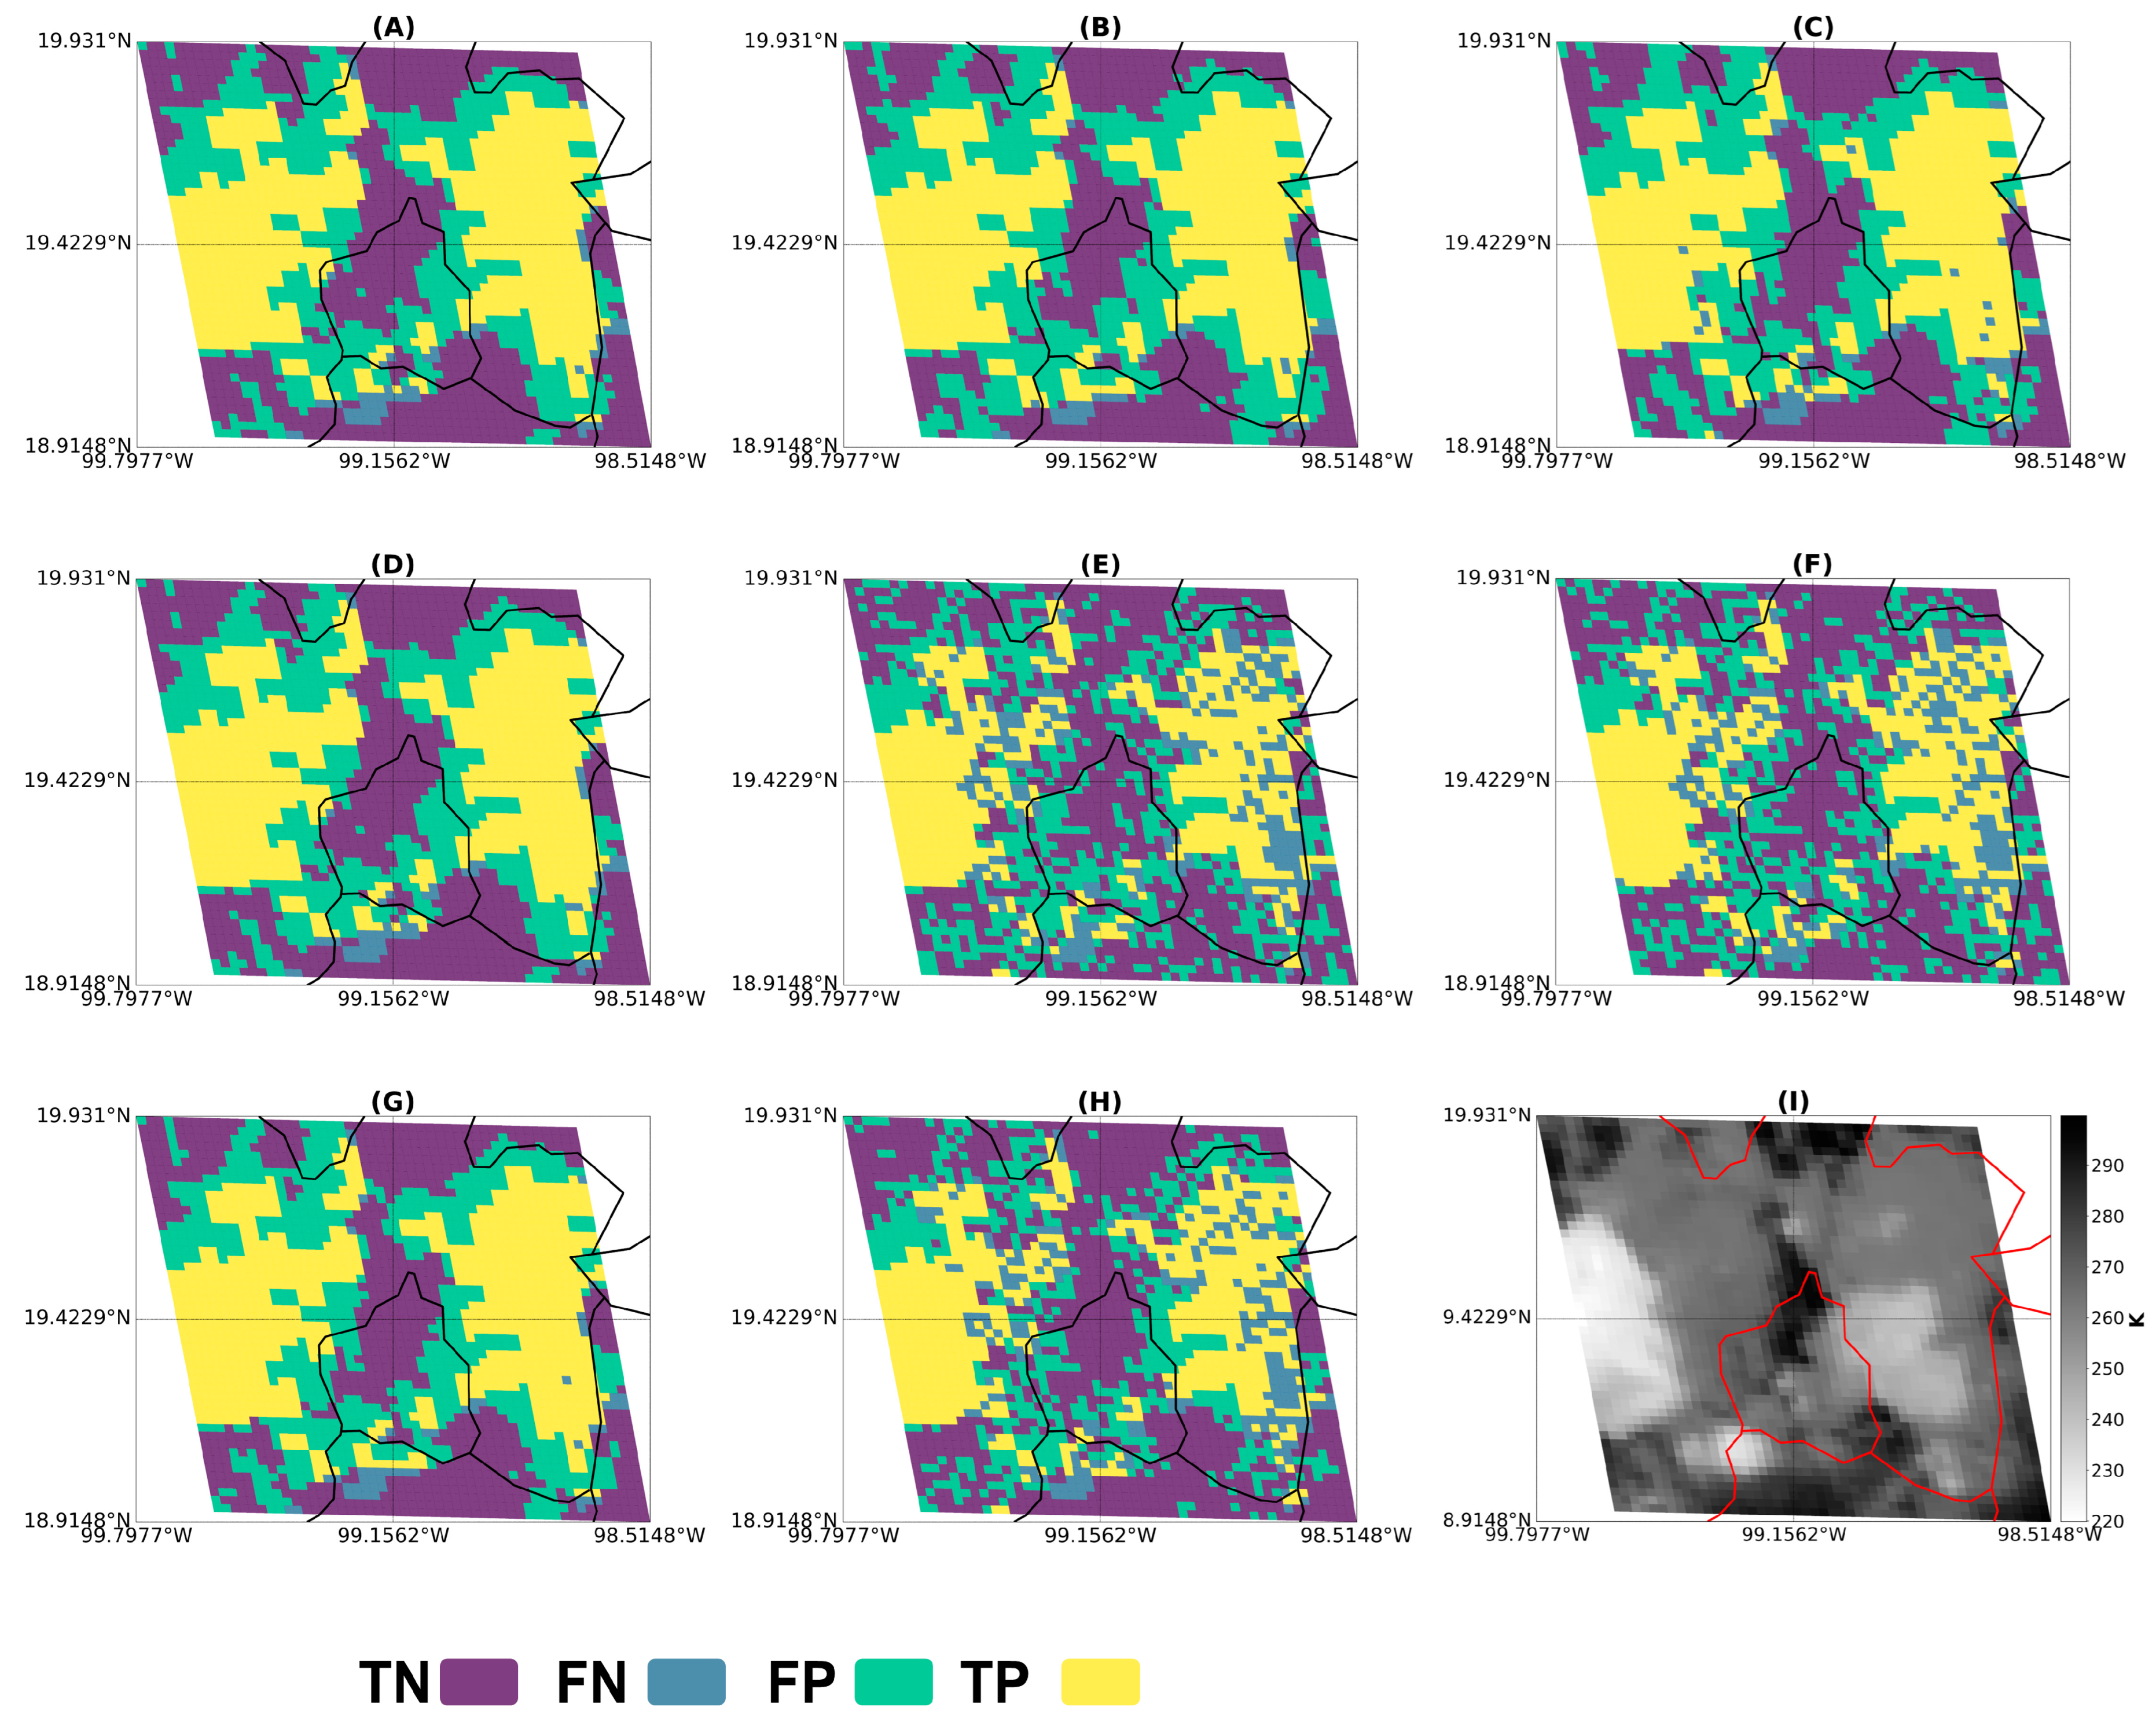
Examples of a deep convection event simulated from each ML approach for Los Mochis and Mexico City are shown in Figure 11 and Figure 12, respectively; this comparison allows for a qualitative evaluation of the performance of each model, while the IoU metric indicates the overlap between the predicted regions and the ground truth (Table 6).
In the case of Los Mochis, the simulation of the event that occurred on 15 August 2018 shows a tendency to underestimate the total area of the deep convective cloud at the cloud edges, with the exception of LR where the IoU = 0.86 values are the highest recorded. The presence of false-negative pixels at the cloud edge indicates the difficulty of simulating this transition zone where cloud properties estimated from ABI-GOES data become diffuse. Therefore, future work will consider adding an additional transition class between CC and non-CC. In most ML approaches, except RF, a convective core is simulated in the lower-right part of the simulation domain that does not match the reference labels for this event, which could be related to a better ability to detect deep convection events from AGI-GOES data than from MODIS.
The ensemble models LRstacking and RFstacking show the worst performance, with values IoU = 0.44 and IoU = 0.62, respectively. In these ML approaches, a pronounced salt-and-pepper effect is observed, which usually occurs in pixel-based classification tasks when no contextual spatial information is provided [90]. This pattern is also present in the simulated event for Mexico City (Figure 12), where LRstacking, RFstacking, and Svoting also show this effect, which is related to the low-performance metrics of the test dataset. In this event, two well-separated clouds can be seen forming over the areas of higher topographic elevation, which, in addition to the presence of nuclei with lower cloud-top temperature, allows us to infer that its formation was due to a forced convection process. However, as in Los Mochis, all models show difficulties in simulating the edge of the clouds, with the difference being that, in this case, the areas of both convective clouds are overestimated with the presence of false-positive pixels.
As in the previous case, this area of opportunity can be addressed by adding an additional transition class or using alternative approaches that maintain the spatial structure, such as Convolutional Neural Networks (CNN) or other spatially aware models.
4.3. Computational Costs of ML Approaches

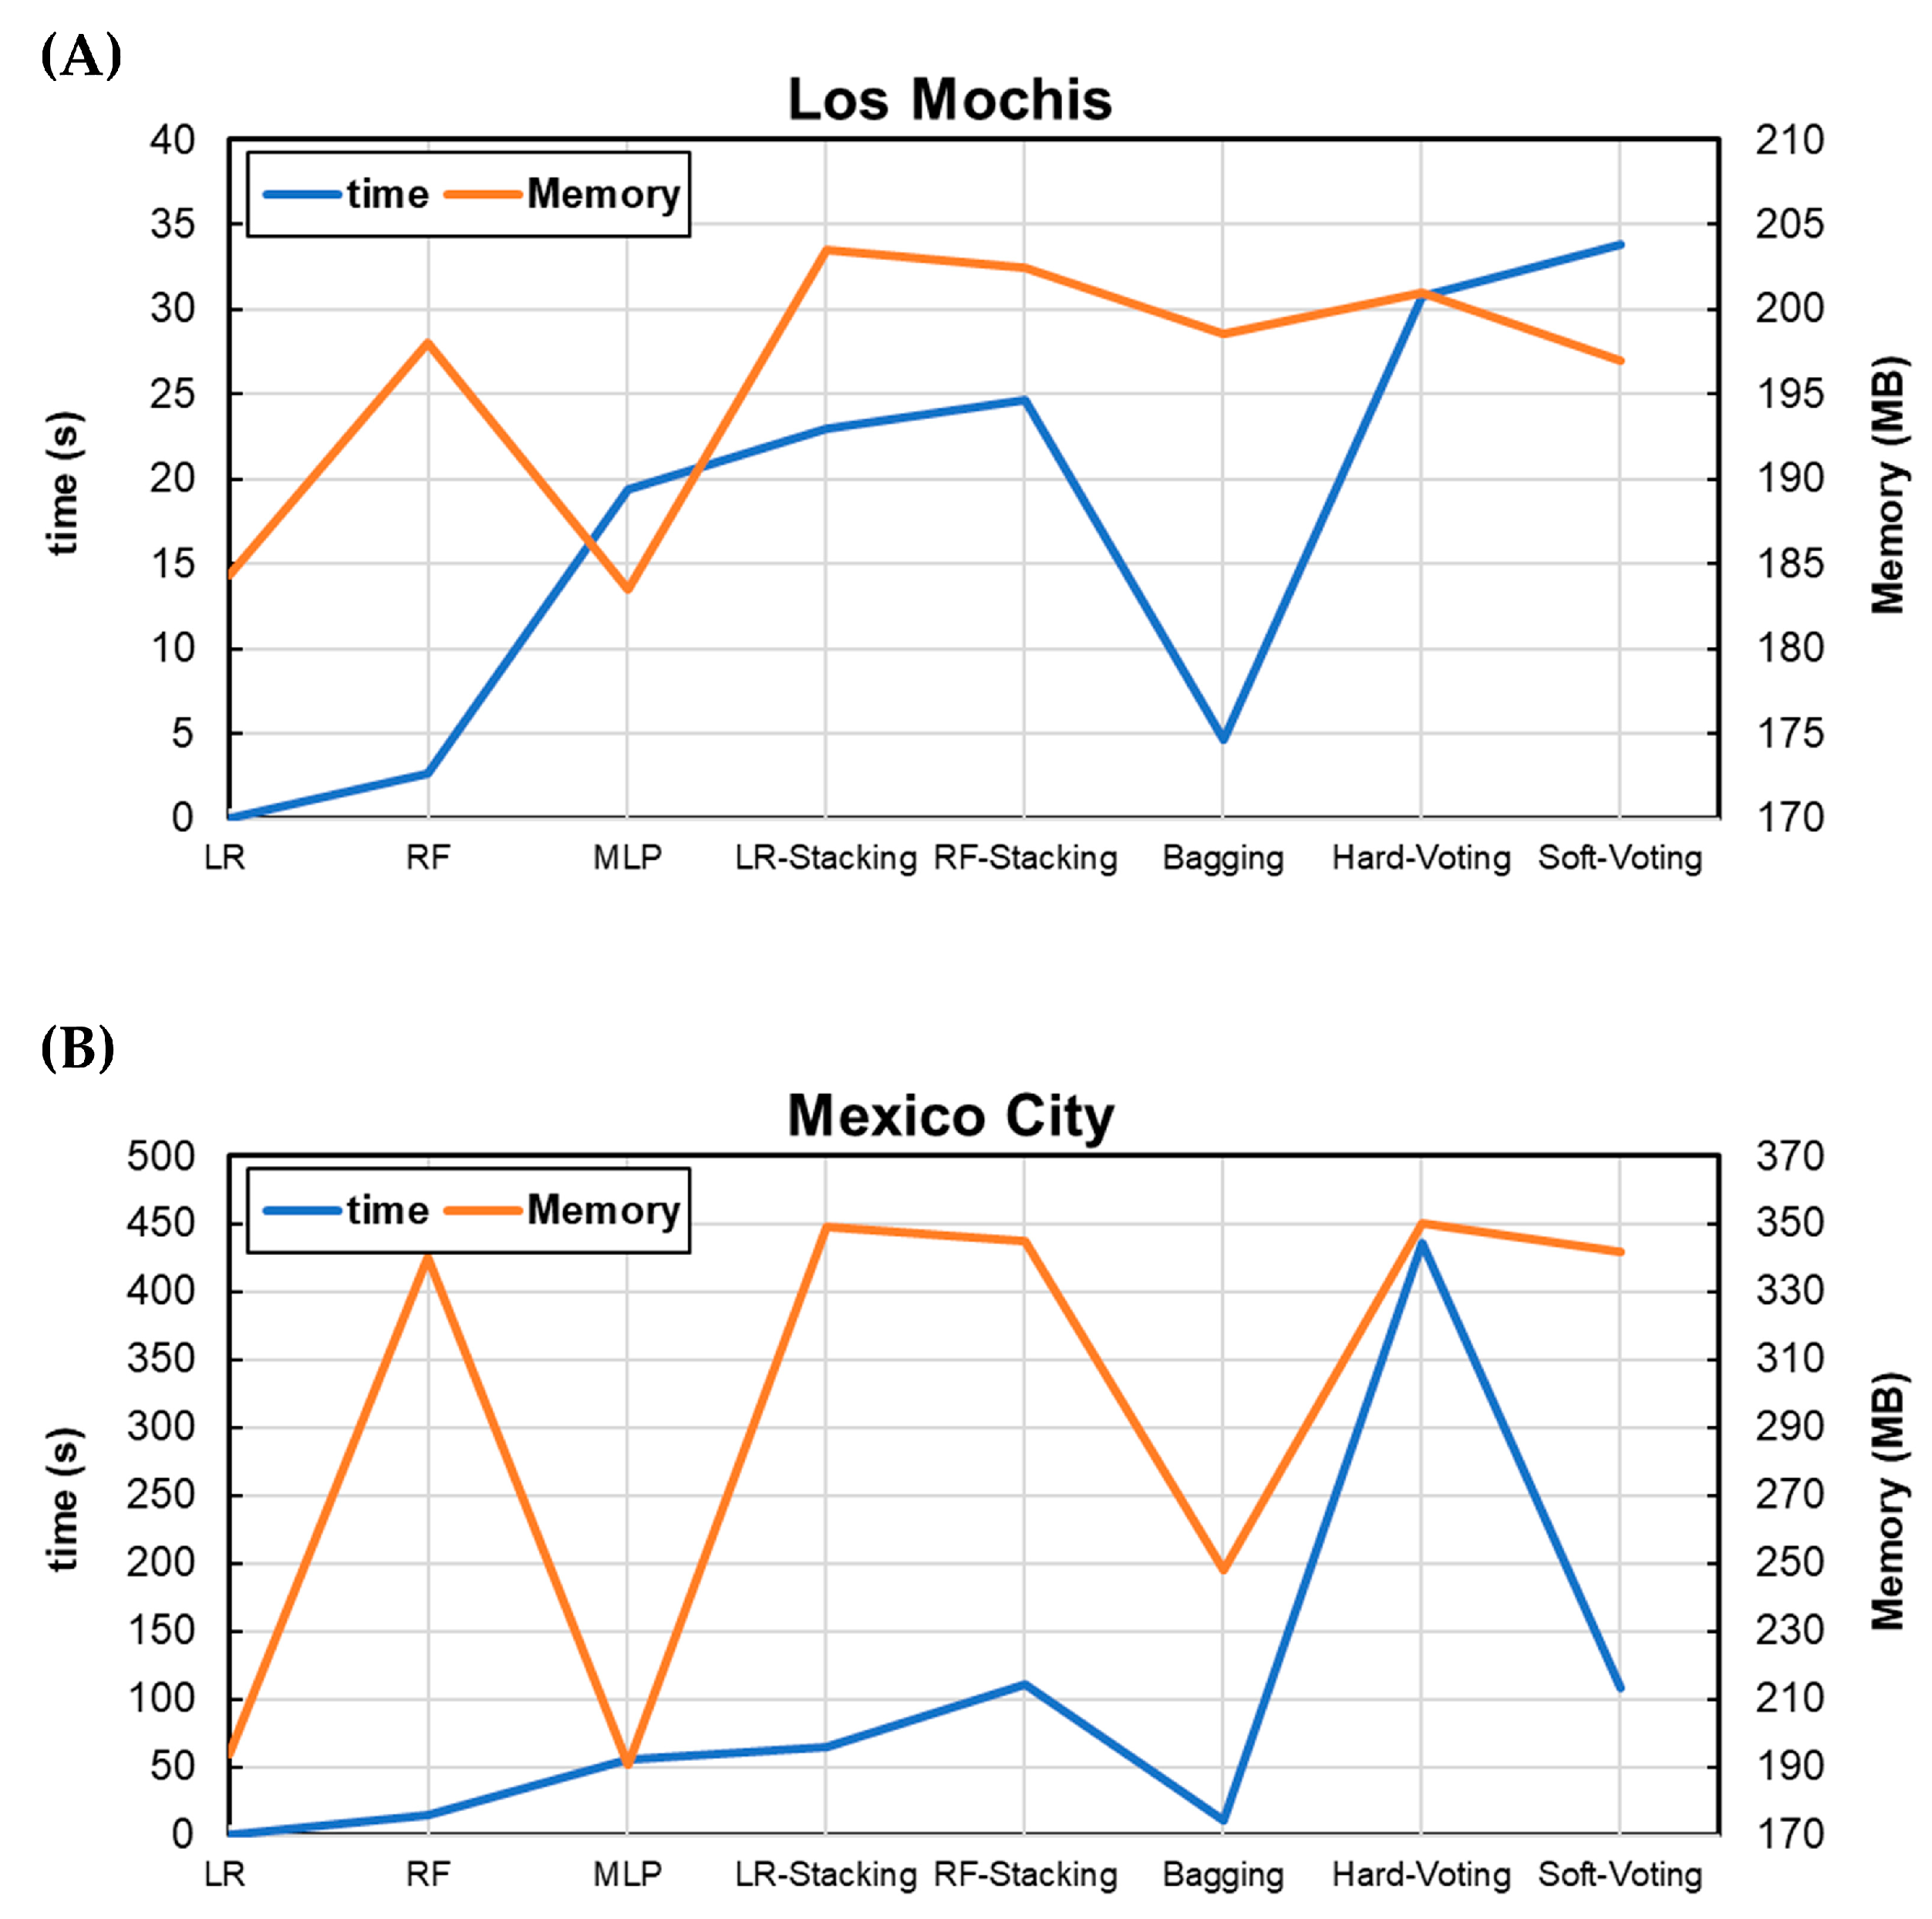
Figure 13 presents a comprehensive evaluation of the computational costs associated with the eight ML approaches in Los Mochis (Figure 13a) and Mexico City (Figure 13b). The assessment considers both computing time and memory usage to provide insights into the efficiency and resource requirements of each model in a standardized computing environment to ensure consistency.
For Los Mochis, the results revealed notable variations in computational costs across the evaluated ML approaches. RF and Bagging demonstrated efficient computing times but consumed higher memory, emphasizing their resource-intensive nature. LR and MLP presented balanced trade-offs between time and memory. In this case, in particular, the ensemble models imply a higher memory usage due to their higher degree of complexity, but this trend does not hold in the computational time section, where LR, RF, and Bagging were the ML approaches with less time consumption, and with a low significant variation.
In Mexico City, Hard-Voting showed a longer computation time compared to the other ML approaches; it is important to add that the omission of SVM in Soft-Voting reduces the computation time compared to Hard-Voting. In Los Mochis, RF showed efficient computation times but consumed more memory, while, LR, RF, and Bagging showcased competitive performance in terms of both time and memory usage.
A more comprehensive comparison should align with the specific requirements of the application, dataset size, and available computational resources.

5. Conclusions

In this study, a quasi-real-time (approximately every 5 min) framework for deep convective events modeling, based on ABI-GOES data, was designed by considering the following three principles: the use of open-source software and open-access products, automation, and scalability. This modeling framework runs cyclically and automatically every 5 min, corresponding to the temporal resolution of the ABI bands.
This framework is based on the use of machine learning techniques, for which eight different models and model ensemble strategies, including LR, RF, MLP, LRstacking, RFstacking, Bagging, Hard-Voting, and Soft-Voting, were compared for two study sites, Los Mochis and Mexico City, selected for their intense convective activity and high degree of vulnerability to extreme weather events. The results indicate that a simple approach such as LR or RF can be a good alternative for the identification and simulation of deep convective clouds in both study areas, showing POD ≈ 0.84 for Los Mochis and POD ≈ 0.72, while FAR ≈ 0.2 and FAR ≈ 0.4 values were estimated, respectively.
In addition, the implementation of a post-processing filter based on lightning incidence recorded by GLM-GOES was evaluated to improve the detection capability of the ML models. In this sense, it was observed that, in the case of Los Mochis, these did not represent a significant change in contrast to Mexico City, where the detection capability of all ML approaches increased significantly.
From the simulation of a reference event in both study areas, a challenge is identified in the simulation of cloud edges due to the limitations of using a pixel-based classification approach; however, the results show a good overall performance in most of the ML approaches analyzed.
This work sets a precedent towards the implementation of an early warning system for hazards associated with intense convective activity in a region with complex atmospheric dynamics such as Mexico, which also has a limited severe-weather-monitoring infrastructure and a highly heterogeneous distribution of ground-based sensors.

Author Contributions

Conceptualization, R.D.-O. and J.T.-V.; methodology, R.D.-O.; software, R.D.-O.; validation, J.T.-V.; formal analysis, R.D.-O., J.N.C.-P., J.A.V.-Z. and J.T.-V.; investigation, R.D.-O.; writing—original draft preparation, R.D.-O.; writing—review and editing, J.N.C.-P., J.A.V.-Z. and J.T.-V.; visualization, R.D.-O.; supervision, J.N.C.-P., J.A.V.-Z. and J.T.-V. All authors have read and agreed to the published version of the manuscript.

Funding

This research received no external funding.

Data Availability Statement

Data are contained within the article.

Acknowledgments

This work was supported by the Consejo Nacional de Humanidades, Ciencias y Tecnologías (CONAHCYT), through grant CVU: 841667. We thank the División de Geociencias Aplicadas of the Instituto Potosino de Investigación Científica y Tecnológica A.C. and the Geomatics and Numerical Modeling Laboratory for their personal and technical support. The authors express their sincere gratitude to the National Centers for Environmental Information (NCEI) at the NOAA for providing access to the GOES-R data.

Conflicts of Interest

The authors declare no conflicts of interest.

Abbreviations

The following abbreviations are used in this manuscript:
ABIAdvanced Baseline Imager
ANNArtificial Neural Networks
AWSAmazon Web Services
CCConvective Cells
CIConvective Initiation
CMIPCloud and Moisture Imagery
CNNConvolutional Neural Networks
COMSCommunication, Ocean, and Meteorological Satellite
COT Cloud Optical Thickness
CSICritical Success Index
CtP Cloud-top Pressure
DLDeep Learning
DTDecision Tree
ENSOEl Niño–Southern Oscillation
FARFalse alarm ratio
GLMGeostationary Lightning Mapper
GOES Geostationary Operational Environmental Satellite
IoUIntersection over Union
ISCCPInternational Satellite Cloud Climatology Project
LFLightning Filter
LRLogistic Regression
MDIMean Decrease Impurity
MLMachine Learning
MLPMulti-layer Perceptron
MODISModerate-Resolution Imaging Spectroradiometer
NAMNorth American monsoon
NWPNumerical weather predictions
OTOvershooting Top
PODProbability of detection
RFRandom Forest
RNNRecurrent Neural Networks
ROCReceiver Operating Characteristic
SMOSierra Madre Occidental
SVMSupport Vector Machine

References

  1. Cancelada, M.; Salio, P.; Vila, D.; Nesbitt, S.W.; Vidal, L. Backward Adaptive Brightness Temperature Threshold Technique (BAB3T): A Methodology to Determine Extreme Convective Initiation Regions Using Satellite Infrared Imagery. Remote Sens. 2020, 12, 337. [Google Scholar] [CrossRef]
  2. Han, H.; Lee, S.; Im, J.; Kim, M.; Lee, M.-I.; Ahn, M.H.; Chung, S.-R. Detection of Convective Initiation Using Meteorological Imager Onboard Communication, Ocean, and Meteorological Satellite Based on Machine Learning Approaches. Remote Sens. 2015, 7, 9184–9204. [Google Scholar] [CrossRef]
  3. Lee, S.; Han, H.; Im, J.; Jang, E.; Lee, M.-I. Detection of Deterministic and Probabilistic Convection Initiation Using Himawari-8 Advanced Himawari Imager Data. Atmos. Meas. Tech. 2017, 10, 1859–1874. [Google Scholar] [CrossRef]
  4. Liu, Q.; Li, Y.; Yu, M.; Chiu, L.S.; Hao, X.; Duffy, D.Q.; Yang, C. Daytime Rainy Cloud Detection and Convective Precipitation Delineation Based on a Deep Neural Network Method Using GOES-16 ABI Images. Remote Sens. 2019, 11, 2555. [Google Scholar] [CrossRef]
  5. León-Cruz, J.F.; Caetano, E.; Cortés-Ramos, J.; Dominguez, C.; Méndez-Pérez, J.M. Thunderstorm and Hailstorm Environments in Mexico. Int. J. Climatol. 2023, 43, 4379–4395. [Google Scholar] [CrossRef]
  6. Weckwerth, T.M.; Parsons, D.B. A Review of Convection Initiation and Motivation for IHOP_2002. Mon. Weather Rev. 2006, 134, 5–22. [Google Scholar] [CrossRef]
  7. Dixon, M.; Wiener, G. TITAN: Thunderstorm Identification, Tracking, Analysis, and Nowcasting—A Radar-Based Methodology. J. Atmos. Ocean. Technol. 1993, 10, 785–797. [Google Scholar] [CrossRef]
  8. Cintineo, J.L.; Pavolonis, M.J.; Sieglaff, J.M.; Wimmers, A.; Brunner, J.; Bellon, W. A Deep-Learning Model for Automated Detection of Intense Midlatitude Convection Using Geostationary Satellite Images. Weather Forecast. 2020, 35, 2567–2588. [Google Scholar] [CrossRef]
  9. Gravelle, C.M.; Mecikalski, J.R.; Line, W.E.; Bedka, K.M.; Petersen, R.A.; Sieglaff, J.M.; Stano, G.T.; Goodman, S.J. Demonstration of a GOES-R Satellite Convective Toolkit to “Bridge the Gap” between Severe Weather Watches and Warnings: An Example from the 20 May 2013 Moore, Oklahoma, Tornado Outbreak. Bull. Am. Meteorol. Soc. 2016, 97, 69–84. [Google Scholar] [CrossRef]
  10. Roberts, R.D.; Rutledge, S. Nowcasting Storm Initiation and Growth Using GOES-8 and WSR-88D Data. Weather Forecast. 2003, 18, 562–584. [Google Scholar] [CrossRef]
  11. Mueller, C.K.; Wilson, J.W.; Crook, N.A. The Utility of Sounding and Mesonet Data to Nowcast Thunderstorm Initiation. Weather Forecast. 1993, 8, 132–146. [Google Scholar] [CrossRef]
  12. Veillette, M.S. Convective Initiation Forecasts Through the Use of Machine Learning Methods. In Proceedings of the 93rd American Meteorological Society Annual Meeting, Austin, TX, USA, 9 January 2013. [Google Scholar]
  13. Mecikalski, J.R.; Bedka, K.M. Forecasting Convective Initiation by Monitoring the Evolution of Moving Cumulus in Daytime GOES Imagery. Mon. Weather Rev. 2006, 134, 49–78. [Google Scholar] [CrossRef]
  14. McGovern, A.; Chase, R.J.; Flora, M.; Gagne, D.J.; Lagerquist, R.; Potvin, C.K.; Snook, N.; Loken, E. A Review of Machine Learning for Convective Weather. Artif. Intell. Earth Syst. 2023, 2, e220077. [Google Scholar] [CrossRef]
  15. Walker, J.R.; MacKenzie, W.M.; Mecikalski, J.R.; Jewett, C.P. An Enhanced Geostationary Satellite–Based Convective Initiation Algorithm for 0–2-h Nowcasting with Object Tracking. J. Appl. Meteorol. Climatol. 2012, 51, 1931–1949. [Google Scholar] [CrossRef]
  16. Reichstein, M.; Camps-Valls, G.; Stevens, B.; Jung, M.; Denzler, J.; Carvalhais, N. Prabhat Deep Learning and Process Understanding for Data-Driven Earth System Science. Nature 2019, 566, 195–204. [Google Scholar] [CrossRef] [PubMed]
  17. Mecikalski, J.R.; Williams, J.K.; Jewett, C.P.; Ahijevych, D.; LeRoy, A.; Walker, J.R. Probabilistic 0–1-h Convective Initiation Nowcasts That Combine Geostationary Satellite Observations and Numerical Weather Prediction Model Data. J. Appl. Meteorol. Climatol. 2015, 54, 1039–1059. [Google Scholar] [CrossRef]
  18. Han, D.; Lee, J.; Im, J.; Sim, S.; Lee, S.; Han, H. A Novel Framework of Detecting Convective Initiation Combining Automated Sampling, Machine Learning, and Repeated Model Tuning from Geostationary Satellite Data. Remote Sens. 2019, 11, 1454. [Google Scholar] [CrossRef]
  19. Krinitskiy, M.; Sprygin, A.; Elizarov, S.; Narizhnaya, A.; Shikhov, A.; Chernokulsky, A. Towards the Accurate Automatic Detection of Mesoscale Convective Systems in Remote Sensing Data: From Data Mining to Deep Learning Models and Their Applications. Remote Sens. 2023, 15, 3493. [Google Scholar] [CrossRef]
  20. Petersen, R.; Aune, R.; Rink, T. Objective Short-Range Forecasts of the Pre-Convective Environment Using SEVIRI Data. In Proceedings of the 2010 EUMETSAT Meteorological Satellite Conference, EUMETSAT, Cordoba, Spain, 20–24 September 2010. [Google Scholar]
  21. Lenk, S.; Senf, F.; Deneke, H.; Hungershoefer, K. On the Sensitivity of Nowcasting Algorithms for Convective Initiation in Satellite Images to Automatic Tracking Techniques. In Proceedings of the 2018 EUMETSAT Meteorological Satellite Conference, Tallinn, Estonia, 17–21 September 2018. [Google Scholar]
  22. La Fata, A.; Amato, F.; Bernardi, M.; D’Andrea, M.; Procopio, R.; Fiori, E. Cloud-to-Ground Lightning Nowcasting Using Machine Learning. In Proceedings of the 2021 35th International Conference on Lightning Protection (ICLP) and XVI International Symposium on Lightning Protection (SIPDA), Colombo, Sri Lanka, 20–26 September 2021; Volume 1, pp. 1–6. [Google Scholar]
  23. Ukkonen, P.; Mäkelä, A. Evaluation of Machine Learning Classifiers for Predicting Deep Convection. J. Adv. Model. Earth Syst. 2019, 11, 1784–1802. [Google Scholar] [CrossRef]
  24. Zhou, K.; Zheng, Y.; Dong, W.; Wang, T. A Deep Learning Network for Cloud-to-Ground Lightning Nowcasting with Multisource Data. J. Atmos. Ocean. Technol. 2020, 37, 927–942. [Google Scholar] [CrossRef]
  25. American Meteorological Society Overshooting Top—Glossary of Meteorology. Available online: https://glossary.ametsoc.org/wiki/Overshooting_top (accessed on 29 November 2023).
  26. Bedka, K.M.; Allen, J.T.; Punge, H.J.; Kunz, M.; Simanovic, D. A Long-Term Overshooting Convective Cloud-Top Detection Database over Australia Derived from MTSAT Japanese Advanced Meteorological Imager Observations. J. Appl. Meteorol. Climatol. 2018, 57, 937–951. [Google Scholar] [CrossRef]
  27. Khlopenkov, K.V.; Bedka, K.M.; Cooney, J.W.; Itterly, K. Recent Advances in Detection of Overshooting Cloud Tops From Longwave Infrared Satellite Imagery. J. Geophys. Res. Atmos. 2021, 126, e2020JD034359. [Google Scholar] [CrossRef]
  28. Kim, M.; Im, J.; Park, H.; Park, S.; Lee, M.-I.; Ahn, M.-H. Detection of Tropical Overshooting Cloud Tops Using Himawari-8 Imagery. Remote Sens. 2017, 9, 685. [Google Scholar] [CrossRef]
  29. Kim, M.; Lee, J.; Im, J. Deep Learning-Based Monitoring of Overshooting Cloud Tops from Geostationary Satellite Data. GIScience Remote Sens. 2018, 55, 763–792. [Google Scholar] [CrossRef]
  30. Cavazos, T.; Turrent, C.; Lettenmaier, D.P. Extreme Precipitation Trends Associated with Tropical Cyclones in the Core of the North American Monsoon. Geophys. Res. Lett. 2008, 35, L21703. [Google Scholar] [CrossRef]
  31. Mejia, J.F.; Douglas, M.W. Relationships between Moisture Surges and Mesoscale- to Large-Scale Convection from Multi-Year Satellite Imagery and North American Regional Reanalysis Data; AGU Fall Meeting Abstracts, A51F-0170. 2009. Available online: https://www.researchgate.net/publication/238027674_Relationships_between_Moisture_Surges_and_Mesoscale-_to_Large-Scale_Convection_from_Multi-year_Satellite_Imagery_and_North_American_Regional_Reanalysis_Data/citations#fullTextFileContent (accessed on 5 December 2023).
  32. Ramos-Pérez, O.; Adams, D.K.; Ochoa-Moya, C.A.; Quintanar, A.I. A Climatology of Mesoscale Convective Systems in Northwest Mexico during the North American Monsoon. Atmosphere 2022, 13, 665. [Google Scholar] [CrossRef]
  33. Forzieri, G.; Castelli, F.; Vivoni, E.R. Vegetation Dynamics within the North American Monsoon Region. J. Clim. 2011, 24, 1763–1783. [Google Scholar] [CrossRef]
  34. Ramírez-López, A.K.; Carbajal, N.; Pineda-Martínez, L.F.; Tuxpan-Vargas, J. Cloud Climatology of Northwestern Mexico Based on MODIS Data. Eur. J. Remote Sens. 2023, 56, 2278066. [Google Scholar] [CrossRef]
  35. INEGI. Conjunto de Datos Vectoriales Escala 1:1 000 000. Unidades Climáticas; INEGI: Aguascalientes, México, 2008. [Google Scholar]
  36. Dávila Ortiz, R. Respuesta hidrológica en Zonas Urbanas Ante Eventos Severos de Tormenta Aplicando Modelación Numérica e Información SAR: Caso Los Mochis. Master’s Thesis, Instituto Potosino de Investigación Científica y Tecnológica, A.C., San Luis Potosí, México, 2019. [Google Scholar]
  37. INEGI. Modelo Digital de Elevación de Alta Resolución Lidar; INEGI: Aguascalientes, México, 2017. [Google Scholar]
  38. León-Cruz, J.F.; Carbajal Henken, C.; Carbajal, N.; Fischer, J. Spatio-Temporal Distribution of Deep Convection Observed along the Trans-Mexican Volcanic Belt. Remote Sens. 2021, 13, 1215. [Google Scholar] [CrossRef]
  39. Vargas, N.; Magaña, V. Climatic Risk in the Mexico City Metropolitan Area Due to Urbanization. Urban Clim. 2020, 33, 100644. [Google Scholar] [CrossRef]
  40. Carbajal, N.; León-Cruz, J.F.; Pineda-Martínez, L.F.; Tuxpan-Vargas, J.; Gaviño-Rodríguez, J.H. Occurrence of Anticyclonic Tornadoes in a Topographically Complex Region of Mexico. Adv. Meteorol. 2019, 2019, e2763153. [Google Scholar] [CrossRef]
  41. Romero Lankao, P. Water in Mexico City: What Will Climate Change Bring to Its History of Water-Related Hazards and Vulnerabilities? Environ. Urban. 2010, 22, 157–178. [Google Scholar] [CrossRef]
  42. Eakin, H.; Lerner, A.M.; Manuel-Navarrete, D.; Hernández Aguilar, B.; Martínez-Canedo, A.; Tellman, B.; Charli-Joseph, L.; Fernández Álvarez, R.; Bojórquez-Tapia, L. Adapting to Risk and Perpetuating Poverty: Household’s Strategies for Managing Flood Risk and Water Scarcity in Mexico City. Environ. Sci. Policy 2016, 66, 324–333. [Google Scholar] [CrossRef]
  43. Schmit, T.J.; Griffith, P.; Gunshor, M.M.; Daniels, J.M.; Goodman, S.J.; Lebair, W.J. A Closer Look at the ABI on the GOES-R Series. Bull. Am. Meteorol. Soc. 2017, 98, 681–698. [Google Scholar] [CrossRef]
  44. Goodman, S.J.; Blakeslee, R.J.; Koshak, W.J.; Mach, D.; Bailey, J.; Buechler, D.; Carey, L.; Schultz, C.; Bateman, M.; McCaul, E.; et al. The GOES-R Geostationary Lightning Mapper (GLM). Atmos. Res. 2013, 125–126, 34–49. [Google Scholar] [CrossRef]
  45. Platnick, S.; Meyer, K.G.; King, M.D.; Wind, G.; Amarasinghe, N.; Marchant, B.; Arnold, G.T.; Zhang, Z.; Hubanks, P.A.; Holz, R.E.; et al. The MODIS Cloud Optical and Microphysical Products: Collection 6 Updates and Examples From Terra and Aqua. IEEE Trans. Geosci. Remote Sens. 2017, 55, 502–525. [Google Scholar] [CrossRef] [PubMed]
  46. Rossow, W.B.; Schiffer, R.A. ISCCP Cloud Data Products. Bull. Am. Meteorol. Soc. 1991, 72, 2–20. [Google Scholar] [CrossRef]
  47. Jergensen, G.E.; McGovern, A.; Lagerquist, R.; Smith, T. Classifying Convective Storms Using Machine Learning. Weather Forecast. 2020, 35, 537–559. [Google Scholar] [CrossRef]
  48. Steinkruger, D.; Markowski, P.; Young, G. An Artificially Intelligent System for the Automated Issuance of Tornado Warnings in Simulated Convective Storms. Weather Forecast. 2020, 35, 1939–1965. [Google Scholar] [CrossRef]
  49. Hosmer, D.; Lemeshow, S.; Sturdivant, R.X. Applied Logistic Regression. In Wiley Series in Probability and Statistics, 3rd ed.; John Wiley & Sons, Inc.: Hoboken, NJ, USA, 2013; ISBN 978-1-118-54838-7. [Google Scholar]
  50. Breiman, L. Classification and Regression Trees, 1st ed.; Routledge: New York, NY, USA, 1984; ISBN 978-1-315-13947-0. [Google Scholar]
  51. Gagne, D.J.; McGovern, A.; Brotzge, J. Classification of Convective Areas Using Decision Trees. J. Atmos. Ocean. Technol. 2009, 26, 1341–1353. [Google Scholar] [CrossRef]
  52. Vapnik, V. Pattern Recognition Using Generalized Portrait Method. Autom. Remote Control 1963, 24, 774–780. [Google Scholar]
  53. Adrianto, I.; Trafalis, T.B.; Lakshmanan, V. Support Vector Machines for Spatiotemporal Tornado Prediction. Int. J. Gen. Syst. 2009, 38, 759–776. [Google Scholar] [CrossRef]
  54. Trafalis, T.B.; Ince, H.; Richman, M.B. Tornado Detection with Support Vector Machines. In Computational Science—ICCS 2003; Sloot, P.M.A., Abramson, D., Bogdanov, A.V., Gorbachev, Y.E., Dongarra, J.J., Zomaya, A.Y., Eds.; Springer: Berlin/Heidelberg, Germany, 2003; pp. 289–298. [Google Scholar]
  55. Han, L.; Sun, J.; Zhang, W.; Xiu, Y.; Feng, H.; Lin, Y. A Machine Learning Nowcasting Method Based on Real-Time Reanalysis Data. J. Geophys. Res. Atmos. 2017, 122, 4038–4051. [Google Scholar] [CrossRef]
  56. Sangiorgio, M.; Barindelli, S.; Guglieri, V.; Biondi, R.; Solazzo, E.; Realini, E.; Venuti, G.; Guariso, G. A Comparative Study on Machine Learning Techniques for Intense Convective Rainfall Events Forecasting. In Theory and Applications of Time Series Analysis; Valenzuela, O., Rojas, F., Herrera, L.J., Pomares, H., Rojas, I., Eds.; Springer International Publishing: Cham, Switzerland, 2020; pp. 305–317. [Google Scholar]
  57. McCulloch, W.S.; Pitts, W. A Logical Calculus of the Ideas Immanent in Nervous Activity. Bull. Math. Biophys. 1943, 5, 115–133. [Google Scholar] [CrossRef]
  58. Chen, H.; Chandrasekar, V.; Cifelli, R.; Xie, P. A Machine Learning System for Precipitation Estimation Using Satellite and Ground Radar Network Observations. IEEE Trans. Geosci. Remote Sens. 2020, 58, 982–994. [Google Scholar] [CrossRef]
  59. Sobash, R.A.; Romine, G.S.; Schwartz, C.S. A Comparison of Neural-Network and Surrogate-Severe Probabilistic Convective Hazard Guidance Derived from a Convection-Allowing Model. Weather Forecast. 2020, 35, 1981–2000. [Google Scholar] [CrossRef]
  60. Afzali Gorooh, V.; Kalia, S.; Nguyen, P.; Hsu, K.; Sorooshian, S.; Ganguly, S.; Nemani, R.R. Deep Neural Network Cloud-Type Classification (DeepCTC) Model and Its Application in Evaluating PERSIANN-CCS. Remote Sens. 2020, 12, 316. [Google Scholar] [CrossRef]
  61. Lee, Y.; Han, D.; Ahn, M.-H.; Im, J.; Lee, S.J. Retrieval of Total Precipitable Water from Himawari-8 AHI Data: A Comparison of Random Forest, Extreme Gradient Boosting, and Deep Neural Network. Remote Sens. 2019, 11, 1741. [Google Scholar] [CrossRef]
  62. Akbari Asanjan, A.; Yang, T.; Hsu, K.; Sorooshian, S.; Lin, J.; Peng, Q. Short-Term Precipitation Forecast Based on the PERSIANN System and LSTM Recurrent Neural Networks. J. Geophys. Res. Atmos. 2018, 123, 12543–12563. [Google Scholar] [CrossRef]
  63. Leinonen, J.; Hamann, U.; Germann, U. Seamless Lightning Nowcasting with Recurrent-Convolutional Deep Learning. Artif. Intell. Earth Syst. 2022, 1, e220043. [Google Scholar] [CrossRef]
  64. Hilburn, K.A.; Ebert-Uphoff, I.; Miller, S.D. Development and Interpretation of a Neural-Network-Based Synthetic Radar Reflectivity Estimator Using GOES-R Satellite Observations. J. Appl. Meteorol. Climatol. 2020, 60, 3–21. [Google Scholar] [CrossRef]
  65. Lee, Y.; Kummerow, C.D.; Ebert-Uphoff, I. Applying Machine Learning Methods to Detect Convection Using Geostationary Operational Environmental Satellite-16 (GOES-16) Advanced Baseline Imager (ABI) Data. Atmos. Meas. Tech. 2021, 14, 2699–2716. [Google Scholar] [CrossRef]
  66. Breiman, L. Bagging Predictors. Mach Learn 1996, 24, 123–140. [Google Scholar] [CrossRef]
  67. Breiman, L. Pasting Small Votes for Classification in Large Databases and On-Line. Mach. Learn. 1999, 36, 85–103. [Google Scholar] [CrossRef]
  68. Géron, A. Hands-On Machine Learning with Scikit-Learn, Keras, and Tensorflow: Concepts, Tools, and Techniques to Build Intelligent Systems, 2nd ed.; O’Reilly: Sebastopol, CA, USA, 2019; ISBN 978-1-4920-3264-9. [Google Scholar]
  69. Ramirez, S.; Lizarazo, I. Detecting and Tracking Mesoscale Precipitating Objects Using Machine Learning Algorithms. Int. J. Remote Sens. 2017, 38, 5045–5068. [Google Scholar] [CrossRef]
  70. Ahijevych, D.; Pinto, J.O.; Williams, J.K.; Steiner, M. Probabilistic Forecasts of Mesoscale Convective System Initiation Using the Random Forest Data Mining Technique. Weather Forecast. 2016, 31, 581–599. [Google Scholar] [CrossRef]
  71. Burke, A.; Snook, N.; Ii, D.J.G.; McCorkle, S.; McGovern, A. Calibration of Machine Learning–Based Probabilistic Hail Predictions for Operational Forecasting. Weather Forecast. 2020, 35, 149–168. [Google Scholar] [CrossRef]
  72. Yao, H.; Li, X.; Pang, H.; Sheng, L.; Wang, W. Application of Random Forest Algorithm in Hail Forecasting over Shandong Peninsula. Atmos. Res. 2020, 244, 105093. [Google Scholar] [CrossRef]
  73. Wolpert, D.H. Stacked Generalization. Neural Netw. 1992, 5, 241–259. [Google Scholar] [CrossRef]
  74. NASA. GOES-R Series Data Book; GOES-R Series Program Office: Greenbelt, MD, USA, 2019. [Google Scholar]
  75. La Fata, A.; Amato, F.; Bernardi, M.; D’Andrea, M.; Procopio, R.; Fiori, E. Horizontal Grid Spacing Comparison among Random Forest Algorithms to Nowcast Cloud-to-Ground Lightning Occurrence. Stoch Env. Res Risk Assess 2022, 36, 2195–2206. [Google Scholar] [CrossRef]
  76. Rutledge, S.A.; Hilburn, K.A.; Clayton, A.; Fuchs, B.; Miller, S.D. Evaluating Geostationary Lightning Mapper Flash Rates Within Intense Convective Storms. J. Geophys. Res. Atmos. 2020, 125, e2020JD032827. [Google Scholar] [CrossRef]
  77. Rudlosky, S.D.; Goodman, S.J.; Virts, K.S.; Bruning, E.C. Initial Geostationary Lightning Mapper Observations. Geophys. Res. Lett. 2019, 46, 1097–1104. [Google Scholar] [CrossRef]
  78. Dávila Ortiz, R.; Tuxpan Vargas, J.; Velázquez Zapata, J.A. Identification of Deep Convection Clouds Using ABIGOES Data and Machine Learning Techniques: The Case of Los Mochis, Sinaloa, Mexico. In Proceedings of the 2023 IEEE Mexican International Conference on Computer Science (ENC), Guanajuato, Mexico, 11–13 September 2023. in press. [Google Scholar]
  79. Kim, B.; Choi, S.Y.; Han, K.-Y. Integrated Real-Time Flood Forecasting and Inundation Analysis in Small–Medium Streams. Water 2019, 11, 919. [Google Scholar] [CrossRef]
  80. da Silva Neto, C.P.; Alves Barbosa, H.; Assis Beneti, C.A. A Method for Convective Storm Detection Using Satellite Data. Atmósfera 2016, 29, 343–358. [Google Scholar] [CrossRef]
  81. Maddox, R.A. Mesoscale Convective Complexes. Bull. Am. Meteorol. Soc. 1980, 61, 1374–1387. [Google Scholar] [CrossRef]
  82. Anderson, C.J.; Arritt, R.W. Mesoscale Convective Complexes and Persistent Elongated Convective Systems over the United States during 1992 and 1993. Mon. Wea. Rev. 1998, 126, 578–599. [Google Scholar] [CrossRef]
  83. Bedka, K.; Brunner, J.; Dworak, R.; Feltz, W.; Otkin, J.; Greenwald, T. Objective Satellite-Based Detection of Overshooting Tops Using Infrared Window Channel Brightness Temperature Gradients. J. Appl. Meteorol. Climatol. 2010, 49, 181–202. [Google Scholar] [CrossRef]
  84. Machado, L.A.T.; Rossow, W.B. Structural Characteristics and Radiative Properties of Tropical Cloud Clusters. Mon. Weather Rev. 1993, 121, 3234–3260. [Google Scholar] [CrossRef]
  85. Holle, R.L.; Murphy, M.J. Lightning in the North American Monsoon: An Exploratory Climatology. Mon. Weather Rev. 2015, 143, 1970–1977. [Google Scholar] [CrossRef]
  86. Siqueira, J.R.; da Silva Marques, V. Tracking and Short-Term Forecasting of Mesoscale Convective Cloud Clusters over Southeast Brazil Using Satellite Infrared Imagery. J. South. Hemisph. Earth Syst. Sci. 2021, 71, 1–16. [Google Scholar] [CrossRef]
  87. Liu, Z.; Min, M.; Li, J.; Sun, F.; Di, D.; Ai, Y.; Li, Z.; Qin, D.; Li, G.; Lin, Y.; et al. Local Severe Storm Tracking and Warning in Pre-Convection Stage from the New Generation Geostationary Weather Satellite Measurements. Remote Sens. 2019, 11, 383. [Google Scholar] [CrossRef]
  88. Zhang, W.; Han, L.; Sun, J.; Guo, H.; Dai, J. Application of Multi-Channel 3D-Cube Successive Convolution Network for Convective Storm Nowcasting. In Proceedings of the 2019 IEEE International Conference on Big Data (Big Data), Los Angeles, CA, USA, 9–12 December 2019; pp. 1705–1710. [Google Scholar]
  89. Bedka, K.M.; Khlopenkov, K. A Probabilistic Multispectral Pattern Recognition Method for Detection of Overshooting Cloud Tops Using Passive Satellite Imager Observations. J. Appl. Meteorol. Climatol. 2016, 55, 1983–2005. [Google Scholar] [CrossRef]
  90. Kete, S.C.R.; Suprihatin; Tarigan, S.D.; Effendi, H. Land Use Classification Based on Object and Pixel Using Landsat 8 OLI in Kendari City, Southeast Sulawesi Province, Indonesia. IOP Conf. Ser. Earth Environ. Sci. 2019, 284, 012019. [Google Scholar] [CrossRef]
Figure 1. Land surface elevation over Los Mochis, [37]. The red border corresponds to the special simulation domain, which has a size of 50 × 50 cells.
Remotesensing 16 00675 g001
Figure 2. Land surface elevation over the study area called Mexico City (however, it also takes part of nearby territories [37]). The red border corresponds to the special simulation domain, which has a size of 50 × 50 cells.
Remotesensing 16 00675 g002
Figure 3. Diagram of ensemble ML methods. (A) Bagging, (B) Voting, (C) Stacking.
Remotesensing 16 00675 g003
Figure 4. General scheme of the framework for identifying and monitoring potential convective events in quasi-real time (5 min). The ML approaches that are applied in the ML process are selected based on their performance parameters during the training and testing phases at each study site. CMIP: Cloud and Moisture Imagery.
Remotesensing 16 00675 g004
Figure 5. Schematization of the Lightning Filter generation process. When the presence of a Lightning Event is identified from the GOES GLM data accumulated in 5 min within the site of interest; it is associated with a cell of the model special domain, using its distance from the nearest cell center as the criterion assignment. The Lightning Cell (LC) together with a buffer of one cell per edge (BC) (A), are labeled as Convection Cells (CC) and are integrated into the output matrix (B) of the ML models.
Remotesensing 16 00675 g005
Figure 6. Box plots of input variables generated based on the reference data used for CC detection models, for Los Mochis. The predictor dataset was reduced from 12 input variables to 6 after analyzing the features in the LR and RF models. The number of classes labeled as CC is 24,116 and noCC is 10,884.
Remotesensing 16 00675 g006
Figure 7. Box plots of input variables were generated based on the reference data used for CC detection models, for Mexico City. The predictor dataset was reduced from 12 input variables to 6 after analyzing the features in the LR and RF models. The number of classes labeled as CC is 57,833 and noCC is 79,667.
Remotesensing 16 00675 g007
Figure 8. Assessment results of POD, FAR, Acc, BIAS, CSI, and F1 metrics for the ML approaches using Los Mochis test dataset. Each vertex of the graph corresponds to an ML approach, the blue lines correspond to the performance results of the ML models (ML), and the red lines show the results integrating the Lightning Filter (ML + LF).
Remotesensing 16 00675 g008
Figure 9. Assessment results of POD, FAR, Acc BIAS, CSI, and F1 metrics for the ML approaches using the test dataset in Mexico City. Each vertex of the graph corresponds to an ML approach, the blue lines correspond to the performance results of the ML models (ML), and the red lines show the results integrating the Lightning Filter (ML + LF).
Remotesensing 16 00675 g009
Figure 10. ROC curves and AUC values for the predictions obtained with LR (black), RF (red), MLP (brown), LRstacking (blue), RFstacking (cyan), Bagging (magenta), and Svoting (light green), for Los Mochis (A) and Mexico City (B). These ROC curves provide a comparison of the sensitivity and specificity of each ML approach, at different discrimination thresholds.
Remotesensing 16 00675 g010
Figure 11. IoU maps of the Los Mochis 2018-227—18:00 event (15 August 2018) generated with the reference labels and simulations of the eight ML approaches LR (A), RF (B), MLP (C), Bagging (D), LRstacking (E), RFstacking (F), Hvoting (G), Svoting (H), and cloud-top brightness temperature map of the same event obtained from the ABI Band 14 (I). In general, it is observed that all the models underestimate the edge of the cloud, except LR, which presented values IoU = 0.86 and POD = 0.8.
Remotesensing 16 00675 g011
Figure 12. IoU maps of the Mexico City 2019-247—20:10 event generated with the reference labels and simulations of the eight ML approaches LR (A), RF (B), MLP (C), Bagging (D), LRstacking (E), RFstacking (F), Hvoting (G), Svoting (H), and cloud-top brightness temperature map of the same event obtained from the ABI Band 14 (I). The outputs of LR, RF, MLP, Bagging, and Hvoting are consistent with each other, showing a significant overestimation at the edge of the CCs. On the other hand, the outputs generated with LRstacking, RFstacking, and Svoting are extremely noisy, especially at the boundary of the clouds.
Remotesensing 16 00675 g012
Figure 13. Computational costs chart for each ML approach corresponding to Los Mochis (A) and Mexico City (B). The right axis indicates the total simulation time, and the left shows the amount of memory usage.
Remotesensing 16 00675 g013
Table 1. Specifications of ABI-GOES Bands.
ABI BandsBands NameCenter Wavelength (µm)Temporal Resolution (min)Best Spatial Resolution (km)
1Blue0.4751
2Red0.6450.5
3Veggie0.8651
4Cirrus1.3752
5Snow/Ice1.6151
6Cloud Particle Size2.2452
7Shortwave Window3.952
8Upper-Level Tropospheric Water Vapor6.1952
9Mid-Level Tropospheric Water Vapor6.9352
10Lower-Level Water Vapor7.3752
11Cloud-Top Phase8.4452
12Ozone9.6152
13Clean IR Longwave Window10.3352
14IR Longwave Window11.2152
15Dirty Longwave Window12.2952
16CO2 Longwave infrared13.2852
Table 2. Summary of the input data used for the implementation of ML workflow and post-processing filter. The initial selection of predictor variables (Interest Fields) was taken from [3].
IDFeature NamesTypeSensor
CtTCloud-top temperature (11.2 µm TB)PredictorABI
CtH01Cloud-top height 01 (6.2–11.2 µm)PredictorABI
CtH02Cloud-top height 02 (6.2–7.3 µm)PredictorABI
CtH03Cloud-top height 03 (13.3–11.2 µm)PredictorABI
CtG01Cloud-top glaciation 01 (12.3–11.2 µm)PredictorABI
CtG02Cloud-top glaciation 02 (8.6–11.2 µm)PredictorABI
CtG03Cloud-top glaciation 03 (8.6–11.2 µm)–(11.2–12.3 µm)PredictorABI
CtCrateCloud-top cooling rate (11.2 µm time trend)PredictorABI
TChCtH01Temporal changes in cloud-top height 01 (6.2–11.2 µm time trend)PredictorABI
TChCtH02Temporal changes in cloud-top height 02 (6.2–7.3 µm time trend)PredictorABI
TChCtH03Temporal changes in cloud-top height 03 (13.3–11.2 µm time trend)PredictorABI
TChCtG03Temporal changes in cloud-top glaciationPredictorABI
((8.6–11.2 µm)–(11.2–12.3 µm) time trend)
LFLightning filterFilter ArrayGLM
CC_labelsDeep convective cloud labelsTarget VariableMODIS
Table 3. Machine Learning Approaches. This work compares the performance of ML approaches: LR, RF, MLP, Bagging, LRstacking, RFstacking, Hvoting, and Svoting. DT and SVM have been used as assembled predictors for Stacking and Voting.
Models and Ensemble MethodsApproachAbbreviation
Logistic regressionSingle modelLR
Decision treeSingle modelDT
Support vector machineSingle modelSVM
Multi-layer perceptronSingle modelMLP
Random ForestEnsemble modelRF
Bagging (Logistic regression)Ensemble modelBagging
Stacking (Logistic regression)Ensemble modelLRstacking
Stacking (Random Forest)Ensemble modelRFstacking
Hard VotingEnsemble modelHvoting
Soft VotingEnsemble modelSvoting
Table 4. The hyperparameters of LR, RF, and MLP were tuned using the cross-validation strategy.
HyperparameterLos MochisMexico City
Norm of the penalty (LR)L2L2
The inverse of regularization strength (LR)0.010.01
Solver (LR)liblinearnewton-cg
Maximum depth of the tree (RF)25
Number of trees in the forest (RF)500100
Random split predictor variables (RF)11
Number of neurons in the hidden layer (MLP)10100
Solver (MLP)sgdAdam
Table 5. Interest Fields were used as predictor variables after the feature importance analysis, for Los Mochis and Mexico City datasets.
Los MochisMexico City
CtTCtT
CtH01CtH01
CtH02CtH02
CtH03CtH03
CtG01CtG01
CtG03TChCtH03
Table 6. IoU metric results for the Los Mochis 2018-227—18:00 and Mexico City 2019-247—20:10 (4 September 2019) events for each ML Approach.
EventLRRFMLPLRstackingRFstackingBaggingHvotingSvoting
Los Mochis 2018-227—18:000.860.760.560.440.620.670.650.65
Mexico City 2019-247—20:100.530.510.510.410.420.530.520.45
Disclaimer/Publisher’s Note: The statements, opinions and data contained in all publications are solely those of the individual author(s) and contributor(s) and not of MDPI and/or the editor(s). MDPI and/or the editor(s) disclaim responsibility for any injury to people or property resulting from any ideas, methods, instructions or products referred to in the content.