Abstract
In complex environments, the clutter statistical characteristics of synthetic aperture radar (SAR) are inconstant, and the constant detection performance of a false alarm rate (CFAR) detector based on a clutter statistical model is also hard to achieve. As a result, the overestimated threshold leads to a degradation in detection probability. To this end, this paper proposes a SAR ship detector different from CFAR detectors, which is independent of traditional clutter statistical distribution models and the probability of a false alarm (PFA). The proposed detector aims to raise the ship detection probability and alleviate interference from complex environments such as multi-target areas, shores, and breakwaters. It estimates clutter-truncated thresholds based on clutter intensity statistics (CIS). Firstly, three statistical parameters, including the mean, standard deviation, and maximum intensity of background clutter contaminated by outliers, are calculated; secondly, these parameters are utilized to estimate the clutter-truncated threshold using the novel CIS; and finally, the pixel under test is determined according to the CIS detection rule. Compared with CFAR-based algorithms, CIS obtains a high probability of detection in complex environments. As for other aspects, the CIS detector is insensitive to the structure of the detection window, as well as the size. It is also computationally efficient due to its simple calculations. The superiority of the CIS detector is validated on scene-differed SAR images from the DSSDD dataset.
1. Introduction
Synthetic aperture radar (SAR) shows a strongly growing trend towards remote sensing applications such as rescue, maritime monitoring, resource surveys, and agricultural estimation due to its all-weather conditions, cloud-resistance, and day-and-night imaging capabilities compared with the traditional remote sensing mode. Ship detection in maritime activities is a typical SAR remote sensing application. At present, many high-resolution SAR satellites have been launched into orbit, such as TerraSAR-X, Sentinel-1, Capella, and GaoFen-3. These satellites generate SAR data continuously for various industries. SAR ship images are also produced and added to various ship detection datasets.
Compared with sea clutter, ship targets have higher intensities in SAR images. This means that ship targets are brighter than sea clutter due to the stronger corner reflection of the ship’s metal structure [1]. However, the azimuth ambiguities, the state of the sea, and the wake of the ship all result in significant interference, which can cause a bright and heterogeneous sea background. In addition, phase errors often lead to a degradation in the focusing quality of SAR imagery [2], leading to an extended back-projection (EBP) algorithm to compensate for the phase errors being proposed. In [3], the authors performed parametrization of the minimum cost flow (MCF) algorithm to address the problem of phase unwrapping in a SAR radar. The bright high-intensity outliers significantly affect the accuracy of ship detection. Meanwhile, tiny ships show little discernible texture and shape information in high-resolution SAR imagery. Especially in complex environments, such as multi-target areas, shores, narrow waterways, and breakwaters, the probability of detection degrades sharply. It can be said that the challenge of SAR ship detection still exists.
SAR ships in complex environments from a DSSDD dataset [4] are shown in Figure 1, which shows some typical scenes such as different sizes of ships, the azimuth ambiguities, multi-target areas, and breakwaters, as well as inshore ships and different sea states. These complex environmental interferences, with their brightness and shape being close to the ship targets, make it difficult to distinguish between them. At the same time, the sidelobe and azimuth ambiguity even cause the loss of ship features such as shape and texture.
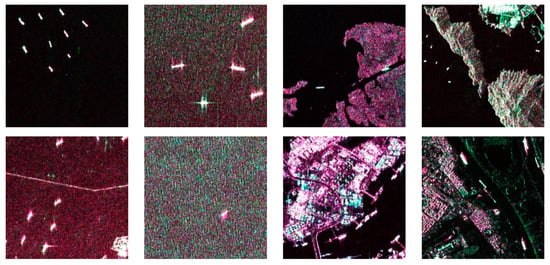
Figure 1.
Pseudo-color SAR images from the DSSDD dataset in azimuth ambiguity, multi-target areas, breakwaters, and inshore scenes.
In the past decade, a large amount of research on SAR ship detection has been carried out. Meanwhile, it was revealed that the most widely used methods are the CFAR-based algorithms that are constantly developed in research [5]. CFAR detectors estimate clutter-truncated thresholds adaptively to segment ship target and sea clutter pixels. Mathematically, sea clutter can be described by a theoretical probability density function (PDF). The adaptive thresholds can be calculated from the statistical parameters of the clutter samples according to the PDF, which sustains a constant probability of false alarm.
CFAR detectors have been practically applied to control the high false alarm rate (FAR) of radar receivers and have shown remarkable effectiveness [6]. Up until now, many CFAR-based detectors have been proposed. SAR image pixels are detected one by one through a small detection window that is divided into a test region, a guard region, and a background region. To a large extent, CFAR detectors depend on the statistical models of sea clutter to estimate the thresholds. For different sea states, the statistical models are different, such as Log-normal [7], K [8], Weibull [9], G [10], generalized Gamma [11], and alpha-stable [12]. According to a statistical model and a given PFA, some parameters of the sea clutter samples in a sliding window are calculated to estimate the adaptive threshold. Then, the central (or tested) pixel in the sliding window is compared with the estimated threshold.
In the past few years, artificial intelligence technology has developed rapidly and is being applied in many fields such as image interpretation, autonomous driving, and neural machine translation. SAR ship detection is part of image interpretation tasks. For this task, convolutional neural networks (CNNs) demonstrate strong recognition capability [13,14,15,16,17]. CNNs learn the features of SAR ships autonomously and point out the probabilities of the suspected ships in SAR imagery. However, similar to the traditional methods, CNN-based ship detection algorithms also face the common problem that the detection probability deteriorates in complex environments. To solve this, with the efforts of many scholars, CNN-based methods have achieved significant ship detection performance on high-resolution SAR images [18,19,20,21].
In recent years, there has been an obvious trend that more and more research on SAR ship detection has focused on artificial intelligence algorithms. Nevertheless, traditional methods based on threshold segmentation are still used with vigor.
The differences between them are expressed in the following aspects:
- Algorithm principles. The threshold estimation of the traditional methods is based on a theoretical clutter statistical model such as Log-normal, Rayleigh, and Otsu. This means that the threshold is adaptive to changes in sea clutter as long as the clutter statistics fit the known model. CNN-based methods learn ship target features autonomously and then fix the weight parameters. However, as the CNN deepens, the learned features become unexplainable gradually.
- Detection rules. In the traditional methods, each pixel is determined by comparing it with an adaptive threshold. CNN-based methods determine ship targets according to the confidence levels calculated from the statistical features of SAR ship images such as shape and texture.
- Detection results. Binary segmentation images are the output results of traditional methods. For most CNN-based methods, the ships are marked by external boxes.
- Parameters. Artificial intelligence algorithms must be trained towards the dataset and save the necessary number of parameters. Traditional methods are the opposite.
The threshold estimation of the traditional methods is mainly affected by the clutter statistical model and the specified PFA. Complex scenes often produce many outliers, which result in large statistical parameters. As a consequence, the threshold is overestimated. A ship pixel tends to be determined as a clutter pixel when comparing it with a large threshold. In addition, an inappropriate PFA may cause a larger threshold deviation due to incorrect statistical parameters.
To solve the probability of detection degradation in complex environments, we proposed a novel SAR ship detector based on clutter intensity statistics (CIS), which is irrelevant to the clutter statistical model and PFA, and estimates the adaptive threshold using clutter intensity information and simple calculations. Firstly, the statistical parameters of outlier-contaminated clutter samples, including mean, standard deviation, and the maximum intensity of the background clutter, are calculated in a sliding window; secondly, the three statistical parameters are used to calculate the adaptive threshold according to the novel intensity statistical model; and finally, the pixel under test is determined by comparing it with the adaptive threshold.
The major contributions of CIS are listed below:
- Clutter intensity statistics (CIS) are proposed to detect SAR ships in complex environments. CIS establishes the relationship between the ship target and the outlier, which expands their difference. The influence of outliers is effectively alleviated, especially for complex scenes. Although the CIS detector is irrelevant to traditional clutter statistical distribution models and PFA, it still projects outstanding performance.
- The structure of the detection window is no longer a sensitive factor for SAR ship detection. As the max intensity of outliers in a sliding window becomes one term of the adaptive threshold estimation formula, the threshold estimation is less affected by the intensities and quantity of outliers in clutter samples.
- Adjustment factor λ is an adjustor that is utilized to adjust thresholds to raise the probability of detection or decrease false alarms. λ is the only global parameter. The optimal λ is determined according to the experimental results on detection performance under the different simulated clutters.
The other parts of this paper are listed as follows. Section 2 introduces the related work on SAR ship detection. The CIS detection methodology details and detection rule are described in Section 3. The analysis of experimental results is given in Section 4, including the analysis of the detecting accuracy, the selection of the optimal adjustment factor, and the structure of the detection window as well as the computational efficiency. The experimental results sufficiently demonstrate the outstanding performance of the CIS detector in complex environments. Section 5 discusses some key derivations of the CIS model and the influence of the size of the detection window on CIS detection accuracy. Finally, the conclusion is presented in Section 6.
2. Related Work
In real SAR images, sea clutter is nonideal. It tends to be contaminated by outliers such as speckle noise, sidelobes, and other objects. The outliers cause inaccurate clutter parameter estimation. As a result, the thresholds are overestimated, and then ship targets are removed due to such a large threshold. To solve the interference from outliers, many CFAR detectors are proposed. CA-CFAR [22] and TP-CFAR [7] are widely applied due to their simple calculations, but both have large detection losses on homogeneous backgrounds. The OS-CFAR [23] based on order statistics shows a markable advantage in multi-target detection but is seriously interfered with by outliers and computational inefficiency. GO-CFAR [24] and SO-CFAR [25] improve on CA-CFAR and use the maximum and the minimum means of four blocks that make up the background region to estimate the local detection thresholds, respectively. However, GO-CFAR suffers from detection loss, while the false alarm of SO-CFAR has increased. VI-CFAR [26] shows a good performance by utilizing the special clutter samples of the background window to estimate the detection threshold, but the detection probability degrades in heterogeneous clutter. In [27], the statistics-truncated CFAR detector is proposed, which raises the detection probability, but the false alarm increases due to the low threshold resulting from the clutter with the removal of high-intensity samples. In [28], the correlation between adjacent pixels and CFAR detection is combined to preserve target signals. Consequently, the parameters estimated with the truncated sea clutter are smaller than those estimated with the real sea clutter, resulting in a high false alarm rate. TS-LNCFAR [29] improves [27] and shows a better detection performance. Its detection results are greatly affected by the truncation depth. In [30], a feature group based on the invariant area ratio is designed to eliminate the capture effect. However, the heterogeneous sea clutter deteriorates the detection probability. In [31], an iterative censoring scheme is proposed, which censors the clutter samples iteratively based on an automatically generated target feature map. However, it takes much time to converge. NLM-CFAR [32] suppresses coherent speckle noise with non-local mean filtering. However, the iterative determination of the proper non-local mean also needs much time. Ray-CFAR [33] only utilizes the outermost samples of the detection window for parameter estimation, ensuring that the signals do not overflow, but it still cannot fully adapt to complex environments, resulting in ship target pixel loss. This is also a common problem for CFAR detectors. IB-CFAR [34] uses spatial and intensity information to detect ships. It shows a significant detection performance and robustness. However, IB-CFAR heavily relies on the details of SAR images. For medium- or low-resolution SAR images, its performance is weakened. OR-CFAR [35] raises the probability of detection in multi-target backgrounds. It removes high-intensity clutter samples first and then uses the remaining samples for parameter estimation and threshold calculation. However, the detection window without a guard region cannot always adapt to complex environments. Further, the probability of detection declines sharply for scenes with few sea clutter samples around ships such as narrow waterways. In [36], a trimodal discrete (3MD) radar clutter model is proposed based on the idea that sea texture can be statistically modeled as discrete in nature instead of using continuous texture statistics. It achieves robust results and low computational complexity according to computing the texture parameters.
It is known that a CFAR detector requires a clear clutter statistical model and a specified PFA. And the detection results are strongly affected by outliers. Complex environments, such as multi-target areas, shores, and sea states, make the clutter statistical model inconstant [37]. This situation makes CFAR detectors obtain inconstant detection performance. In order to raise SAR ship detecting probability and reduce the interference from complex environments, a new SAR ship detector based on clutter intensity statistics (CIS) is proposed.
3. Methods
Figure 2 shows the CIS detection flowchart and some detection details. CIS detection contains two main parts: (1) adaptive detection threshold estimation using simple calculations, such as the standard deviation, mean, maximum intensity, and adjustment depth, and (2) the detection rule. After a comparison with the adaptive threshold, the tested pixel is determined as a ship pixel or a clutter. After all the pixels are examined, a binary image containing ship targets only is the output.
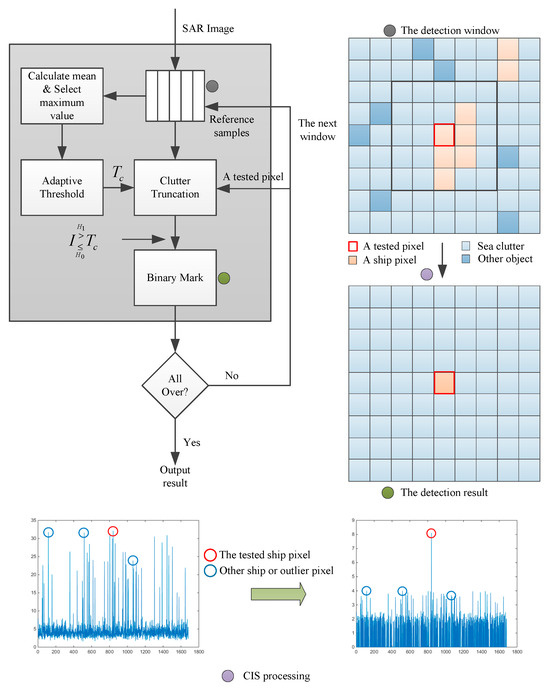
Figure 2.
CIS detection flowchart.
TP-CFAR [7] is described in Section 3.1 first. On the one hand, the CIS detector is inspired by TP-CFAR. On the other hand, CFAR detection is briefly introduced using TP-CFAR as an example. Section 3.2 and Section 3.3 introduce the CIS detection methodology and the detection rule, respectively.
3.1. TP-CFAR Detector
For TP-CFAR, the adaptive threshold is calculated using the mean, standard deviation, and scale factor. Let I be the clutter samples and I = {I1, I2, ···, IN−1, IN}. The mean and the standard deviation are computed by
where μ is the mean and σ is the standard deviation.
If the intensity of the tested pixel I satisfies formula (3), the tested pixel is considered as a ship pixel; otherwise, it is considered a clutter pixel.
where T is the threshold and ĸ is the scale factor, which is calculated using the statistical model of the clutter samples I.
The probability density function of I is supposed to obey Gaussian in TP-CFAR. When a PFA is specified, ĸ can be deduced as
where Θ (∙) is the cumulative distribution function of the standard normal distribution. ĸ is calculated using the inverse function of Θ (∙).
3.2. CIS Detection
For the TP-CFAR detector, the PFA must be given, and the PDF of clutter distribution should be consistent with Gaussian. However, the statistics of the outlier-contaminated clutter suffer from instability. Meanwhile, outliers in sea clutter make it hard for TP-CFAR to obtain constant detection performance against a fixed PFA. An outlier is the non-negligible point that affects detection performance. Hence, the threshold estimation of the CIS detector considers interference from outliers.
In the TP-CFAR algorithm, formula (3) shows the relationship between the mean, the standard deviation of clutter samples, and the ship target. Inspired by it, the relation can be expressed through an approximate signal-to-clutter ratio:
The maximum intensity ξ of outliers in the sea background window can be expressed as
For the CIS detector, the pixels except for the test (or center) pixel or protection window in a small detection window are collectively referred to as “clutter pixels”, although these pixels may contain ship pixels.
Sea clutter with outliers and ship targets are inhomogeneous, and the intensity values are different. It is known that ξ is larger than μ, which is calculated using I. As mentioned in [1], the ship’s target intensity is larger than the average intensity of the sea clutter around it. Let Is be a ship pixel and Is > μ. Ideally, Is > ξ, and then Is − μ can be divided into many equal parts, and each one is 0 < Ωk ≤ 1 and Ω1 = … = Ωn. Expression (5) can be deduced as
where 1 < k ≤ n and ĸ’ is the ideal threshold factor. Note that the ideal situation, Is > ξ, is discussed, but the final formula also handles non-ideal situations. It is proved in the complex scene experiments of Section 4. Computing the geometric average of (7), the new inequality is described as
where v represents n − k + 2.
v is hard to determine simply, which can be understood that v is determined while μ + (k − 1) ∙ Ωk-1 is approximately equal to ξ. Therefore, (8) is proceeded to deduce until eliminating the uncertain term of Ωk. By computing the geometric average of the terms in (Is − μ)/σ and Ωk/σ, (9) can be obtained:
The larger the n, the smaller the Ωk. If Ωk is small enough, it can be satisfied that the ratio of Ωk to σ is less than 1.0. In real clutter samples, high-intensity outliers make the sea background inhomogeneous, and their intensity values are higher than the mean of sea clutter. Then, the standard deviation of the outlier-contaminated clutter tends to be far larger than 1.0. Therefore, the situation that the ratio of Ωk to σ is less than 1.0 exists. Then, formula (9) can be deduced as
where λ represents v/2 and 1 ≤ λ.
Formula (9) is obtained by the calculation of the geometric average twice. The uncertain relationship between (8) and (10) is established. It eliminates the outliers whose intensities are close to Is, which is discussed in Section 5.
Formula (10) eliminates the uncertain term of Ωk to raise the computing efficiency. Formulas (8) and (10) express similar physical meanings: the ratio of signal to clutter and the ratio of high-intensity outlier to clutter, respectively. Thus, by combining (7) and (10), the ideal formula (11) can be obtained:
where λ is a global parameter determined by Monte Carlo simulation experiments. When (Is – μ)/σ > ĸ′, Is is considered a ship pixel. Therefore, the CIS detection threshold Tc is described as
The adjustment factor λ is an adjustor by which Tc can be changed. Therefore, the fact can be seen that the PFA and clutter statistical model are not prerequisites for the adaptive threshold estimation of the CIS detector. The only thing to consider is the adjustment factor λ. This means that the complexity of the threshold estimation has decreased.
3.3. The Rule of the CIS Detection
The main steps of CIS are elaborated below:
- The adjustment factor λ is initialized. The size of the test window is determined according to the sizes of the ships in a SAR image.
- The parameters μ, ξ, and σ of clutter samples in the background window are computed according to formulas (1), (2), and (6).
- The adaptive threshold Tc is estimated using the CIS model, as shown in formula (12). Tc is used to separate the ship pixels from sea clutter in a local window.
- The intensity value of the tested pixel is compared with Tc. The rule of CIS detection is
If I > Tc, the detected pixel is regarded as a ship pixel; otherwise, it is regarded as clutter.
- 5.
- If all the pixels are detected, the final detection result is the output. Otherwise, the next pixel is moved it and steps from (2) to (4) are repeated.
4. Experiment
4.1. Experiment Introduction
Figure 3a shows the multi-target scene where 21 ship targets of different sizes distribute densely and with sidelobes. Figure 3b exhibits three ship targets on a narrow waterway and the shore background. Figure 3c shows one ship target on the sea and three ship targets near the breakwaters.
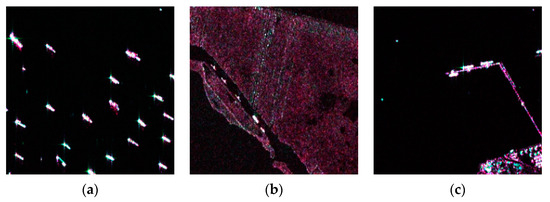
Figure 3.
Pseudo-color SAR images from the DSSDD dataset: (a) multi-target scene, (b) shore scene, and (c) breakwater scene.
Some SAR images from DSSDD [4] with typical scenes are used to validate and analyze the superiority of the proposed CIS detector in complex environments such as multi-target, shore, and breakwater. The DSSDD dataset consists of pseudo-color enhanced Sentinel-1 imagery. Dual vertical (DV) polarization images in Sentinel-1 IW mode were selected as samples to construct pseudo-color enhancement. Each pixel was obtained by taking |C11|, |C12|, and |C22| elements of polarimetric covariance matrix C as red, green, and blue channels, respectively.
The images are shown in Figure 3. The detailed information of the original Sentinel-1 imagery and DSSDD dataset are listed in Table 1 and Table 2, respectively.

Table 1.
The basic information of the original Sentinel-1 imagery.

Table 2.
The basic information of the DSSDD dataset.
According to [35], OR-CFAR shows the robustness of ship detection in a multi-target environment and performs better than other similar methods. Thus, it is selected as the reference method. The CIS detector is inspired by TP-CFAR, so it is also chosen. Three classic and cell-average-based CFAR detectors, such as CA-CFAR, SO-CFAR, and GO-CFAR, are picked for comparison with the CIS detector. In addition, LN-CFAR based on the Log-normal model and Ray-CFAR based on the Rayleigh model are also selected as the reference methods.
The experimental parameters are described as below:
- The structures of the detection windows of the reference methods are listed in Table 3. The size of the detection window is set according to the sizes of the ships.
 Table 3. The detection windows of the reference methods.
 - According to [35], a false-alarm rate of 0.00001 is set for all the CFAR detectors, and the truncation depth γ of OR-CFAR is 2.0.
- The symmetric image block is used to detect the edge pixels of a SAR image.
- The adjustment factor λ of CIS is set to 1.0, 2.0, and 3.0. The aim is to investigate the detection performance of CIS under different adjustment factors.
4.2. Detection Results
Figure 4, Figure 5 and Figure 6 illustrate the experimental results of SAR ship detection in different scenes.
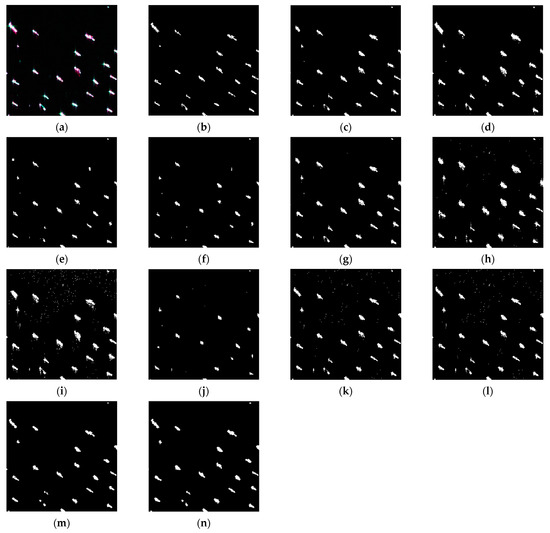
Figure 4.
A comparison of the detection performance on a multi-target scene: (a) Figure 3a; (b) ground truth; (c) CA-CFAR; (d) SO-CFAR; (e) GO-CFAR; (f) TP-CFAR; (g) LN-CFAR; (h) Ray-CFAR; (i) OR-CFAR with γ = 2.0; (j) CIS with λ = 1.0; (k) CIS with λ = 2.0; (l) CIS with λ = 3.0; (m) filtered on (k) through the open operator of morphology; and (n) filtered on (l) through the open operator of morphology. The PFA of 1.0 × 10⁻⁵ is set for all CFAR detectors.
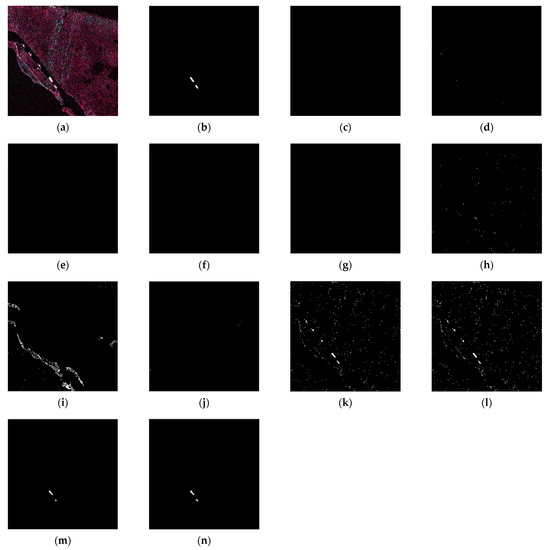
Figure 5.
A comparison of the detection performance on the shore scene: (a) Figure 3b; (b) ground truth; (c) CA-CFAR; (d) SO-CFAR; (e) GO-CFAR; (f) TP-CFAR; (g) LN-CFAR; (h) Ray-CFAR; (i) OR-CFAR with γ = 2.0; (j) CIS with λ = 1.0; (k) CIS with λ = 2.0; (l) CIS with λ = 3.0; (m) filtered on (k) through the open operator of morphology; and (n) filtered on (l) through the open operator of morphology. The PFA of 1.0 × 10⁻⁵ is set for all CFAR detectors.
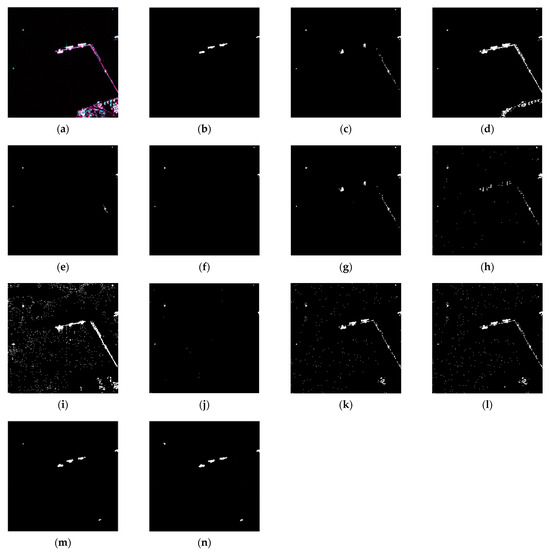
Figure 6.
A comparison of the detection performance on the breakwater scene: (a) Figure 3c; (b) ground truth; (c) CA-CFAR; (d) SO-CFAR; (e) GO-CFAR; (f) TP-CFAR; (g) LN-CFAR; (h) Ray-CFAR; (i) OR-CFAR with γ = 2.0; (j) CIS with λ = 1.0; (k) CIS with λ = 2.0; (l) CIS with λ = 3.0; (m) filtered on (k) through the open operator of morphology; and (n) filtered on (l) through the open operator of morphology. The PFA of 1.0 × 10⁻⁵ is set for all CFAR detectors.
Figure 4a shows the SAR ship image with the size of 256 × 256 pixels, as well as more than 20 densely distributed ships in different sizes and the case of azimuth ambiguity. Figure 4b shows the ground truth. Most of the detectors detect all the ship targets except TP-CFAR, as shown in Figure 4f. The ships missing in the TP-CFAR detection results are the ones affected heavily by azimuth ambiguity. It can be explained that the removal of the ship targets results from large thresholds, which are obtained through the inaccurate parameter estimation of clutter samples contaminated by the azimuth ambiguity and the dense ships. CA-CFAR, GO-CFAR, LN-CFAR, Ray-CFAR, and OR-CFAR preserve all ships, but detection loss exists in the detection results due to their high thresholds. CA-CFAR, GO-CFAR, and LN-CFAR use the cell-average method to estimate parameters. GO-CFAR divides the background window into four regions and selects the maximum mean of these regions as a multiplier with the calculated CFAR detection threshold factor. Regardless of the selection of mean, maximum, or minimum mean, the threshold estimation is influenced severely by the high-intensity outliers in the clutter samples. If these statistical parameters are excessively large, the threshold tends to be inevitably large. This situation causes detection probability degradation. For Ray-CFAR when using few samples to calculate the parameters, the thresholds are often underestimated, resulting in the ship pixels being more than the ground truth; meanwhile, a low PFA can make some local detection thresholds large, causing missing ship pixels such as the ship at the bottom of Figure 4h. The detection results of OR-CFAR are similar to Ray-CFAR. It uses truncated clutter to estimate the adaptive threshold. However, the threshold seems unstable, resulting in more or fewer ship pixels than the ground truth. It can be deduced that the threshold estimation is related to the outliers in the truncated clutter. If high-intensity clutter samples are removed massively, the threshold calculated using the remaining clutter samples is low; otherwise, it is large. It can be concluded that the truncation depth affects the accuracy of the threshold estimation of OR-CFAR. The detection results of CIS against different adjustment factors, shown in Figure 4j–l, are close to the ground truth except in Figure 4j. It can be explained that its threshold estimation can overcome the interference from multi-targets, preserving the true target pixels. Although the isolated noise points are left in the detection results, they can be easily removed by feature extraction and classification [38,39], deep learning [40], morphology filtering, etc. It is also seen that a low adjustment factor results in detection loss. Thus, an appropriate adjustment factor is critical, which is discussed in the next section. Figure 4m,n show the filtering results by the open operator against Figure 4k,l, respectively.
Figure 5a shows that the ships are in a shore-dominated scene with narrow waterways. The ground truth is shown in Figure 5b. Very few sea clutter samples are around the two ships. On the contrary, shore pixels represent the most pixels in the background window. The statistical characteristics of such background samples are inconsistent with that of sea clutter. The parameters, such as mean and standard deviation, are also larger than the actual ones of sea clutter, which results in a large threshold. Under these situations, the ship targets are often removed from the detection results. The reason is that the threshold is overestimated due to high-intensity outliers. The results of the CFAR detection prove the above analysis. Most of the detectors eliminate the two ships, as shown in Figure 5c–i. Only CIS can detect both ships when λ is equal to 2.0 or 3.0. The threshold estimation of the CIS detector uses outliers in the clutter samples. In this way, it can reduce the interference from outliers and raise the detection probability. Although CIS is irrelevant to the statistical model of sea clutter samples, it can still achieve, or even surpass, the detection performance of CFAR-based detectors.
As a further analysis, the detection threshold of CIS is calculated using the maximum intensity outlier. It can be deduced that such a threshold can distinguish the targets from the outliers to a large extent. Meanwhile, most of the outliers are eliminated, and the remaining are decomposed into discrete noise points, as shown in Figure 5k,l. In high-resolution SAR imagery, the ship target consists of many high-intensity pixels. The isolated noise points can be removed easily without heavy influence on the ship targets, as shown in Figure 5m,n.
Figure 6a,b show the shore scene and the ground truth, respectively. Three ships are moored at the breakwater, and one is in the sea. The ship targets are absent or indiscernible in the detection results of the CA-CFAR, GO-CFAR, TP-CFAR, LN-CFAR, and Ray-CFAR detectors. The reasons are consistent with the analysis in the previous scenes: large threshold due to incorrect parameter estimation. Figure 6i shows that all ship targets seem to be detected by the OR-CFAR detector. Actually, most of the two ship pixels are missing; meanwhile, the breakwater pixels close to the two ships are preserved. It is exposed that the clutter truncation is non-ideal as many high-intensity pixels are left in the truncated clutter and interfere with the threshold estimation. As a result, partial pixels of the ship targets are discarded when compared with a large threshold. SO-CFAR performs well, but too many breakwater pixels are left in the detection results. Thus, a smaller PFA is needed to generate a larger threshold. Nevertheless, an appropriate global PFA cannot be determined simply and accurately. This situation is also a drawback of CFAR-based detectors. As for the CIS detection results illustrated in Figure 6k,l, it is observed that the ships are almost intact; meanwhile, the outlier pixels such as breakwater are removed massively, and the residual points become isolated or dispersed. After morphology filtering, they are nearly filtered out, as shown in Figure 6m,n.
The performance of CIS detection shown in Figure 6l is worse than in Figure 6k,l due to a low adjustment factor λ. The lower the λ, the higher the threshold, which can be deduced according to formula (12). Thus, an adjustment factor is the key point for the CIS detector, which is analyzed in Section 4.3.
4.3. Analysis
4.3.1. The Analysis of the Optimal Adjustment Factor
According to the analysis of the detection results in Section 4.2, it can be concluded that an optimal adjustment factor determines the performance of the CIS detection.
In order to evaluate the performance of CIS detection under different adjustment factors, the clutter data are simulated with the size of 100 × 100 pixels. Furthermore, four common clutter statistical models are used to simulate sea clutter, whose parameters are shown in Table 4.

Table 4.
The parameters of 4 clutter statistical models.
When a ship target pixel is detected, other ship targets in the detection window are regarded as outliers. Therefore, a multi-target environment can be simulated by adding multiple targets to the clutter. The target samples are generated from a uniform distribution, of which intensity is in the range of 1.2 to 3.0 times the maximum value of the clutter-simulated data, and the clutter data are randomly replaced by these targets. The target interference ratio is described as the fraction of the target samples in all clutter samples. Considering that the width of the detection window is 40 pixels (excluding the center pixel), the probability that there is only one outlier in one-dimensional data is 2.5%. Then, for two-dimensional data composed of such one-dimensional data, more than one pixel can be guaranteed to exist within the detection window. Thus, the target interference ratio of 2.5% is implemented in the simulated clutter samples.
The probability of detection (PD) and the false alarm rate (FAR) can be calculated according to [41]. The PD is defined as the proportion of the number of pixels accurately determined as ship pixels in the total ship pixels. The FAR is defined as the proportion of the number of pixels falsely determined as ship pixels in the total clutter. The experiments are implemented against different adjustment factors, of which the range is from 1.0 to 10.0. The plots of CIS detection are shown in Figure 7.
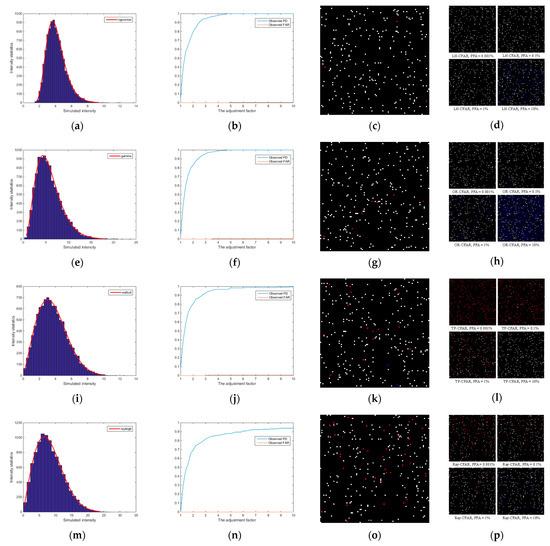
Figure 7.
Plots of CIS detection performance against different adjustment factors: (a,e,i,m) show the simulated clutter distribution fitting; (b,f,j,n) exhibit PD and FAR performance; (c,g,k,o) are the visualization of detection results when λ = 3.0; (d,h,l,p) are the detection results of LN-CFAR, OR-CFAR, TP-CFAR, and Ray-CFAR against different PFAs of 0.001%, 0.1%, 1%, and 10% (red: missed target points; blue: false alarm points).
Figure 7a,e,i,m show the histogram statistics of the four clutter-simulated samples. The fitting results are consistent with the four preset models. Figure 7b,f,j,n exhibit the performance of CIS detection under different λ for different clutter statistical models. The PD becomes stable and high when λ is close to 3, 4, or 5, but the FAR also appears when λ > 3. In summary, considering a high PD and a relatively lower FAR under different clutter statistical models, the statistical optimal adjustment factor of 3.0 is selected. Figure 7c,d,g,h,k,l,o,p show the CIS detection results, which, for λ = 3.0, have higher PDs (white pixels) and lower FARs (blue pixels) than the reference methods.
4.3.2. Detection Performance Analysis
Pixel accuracy (PA), pixel recall (PR), and pixel precision (PP) are used to analyze the detection performance of the CIS detector. They are calculated as below, respectively,
where TP is the true ship pixel detected; TN is the true sea pixel detected; FP is the false alarm pixel; and FN is the pixels mis-detected as clutter.
Figure 4a, Figure 5a, and Figure 6a are selected to calculate these metrics. The PFAs are set to 0.001%, 0.1%, 1% for the CFAR methods. A comparison of the results is shown in Table 5. For the three different scenes and the different PFAs, the proposed CIS exhibits outstanding performance. CIS has high pixel accuracy and pixel recall; furthermore, the pixel precision is the highest. The other detectors show different performances under the different PFA and scenes. The reference methods achieve inflated pixel accuracy due to the contribution of the background pixels detected, but they generate many false-alarm ship pixels. This can be seen based on the pixel precision of Figure 4a in Table 5. For complex scenes, such as Figure 5a and Figure 6a, the reference methods obtain low pixel recall and pixel precision. But the CIS detector still achieves better performance than the others against complex scenes. The CFAR detectors, such as CA-CFAR, TP-CFAR, LN-CFAR, Ray-CFAR, and OR-CFAR, require different PFAs to detect ships accurately for different scenes, which reduces the algorithm adaptability.

Table 5.
Detection performance analysis under different scenes and PFAs.
To further analyze the performance of the CIS detector, ROC curves are drawn, as shown in Figure 8. Figure 4a is selected to calculate the analysis metrics TPR (same as PR) and FPR (false positive rate). The expression of FPR is below
where TPR is the recall or true positive rate, and FPR is the false alarm rate.
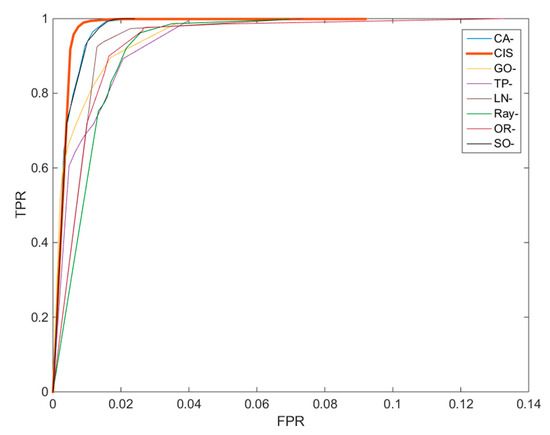
Figure 8.
The ROC performance curves of different detectors.
For CFAR-based methods, the range of PFAs is from 1.0 ×10⁻¹⁰ to 1.0. The range of the parameter λ of the CIS detector is from 0.1 to 5. Other parameters are the same as the experiment in Section 4.2.
According to Figure 8, it can be seen that the ROC performance of the CIS detector is better than other reference methods. The CIS detector obtains a high PR with a low FPR and rises up to a stable state quickly. Meanwhile, the reference methods show differentiated results. This indicates that not only is the probability of CIS detection higher than the reference methods, but it also achieves fewer false alarms.
4.3.3. Analysis of the Structure of the Detection Window
The detection performance of the CIS detector is also related to the structure of the detection window. For most of the methods based on CFAR, a detection window is often composed of a test window, a guard window, and a background window. In this section, the impact of different windows on detection performance is analyzed.
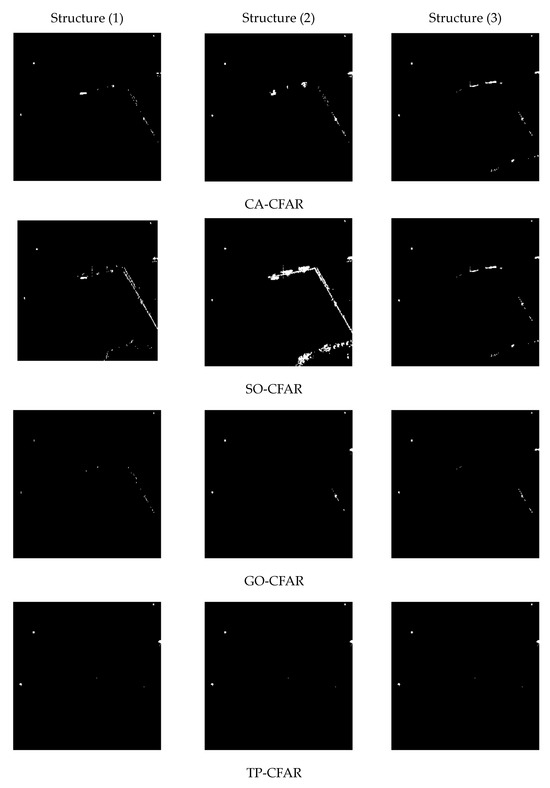
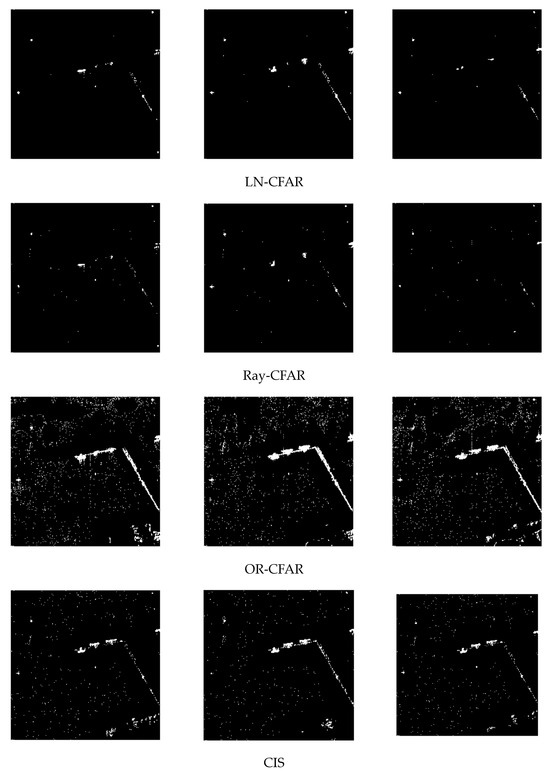
Ray-CFAR, OR-CFAR, and other CFAR detectors have different structures of detection windows. Therefore, the detection performance of the CIS detector is analyzed against their three different windows, as shown in Table 6. Structure (1) does not have a guard window but has a large amount of background clutter. Meanwhile, structure (3) has a large guard window but few clutter samples. Structure (2) is a traditional detection window. Figure 4a and Figure 6a are selected as the test images. The final detection results are shown in Figure 9.

Table 6.
The structure of the detection window.
For the different windows described in Table 6, all the ship targets are accurately detected by CIS. This proves that CIS is less affected by the different structures of the detection window. For structures (1), (2), and (3), the other methods show different ship pixel loss. Comparing structure (1) with structure (2), the detection results against structure (2) are better than the other structures. It can be explained that parts of the high-intensity ship targets, without the protection of the guard window, overflow into the background clutter samples, which results in overestimated thresholds. Compared with structure (3), structure (2) preserved the integrity of the ship targets better. The reason is that the parameters calculated using small samples, such as the mean and standard deviation, are affected much more than those calculated using large ones. Based on the analysis of the experimental results, it can be determined that CIS achieves a better performance than other methods under different structures.
4.3.4. Computational Efficiency Analysis
Time consumption is one of the important indicators for evaluating the performance of an algorithm. In this section, the proposed CIS is compared with other reference methods in terms of time. This experiment is carried out on a desktop computer with a Core (TM) i3-2120 CPU, 8 GB RAM, and the 64-bit Windows 7 operating system. The CIS detector is developed using MATLAB (R2014b). Table 7 lists the time consumed by the CIS and the CFAR-based detectors in Figure 4a, Figure 5a, and Figure 6a.

Table 7.
Computational time of the CIS and CFAR detectors.
All the methods except OR-CFAR are less time-consuming than the simple calculations. CIS only needs simple processing such as mean, standard deviation, and maximum intensity of sea clutter. Therefore, the computational efficiency of CIS is close to the two-parameter-based CFAR detectors such as TP-CFAR, LN-CFAR, and Ray-CFAR. OR-CFAR spent a relatively long time on the three main steps of truncation clutter, parameter estimation, and adaptive threshold calculation. In addition, CFAR detectors rely on the PDF of sea clutter. The PDF is determined by the clutter statistical model. It is assumed that the whole SAR image and any local sea clutter obey the same statistical model. In fact, the local clutter statistical model may differ from the global one [37]. If clutter statistics are implemented on each local sample, the processing time will be quite long. On the contrary, the proposed CIS detector results in less time consumption due to simple parameter statistics.
5. Discussion
5.1. Size of the Detection Window
The previous section analyzes the impact of the structure of the detection window. This section discusses the impact of the size of the detection window. Actually, the parameters are calculated using the clutter samples in the background window, which is part of the detection window shown in Table 3. To avoid confusion, the detection window is shown instead of the background window. The size of the detection window is related to the number of clutter samples. Different clutter samples can lead to different statistical results.
Figure 10 shows the experimental results of CIS, OR-CFAR, and Ray-CFAR detection against Figure 3a and Figure 5a. The range of the size of the detection window is from 23 to 65 pixels with a step of 2.
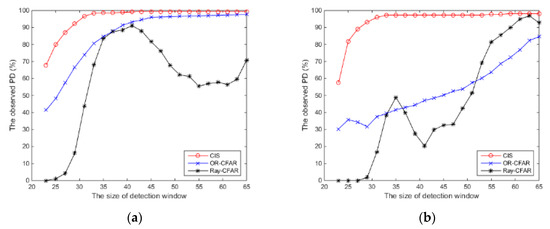
The detection performance curves of the CIS detector converge quickly, and both show the same trend. It can be determined that CIS is hardly affected by the changes in clutter samples resulting from the different sizes of the detection window. At the same time, OR-CFAR and Ray-CFAR exhibit fluctuations and instability.
5.2. Analysis of Large-Scale Images
Large-scale images have more complex scenes, which can be used to better examine the performance of the CIS detector. A high-resolution SAR image with 800 × 800 pixels from the HRSID dataset [42] is shown in Figure 11. The image is complex for ship detection, including shore, breakwater, noise, and other highlighted pixels. There are many densely distributed ships of different sizes and large areas without ships in the image.
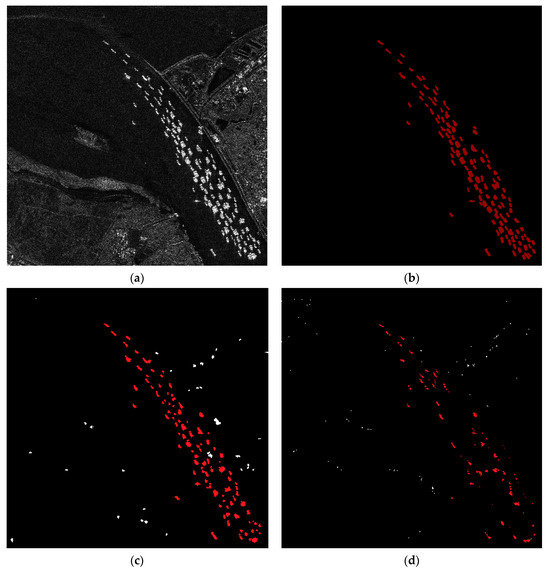
Figure 11.
The detection results against a large-scale image: (a) a SAR image from HRSID; (b) ground truth; (c) the CIS detection result; and (d) the OR-CFAR detection result. (red: ship pixel; white: false alarm).
Compared with the ground truth, most of the ships are detected by the CIS detector, although some false alarm pixels appear. OR-CFAR obtains few ship pixels, which means the PD is quite low. For the CIS detector, the PD is higher than that of OR-CFAR, but ship pixel loss still exists, and some adjacent ships are detected as one. This will be regarded as the key problem to improve in the future.
6. Conclusions
In this paper, a SAR ship detector based on clutter intensity statistics (CIS) is proposed. CIS is used to design an adaptive threshold estimation algorithm that is irrelevant to PFA and traditional sea clutter statistical models and is only dependent on the adjustment factor. The threshold estimation of the CIS detector considers high-intensity outliers, the mean, and the standard deviation. In this way, it alleviates interference from outliers effectively in complex environments such as breakwaters, shores, narrow waterways, and multi-target areas. Based on the quantitative analysis of the experimental results against real SAR and simulated data, the CIS detection performance outperforms the reference methods in terms of detection precision and recall. As for other aspects, CIS is insensitive to the structure and size of the detection window as well as being simple and efficient. To conclude, the proposed CIS exhibits a better comprehensive performance than other CFAR detectors.
Author Contributions
Conceptualization and software, M.L.; methodology and validation, B.Z. and H.M.; writing—original draft preparation, M.L.; writing—review and editing, B.Z. and H.M. All authors have read and agreed to the published version of the manuscript.
Funding
This work was supported in part by the National Natural Science Foundation of China under Grant 62027801 and the Research Foundation of the Key Laboratory of Spaceborne Information Intelligent Interpretation.
Data Availability Statement
The DSSDD datasets presented in this paper are available at https://github.com/liyiniiecas/A_Dual-polarimetric_SAR_Ship_Detection_Dataset, accessed on 3 November 2021.
Conflicts of Interest
The authors declare no conflicts of interest.
References
- Ai, J.; Qi, X.; Yu, W.; Deng, Y.; Liu, F.; Shi, L. A new CFAR ship detection algorithm based on 2-D joint log-normal distribution in SAR images. IEEE Geosci. Remote Sens. Lett. 2010, 7, 806–810. [Google Scholar] [CrossRef]
- Lin, C.; Tang, S.; Zhang, L.; Guo, P. Focusing High-Resolution Airborne SAR with Topography Variations Using an Extended BPA Based on a Time/Frequency Rotation Principle. Remote Sens. 2018, 10, 1275. [Google Scholar] [CrossRef]
- Dudczyk, J.; Kawalec, A. Optimizing the minimum cost flow algorithm for the phase unwrapping process in SAR radar. Bull. Pol. Acad. Sci. Tech. Sci. 2014, 62, 511–516. [Google Scholar] [CrossRef]
- Hu, Y.; Li, Y.; Pan, Z. A Dual-Polarimetric SAR Ship Detection Dataset and a Memory-Augmented Autoencoder-Based Detection Method. Sensors 2021, 21, 8478. [Google Scholar] [CrossRef]
- Raghavan, R.S. CFAR Detection in clutter with a Kronecker covariance structure. IEEE Trans. Aerosp. Electron. Syst. 2017, 53, 619–629. [Google Scholar] [CrossRef]
- Liu, Y.; Zhang, S.; Suo, J.; Zhang, J.; Yao, T. Research on a New Comprehensive CFAR (Comp-CFAR) Processing Method. IEEE Access 2019, 7, 19401–19413. [Google Scholar] [CrossRef]
- Crisp, D.J. The state-of-the-art in ship detection in synthetic aperture radar imagery. Org. Lett. 2004, 35, 2165–2168. [Google Scholar]
- Oliver, C. A Model for non-Rayleigh scattering statistics. Opt. Acta Int. J. Opt. 1984, 31, 701–722. [Google Scholar] [CrossRef]
- Gu, X.; Fu, K.; Qiu, X. Basics of SAR Image Interpretation; Science Press: Beijing, China, 2017. [Google Scholar]
- Gao, G.; Liu, L.; Zhao, L.; Shi, G.; Kuang, G. An adaptive and fast CFAR algorithm based on automatic censoring for target detection in high-resolution SAR images. IEEE Trans. Geosci. Remote Sens. 2009, 47, 1685–1697. [Google Scholar] [CrossRef]
- Qin, X.; Zhou, S.; Zou, H.; Gao, G. A CFAR detection algorithm for generalized gamma distributed background in high-resolution SAR images. IEEE Geosci. Remote Sens. Lett. 2013, 10, 806–810. [Google Scholar] [CrossRef]
- Liao, M.; Wang, C.; Wang, Y.; Jiang, L. Using SAR Images to Detect Ships from Sea Clutter. IEEE Geosci. Remote Sens. Lett. 2008, 5, 194–198. [Google Scholar] [CrossRef]
- Mao, Y.; Yang, Y.; Ma, Z.; Li, M.; Su, H.; Zhang, J. Efficient low-cost ship detection for SAR imagery based on simplified U-Net. IEEE Access 2020, 8, 69742–69753. [Google Scholar] [CrossRef]
- Zhao, Y.; Zhao, L.; Xiong, B.; Kuang, G. Attention receptive pyramid network for ship detection in SAR images. IEEE J. Sel. Top. Appl. Earth Obs. Remote Sens. 2020, 13, 2738–2756. [Google Scholar] [CrossRef]
- Lin, T.Y.; Dollár, P.; Girshick, R.; He, K.; Hariharan, B.; Belongie, S. Feature pyramid networks for object detection. In Proceedings of the IEEE Conference on Computer Vision and Pattern Recognition, Honolulu, HI, USA, 21–26 July 2017. [Google Scholar] [CrossRef]
- He, K.; Zhang, X.; Ren, S.; Sun, J. Deep residual learning for image recognition. In Proceedings of the IEEE Computer Society Conference on Computer Vision and Pattern Recognition (CVPR), Las Vegas, NV, USA, 27–30 June 2016; pp. 770–778. [Google Scholar] [CrossRef]
- Chen, H.; Zhang, F.; Tang, B.; Yin, Q.; Sun, X. Slim and Efficient Neural Network Design for Resource-Constrained SAR Target Recognition. Remote Sens. 2018, 10, 1618. [Google Scholar] [CrossRef]
- Wang, S.; Cai, Z.; Yuan, J. Automatic SAR Ship Detection Based on Multifeature Fusion Network in Spatial and Frequency Domains. IEEE Trans. Geosci. Remote Sens. 2023, 61, 4102111. [Google Scholar] [CrossRef]
- Zhou, Z.; Cui, Z.; Cao, Z.; Yang, J. Feature-transferable pyramid network for dense multi-scale object detection in SAR images. In Proceedings of the IGARSS 2022–2022 IEEE International Geoscience and Remote Sensing Symposium, Kuala Lumpur, Malaysia, 17–22 July 2022; pp. 647–650. [Google Scholar]
- Cui, Z.; Li, Q.; Cao, Z.; Liu, N. Dense attention pyramid networks for multi-scale ship detection in SAR images. IEEE Trans. Geosci. Remote Sens. 2019, 57, 8983–8997. [Google Scholar] [CrossRef]
- Li, L.; Lv, M.; Jia, Z.; Ma, H. Sparse Representation-Based Multi-Focus Image Fusion Method via Local Energy in Shearlet Domain. Sensors 2023, 23, 2888. [Google Scholar] [CrossRef]
- Finn, H.M.; Johnson, R.S. Adaptive detection mode with threshold control as a function of spatially sampled clutter-level estimates. RCA Rev. 1968, 29, 414–464. [Google Scholar]
- Rohling, H. Radar CFAR Thresholding in clutter and multiple target situations. IEEE Trans. Aerosp. Electron. Syst. 1983, 19, 608–621. [Google Scholar] [CrossRef]
- Hansen, V.G.; Sawyers, J.H. Detectability loss due to “greatest of” selection in a cell-averaging CFAR. IEEE Trans. Aerosp. Electron. Syst. 1980, 16, 115–118. [Google Scholar] [CrossRef]
- Trunk, G.V. Range resolution of targets using automatic detectors. IEEE Trans. Aerosp. Electron. Syst. 1978, 14, 750–755. [Google Scholar] [CrossRef]
- Smith, M.E.; Varshney, P.K. Intelligent CFAR processor based on data variability. IEEE Trans. Aerosp. Electron. Syst. 2000, 36, 837–847. [Google Scholar] [CrossRef]
- Tao, D.; Anfinsen, S.N.; Brekke, C. Robust CFAR detector based on truncated statistics in multiple-target situations. IEEE Trans. Geosci. Remote Sens. 2016, 54, 117–134. [Google Scholar] [CrossRef]
- Ai, J.; Yang, X.; Zhou, F.; Dong, Z.; Jia, L.; Yan, H. A Correlation-based joint CFAR detector using adaptively-truncated statistics in SAR imagery. Sensors 2017, 17, 686. [Google Scholar] [CrossRef]
- Ai, J.; Yang, X.; Song, J.; Dong, Z.; Jia, L.; Zhou, F. An Adaptively truncated clutter-statistics-based two-parameter CFAR Detector in SAR imagery. IEEE J. Ocean. Eng. 2018, 43, 267–279. [Google Scholar] [CrossRef]
- Leng, X.; Ji, K.; Xing, X.; Zhou, S.; Zou, H. Area ratio invariant feature group for ship detection in SAR imagery. IEEE J. Sel. Top. Appl. Earth Obs. Remote Sens. 2018, 11, 2376–2388. [Google Scholar] [CrossRef]
- Cui, Y.; Zhou, G.; Yang, J.; Yamaguchi, Y. On the iterative censoring for target detection in SAR images. IEEE Geosci. Remote Sens. Lett. 2011, 8, 641–645. [Google Scholar] [CrossRef]
- Chang, J.; Zhao, J.; Li, N. Improved 2P-CFAR SAR ship detection method. Foreign Electron. Meas. Technol. 2021, 40, 7–12. [Google Scholar]
- Wu, R. Two-Parameter CFAR Ship Detection Algorithm Based on Rayleigh Distribution in SAR Images. Preprints 2021, 2021120280. [Google Scholar] [CrossRef]
- Ai, J.; Cao, Z.; Mao, Y.; Wang, Z.; Wang, F.; Jin, J. An Improved Bilateral CFAR Ship Detection Algorithm for SAR Image in Complex Environment. J. Radars 2021, 10, 499–515. [Google Scholar]
- Ai, J.; Luo, Q.; Yang, X.; Yin, Z.; Xu, H. Outliers-Robust CFAR Detector of Gaussian Clutter Based on the Truncated-Maximum-Likelihood-Estimator in SAR Imagery. IEEE Trans. Intell. Transp. 2020, 21, 2039–2049. [Google Scholar] [CrossRef]
- Bocquet, S.; Rosenberg, L.; Gierull, C.H. Parameter Estimation for a Compound Radar Clutter Model With Trimodal Discrete Texture. IEEE Trans. Geosci. Remote Sens. 2020, 58, 7062–7073. [Google Scholar] [CrossRef]
- Sana, S.; Ahsan, F.; Khan, S. Design and implementation of multi-mode CFAR processor. In Proceedings of the 19th International Multi-Topic Conf (INMIC), Islamabad, Pakistan, 2 February 2017. [Google Scholar]
- Zhu, C.; Zhou, H.; Wang, R.; Guo, J. A Novel hierarchical method of ship detection from spaceborne optical image based on shape and texture features. IEEE Trans. Geosci. Remote Sens. 2010, 48, 3446–3456. [Google Scholar] [CrossRef]
- Schwegmann, C.P.; Kleynhans, W.; Salmon, B.P. Synthetic aperture radar ship detection using haar-like features. IEEE Geosci. Remote Sens. Lett. 2017, 14, 154–158. [Google Scholar] [CrossRef]
- Jiao, J.; Zhang, Y.; Sun, H.; Yang, X.; Gao, X.; Hong, W.; Fu, K.; Sun, X. A Densely connected end-to-end neural network for multiscale and Multiscene SAR ship detection. IEEE Access 2018, 6, 20881–20892. [Google Scholar] [CrossRef]
- Fawcett, T. An Introduction to ROC analysis. Pattern Recogn. Lett. 2006, 27, 861–874. [Google Scholar] [CrossRef]
- Wei, S.; Zeng, X.; Qu, Q.; Wang, M.; Su, H.; Shi, J. HRSID: A High-Resolution SAR Images Dataset for Ship Detection and Instance Segmentation. IEEE Access 2020, 8, 120234–120254. [Google Scholar] [CrossRef]
Disclaimer/Publisher’s Note: The statements, opinions and data contained in all publications are solely those of the individual author(s) and contributor(s) and not of MDPI and/or the editor(s). MDPI and/or the editor(s) disclaim responsibility for any injury to people or property resulting from any ideas, methods, instructions or products referred to in the content. |
© 2024 by the authors. Licensee MDPI, Basel, Switzerland. This article is an open access article distributed under the terms and conditions of the Creative Commons Attribution (CC BY) license (https://creativecommons.org/licenses/by/4.0/).
