Article

Validation of ERA5 Boundary Layer Meteorological Variables by Remote-Sensing Measurements in the Southeast China Mountains

1
Key Laboratory of Atmospheric Environment and Extreme Meteorology, State Key Laboratory of Atmospheric Boundary Layer Physics and Atmospheric Chemistry, Institute of Atmospheric Physics, Chinese Academy of Sciences, Beijing 100029, China
2
College of Resource and Environment, Northeast Agricultural University, Harbin 150030, China
3
University of Chinese Academy of Sciences, Beijing 100049, China
*
Author to whom correspondence should be addressed.
These authors contributed equally to this work.
Remote Sens. 2024, 16(3), 548; https://doi.org/10.3390/rs16030548
Submission received: 28 November 2023 / Revised: 10 January 2024 / Accepted: 28 January 2024 / Published: 31 January 2024
(This article belongs to the Section Atmospheric Remote Sensing)

Abstract

:
Mountainous terrains are typical over southeast China, with complex and diverse topography, large terrain undulations, rich geographic features, and meteorological variations. Previous studies show that ERA5 meteorological variables are generally accurate with respect to large plains or urban agglomerations, while their applicability to mountainous areas remains inconclusive. In this paper, using high-precision measurements probed by ground-based remote sensing instruments in May–July 2023 at a typical mountainous Shanghuang site in southeast China, the vertical accuracy of the ERA5 reanalysis datasets were comparatively evaluated. Our findings depict that the horizontal wind speeds of the ERA5 reanalysis data show a good performance compared to the Doppler lidar observations. In quantitative terms, ERA5 horizontal wind speeds are about 8% higher than the observed values below a height of 400 m, while above 400 m, an increasing negative bias is observed along as altitude increases. Differing from the horizontal wind speeds, there is a large discrepancy in the vertical wind speeds between the ERA5 and the observations, with a deviation of −150% to 40%. In terms of the thermal variables, the temperature extracted from ERA5 are consistent with the measurements in the low troposphere. Nevertheless, large systematic errors occur at 2000–3000 m, and the overall presentation shows that the errors gradually increase with the increase in altitude. Concerning the relative humidity, the general trend in ERA5 is similar to that observed by the microwave radiometer, but the relative errors from 500 to 2500 m range from 40% to 100%. This study also reveals that ERA5 is poorly representative and requires further improvements during extreme weather events such as rainstorms and typhoons. In particular, the horizontal wind speeds at the middle and lower levels deviate strongly from the observations. Given the importance of atmospheric thermodynamic stratifications in terms of both environmental and climatic issues, the results expand the application of the ERA5 reanalysis datasets in the mountainous areas of southeast China. More importantly, it provides credible reference data for the meteorological predictions and climate modelings in the southeast China mountainous region.

1. Introduction

The mountains exemplify the distinctive geography of southeast China, characterized by intricate and diverse topography, substantial elevations, and a rich array of geographical features and meteorological variations. It encompasses the middle and lower reaches of the Yangtze River in China as well as the surrounding mountainous and hilly areas. The different heights and slopes of the mountainous terrains also contribute to the diverse climatic variations, with substantial differences in meteorological variables among the mountain ranges [1]. In order to gain a deeper understanding of the vertical structure of the atmosphere and the pattern of meteorological changes in the mountainous regions of southeast China, accurate meteorological data are essential.
ERA5 (5th Generation European Reanalysis Datasets) is a global reanalysis dataset developed by the ECWMF [2,3]. Through integrating a wide range of observational data and advanced numerical weather prediction model outputs, ERA5 provides continuous and comprehensive vertical coverage of meteorological variables from 1000 to 1 hPa. It has been employed in multiple fields. Prein et al. (2023) found, through analyzing ERA5 data, that thunderstorm straight line winds are enhanced with climate change [4]. Zhai et al. (2023) assessed the applicability of ERA5 wind and wave products in the South China Sea and found that the bias between the ERA5 and observed significant wave height (SWH) data varied from −0.24 to 0.28 m. The ERA5 data showed a positive SWH bias, which implied a general underestimation at all locations, except those in the Beibu Gulf and central-western SCS, where overestimation was observed [5]. Ombadi et al. (2023) evaluated the global warming levels due to different emission scenarios using the recent (1950–2019) and future projections of ERA5 [6]. Xin et al. (2021) found that ERA5 performs best in both the rainy and dry seasons for the coastal urban and mountainous regions of the Guangdong–Hong Kong–Macao Greater Bay Area, China. ERA5 is not sufficient to reproduce precipitation in highly urbanized areas, and the model obtained for ERA5 precipitation on the monthly scale agrees well with the actual model, with a spatial correlation coefficient of more than 0.75, while it falls below 0.5 on the daily and hourly scales [7]. ERA5 is able to support the predictions of global warming levels over China without affecting the diel cycle [6]. The ERA5 datasets has high spatial and hourly temporal resolutions, and although the spatial resolution of the ERA5 data is relatively high, the spatial distribution of the data may not be well enough in some regions, especially in mountainous plateaus and coastal areas with complex topography [8,9,10]. This may lead to certain errors and biases in meteorological and climatic characteristics in these regions.
There have been many assessments of the applicability of ERA5 reanalysis data [11,12]. Meng et al. (2018) conducted a preliminary assessment of the applicability of the ERA5 reanalysis data by using the surface and elevated data from 10 stations in Shandong province and the surrounding areas. The mean absolute deviation of the temperature field below 300 hPa ranged between 0.4 and 0.6 K, and gradually increased above 300 hPa, as did the relative humidity [13]. Zhi et al. (2013) investigated the applicability of the high-altitude temperature field in various reanalysis data in China by combining with the sounding data and found that ERA5 high-altitude temperature data are better described in the upper troposphere in the northern part of China [14]. Jiang et al. (2019) evaluated the ERA5 reanalysis precipitable water vapor datasets based on Central Asian radiosonde observation pairs [15]. They suggest that ERA5 can be used to understand the interannual variations of PWV in central Asia. Binder’s study not only provides important observational insights and highlights the ability of ERA5 to fundamentally capture the observed patterns, but it also reveals many small- and meso-scale structures that are not captured by the remote-sensing instruments [16]. Despite its wide applications, the applicability of ERA5 datasets over mountainous areas requires further exploration because the spatial resolution may not be fine enough to capture all the complex physical processes and atmospheric motions induced by the rolling topography at the kilometer scale [8,9,10], especially for the mountainous areas in southeast China, a place appearing with frequent and specific meteorological phenomena, such as uplift effects and the local circulation forced by the complex terrains [17].
Given the importance of atmospheric thermodynamic stratifications in both environmental and climatic research [18,19,20], we adopted the high-precision Doppler wind lidar and microwave radiometer, which has been widely applied in various terrains [17,21,22] and has achieved important results [23], to measure the thermodynamic profiles over a typical mountain site in the Wuyi mountains in southeast China to assess the vertical accuracy of the ERA5 reanalysis datasets in this area. The results provide an in-depth understanding of the vertical meteorological characteristics of the mountainous meteorology. It is also of great significance for giving important reference data for meteorological predictions and climate modeling in the southeast China mountainous region.

2. Methodology

2.1. Observation Site and Instruments

The geographic location of the site, the Shanghuang Observatory of Atmospheric Boundary Layer Top Ecology of the Chinese Academy of Sciences (119.51°E, 28.58°N, 1113 m A.S.L.), is shown in Figure 1a. This site is surrounded by rich vegetation resources (Figure 1b) and is situated in forested areas. The high-precision ground-based remote-sensing instruments used in the study include the Windcube 100S Doppler wind lidar and RPG-HATPRO-G5 microwave radiometer (Figure 1c,d).

2.2. Windcube 100S Doppler Wind Lidar

The mountainous wind field was observed by the Windcube 100S Doppler wind lidar. This type of instrumentation uses the laser light signals back-scattered by aerosols to provide accurate and reliable results, including the horizontal wind (u, v), vertical wind (w), signal-to-noise ratio, mean radial wind speed, and raw spectral data [22,24,25]. Windcube 100S commonly adopts the carrier-to-noise ratio (CNR) for data quality control [26,27], in which the CNR data smaller than a criteria of −30 dBZ were discarded, and those greater than −30 dBZ were credible. Windcube 100S emits laser pulse signals into the atmosphere by collecting the backward echo signals scattered by moving particles and uses a specific signal processing algorithm to determine the Doppler shift of the backward-scattered signals, which is analyzed to compute the radial wind speeds and directions along the measurement path. The temporal resolution is 5 s. The unmeasurable area of this lidar is from the ground to a 50 m height, and due to the attenuation of the detection signal, the maximum detection distance is theoretically 3 km. For the details of Windcube 100S Doppler wind lidar, please refer to www.leosphere.com (accessed on 7 January 2024). In this paper, we averaged the wind data into hourly scale for ease of comparison.

2.3. RPG-HATPRO-G5 Microwave Radiometer

The RPG-HATPRO-G5 microwave radiometer (hereafter referred to as MWR) is capable of performing the real-time and continuous monitoring of tropospheric thermodynamic structures across a vertical range of 0–10 km. The products contain the temperature, the absolute humidity, the relative humidity, the total water vapor content, the liquid water path, the liquid water contours, the cloud base height, the atmospheric stability index, and the surface meteorological variables [10,22,23]. The study by Löhnert and Maier (2012) shows that the differences between MWR observations and radiosondes are small and suitable for boundary layer observations [28]. This MWR operated a continuous observation with a temporal resolution of 1 s and provided a temperature and humidity profile data from the ground to a height of 10 km at a 10–30 m resolution up to 0.5 km, a 40–70 m resolution from 0.5 to 2.5 km, and a 100–200 m resolution from 2 to 10 km. For the details of MWR, please refer to http://www.radiometer-physics.de (accessed on 7 January 2024).

2.4. ERA5 Reanalysis Data

ERA5 is the fifth generation of the ECMWF (European Centre for Medium-Range Weather Forecasts) global reanalysis datasets from 1950 to present. ERA5 offers hourly estimates of a large number of atmospheric, terrestrial, and oceanic climate variables covering the Earth with a 30 × 30 km grid (corresponding to a resolution of 0.25° × 0.25°) and resolving the atmosphere using 137 altitudes from the surface up to 80 km [29]. The last generation, ERA-Interim, does not adequately represent the surface energy balance, the atmospheric boundary layer, the cloud properties, and the sea ice concentration [30], while the replaced ERA-5 was updated accordingly [31,32,33,34]. In this study, the parameters of horizontal wind speed, vertical wind speed, wind direction, temperature, relative humidity, and potential height from the ERA5 hourly data on pressure levels were selected. We interpolated the ERA5 data to the Shanghuang site (i.e., 119.51°E, 28.58°N) using bi-linear interpolation, and then obtained the values of each meteorological element by the cubic spline interpolation at the height corresponding to the observatory. The ERA5 reanalysis datasets can be downloaded from https://cds.climate.copernicus.eu/cdsapp#!/home (accessed on 27 December 2023).

3. Results

3.1. Comparative Analysis of Horizontal Wind Speed Profiles from 50 to 1500 m

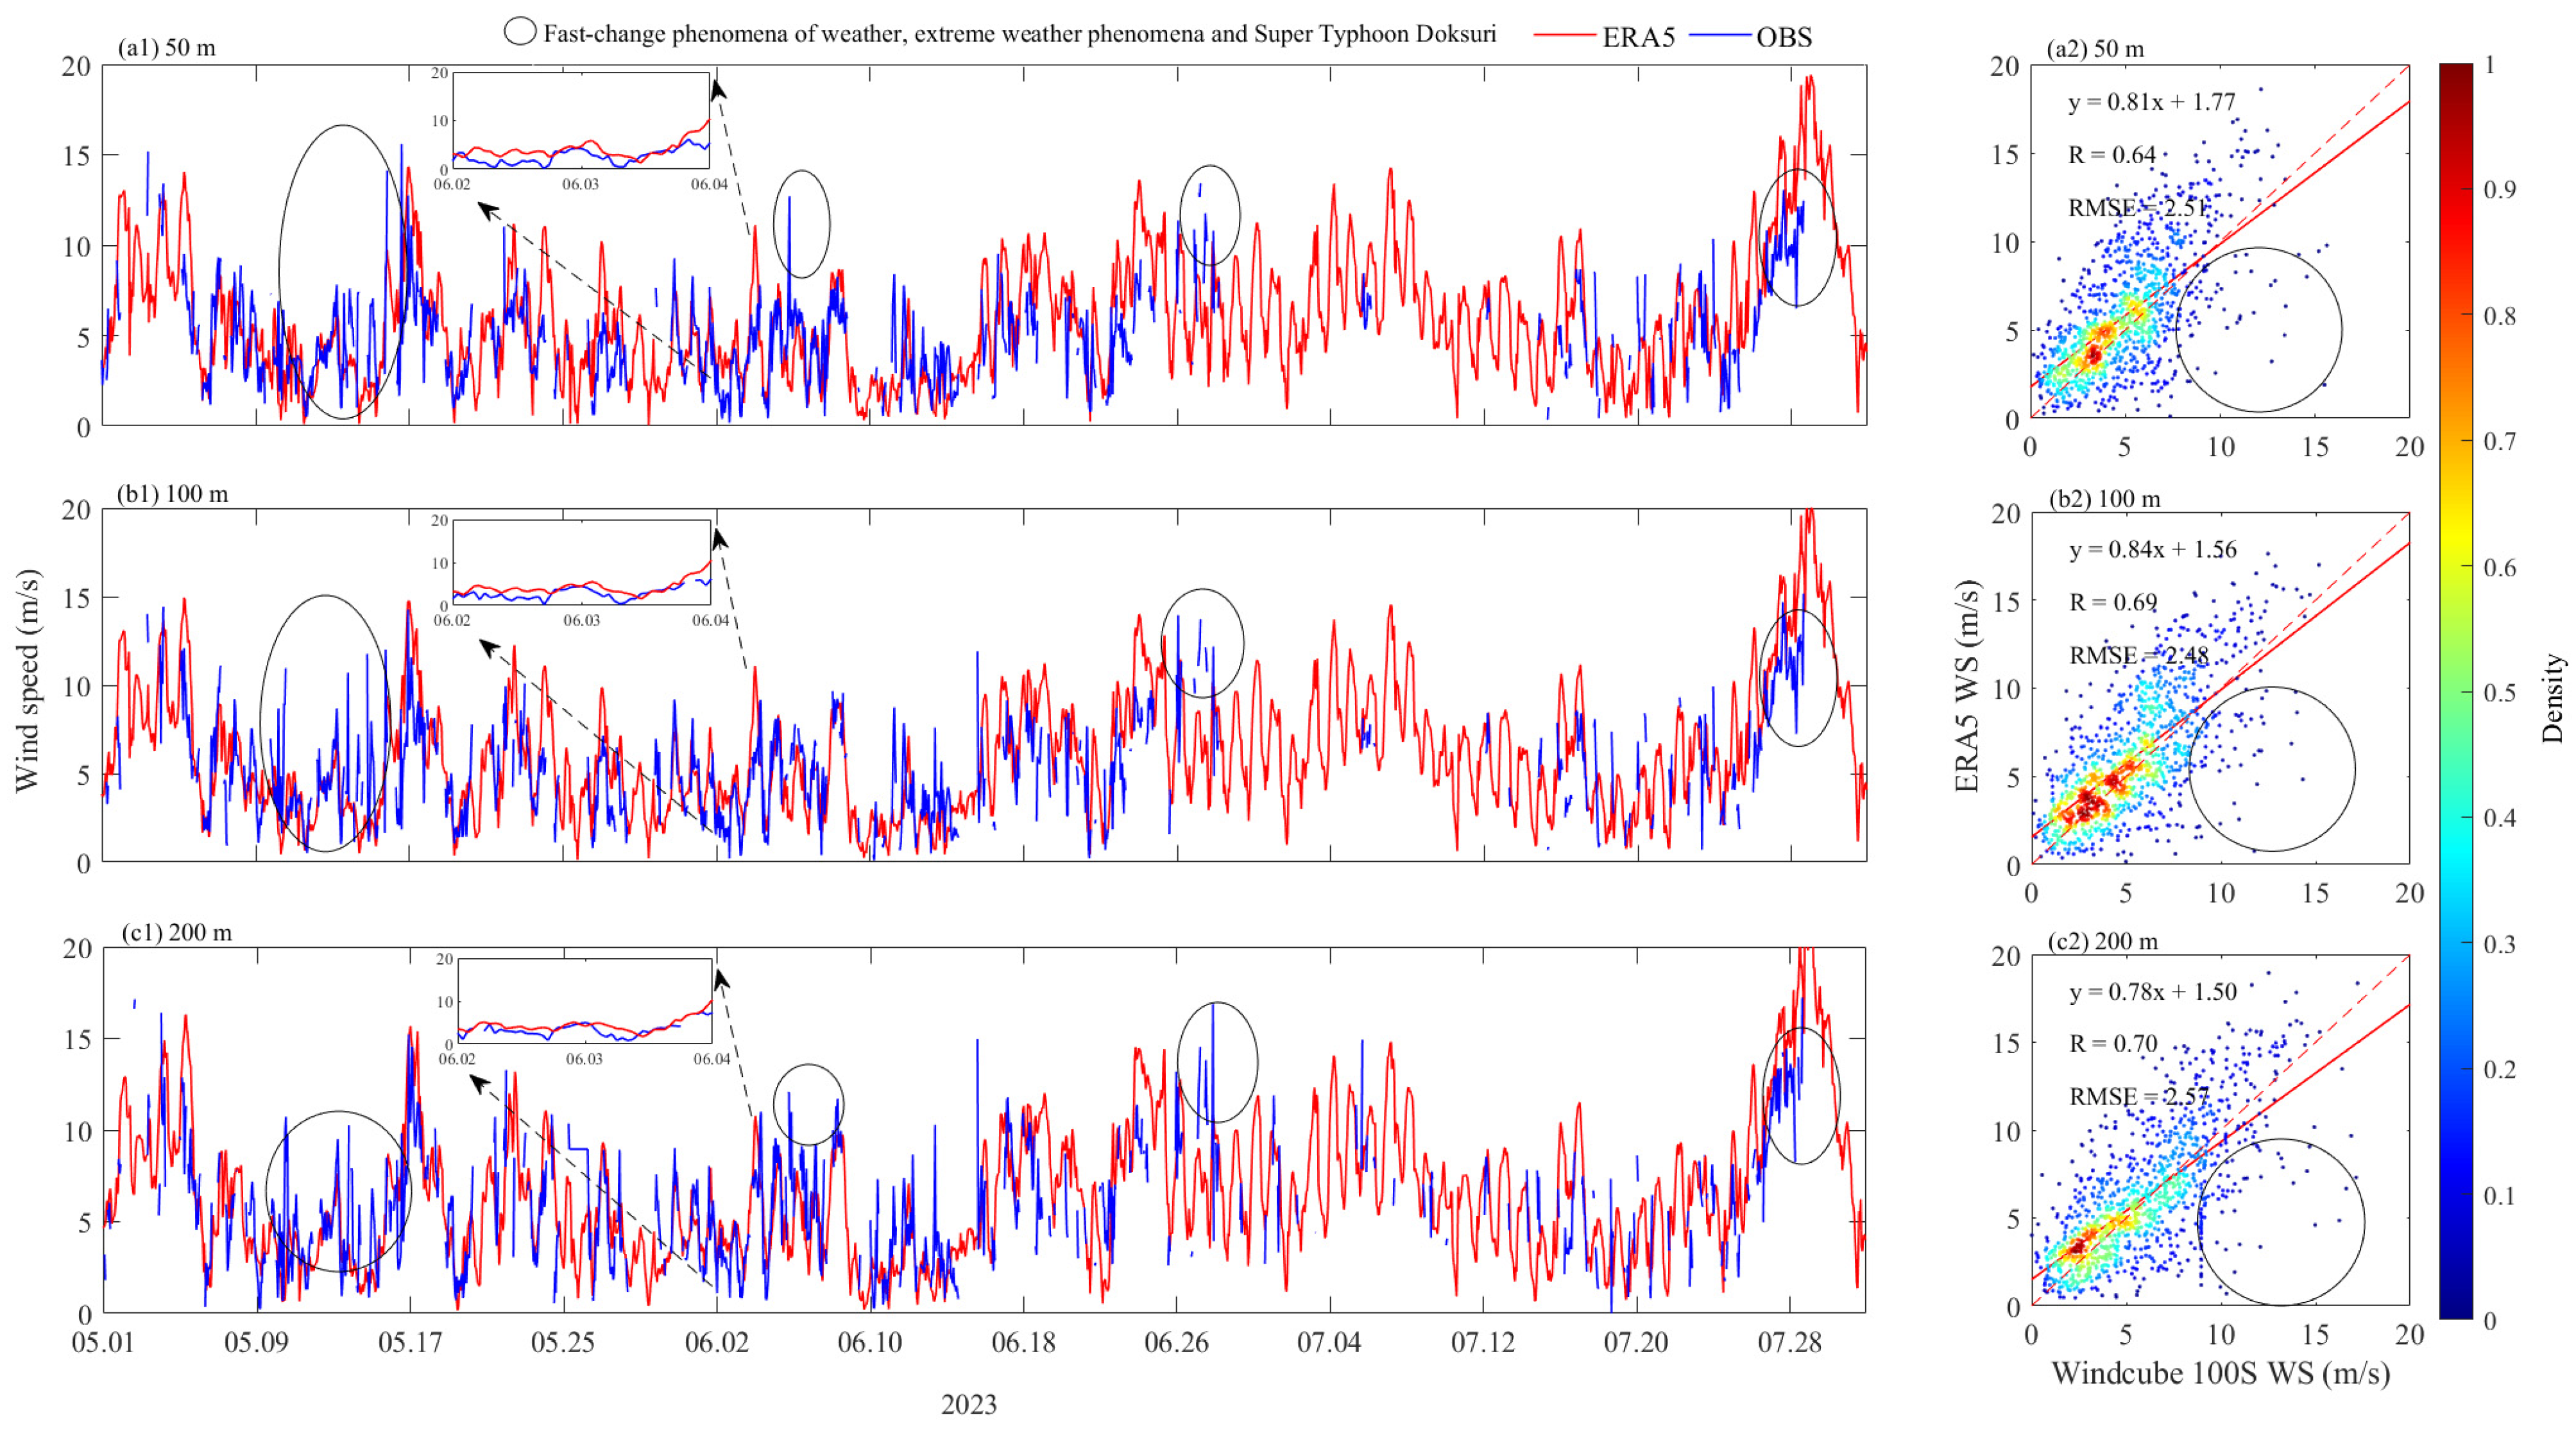
Figure 2 shows the applicability of ERA5 horizontal wind speeds at various heights. Specifically, the horizontal wind speed of the ERA5 reanalysis datasets at a height of 50 m corresponds well to the observed value (Figure 2(a1)), but there remains a certain error, with a root mean square error (RMSE) of 2.51 m/s. The effect of local circulation possibly contributes to this phenomenon. The complex flow field at the top of the mountain changes from time to time. Therefore, it is not easy for the ERA5 to capture the phenomenon of an abrupt change of the wind speed very well. At the observation site, the terrain is complex, and there are a number of circulation currents that affect the local horizontal wind speeds. The site is surrounded by mountains, and there is a noticeable valley wind at the observation point. In terms of the specific weather events, significant deviations in the ERA5 reanalysis data occur; for example, during the stormy weather on 21 June, the behaviour of the horizontal wind of ERA5 data is relatively low. Another extreme weather event is the typhoon on 28 July, and the ERA5 values are much higher than the observed values. It is also interesting to find that, due to the topography of the mountain, the occurrences of valley winds make the observed horizontal wind speeds higher than the ERA5 values. The horizontal wind speeds at 100 m are compared in Figure 2(b1). The observed winds are stronger than the ERA5 values due to the rapid changes in 13–14 May. On 25 May, there was light rain in the vicinity of the mountain, and a drizzle in the area not far away from the adjacent Wuyi county. The ERA5 reanalysis data could not resolve the weather process within such a small scale. Figure 2(c1) gives the inter-comparison of the 200 m horizontal wind speed, and we find there is convective weather on 8 May, resulting in the underestimate of the ERA5 reanalysis.
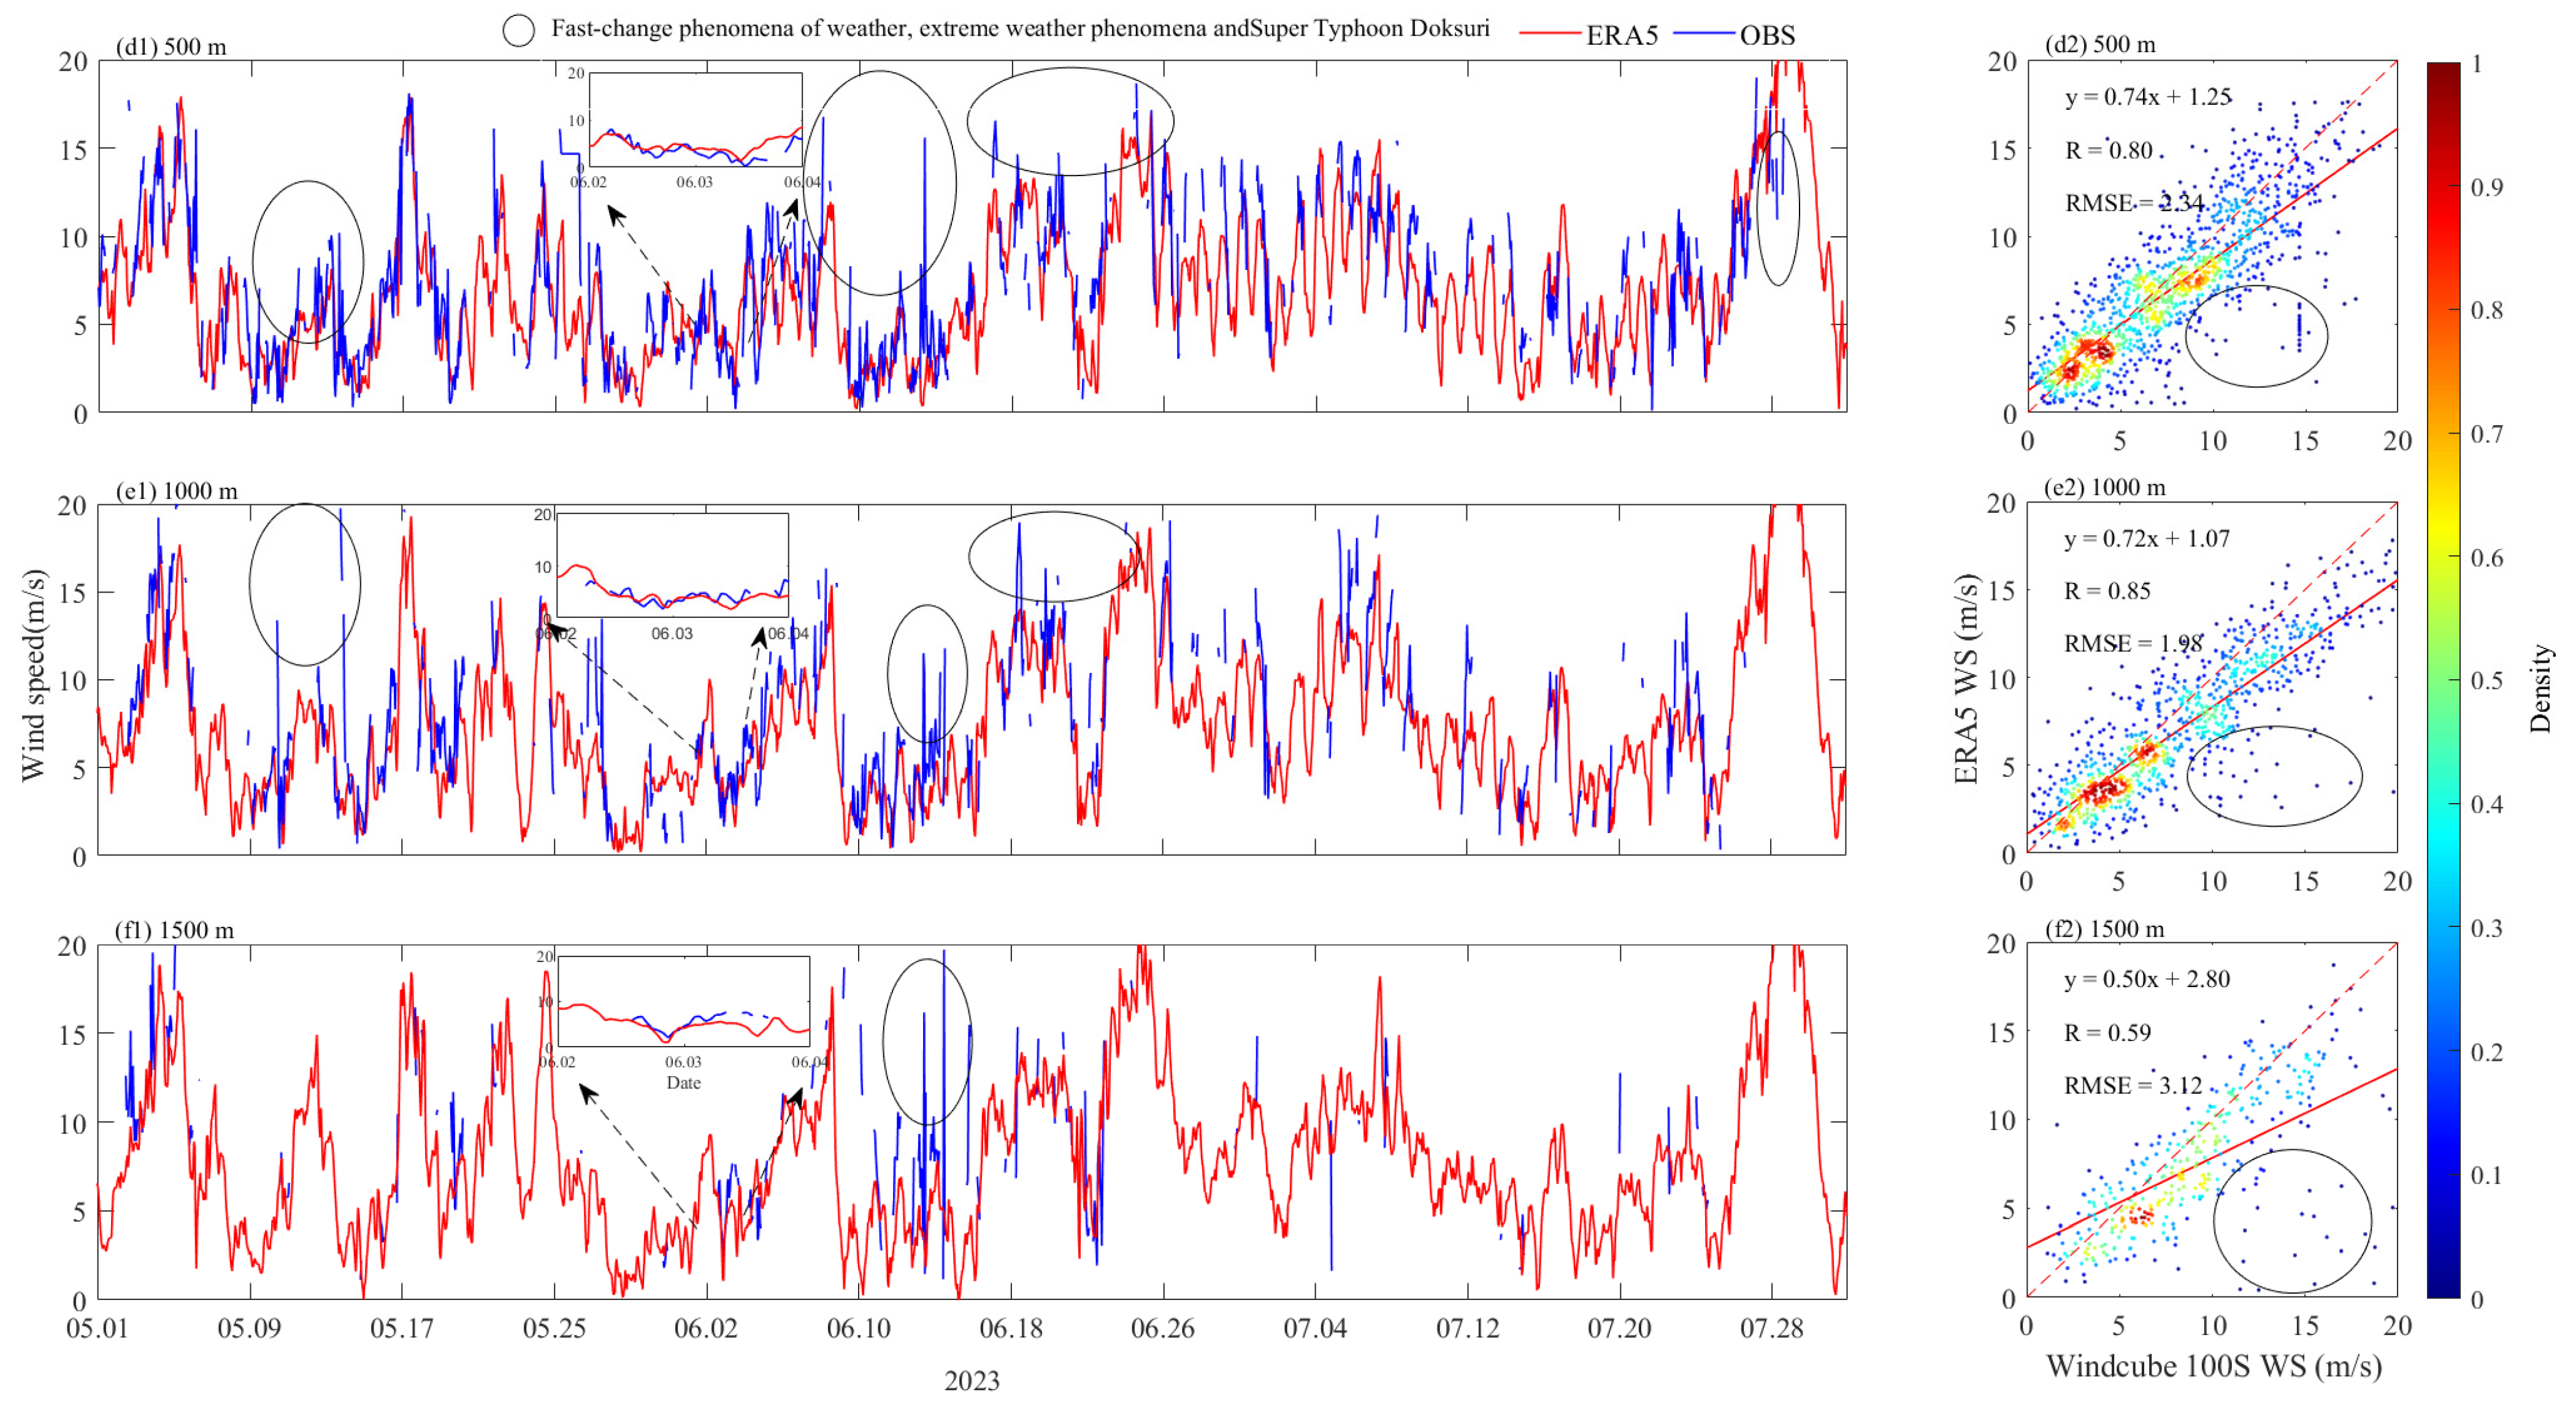
The duration of the observations in this paper was in the rainy season, which is often characterized by strong convective weather. This abnormal weather requires fine resolutions and intensive observations to resolve, which entails a need for further improvement in the ERA5 reanalysis. In particular, a typhoon that was originally forecast to pass through the area from 24 to 30 July travelled in a path adjacent to the site, during which the ERA5 wind speed is higher than the observations. In Figure 2(d1), the agreement between the ERA5 and the measurements is very good at 500 m above the mountain top, but there are still some fast variations in the actual wind speeds that cause some differences. The subplot of Figure 2(e1) shows that the observed horizontal wind speed at 1000 m is higher than the ERA5 reanalysis data, which may be attributed to the systematic errors of the ERA5 reanalysis data. Although the Doppler lidar is undetectable to a height of 1500 m most of the time because of the frequent fogs and clouds (Figure 2(f1)), the available observations obtained show that the horizontal wind speed of ERA5 is basically smaller than the measurements. The deviations can be clearly observed in the fitted curve in Figure 2(f2).

3.2. Comparative Analysis of Vertical Wind Speed Profiles from 50 to 1500 m

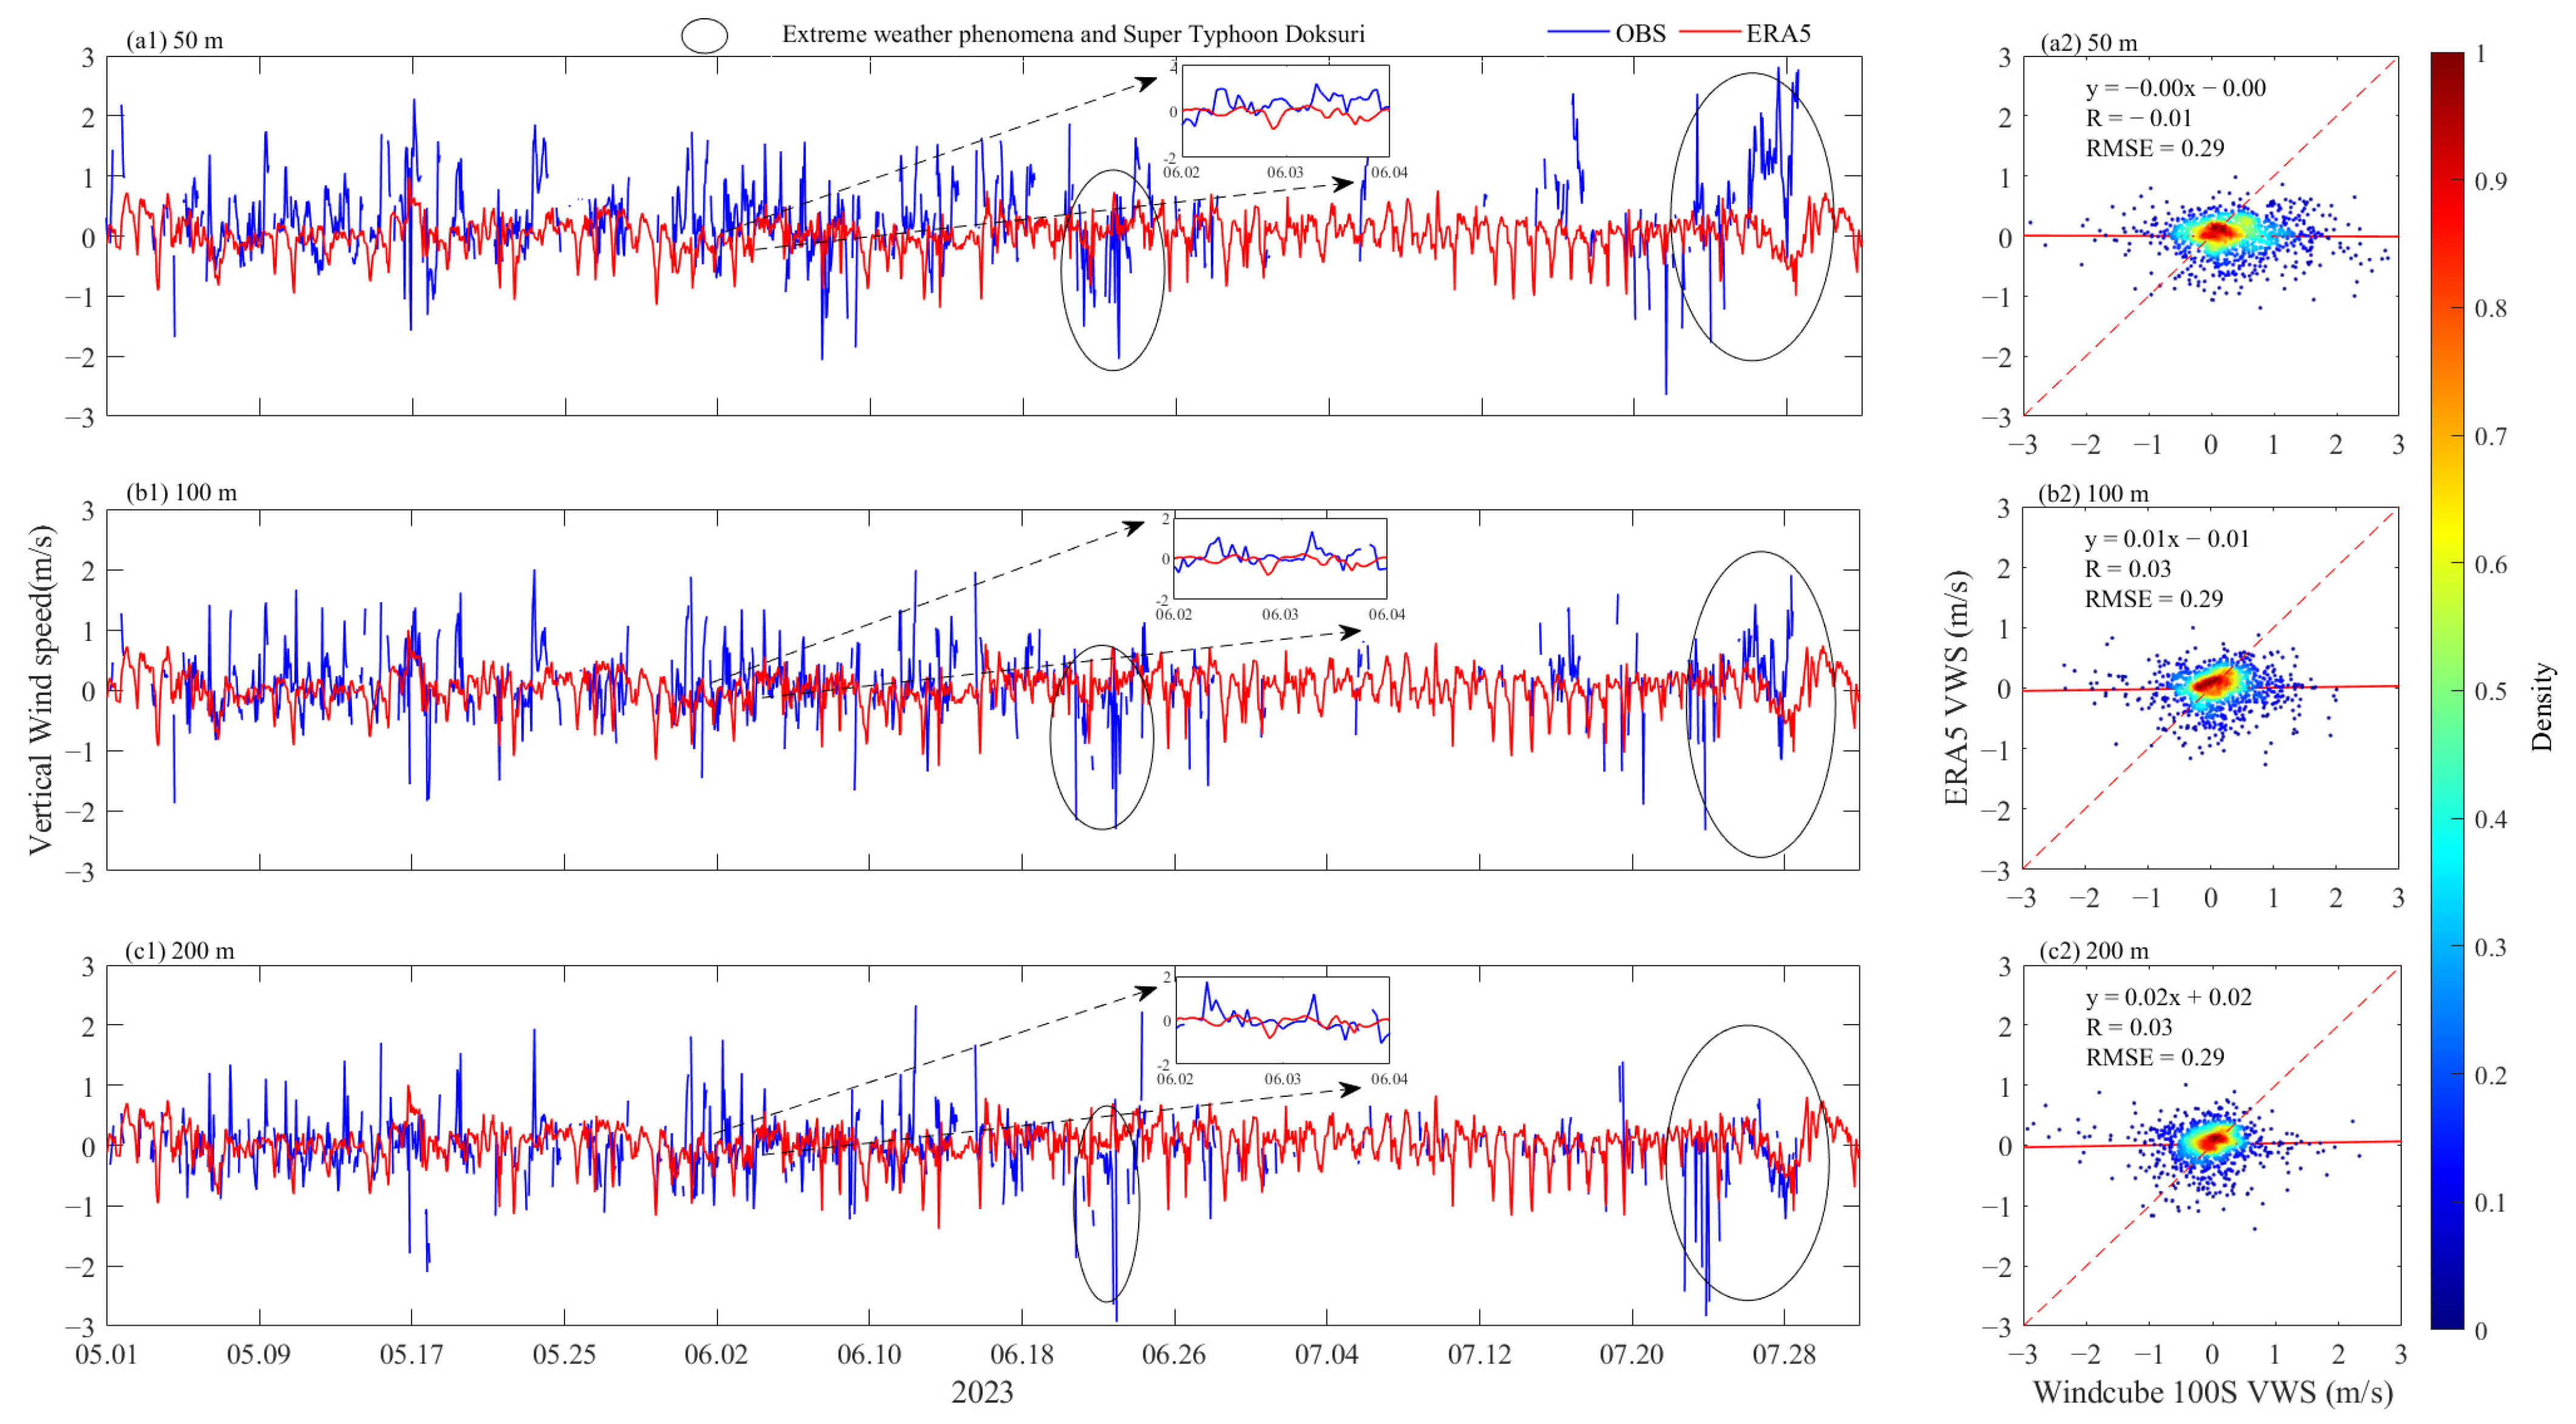
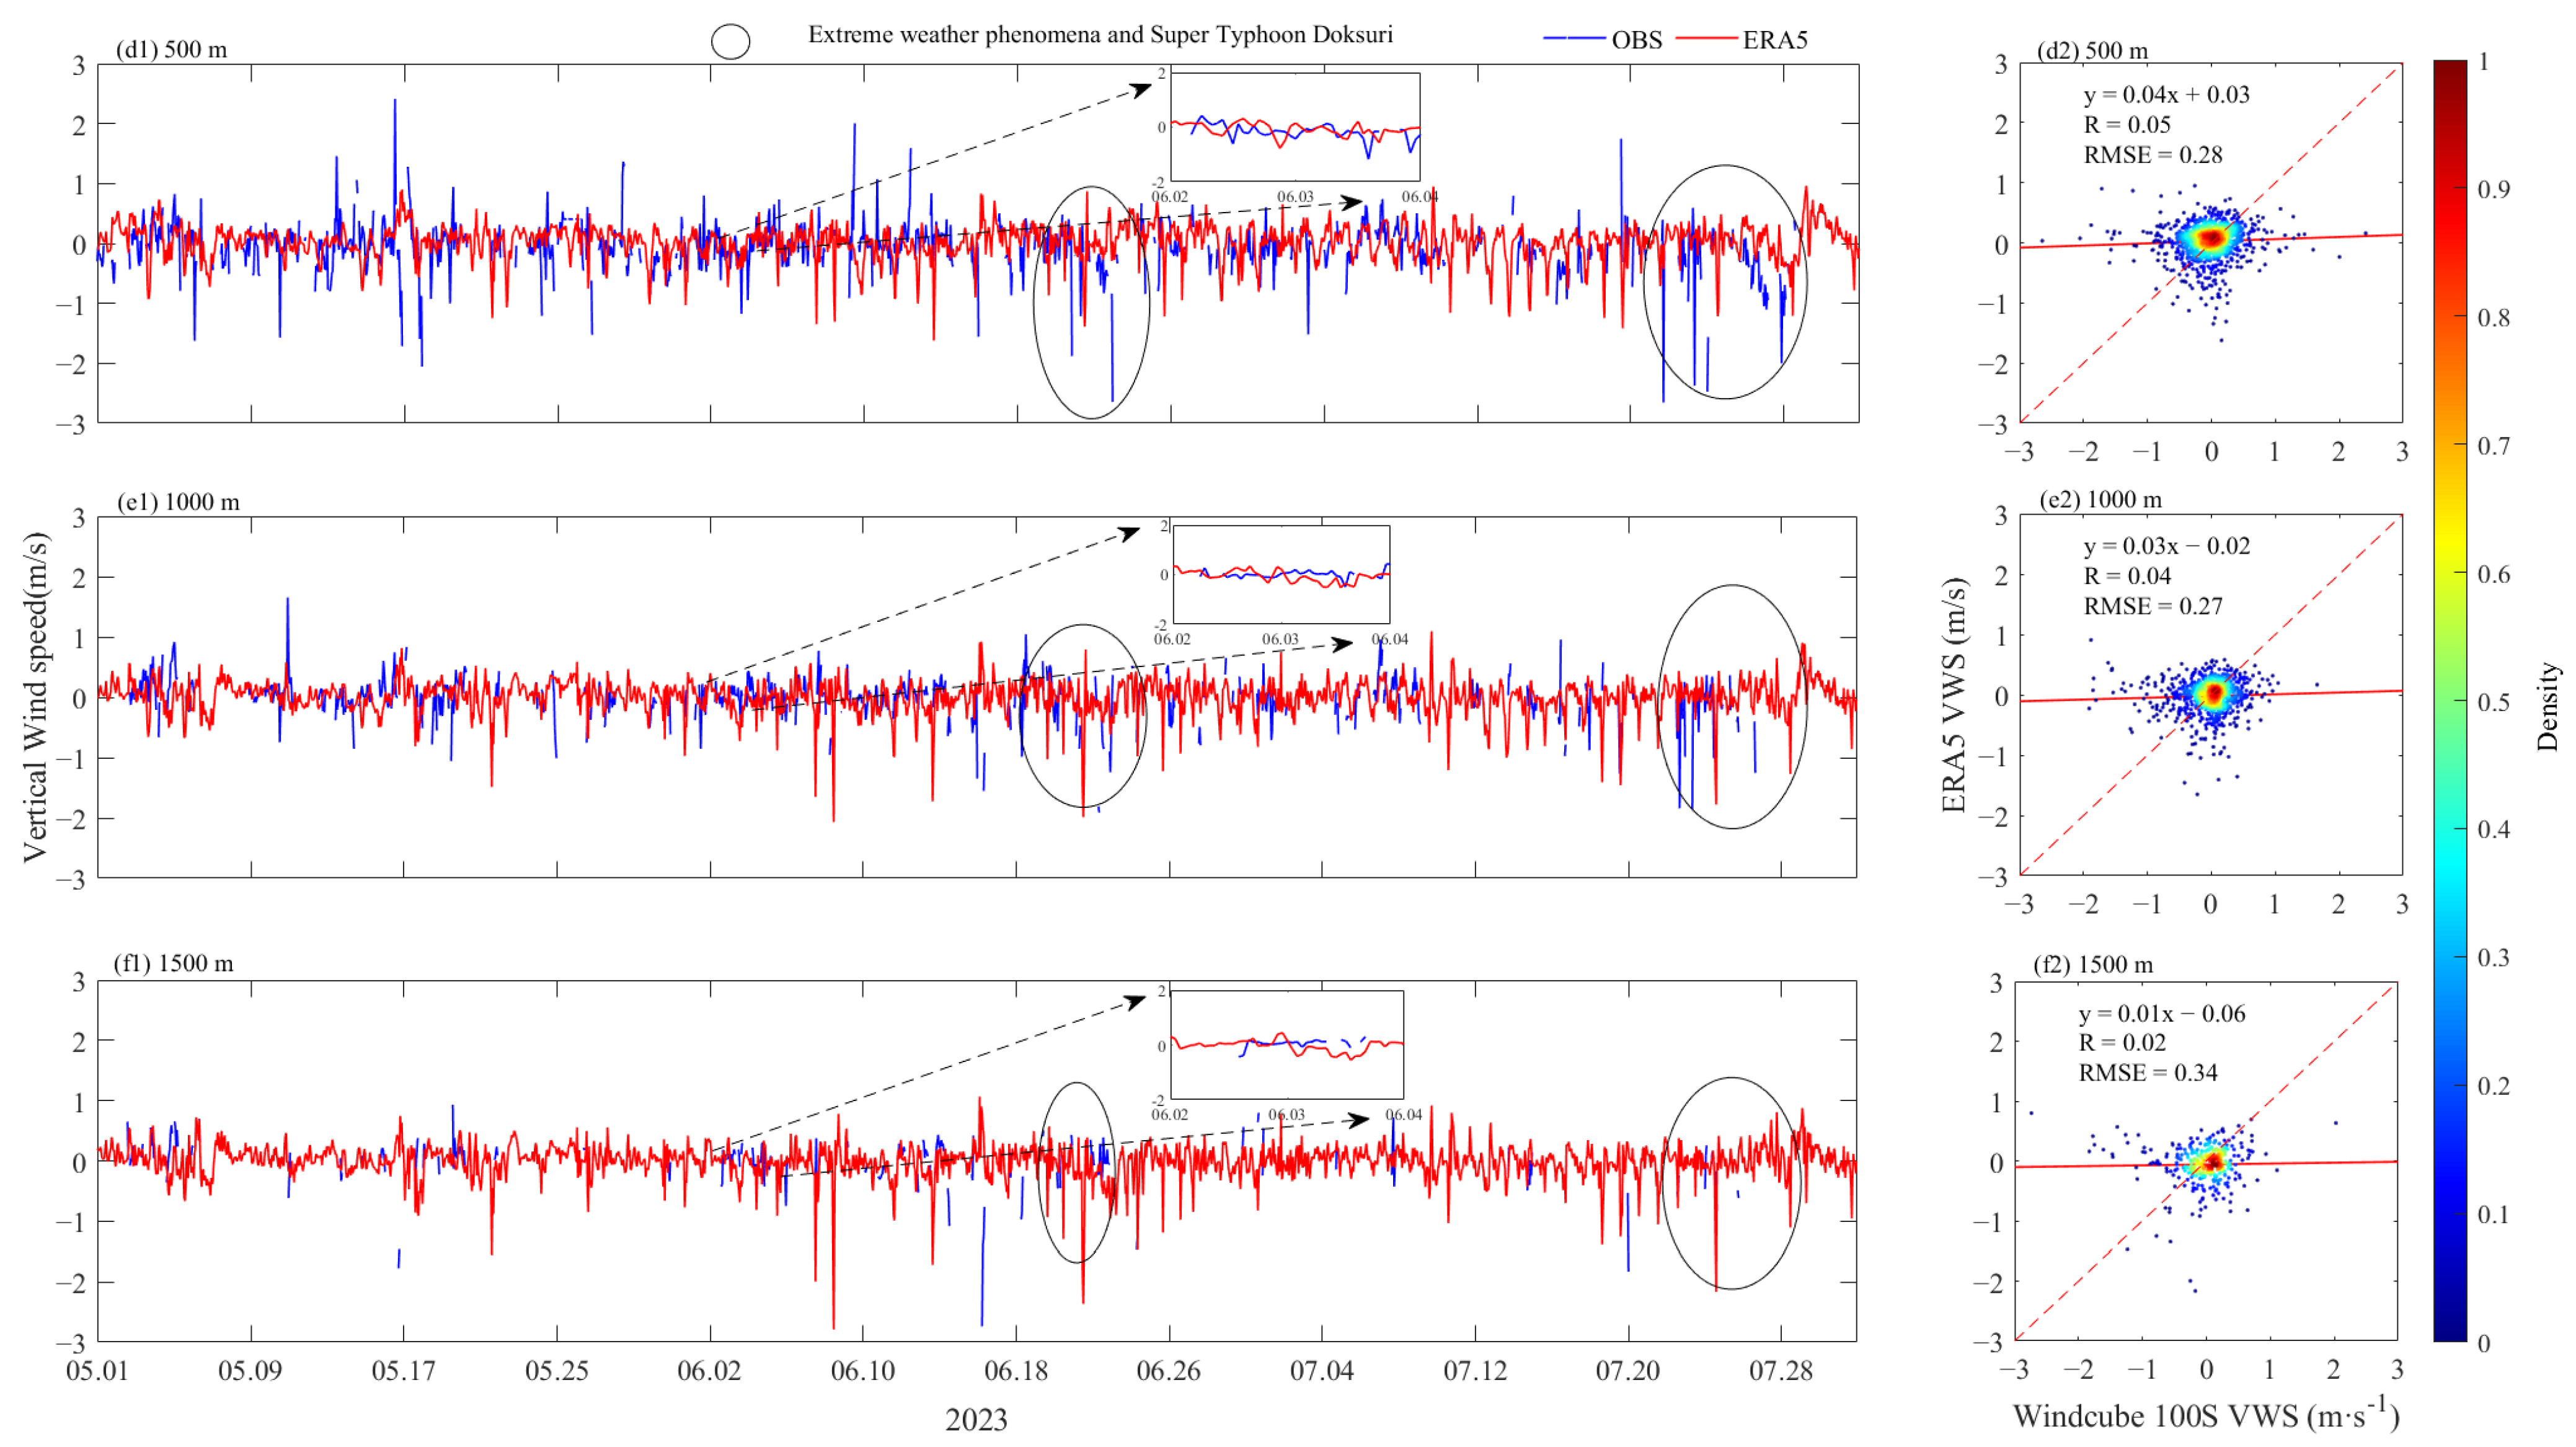
Figure 3 shows the applicability of ERA5 vertical wind speeds at various heights. Figure 3(a1–f1) shows the observed vertical wind speeds at various heights compared with the ERA5 reanalysis data values, and the zoomed-in time series on 2 and 3 June 2023 were selected for comparison. Overall, the vertical wind speeds from the ERA5 reanalysis data differ significantly from the observed vertical wind speeds from the Doppler wind lidar, and they illustrate a poor correlation, as shown in Figure 3(a2–f2). Although the spatial resolution of the ERA5 data is relatively high, it falls short in mountainous areas with complex terrain. Simultaneously, it is crucial to acknowledge the potential presence of data gaps during specific time intervals and in particular geographical regions, especially those characterized by pronounced terrain undulations. These impact factors contribute to the deviations observed between the vertical wind speeds in the ERA5 reanalysis data and the actual observations obtained from mountainous areas in southeast China.
The wind speed at heights between 50 and 200 m is shown in Figure 3(a1–c1). Due to the valley winds, the sudden increase in observed vertical wind occurs from 1 May to 18 June. The Doppler wind lidar is located in the top of the sunrise slope at Shanghuang site, so the valley wind is obvious in the observation. Due to the influence of solar radiation, the air on the slopes of the mountain will increase in temperature during the daytime. However, the air at the same altitude over the valley floor is farther away from the ground, so it receives less radiation than the air near the slopes and increases in temperature to a lesser extent. As a result, the warm air on the slopes of the mountain rises and circulates between the upper slopes and the valleys, the air in the valleys replenishes itself along the slopes to the tops of the mountains, thus forming a thermal circulation between the slopes and the valleys, with the lower wind blowing from the valleys to the slopes. On the contrary, due to the difference in specific heat capacity, the heat in the mountain slopes dissipates faster, and the air becomes cooler compared to the air in the valleys. Cold air on the slope of the mountain will sink down along the slopes because its density is lower than the warm air, and warmer air in the valleys is forced to lift and replenish the air at the tops of the mountains, so they form a circulation. As a result, upward vertical winds occur during the day and downward vertical winds during the night. Moreover, strong convective weather often occurs during the main season in southeast China, especially in May and June. For example, the convective weather caused the deviation between the ERA5 reanalysis data and the observed data on 17–19 May, and the heavy rainfall also caused the deviation of the vertical wind speed on 23–24 June. Due to the Typhoon Doksuri on the 24–31 July, extreme weather conditions such as heavy rain and high winds occurred over a wide area in southeast China, and the vertical wind speeds of the low-level ERA5 showed large errors compared with the observations. Thus, the climate on the mountain tops is unpredictable during the typhoon weather conditions. It is very important to improve the accuracy and resolution of ERA5reanalysis data. The effects of topography and local circulation also need to be taken into account.

3.3. Comparative Analysis of Wind Directions from 50 to 1500 m

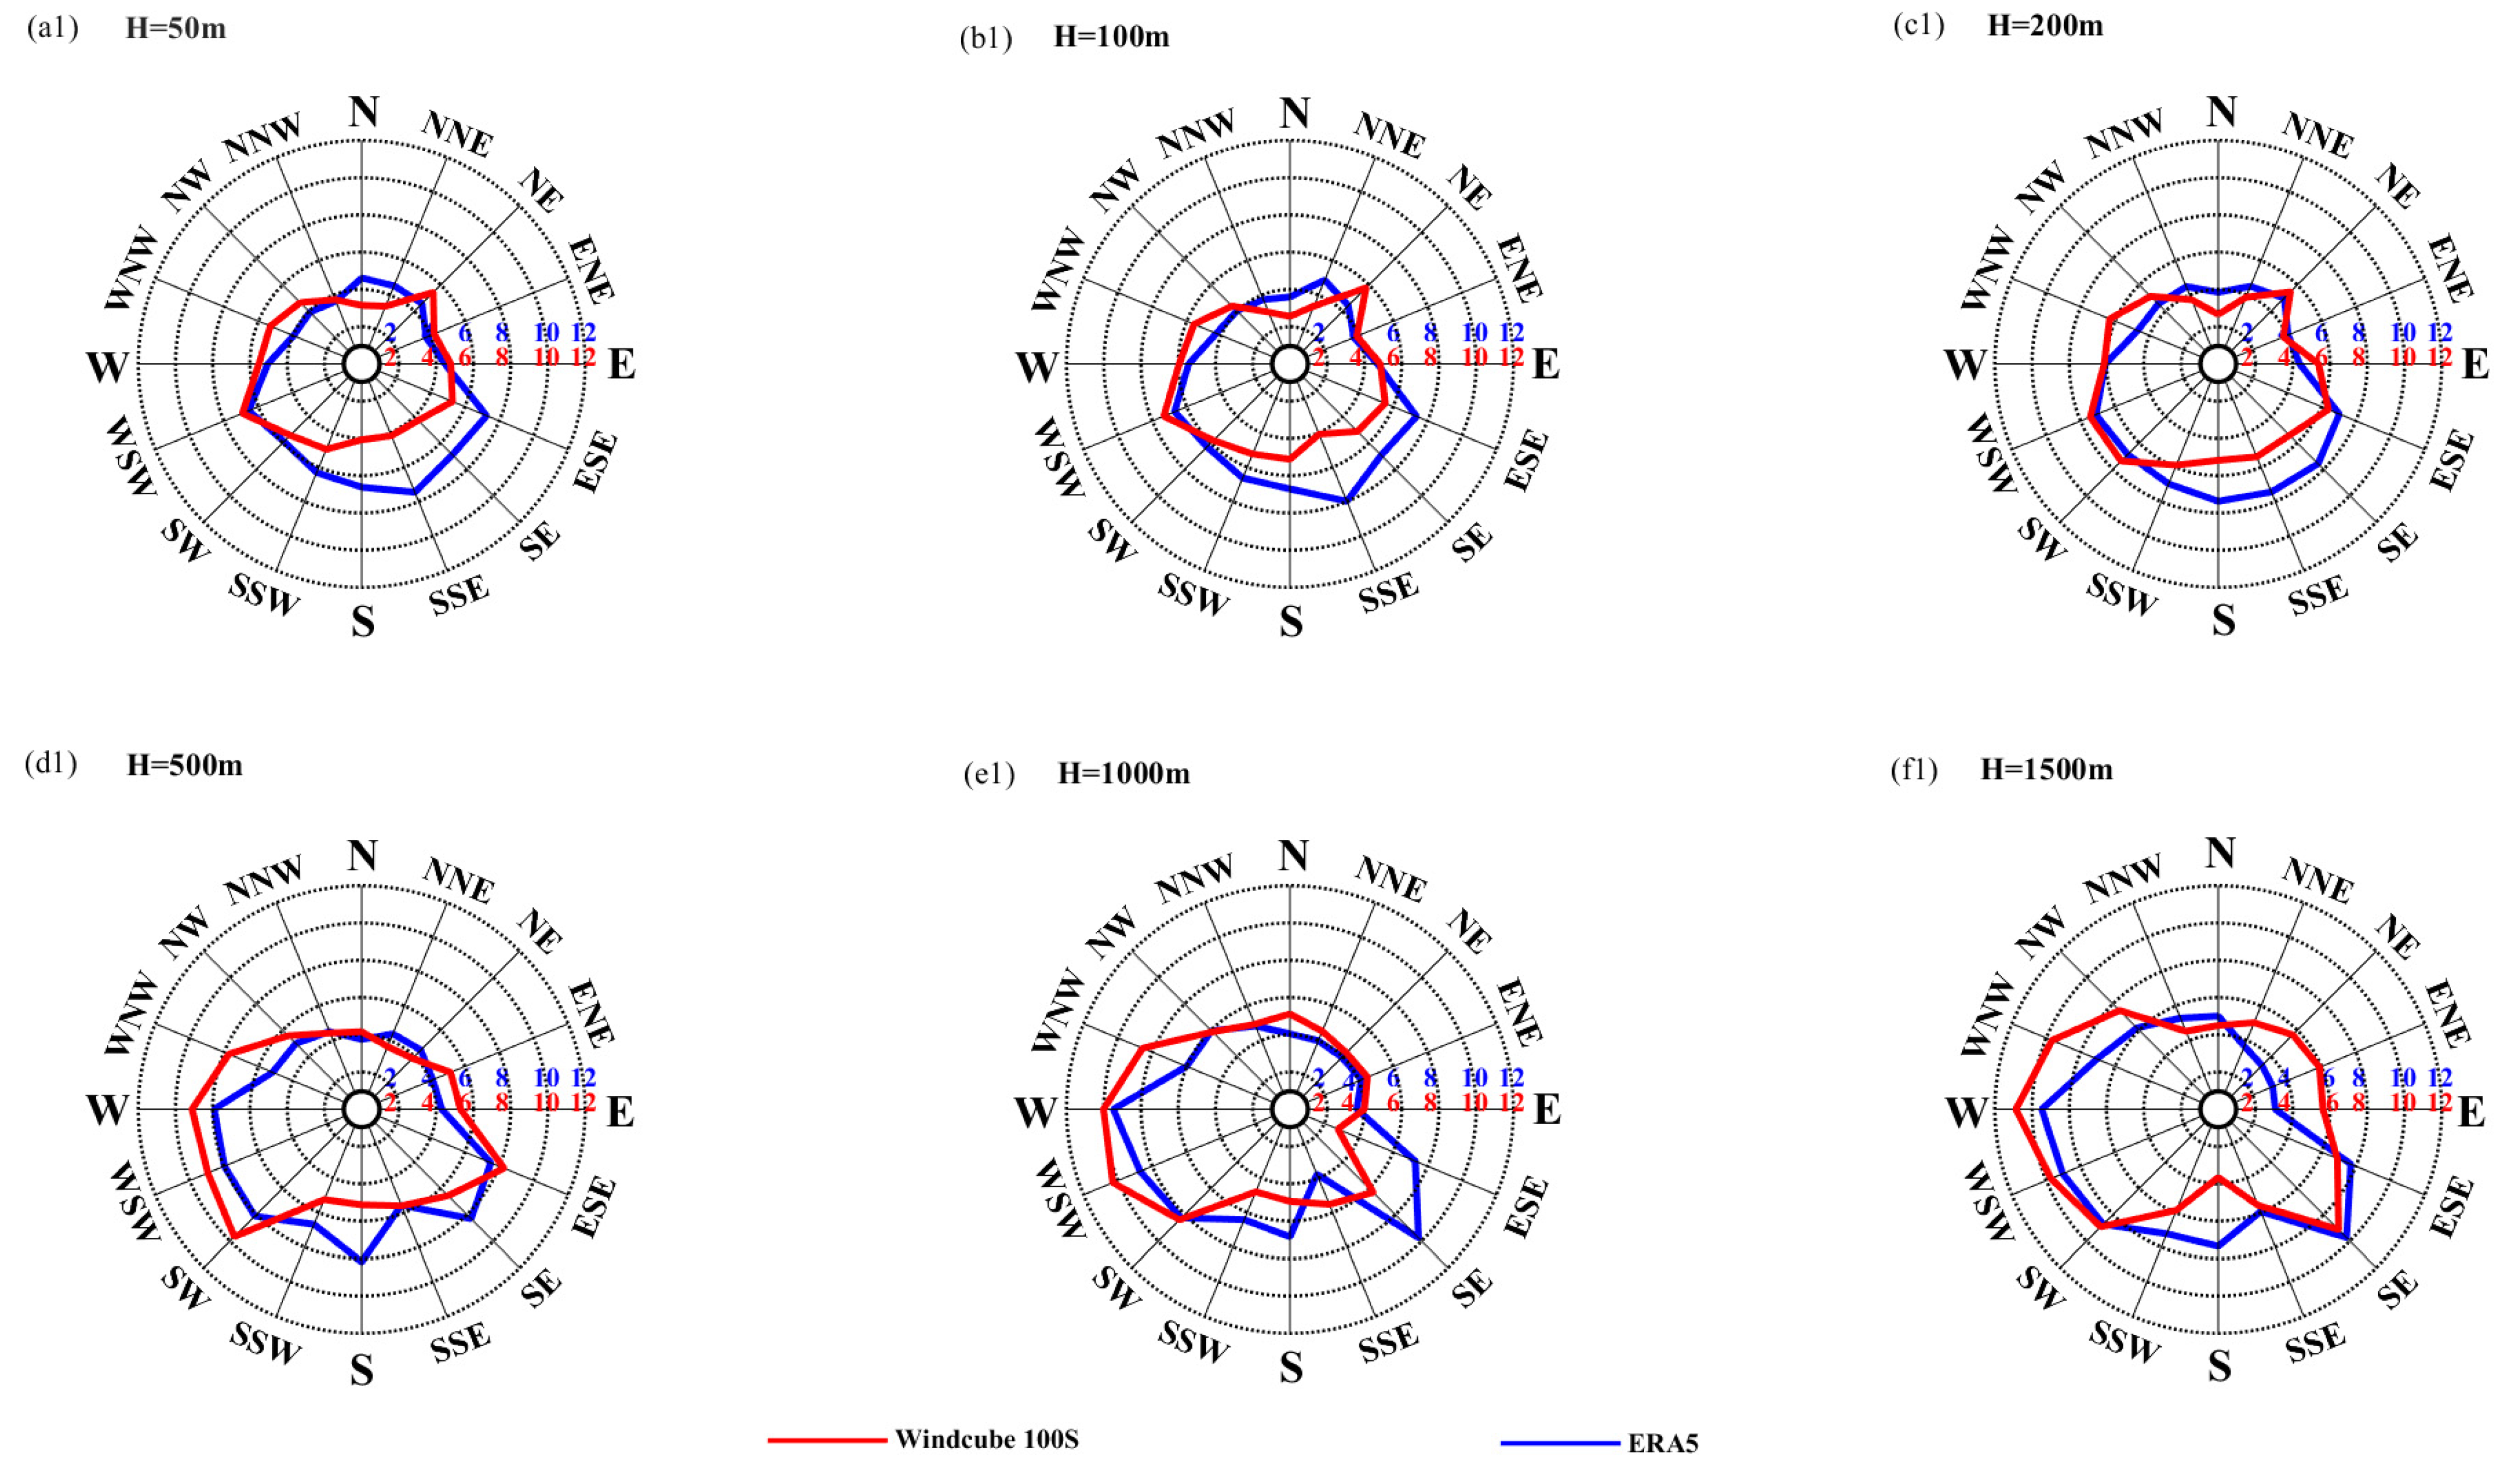
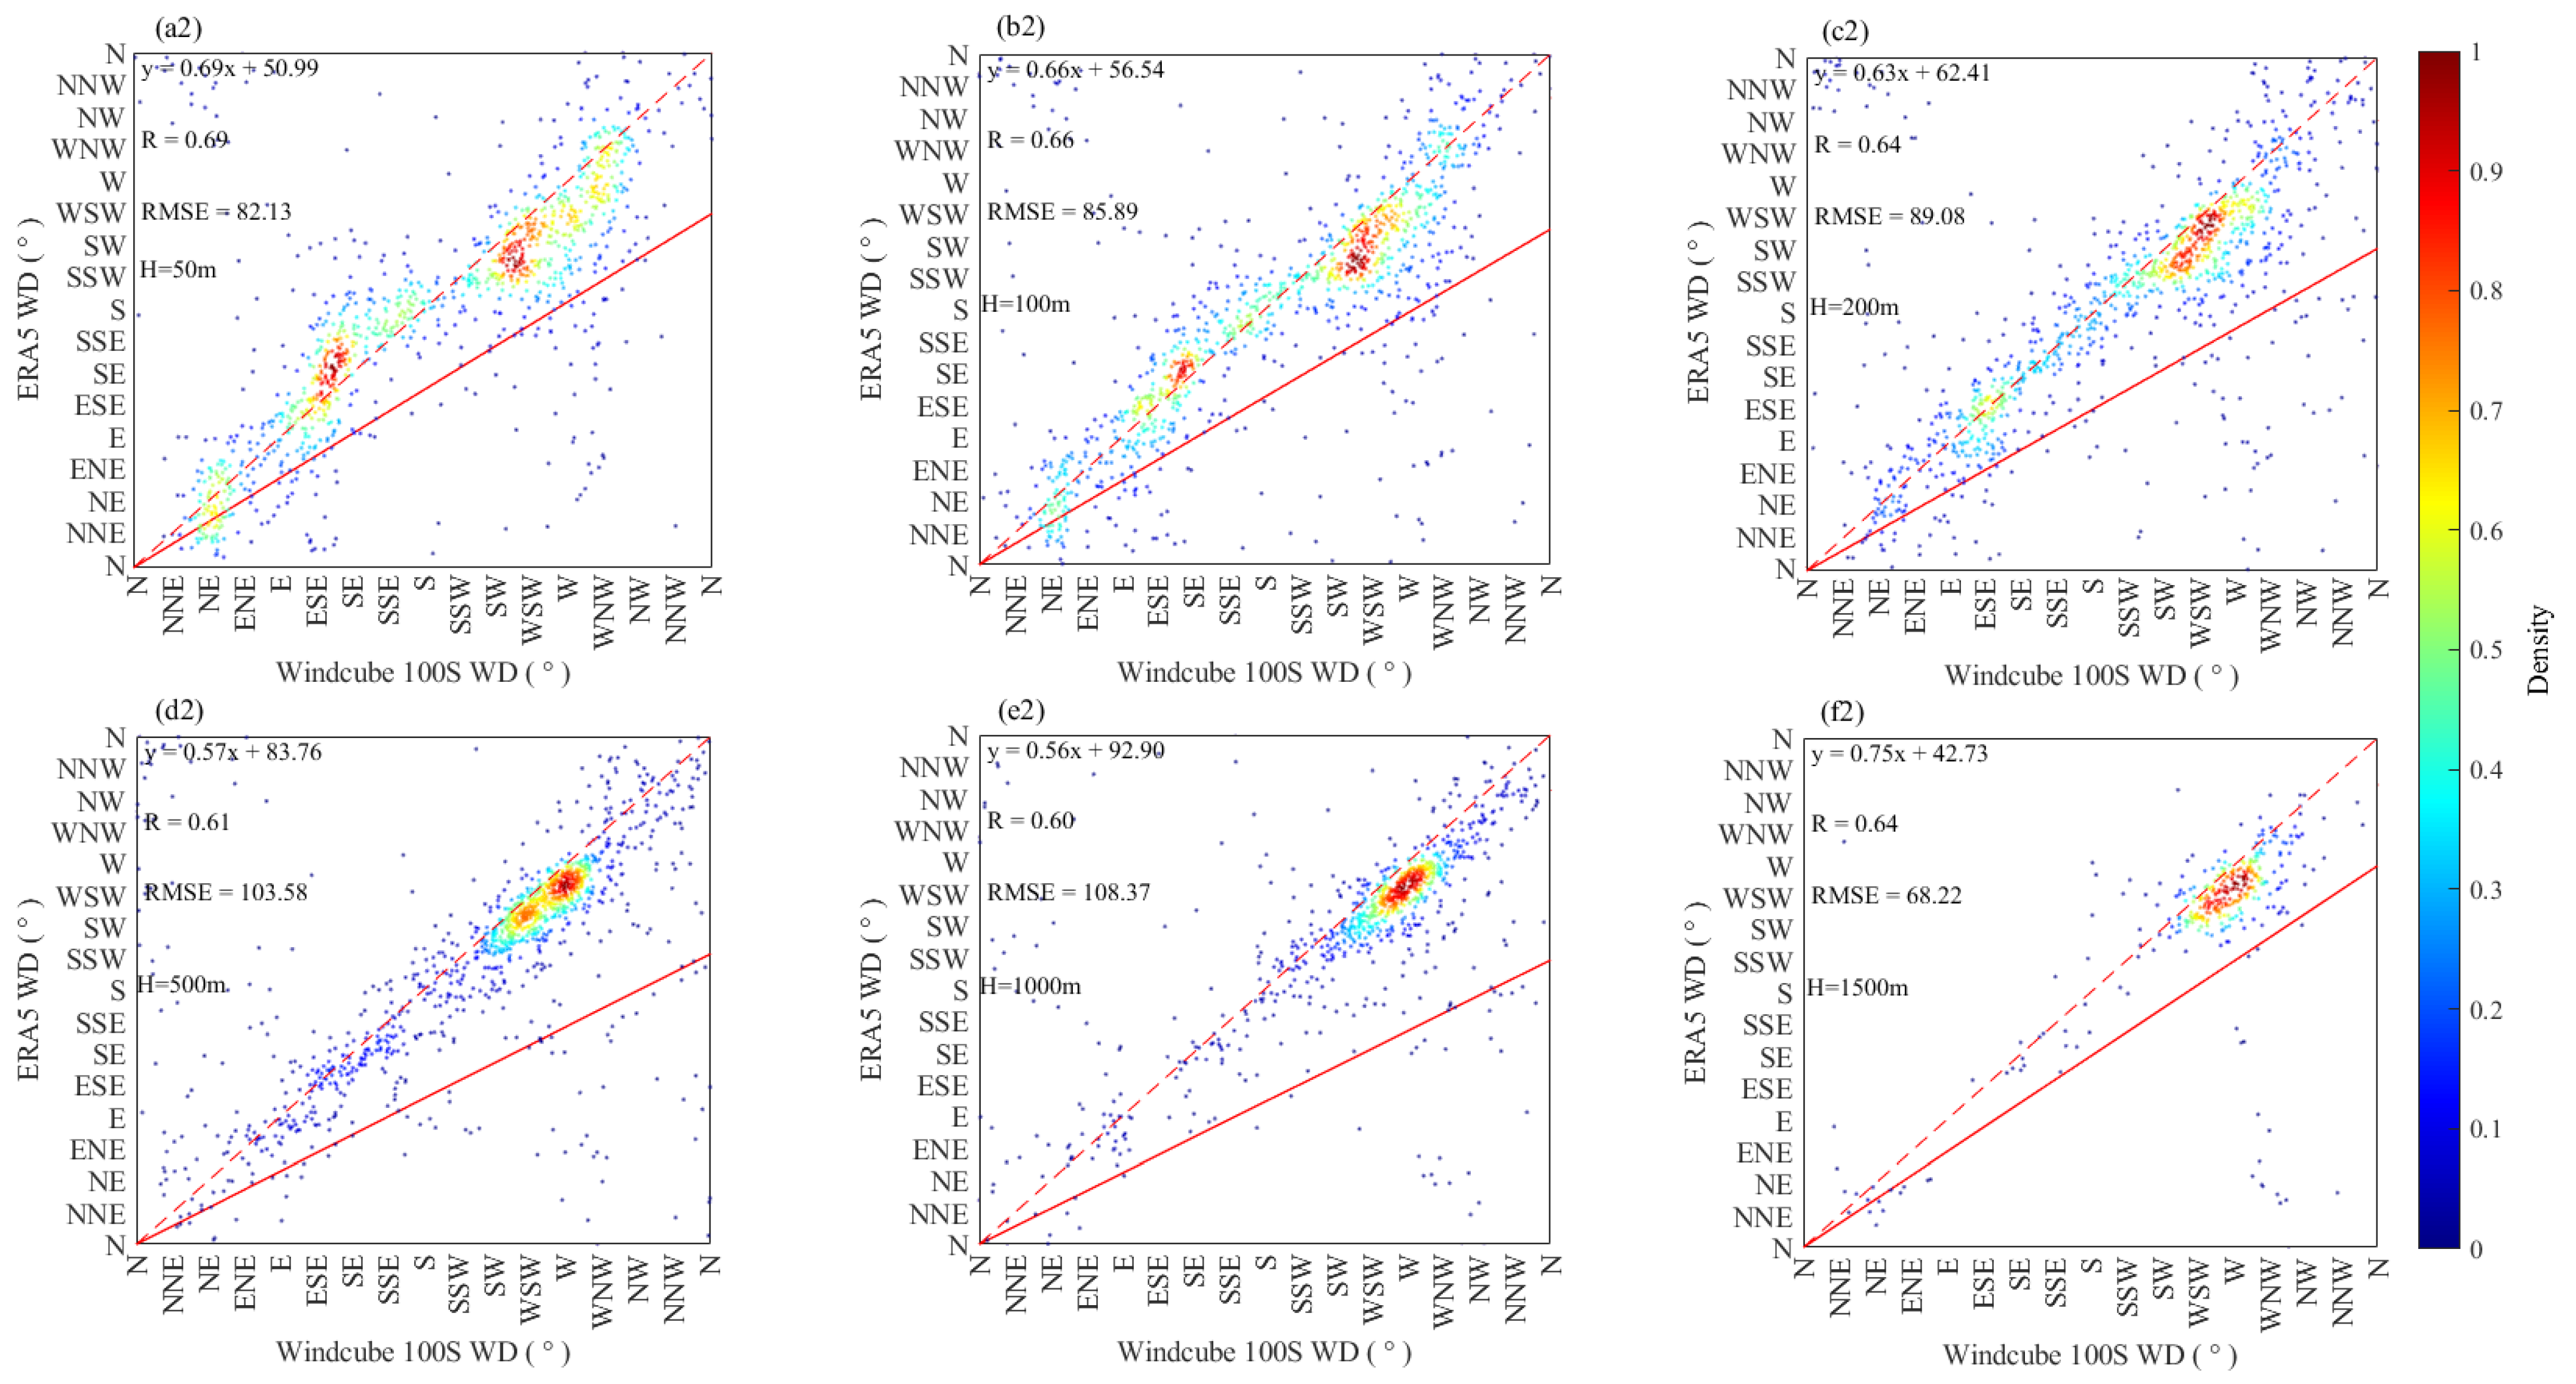
Figure 4 shows the applicability of ERA5 wind direction at various heights. Figure 4(a1–f1) shows the wind rose plots of the mean wind speed observations in 16 directions at each height compared to the ERA5 reanalysis data. Figure 4(a2–f2) shows the corresponding scatter plots of the wind direction at each height between the observations and the ERA5 reanalysis data. Overall, the maximum mean wind speeds for both ERA5 reanalysis data and observations occur in the westerly direction, and the best concordance is also found between the two datasets at each height, as shown in Figure 4(a2–f2). Figure 4(a1) shows that the 50 m ERA5 values indicate a larger south-southeasterly wind than the actual observed values, which may be caused by the influence of local circulation and other factors. Figure 4(a2) illustrates a notable agreement in the northeast and south-southwest directions, and the mean wind speeds of the ERA5 in the northwest and northeast directions are smaller than the observations, while the winds in the west-northwest direction of the ERA5 are worse, and the difference is more than a few times. In Figure 4(b1), the mean wind speed of the ERA5 reanalysis data is 4 m/s higher than the observations in the south-southeast direction at 100 m, while it is 2 m/s smaller in the west-northwest and northeast directions, with more outliers and poorer concordance. In Figure 4(c1), the mean wind speed of ERA5 is 2 m/s higher than the observations in the south-southeast direction at 200 m, while the mean wind speeds in the west-northwest and north-northeast directions are 2 m/s lower than the observations. In Figure 4(c2), with prevailing westerly and northwesterly winds, the observed wind direction and ERA5 reanalysis data have fewer outliers and have a better correlation at 100 m height, whereas larger biases exist at other altitudes. In Figure 4(d1), the mean wind speed of the 500 m ERA5 values is 3 m/s higher than the observations in the southerly direction, while the mean wind speed in the west-northwest direction is 3 m/s lower than the observations, and the mean wind speed in the south-southwest, south-southwest, and west-northwest directions is about 1–2 m/s lower than the observations. In Figure 4(d2), the wind directions between the observations and the ERA5 reanalysis data are poorly attuned at 500 m, with more outliers observed in the ERA5 reanalysis data in the north-westerly and north-easterly directions. In Figure 4(e1), the mean wind speed of the ERA5 data is 4 m/s higher than the observations in the southeast wind at 1000 m. The deviation of the mean wind speed in the east-southeast wind shows the maximum value, which is 5 m/s higher than that of the observed value, and the mean wind speeds of the west-southwest wind, west-northwest wind, northwest wind, and south-southeast wind are lower than the observed mean wind by 1–2 m/s. In Figure 4(e2), the wind direction between the observations and the ERA5 reanalysis data is poorly correlated at 1000 m, with more outliers in the north and northwest directions. In Figure 4(f1), the mean wind speeds of the 1500 m ERA5 data are 3 m/s lower than the observations in the northeast, east-northeast, and west-northwest directions, the mean wind speeds in the west, east, and north-northeast directions are 1–2 m/s lower than the observations, and the mean wind speeds in the west, east, and north-northeast directions are 1–2 m/s lower than observations. There are fewer outliers of westerly winds, which are more correlated with the prevailing westerly and northwestern winds. There are various reasons for the poor wind data. Due to the influence of the topography of the subsurface, temperature, and weather, the difference between the observations and ERA5 reanalysis data will be significant. Therefore, the ERA5 does not accurately reproduce the wind direction in the mountainous area, and the deviation is large.

3.4. Comparative Analysis of Temperature Profiles from the Surface to 3000 m

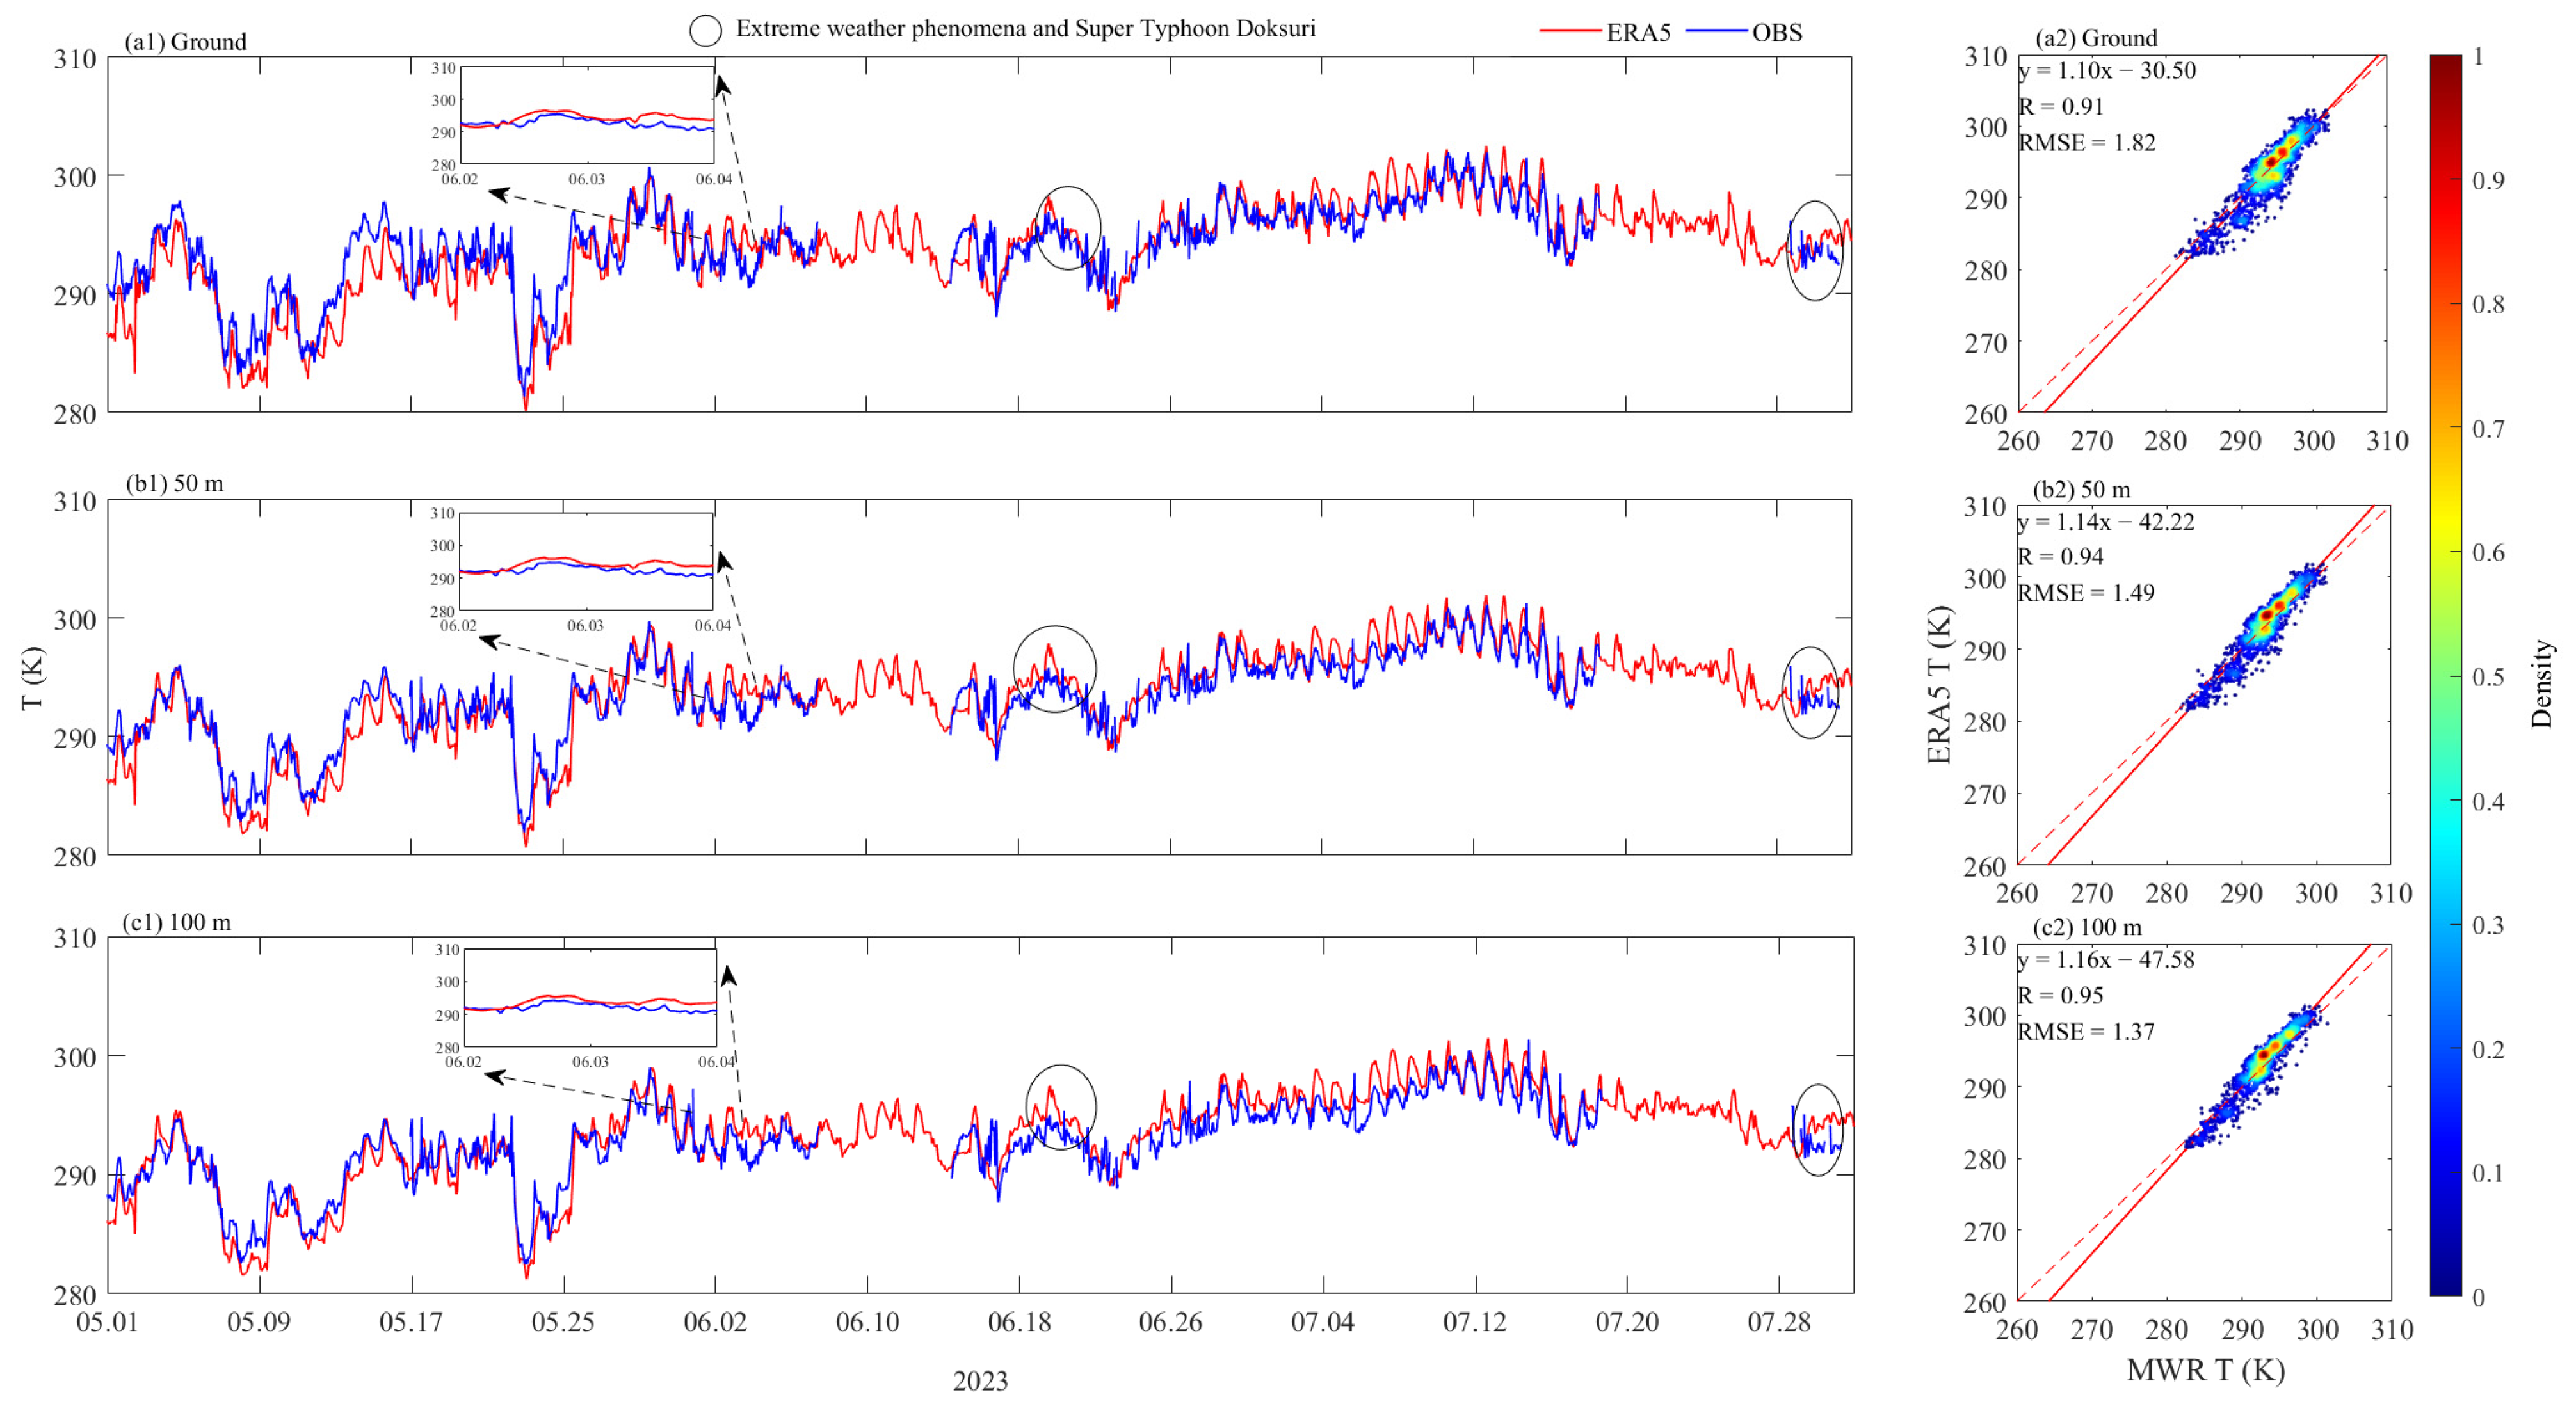
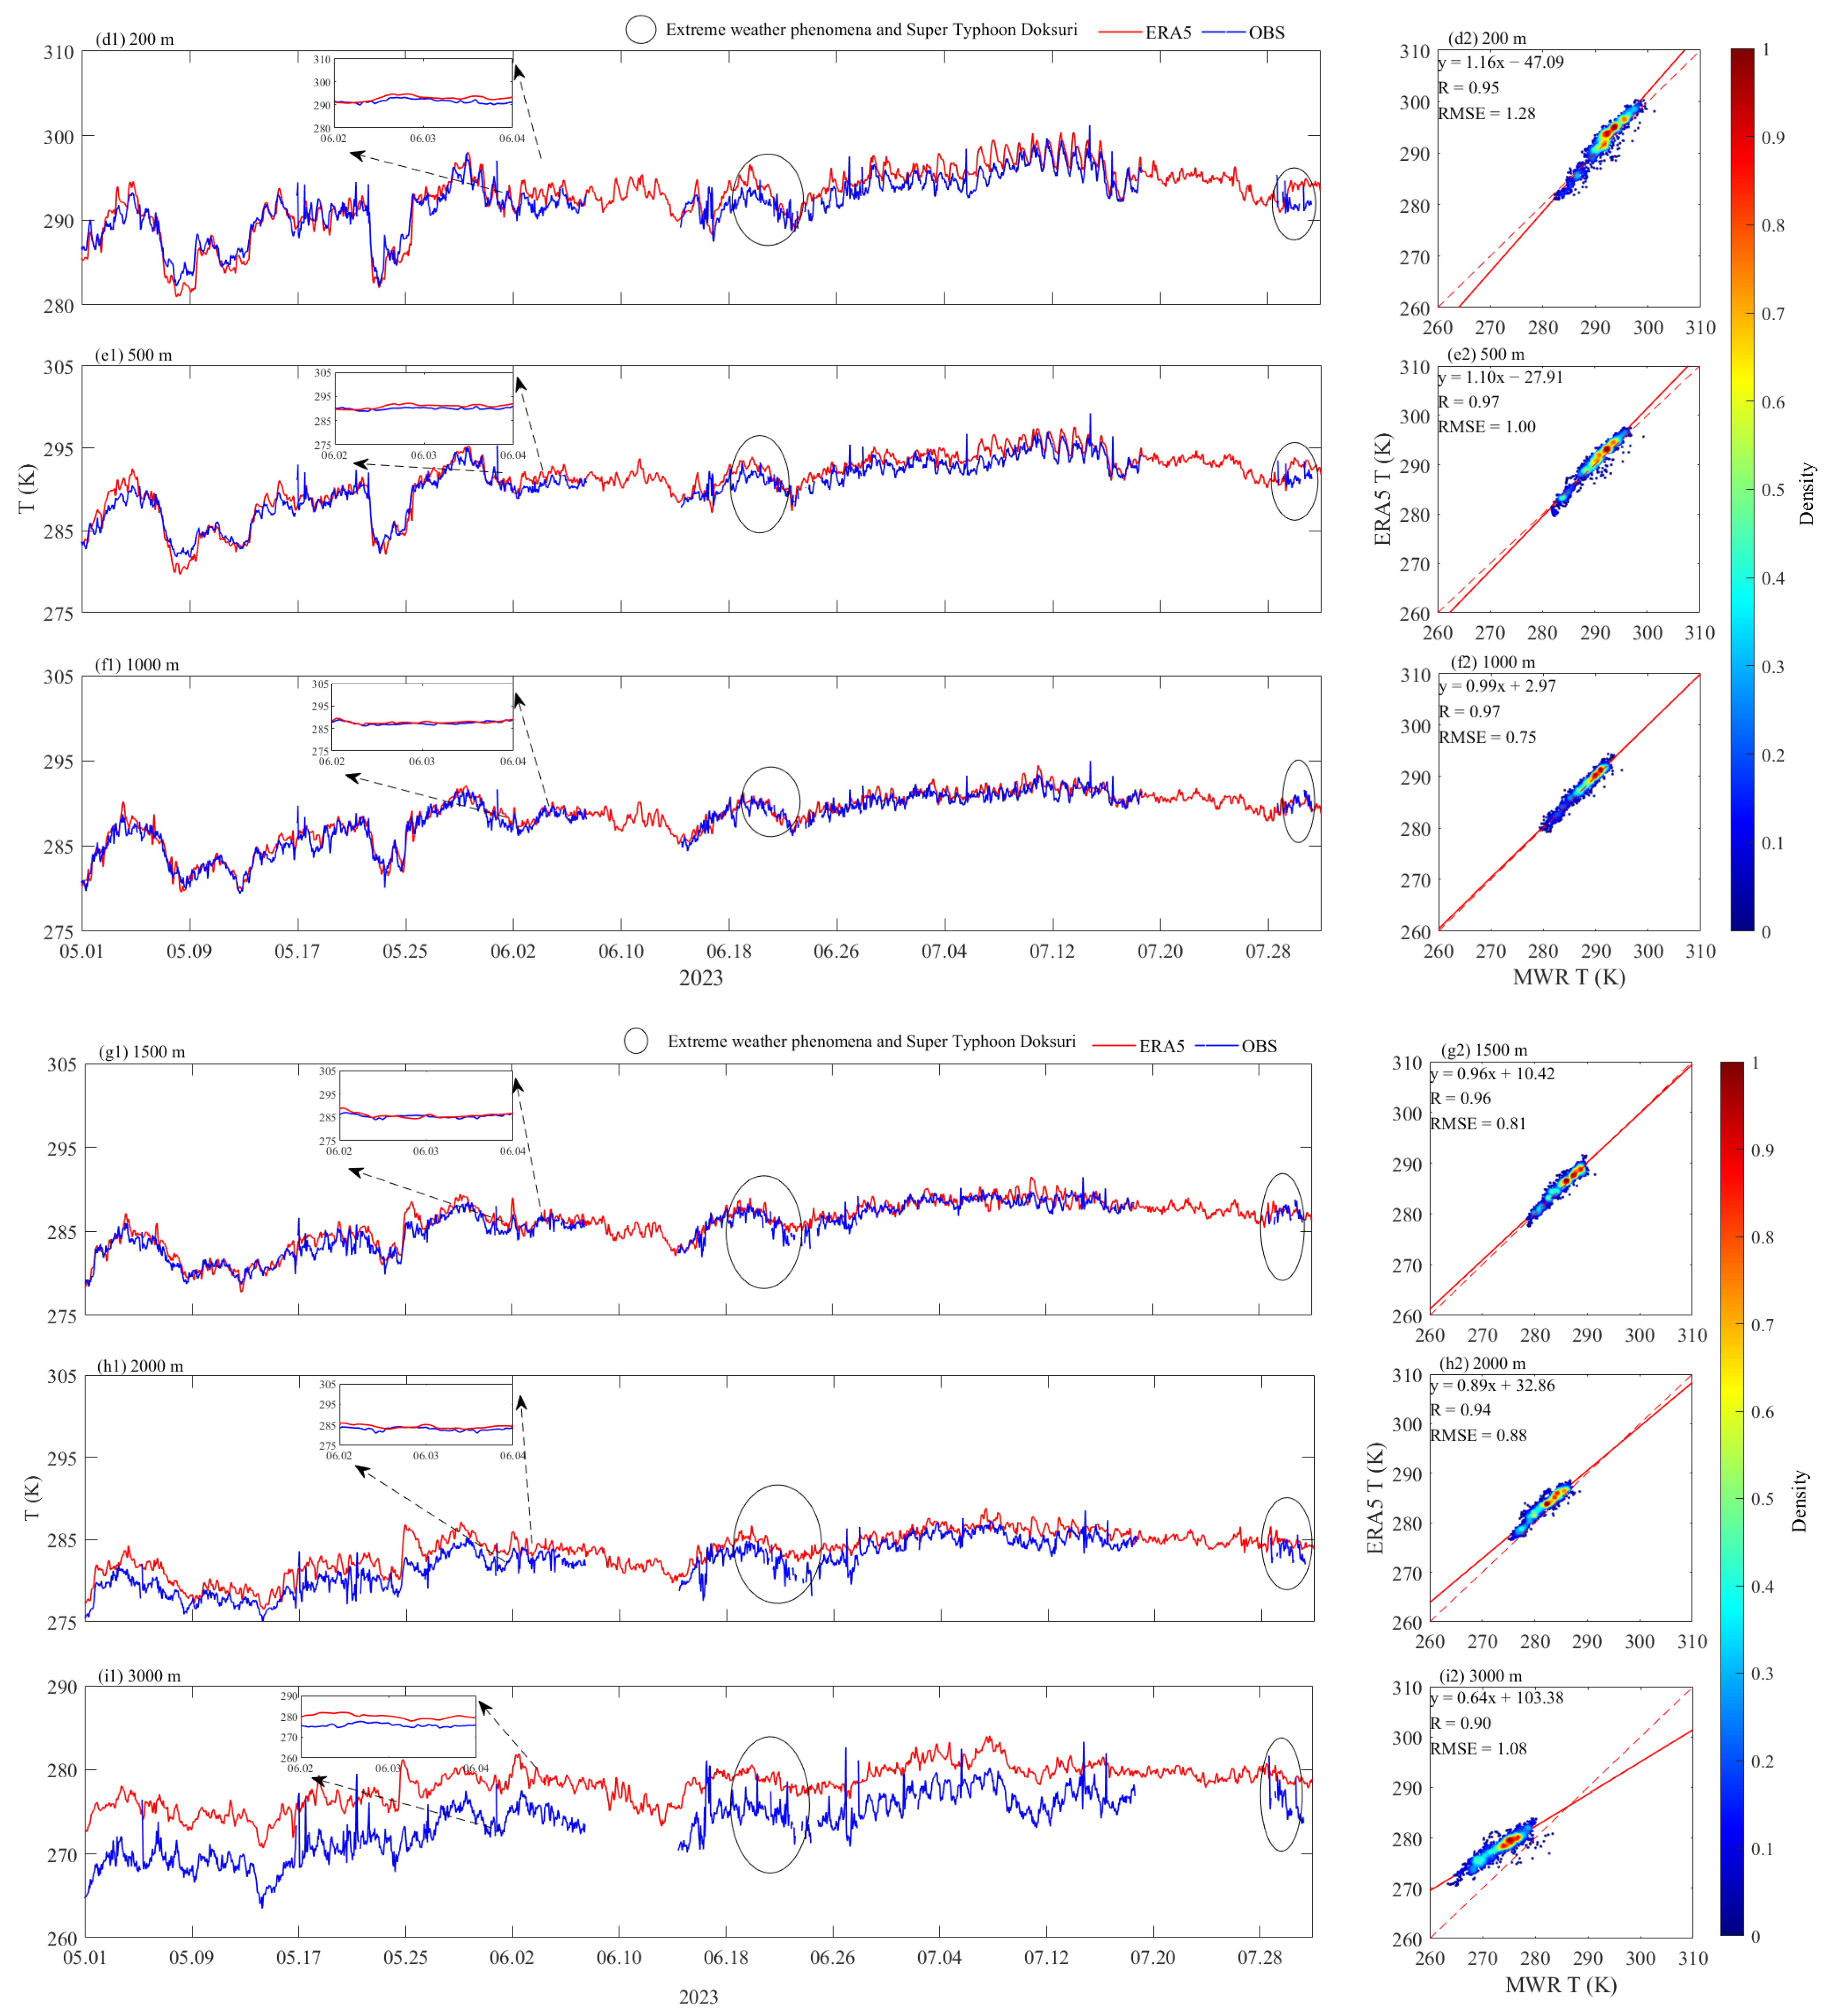
Figure 5 shows the applicability of ERA5 temperature at various heights. Though the near-surface temperature is mainly influenced by solar radiation and weather conditions, the topography and vegetation cover in the mountainous areas of southeast China are also major factors. The red lines in Figure 5(a1–i1) indicate the temperatures of the ERA5 reanalysis data at each height, and the blue lines indicate the temperatures obtained from the MWR observations at each height. Overall, the ERA5 reanalysis data at 0, 50, 100, and 200 m show some small deviations from the MWR observations, the ERA5 reanalysis data at 1000 m and 1500 m agree well with the MWR observations, and the ERA5 reanalysis data at 2000 m and 3000 m show large deviations from the MWR observations. In Figure 5(a1), a large deviation is evident. In the comparison of surface temperatures, the ERA5 reanalysis data have deviations in some periods, and the temperatures of the ERA5 reanalysis data are significantly lower than those of the observations in the period from 1 to 17 May, while it is slightly warmer than the observations from 22 to 26 May. Moreover, the ERA5 reanalysis data was slightly higher than the observed temperatures during the heavy rainfall period from 18 to 22 June. However, the ERA5 data show a trend of temperature variations at the mountain site, and the temperature of the ERA5 reanalysis data deviates slightly from the MWR observations due to the local circulation and the rapid change in regional weather phenomena.
In Figure 5(a1–e1), the deviations of the ERA5 reanalysis data are generally higher than those of the MWR observations before 20 May, and lower than those of the MWR observations after 20 May, and the temperature of the ERA5 data is higher than that of the observed data on 28 July, when southeast China was affected by the typhoon. In Figure 5(f1,g1), the ERA5 reanalysis data and the observed temperatures from the MWR show a good agreement at 1000 m and 1500 m. Under the influence of the typhoon, the temperature observations after July 28 are lower than the ERA5 temperature data at altitudes other than 1000 and 1500 m, and the ERA5 data temperatures at altitudes of 1000 and 1500 m are less affected by the typhoon. A poor correlation between the ERA5 reanalysis data and the observations are found at 2000 m and 3000 m. The systematic deviation is 2 K at 2000 m and more than 5 K at 3000 m. In Figure 5(h2,i2), the scatter plot reveals a discrepancy between the actual data points and the red dotted line, as the fitted line exhibits a considerable displacement from its corresponding reference line. However, the temperature trend of the ERA5 reanalysis data is improved in Figure 5(h1,i1), and the error only occurs in special weather conditions. The temperature of ERA5 reanalysis data are well correlated in the middle and bottom layers over mountainous areas. However, in the upper layers above 2000 m, there is a phenomenon whereby the higher the altitude, the larger the deviation. These large temperature deviations at higher altitudes have been mentioned in previous studies [13]. The accuracy of the ERA5 reanalysis data itself is also insufficient, and although the resolution has reached 0.25° × 0.25°, the accuracy of 31 km also makes it unable to precisely describe the exact meteorological elements at a location. We also compare the observations with the ERA5 data through the U,V component of the wind, as detailed in Figure S7.

3.5. Comparative Analysis of Relative Humidity Profiles from the Ground to 3000 m

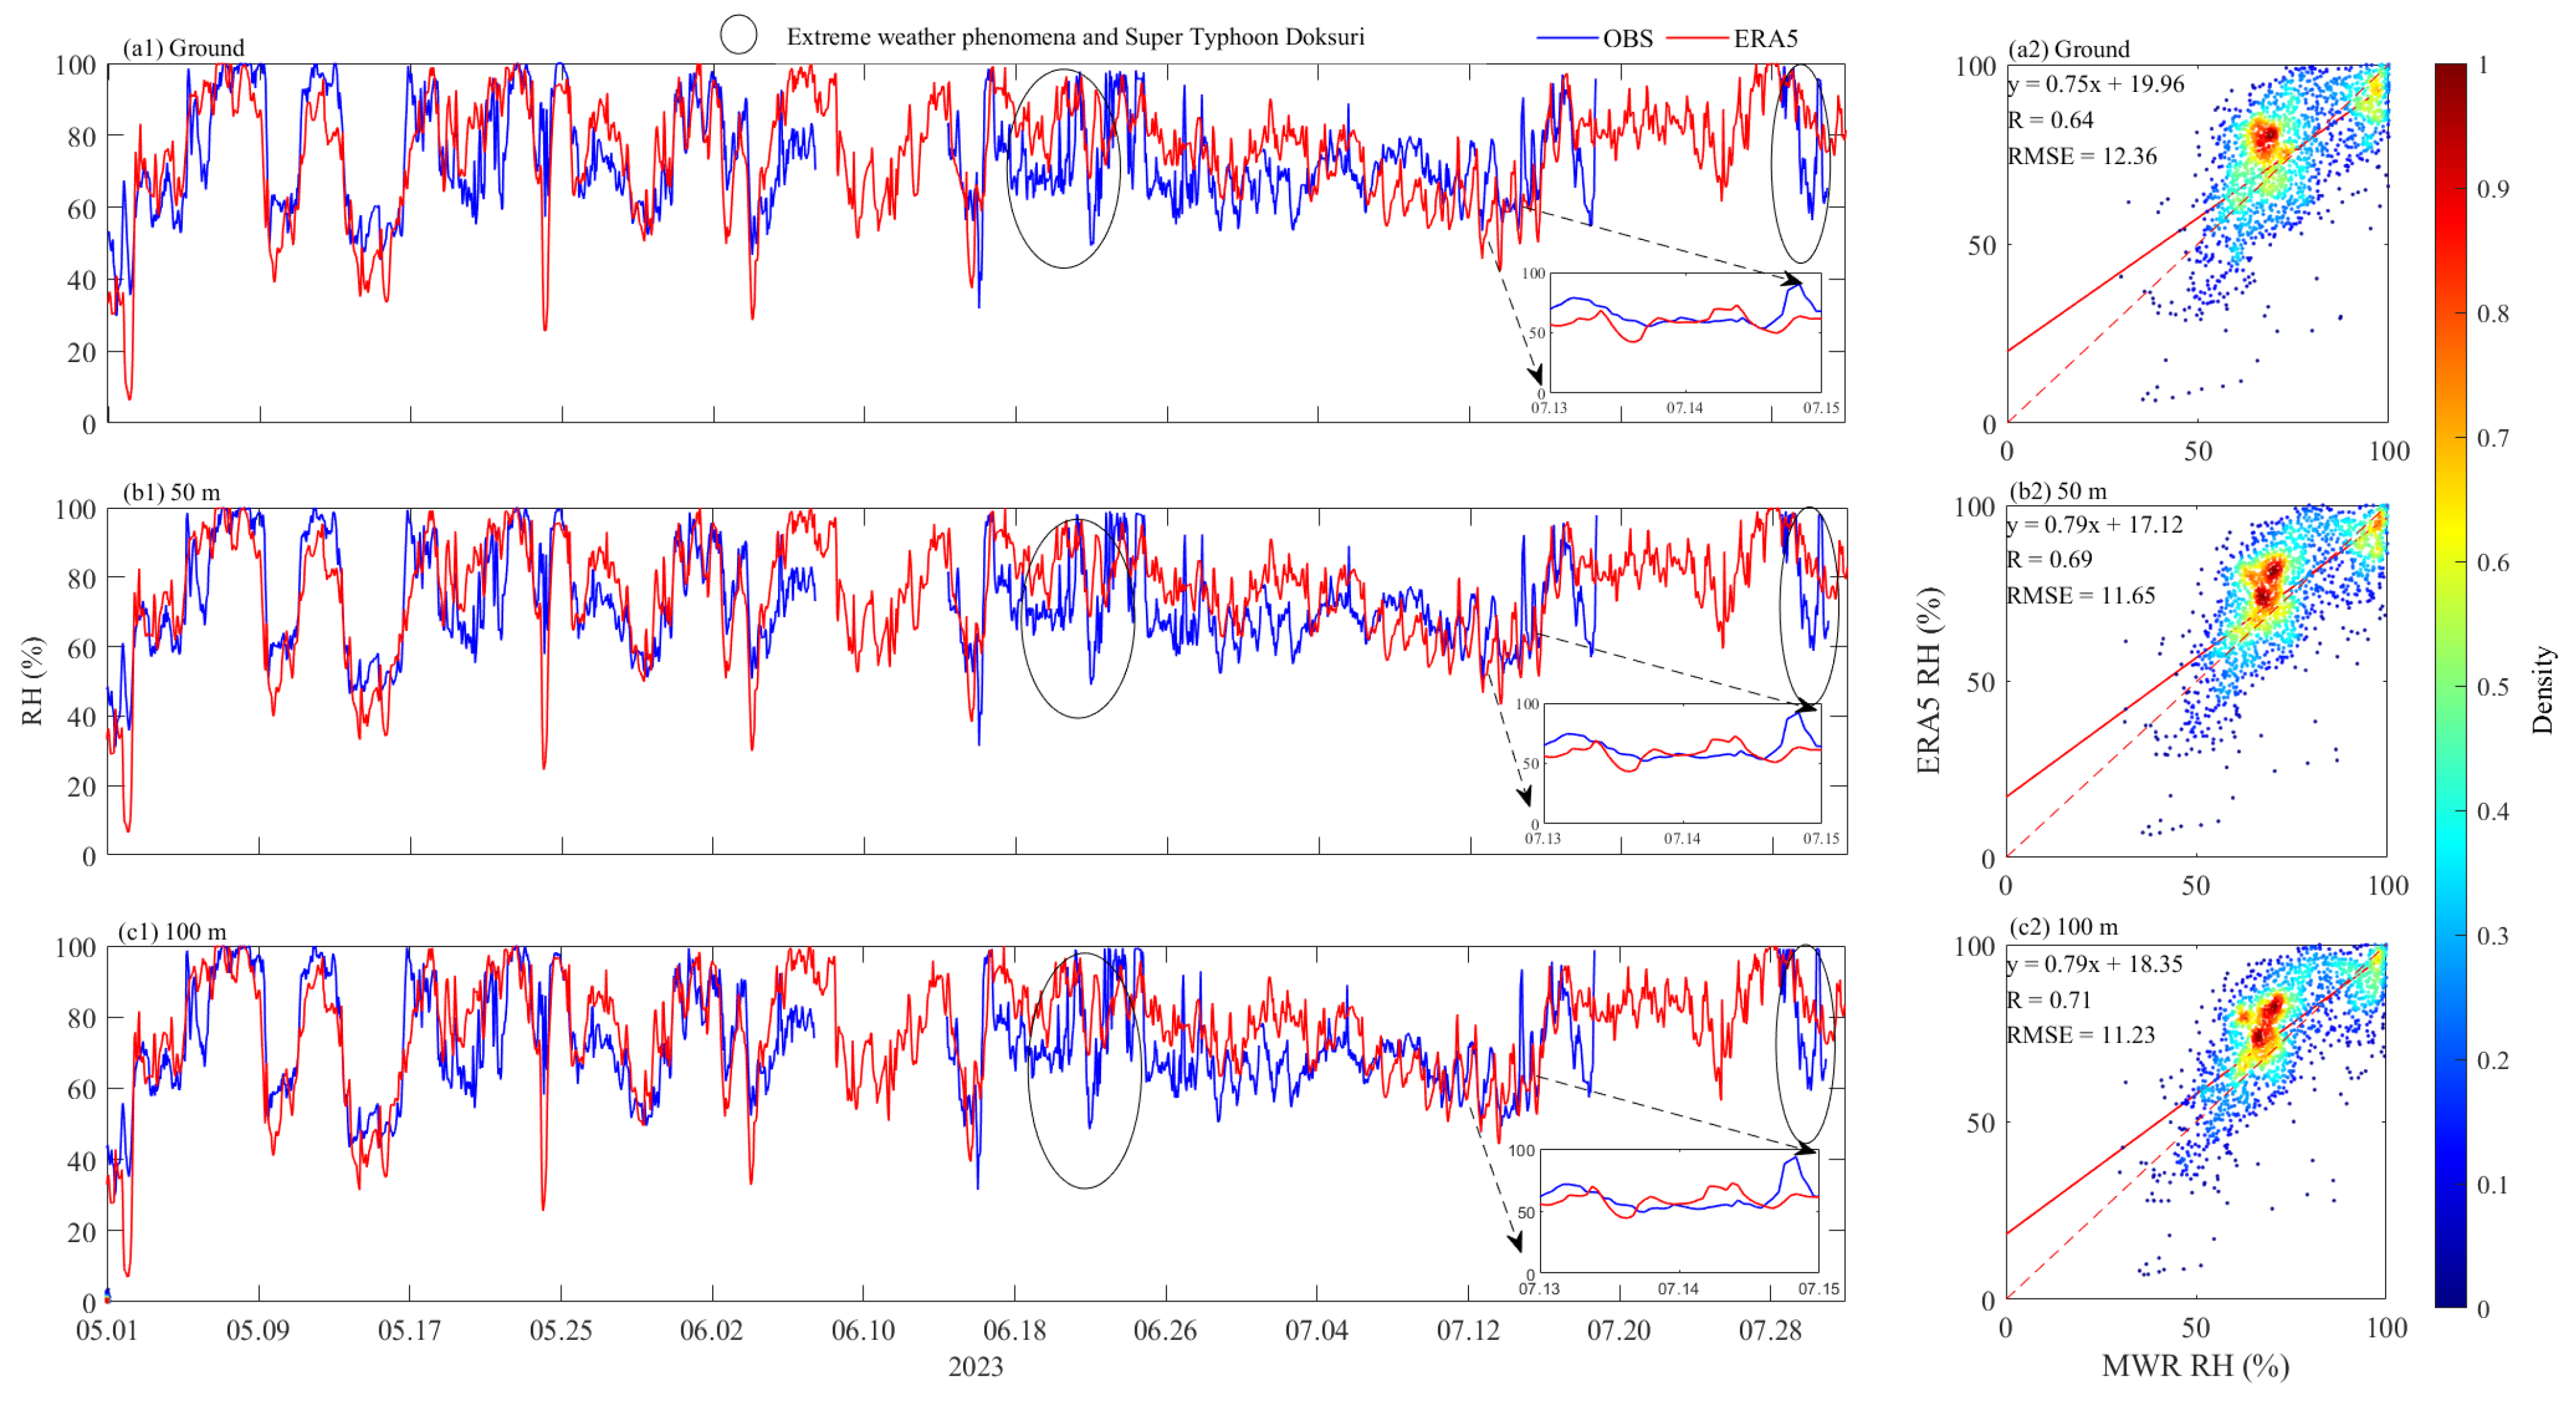
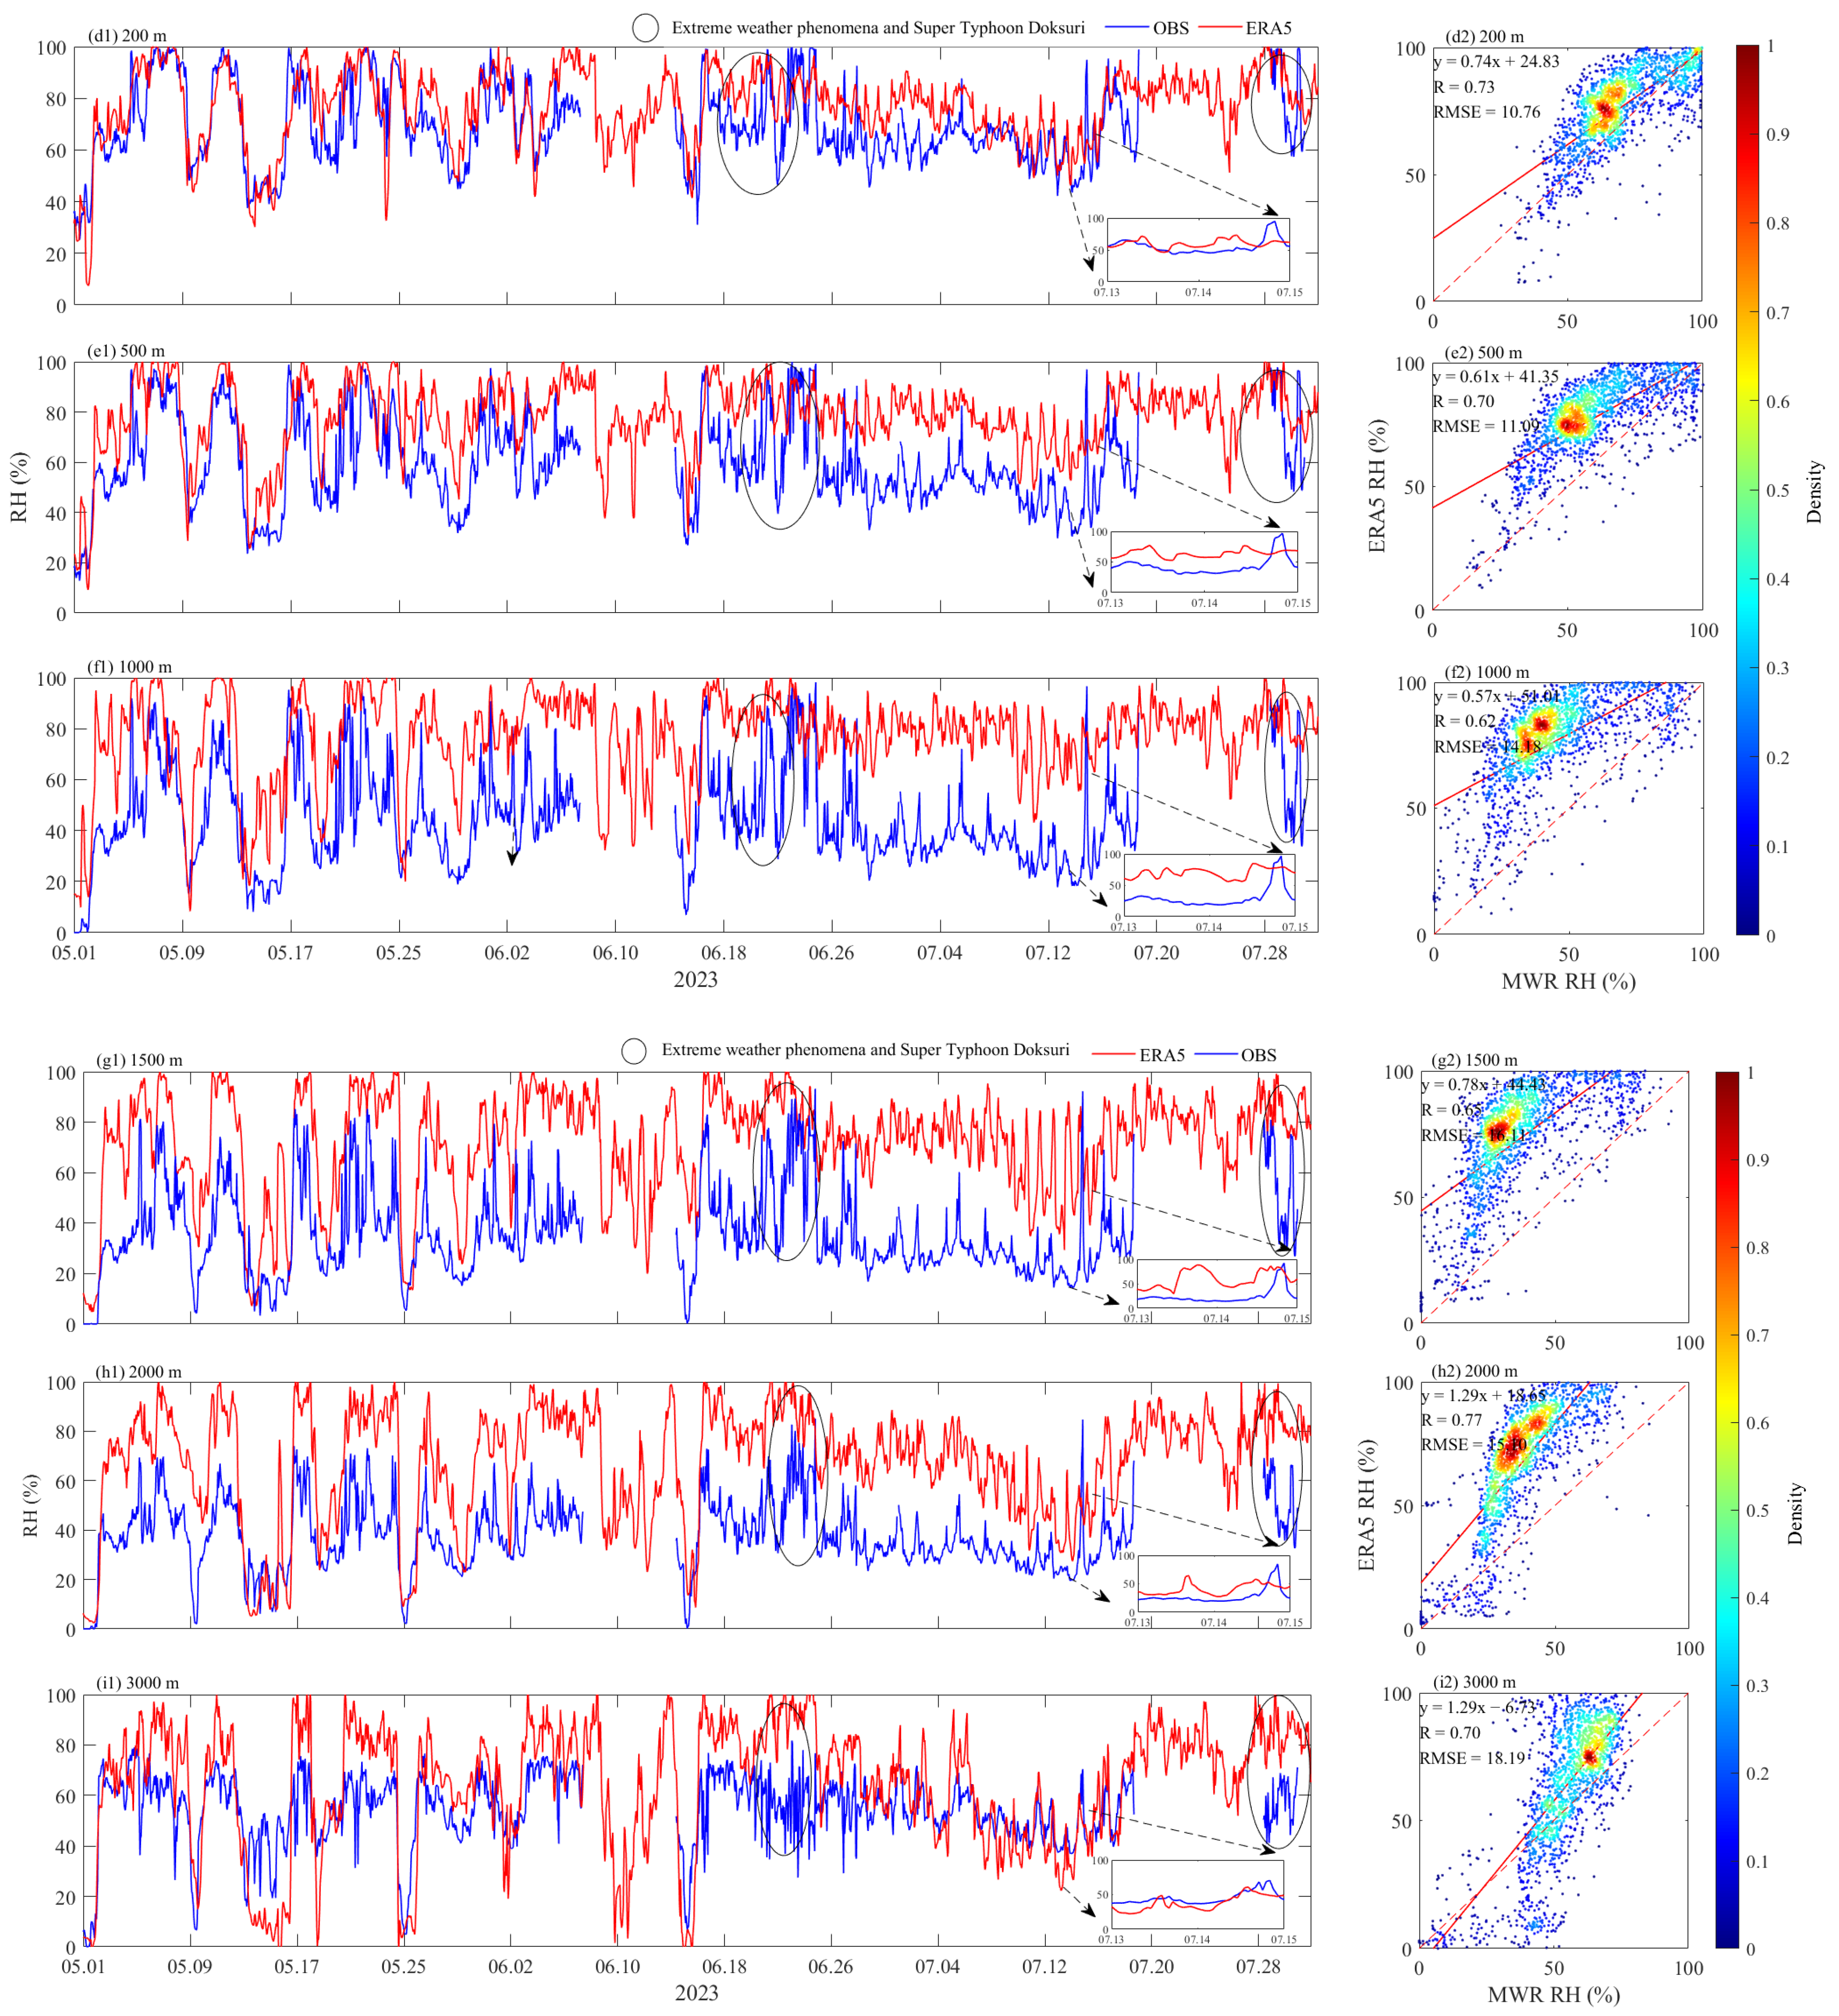
Figure 6 shows the applicability of ERA5 relative humidity at various heights. In Figure 6(a1–i1), the observed relative humidity for each height compared to the ERA5 reanalysis data values are presented. As a whole, the general variation trend of relative humidity in the ERA5 reanalysis data is similar to that observed by the MWR, but there still remain larger deviations in some cases. The relative humidity of the ERA5 reanalysis data are lower than the observations from the surface to 100 m on 1 and 2 May 2023, as is shown in Figure 6(a1–c1), since the relative humidity is closely related to the temperature. The errors are larger compared to the temperature, so the relative humidity of the ERA5 reanalysis data shows a larger deviation from the MWR. Due to the local rainfall, the relative humidity of the ERA5 reanalysis data was lower than the observations on 15–17 May, 3–4 June, and 9 July. On 15 July, the humidity in the air increased rapidly due to a short period of strong convective thunderstorms, and due to the typhoon weather from 27 to 30 July, the relative humidity of both the ERA5 reanalysis data and the MWR observations were higher. Due to the inaccurate forecast, the typhoon resulted in the discrepancy between the ERA5 reanalysis data and the observed data in the MWR.
Figure 6(a1–d1) show that the relative humidity of the ERA5 reanalysis data was higher than that of the MWR on 3 May, 4–8 June, 17–20 June, and from 28 June to 4 July. On 1–2 May, 9–11 May, 24 May, 1–5 June, and 7–14 July, the relative humidity of the ERA5 reanalysis data was lower than the MWR observations. Large deviations occur in Figure 6(e1–i1), and the deviations in the 2000 m and 3000 m comparison series plots are related to systematic errors in temperature. Large deviations occur at 500, 1000, and 1500 m ERA5, where the relative humidity is much higher than the observed values of MWR. In Figure 6(e1–i1), the relative humidity of the ERA5 reanalysis data are higher than the observations most of the time, and the relative humidity of the ERA5 reanalysis data is lower than the observations only in a few rainy days. In general, the relative humidity of the ERA5 data is basically consistent with observations when the height is under 500 m, with some deviations only in some special cases and fast-change phenomena caused by local factors. From 500 to 2000 m, the ERA5 data show a poor correlation, and significant deviations are observed in the majority of cases. However, the ERA5 data at 3000 m correspond better to the observations than those from 500 to 2000 m. In Figure 6(a2–i2), deviations are evident at all heights, and the fitted curves after the intercept is forced to zero are all significantly skewed to the side of the ERA5 reanalysis data, which means that the relative humidity of the ERA5 reanalysis data is generally skewed higher than the temperatures of the MWR observations.

4. Discussion

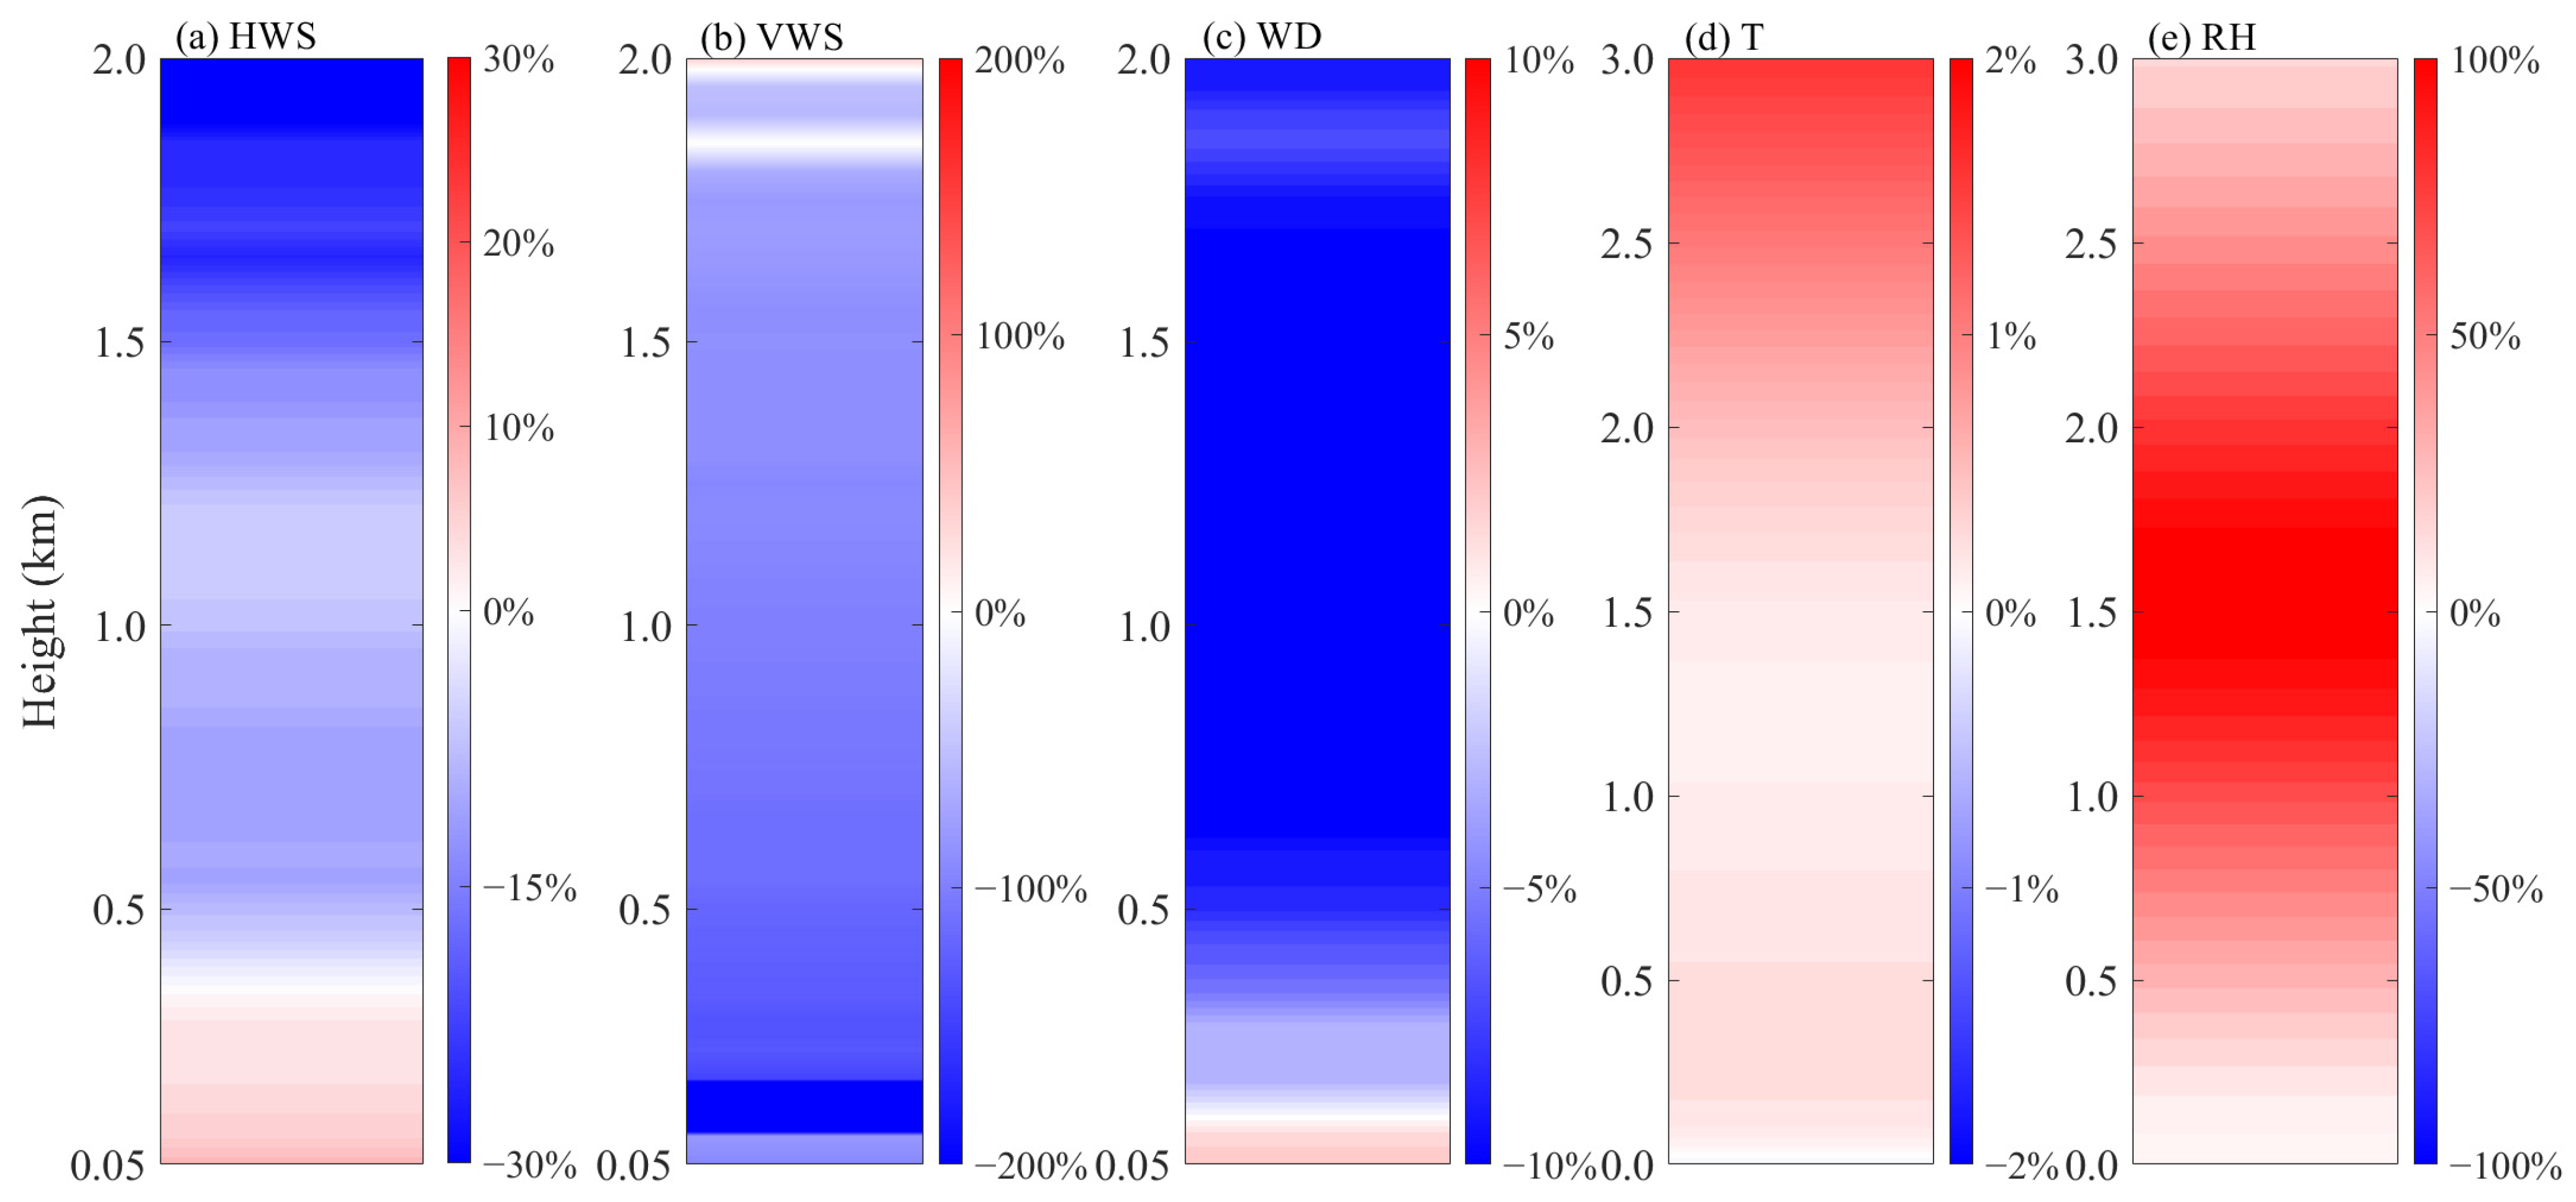
Figure 7 shows the mean deviations of ERA5 and remote-sensing observations for different meteorological variables. In Figure 7a, the horizontal wind speed of the ERA5 reanalysis data is positively deviated at a maximum of 9% when presented below 400 m. Above 400 m, there is a tendency of an increasing negative deviation, and a large deviation of the horizontal wind speed at upper levels will generate larger errors in the operation of the climate models. The ERA5 vertical wind speed shows a more obvious negative deviation below 1800 m, which indicates that the ERA5 reanalysis data are unable to accurately represent the state of the local vertical motions (Figure 7b). Some of the poor agreement between the model and observations for the vertical velocities can be attributed to differences in the averaging timescales used for the wind lidar and the ERA5. Wind radar observations have a second resolution. We compared their averaged hourly data to the ERA5 data at an hourly resolution, and a large error was found. Figure 7c shows that the deviation of the ERA5 wind direction varies within 10%. Affected by the local circulations and the terrain forcings, it is normal to fluctuate the small deviations. In Figure 7d, although the deviation shown is only within 2%, we observed higher temperature deviations at higher altitudes occurs above 2000 m. The humidity data from the ERA5 reanalysis datasets show more pronounced positive deviations from 500 to 2500 m, as shown in Figure 7e, with that of the ERA5 data, which is twice as high as the observed values.
The ERA5 reanalysis datasets were shown to poorly capture the vertical wind speeds in the context of extreme weather events. The temperature data from ERA5 agree well with the measurements at low and medium levels, with deviations of less than 0.2%, but systematic errors of high deviations appear at higher than 2000 m, illustrating the importance of the optimization and improvement of ERA5 upper-level temperature data. When unusual weather occurred, the meteorological variables changed rapidly within a small scale, and the ERA5 was unable to accurately represent these conditions, leading to biases. Please refer to the Supplementary Materials for the vertical profile of each meteorological element under extreme weather conditions. Aiming to compensate for the disadvantages of the ERA5, several methodologies have potential applications in improving the accuracy its accuracy. For example, mechanical learning methods have been evidenced to be an useful tool for reducing the errors of the boundary layer height of the ERA5 data [10].

5. Conclusions

In this study, based on the high-precision remote-sensing measurements from May to July 2023 in a typical mountainous Shanghuang site in southeast China, we systemically evaluated the vertical accuracy of the ERA5 meteorological variables over mountainous areas, which corresponds well to the Doppler wind lidar observations, but there are still some discrepancies. The mountainous climate is extremely complex and changeable, especially at the summit, making it much more difficult for the ERA5 data to capture true values because of its relatively coarse resolution both at temporal and spatial scales. The horizontal wind speeds of ERA5 only deviate from the observed values below 400 m by about 8%, whereas above 400 m, there is an increasing negative bias as altitude increases. The difference between the vertical wind speeds in ERA5 and those observed by Doppler wind lidar is large, and the valley winds and heterogeneous topographic forcing in the mountains are important reasons. Thus, the ERA5 is not able to characterize the vertical wind speeds of the localities.
Therefore, the coarse resolution and heterogeneous topographic forcing jointly result in poor representativeness of meteorological variables, especially in extreme weather such as heavy rainfalls and typhoons. In particular, there is a large deviation from the observations in the middle and lower vertical wind speeds and the horizontal winds. The maximum mean wind speeds of both the ERA5 reanalysis data and the observations occur in the westerly winds. Below 1800 m, the vertical wind speed of the ERA5 shows positive deviations from −150% to −60%. Above 1800 m, the deviation is from −60% to 40%. With prevailing westerly and northwesterly winds, the observed wind direction and ERA5 reanalysis data have fewer outliers, and they show a better correlation at a 100 m height, whereas larger biases exist at other altitudes. The reasons for the poor consistency of wind direction in the atmospheric boundary layer below 1500 m are the influences of the topography of the subsurface, the temperature, the convective weather processes, typhoons, etc.
In addition, temperature data from the ERA5 agree well at low and medium levels over mountainous regions, with deviations of less than 0.5%, but systematic errors with higher deviations occur at altitudes higher than 2000 m, and the upper-level temperature data need to be optimized. The general trend of relative humidity variations in the ERA5 is similar to that observed by the MWR, but with larger deviations occurring during convective weather events. Below 200 m, the ERA5 relative humidity is similar to that observed by MWR, but at middle and upper levels, the ERA5 relative humidity is generally biased, higher than that observed by MWR, with larger positive deviations ranging from 30% to 110% from 500 to 2500 m. The results expand the application of the ERA5 reanalysis datasets in the mountainous areas of southeast China. More importantly, it provides credible reference data for the meteorological predictions and climate modelings in the southeast China mountainous region.

Supplementary Materials

The following supporting information can be downloaded at: https://www.mdpi.com/article/10.3390/rs16030548/s1, Figure S1: Horizontal and vertical wind speeds at the observation site under convective weather on 19 May 2023; Figure S2: Comparison of observed horizontal wind speeds with ERA5 horizontal wind speeds under the influence of heavy rain on 21–22 June 2023; Figure S3: Comparison of observed vertical wind speed with ERA5 vertical wind speed under the influence of heavy rain on 21–22 June 2023; Figure S4: Comparison of observed temperatures with ERA5 temperatures under the influence of heavy rainfall on 21–22 June 2023; Figure S5: Comparison of observed relative humidity with ERA5 relative humidity under the influence of heavy rainfall on 21–22 June 2023; Figure S6: Liquid water content on 22 June 2023; Figure S7: Time series and scatter plots of the observed horizontal u-wind components at various heights compared with the ERA5 reanalysis data values, with the red and blue lines representing the u-wind components from ERA5 and Doppler wind lidar, respectively.

Author Contributions

Conceptualization, Y.M., Y.S. and J.X.; methodology, Y.W. and Y.M.; software, Y.W. and K.P.; validation, D.Z., X.R. and S.Y.; formal analysis, Y.W. and K.P.; investigation, Y.W. and Y.M.; resources, X.P. and J.X.; data curation, X.P., Z.W. and J.X.; writing—original draft preparation, Y.W. and Y.M.; writing—review and editing, Y.M., Y.S., M.A., X.P., Z.W. and J.X.; visualization, Y.W.; supervision, Y.M. and Y.S.; project administration, Y.M., D.Z. and J.X.; funding acquisition, Y.M., D.Z. and J.X. All authors have read and agreed to the published version of the manuscript.

Funding

This study was supported by the CAS Strategic Priority Research Program (XDA23020301), the National Key Research and Development Program of Young Scientists of China (2023YFC3711000), the National Natural Science Foundation of China (42305090; 42307144), the China Postdoctoral Foundation (2021M700140; 2022TQ0332), the Ministry of Science and Technology of China (2022YFF0802501), the Future Earth Secretariat Hub China, and the Fundamental Research Funds for the Central Universities, Sun Yat-sen University (23ptpy91).

Data Availability Statement

The data underlying this article will be shared upon reasonable request to the corresponding author. The data are not publicly available due to protect intellectual property rights.

Conflicts of Interest

The authors declare no conflicts of interest.

References

  1. Xu, A.; Zhang, W.; Li, J.; Xie, Y.; Dong, B.; Su, J. An Overview of the Field Observation Experiments and Associated Investigation on Mountain Meteorology over Complex Terrain Region. Adv. Meteorol. Sci. Technol. 2022, 12, 13–20. [Google Scholar] [CrossRef]
  2. Hersbach, H. The ERA5 Atmospheric Reanalysis. AGU Fall Meeting Abstracts; American Geophysical Union: Washington, DC, USA, 2016. [Google Scholar]
  3. Hersbach, H.; Bell, B.; Berrisford, P.; Hirahara, S.; Horányi, A.; Muñoz-Sabater, J.; Nicolas, J.; Peubey, C.; Radu, R.; Schepers, D.; et al. The ERA5 global reanalysis. Q. J. R. Meteorol. Soc. 2020, 146, 1999–2049. [Google Scholar] [CrossRef]
  4. Prein, A.F. Thunderstorm straight line winds intensify with climate change. Nat. Clim. Change 2023, 13, 1353–1359. [Google Scholar] [CrossRef]
  5. Zhai, R.; Huang, C.; Yang, W.; Tang, L.; Zhang, W. Applicability evaluation of ERA5 wind and wave reanalysis data in the South China Sea. Oceanol. Limnol. Sin. 2023, 41, 495–517. [Google Scholar] [CrossRef]
  6. Ombadi, M.; Risser, M.D.; Rhoades, A.M.; Varadharajan, C. A warming-induced reduction in snow fraction amplifies rainfall extremes. Nature 2023, 619, 305–310. [Google Scholar] [CrossRef] [PubMed]
  7. Xin, Y.; Ning, L.; Hou, J.; Yang, X.; Liu, L. Performance of ERA5 reanalysis precipitation products in the Guangdong-Hong Kong-Macao greater Bay Area, China. J. Hydrol. 2021, 602, 126791. [Google Scholar] [CrossRef]
  8. Jiang, Q.; Li, W.; Fan, Z.; He, X.; Sun, W.; Chen, S.; Wen, J.; Gao, J.; Wang, J. Evaluation of the ERA5 reanalysis precipitation dataset over Chinese Mainland. J. Hydrol. 2020, 595, 125660. [Google Scholar] [CrossRef]
  9. Jiao, D.; Xu, N.; Yang, F.; Xu, K. Evaluation of spatial-temporal variation performance of ERA5 precipitation data in China. Sci. Rep. 2021, 11, 17956. [Google Scholar] [CrossRef] [PubMed]
  10. Peng, K.; Xin, J.; Zhu, X.; Wang, X.; Cao, X.; Ma, Y.; Ren, X.; Zhao, D.; Cao, J.; Wang, Z. Machine learning model to accurately estimate the planetary boundary layer height of Beijing urban area with ERA5 data. Atmos. Res. 2023, 293, 106925. [Google Scholar] [CrossRef]
  11. Liu, H.; Dong, L.; Yan, R.; Zhang, X.; Guo, C.; Liang, S.; Tu, J.; Feng, X.; Wang, X. Evaluation of Near-Surface Wind Speed Climatology and Long-Term Trend over China’s Mainland Region Based on ERA5 Reanalysis. Clim. Environ. Res. 2021, 26, 299–311. [Google Scholar] [CrossRef]
  12. Heitmann, K.; Sprenger, M.; Binder, H.; Wernli, H.; Joos, H. Warm conveyor belt characteristics and impacts along the life cycle of extratropical cyclones: Case studies and climatological analysis based on ERA5. EGUsphere, 2023; preprint. [Google Scholar] [CrossRef]
  13. Meng, X.; Guo, J.; Han, Y. Preliminarily assessment of ERA5 reanalysis data. J. Mar. Meteorol. 2018, 38, 91–99. [Google Scholar] [CrossRef]
  14. Zhi, X.; Xu, H. Comparative analysis of free atmospheric temperature between three reanalysis datasets and radiosonde dataset in China: Annual mean characteristic. Trans. Atmos. Sci. 2013, 36, 77–87. [Google Scholar] [CrossRef]
  15. Jiang, J.; Zhou, T.; Zhang, W. Evaluation of satellite and reanalysis precipitable water vapor datasets against radiosonde observations in central Asia. Earth Space Sci. 2013, 6, 1129–1148. [Google Scholar] [CrossRef]
  16. Binder, H.; Boettcher, M.; Joos, H.; Sprenger, M.; Wernli, H. Vertical cloud structure of warm conveyor belts—a comparison and evaluation of ERA5 reanalysis, CloudSat and CALIPSO data. Weather. Clim. Dyn. 2020, 1, 577–595. [Google Scholar] [CrossRef]
  17. Zhao, D.; Xin, J.; Gong, C.; Quan, J.; Liu, G.; Zhao, W.; Wang, Y.; Liu, Z.; Song, T. The formation mechanism of air pollution episodes in Beijing city: Insights into the measured feedback between aerosol radiative forcing and the atmospheric boundary layer stability. Sci. Total Environ. 2019, 692, 371–381. [Google Scholar] [CrossRef]
  18. Wang, Y.; Yu, M.; Wang, Y.; Tang, G.; Song, T.; Zhou, P.; Liu, Z.; Hu, B.; Ji, D.; Wang, L.; et al. Rapid formation of intense haze episodes via aerosol–boundary layer feedback in Beijing. Atmos. Chem. Phys. 2020, 20, 45–53. [Google Scholar] [CrossRef]
  19. Wang, Y.; Ma, Y.; Yan, C.; Yao, L.; Cai, R.; Li, S.; Lin, Z.; Zhao, X.; Yin, R.; Deng, C.; et al. Sulfur Dioxide Transported from the Residual Layer Drives Atmospheric Nucleation During Haze Periods in Beijing. Geophys. Res. Lett. 2023, 50, e2022GL100514. [Google Scholar] [CrossRef]
  20. Davy, R. The Climatology of the Atmospheric Boundary Layer in Contemporary Global Climate Models. J. Clim. 2018, 31, 9151–9173. [Google Scholar] [CrossRef]
  21. Ma, Y.; Ye, J.; Xin, J.; Zhang, W.; de Arellano, J.V.; Wang, S.; Zhao, D.; Dai, L.; Ma, Y.; Wu, X.; et al. The stove, dome, and umbrella effects of atmospheric aerosol on the development of the planetary boundary layer in hazy regions. Geophys. Res. Lett. 2020, 47, e2020GL087373. [Google Scholar] [CrossRef]
  22. Ren, X.; Zhao, L.; Ma, Y.; Wu, J.; Zhou, F.; Jia, D.; Zhao, D.; Xin, J. Remote Sensing of Planetary Boundary Layer Thermodynamic and Material Structures over a Large Steel Plant, China. Remote Sens. 2023, 15, 5104. [Google Scholar] [CrossRef]
  23. Cimini, T.; Hewison, T.; Martin, L.; Güldner, J.; Gaffard, C.; Marzano, F.S. Temperature and humidity profile retrievals from ground-based microwave radiometers during TUC. Meteorol. Z. 2006, 15, 45–56. [Google Scholar] [CrossRef]
  24. Berg, L.K.; Newsom, R.K.; Turner, D.D. Year-long vertical velocity statistics derived from Doppler lidar data for the continental convective boundary layer. J. Appl. Meteorol. Climatol. 2017, 56, 2441–2454. [Google Scholar] [CrossRef]
  25. Banakh, V.A.; Smalikho, I.N.; Falits, A.V. Estimation of the height of the turbulent mixing layer from data of Doppler lidar measurements using conical scanning by a probe beam. Atmos. Meas. Tech. 2021, 14, 1511–1524. [Google Scholar] [CrossRef]
  26. Chen, S.; Tong, B.; Russell, L.M.; Wei, J.; Guo, J.; Mao, F.; Liu, D.; Huang, Z.; Xie, Y.; Qi, B.; et al. Lidar-based daytime boundary layer height variation and impact on the regional satellite-based PM2.5 estimate. Remote Sens. Environ. 2014, 281, 113224. [Google Scholar] [CrossRef]
  27. Kumer, V.-M.; Reuder, J.; Furevik, B.R. A comparison of LiDAR and radiosonde wind measurements. Energy Procedia 2014, 53, 214–220. [Google Scholar] [CrossRef]
  28. Löhnert, U.; Maier, O. Operational profiling of temperature using ground-based microwave radiometry at Payerne: Prospects and challenges. Atmos. Meas. Tech. 2012, 5, 1121. [Google Scholar] [CrossRef]
  29. Hersbach, H.; Bell, B.; Berrisford, P.; Biavati, G.; Horányi, A.; Muñoz Sabater, J.; Rozum, I. ERA5 hourly data on pressure levels from 1940 to present. Copernic. Clim. Chang. Serv. Clim. Data Store 2023. [Google Scholar] [CrossRef]
  30. Dee, D.P.; Uppala, S.M.; Simmons, A.J.; Berrisford, P.; Poli, P.; Kobayashi, S.; Andrae, U.; Balmaseda, M.A.; Balsamo, G.; Bauer, P.; et al. The ERA-interim reanalysis: Configuration and performance of the data assimilation system. Q. J. R. Meteorol. Soc. 2016, 137, 553–597. [Google Scholar] [CrossRef]
  31. Sorteberg, A.; Kattsov, V.; Walsh, J.E.; Pavlova, T. The Arctic surface energy budget as simulated with the IPCC AR4 AOGCMs. Clim. Dyn. 2007, 29, 131–156. [Google Scholar] [CrossRef]
  32. Tjernström, M.; Graversen, R.G. The vertical structure of the lower Arctic troposphere analysed from observations and the ERA-40 reanalysis. Q. J. R. Meteorol. Soc. 2009, 135, 431–443. [Google Scholar] [CrossRef]
  33. Jakobson, E.; Vihma, T.; Palo, T.; Jakobson, L.; Keernik, H.; Jaagus, J. Validation of atmospheric reanalyses over the central Arctic Ocean. Geophys. Res. Lett. 2012, 39, 10802. [Google Scholar] [CrossRef]
  34. Lindsay, R.; Wensnahan, M.; Schweiger, A.; Zhang, J. Evaluation of seven different atmospheric reanalysis products in the Arctic. J. Clim. 2014, 27, 2588–2606. [Google Scholar] [CrossRef]
Figure 1. (a) Geophysical location of Shanghuang site marked with a big red dot and (b) a photo of the site. The black grids in (a) indicate the ERA5 reanalysis gridden data, and the surrounding small red dots are the main cities around the observatory. (c,d) The Doppler wind lidar (Windcube 100s, Leosphere, France) and the microwave radiometer (RPG-HATPRO-G5, Radiometer Physics GmbH, Meckenheim, Germany) placed at the Shanghuang site.
Remotesensing 16 00548 g001
Figure 2. Time series (a1f1) and scatter plots (a2f2) of the observed horizontal wind speeds at various heights compared with the ERA5 reanalysis data values. The zoomed-in time series of 2 and 3 June 2023 were selected for comparison, with the red and blue lines representing the horizontal wind speeds from ERA5 and Doppler wind lidar, respectively. The areas circled by ellipses are the locations of wind speed changes during extreme weather and heavy rainfalls.
Remotesensing 16 00548 g002aRemotesensing 16 00548 g002b
Figure 3. Same as Figure 2, but for vertical wind speeds at different heights. Time series (a1f1) and scatter plots (a2f2) of the observed vertical wind speeds at various heights compared with the ERA5 reanalysis data values. The zoomed-in time series of 2 and 3 June 2023 were selected for comparison, with the red and blue lines representing the vertical wind speeds from ERA5 and Doppler wind lidar, respectively. The areas circled by ellipses are the locations of vertical wind speed changes during extreme weather.
Remotesensing 16 00548 g003aRemotesensing 16 00548 g003b
Figure 4. (a1f1) Wind rose plots of mean wind speed observations in 16 directions at each height compared to the ERA5 reanalysis data; (a2f2) scatter plots of wind direction observations at each height compared to the ERA5 wind directions.
Remotesensing 16 00548 g004aRemotesensing 16 00548 g004b
Figure 5. Same as Figure 2, but for the temperature at different heights. Time series (a1i1) and scatter plots (a2i2) of the observed temperature at various heights compared with the ERA5 reanalysis data values. The zoomed-in time series of 2 and 3 June 2023 were selected for comparison, with the red and blue lines representing the temperature from ERA5 and MWR, respectively. The areas circled by ellipses are the locations of temperature changes during extreme weather.
Remotesensing 16 00548 g005aRemotesensing 16 00548 g005b
Figure 6. Same as Figure 2, but for the relative humidity (RH) at different heights. Time series (a1i1) and scatter plots (a2i2) of the observed relative humidity at various heights compared with the ERA5 reanalysis data values. The zoomed-in time series of 13 and 15 July 2023 were selected for comparison, with the red and blue lines representing the relative humidity from ERA5 and MWR, respectively. The areas circled by ellipses are the locations of relative humidity changes during extreme weather.
Remotesensing 16 00548 g006aRemotesensing 16 00548 g006b
Figure 7. Mean deviations of ERA5 and remote-sensing observations for (a) horizontal wind speed (HWS), (b) vertical wind speed (VWS), (c) wind direction (WD), (d) temperature (T), and (e) relative humidity (RH) for May–July 2023.
Remotesensing 16 00548 g007
Disclaimer/Publisher’s Note: The statements, opinions and data contained in all publications are solely those of the individual author(s) and contributor(s) and not of MDPI and/or the editor(s). MDPI and/or the editor(s) disclaim responsibility for any injury to people or property resulting from any ideas, methods, instructions or products referred to in the content.