1. Introduction
The field of remote sensing image classification holds a pivotal position in various application domains, including disaster detection [
1], land use analysis [
2], and environmental monitoring [
3]. Early remote sensing scene classification methods predominantly relied on manually crafted features, encompassing texture features, structural features, and spectral features [
4]. Correspondingly, a multitude of models based on these features emerged, such as the Bag of Words (BoWs) model [
5] and sparse coding models [
6]. Their fundamental strategies often revolved around enhancing or reducing certain aspects of the image, such as increasing the sparsity of features or reducing redundant image portions, aiming to improve classification performance. These methods are characterized by their simplicity and efficiency [
4,
7]. However, as the demand for improved performance has grown, these methods have shown limited feature representation capabilities and low utilization efficiency of data information, constraining their effectiveness in practical applications.
With the rapid evolution of parallel computing resources and advancements in artificial intelligence theory, deep learning algorithms have become the predominant trend in remote sensing image classification [
8,
9,
10]. This approach involves using deep encoders, convolutional neural networks (CNNs), and similar architectures for end-to-end feature extraction, followed by analysis and processing using appropriate decoders. Several notable advancements have been made in model optimization. For instance, Chen et al. [
11] integrated local convolutional attention modules into the backbone network, resulting in significant target-highlighting effects in complex background remote sensing images. Ma et al. [
12] introduced network evolution, training, and searching for better network structures using various remote sensing image datasets. Wang et al. [
13] employed a target–background separation strategy, using background information beyond the effective target as decision support to enhance distinguishability between target similarity and background difference samples. They also combined texture and morphological features to guide feature learning, effectively reducing the impact of intraclass differences.
In practice, optimizing network architectures significantly enhances performance, assuming sufficient labeled data for structural training optimization. However, a major challenge in remote sensing scene classification is the scarcity of annotated data for model training, especially when faced with tasks involving unseen scene types. Few-shot learning, focusing on a limited number of samples, has gained prominence in addressing this challenge. The primary hurdle in few-shot learning is enabling deep models to quickly learn and infer from a small number of samples without extensive training on large-scale datasets [
14,
15,
16].
There are two primary approaches to few-shot learning: meta-learning [
17] and metric learning [
18]. Meta-learning trains classifiers for quick adaptation to new tasks by sharing knowledge across multiple tasks, enhancing few-shot learning. In high-resolution satellite image scene classification, Zhai and colleagues introduced a lifelong few-shot learning approach [
19], enabling easy adaptation to new datasets. Li et al. [
20] improved intertask relevance by integrating more historical prior knowledge from partial intratask sequences. They also introduced a graph transformer to optimize the distribution of sample features in the embedding space. In contrast, similarity-based methods or metric learning methods are simpler and more effective. The core idea is to cluster similar samples and disperse dissimilar ones by measuring sample similarity. Deng et al. [
21] proposed a deep metric learning-based feature embedding model using the nearest neighbor (NN) algorithm as a classifier, addressing classification tasks for high-spectral remote sensing images within and across scenes. Li et al. [
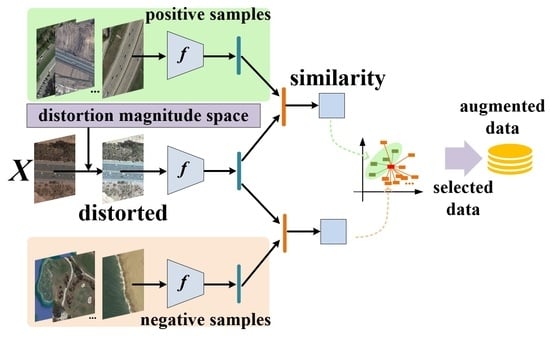
22] introduced an adaptive matching network, concatenating support and query set discriminative features and assigning similarity scores to sample pairs. This method captures a more comprehensive range of image information and cues. The challenge for these methods lies in better representing sample features and measuring class similarity. They need to address the limitations of sample features and potential issues in handling similarity metrics, as shown in
Figure 1.
Previous studies confirm that effective data augmentation in few-shot learning significantly improves classification accuracy [
23]. Data augmentation methods offer advantages by minimizing additional computational costs and being less constrained by training/testing framework designs. In addition to traditional techniques like rotation and color adjustments, researchers have innovated various augmentation methods, broadly categorized into two types. One type involves data generation. For instance, Antoniou et al. [
24] introduced the data augmentation generative adversarial network (DAGAN) model. It extracts image data from a source domain, projects it into a lower-dimensional vector with an encoder, and concatenates the transformed random vector with a decoder to generate augmented images. Li et al. [
25] proposed the adversarial feature hallucination network (AFHN) model, utilizing generative adversarial networks (cWGANs) for dataset expansion in few-shot learning. This model enhances discriminative capability and diversity by adding a classification regularizer and an anticollapse regularizer. Subedi et al. [
26] presented a GAN-based data augmentation approach generating high-quality training data. Featuring an additional binary classifier in data and feature spaces, this approach controls the generator for optimized training data, improving classification performance. Chen et al. [
27] simultaneously employed GAN and U-Net models to create medical images with additional information, elevating few-shot classification task performance. However, a challenge with such methods is the instability in the contribution of generated features to classification performance. The difficulty arises from evaluating whether the newly generated features possess adequate discriminability. Task-specific regularization may lead to the collapse of the synthesis process, resulting in a lack of diversity in generated samples [
28].
The other type of method is based on feature enhancement, forming the foundation of this work. These methods assume that knowledge about relationships between samples within known visible categories can be acquired and transferred to unseen categories. Successfully establishing cross-associations between visible categories and learning these relationships allows the application of the knowledge to handle unseen categories with only a few labeled samples. Researchers believe that by increasing sample diversity, we can expand intraclass differences and better define classification boundaries between different categories [
29]. Following this rationale, Chen et al. [
30] proposed a semantic feature enhancement algorithm. This algorithm utilizes an encoder–decoder model to map samples to a semantic space, learning concepts of samples in the semantic space. By adding noise, extending samples in the semantic space, finding nearest neighbors, and mapping them back to the visual space, the algorithm achieves effective sample augmentation. Alfassy et al. [
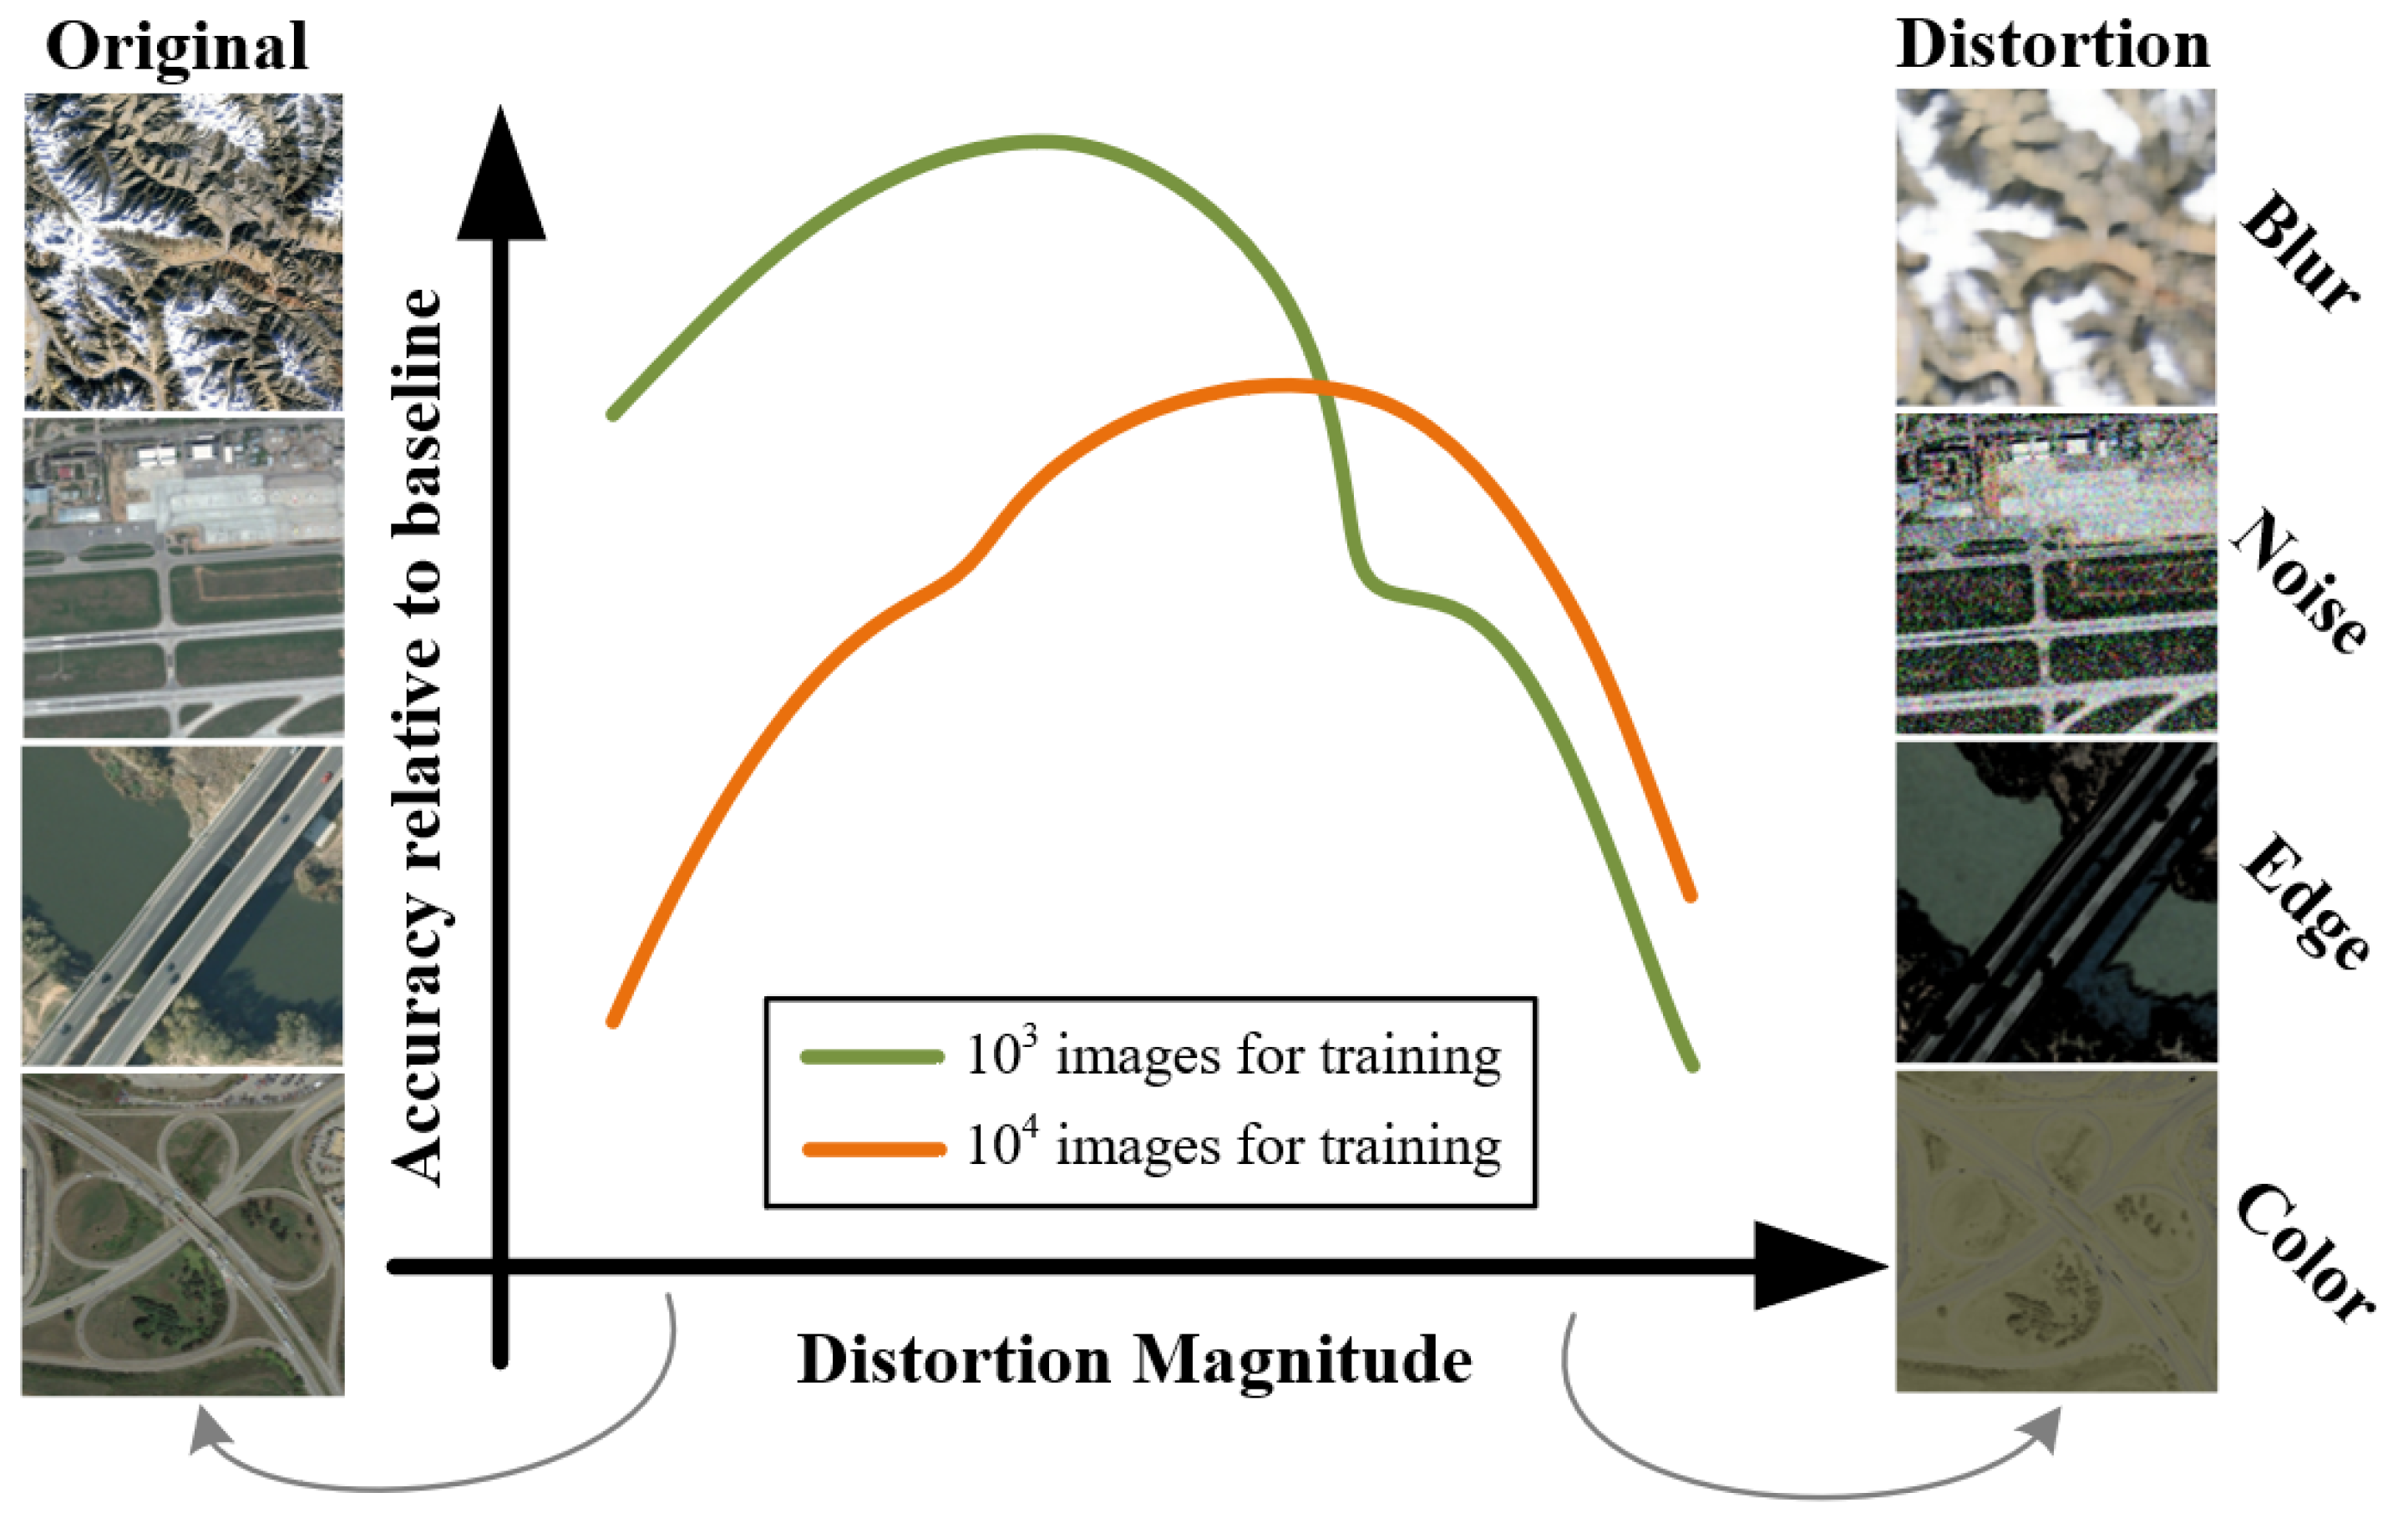
31] introduced a label-set operations (LaSOs) network for multilabel few-shot image classification tasks. LaSOs leverage relationships between label sets to extract potential semantic information, forming data augmentation at the feature space level. Such approaches introduce varying degrees of distortion to data, making it crucial to ensure that distorted samples maintain or increase discernibility; otherwise, achieving ideal classification performance becomes challenging. On the other hand, accurate delineation of classification decision boundaries depends on sufficient intraclass variance in labeled samples. Therefore, the process of feature enhancement can be understood as actively adding distortion to original features, with these distortions having limitations. Excessive distortion may lead to the loss of discernibility in numerous newly introduced features, increasing the risk of underfitting [
32], as illustrated in
Figure 2. The impact of image distortion levels on classification accuracy varies when different numbers of images are used for training (e.g., 10
3 and 10
4). The training data are randomly extracted in proportion, and the horizontal axis represents the distortion magnitude level, while the vertical axis shows the ratio of classifier accuracy when using additional distorted data compared to not using it.
It is noteworthy that frameworks or data optimization methods for specific tasks often lack generalizability [
33,
34]. Currently, a more universally applicable solution is the use of learned data augmentation policies [
35]. The limited adoption of these methods is primarily due to the mostly discrete nature of the search space they construct. Each subpolicy within this space brings inconsistent gains to the model, with variations even far apart. Hence, the generation of these policy combinations is inherently challenging to generalize. Additionally, achieving optimal parameters involves independent and costly search and learning stages, resulting in unstable performance gains [
36].
For remote sensing images, few-shot classification tasks are significantly more challenging than those for ordinary object images. Remote sensing images have lower resolutions, less detail, and are more prone to confusion between images, making it relatively difficult to define interclass boundaries. In this work, to maximize the improvement of interclass boundaries in few-shot learning tasks, we first explored the impact of different types of feature distortions on learning and introduced a method to construct a continuous distortion space. Subsequently, we combined feature enhancement with metric learning, incorporating the distortion magnitude of features into the metric learning process. Through this amalgamation, we tried to construct a classification framework with a better generalization performance through the acquirement of more discriminable additional features and the support of an optimized learning network.
The specific contributions of this paper are as follows:
For few-shot classification tasks in remote sensing images, we propose a data augmentation method based on distortion magnitude optimization. The core idea of this method is to introduce appropriate shifts in the feature space for limited samples across a distortion magnitude space, thereby probing and reconstructing interclass boundaries. This approach assimilates the strengths of feature enhancement and metric learning methods. By constructing a multidimensional feature distortion space and segmenting the search for distortion magnitude, it efficiently identifies the optimal distortion magnitude;
We propose a dual-path classification strategy that optimizes the classification process by dynamically adjusting decision weights. This strategy is particularly suitable for few-shot classification tasks in remote sensing images, as it simultaneously considers the feature information provided by the overall sample distribution and individual samples, significantly reducing the probability of classification errors.
2. Proposed Method
The proposed methodology comprises three integral components: optimal distortion search, feature distortion space construction, and dual-path classification strategy. The optimal distortion search is employed to acquire samples with more discernible features, while the construction of the distortion magnitude space provides feature references for the optimization search. Ultimately, the dual-path classification strategy is employed to manage a more effective classification of augmented data.
2.1. Optimal Distortion Search
Assuming the current problem is a
k-way,
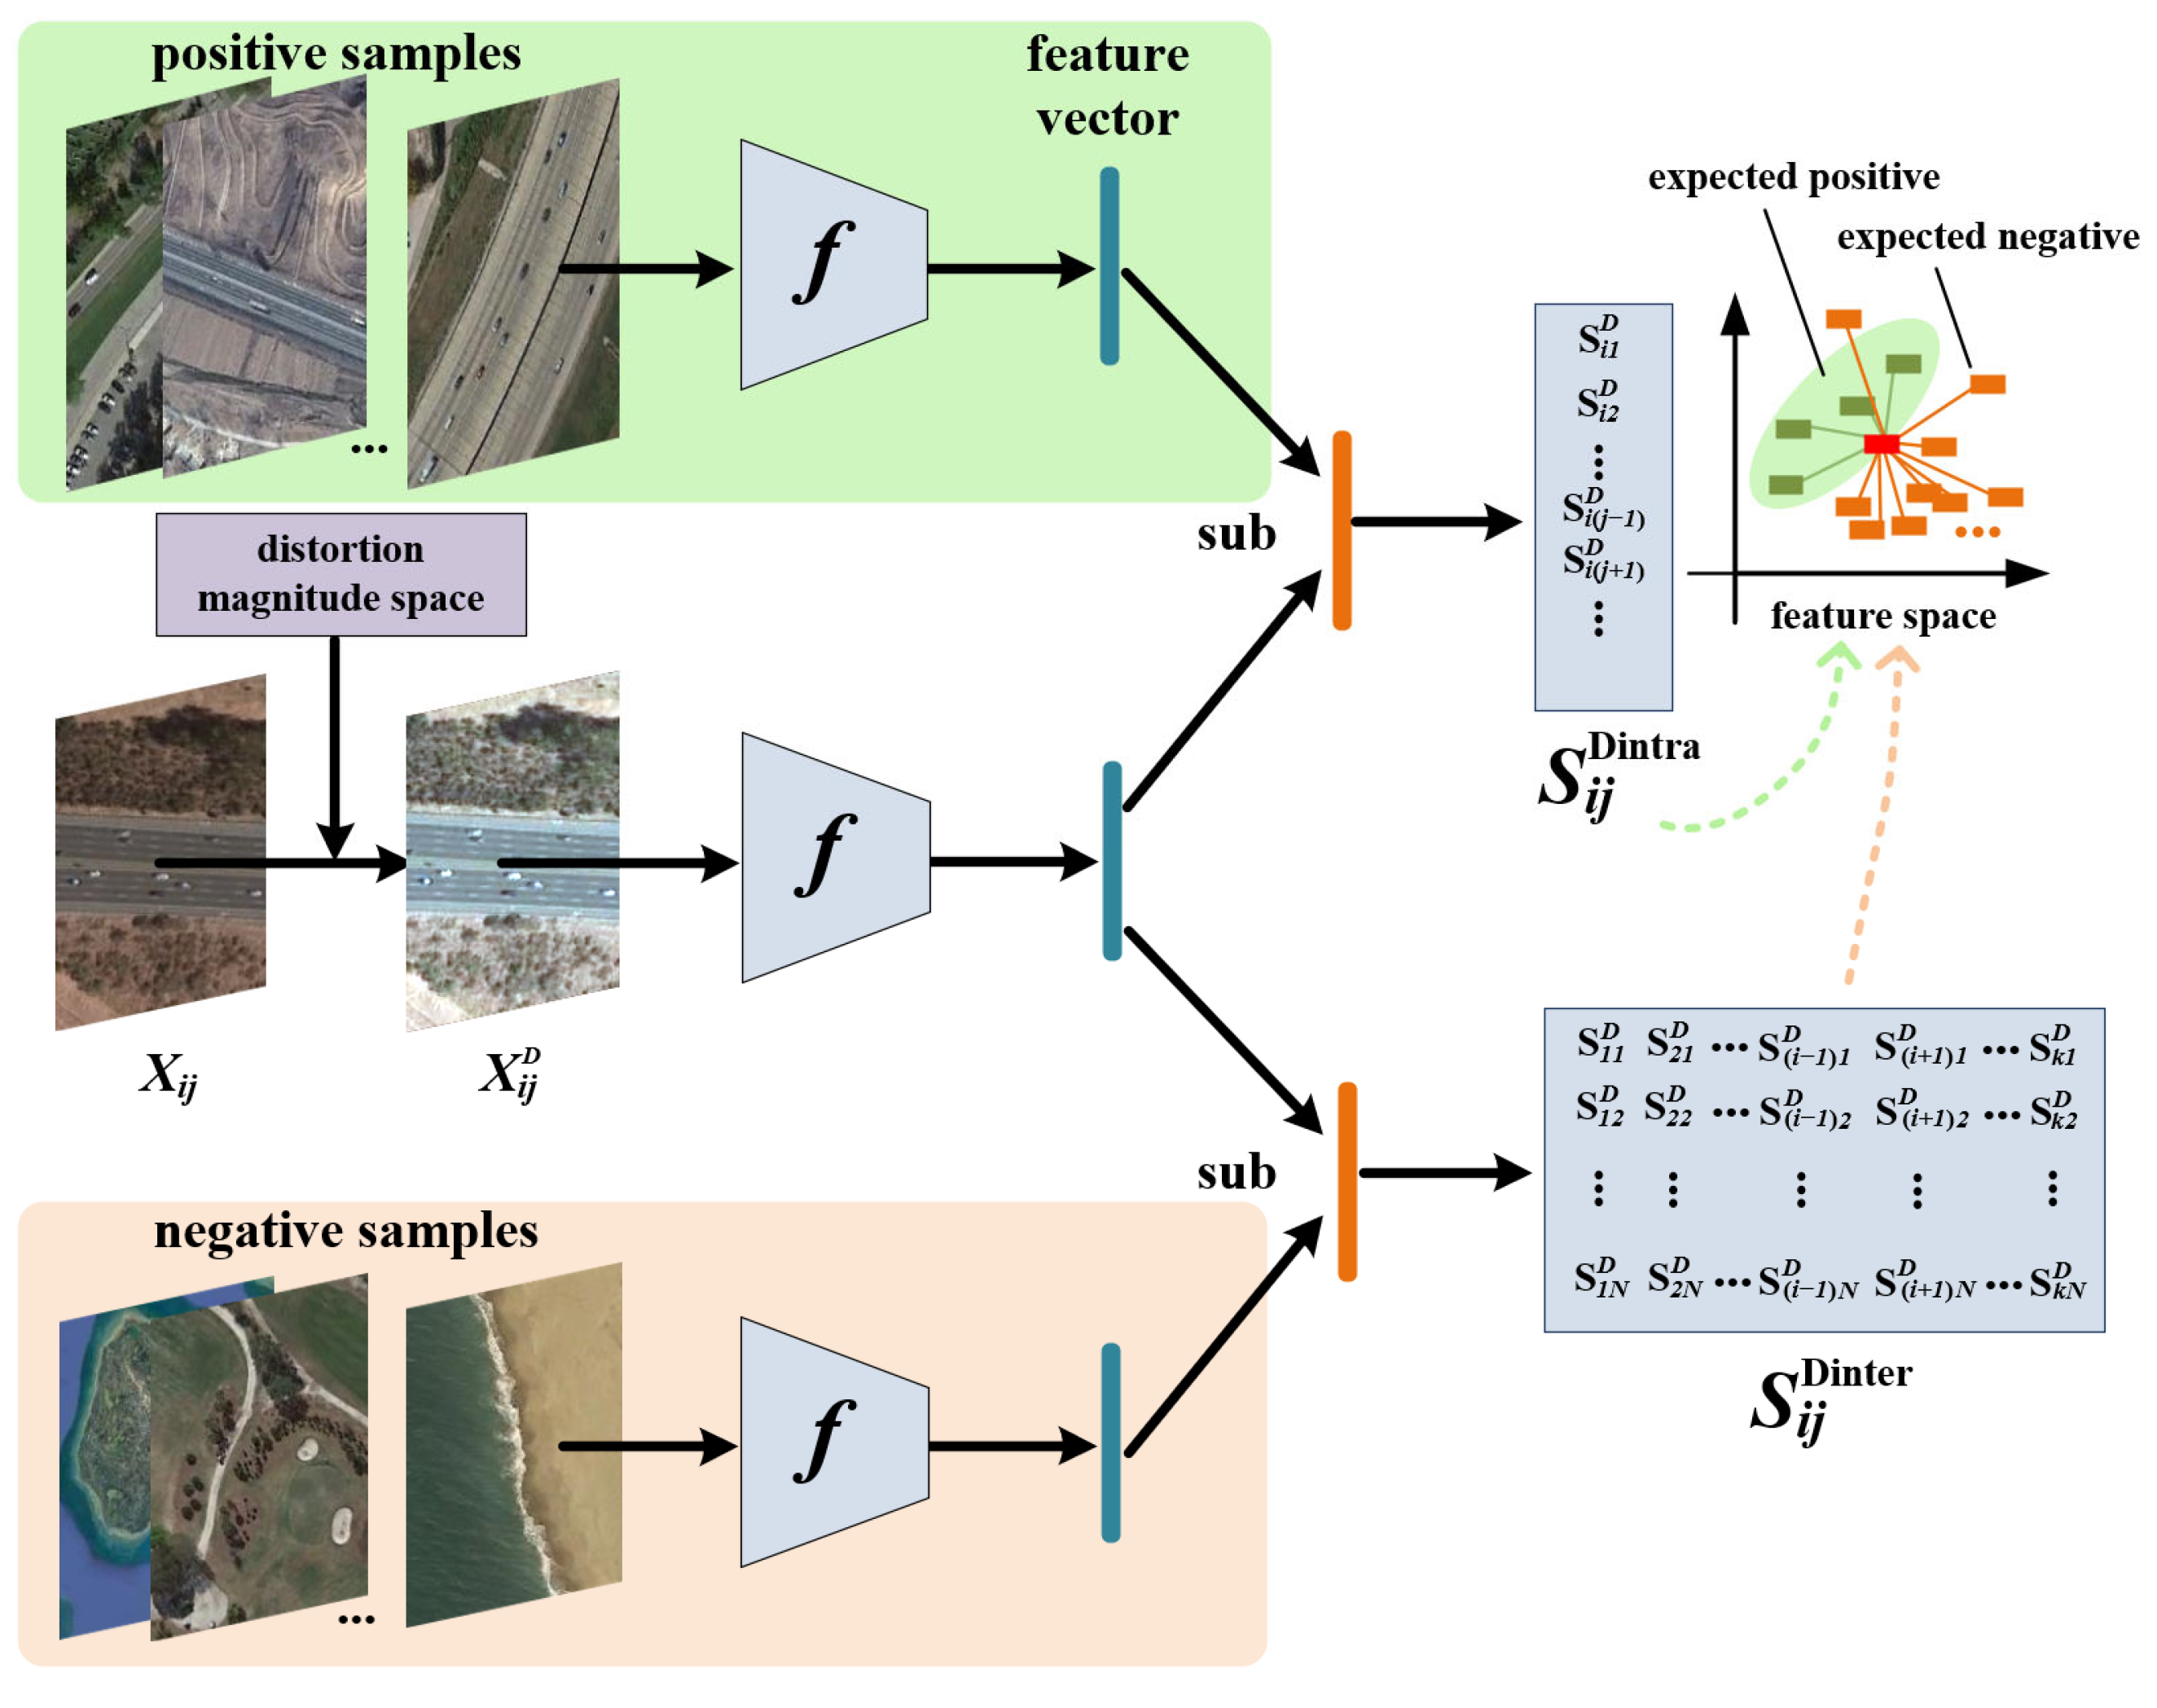
N-shot task, the overall framework of the optimal distortion search (ODS) is represented in
Figure 3, where
Xij denotes a specific image’s data in the support set, and
represents the image after feature distortion. The core idea of this method is to introduce additional distortion to the sample features provided by the support set, allowing these features to generate appropriate shifts in the feature space.
In the initial stages of the method, we need to obtain a similarity matrix
Sij for each sample in the support set with all other samples. Here,
i and
j represent the indices of images in the support set,
S represents the similarity between image pairs, and f denotes a convolutional neural network. From this matrix, we can find the maximum and minimum values of intraclass similarity
for each sample, as well as the maximum and minimum values of interclass similarity
. Similarly,
and
, respectively, represent the similarity matrices between the current distorted sample and samples of the same class and other classes, which can be represented as follows:
Depending on the magnitude of the distortion, the feature vectors of the distorted samples may exhibit a significant shift from their original positions. Therefore, during the process of updating the distortion parameters, it is essential to impose reasonable constraints on this range. Therefore, we set
and
as the expected target values to achieve for
Sij. In previous few-shot learning methods, these two parameters were often set to 0 and 1, but in the distortion magnitude search process, such settings can lead to issues. For example, it may result in distorted sample features being too close to the original features, rendering the distortion itself meaningless. So, in our approach, we uniformly set the threshold for
to be 0.7 (set to 0.7 if it falls below this value) and the threshold for
to be 0.3 (set to 0.3 if it exceeds this value). This choice aims to ensure that the distortion of features increases the similarity between the current image and the sample with the minimum intraclass similarity while decreasing the similarity with the sample with the maximum interclass similarity. This way, the feature vector of the distorted image can approach the intraclass boundary as closely as possible while staying far away from the feature boundary of other sample classes in the support set. The loss function in the optimization process is defined as follows:
This framework shares the same feature extractor f and fully connected layers with the earlier pretrained model. During the distortion magnitude search process, we need to freeze all the parameters of f and the fully connected layers until the entire distortion-based augmentation operation is complete. Once the search is finished, the final values of the distortion magnitudes will be directly used for data augmentation. These data, after undergoing feature distortion, will form a new support set along with the basic geometric transformation-based data augmentation (rotation, random clip, etc.). The augmented support set will provide data features that occupy more positions in the feature space compared to the original features, and the mean feature vector of individual classes will also exhibit varying degrees of shift.
2.2. Construction of Feature Distortion Space
In contrast to methods based on AutoAugment [
36], the premise of the method proposed in this paper is to start with specified data augmentation strategies and then optimize their inner attributive parameters based on these strategies. Therefore, to search for the optimal distortion magnitudes, it is essential to construct an appropriate magnitude space. The preset distortion magnitude values are stored in registers, and as the iterative process proceeds, the current parameters are continuously updated based on the loss value. The last updated magnitude parameters represent the best magnitude for feature enhancement.
In the edge distortion section, we use simple operators (such as the Sobel operator) to first extract the edge information from the original image and then perform a dilation operation on the edges of the image. The size of the dilation matrix is D × D, which determines the degree of thickening of the shape edges. Based on empirical evidence, the range of D is set within D ∈ [1, 8]. This parameter will be involved in the learning process.
For texture distortion, we refer to the six attributes of texture features proposed by Tamura et al. [
37] (i.e., contrast, coarseness, directionality, regularity, linearity, and roughness, with the first three being more significant in feature representation). We use the addition of random pixel grains to control the roughness of the image. The parameter involved in the search process is the granularity level
P, with
P representing the number of times random pixels are added. Before adding, we can set the number of pixels to be added and the size of the pixel blocks artificially. The benefit of this approach is that it simplifies the model and makes the enhancement magnitude controllable.
To simplify the calculation in the color distortion section, we randomly (or at evenly spaced intervals) set C color combinations of RGB channels. In other words, we select values from the RGB channels to form C different combinations. In this section, there are C updatable values that determine the color.
This approach allows us to establish a discrete distortion magnitude space, denoted as Φ = (D, P, C). Assuming P = 20 and C = 10, this results in a potential pool of 8 × 20 × 10 different distortion magnitude combinations. It is worth noting that the aforementioned augmentation strategies may not necessarily represent the optimal choices, as there can be multiple strategies to choose from. Furthermore, these diverse strategies entail different parameters for representing the distortion magnitude. It is important to clarify that our research focuses on exploring the distortion magnitude space and does not encompass learning within the strategy space.
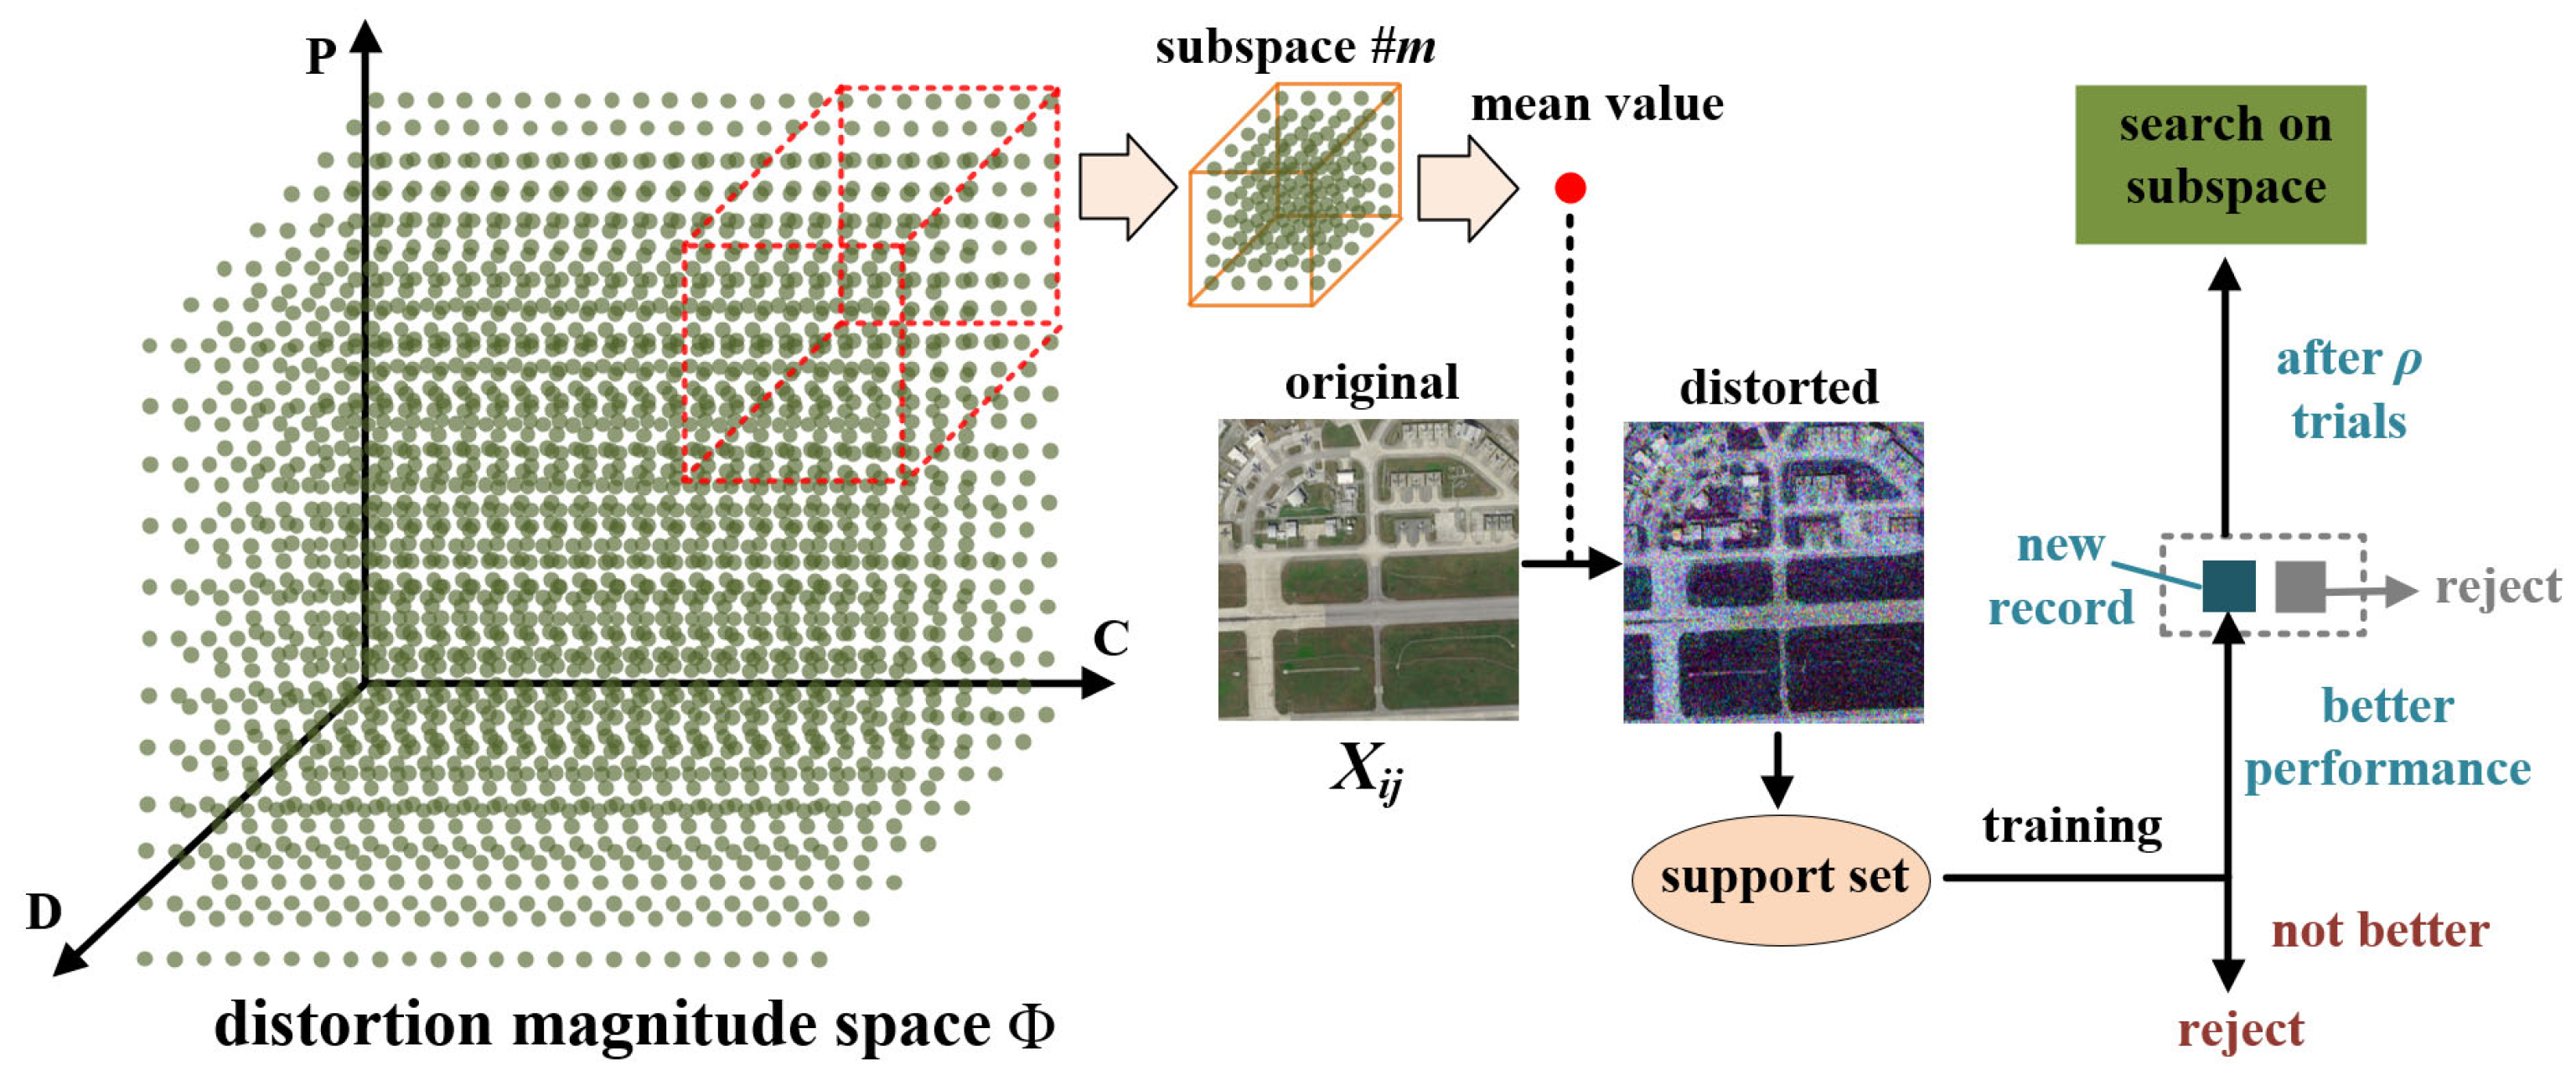
During the exploration process, we employ a segmented search strategy by dividing the magnitude values for each feature into
ρ subregions. The mean distortion magnitude from each subregion combination is introduced into the iterative process as the magnitude parameter. In each iteration, a set of distortion magnitudes for each feature is generated, which corresponds to a specific loss function,
Ld. Subsequently, within the subregion associated with the smallest
Ld, we conduct further searches. This subregion is then excluded, and the process is repeated iteratively.
Figure 4 visually illustrates this process, where
m denotes the index of the subspace. The best distortion magnitudes determined for
Xij during the current iteration are subsequently incorporated, replacing the original images in the support set for the next iteration. The value of
ρ can be tailored to the size of the distortion magnitude space. Through this approach, we efficiently realize dynamic feature distortion selection while streamlining the search process, considerably reducing computational overhead in the iterations.
2.3. Dual-Path Classification
Currently, the prevailing approach in few-shot classification involves comparing the query to the mean feature vectors of various classes within the support set. Cosine similarity has been demonstrated to be a highly effective method for measuring similarity [
38], and it is typically computed using the formula expressed in Equation (3). Here,
X represents the feature vector,
s denotes the support set, and
signifies the calculation of the L2 norm.
In conventional classification, the mean feature vector represents the overall characteristics of the current class, essentially acting as its centroid. However, in few-shot remote sensing image classification tasks, relying solely on the overall features may lead to the loss of distinctive characteristics contributed by individual samples. Furthermore, the negative impact of this situation becomes more pronounced as the number of intraclass samples increases [
39]. Through the effective feature expansion discussed in the previous two sections of this paper, each few-shot category now occupies a richer position in the feature space, providing clearer class boundaries. Based on this, we propose a dual-path classification (DC) strategy. The framework of this method is illustrated in
Figure 5. In the figure,
f denotes the feature extraction network, which remains entirely consistent with the one used in pretraining.
A and
B are the two-way classification output labels,
λA and
λB represent the weight parameters for the output probabilities, and
μ indicates the number of samples added for each class after regular augmentation and feature distortion processing.
After extracting the features of the support set samples following data augmentation, we introduce an additional branch on top of the existing training branch. The feature vectors of the support set samples, after entering this additional branch, bypass the mean operation and are directly used to calculate their similarity with the query’s feature vector, forming a similarity score matrix
M. In this matrix, the scores computed between all samples of the same class and the query are randomly shuffled within each row. Each column represents a set of randomly composed samples with all class labels and their calculated similarity scores with the query. In this score matrix, the label corresponding to the highest similarity score is considered the classification result for that branch. Equations (4) and (5) illustrate the calculation process for the two-way outputs.
Here, x represents the feature vector of the query image, stands for the mean feature vector of the label r, 〈∙〉 denotes cosine similarity calculation, is a vector within the set of feature vectors corresponding to the support set, labeled as r, and forms a pair with a random sample from each of the other categories. τ represents the temperature hyperparameter, where a lower value of temperature leads to lower entropy, concentrating the distribution in a few high-confidence positions.
To compare the classification effectiveness between the two branches through learning, we add weights
λA and
λB at the output of both the original classification branch and the new classification branch. These two weights satisfy
λA +
λB = 1, and their initial values are both set to 0.5. Before making the comparison, the vector formed by selecting the maximum element column in the matrix is normalized, resulting in
Ps as the normalized value of the maximum element in the matrix. During the process of sample learning, when the classification outcomes of the two branches are consistent with the labels, it indicates that both the mean features and the maximum similarity are effective. In this case, the weights remain unchanged. However, when one branch’s classification outcome matches the label, and the other does not, the weight of the correct branch increases, while the incorrect one decreases. Furthermore, when the judgment based on the mean feature is not effective, it should be replaced by the predictions based on the similarity among individuals. So, when the classification outcomes of both branches do not match the labels,
λA decreases while
λB increases. Given a support set, assuming that for each category, a sample is randomly chosen from the support set to form the query set, the query set has a total of (
N +
μ) samples, and the support set contains (
k − 1) × (
N +
μ) samples for training. To encourage competition between branches A and B, we set the loss functions for the training of the A and B branches as follows:
In the equation,
yj represents the label of the sample, and the overall loss function of the network is defined as
L =
λA LA +
λB LB. By optimizing L using gradient descent, end-to-end training of the network can be achieved. The weight parameters are updated based on the learning rate, with each update magnitude being (
γ ×
lr), where
γ is a learning rate coefficient. During training, the value of
γ is set based on the number of samples in the support set, typically with smaller values for larger support sets. Additionally, to ensure that the parameters are initialized in an appropriate state, we initially conduct extra pretraining on the original A branch (without weight parameter
λA) using the augmented support set [
40]. Finally, the training is completed by combining both the A and B branches.
3. Experimental Results and Discussions
In this section, we first employed the three data augmentation methods mentioned in
Section 2.2 to construct the distortion magnitude space. We evaluated the benefits of the distortion-based data augmentation method combined with the dual-path classification strategy for few-shot learning models. The datasets used for our experiments include the UCMerced Landuse dataset (UCM) [
41], the Aerial Image dataset (AID) [
42], and the NWPU-RESISC45 Remote Sensing Image Scene Classification dataset (NWPU) [
43]. Finally, we conducted ablation experiments and analyzed the impact of feature distortion magnitude space dimensions on model improvements.
3.1. Dataset Description and Preprocessing
The UCM, AID, and NWPU datasets used in this study are publicly available general remote sensing image datasets. The UCM dataset originates from the National Map Urban Area Imagery series of the United States Geological Survey, offering labeled examples of diverse categories within typical urban remote sensing scenes. The AID, unveiled by the Huazhong University of Science and Technology and Wuhan University, constitutes an extensive aerial image dataset compiled from samples extracted from Google Maps imagery. The NWPU dataset, released by Northwestern Polytechnical University, stands as an openly accessible dataset showcasing notable variations across scene samples concerning translation, spatial resolution, and other factors.
Table 1 provides the specific details for each of them.
In our experiments, each remote sensing scene in the datasets was divided into three sets. Specifically, in the UCM dataset, we randomly selected 11 categories as the training set, 5 categories as the validation set, and 5 categories as the test set. Similarly, in the AID dataset, we randomly selected 16, 7, and 7 categories, and in the NWPU dataset, we randomly selected 23, 11, and 11 categories for training, validation, and testing, respectively. Our model was trained on two of these subsets and evaluated on the remaining one in a cross-validation fashion. For each testing task, we randomly sampled five scenes from the test set to simulate five new remote sensing scenes as encountered in the real world. Each scene was assigned only one or a few labeled samples for the scene classification task.
3.2. Experimental Settings
The experiments were conducted on a computer with an Intel(R) Core(TM) i5-13600KF CPU, with 64GB of RAM and an Nvidia GeForce RTX 3080Ti GPU. The distortion space parameters were set to D = 8, P = 20, and C = 12. For the purpose of comparison, we employed ResNet-12 as the backbone network and initialized the similarity function with pretraining on the UCM, AID, and NWPU datasets.
Before training, all image pixels were resized to 256 × 256. The hyperparameters τ and γ were set to 50 and 5, respectively. The initial learning rate was 0.001, the batch size was set to 32, and the number of epochs was set to 800. We utilized stochastic gradient descent (SGD) for optimization during both the pretraining and metric learning phases. During the first 200 epochs, only the original A branch was trained, and in the subsequent 600 epochs, the A and B branches were jointly trained. The learning rate was decayed by a factor of 0.5 every 100 epochs. Additionally, the traversal order within the distortion space was D, P, and C, with each parameter exploring its range from small to large. The reported classification accuracy results in all experiments are the averages of the accuracy results from 100 randomly sampled subsets from the test set, with a 95% confidence interval.
3.3. RS Scene Few-Shot Classification Results and Analysis
Figure 6 illustrates the change in accuracy during the distortion magnitude search process. A maximum accuracy value was recorded after every 200 attempts. If this accuracy was higher than the previously recorded maximum, it was updated as the current accuracy; otherwise, it remained unchanged. The solid line represents the mean accuracy obtained from 100 complete search processes, each utilizing different support sets randomly extracted from the test set. The shaded region shows the range in which the 100 search operations’ curves appeared.
In the figures, we can observe that feature-based data augmentation significantly impacts the classifier’s performance. Simultaneously, the segmented search approach substantially shortens the search process. Regardless of the different support sets used, the proposed method in this paper consistently identifies the optimal distortion magnitudes.
Table 2 displays a comparison of the performance of the ODS method with advanced data augmentation models. It is evident that the proposed approach effectively leverages discriminative features, thereby enhancing the model’s generalization performance.
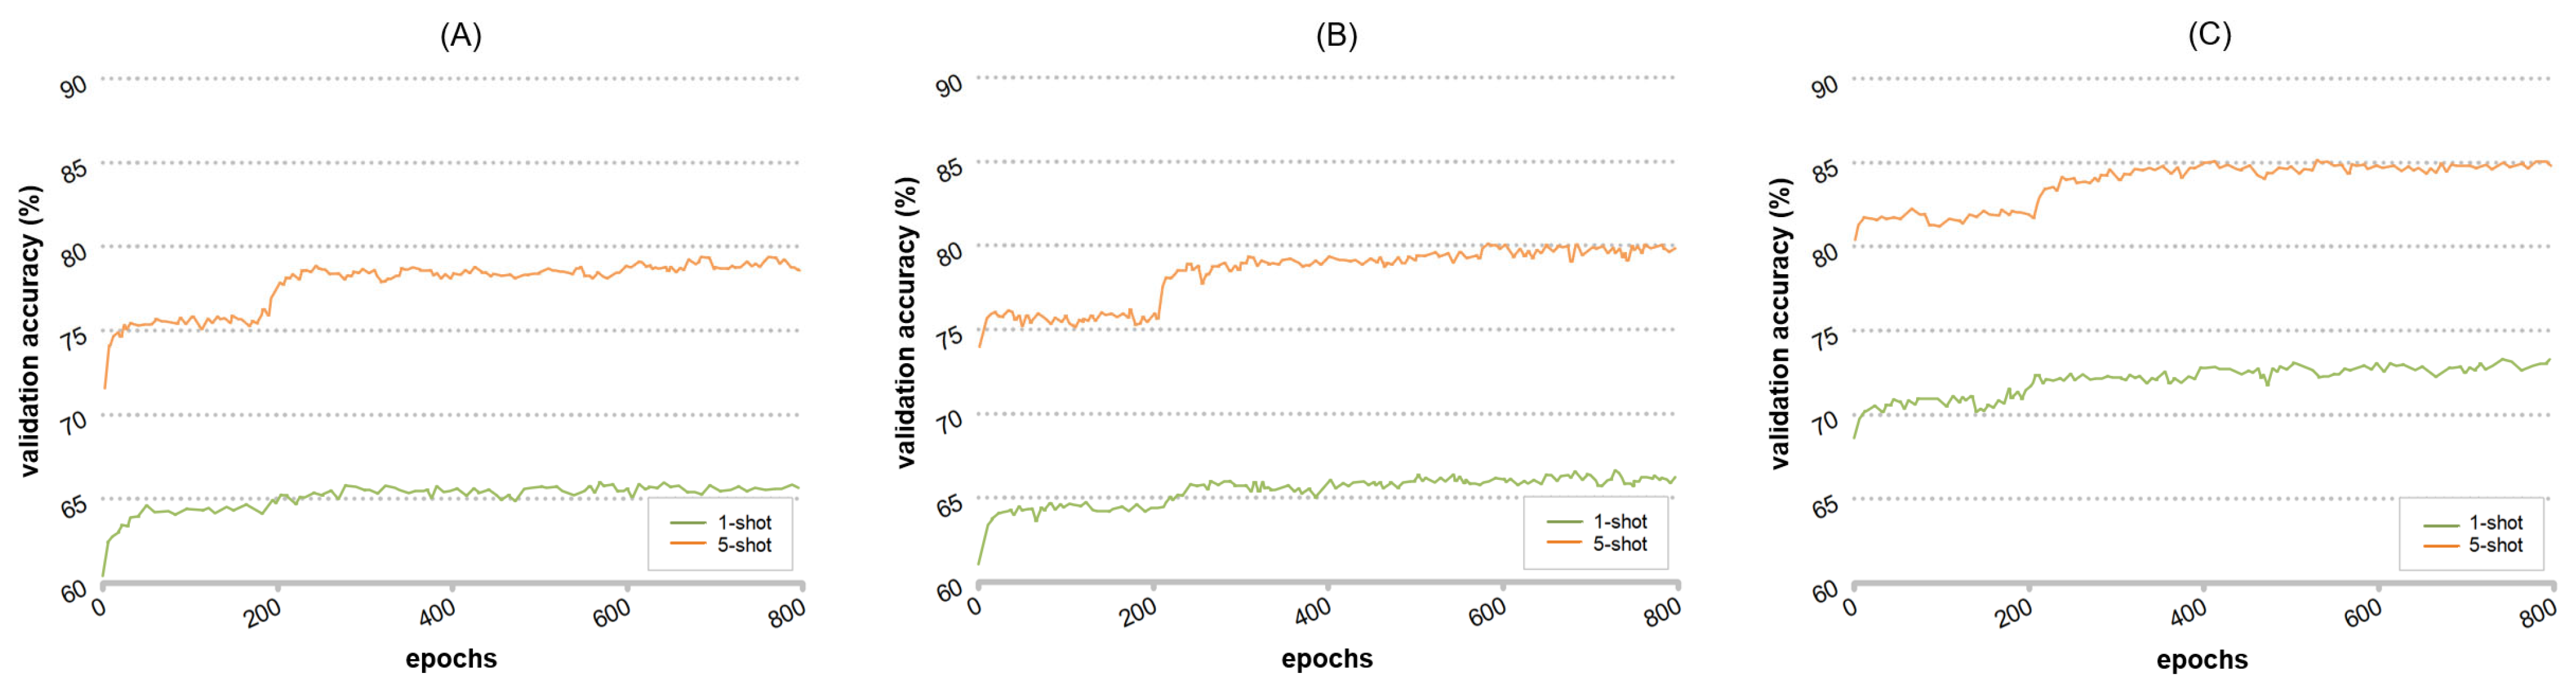
Figure 7 illustrates the variations in validation accuracy during the learning process of the dual-path classification network. It is evident that, in the training process of the five-way-five-shot scenario, the introduction of branch B significantly boosts the classification accuracy. Even in the five-way-one-shot training scenario, branch B provides performance gains. However, the five-shot curve demonstrates more pronounced gains compared to the one-shot scenario. Hence, in the context of few-shot classification, the greater the number of samples in the support set, the more pronounced the impact of ODS-DC on classification accuracy.
Table 3 presents a performance comparison between the method proposed in this paper and currently advanced data augmentation-based few-shot learning methods. All the methods include data augmentation techniques such as random rotation, random cropping, and translation, and employ ResNet-12 as the backbone network for testing in a five-way scenario. It is evident that the method introduced in this paper outperforms other methods across the three widely used datasets.
In addition,
Table 4 illustrates the variation in classification accuracy when different backbone networks are employed as feature extractors. As observed from the table, using deeper feature extractors leads to significantly better classification performance. However, it is worth noting that backbone networks with more layers tend to be more complex and demand greater computational resources. For example, transitioning from Conv-4 to ResNet-12 increases the number of layers by threefold, resulting in substantial accuracy improvement. On the other hand, substituting ResNet-12 with ResNet-50, which increases the number of layers by more than fourfold, yields only a minor accuracy gain. Hence, for the method proposed in this paper, the choice of the backbone network is not solely based on having more layers but rather involves a comprehensive consideration of factors such as gains in accuracy, computational resource utilization, and the efficiency of method reproduction.
3.4. Ablation Study
We assessed the performance of ODS-DC under different combinations of feature distortions using the AID dataset.
Table 5 documents the average classification accuracy for each combination in the five-way few-shot classification. From the table, it is visually evident that the contribution of distortion optimization varies significantly for different types of features. Optimization of edge feature distortion yields the greatest performance gain, followed by texture features, with color features exhibiting the smallest gain. Moreover, as the dimension of feature distortion optimization increases, the model’s performance shows varying degrees of gain change depending on the combination of different feature types.
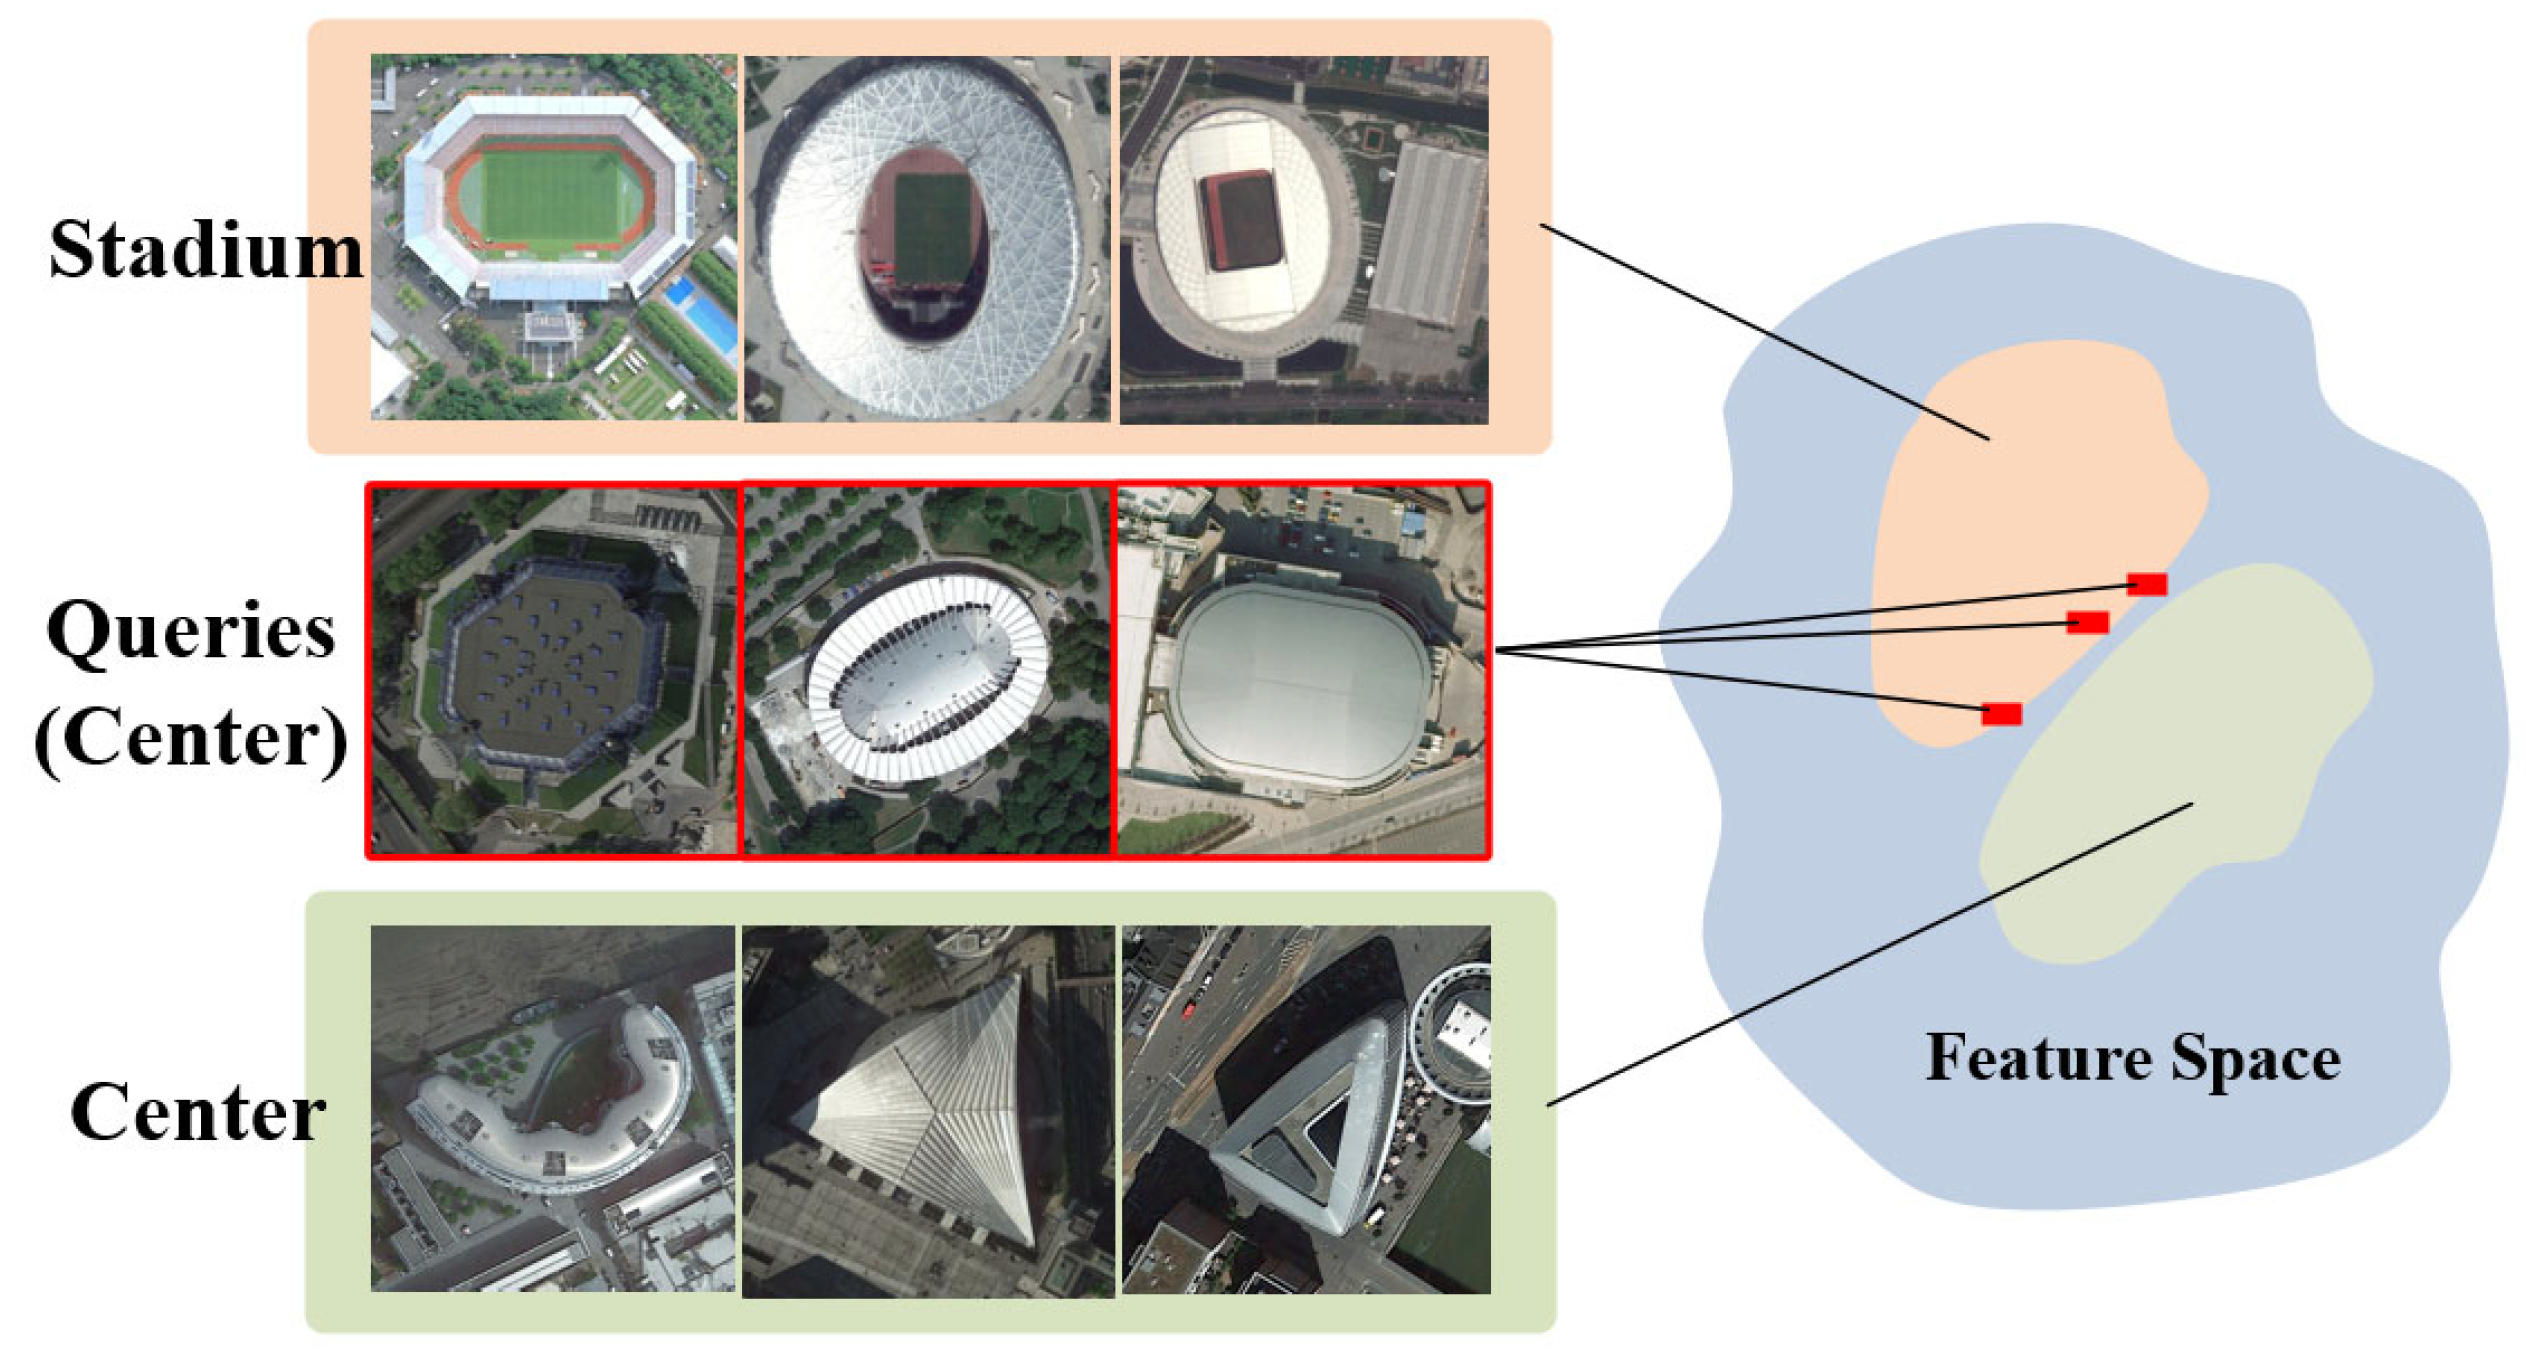
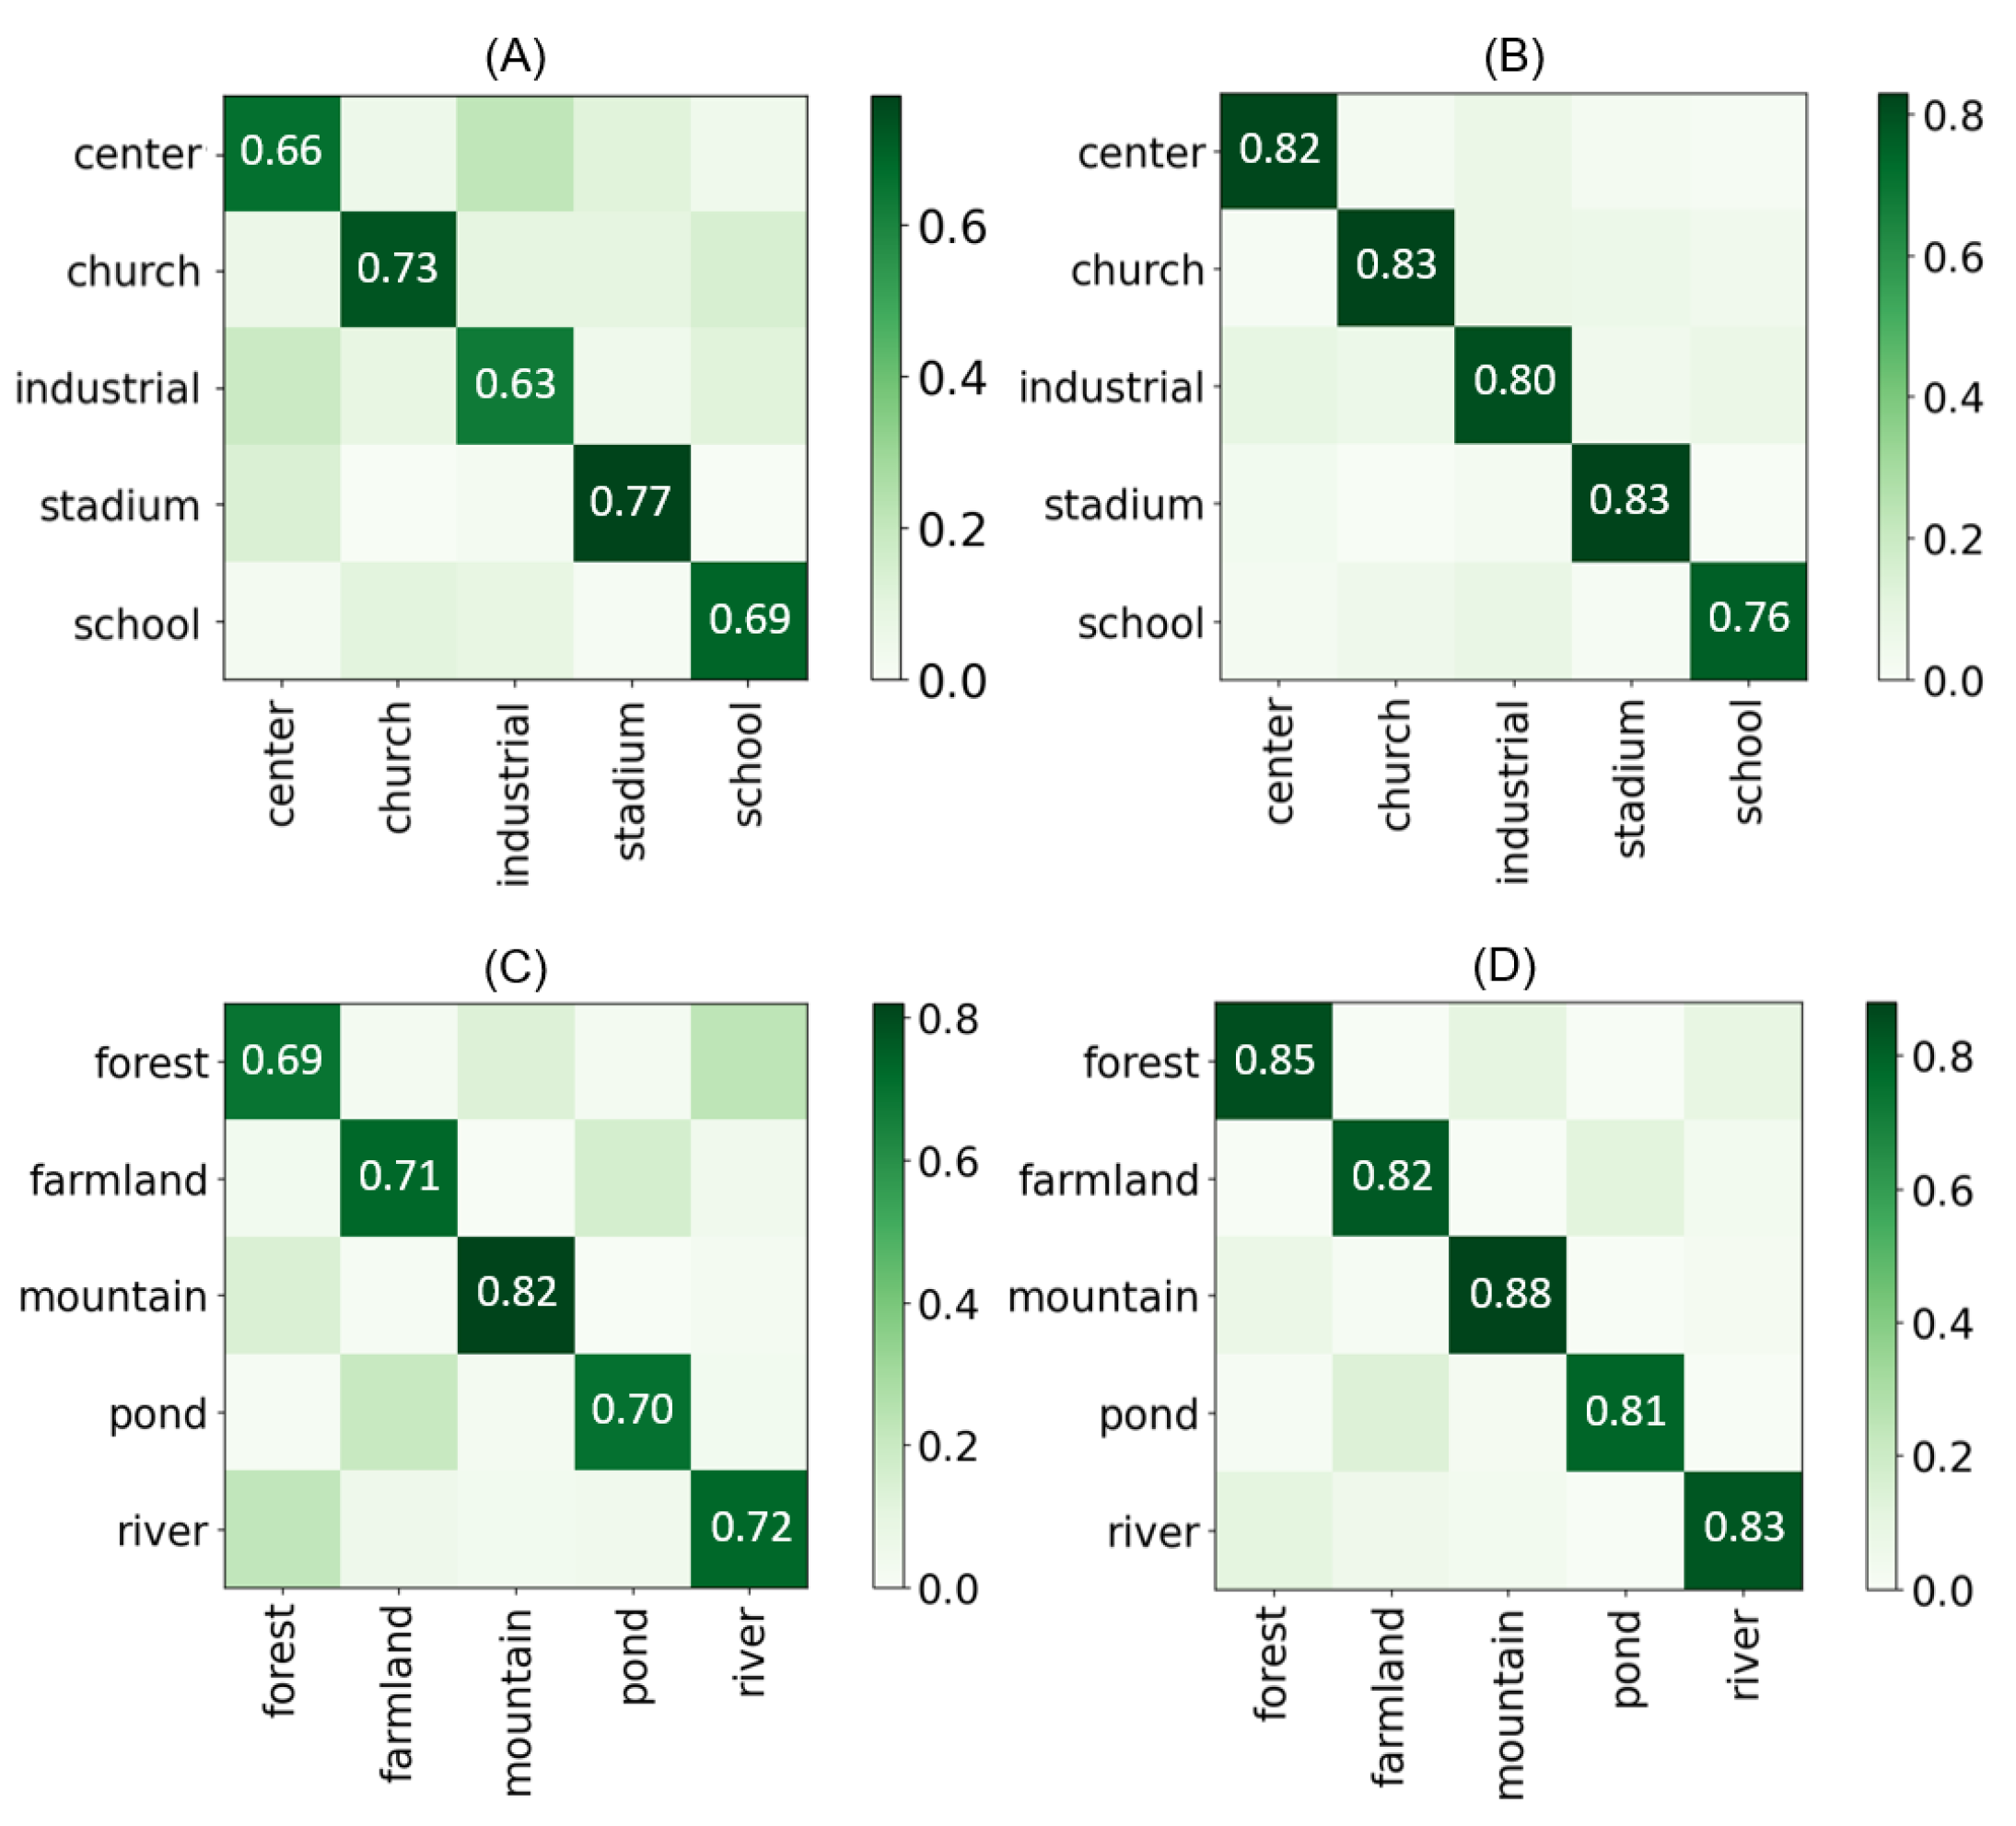
To better illustrate the benefits of the dual-path classification strategy, we compared the classification performance between the single path (without branch B and weighting coefficients) and the dual path by recording the classification accuracy for individual categories. Using the AID dataset as an example, we randomly selected five categories related to urban scenes and five unrelated to urban scenes for testing. Each category served as a query for few-shot classification, and after each round of classification for all test objects, a new round began by randomly selecting query images and a support set. This process continued for 200 rounds.
Figure 8 presents the confusion matrix of the ODS-DC model for these scene categories under both single-path and dual-path scenarios (five-way, five-shot). As observed from the figure, dual-path classification exhibits a significant improvement over the single path, with substantial variations in the degree of enhancement for each category. The differences in gains are primarily related to the selection of scene types, where specific scenes are more influenced by feature types that exhibit better discriminability. For instance, in the comparison between (A) and (B), the dual-path classification model achieves greater performance improvement in the “Center” category, where edge features are more prominent. However, in the comparison between (C) and (D), the “Forest” category, where texture features are more pronounced, exhibits the greatest improvement in accuracy.
Furthermore, to better capture the variations in the operational performance of the model, we assessed the framework’s average prediction time on the AID dataset under 1-shot, 5-shot, and 10-shot (5-way) scenarios. We randomly sampled 20 subsets of classes from the AID dataset for model training. Subsequently, using 100 randomly selected samples from each corresponding subset, we evaluated the model’s predictions after each training iteration.
Table 6 documents the average inference time for all sampled data under different configurations (95% confidence intervals included). Notably, dual-path classification exhibits a slight decrease in inference speed compared to single-path classification, and the model’s inference time significantly elongates with an increase in the number of samples in the support set, as evident from the table.
3.5. Discussion
Through the analysis of experimental results, the proposed ODS method demonstrates its effectiveness across three remote sensing scene datasets. In comparison to generative and policy-based approaches, ODS exhibits superior accuracy in five-way tasks with varying sample sizes. Notably, among the selected feature types, optimizing the distortion magnitude of edge features provides the model with the most significant gains. This suggests a substantial discrepancy in the contribution of distinguishable features generated by different types of feature distortions. Hence, exploring and optimizing combinations of distortion amplitudes for different features in the feature distortion space holds the potential for further accuracy improvement. However, constructing a higher-dimensional feature distortion space will inevitably result in a significant increase in computational complexity, necessitating a specific task analysis and hardware ability assessment.
Simultaneously, the test results of ODS-DC on the three datasets indicate an enhancement in model robustness. In comparison to the single-path strategy, the dual-path strategy in five-way, five-shot tasks showed a potential improvement of approximately 7–18% in classification accuracy. Furthermore, the classification efficiency of ODS-DC is contingent on the number of support set samples. While an increase in the number of support set samples enhances model accuracy, it also leads to a substantial reduction in model inference efficiency. For instance, in a five-way scenario, the inference time for a single-path model only increased about twice from 1-shot to 10-shot tasks, while for a dual-path model, the inference time increased by over six times. Therefore, in tasks with fewer samples, the advantages of ODS-DC are more readily evident.
4. Conclusions
The impact of data augmentation on classification performance in few-shot learning is evident. Traditional feature enhancement methods have not explored the distinctiveness of features extensively, leading to unstable gains in classification performance. This issue is particularly common in the context of few-shot tasks with remote sensing images. Even with improvements in data augmentation techniques, it is challenging to provide effective support in the design of learning models. In this paper, we quantified feature distortion magnitudes and projected them onto a feature distortion magnitude space. Through the search of this distortion space, we optimized the distribution of sample features. Subsequently, to fully utilize this distribution, we proposed a classification model based on dual-path classification. The additional classification branch, through learning the comparison of intraclass and interclass similarities of all support samples, reinforced the classification process of the original branch while mitigating, to some extent, the shortcomings of the original branch in classifying challenging data. In the experimental section, we validated the effectiveness of the ODS-DC joint method using general remote sensing datasets. Furthermore, our comparative experiments revealed that the gains brought by the ODS-DC method surpass current State-of-the-Art data augmentation methods. In the ablation experiments, we explored the impact of changes in distortion magnitudes of different features on classification performance. Regrettably, due to hardware constraints and model efficiency, we were unable to conduct more in-depth investigations using higher-dimensional feature spaces comprising various feature types. However, in subsequent investigations, we will not only focus on expanding the dimensions of the feature space but may also introduce additional distortion parameters, thereby further exploring the potential of feature distortion in few-shot classification. Overall, this method’s novel and valuable perspective on feature distortion and model optimization offers a more efficient way to utilize data for few-shot classification learning in remote sensing scenes. It also provides new insights into research on data augmentation in deep learning.


