Technical Note

Arctic Sea Ice Surface Temperature Inversion Using FY-3D/MWRI Brightness Temperature Data

1
College of Marine Technology, Faculty of Information Science and Engineering, Ocean University of China, Qingdao 266100, China
2
Aerospace Times FeiHong Technology Company Limited, Beijing 100094, China
*
Author to whom correspondence should be addressed.
Remote Sens. 2024, 16(3), 490; https://doi.org/10.3390/rs16030490
Submission received: 14 December 2023 / Revised: 11 January 2024 / Accepted: 24 January 2024 / Published: 26 January 2024

Abstract

:
The Arctic plays a crucial role in the intricate workings of the global climate system. With the rapid development of information technology, satellite remote sensing technology has emerged as the main method for sea ice surface temperature (IST) observation. To obtain Arctic IST, we used the FengYun-3D Microwave Radiation Imager (FY-3D/MWRI) brightness temperature (Tb) data for IST inversion using multiple linear regressions. Measured data on IST parameters in the Arctic are difficult to obtain. We used the Moderate-Resolution Imaging Spectroradiometer (MODIS) MYD29 IST data as the baseline to obtain the coefficients for the MWRI IST inversion function. The relation between MWRI Tb data and MODIS MYD29 IST product was established and the microwave IST inversion equation was obtained for the months of January to December 2019. Based on the R2 results and the IST inversion results, we compared and analyzed the MWRI IST data from the months of January to April, November, and December with the Operation IceBridge KT19 IR Surface Temperature data and the Northern High Latitude Level 3 Sea and Sea Ice Surface Temperature (NHL L3 SST/IST). We found that compared MWRI IST with NHL L3 IST, the correlation coefficients (Corr) > 0.72, mean bias ranged from −1.82 °C to −0.67 °C, and the standard deviation (Std) ranged from 3.61 °C to 4.54 °C; comparing MWRI IST with KT19 IST, the Corr was 0.69, the bias was 0.51 °C, and the Std was 4.34 °C. The obtained error conforms to the precision requirement. From these results, we conclude that the FY-3D/MWRI Tb data are suitable for IST retrieval in the Arctic using multiple linear regressions.

1. Introduction

The presence of sea ice affects oceanic and atmospheric temperatures, as well as circulation patterns [1]. The presence of sea ice moderates the reduction of tidal levels and constrains the movement of tidal currents, thereby reducing both tidal range and velocity. Additionally, it serves as a barrier to dampen wave height, hindering the transmission of waves and associated phenomena. Since sea ice has a considerably higher solar radiation reflectivity than sea water, the presence of sea ice inhibits the direct exchange of energy between the ocean and earth’s atmosphere, thus regulating the global atmosphere–ocean energy balance [2]. Additionally, the reduction in sea ice cover serves to exacerbate the Earth’s greenhouse effect, thus impelling unforeseen consequences upon global climatic patterns. Arctic sea ice emerges through a process in which sea temperatures fall below −1.8 °C. Arctic sea ice surface temperature (IST) is a crucial index of Arctic sea ice change, and its change is extremely significant within the background of global climate warming. Studying the laws that govern change in marine environments and ecosystems through the observations and analysis of IST can aid a more thorough understanding of the impact of global warming on these environments.
Two primary methods are employed to acquire IST: field measurement and satellite remote sensing. In polar regions, the harsh climate conditions render it impracticable to establish numerous meteorological observatories, making it difficult to conduct in situ observations on the factors governing the energy and momentum equilibrium of sea ice. One approach to bridge this observational disparity is the utilization of satellites to measure the properties of sea ice [3]. Compared with traditional measurement methods dependent on ships and buoys, satellite remote sensing offers numerous advantages including near real-time, all-weather, wide and long-term repeated coverage, which is better adapted to characteristics of ocean phenomena and can fill the gaps in field-measured data [4]. Depending on the sensor type, the main IST algorithm for remote sensing inversion can be divided into a thermal infrared inversion algorithm and a microwave inversion algorithm. Thermal infrared sensors are characterized by high spatiotemporal resolution, and are widely used for IST inversion. However, the application of satellite infrared IST inversion is constrained by the existence of clouds. The IST data obtained in the presence of thin cirrus clouds are usually biased. Microwave radiometers are also widely used for sea ice observation [5]. These receive microwave radiation that penetrates clouds, are unaffected by meteorological conditions such as sunlight and clouds, and can detect sea ice throughout the day in different meteorological conditions. Their disadvantage, however, is their relatively low spatial resolution.
Many scholars use microwaves to retrieve surface temperatures. In 1994, Key et al. [6] proposed that if the surface type and emissivity of floating ice was known, the data from the Special Sensor Microwave Imager (SSM/I) could provide useful IST data. However, there needs to be some way to reduce the uncertainty in the ice classification in the floes, and the Synthetic Aperture Radar (SAR) data may need to be combined. In 1997, Comiso and Cavalieri [7] used the 6 GHz channel of the Scanning Multichannel Microwave Radiometer (SMMR), carried by Nimbus-7, to calculate sea ice concentration (SIC) and IST. This approach addressed the limitations associated with using vertical polarization data at 18 and 37 GHz in the Bootstrap algorithm, thus enhancing its performance [8]. In 2000, Wentz [9] used the Advanced Microwave Scanning Radiometer for Earth Observing System (AMSR-E) to describe a multiple linear regression method suitable for ocean observations. In 2006, Li and Guan et al. [10] identified a forward model for the study of inversion algorithms, and proposed a physics-based multiple linear regression algorithm for estimating sea surface temperature (SST) derived from spaceborne microwave radiometry. Comparison with data from the European Centre for Medium-Range Weather Forecasts (ECMWF) showed the bias was 0.02 °C ± 0.68 °C and the correlation coefficient (Corr) was 0.993. In 2007, Wentz et al. [11] divided the AMSR-E SST retrieval algorithm into two stages for a comprehensive elucidation of the algorithm’s structure and training methodology. In 2012, Holmes et al. [12] proposed the use of vertical polarized brightness temperature (Tb) at 37 GHz, rather than thermal infrared satellite sensors, for measurement of land surface temperature (LST). The theoretical bias was found to be within 1 K for 70% of vegetated land areas worldwide. In 2014, Scott et al. [13] proposed the multimodality guided variational (MGV) approach, which combines data captured by a passive microwave sensor with data obtained from the Moderate Resolution Imaging Spectroradiometer (MODIS) in order to estimate IST. An evaluation of the MGV method’s performance was conducted by comparing the sea ice thickness derived from the swath surface temperature and the sea ice thickness obtained from the surface temperature by MGV. In 2015, Lee [14] used the combined Fresnel equation, which was derived analytically by Sohn and Lee [15], to retrieve various parameters, including emissivity, physical temperature, and refractive index of sea ice from microwave measurements, utilizing the Tb at 6.9 GHz. Then, in 2018, Lee [16] used SSM/I to invert winter snow and ice interface temperature (SIIT) in the Arctic, incorporating calculations for ice surface roughness and snow and ice volume scattering to determine apparent emissivity, and utilized ice mass balance (IMB) drift buoy data from the U.S. Navy Cold Regions Research and Engineering Laboratory (CRREL) to verify at the depth of zero ice. At present, inversion of microwave radiometry temperature observation is mostly used to retrieve SIIT, SST, or LST, and is seldom applied to IST.
Existing IST products include MODIS MYD29, Advanced Very High Resolution Radiometer (AVHRR), Visible Infrared Imaging Radiometer Suite (VIIRS), and some fusion products, such as the Arctic Ocean sea and ice surface temperature data (L4 SST/IST) and the Northern High Latitude Level 3 Sea and Sea Ice Surface Temperature (NHL L3 SST/IST) data. In a previous paper, we evaluated the Arctic Tb data of FengYun-3D Medium Resolution Spectral Imager-II (FY-3D/MERSI-II) thermal infrared channels (channels 24 and 25), and used the calibrated Tb data from MERSI-II to retrieve the IST with good results. From January to May, the monthly mean bias of MERSI IST and L4 IST data was less than 2.7510 °C, with the Std of less than 3.5774 °C [17]. Most of these products have been validated, with absolute values of bias less than 3 °C, and the standard deviation (Std) and root mean square error (RMSE) mostly below 4.5 °C [1,17,18,19,20,21,22].
In this study, the channels Tb data of FengYun-3D Microwave Radiation Imager (FY-3D/MWRI) were used to invert the IST. Compared with microwave IST inversion algorithm, IST inversion algorithm using thermal infrared band has been relatively mature. There are few algorithms and studies on microwave IST data inversion, and no IST inversion algorithm for Tb data observed by FY-3D/MWRI has been published. The FY-3D and Aqua satellites both operate in the afternoon, making their sensors suitable for comparisons. Measured data on IST parameters in the Arctic are difficult to obtain. We aimed to establish the relationship between Tb data in FY-3D/MWRI and Aqua/MODIS MYD29 IST data to obtain a microwave IST inversion equation in 2019. The retrieved MWRI IST data were assessed against the NHL L3 IST product and the Operation IceBridge (OIB) KT19 IR Surface Temperature data.

2. Materials and Methods

2.1. Datasets

The datasets comprise Arctic Tb data observed by FY-3D/MWRI during January to December 2019. We also used the MYD03 and MYD29 datasets from Aqua/MODIS, the NHL L3 IST from National Polar-orbiting Operational Environmental Satellite System Preparatory Project (NPP)/VIIRS, the KT19 IR IST data from OIB, and the SIC data from FY-3D/MWRI (Table 1).

2.1.1. FY-3D/MWRI Data

MWRI is aboard the FY-3D satellites (launched in November 2017) [25,28], and FY-3D is afternoon-orbiting satellites. The parameter configurations of the FY-3D/MWRI instruments are generally in line with those of the AMSR-E and the Advanced Microwave Scanning Radiometer 2 (AMSR2), and they are only slightly different from those of other microwave radiometer data. Each of the five frequencies is divided into a horizontal (H) and vertical (V) polarization mode, giving 10 channels in total (Table 2). The scanning range is ±55.4° and the ground resolution is 15–85 km [25]. FY-3D/MWRI data are stored in two types: ascending- and descending-order data. The level 1 Tb data in FY-3D/MWRI used in this paper is supplied by the China National Satellite Meteorological Center (NSMC) (http://www.nsmc.org.cn/ (accessed on 6 July 2022)).

2.1.2. Aqua/MODIS Data

The MODIS sensor, on the afternoon-orbiting Aqua satellite, has high sensitivity and accuracy [29,30]. The MYD29 product of Aqua/MODIS provides IST data, and the MYD03 product provides latitude and longitude data [31]. The comparison of MYD29 data with the measured data indicated that the mean bias amounted to −2.1 °C and the RMSE was 3.7 °C [1]. The MODIS data supplied by the National Aeronautical and Space Administration (NASA) Level-1 and Atmosphere Archive and Distribution System (LAADS) Distributed Active Archive Center (DAAC) (https://ladsweb.modaps.eosdis.nasa.gov/ (accessed on 12 March 2023)).

2.1.3. Northern High Latitude L3 Sea and Sea Ice Surface Temperature Data

The NHL L3 IST data derived from NPP/VIIRS. These datasets cover the northern high latitudes, and are available at a 5 km resolution. The data span from 25 January 2019 to the present. The validation of the IST has been conducted using drifting buoys received from the Global Telecommunications System (GTS) at the Meteorological Institute of Norway (MET Norway). Three requirement levels were defined when the product was verified: Threshold, Target, and Optimal (Table 3).
In all months, the validation shows that during the day, the data meet or closely approach the target requirement of 3.0 °C Std and 3.5 °C bias on a monthly basis. During nighttime, the data meet or closely approach the target requirement for Std, and the yearly nocturnal bias falls within the prescribed threshold of 4.5 °C [22]. The NHL L3 VIIRS IST data were published by the European Organisation for the Exploitation of Meteorological Satellites (EUMETSAT) Ocean and Sea Ice Satellite Application Facility (OSI-SAF), (https://osi-saf.eumetsat.int/products/osi-203-b (accessed on 10 April 2023)).

2.1.4. Operation IceBridge KT19 IR Surface Temperature Data

This dataset presents surface temperature measurements collected from sea ice across the Arctic and Antarctic, as well as land ice, using the Heitronics KT19.85 Series II Infrared Radiation Pyrometer from 5 March 2012 to 17 May 2019. The instrument forms a part of the Atmospheric Microwave Radiometer (ATM) instrument suite and is operated by the Wallops Flight Facility (WFF). The data were compiled as a component of the OIB funded survey initiative. The OIB IST data were made available for public use by the National Snow and Ice Data Center (NSIDC), (https://nsidc.org/data/iakst1b/versions/2 (accessed on 15 October 2023)). Figure 1 outlines the flight path of the OIB campaigns undertaken in the Arctic in 2019.

2.2. Methods

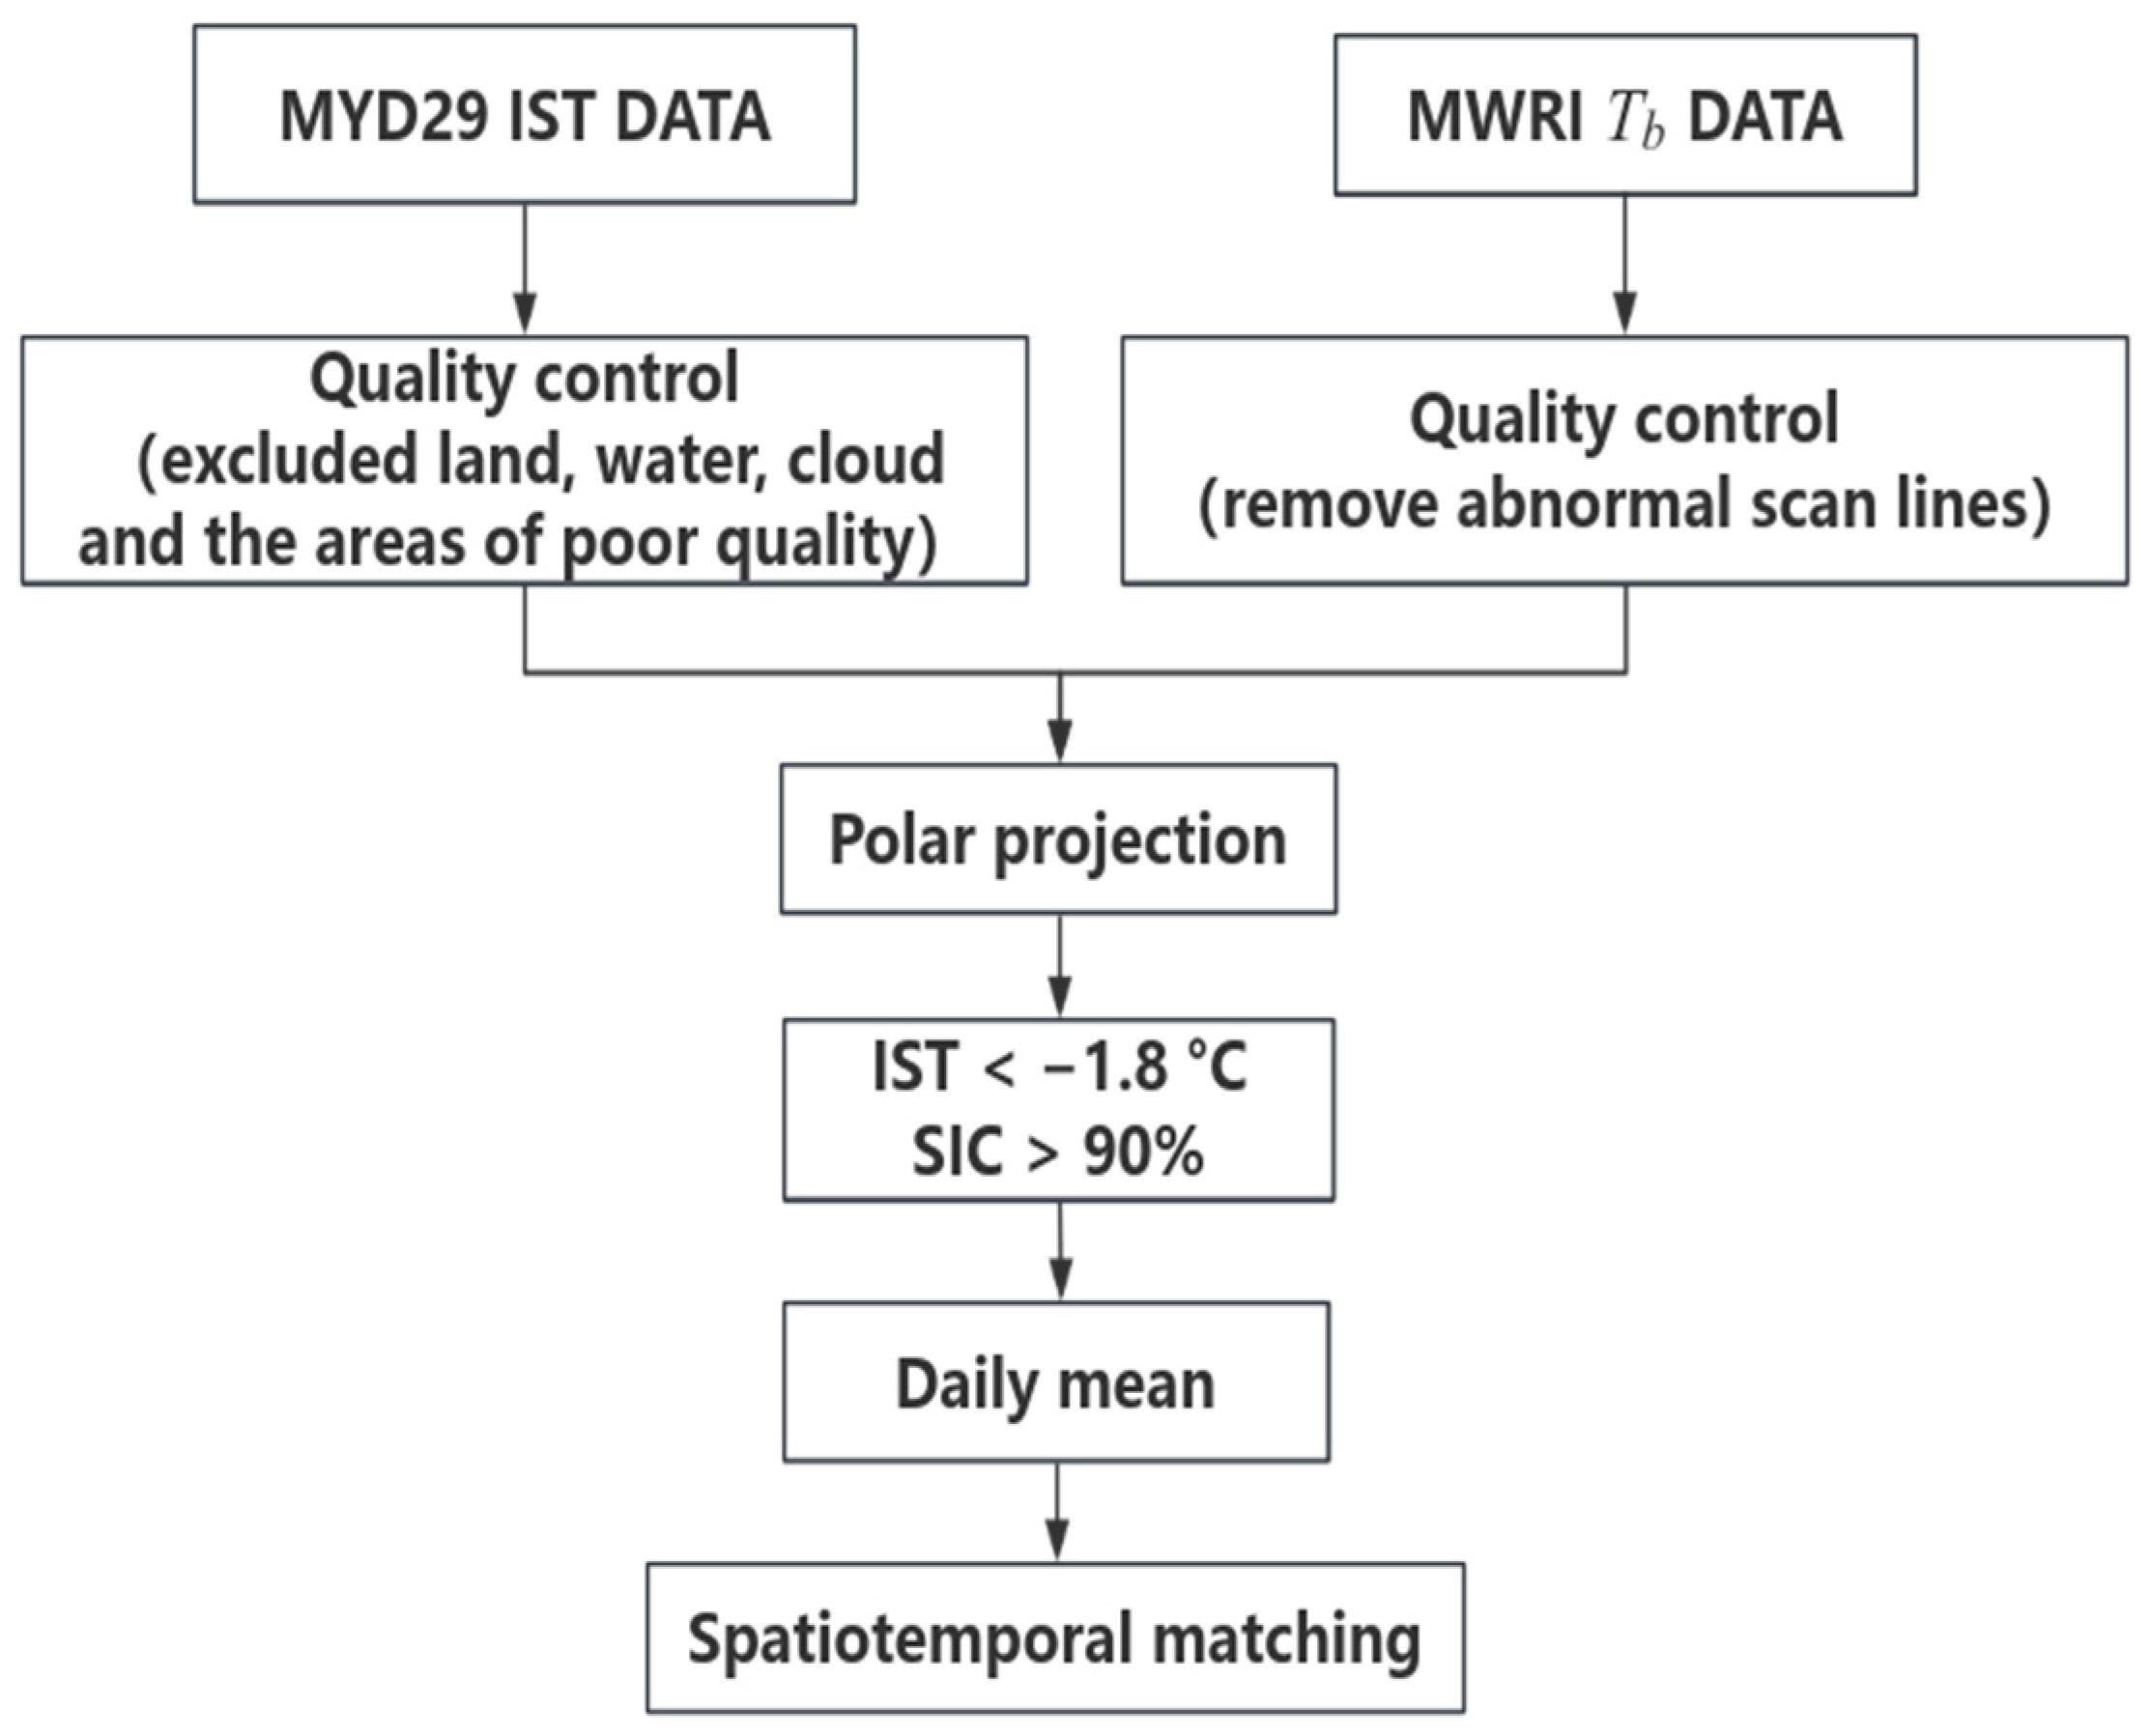
2.2.1. Data Preprocessing

We used the areas of MYD29 data with quality of “GOOD”, which excluded land, water, and the areas of poor quality. The MYD29 Cloud Mask was used to remove cloud. Quality control was applied by setting thresholds to remove abnormal scan lines from the MWRI Tb data.
The average daily product resolution of MYD29 is 4 km. To facilitate comparison and analysis, we also mapped MWRI Tb, NHL L3 IST, and OIB IST data to a 4 km resolution and ensured the data of IST temperatures below −1.8 °C. Only areas with an SIC exceeding 90% were taken into account for IST inversion. Since the time resolution of each dataset is different, after quality control, we processed the data by taking the average of each day so as to obtain spatiotemporally matched data. Figure 2 shows the preprocessing flow chart for MYD29 IST and MWRI Tb data. Figure 3 shows the daily average MYD29 and NHL L3 IST data on 1 February 2019. The MYD29 daily IST distribution is basically consistent with the NHL L3 daily IST. In this study, we used the MYD29 IST product as the baseline to obtain the coefficients for the MWRI IST inversion function, and the NHL L3 daily IST data were used as comparison data.

2.2.2. Multivariate Statistical Regression Algorithm

There are few microwave IST inversion algorithms and studies, and no IST inversion algorithm has been published for FY-3D/MWRI Tb data. In this study, a multivariate statistical regression method based on statistical analysis was used to retrieve the MWRI IST data. Based on the assumption that some correlation exists between the MYD29 IST and the microwave radiometer observed Tb data, statistical regression was performed on both sets of data after spatiotemporal matching. By improving the ocean retrieval algorithm [9] and applying it to IST, the regression coefficient was obtained, thereby enabling IST inversion.
Compared with other algorithms with complex expressions and requiring a large amount of computation, this method is more suitable for business applications due to its simple expression and easy calculation [32]. The inversion equation is as follows [9]:
P = [ a + j = 1 J a j ( T bj ) ]
where P represents the parameter to be inverted (such as IST), j represents the microwave radiometer observation channel, a j represents the inversion coefficient of channel j, and Tbj represents the Tb of channel j. is the linear function, ( x ) = x and are divided into linear function and logarithmic function (as is common in the field of marine remote sensing) [9]:
( x ) = x
( x ) = log ( 290 x )
where Equation (2) is used for the 10.65 GHz channel and Equation (3) is used for the other frequency channels.
Arctic snow depth is transparent to low frequencies. The 10.65 GHz vertical and horizontal polarization channels of FY-3D/MWRI were selected as the first IST inversion channels, since these channels have the greatest sea ice penetration depth [33], have the highest effective emissivity [34], and are least influenced by clouds and rain, which can thus be ignored [35,36,37].
In addition to 10.65 GHz, we conducted correlation analysis for the Tb data of the MWRI 18.7 GHz, 23.8 GHz, 36.5 GHz, and 89 GHz channels with different polarization. The Tb data of the MWRI 18.7 GHz, 23.8 GHz, 36.5 GHz, and 89 GHz horizontal and vertical polarization for the entire year of 2019 were correlated with MODIS IST. Figure 4 shows that the Tb data of the MWRI 18.7 GHz, 23.8 GHz, 36.5 GHz, and 89 GHz vertical polarization channels are better correlated with MYD29 IST than that of the corresponding horizontal polarization channels. The 23.8 GHz vertical polarization channel can be used to correct the influence of atmospheric water vapor radiation [38]. The 23.8 GHz and 36.5 GHz vertical polarization channels can also be used to eliminate the influence of less than 3% of low-frequency atmospheric signals [10]. The 89 GHz vertical polarization channel has the highest correlation with MYD29 IST, and can also eliminate other average atmospheric influences and improves spatial resolution [25]. In summary, 23.8 GHz, 36.5 GHz, and 89 GHz vertical polarization channels with correlations greater than 0.5 were selected for IST inversion. Figure 5 shows the daily average Tb data for the frequency channels selected in this study on 1 February 2019.
In this study, combining the definition of Equation (1) and the selected Tb (the unit is Kelvin) from the MWRI frequency channels, we obtain the following specific IST inversion formula:
T S = K 0 + K 1 T 10.65 V + K 2 T 10.65 H + K 3 log ( 290 T 23.8 V ) + K 4 log ( 290 T 36.5 V ) + K 5 log ( 290 T 89 V )
where K0K5 are coefficients; Ts (the unit is Kelvin) is the IST; and T10.65V, T10.65H, T23.8V, T36.5V, and T89V are the Tb at the corresponding frequency and polarization channels of FY-3D/MWRI. The value of 290 represents the relatively constant effective temperature of the ocean–atmosphere system [9].

3. Results

3.1. Multivariate Statistical Regression Results

We used the MODIS IST product MYD29 as baseline to obtain the MWRI IST inversion function coefficients. In the regression analysis, the coefficient of determination (R2) values for each month during the period of January to December 2019, which evaluate the performance of the IST inversion from MWRI Tb, as shown in Table 4. From May to October, R2 values were between 0.04 and 0.31, while in the other months, R2 values were all greater than 0.45. Overall, the FY-3D/MWRI IST fit from May to October 2019 was poor.
The Microwave Radiation Imager is utilized for the retrieval of sea ice parameters by receiving and measuring the microwave radiation emitted from the sea ice. During the period from May to October, the increase in temperature causes the surface of sea ice to be susceptible to melting, leading to the formation of melting ponds. In the summer, as much as 60% of the Arctic sea ice surface may be covered by melt ponds. Due to factors such as ice melting and solar radiation, the surface of the sea ice becomes uneven, thereby disrupting the transmission and reception of microwave signals, which affects the accuracy and reliability of the IST detection by microwave radiometers. In addition, with higher temperatures in the Arctic during summer, microwave signals are susceptible to atmospheric absorption and scattering as they pass through the air and sea ice, further reducing the performance and effectiveness of microwave imagers. In summer, the atmospheric water vapor content is higher, and the passive microwave data are greatly affected by water content, resulting in low inversion accuracy [39].
Table 5 gives the MWRI IST inversion coefficients for the months of January to December 2019, which were obtained using the statistical regression Equation (4), where K0 was between 227.742 and 468.9688. K1 was positive except in March and June to September; K2 was negative except in June–September, with K1 and K2 ranging from −0.4233 to 0.5516; K3 was negative except in June and July; K4 was positive except in July; K5 was less than −10 in January–April and October–December, but greater than –10 in May–September. The coefficients of May–September differed greatly from those of other months. A uniform one-year average was not possible due to the differences among the coefficients for each month, so we performed the inversion separately for each month.

3.2. Ice Surface Temperature Inversion Results

The coefficients in Table 5 were applied to Equation (4) to obtain the MWRI IST data. The daily IST inversion result (Figure 6) from MWRI Tb data was compared with the MYD29 and NHL L3 daily ISTs (Figure 3), and the distribution was found to be consistent. The white regions were pure water area or ice–water mixed area.

4. Discussion

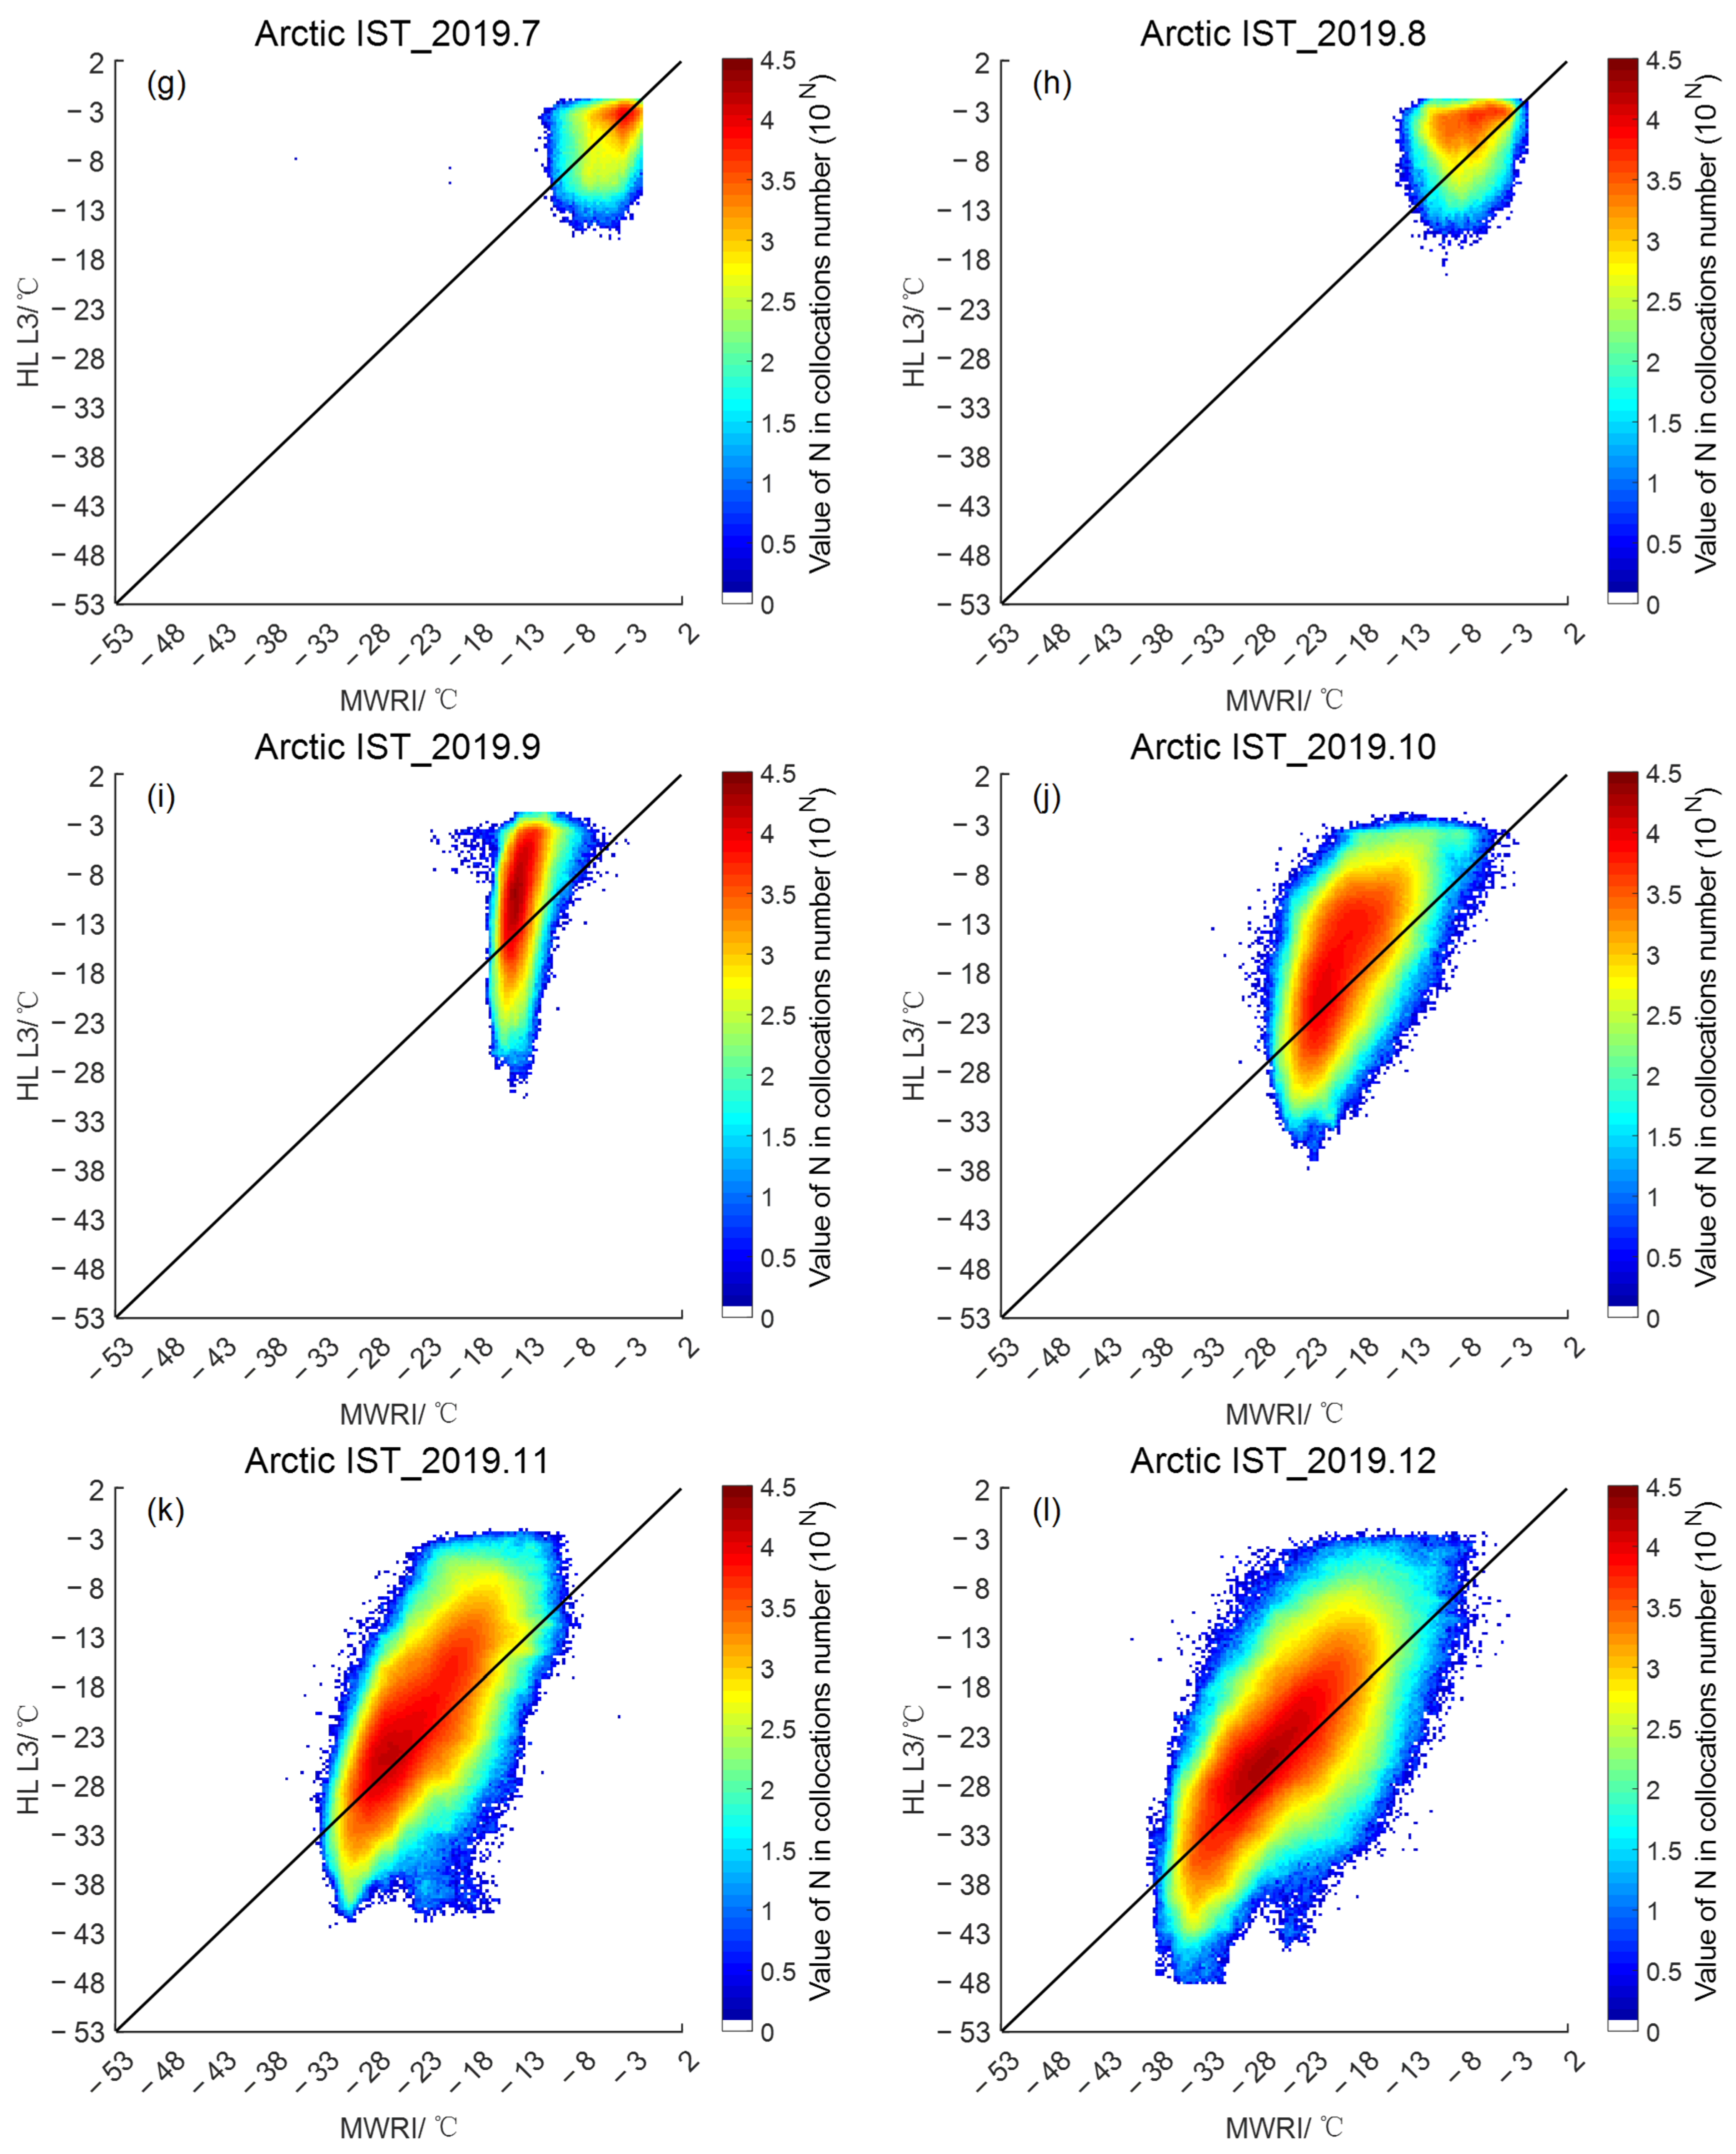
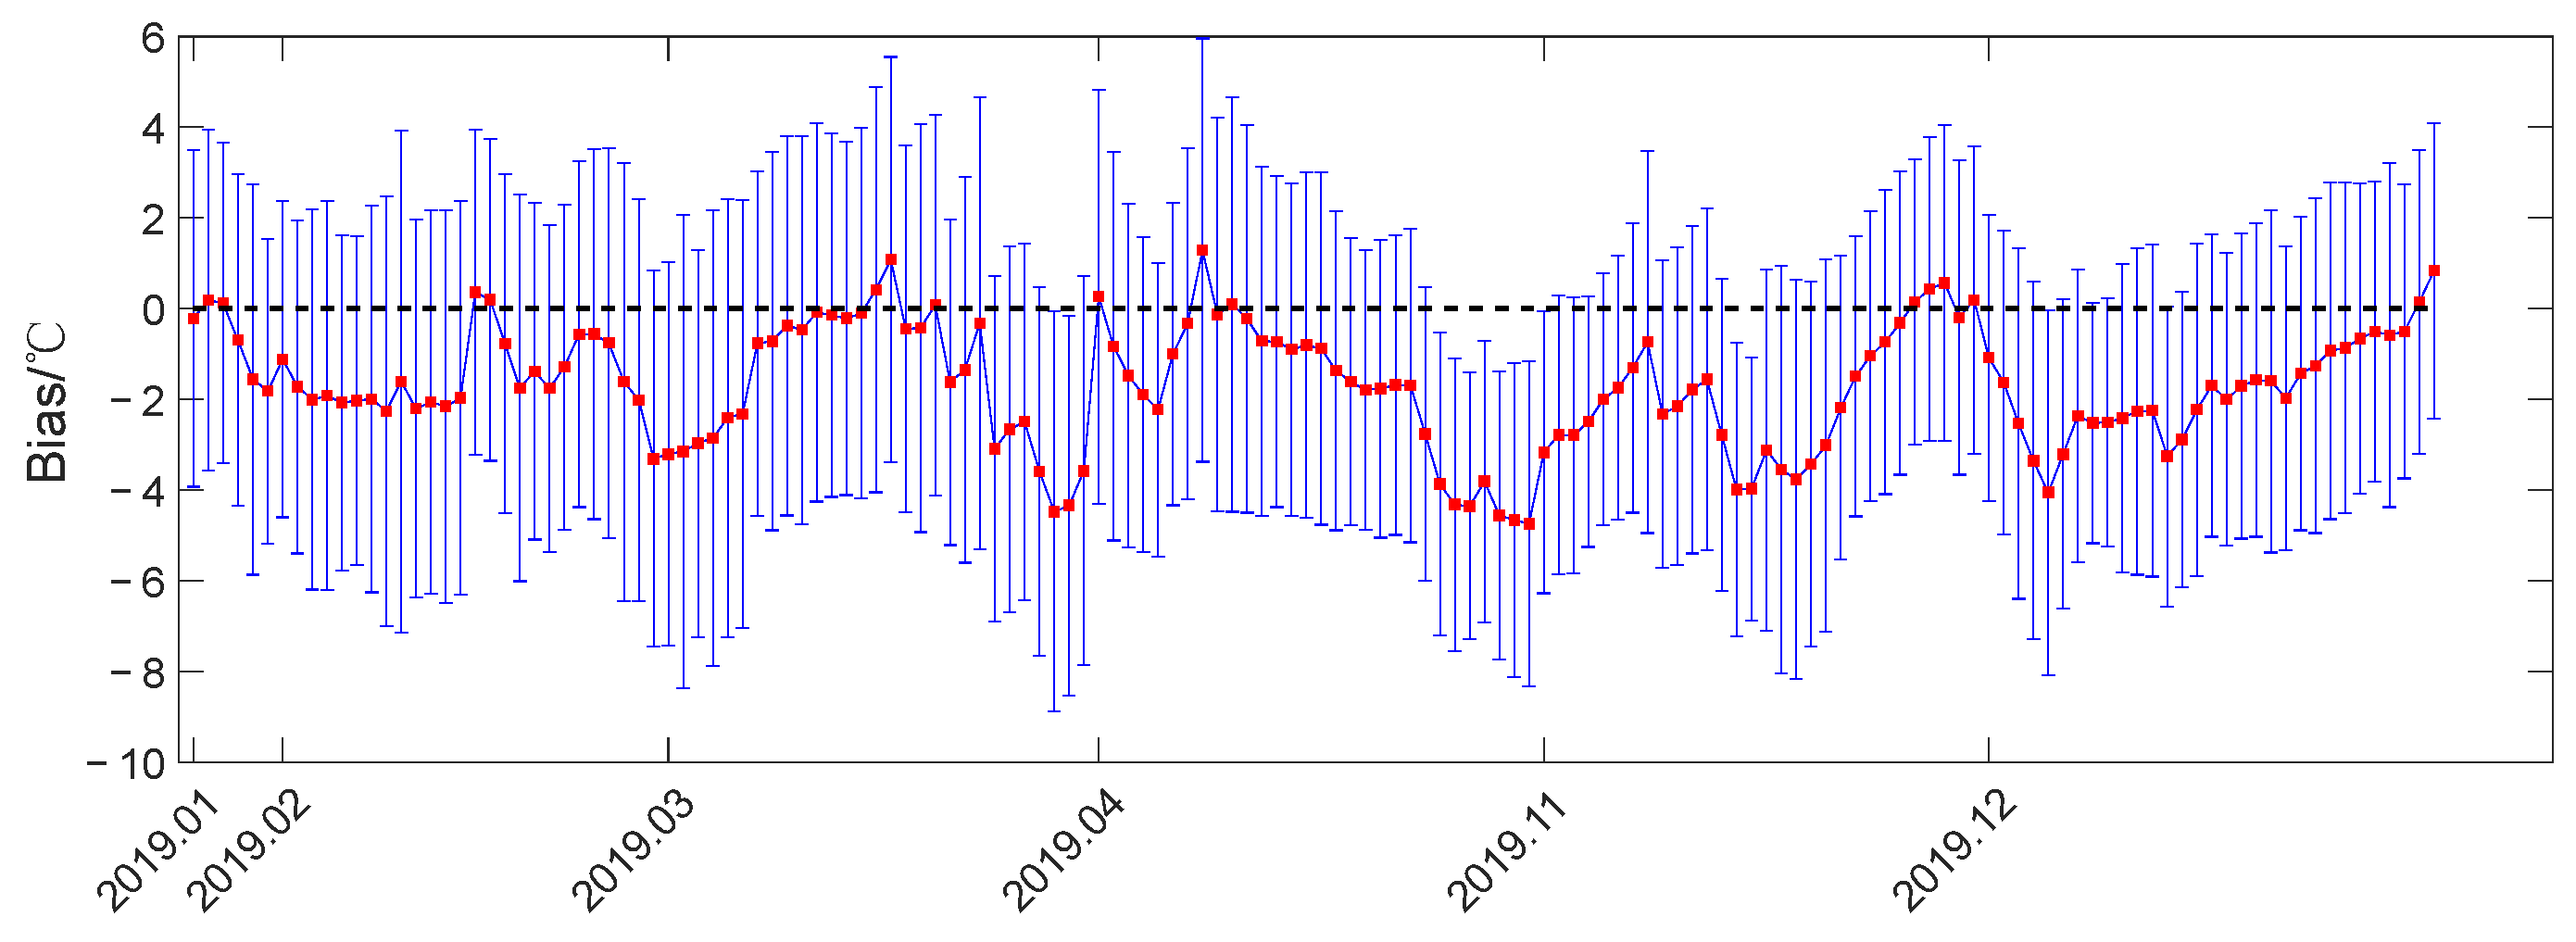
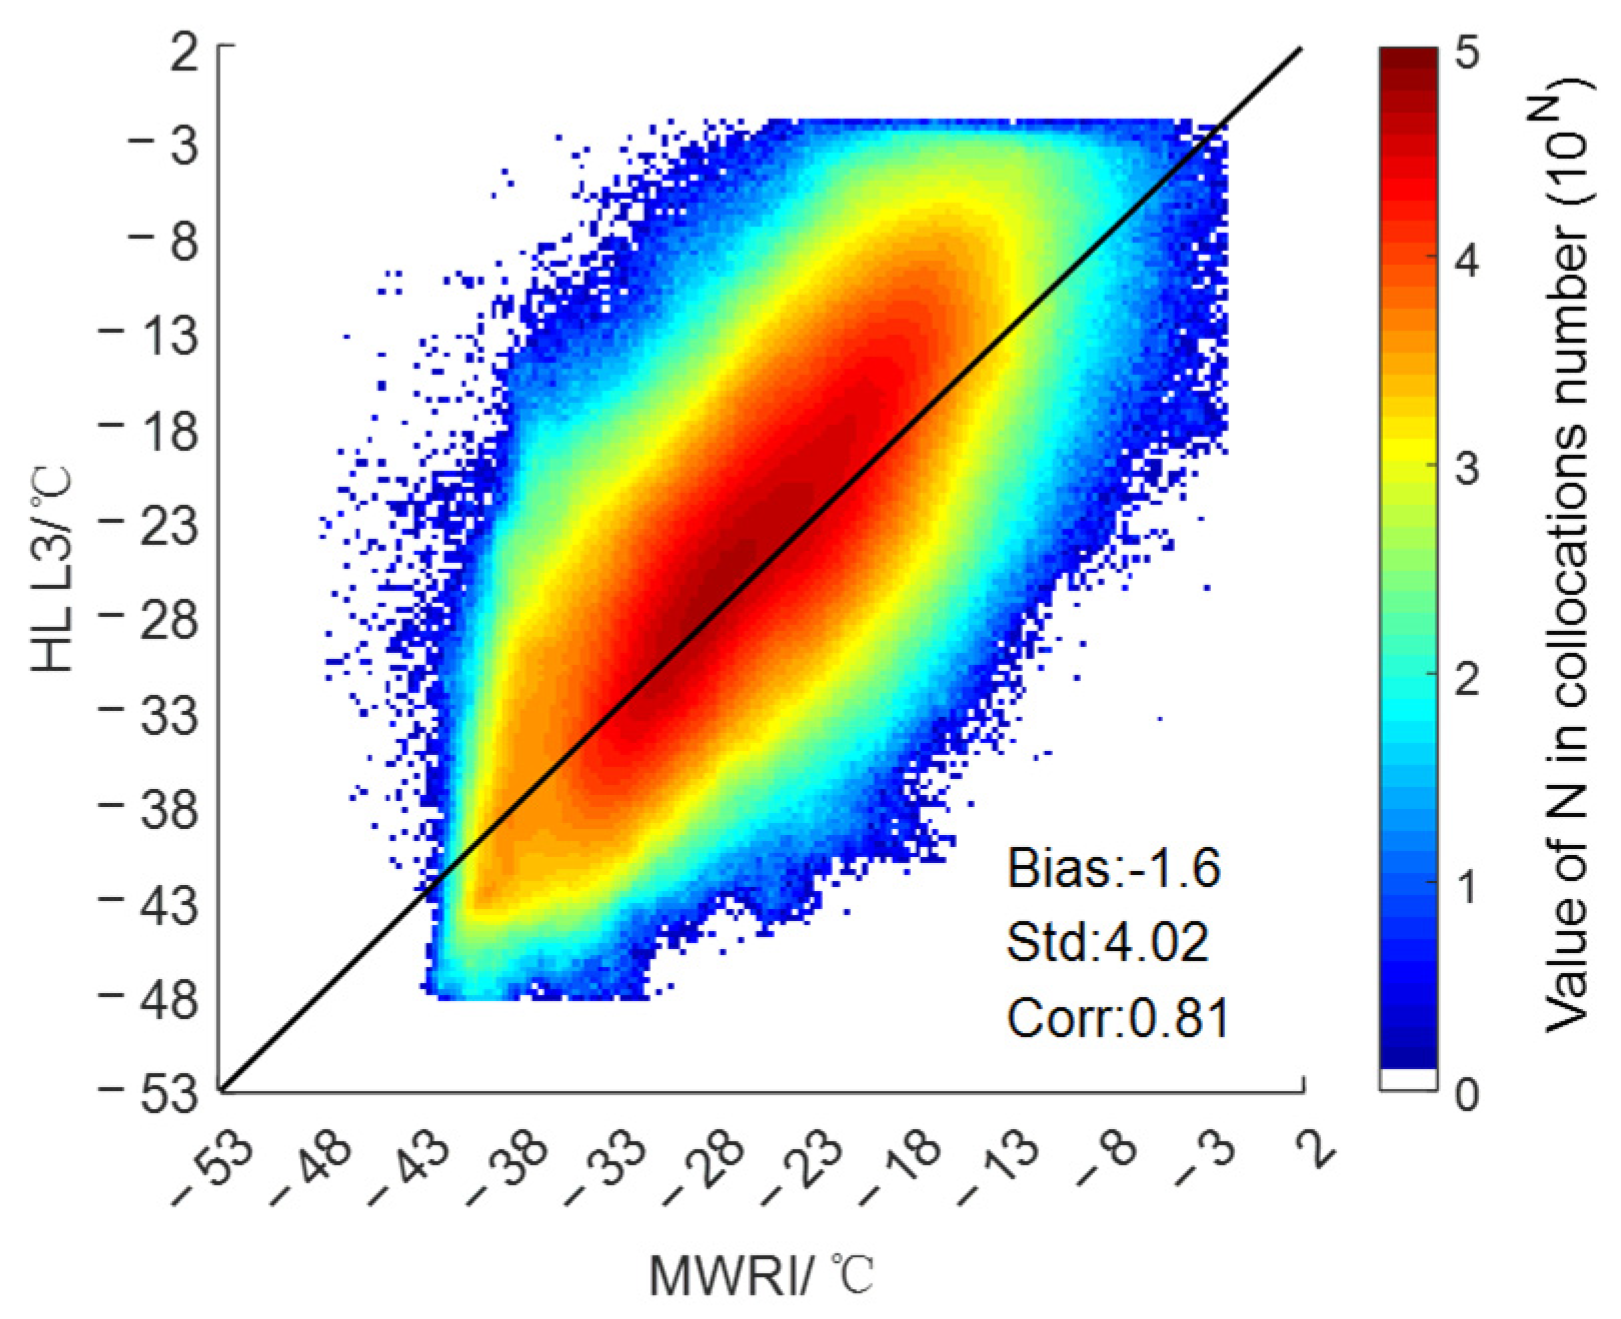
4.1. Comparative Statistical Analysis with NHL L3 IST Data

We convert the corresponding IST units into degrees Celsius (°C). A comparison between the FY-3D/MWRI IST and the NHL L3 IST data was performed to obtain a scatter plot of the distribution, as shown in Figure 7. Table 6 shows that the Corr > 0.72 in the months from January to April, November, and December in 2019. The slightly lower Corr in October was 0.67, and the Corr from May to September ranged from 0.17 to 0.51, which indicated a poor correlation compared to other months. Due to the poor inversion results from May to October, we only analyzed the data for the months of January through April, as well as November and December of 2019. For these six months in 2019, the Bias ranged from −1.82 °C to −0.67 °C and Std ranged from 3.61 °C to 4.54 °C. The NHL L3 IST only had data from 25 to 31 in January 2019, so the amount of data is smaller.
Figure 8 shows the MWRI and NHL L3 daily IST bias error bars during the months of January to April, November, and December 2019. The red dots indicate the daily mean bias and the blue lines indicate the Std range. On most days, the bias was below 0 °C, with a few days exceeding 0 °C, but all the bias was between −4.75 and 1.3 °C. Overall, the MWRI IST obtained by inversion was lower than that of the NHL L3 IST product data.
We synthesized the corresponding MWRI daily IST data for six months to compare with NHL L3 IST data (Figure 9). The number of matching points was 69,213,543, with the Corr of 0.81, the mean bias of −1.6 °C, and the Std of 4.02 °C. Overall, the matching points were roughly symmetrically distributed on both sides of the 1:1 line.

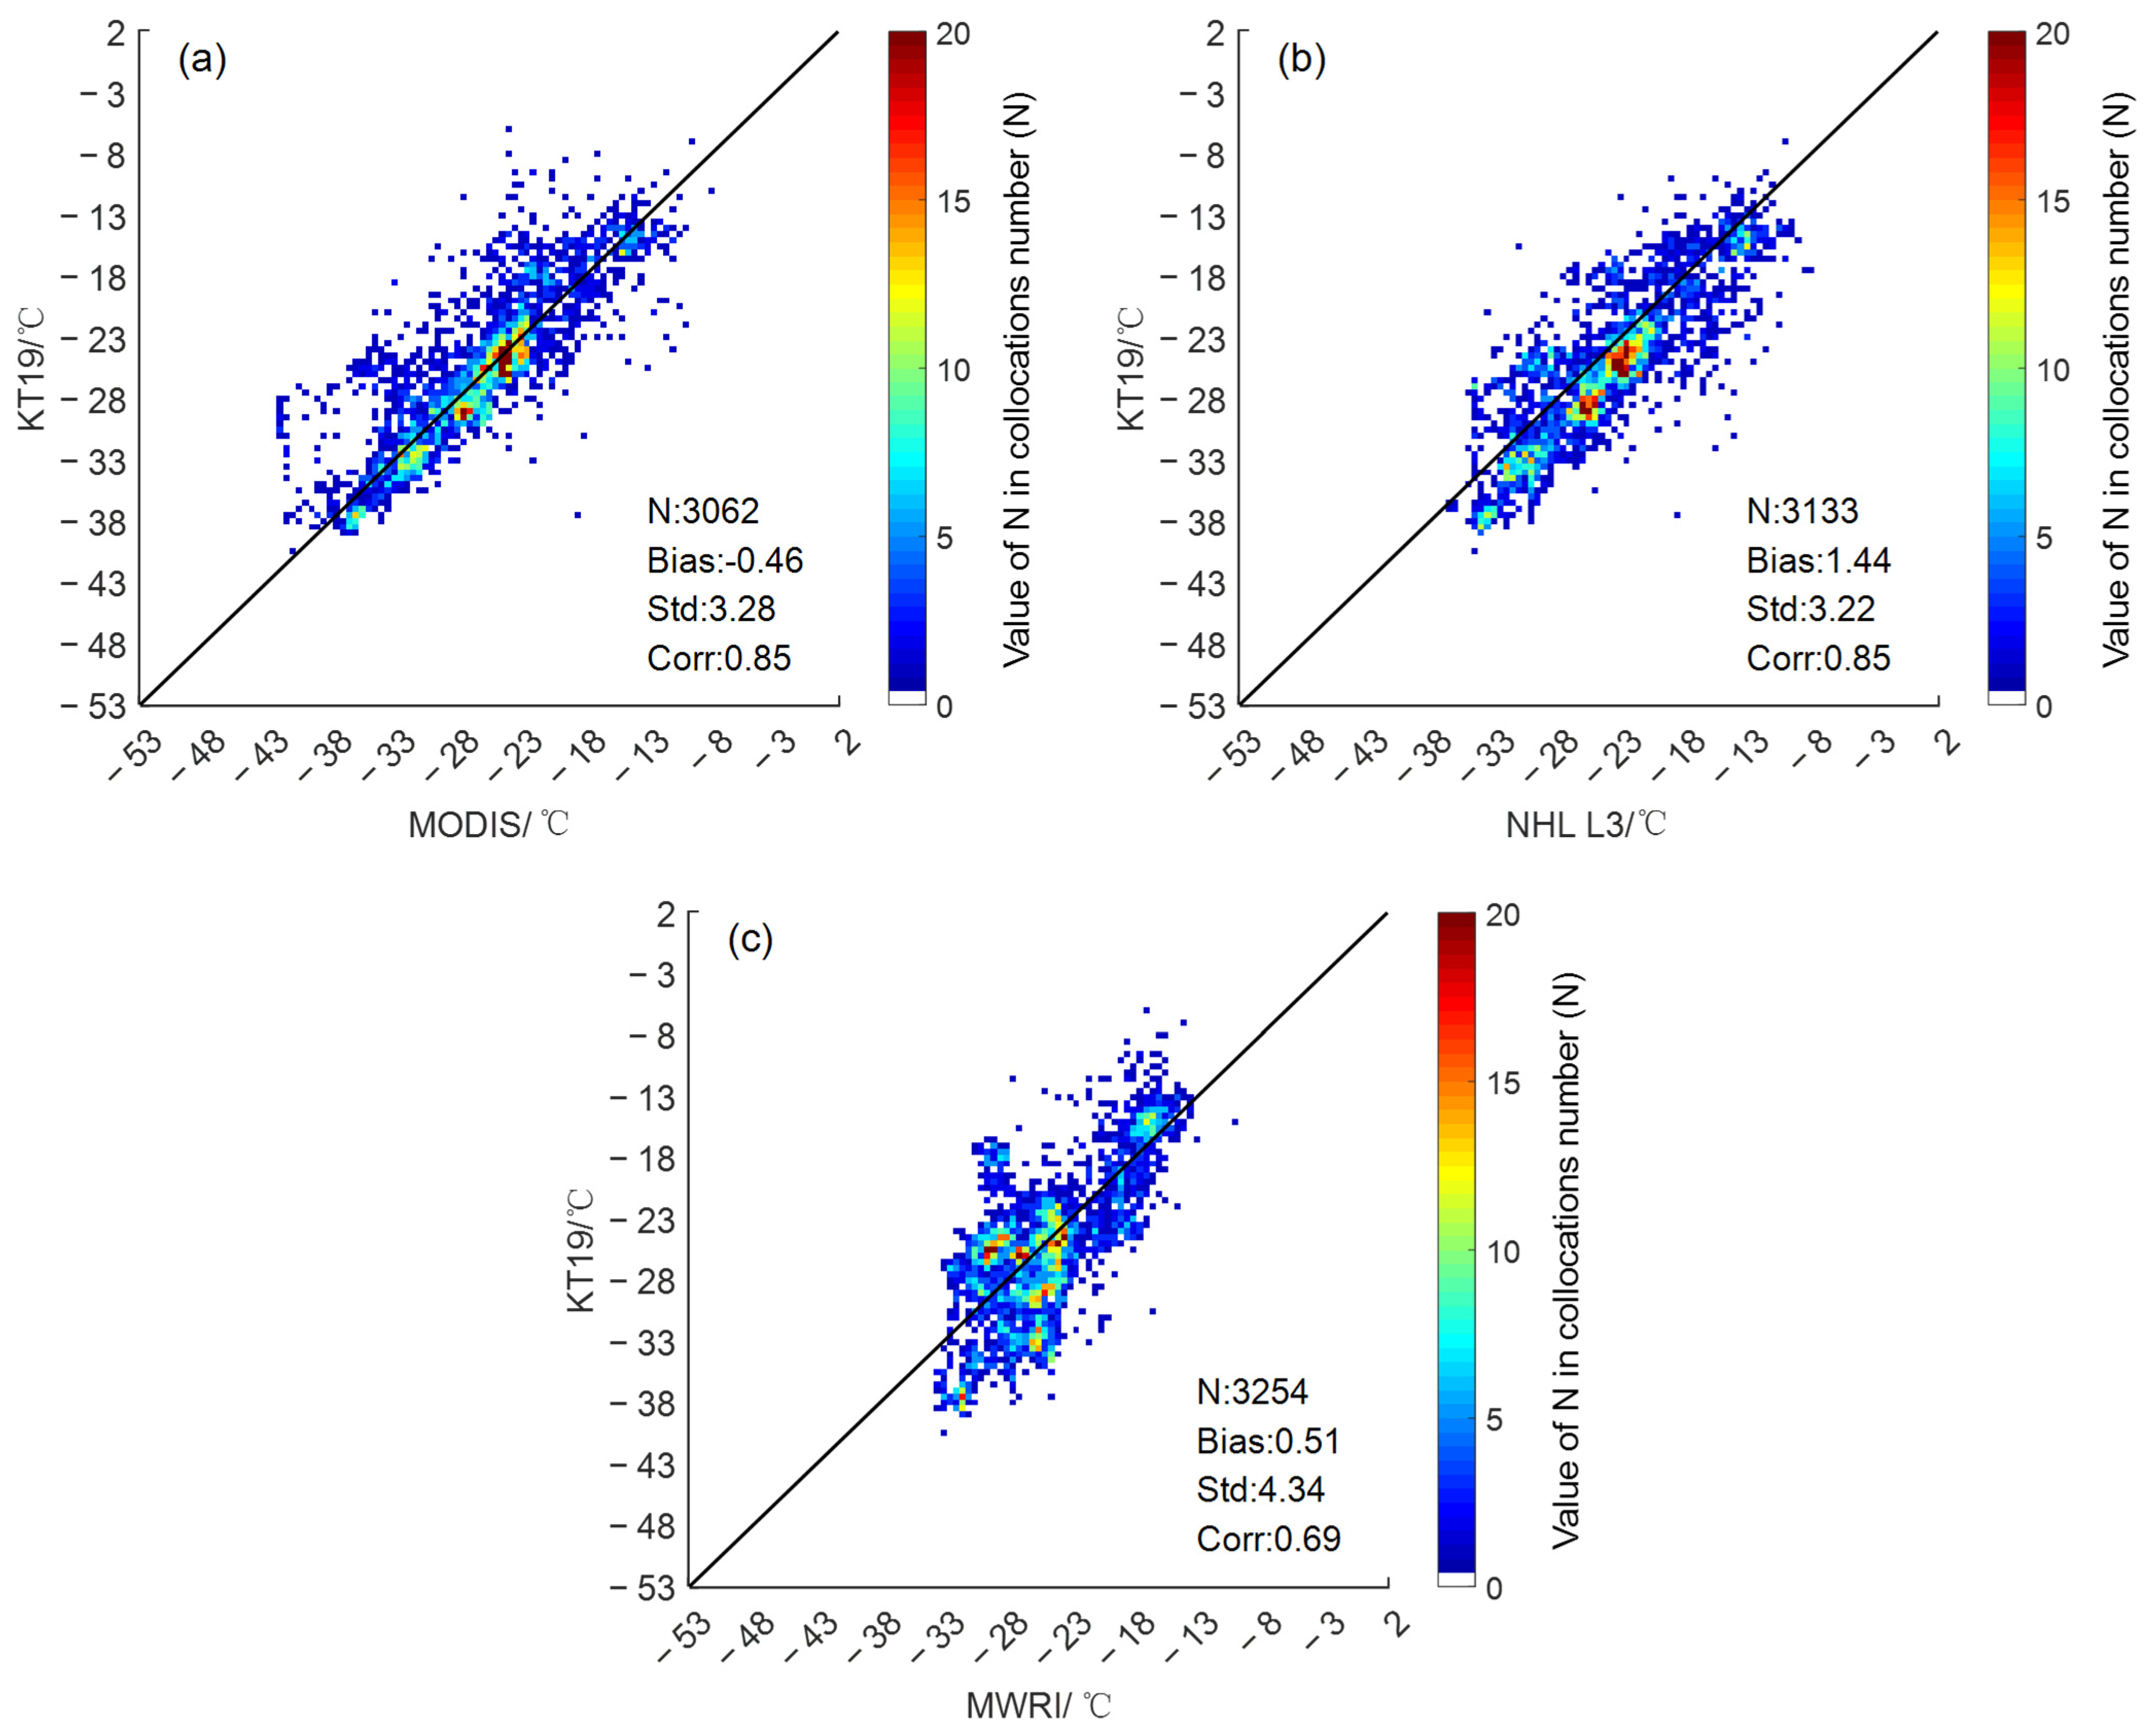
4.2. Comparative Statistical Analysis with OIB KT19 IR IST Data

OIB KT19 IR IST data are only available for the months of March to May 2019. The spatiotemporal matching of MODIS MYD29 IST data and OIB KT19 IR IST data in the Arctic showed that there were 3062 data points in April, the Corr was 0.85, the bias was calculated as −0.46 °C, and the Std stood at 3.28 °C, as shown in Figure 10a. The spatiotemporal matching of NHL L3 IST data and OIB KT19 IR IST data showed that there were 3133 data points in April, the Corr was 0.85, the bias was 1.44 °C, and the Std stood at 3.22 °C, as depicted in Figure 10b. The spatiotemporal matching of MWRI IST data and OIB KT19 IR IST data showed that there were 3254 data points in April, with the Corr of 0.69, the bias of 0.51 °C, and the Std of 4.34 °C, as shown in Figure 10c. In March and May, there was no spatiotemporal matching data.
When the three IST datasets were compared with OIB KT19 IST data, the MWRI IST Corr was slightly lower than MYD29 and NHL L3 IST, and the Std was larger than other IST datasets. However, both are within a reasonable range. The bias of all three groups remained at a good level.

5. Conclusions

Based on the FY-3D/MWRI microwave Tb data and MODIS MYD29 IST data from January to December 2021, we inverted IST using multivariate statistical regression. NHL L3 IST data and OIB IST data were used as validation data. We evaluated and analyzed the MWRI IST data for the months of January to April, November, and December 2019.
A comprehensive comparison between the inversion-obtained MWRI IST and the NHL L3 IST for the six months showed that the results were better: the Corr was 0.81, the mean bias was −1.6 °C, and the Std was 4.02 °C. Overall, the inversion-obtained MWRI IST was lower than that of the NHL L3 IST data, and the matching points exhibited a nearly symmetrical distribution on either side of the 1:1 line. The MWRI daily IST distribution is basically consistent with the MYD29 and NHL L3 daily ISTs. When the inversion-obtained MWRI IST was compared with OIB KT19 IST data, there were 3254 matching data points in April, with a bias of 0.51 °C, and a Std of 4.34 °C. The obtained result exhibits a level of accuracy on par with that of most IST products. We thus infer that the FY-3D/MWRI Tb data have the potential to be utilized for inverting IST through multiple linear regressions in the Arctic.
We used the MYD29 IST data as the baseline data. Despite the validation of the MODIS MYD29 product, current measurements obtained from Arctic buoys are lacking, and this represents an area for the future improvement. The microwave data can be used as supplementary data as it is not affected by clouds, although its resolution is low. Inversion of microwave IST data and fusion of thermal infrared data and microwave data are the directions for additional discussion and analysis.

Author Contributions

Conceptualization, X.M., H.C., J.L., K.N. and L.L.; methodology, X.M. and H.C.; formal analysis, X.M. and H.C.; investigation, X.M., H.C., J.L., K.N. and L.L.; data curation, X.M., H.C. and L.L.; writing—original draft preparation, X.M. and H.C.; writing—review and editing, X.M., H.C. and L.L.; funding acquisition, H.C. and L.L. All authors have read and agreed to the published version of the manuscript.

Funding

This research was funded by the National Key R&D Program of China, grant number 2019YFA0607001.

Data Availability Statement

Data are contained within the article.

Acknowledgments

We are grateful to the NSMC, POGOC, EUMETSAT OSI-SAF, NASA LAADS DAAC, and OIB for providing the research data.

Conflicts of Interest

Author Kun Ni was employed by the Aerospace Times FeiHong Technology Company Limited. The remaining authors declare that the research was conducted in the absence of any commercial or financial relationships that could be construed as a potential conflict of interest.

References

  1. Hall, D.K.; Key, J.R.; Casey, K.A.; Riggs, G.; Cavalieri, D. Sea Ice Surface Temperature Product from MODIS. IEEE Trans. Geosci. Remote Sens. 2004, 42, 1076–1087. [Google Scholar] [CrossRef]
  2. Zhou, Y.; Kuang, D.; Gong, C.; Hu, Y.; Fang, S.; Zhang, Y.; Peng, Y. A method to extract parameters of Arctic sea ice from FY-3/MERSI imagery. J. Infrared Millim. Waves 2017, 36, 41–49. [Google Scholar]
  3. Kilic, L.; Tonboe, R.; Prigent, C.; Heygster, G. Estimating the snow depth, the snow-ice interface temperature, and the effective temperature of Arctic sea ice using Advanced Microwave Scanning Radiometer 2 and Ice Mass Balance buoys data. Cryosph. Discuss. 2019, 13, 1283–1296. [Google Scholar] [CrossRef]
  4. Xi, M. Merging Infrared Radiometer and Microwave Radiometer Sea Surface Temperature Data Based on the Optimum Interpolation. Master’s Thesis, National Marine Environmental Forecasting Center, Physical Oceanography, Beijing, China, 2011. [Google Scholar]
  5. Guan, L.; Zhang, H.; Qu, L.Q. Sea Surface Temperature Merged from MultiSensor Data; Proc. 2005 Dragon Symposium “Mid-Term Results”, Santorini, Greece, 27 June–1 July 2005; European Space Agency SP-611: Paris, France, 2006. [Google Scholar]
  6. Key, J.R.; James, M.; Konrad, S. Ice Surface Temperature Retrieval from AVHRR, ATSR, and Passive Microwave Satellite Data: Algorithm Development and Application; Environmental Sciences University of Colorado: Boulder, CO, USA, 1995. [Google Scholar]
  7. Comiso, J.C.; Zwally, H.J. Temperature corrected bootstrap algorithm, in IGARSS’97. In Proceedings of the 1997 IEEE International Geoscience and Remote Sensing Symposium Proceedings. Remote Sensing—A Scientific Vision for Sustainable Development, Singapore, 3–6 August 1997; pp. 857–861. [Google Scholar]
  8. Comiso, J.C. SSM/I Sea Ice Concentrations Using the Bootstrap Algorithm; National Aeronautics and Space Administration, Goddard Space Flight Center: Greenbelt, MD, USA, 1995; p. 1380. [Google Scholar]
  9. Wentz, F.J.; Meissner, T. AMSR Ocean Algorithm Theoretical Basis Document, Version 2; Remote Sensing Systems: Santa Rosa, CA, USA, 2000. [Google Scholar]
  10. Li, L.; Guan, L.; Chen, H. Study on an Algorithm for the Retrieval of Oceanic and Atmospheric Parameters from Satellite Microwave Radiometer Measurements. Period. Ocean Univ. China 2006, 36, 205–211. [Google Scholar]
  11. Wentz, F.J.; Meissner, T. Supplement 1 Algorithm Theoretical Basis Document for AMSR-E Ocean Algorithms; RSS Technical Rpt. 051707; NASA: Santa Rosa, CA, USA, 2007.
  12. Holmes, T.R.H.; De Jeu, R.A.M.; Owe, M.; Dolman, A.J. Land surface temperature from Ka band (37 GHz) passive microwave observations. J. Geophys. Res. 2009, 114, D04113. [Google Scholar] [CrossRef]
  13. Scott, K.A.; Li, E.; Wong, A. Sea Ice Surface Temperature Estimation Using MODIS and AMSR-E Data Within a Guided Variational Model Along the Labrador Coast. IEEE J. Sel. Top. Appl. Earth Obs. Remote Sens. 2014, 7, 3685–3694. [Google Scholar] [CrossRef]
  14. Lee, S.-M.; Sohn, B.J. Retrieving the refractive index, emissivity, and surface temperature of polar sea ice from 6.9 GHz microwave measurements: A theoretical development. J. Geophys. Res. Atmos. 2015, 120, 2293–2305. [Google Scholar] [CrossRef]
  15. Sohn, B.J.; Lee, S.M. Analytical relationship between polarized reflectivities on the specular surface. Int. J. Remote Sens. 2013, 34, 2368–2374. [Google Scholar] [CrossRef]
  16. Lee, S.-M.; Sohn, B.J.; Christian, D.K. Long-Term Arctic Snow/Ice Interface Temperature from Special Sensor for Microwave Imager Measurements. Remote Sens. 2018, 10, 1795. [Google Scholar] [CrossRef]
  17. Chen, H.; Meng, X.; Li, L.; Ni, K. Quality Assessment of FY-3D/MERSI-II Thermal Infrared Brightness Temperature Data from the Arctic Region: Application to Ice Surface Temperature Inversion. Remote Sens. 2022, 14, 6392. [Google Scholar] [CrossRef]
  18. Key, J.R.; Collins, J.B.; Fowler, C.; Stone, R.S. High-latitude Surface Temperature Estimates from Thermal Satellite Data. Remote Sens. Environ. 1997, 61, 302–309. [Google Scholar] [CrossRef]
  19. Key, J.R.; Mahoney, R.; Liu, Y.; Romanov, P.; Tschudi, M.; Appel, I.; Maslanik, J.; Baldwin, D.; Wang, X.; Meade, P. Snow and ice products from Suomi NPP VIIRS. J. Geophys. Res. Atmos. 2013, 118, 12816–12830. [Google Scholar] [CrossRef]
  20. Nielsen-Englyst, P.; Høyer, J.L.; Kolbe, W.M.; Dybkjær, G.; Lavergne, T.; Tonboe, R.T.; Karagali, I. A combined sea and sea-ice surface temperature climate dataset of the Arctic, 1982–2021. Remote Sens. Environ. 2022, 284, 113331. [Google Scholar] [CrossRef]
  21. Jacob, L.H.; Ioanna, K.; Pia, N. Quality Information Document for Arctic Sea and Ice Surface Temperature Product, Copernicus Marine Environment Monitoring Service; DMI: Danish Meteorological Institute: Copenhagen, Denmark, 2021. (In Danish) [Google Scholar]
  22. Steinar, E.; Anette, L.B.; Atle, S. Validation Report for the Northern High Latitude L3 VIIRS Sea and Sea Ice Surface Temperature Product, OSI-203-b, Version 2.1. 2019. Available online: https://osisaf-hl.met.no/sites/osisaf-hl.met.no/files/validation_reports/osisaf_cdop3_ss2_valrep_nhl-l3-sst-ist_v2p+1.pdf (accessed on 10 April 2023).
  23. Hao, H.R.; Su, J.; Shi, Q.; Li, L.L. Arctic sea ice concentration retrieval using the DT-ASI algorithm based on FY-3B/MWRI data. Acta Oceanol. Sin. 2021, 40, 176–188. [Google Scholar] [CrossRef]
  24. Hall, D.K.; Riggs, G.A. MODIS/Terra Sea Ice Extent 5-Min L2 Swath 1 Km, Version 61. 90°N, −180°E; 60°N, 180°W, Credits; NASA National Snow and Ice Data Center Distributed Active Archive Center: Boulder, CO, USA, 2021. [Google Scholar] [CrossRef]
  25. Wu, S.L. FY-3D (02) Meteorological Satellite Ground Application System Engineering Microwave Radiation Imager Data Use Guide, Version 2.1, National Satellite Meteorological Center. 2019. Available online: https://img.nsmc.org.cn/PORTAL/NSMC/DATASERVICE/OperatingGuide/FY3D/FY3D_MWRI%e6%95%b0%e6%8d%ae%e4%bd%bf%e7%94%a8%e6%8c%87%e5%8d%97.pdf (accessed on 6 July 2022).
  26. OSI SAF Northern High Latitude L3 Sea and Sea Ice Surface Temperature (NPP) 2019-Onwards, OSI-203-b. EUMETSAT Ocean and Sea Ice Satellite Application Facility. Data Extracted from 25 January 2019 to 31 December 2019. North of 60N. Available online: https://osi-saf.eumetsat.int/products/osi-203-b (accessed on 10 April 2023).
  27. Studinger, M. IceBridge KT19 IR Surface Temperature, Version 2. Boulder, Colorado USA. NASA National Snow and Ice Data Center Distributed Active Archive Center. 2020. Available online: https://nsidc.org/data/iakst1b/versions/2 (accessed on 20 October 2022).
  28. Yang, H.; Wend, F.Z.; Lv, L.Q.; Lu, N.; Liu, G.; Bai, M.; Qian, Q.; He, J.; Xu, H. The FengYun-3 microwave radiation imager on-orbit verification. IEEE Trans. Geosci. Remote Sens. 2011, 49, 4552–4560. [Google Scholar] [CrossRef]
  29. Hall, D.K.; Riggs, G.A. MODIS/Aqua Sea Ice Extent 5-Min L2 Swath 1 Km, Version 6. 2015. Available online: https://nsidc.org/sites/default/files/myd29-v006-userguide_1.pdf (accessed on 6 March 2022).
  30. Barnes, W.L.; Xiong, X.; Salomonson, V.V. Status of Terra MODIS and Aqua MODIS. IEEE Int. Geosci. Remote Sens. Symp. 2002, 2, 970–972. [Google Scholar] [CrossRef]
  31. Hall, D.K.; Riggs, G.A.; Salomonson, V.V. MODIS Sea Ice Products User Guide to Collection 5. Available online: https://modis-snow-ice.gsfc.nasa.gov/uploads/siug_c5.pdf (accessed on 22 February 2022).
  32. Zhang, M.; Wang, S.J.; Qin, D.Y.; Qiu, H.; Tang, S.H. The inversion and quality validation of FY-3C MWRI sea surface temperature. J. Remote Sens. 2018, 22, 713–722. [Google Scholar] [CrossRef]
  33. Mathew, N.; Heygster, G.; Melsheimer, C. Surface Emissivity of the Arctic Sea Ice at AMSR-E Frequencies. IEEE Trans. Geosci. Remote Sens. 2009, 47, 4115–4124. [Google Scholar] [CrossRef]
  34. Comiso, J.C. Sea ice effective microwave emissivities from satellite passive microwave and infrared observations. J. Geophys. Res. 1983, 88, 7686–7704. [Google Scholar] [CrossRef]
  35. Shibata, A.; Imaoka, K.; Kachi, M.; Fujimoto, Y.; Mutoh, T. AMSR/AMSR-E sea surface temperature algorithm development, IGARSS 2003. In Proceedings of the 2003 IEEE International Geoscience and Remote Sensing Symposium, Toulouse, France, 21–25 July 2003; Volume 1, pp. 672–673, Proceedings (IEEE Cat. No. 03CH37477). [Google Scholar] [CrossRef]
  36. Yin, X.B.; Wang, Z.; Liu, Y.; Cheng, Y.; Gu, Y.; Fan, W. Comparison between Infrared and Microwave Radiometers for Retrieving the Sea Surface Temperature. Mar. Sci. Bull. 2007, 26, 3–10. [Google Scholar]
  37. Yan, H.; Li, X.Q.; You, Y.; Wu, S.L. Environmental Data Records from FengYun-3B Microwave Radiation Imager. Adv. Met. ST 2013, 3, 136–143. [Google Scholar]
  38. Mao, K.B.; Shi, J.; Li, Z.; Qin, Z.; Jia, Y. The Land Surface Temperature and Emissivity Retrieved from the AMSR Passive Microwave Data. Remote Sens. Land Resour. 2005, 3, 14–17+99. [Google Scholar]
  39. Worby, A.P.; Comiso, J.C. Studies of the Antarctic Sea Ice Edge and Ice Extent from Satellite and Ship Observations. Int. J. Remote Sens. 2004, 92, 98–111. [Google Scholar] [CrossRef]
Figure 1. Flight route of OIB funded campaigns during 2019.
Remotesensing 16 00490 g001
Figure 2. Data preprocessing flow chart.
Remotesensing 16 00490 g002
Figure 3. Distribution maps of the MYD29 and NHL L3 daily IST data on 1 February 2019.
Remotesensing 16 00490 g003
Figure 4. Correlation between the Tb of MWRI 18.7 GHz, 23.8 GHz, 36.5 GHz, and 89 GHz channels and MYD29 IST.
Remotesensing 16 00490 g004
Figure 5. Distribution maps of the MWRI daily Tb data on 1 February 2019.
Remotesensing 16 00490 g005
Figure 6. Distribution maps of the MWRI daily IST data on 1 February 2019.
Remotesensing 16 00490 g006
Figure 7. Scatter plot of inversion-obtained MWRI IST and NHL L3 IST data for each month in 2019.
Remotesensing 16 00490 g007aRemotesensing 16 00490 g007b
Figure 8. Daily bias error bars for MWRI IST and NHL L3 IST data.
Remotesensing 16 00490 g008
Figure 9. Scatter plot of inversion-obtained MWRI IST and HL L3 IST data for the six months in 2019.
Remotesensing 16 00490 g009
Figure 10. Comparison scatter plot in 2019 (a) MYD29 IST and KT19 IST data. (b) NHL L3 IST and KT19 IST data. (c) Inversion-obtained MWRI IST and KT19 IST data.
Remotesensing 16 00490 g010
Table 1. Source and resolution of the data [23,24,25,26,27].
SourceSatellite/SensorDatasetsParametersSpatial ResolutionTime Resolution
China National Satellite Meteorological CenterFY-3D/MWRIL1CBrightness Temperature 50 min
SICSea ice concentration12.5 km1 day
NASA LAADS DAACAqua/MODISMYD29Sea ice surface Temperature1 km5 min
MYD03Latitude and longitude1 km5 min
Ocean and Sea Ice Satellite Application FacilitNPP/VIIRSNHL L3Sea ice surface Temperature5 km12 h
Operation IceBridge KT19 IRSea ice surface Temperature15 m
Table 2. Main instrument parameters of FY-3D/MWRI [25].
SensorMWRI
Frequency (GHz)10.6518.723.836.589
Spatial Resolution (km × km)51 × 8530 × 5027 × 4518 × 309 × 15
Bandwidth (MHz)1802004009002 × 2300
Sensitivity (K)0.50.50.50.50.8
Satellite FY-3D
Polarization V/H
Breadth (km) ≥1400
Dynamic range (k) 3~340
Table 3. IST quality requirements thresholds [22].
Threshold, Buoy/KTarget, Buoy/KOptimal, Buoy/K
StdBiasStdBiasStdBias
4.04.53.03.51.00.8
Table 4. MWRI IST inversion monthly coefficients of determination (R2), January to December 2019.
Jan.Feb.Mar.Apr.MayJun.Jul.Aug.Sep.Oct.Nov.Dec.
R20.640.570.600.450.090.050.150.140.040.310.490.59
Table 5. MWRI IST inversion coefficients for the Arctic, 2019.
Matching Points K 0 K 1 K 2 K 3 K 4 K 5
January15,721,685396.19960.0614−0.2483−37.736226.5734−16.9252
February14,923,734353.66880.2722−0.2969−37.946131.6104−21.1286
March16,217,105468.9688−0.1132−0.2231−61.274546.4874−22.4522
April14,535,996285.91940.5516−0.4233−31.202923.4979−11.8030
May8,952,292294.12140.0949−0.1455−18.705413.8825−1.8806
June4,771,335285.2614−0.20270.12510.35230.08400.6738
July2,283,151227.7420−0.07220.13817.7663−0.94210.8756
August2,101,423288.8125−0.12460.1001−8.36910.32554.3951
September4,596,585318.4204−0.1239−0.0080−21.150716.8736−3.1576
October7,192,761339.41200.0474−0.1381−34.802030.7586−13.5859
November11,611,805329.94680.1754−0.2368−27.378120.7148−11.7784
December15,074,632307.47380.423−0.3608−25.83318.3021−13.7578
Table 6. Analysis of the monthly MWRI and NHL L3 IST data in 2019.
Std (°C)Bias (°C)Corr
Jan.3.81−0.670.85
Feb.4.18−1.550.75
Mar.4.54−1.490.78
Apr.3.96−1.670.72
May3.49−1.380.35
Jun.1.96−0.740.17
Jul.2.060.310.4
Aug.2.45−2.610.27
Sep.3.43−3.520.51
Oct.3.91−2.670.67
Nov.3.75−1.820.76
Dec.3.61−1.740.78
Disclaimer/Publisher’s Note: The statements, opinions and data contained in all publications are solely those of the individual author(s) and contributor(s) and not of MDPI and/or the editor(s). MDPI and/or the editor(s) disclaim responsibility for any injury to people or property resulting from any ideas, methods, instructions or products referred to in the content.

