1. Introduction
Over 50 years, the number of natural disasters driven by climate change and more extreme weather has increased by a factor of five [
1]. Disaster events caused by natural hazards affected approximately 100 million people and resulted in 15,082 deaths in 2020 alone [
2]. Therefore, it is important to improve Search and Rescue technologies that could assist the rescuers in locating victims, especially in challenging environments where human interventions are often dangerous and unfeasible.
Autonomous UAVs can be utilised to remotely operate in challenging environments. As an example, autonomous UAVs are used in critical applications such as surveillance [
3], SAR [
4], and mining [
5]. These critical applications increase in complexity in environments characterised by the absence of the GNSS and the presence of visual obstructions in the form of low luminosity, smoke, and dust. These particular conditions are a great challenge to UAV autonomous navigation, decision making, and target detection. Possible applications for autonomous UAVs are SAR operations such as the UAV Challenge [
6] and subterranean operations like the DARPA SubT Challenge [
7]. Australia also started using drones to detect sharks to learn more about their behaviours and to notify lifeguards of their presence [
8].
Autonomous perception and localisation in low-visibility conditions without the GNSS require the use of multiple sensors, allowing the agent to perceive its surrounding environment. A framework for UAV navigation under degraded visibility was developed in [
9,
10,
11,
12]. The objective was to allow a small UAV to autonomously explore and navigate in subterranean environments in the presence of visual obstructions. The final framework combined the use of 3D (three-dimensional) LIDAR (Light Detection and Ranging), a thermal camera, an RGB (red, green, blue) camera and an IMU to perform odometry and Simultaneous Localisation and Mapping (SLAM). The LIDAR was used for the LIDAR odometry and mapping (LOAM) method [
13], and both cameras were used for odometry only. The agent was able to explore cluttered, low-light environments in the presence of smoke and dust, without a GNSS signal. The main limitation of these papers was the restricted use of their framework in cluttered and indoor environments, where LIDAR is extremely efficient. Another gap in the knowledge from these papers is the lack of uncertainty modelling. Subterranean environments can cause uncertainty in observations, states, and actions due to their challenging conditions. An analysis of the use of multiple low-cost on-board sensors for ground robots or drones navigating in visually degraded environments was proposed by Sizintsev et al. [
14]. An IMU, stereo cameras with LED lights, active infrared (IR) cameras, and 2D (two-dimensional) LIDAR were successfully tested on a ground robot, but not on a UAV.
The use of thermal imagery for object detection is a possible solution for SAR missions operating in low-visibility conditions such as smoke, fog, or low luminosity (night). Jiang et al. [
15] proposed a UAV thermal infrared object detection framework using You Only Look Once (YOLO) models. The FLIR Thermal Starter Dataset [
16] was used to train the model, which contains four classes: person, car, bicycle, and dog. Their research consisted of car and person multi-object detection experiments using YOLOv3, YOLOv4, and YOLOv5 models. The conclusion drawn from these experiments was that the YOLOv5 model can be used on board a UAV due to its small size, relative precision, and speed of detection. Similarly, Dong et al. [
17] and Lagman et al. [
18] used YOLO models for human detection using thermal imagery.
Decision making under uncertainty is the process of an agent receiving an incomplete or noisy observation at a precise time and then choosing an action based on this observation [
19]. In SAR missions taking place under challenging conditions, the robotic agent is subjected to uncertainty due to the possible lack of the GNSS and by the presence of visual obstructions. Uncertainty and partial observability are modelled in two mathematical frameworks, the Markov Decision Process (MDP), and POMDPs. POMDPs were proven to be viable in UAV frameworks for autonomous navigation under partial observability and uncertainty [
20,
21,
22,
23]. Sandino et al. [
24] proposed a framework for UAV autonomous navigation under uncertainty and partial observability from imperfect sensor readings in cluttered indoor scenarios. The navigation problem was modelled as a POMDP and was solved in real time with the ABT solver. Only colour imagery was used to detect the target. In later work, Sandino et al. [
25] proposed a framework for UAV autonomous navigation in outdoor environments. The navigation problem was modelled with uncertainty and using a POMDP. Colour and thermal imagery were used to make the system more robust against the environmental conditions. Multiple flight modes were tested: a classic motion planner working with a list of position and velocity waypoints creating a survey zone, the POMDP motion planner, and a fusion of the two flight modes. The developed framework was able to find an adult mannequin by reducing the object detection uncertainty. Both research papers used the ABT online POMDP solver [
26]. A gap in the knowledge highlighted by both these works is the lack of testing in different visibility conditions, as the frameworks were not tested under poor visibility conditions.
This paper presents a framework for autonomous UAV navigation, exploration and target finding in low-visibility environments without the GNSS. The navigation problem is mathematically formulated using a POMDP, which models action and state uncertainty with probabilistic distributions. The navigation task is inspired by SAR in challenging environments. A UAV with a weight of 5 kg is deployed in a cluttered indoor environment to explore and locate a victim. Thermal imagery is used to detect the heat signature of a person under low-visibility conditions. This work evaluates the performance of the proposed framework via Software in the Loop (SITL) simulations, Hardware in the Loop (HIL), and real-life testing (RLT).
4. Framework Implementation
This section presents the hardware and software used to implement the framework as presented in
Section 3. To begin with, the UAV frame and payload, as well as operating systems and communication interface of the system, are highlighted. Then, the decision-making module, consisting of the POMDP formulation, is presented. Finally, both the computer vision and decision-making modules are explained.
4.1. UAV Hardware
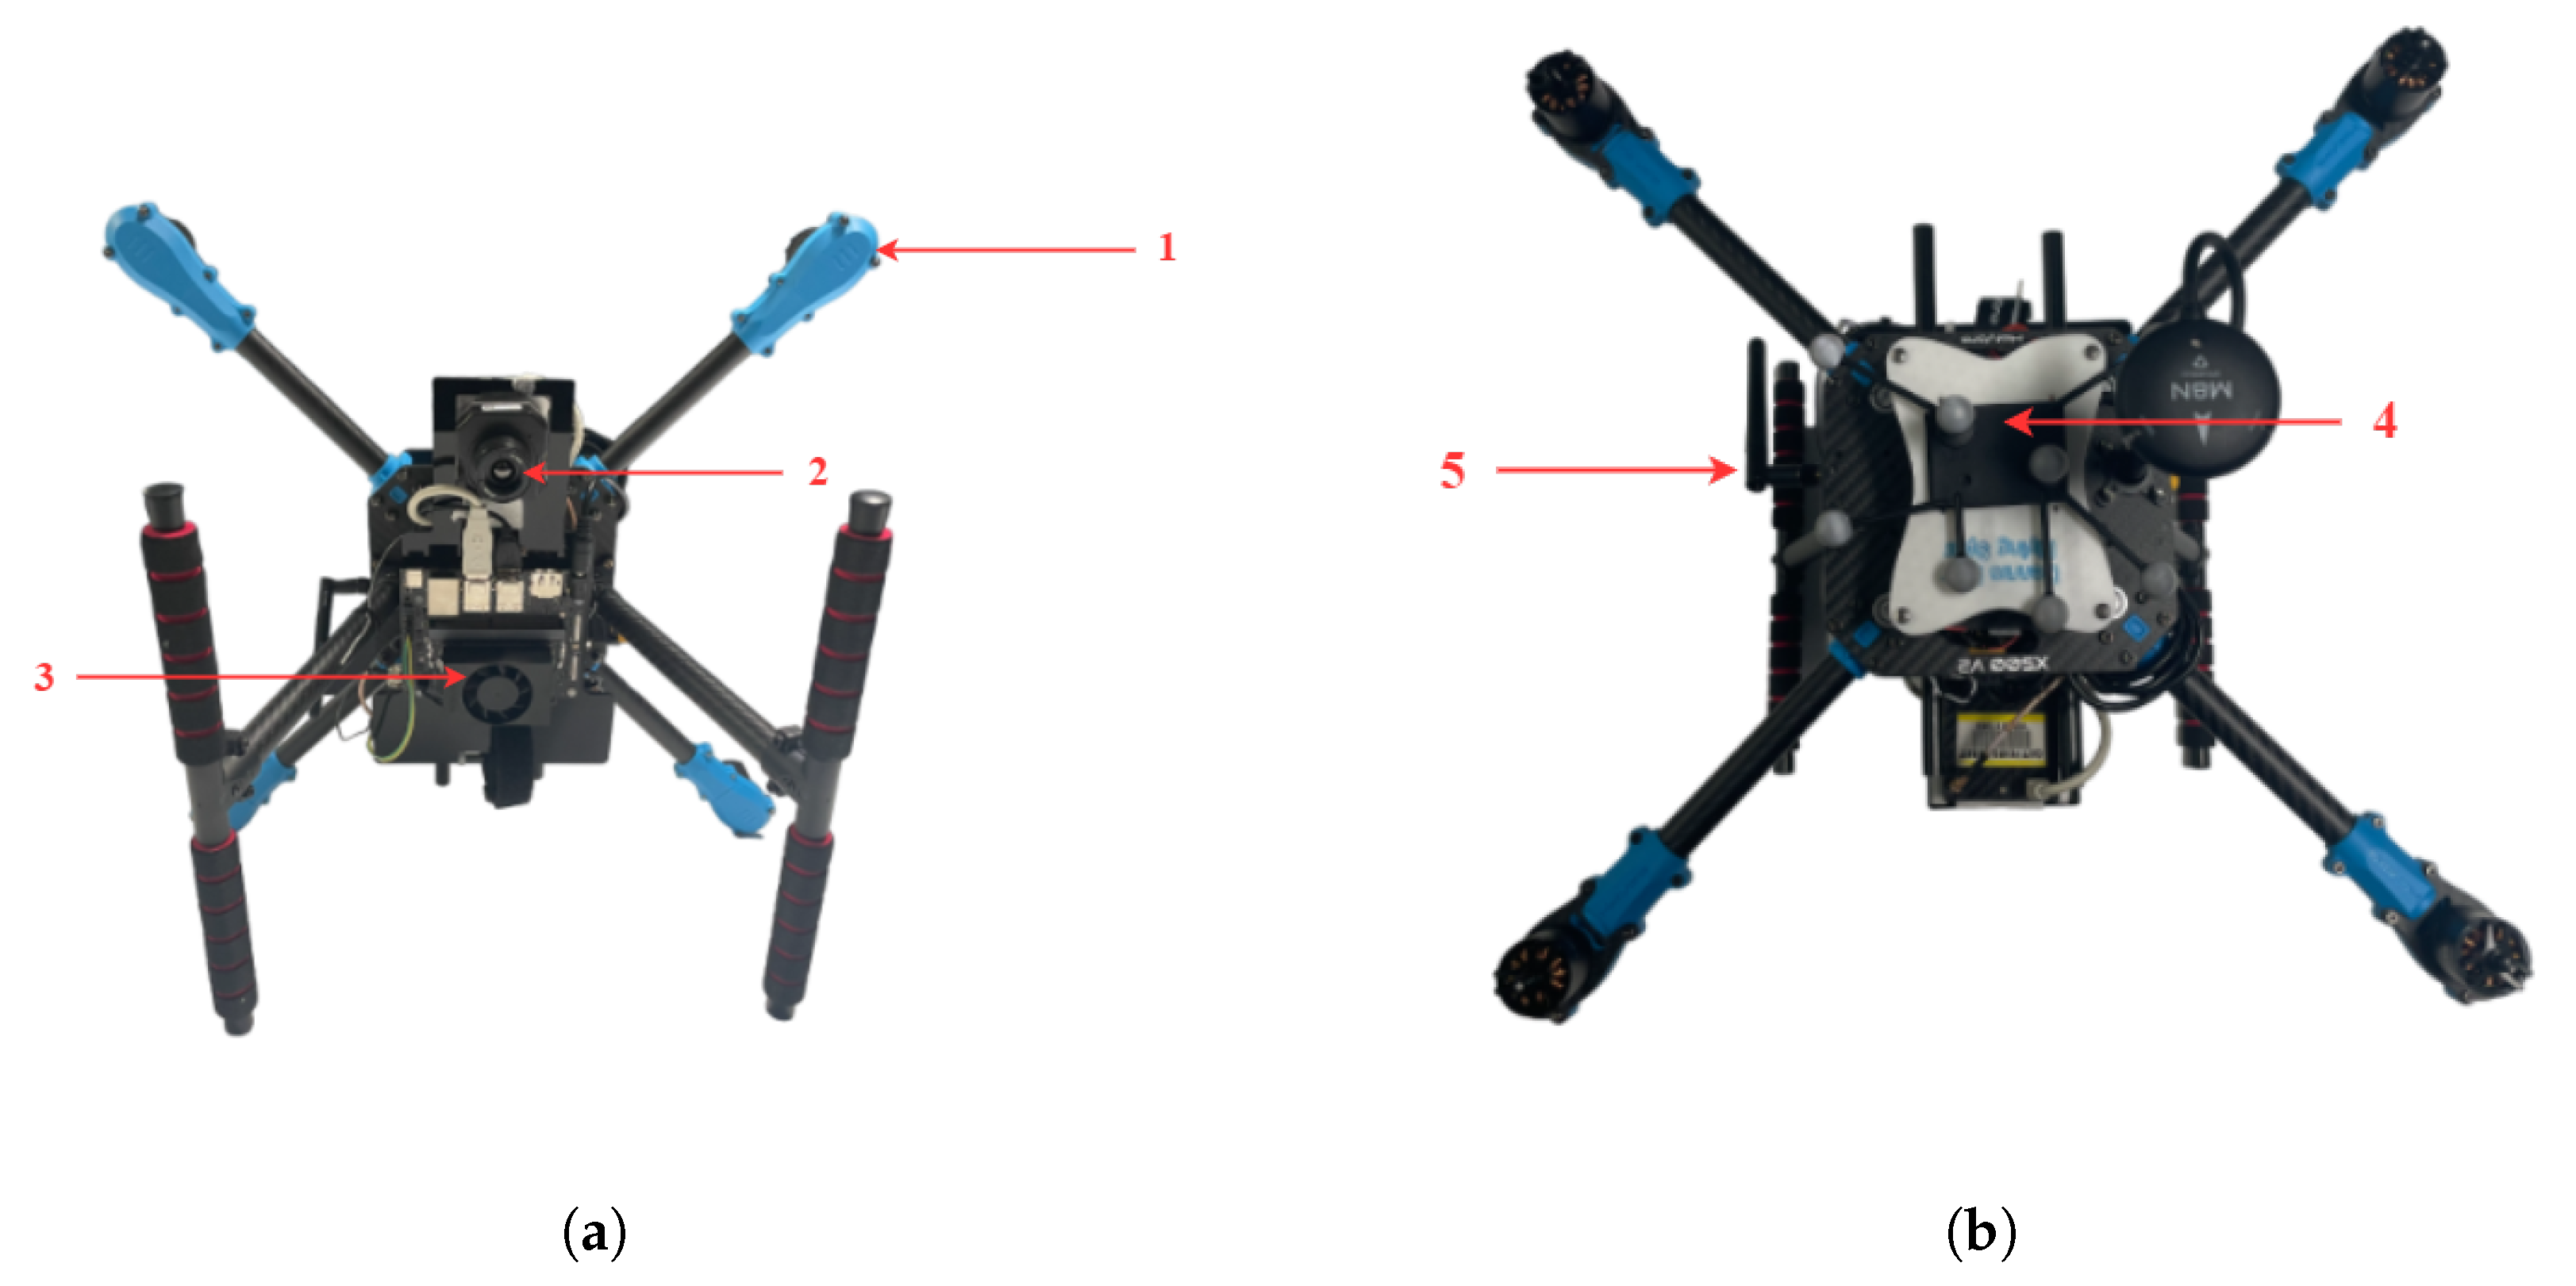
The UAV frame used in this paper is a Holybro (Shenzhen City, China) X500 V2 multi-rotor kit. The motors are Holybro 2216 KV920 motors, with 1045 propellers (10”/254 mm length, 4.5”/114.3 mm pitch). The selected autopilot is the Pixhawk 6c autopilot from Holybro, which is the same flight controller unit (FCU) interface used in simulation and in real-life testing, and communication is performed with a Holybro 915 MHz telemetry radio. The dimensions of the UAV are 500 × 215 × 1440 mm, with a payload capacity of 1 kg. The UAV is powered using a four-cell 5000 mAh LiPo battery. This provides a flight autonomy of approximately 8 min with a payload and 12 min without a payload.
The onboard computer processing the decision-making and detection module is an NVIDIA (Santa Clara, CA, USA) Jetson Orin Nano developer kit. It is composed of an NVIDIA Ampere architecture with 1024 NVIDIA® CUDA® cores and 32 Tensor cores, a 6-core Arm Cortex-A78AE v8.2 64-bit CPU, 8GB of LPDDR5 DRAM, four USB Type A 3.2 Gen2 ports, one USB Type C, one display port and a microSD card slot for main storage.
The sensors used in this framework are a FLIR (Wilsonville, OR, USA) TAU2 thermal camera with a 13 mm lens and a Field of View (FOV) of 45° (horizontal) × 37° (vertical), and an embedded IMU from Bosch® (Gerlingen, Germany) and InvenSense® (San Jose, CA, USA) in the Pixhawk 6c. Ultimately, the framework will include RPI S1 two-dimensional LIDAR from SLAMTEC (Shanghai, China) to perform LIDAR/inertial odometry to estimate the x and y coordinates of the UAV. The current pose estimation is performed with the integrated IMU and the OptiTrack system [
30]. In this framework, the thermal camera is solely used for target detection.
Figure 2 shows the fully integrated UAV platform.
4.2. Operating Systems and Middleware
Ubuntu 20.04, which is a 64-bit Linux-based operating system (OS), was installed on the companion computer. The robotic operating system (ROS) Noetic version [
31] was used to communicate between the sensors, decision-making module, and detection module. To control the UAV, the open-source flight control software PX4 firmware version 1.13.2 [
32] was used. The PX4 architecture can be separated into two layers: the flight stack, which is an estimation and flight control system, and the middleware, a general robotic layer. The former contains altitude and position estimators, as well as the pipelines of flight controllers. The latter can support a large variety of autonomous robots and contains the communication interfaces and the simulation layer. MAVROS [
33], a ROS wrapper of the Micro Air Vehicle Link (MAVLink) protocol [
34], was used for the communication between the decision-making module, which is processed on the onboard computer, and the motion module from the PX4. This communication is performed via a high-speed UART interface. Finally, communication to the ground control station (GCS) is achieved via the 915 MHz telemetry radio. The software used in the GCS is QGroundControl (version 4.0), which allows the GCS to communicate with the PX4 autopilot.
4.3. Mission Objectives
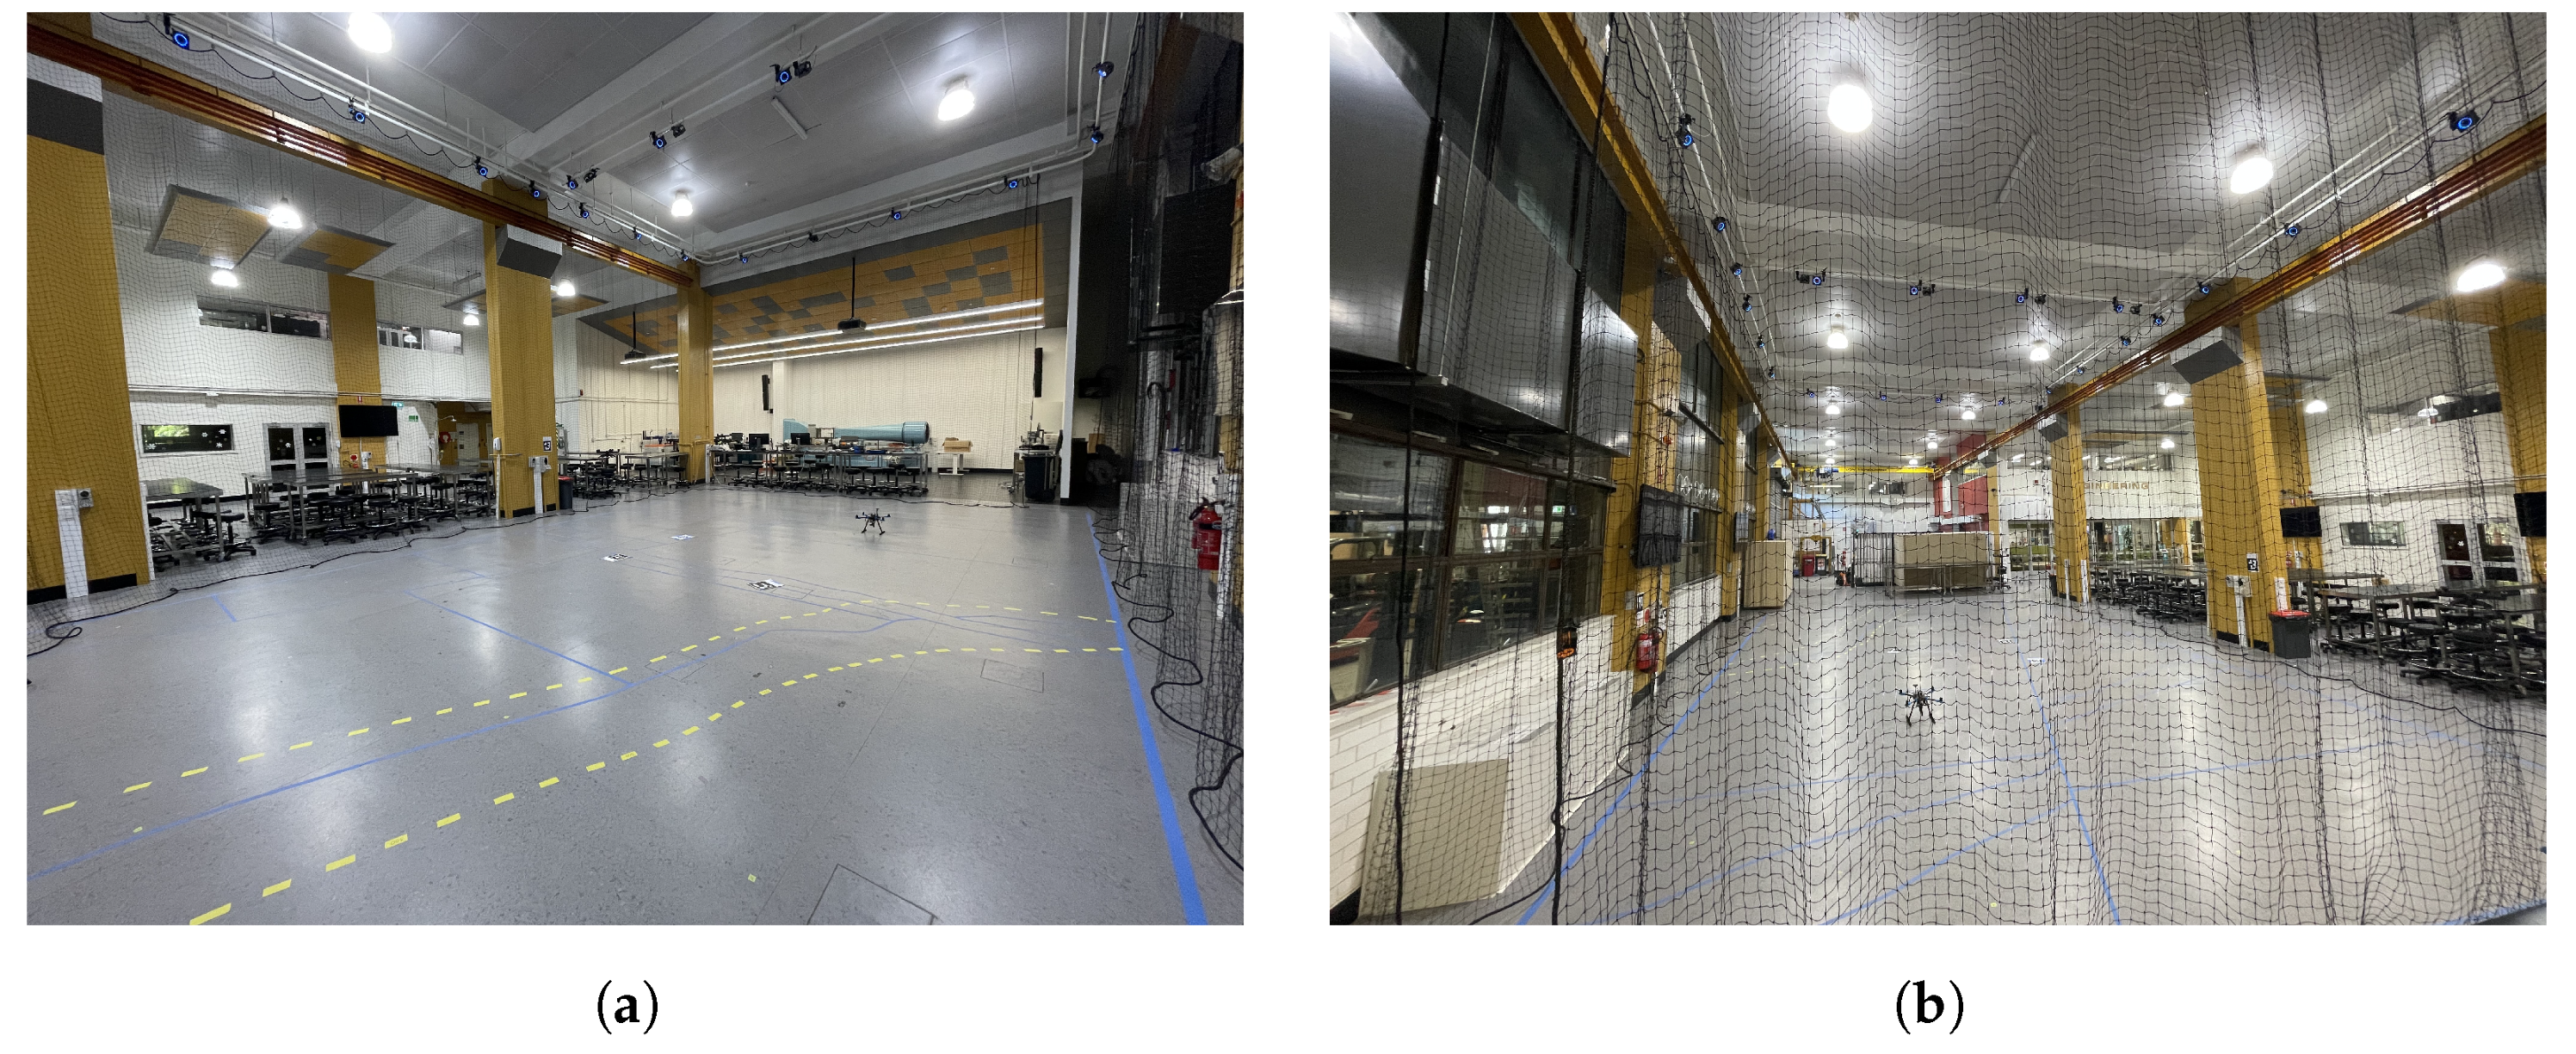
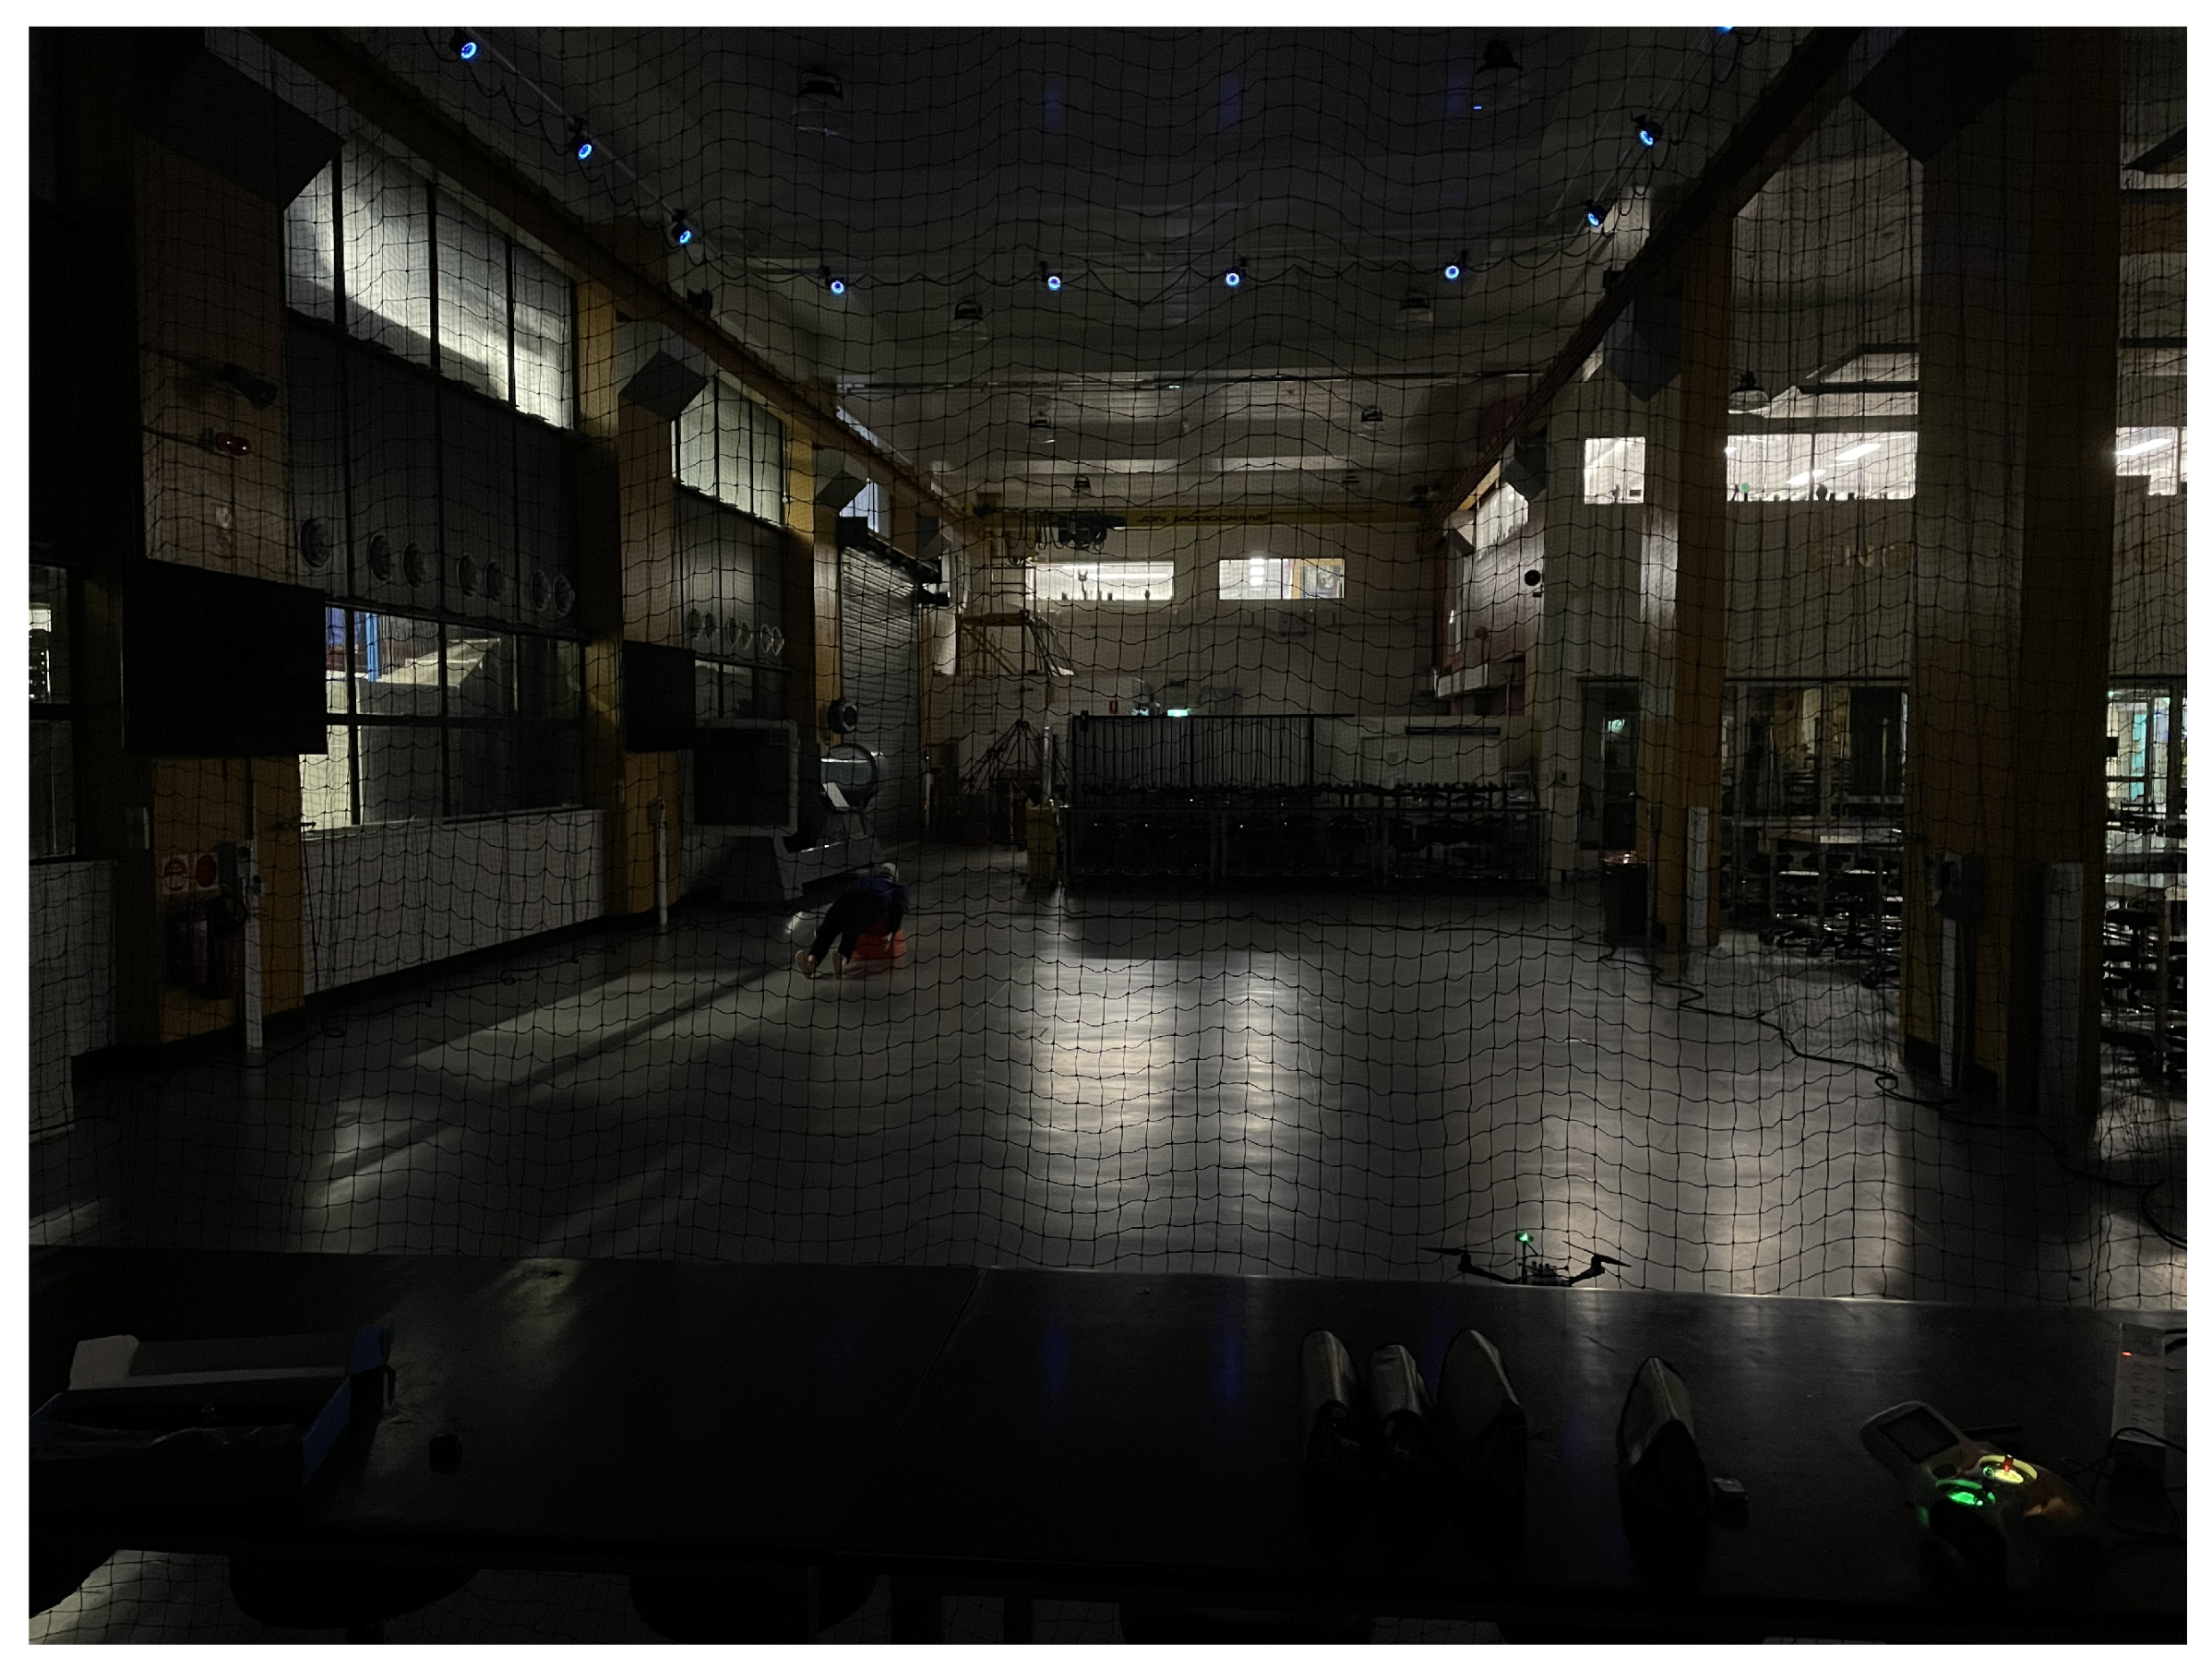
The navigation task selected is a SAR mission in which the agent is required to explore and find targets in an indoor environment composed of several obstacles, a restricted flying area, no GNSS, and low visibility. Search and Rescue was selected for its challenges and the large range of possible applications. A target, with a position unknown to the UAV, was placed in the flying area. The principal objective of the UAV is to explore the environment in search of the target. To create low-visibility conditions, the framework was tested in two different settings. In simulations, the mission was executed in the presence of smoke, while real-life testing was effectuated in a low-luminosity environment. The target used in this research is a mannequin able to emit a heat signature similar to a human being. The mission comprises two phases: take-off to the required altitude and the autonomous navigation phase, which ends when the target is found. A successful mission is defined by several parameters, including staying in the restricted flying area, avoiding obstacles, and detecting the target.
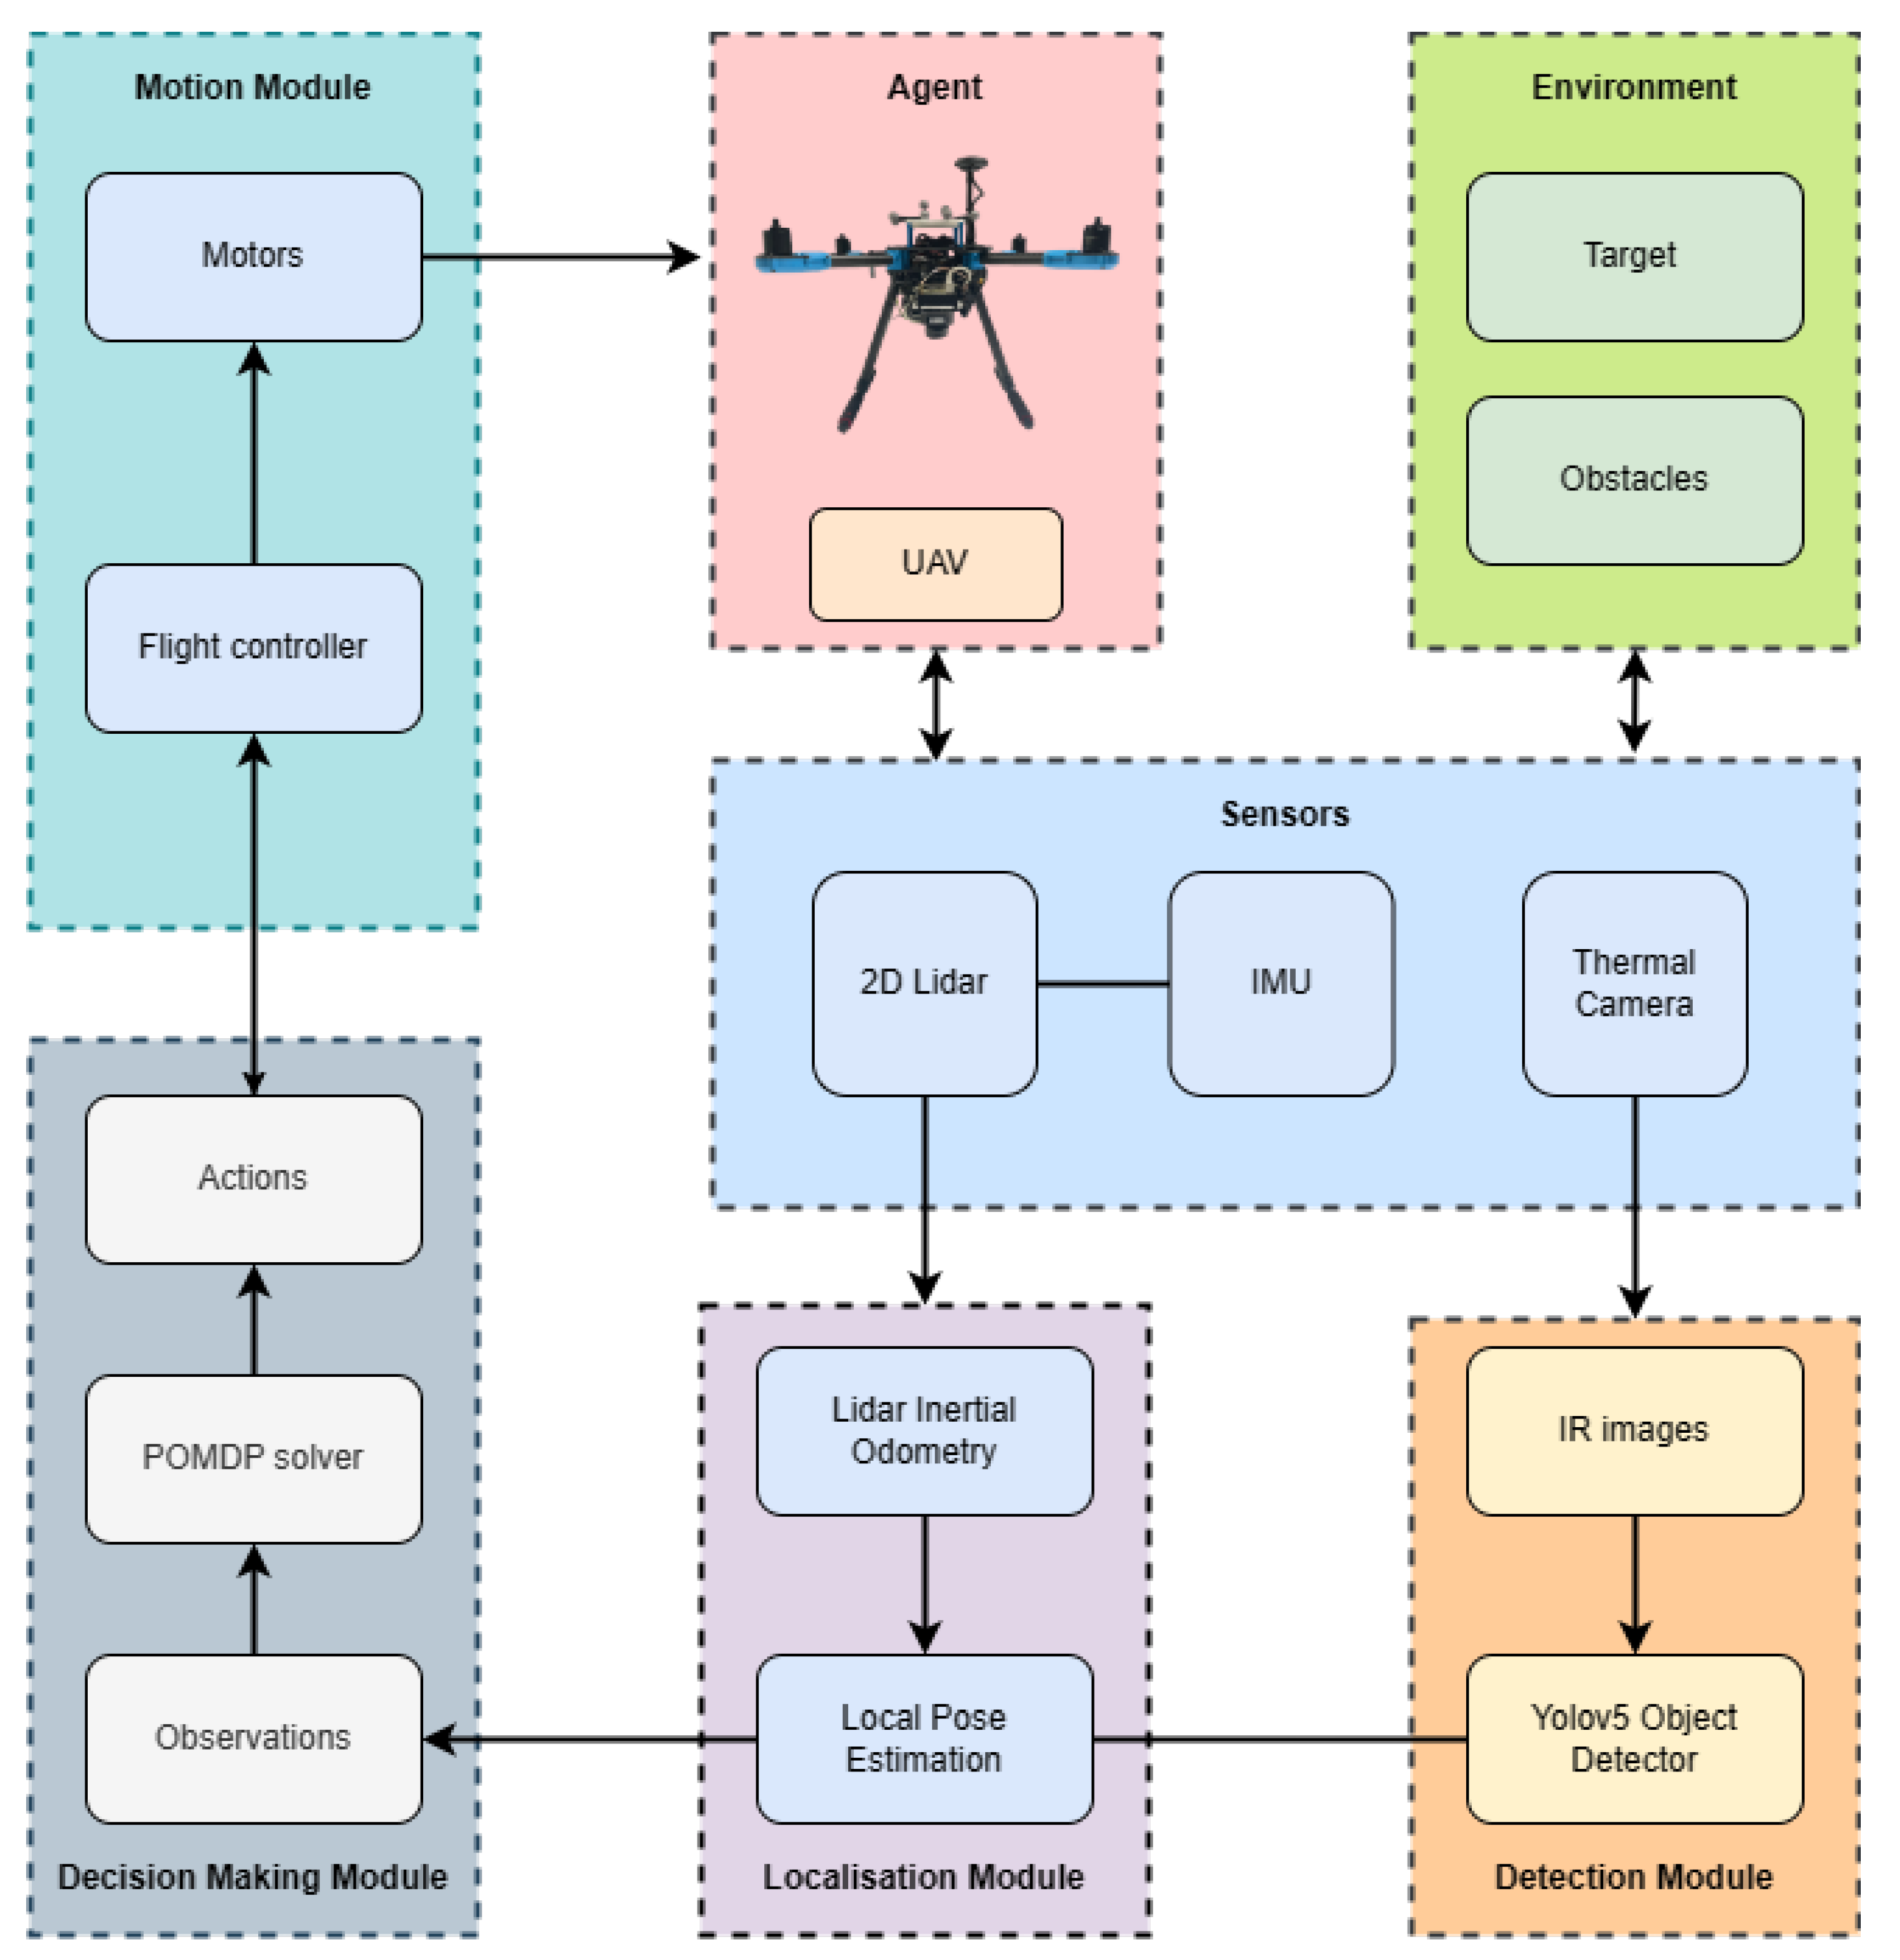
4.4. Decision-Making Module
In this work, the decision-making module receives input from the environment called observations and translates these observations into action commands resulting in a new agent state. The decision-making module is modelled following the POMDP representation, and more precisely implemented using the TAPIR software (commit e2c0da7) [
35]. TAPIR is a C++ implementation of the POMDP online solver ABT. Several parameters such as the discount factor and the magnitude of displacement need to be selected and tuned in order for the optimal policy to be estimated. Parameter tuning will be covered in
Section 5.2.2. This estimated optimal policy results in a successful mission, characterised by the agent’s ability to explore its environment and find the target while avoiding obstacles and staying in the region of interest (ROI). The following current assumptions are made in this paper:
The flight controller unit (autopilot) is assumed to include the take-off, landing, and return-home functions. The operator can regain control at all times if needed.
LIDAR and inertial odometry for pose and motion estimation are assumed to be incorporated in the UAV.
Observations are from real-time streaming of processed thermal imagery.
The autonomous mission (POMDP) starts when the UAV reaches an initial waypoint.
The mission finishes if the target is detected or if the maximum flight time is reached.
The target and obstacles are assumed static.
The problem formulation, including the state space, set of actions, transition function, rewards and reward function, observation space, and observation model, as well as the belief states, will be covered below.
4.4.1. State Space
The state space in this research is composed of , the state space of the agent, and , the state space of the target, and is represented by . The state space of the agent first includes its position and its rotation in the world Cartesian frame. To simplify the dynamic representation of the UAV, rotation is only in terms of the yaw angle . The state space of the agent also includes two discrete states representing if the agent has crashed and if it is outside the ROI, respectively, . Similarly, the target state comprises its position and a discrete state representing if the target has been found or not. The latter is marked true if and only if the frequency of target detection is higher than a selected threshold. In this representation, are terminal states.
4.4.2. Actions
Several actions were chosen for the UAV to interact with its environment as shown in
Table 1. The actions were restricted to pure translation (no rotations) to simplify the UAV’s dynamic.
4.4.3. Transition Function
A dynamic model of a UAV can be described using a rotation matrix
of a quad-rotor [
36].
, as shown by Equation (
2), was modified based on the actions as described in the previous section. Thus, the angles
and
are assumed constant, and
. The POMDP is a mathematical framework used to model decision making under uncertainty; thus, action uncertainty needs to be represented. An angle deviation
is introduced into the rotation matrix to represent action uncertainty in the Euler yaw angle. A normal distribution is used to model this uncertainty, with mean
and standard deviation
=
. This standard deviation value was selected based on the compass magnetometer heading accuracy used by the drone detailed in
Section 4.1.
To model changes in position at each time step, Equation (
3) was used, and can be expanded as shown in Equation (
4).
represents the change in the agent’s location from time step
t to
.
4.4.4. Reward Function
The reward function
is used to calculate the reward
r resulting from an action
a taken by the agent at state
s. The reward function is a capital element of the POMDP formulation, as it will dictate the behaviour of the agent by encouraging or punishing certain actions. The reward variables are the following:
Table 2 highlights the selected values for each reward. Negative rewards are used to avoid certain actions that will put the agent in an unwanted state. Both
and
are negative rewards. The former is used when the UAV crashes into an obstacle, and the latter when it is out of the ROI.
is a positive reward when the agent finds the target. To encourage the UAV to explore the environment,
is a negative accumulative reward, punishing the agent if an action results in an already explored area, and
is a positive reward, rewarding the UAV if an action results in an unexplored area.
is a reward encouraging the UAV to increase its altitude to facilitate the target detection module. The reward function is represented by Algorithm 1.
| Algorithm 1: Reward function algorithm. |
- 1:
r - 2:
ifthen - 3:
r - 4:
end if - 5:
ifthen - 6:
r - 7:
end if - 8:
ifthen - 9:
r - 10:
end if - 11:
ifthen - 12:
r - 13:
else - 14:
r - 15:
r - 16:
end if - 17:
return r
|
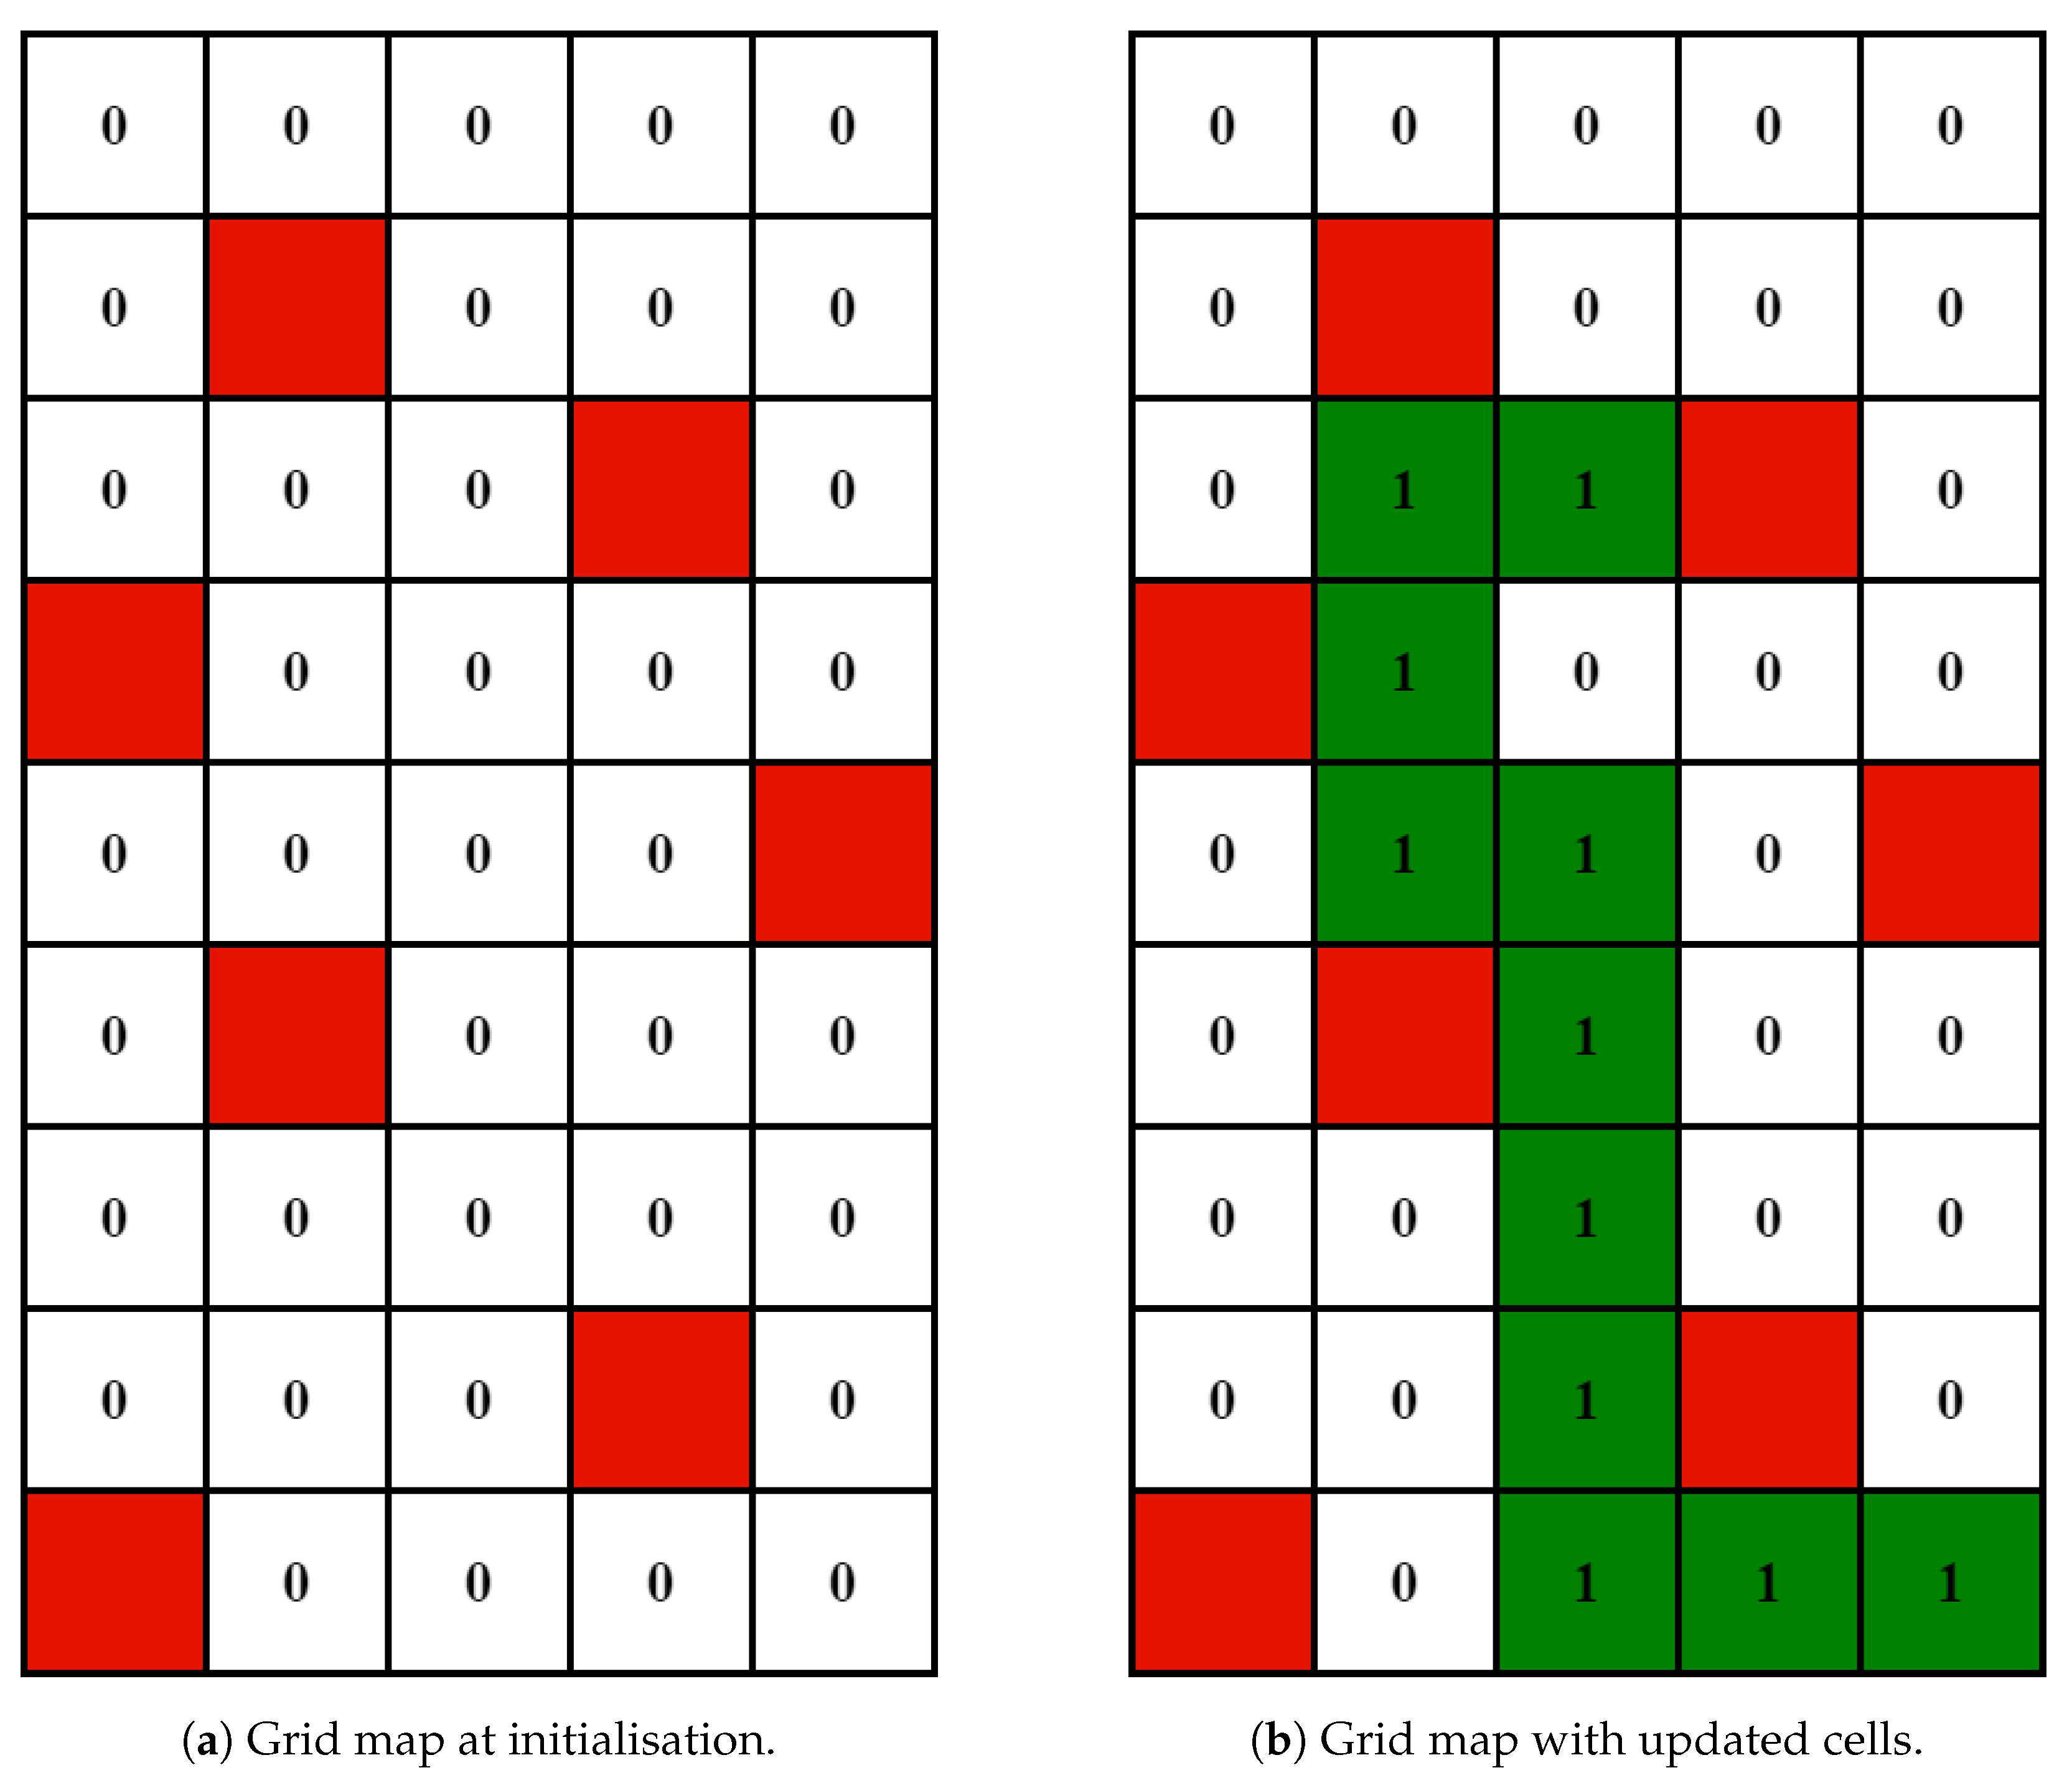
An important aspect of this research problem is to encourage the agent to explore the environment as much as possible, as the target position is unknown. To assist the agent in exploring its surroundings and avoid already explored areas, the environment is represented by a two-dimensional grid map composed of 1 × 1 m cells. Cells are modelled as a structure type that encapsulates data and parameters. Each cell is composed of top right and bottom left corner coordinates, a Boolean flag marking the cell as explored or unexplored, and an integer counting the number of times the UAV has explored the cell. For a cell to be marked as “explored”, the Boolean flag is set to true if and only if the observed position of the UAV is inside the cell.
Figure 3 illustrates how the grid map is initialised and updated. The illustration represents the environment in which the system was tested in simulation and in real life. Unexplored cells are white, explored cells are highlighted in green, and obstacles are highlighted in red. Cells that can be explored also contain in their centre the number of times they have been explored. A functionality allowing the agent to keep exploring until the target was detected or until the maximum flight was reached was also introduced by keeping track of the number of cells explored and selecting an arbitrary percentage of exploration. If this percentage is attained, all the cells are marked as unexplored, and their count is reset.
4.4.5. Observation Space
The set of observations
O is defined as:
where
is the local pose estimation of the agent,
is the local pose estimation of the target, and
is a discrete observation defining if the target has been detected or not.
is received only when the target is detected.
is a flag describing if the agent is close to an obstacle. This observation is obtained using an occupancy map object and the agent’s location within this map.
4.4.6. Observation Model
The observation model is a distribution function modelling the probability of observing an observation
o from state
s after performing action
a. As the ABT solver is a generative model; it is required to model an observation
o that is the result of an action
a and a new state
. The observation model includes the UAV-estimated position in the world coordinate frame
, as well as the location of the target
when it is detected by the camera. The detection of a victim using the camera’s FOV was based on Sandino et al. [
24,
25]. The footprint area of the thermal camera is calculated using its sensor width, height, and focal length. The target location point is predicted to be within the camera’s FOV if the calculated sum between the pairs of points comprising the footprint area and the target belief position is equal to
. In this research, it is assumed that there is no detection uncertainty, meaning that detection is always assumed to be correct. Furthermore, this observation model is designed for the detection of stationary objects and not for moving objects.
4.4.7. Belief States
Two sets of belief states are used in this work: the position of the UAV, represented by its
coordinates, and the position of the victim, represented by their coordinates as well. The position of the UAV is represented as a Gaussian distribution.
Section 4.6 will cover in more depth how the mean
and standard deviation
were defined. A Gaussian distribution is used to represent the
x and
y coordinates and
z is assumed to be known with a negligible uncertainty. As previously stated in
Section 4.3, the target position is unknown to the UAV. Therefore, the belief state of the target is uniformly distributed in the restricted flying area.
4.4.8. Obstacle Avoidance
Obstacle avoidance is implemented in this framework using occupancy maps. Occupancy maps are a 3D representation of the environment using occupancy grids consisting of cells. Each cell contains binary values representing whether the cell is occupied, free, or unknown. In this work, the Octopmap library [
37] was used. This library is used to make occupancy maps using 3D point cloud data, making it a popular choice for robotic applications requiring the computation of maps using sensors such as LIDAR and depth cameras. For this research, occupancy maps were generated manually prior to the mission and then used by the decision-making module.
4.5. Detection Module
The computer vision module is composed of a deep learning network structure that processes object detection and classification from the FLIR TAU 2 thermal camera’s raw frames. The deep learning model used was YOLOv5 [
38], which is part of the You Only Look Once (YOLO) family of computer vision models. YOLOv5 was selected following Jiang et al.’s [
15] research, which compared YOLOv3, YOLOv4, and YOLOv5 models for a UAV thermal infrared object detection framework. YOLOv5 was also selected for its simple integration with the ROS. The dataset used was developed by the Roboflow Universe Project to detect persons in infrared frames [
39]. The YOLOv5 model was then trained using this dataset containing over 15,000 images. These images consist of a mix of thermal images taken from a car using the FLIR Tau2 thermal camera (Teledyne FLIR Thermal Dataset) [
16] and thermal images taken by surveillance cameras.
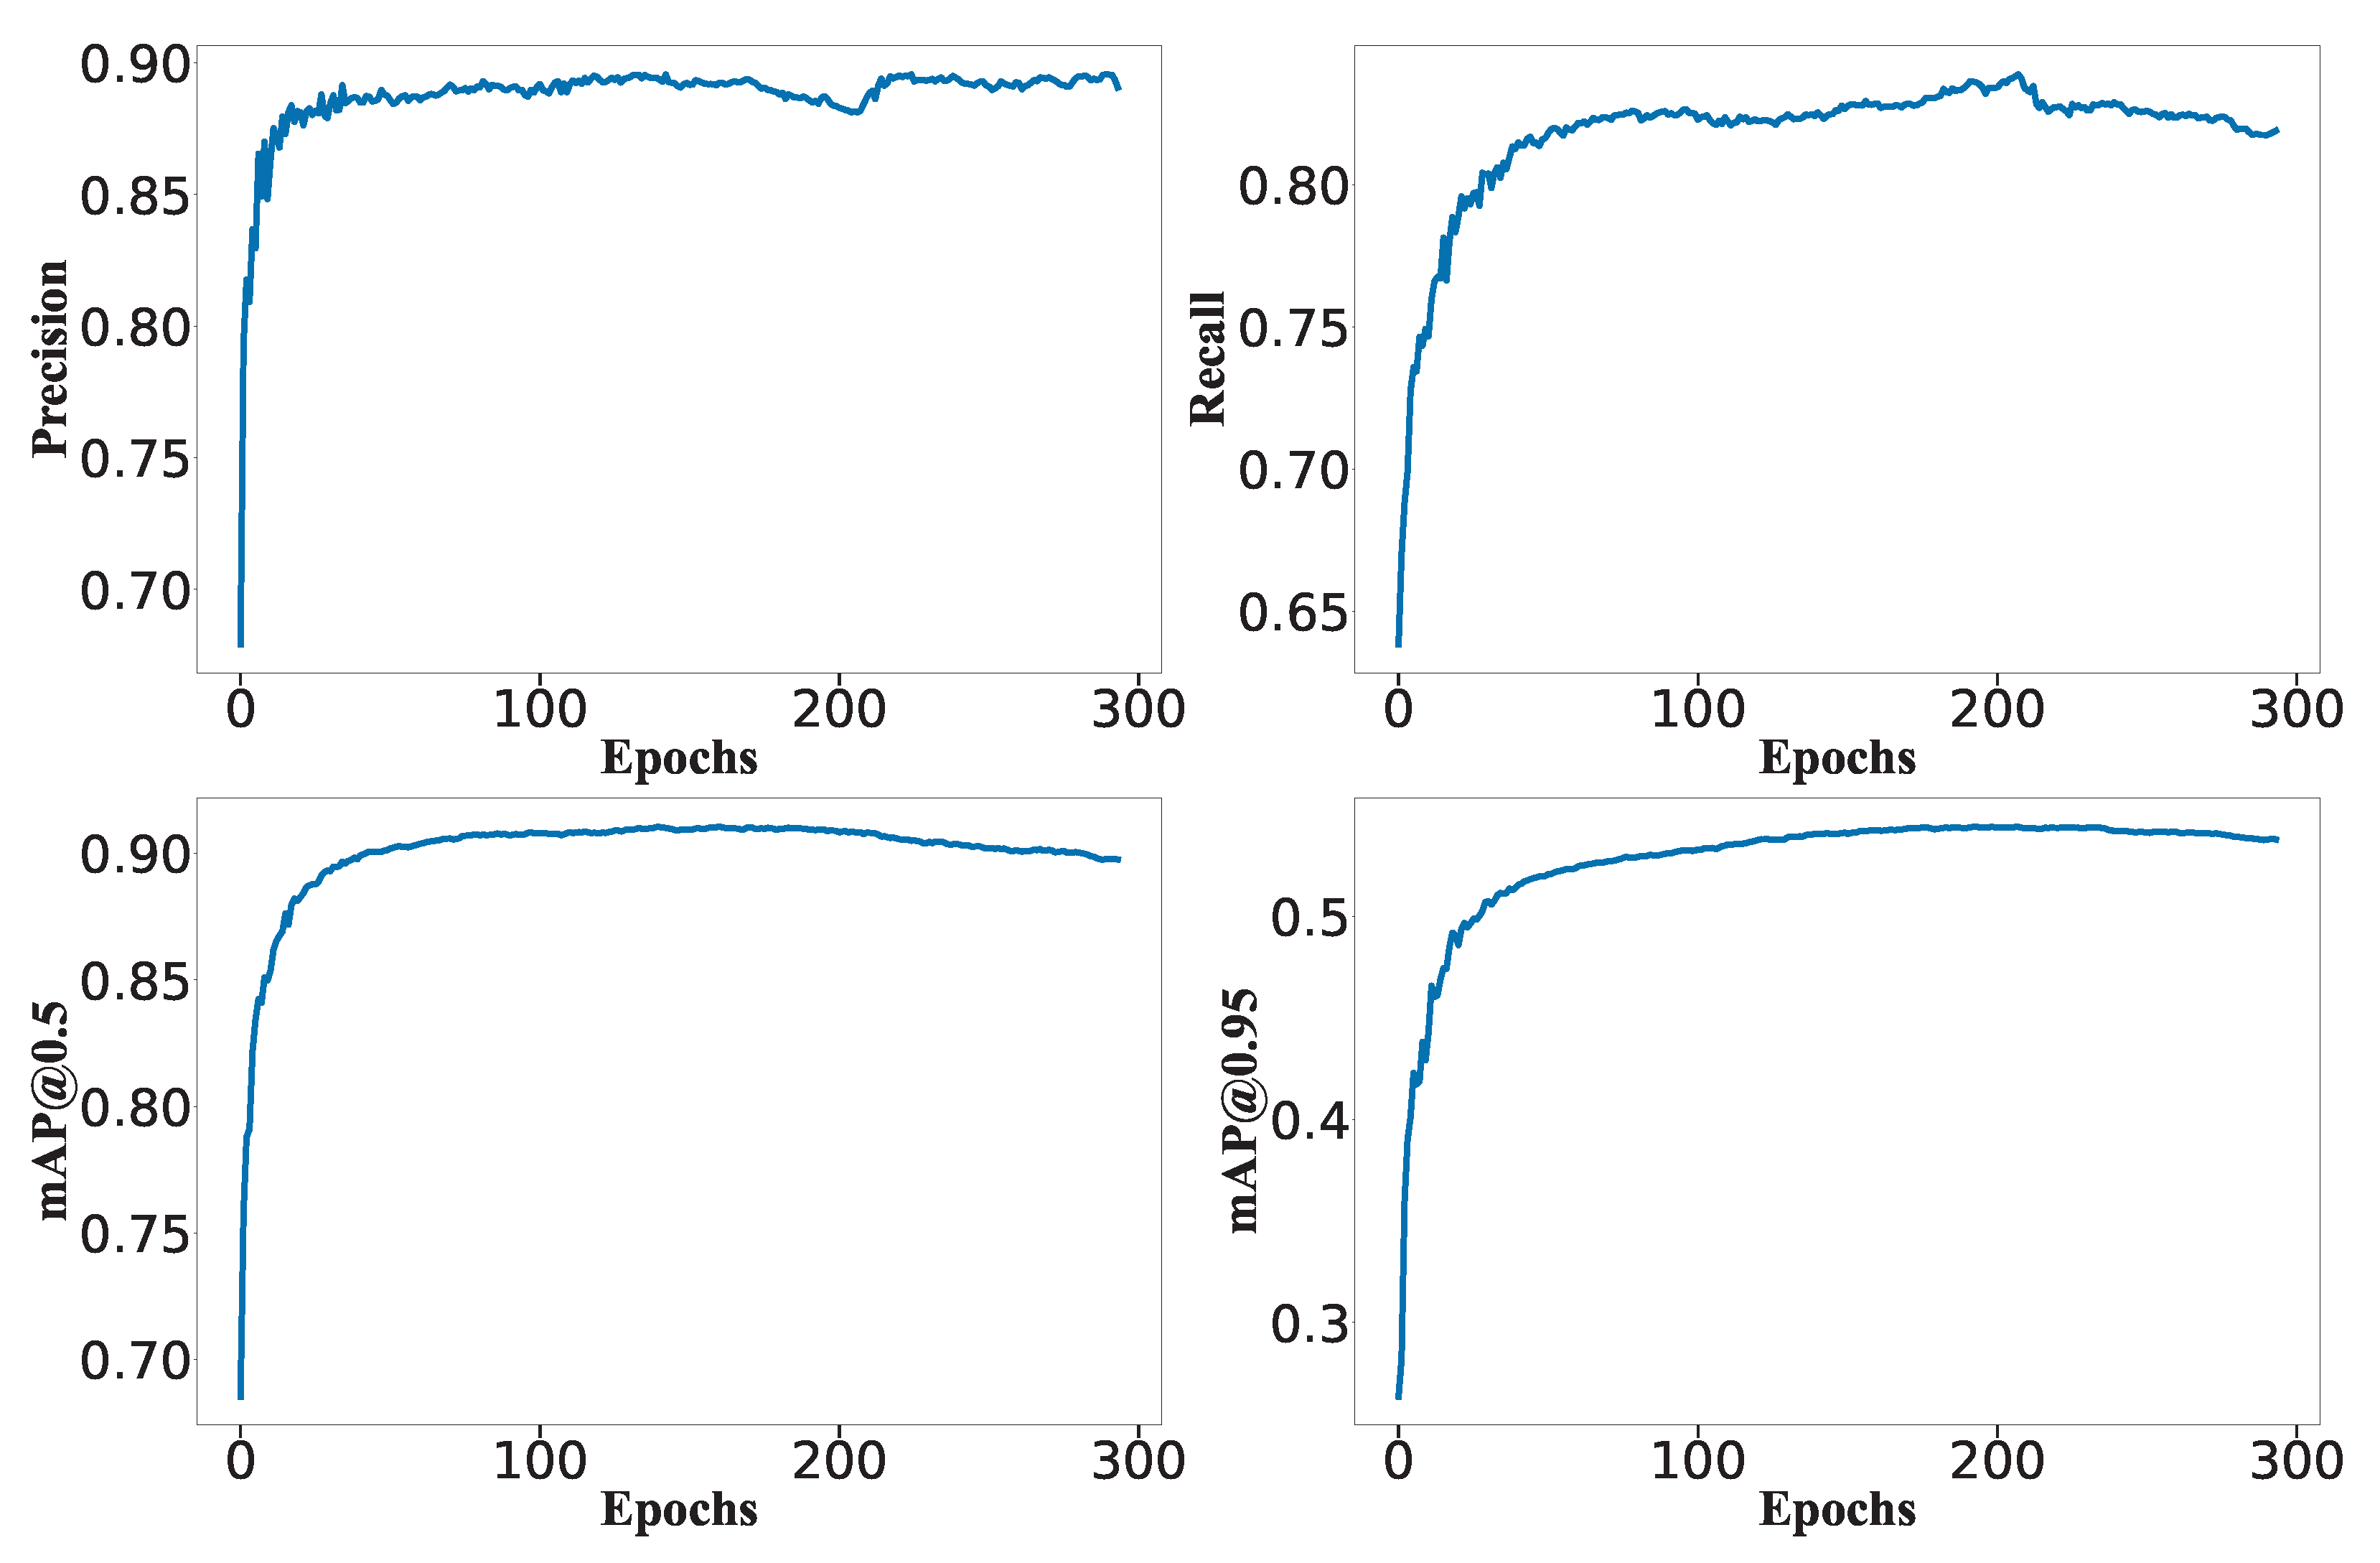
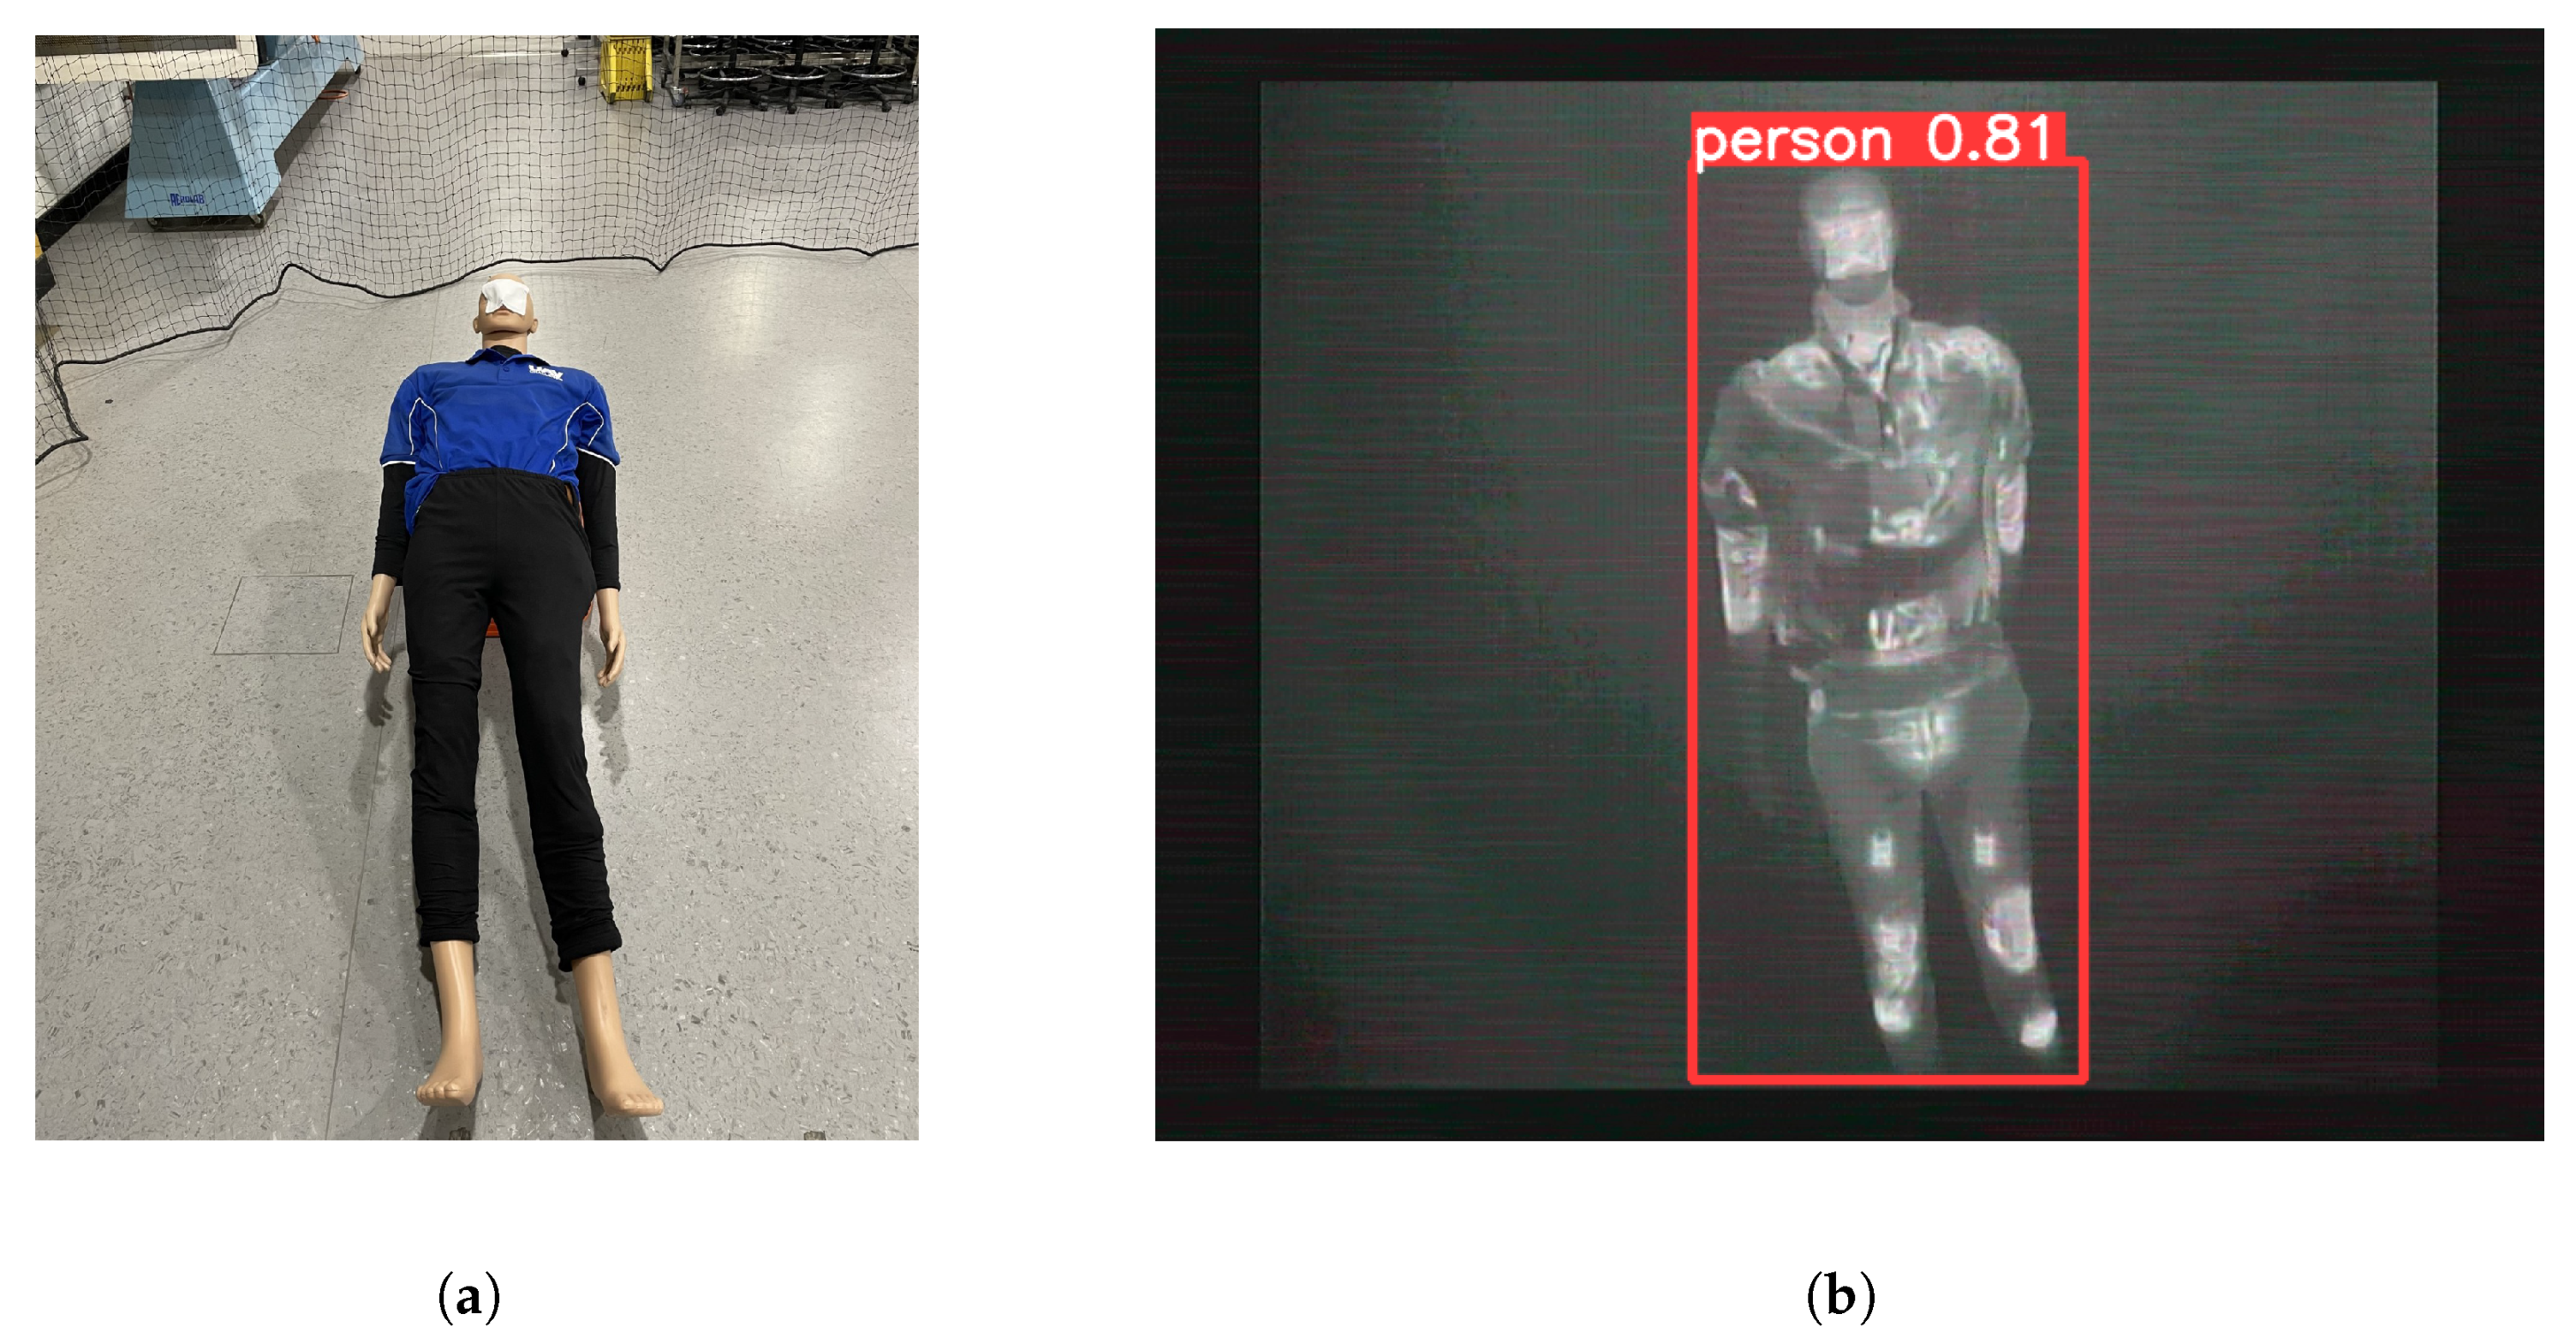
Figure 4 highlights the evaluation indicator of the YOLOv5 model during the training used in this paper. A total of 500 epochs were originally selected for training this model; however, the training was stopped at 293 epochs as the results were not improving. The YOLOv5 model achieved metric values of 89.1%, 81.9%, 89.8%, and 0.54% for precision, recall, mean average precision with an intersection over union (IoU) of 50 % (mAP_0.5), and mean average precision with an IoU interval of 50 % to 95% (mAP_0.95). Overall, the only metric with a low performance was mAP_0.95, while the precision, recall, and mAP_0.5 metrics are satisfactory. The model was tested in simulations and in real life to verify if improvements were needed before the full integration of the system. Even with a low mAP_0.95, the model was able to detect the heated mannequin consistently with few false positives and false negatives in simulation and real life.
Figure 5 shows the heated mannequin used in real-life experiments and the YOLOv5 detection when the UAV was flying above the target. More information about the mannequin will be given in
Section 5.1.
4.6. Localisation Module
LIDAR/inertial odometry is yet to be integrated within the current system; however, it was individually tested in low-luminosity conditions. The sensor used was the RPI S1 two-dimensional sensor, and the Hector SLAM package [
40] was used to estimate the motion of the UAV. Two sets of data were processed: the ground truth and the pose estimation from LIDAR/inertial odometry. As the pose uncertainty in the POMDP representation is modelled as a Gaussian distribution, the standard deviation of the error between these two sets of data was calculated. This value was then used in the Gaussian distribution, with the observed agent’s position as the mean, and the calculated value as the standard deviation. Pose estimation was achieved using the PX4 SITL and HIL capabilities. In simulations, PX4 relies on Gazebo plugins and simulated sensors such as the GNSS and IMUs. In real life, it relies on the Optitrack system (please refer to
Section 4.1 for more information) and internal sensors.
6. Results
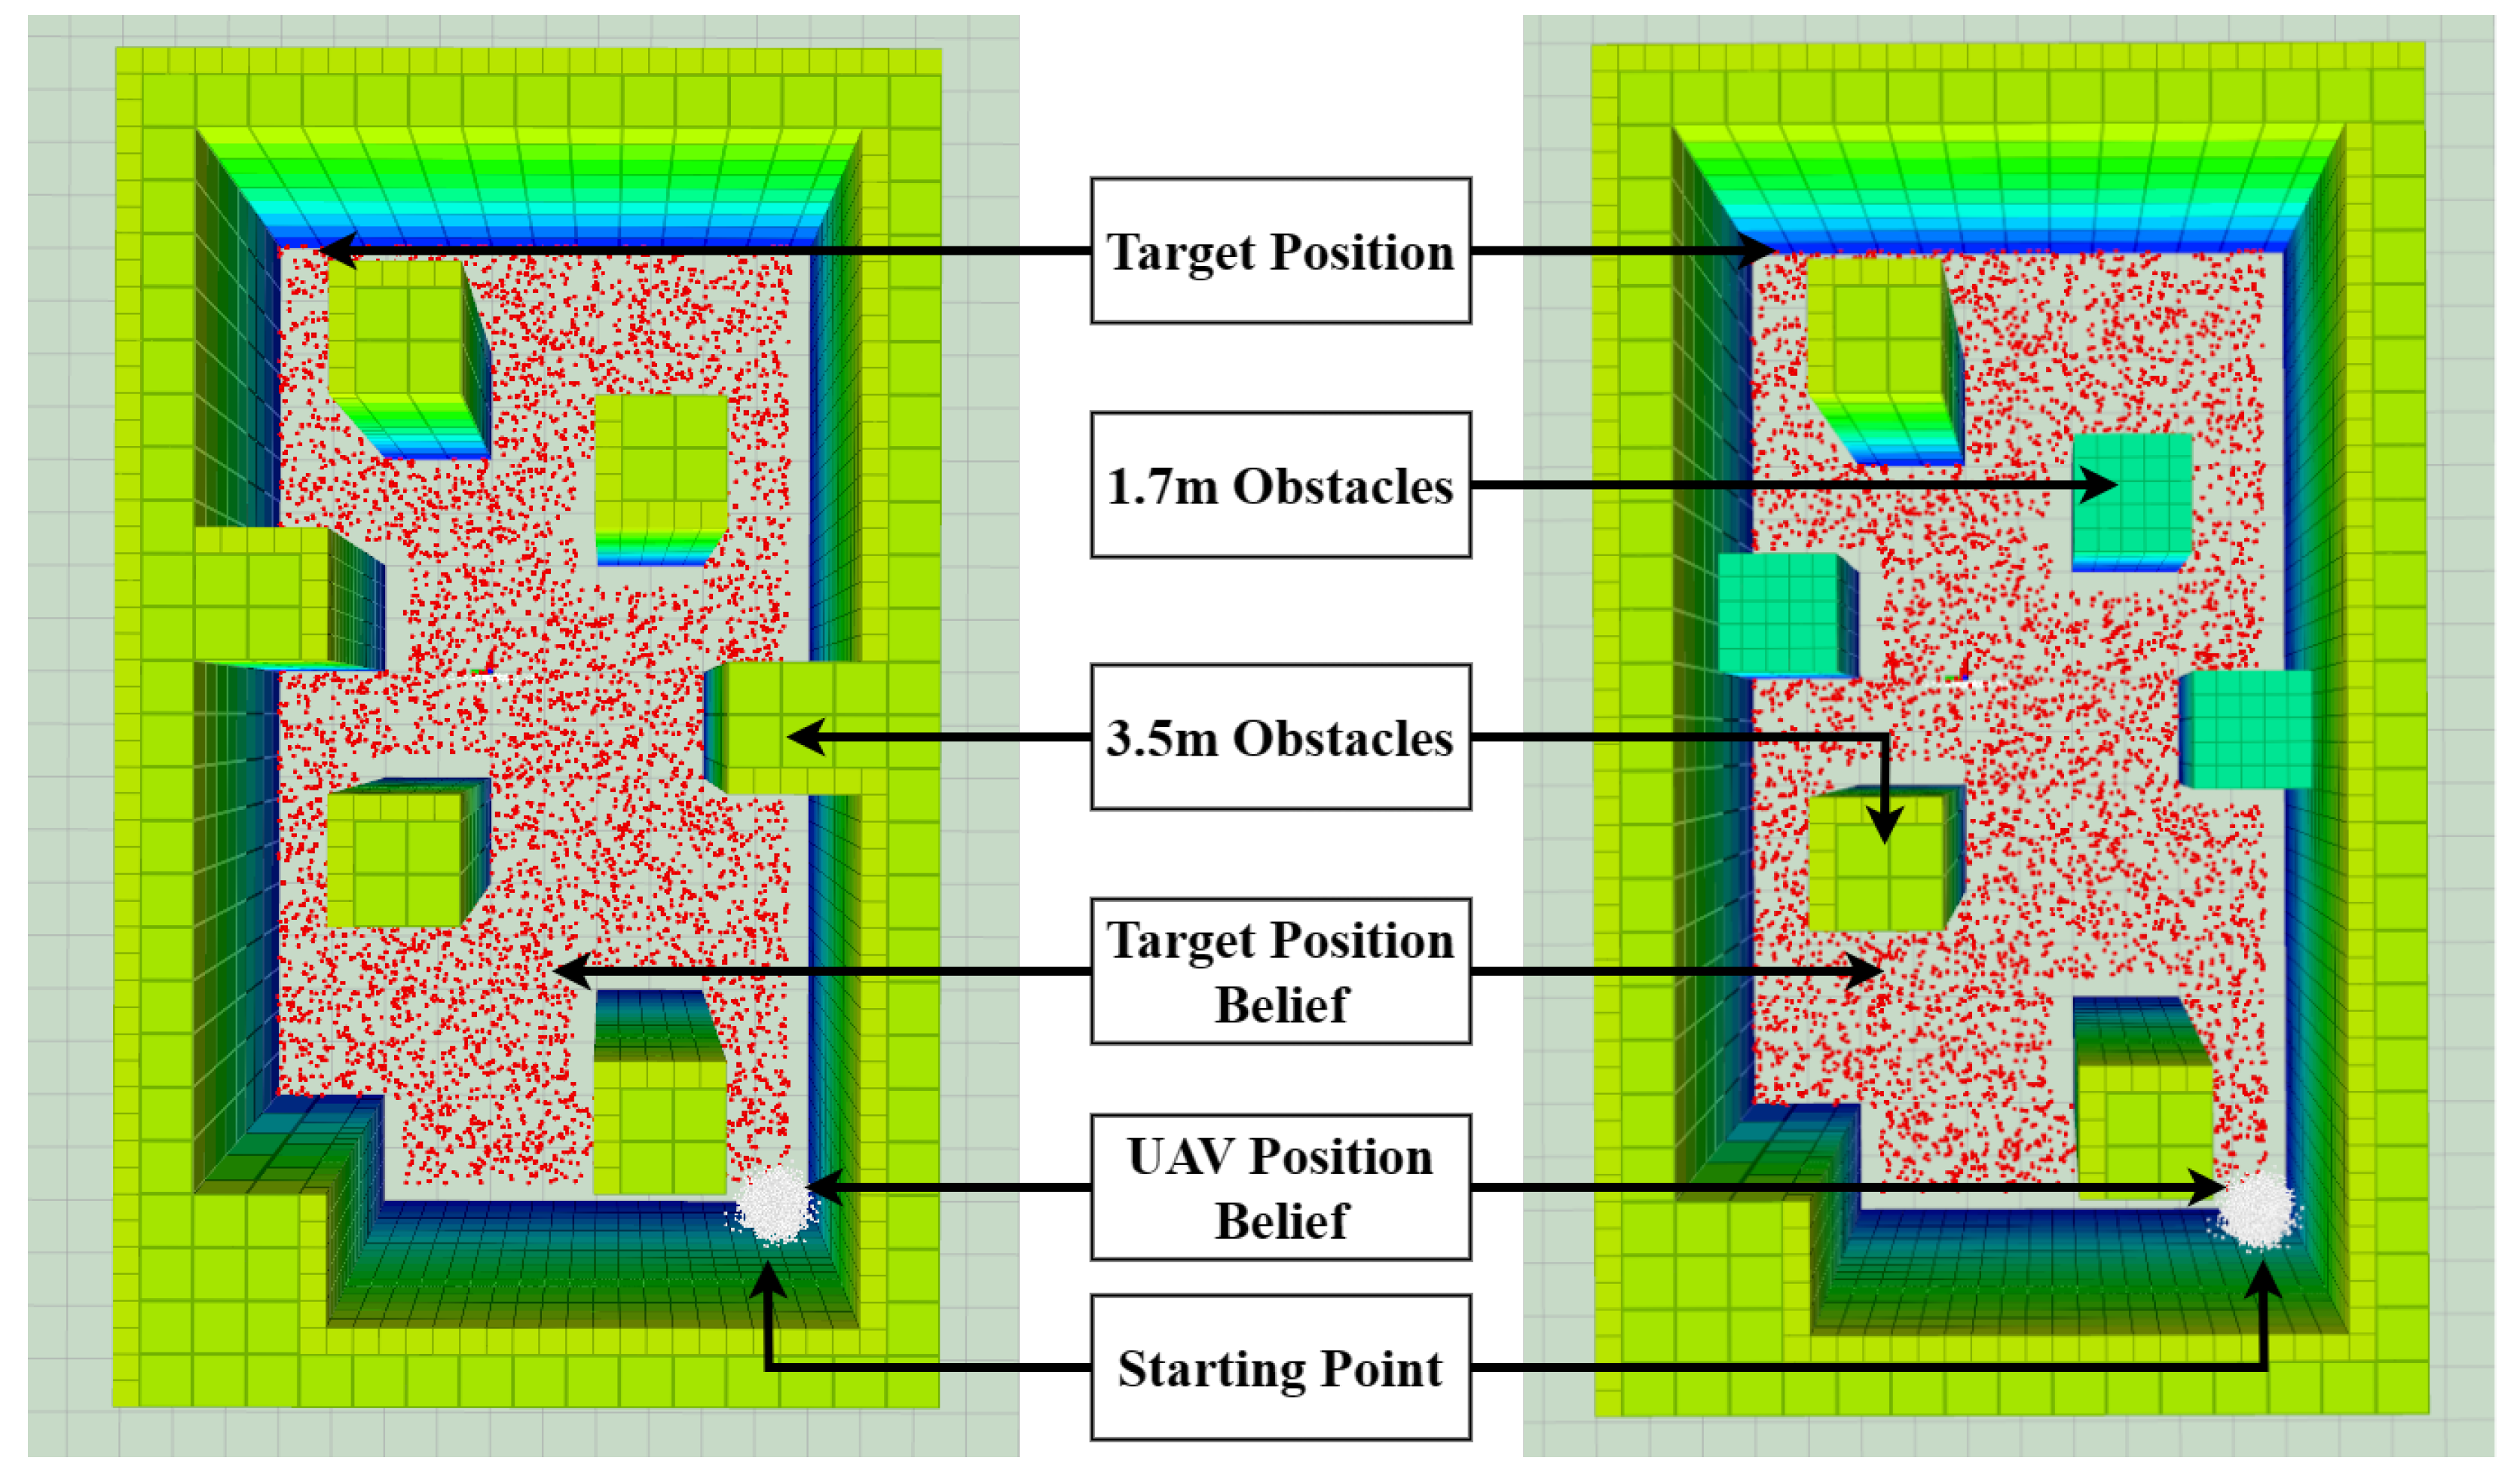
Two different setups were tested in simulation (S) and in real-life testing. Each setup was tested in normal (NV) and low-visibility (LV) conditions. The first testing configuration (M1) consists of obstacles of different heights, from 1.65 m to 3.5 m (limit of altitude), while the second setup (M2) only has obstacles of 3.5 m. The metrics used to evaluate the success of each setup consist of Success (target found), Crash (if the UAV collides with an obstacle), ROI Out (if the UAV leaves the ROI), and Timeout (target not found in the time limit). In these tests, the target position was opposite the starting position of the UAV, with coordinates of (4.5;1.5).
Figure 10 shows the RViz environment of both maps, and
Table 4 summarises the results:
From all the testing scenarios presented, the proposed framework performed perfectly in simulations, with a 100% success rate (target found with no crashes), and a 96.87% success rate in real-life testing. For the simulation, a total of 120 iterations through all the setups (30 each) were performed, and 32 iterations for real-life testing (8 each). Overall, the proposed system performed identically in simulations and in real life, with similar results. The agent found the target in both maps and in different visibility conditions, highlighting the ability of the decision-making module to explore different environments and the ability of the thermal camera and object detection module to detect the target in normal and low-visibility conditions. The differences between the heat signature of a human being and the heated mannequin used in real-life testing did not impact the operation of the agent. On the contrary, the mannequin was placed in a seated position in simulations to facilitate detection, as the laying-down model was consistently miss-detected. These miss-detections were caused by differences between the target used in simulation and the actual detection model. The YOLOv5 model was trained using actual people and was not trained to detect the simulated mannequin.
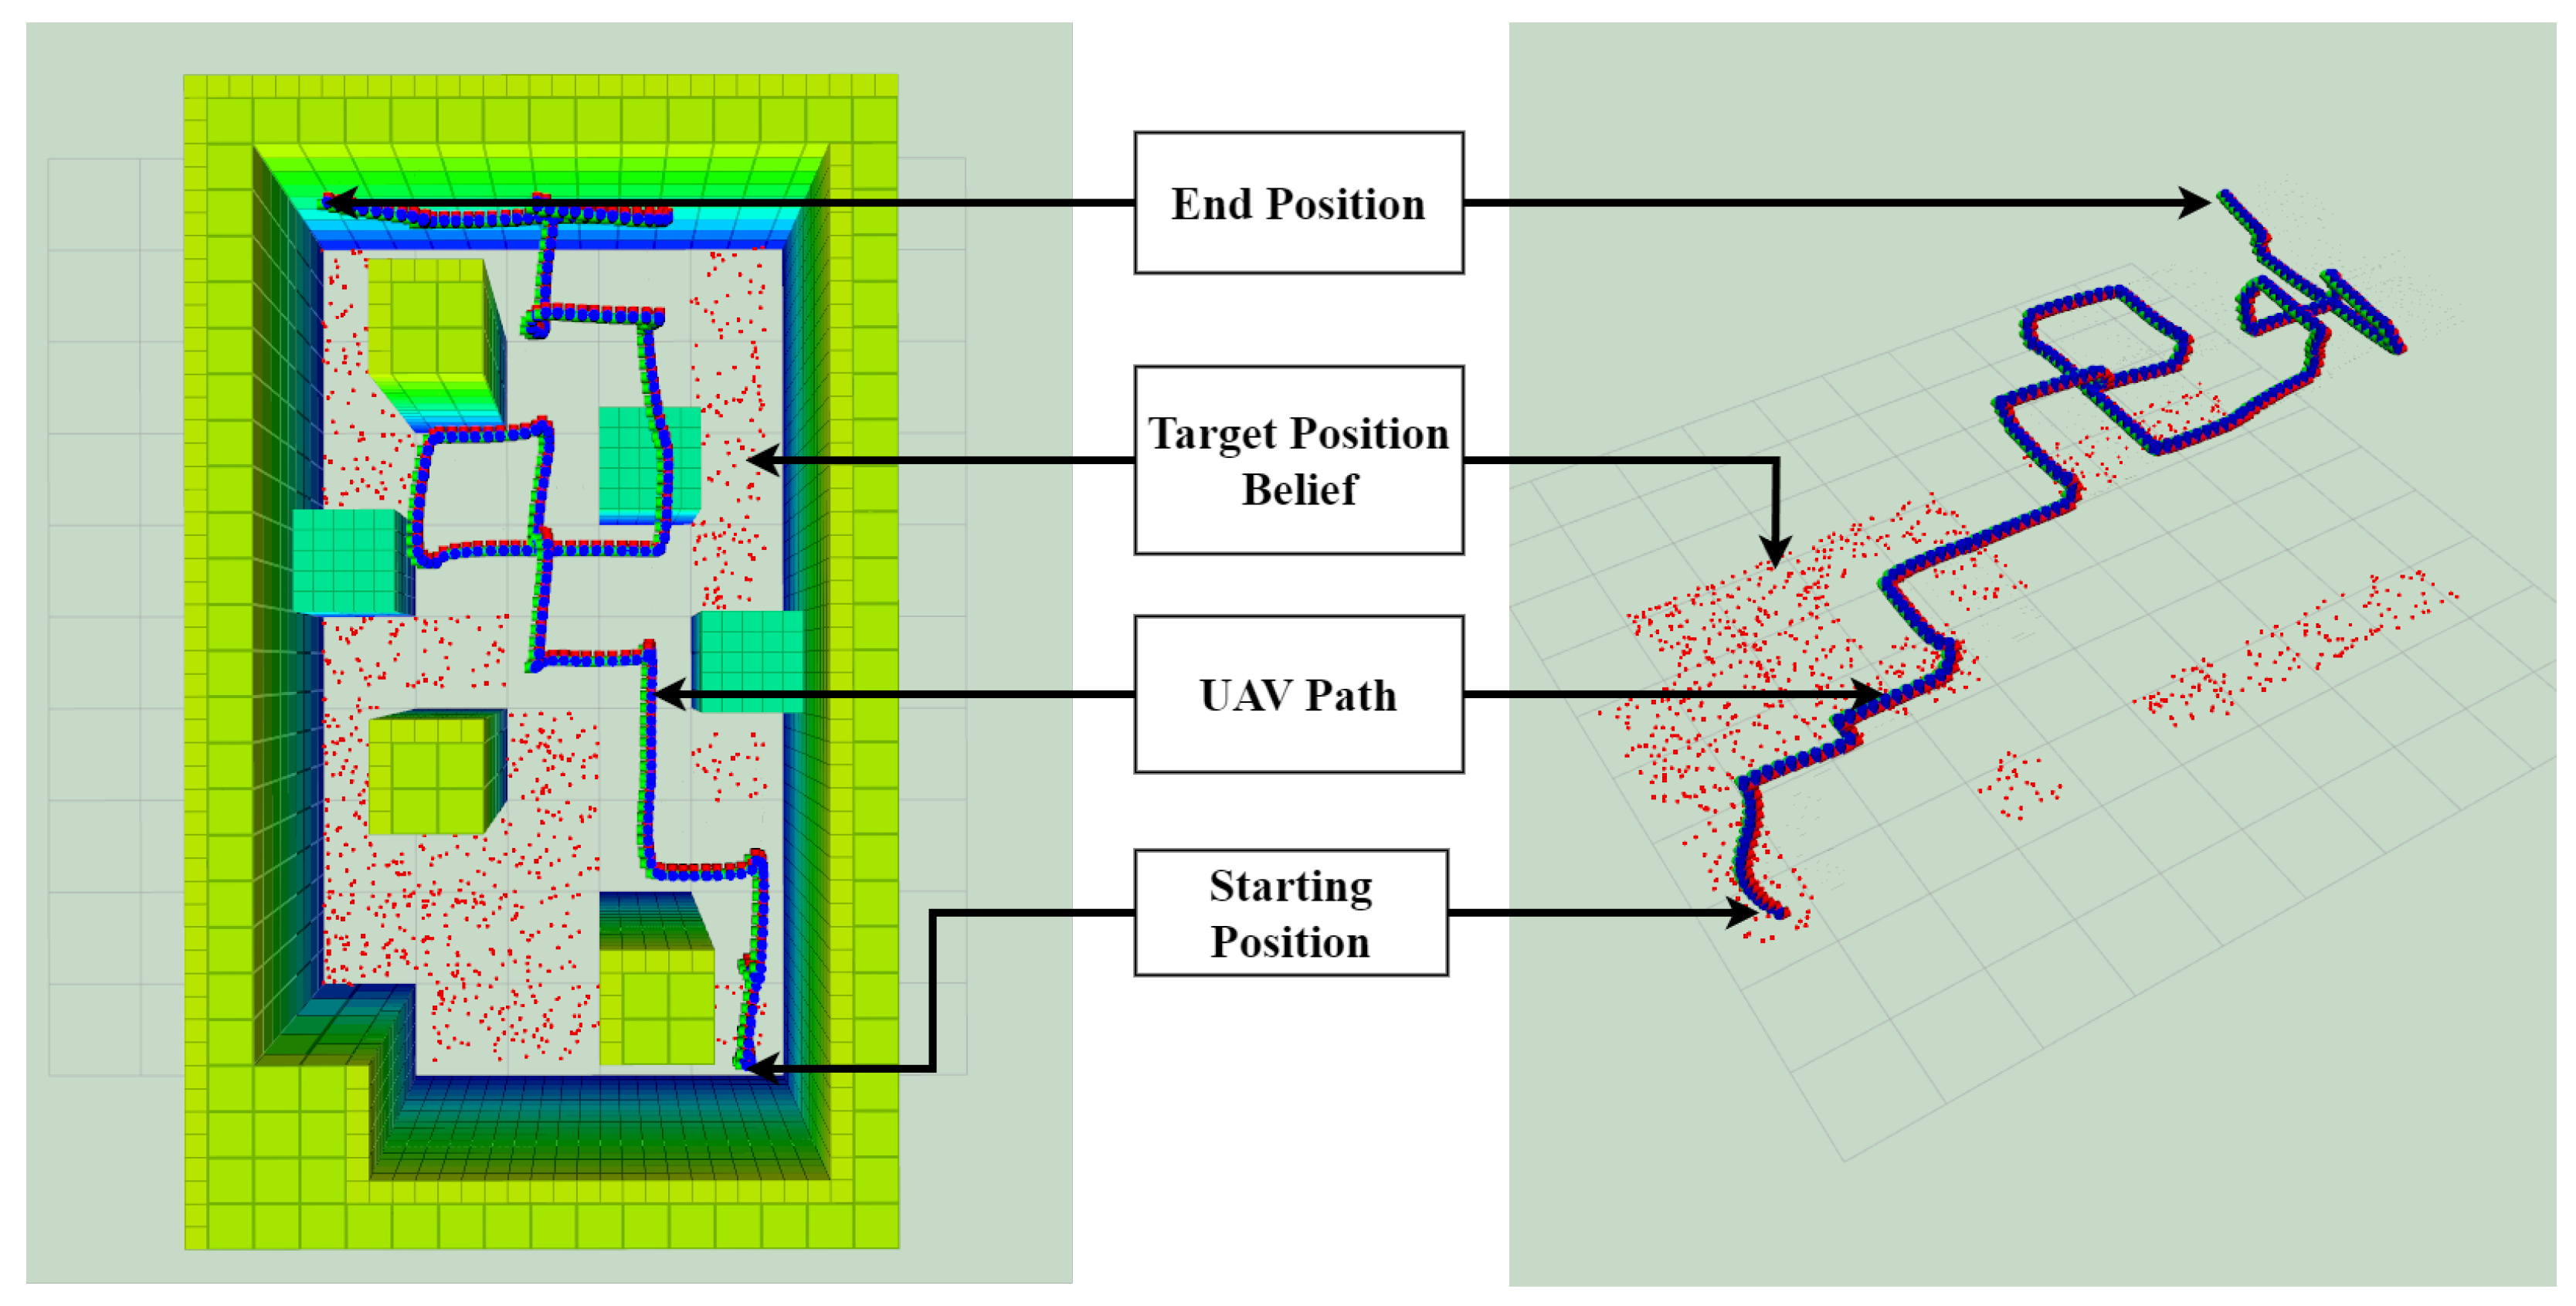
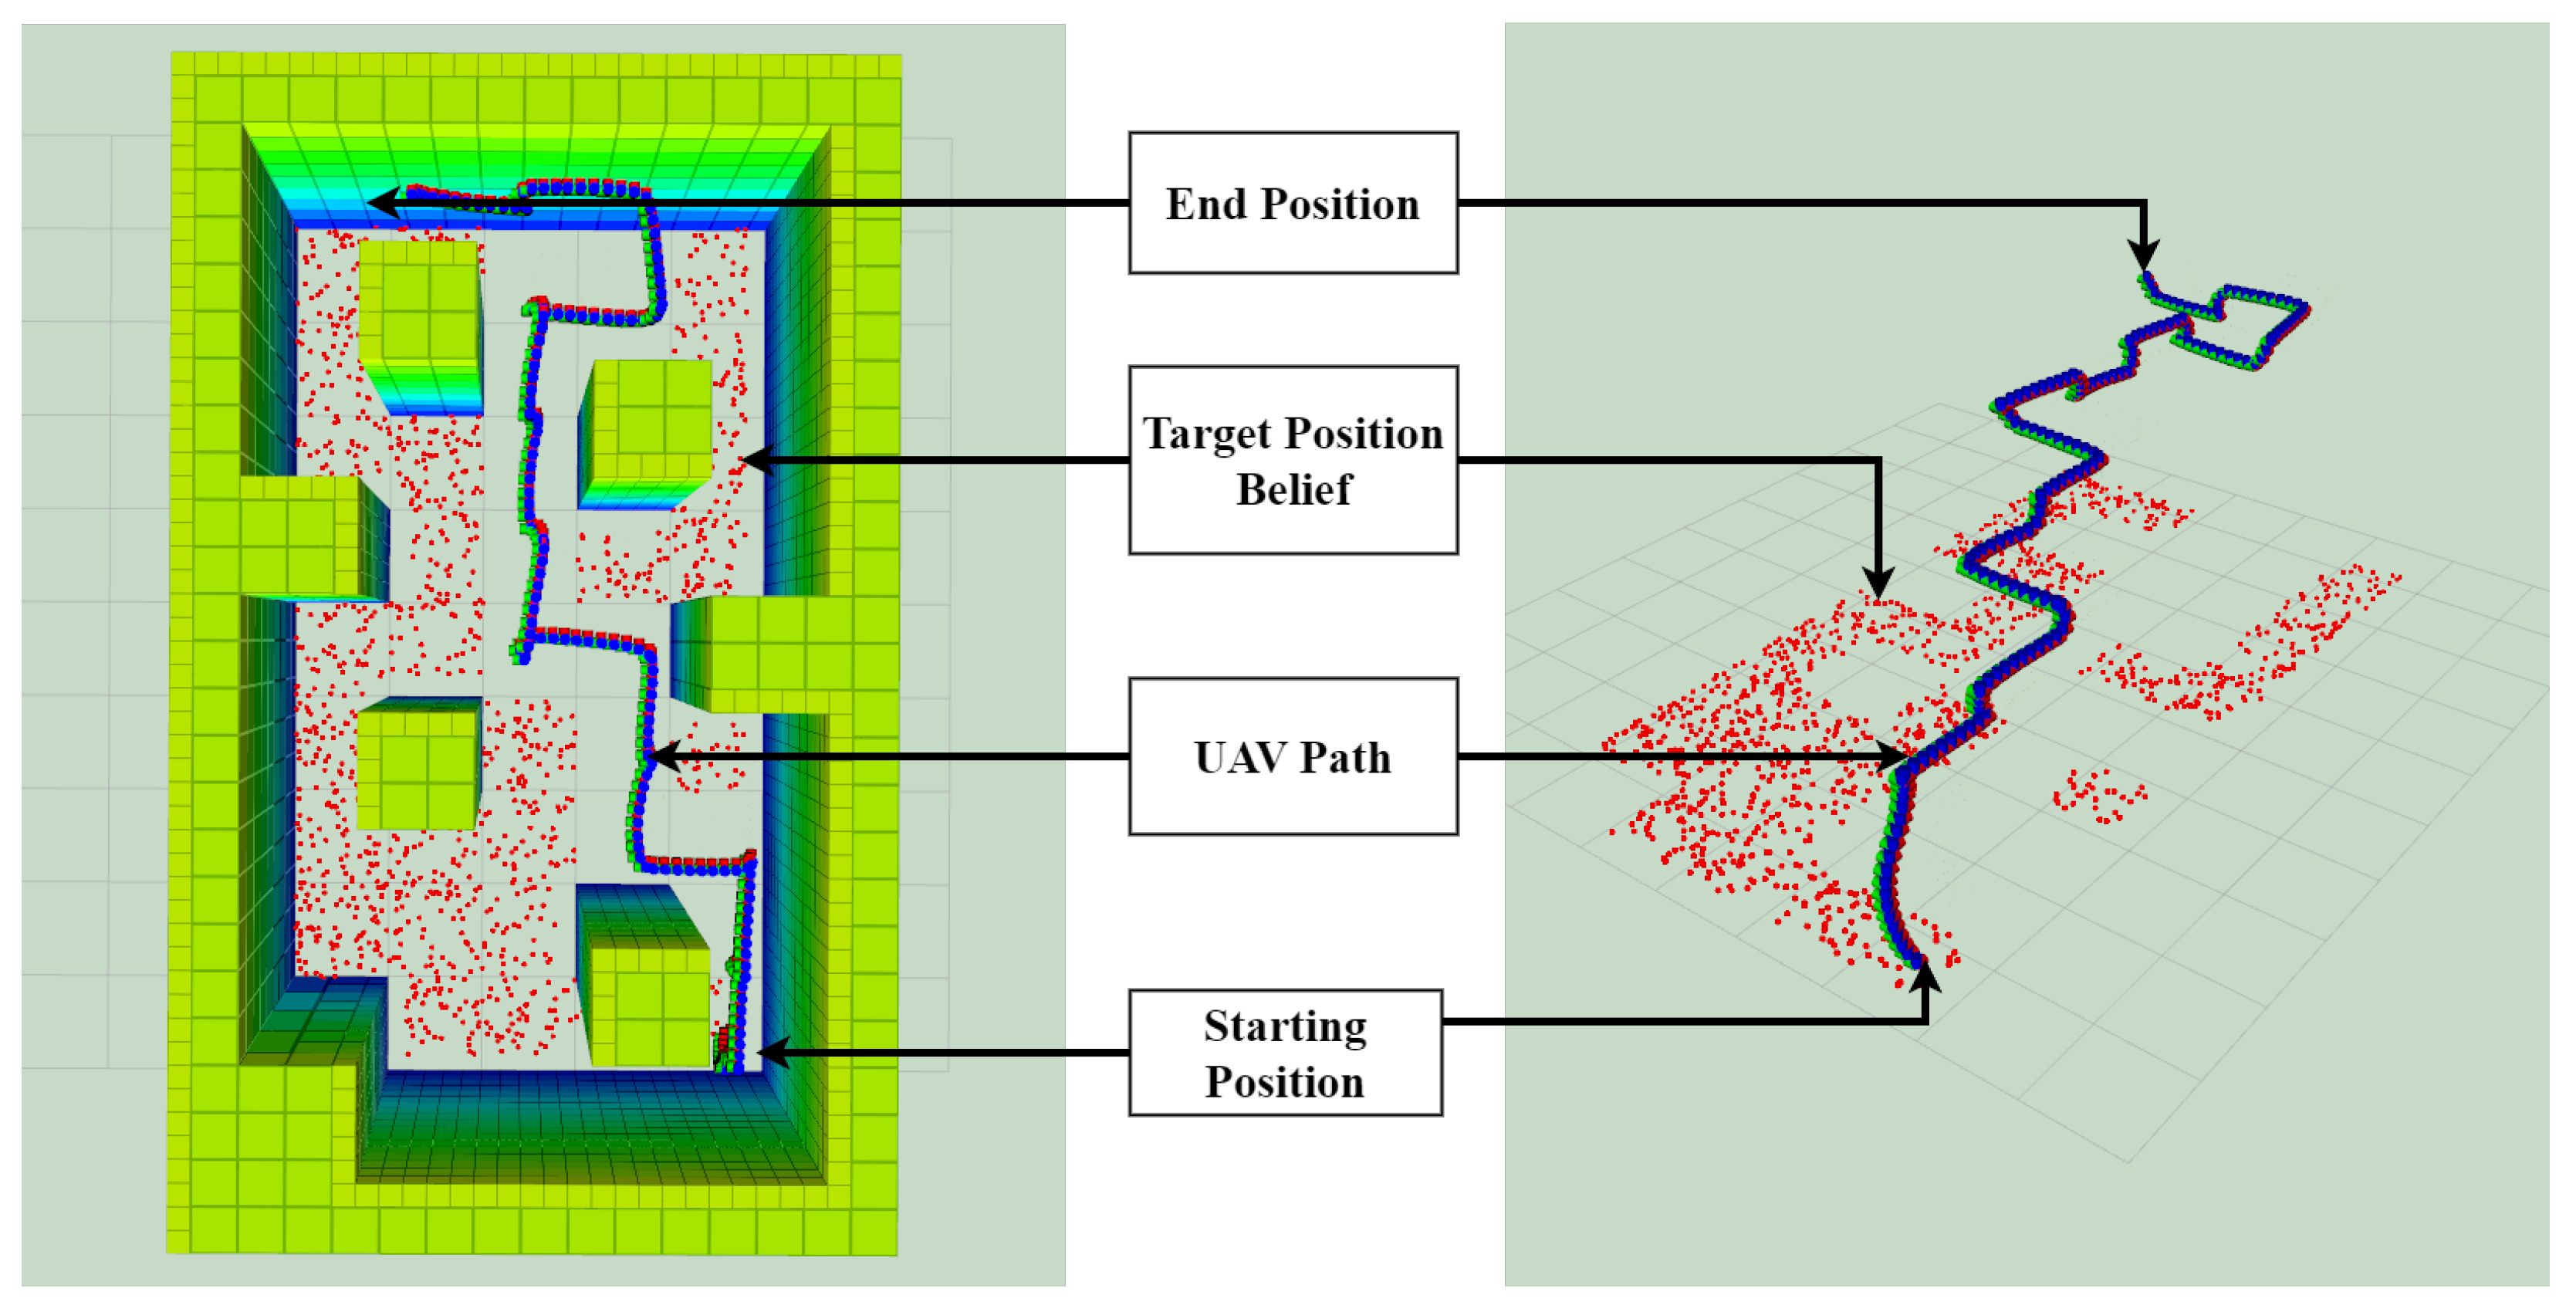
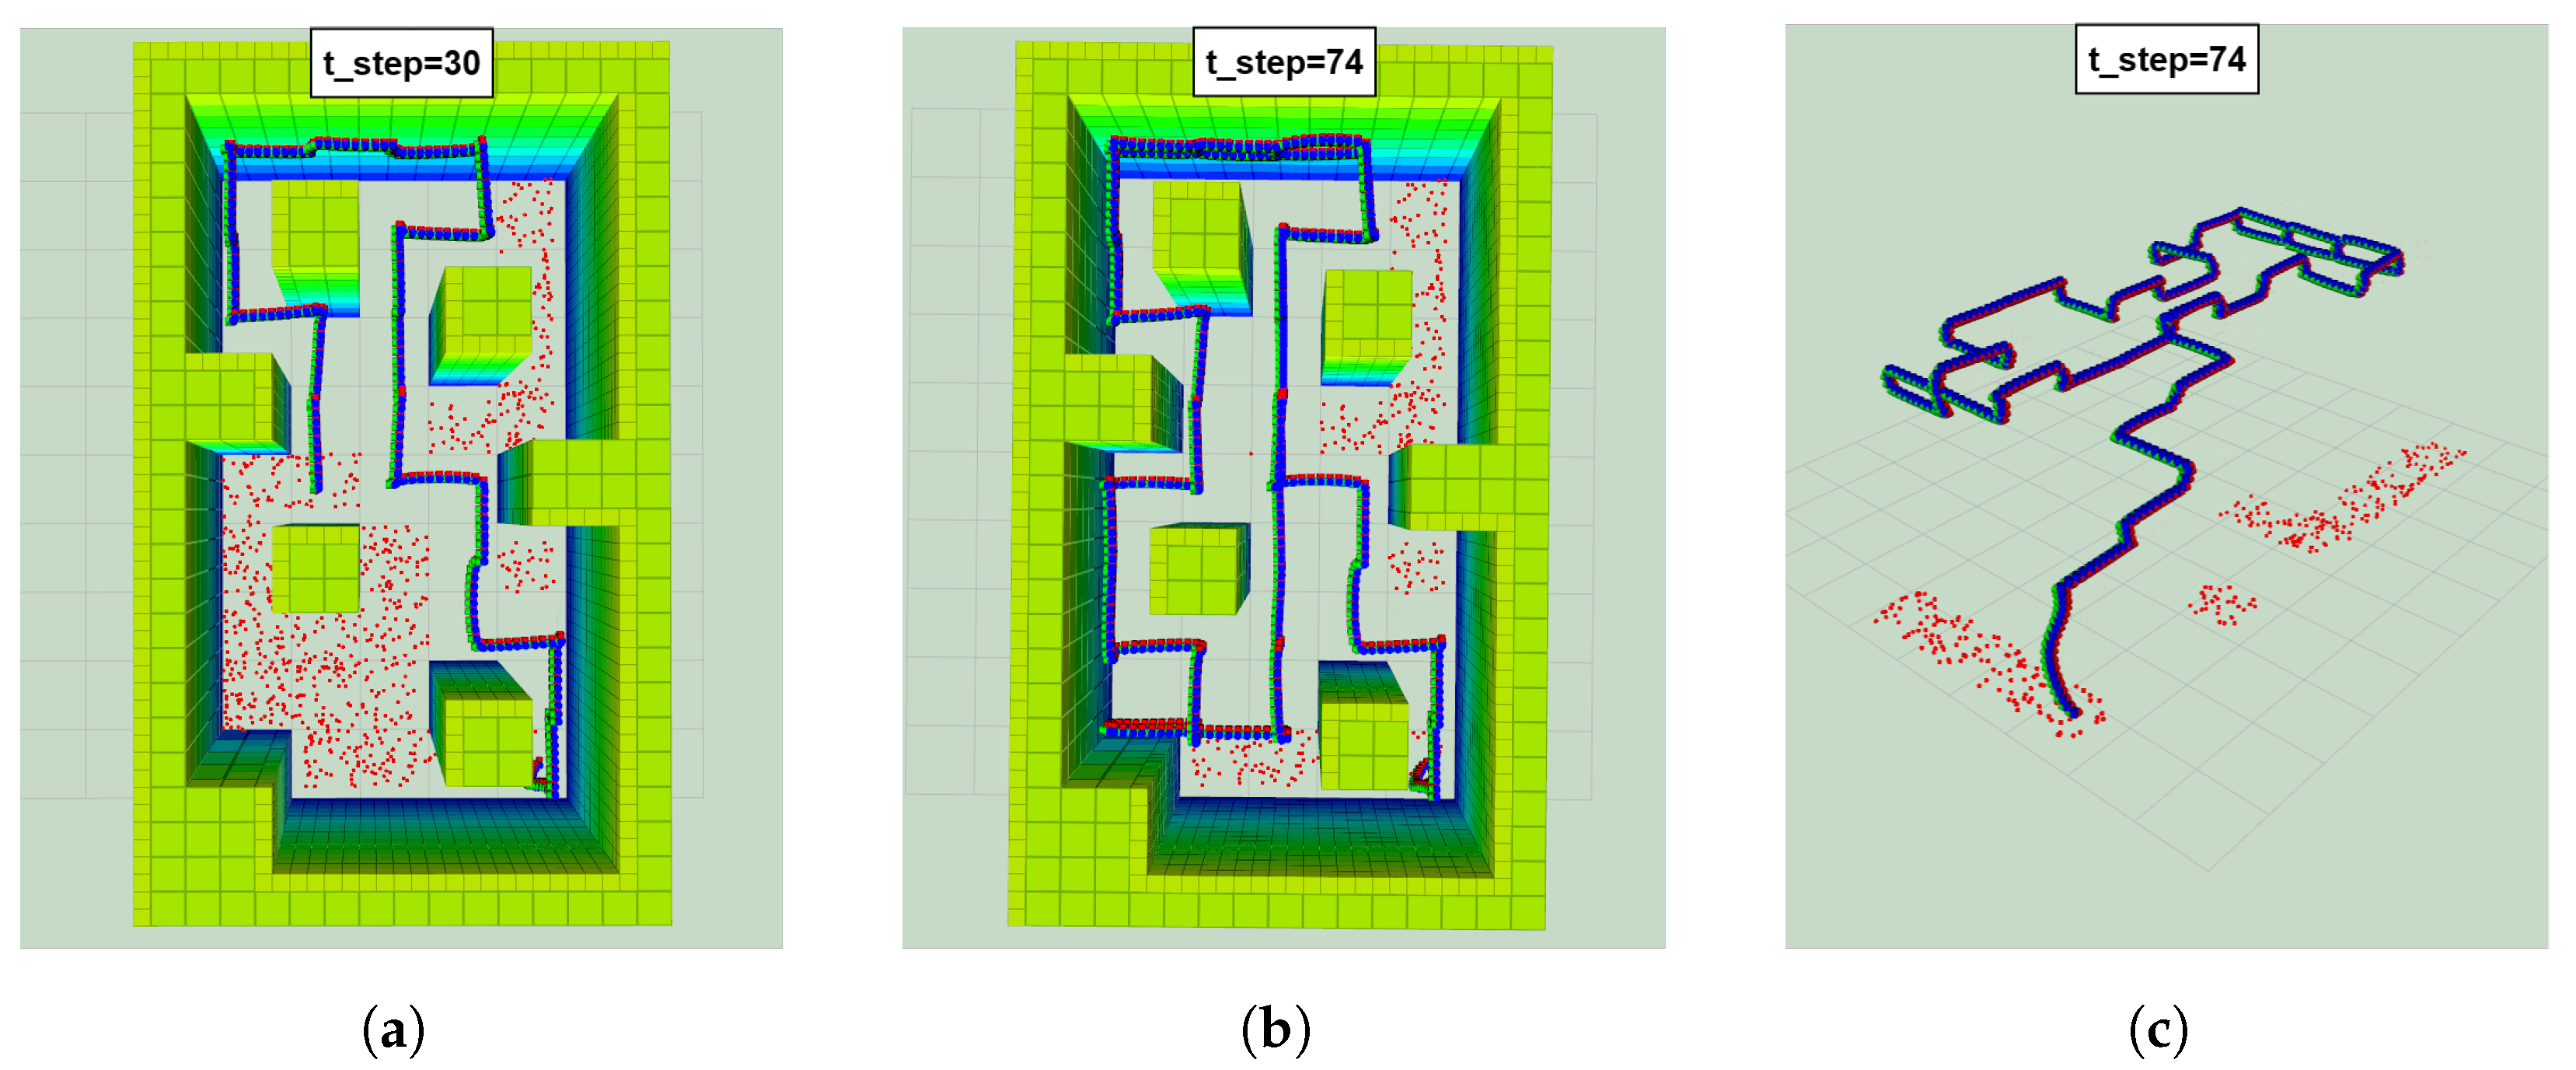
The most frequent trajectory for M1 is presented in
Figure 11, and the most frequent trajectory for M2 is shown in
Figure 12. In all tested environments, the first series of actions often resulted in the following steps: meeting the altitude requirement to avoid the negative reward and going to the centre of the map. The former was part of the POMDP formulation, with
encouraging the UAV to reach the required altitude. The latter, on the other hand, was the result of the complete formulation and reward function. The POMDP always outputs a policy in which the first actions result in the agent’s position being in the centre of the map to maximise the number of unexplored cells around the UAV. When the centre is reached, the agent will either keep going toward the top side of the map, as shown in
Figure 11 and
Figure 12, or the actions will result in the agent exploring the bottom side of the map.
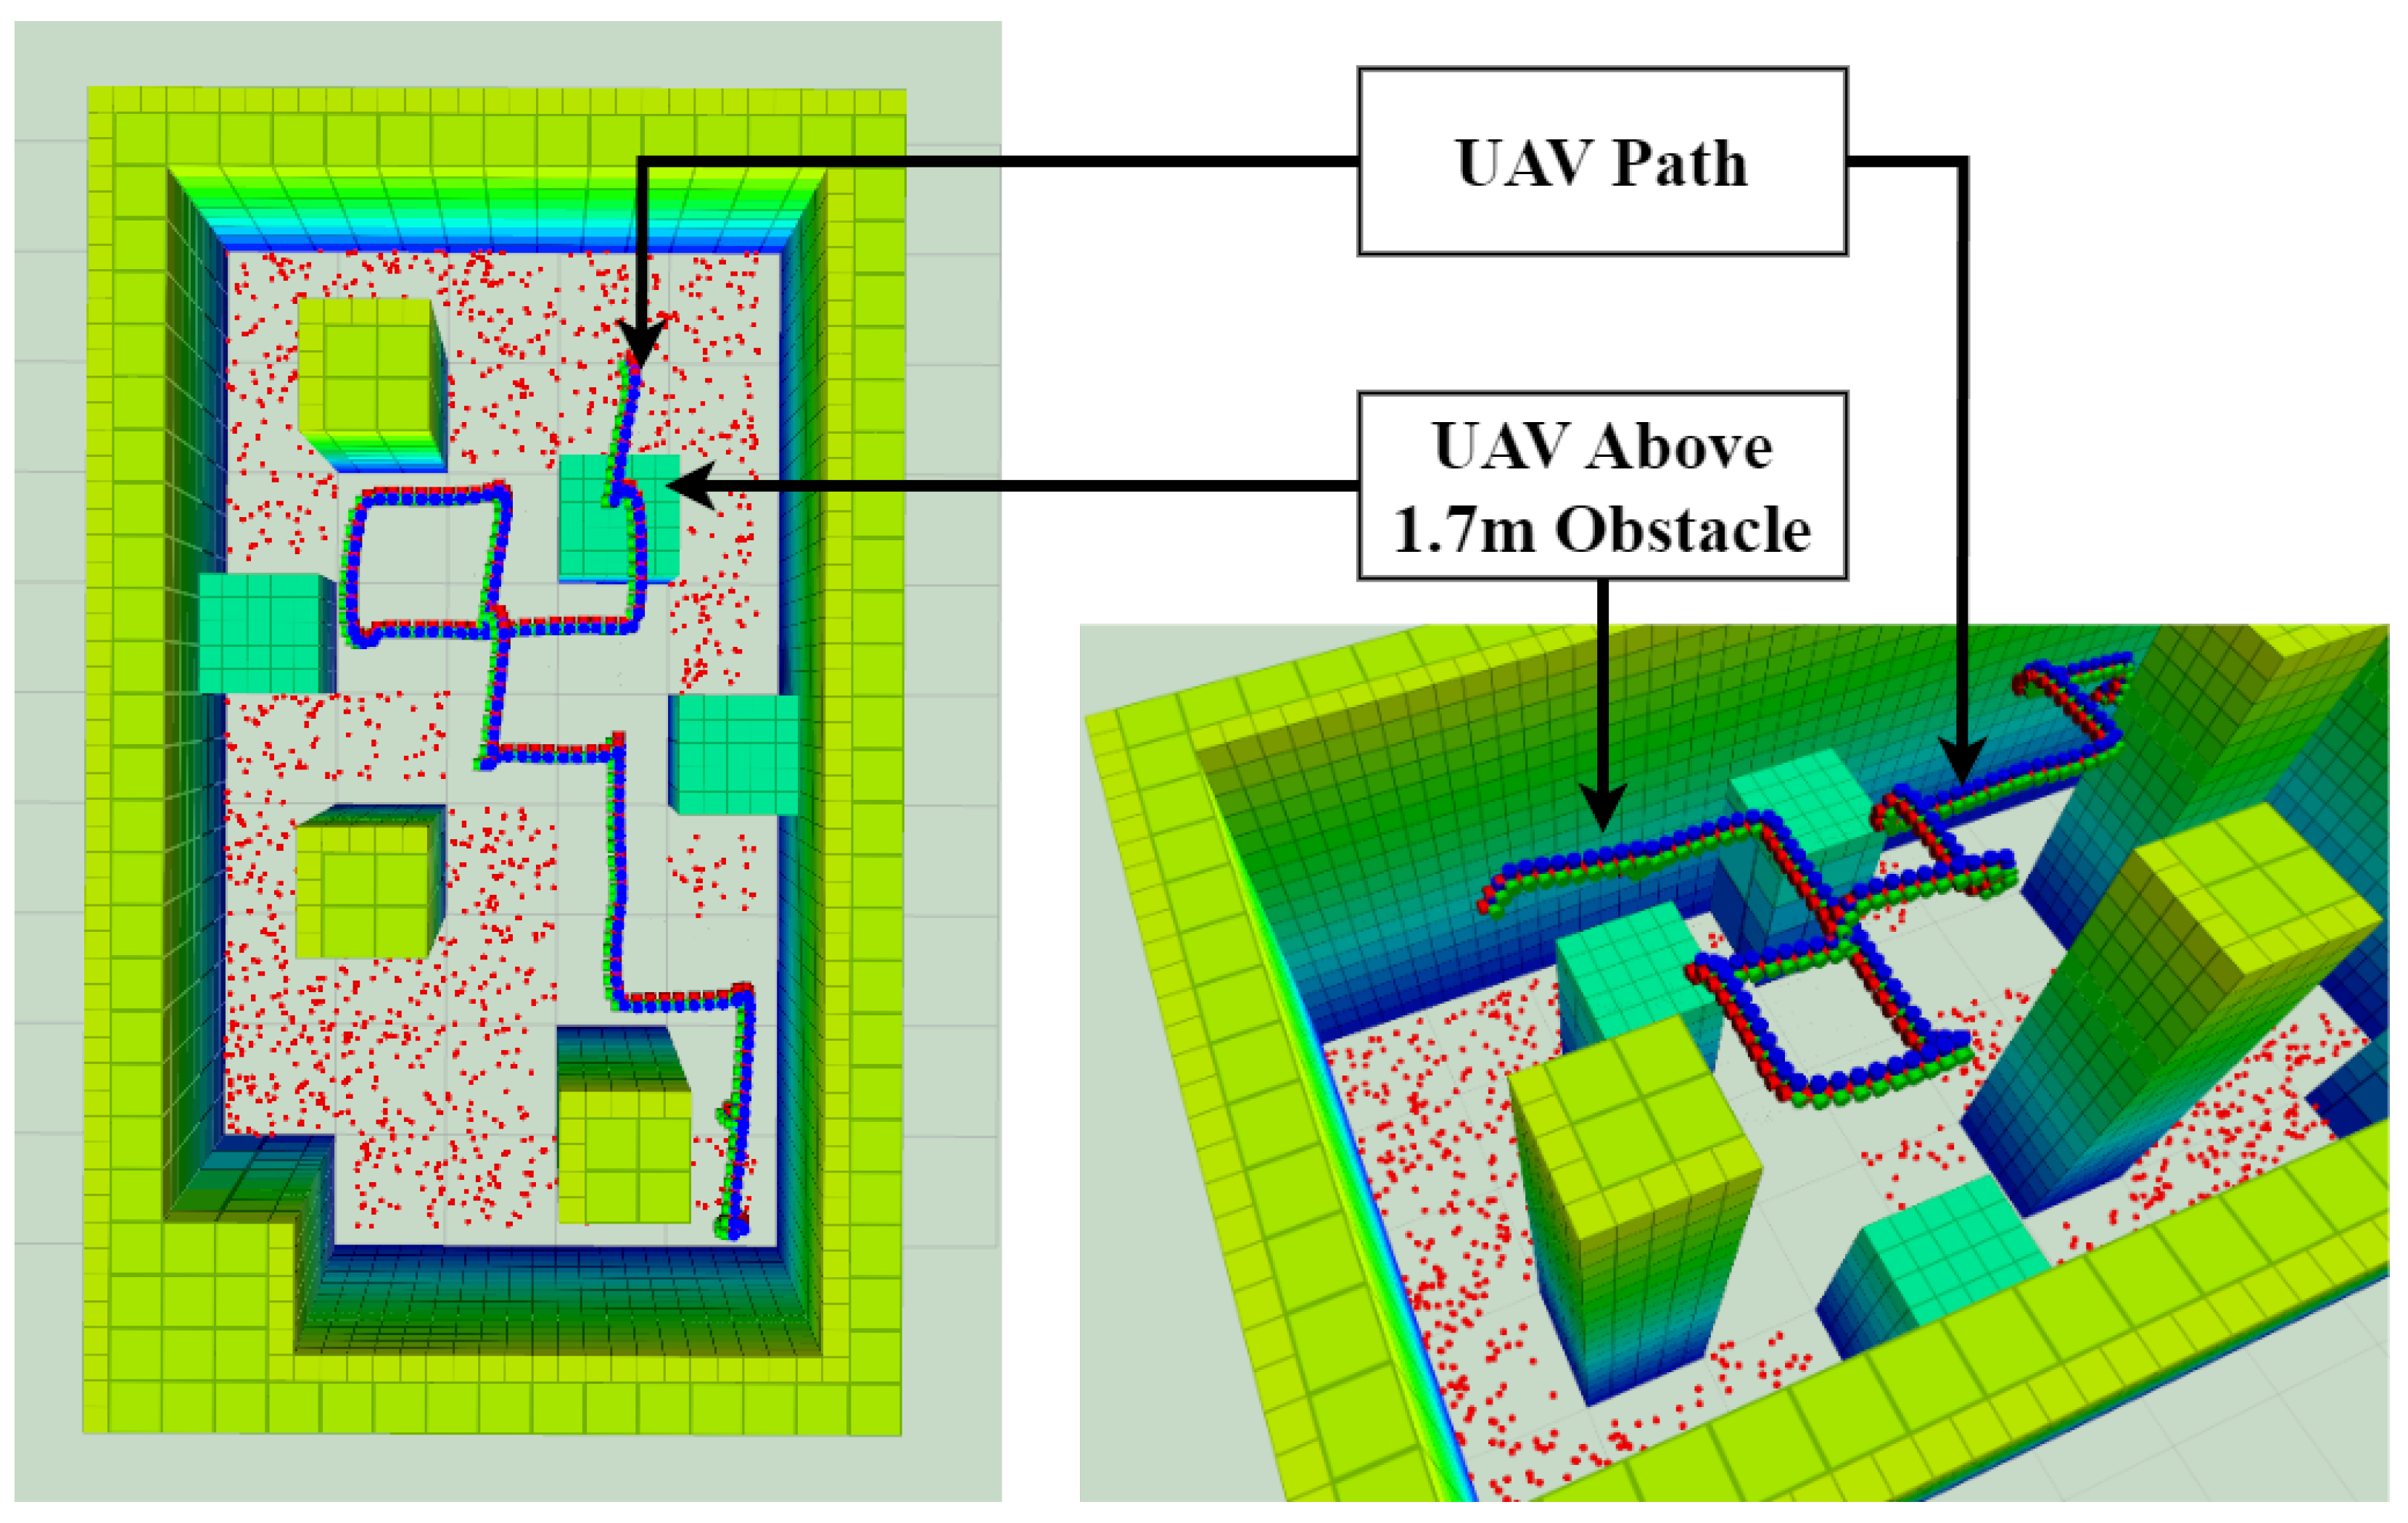
M1 was also used to highlight the ability of the agent to go above an obstacle, as shown in
Figure 13. The POMDP solver was able to recognise the lower obstacles as a “non-threat” and output actions resulting in the agent’s position being above these smaller obstacles, without causing any collisions and successfully avoiding the obstacle.
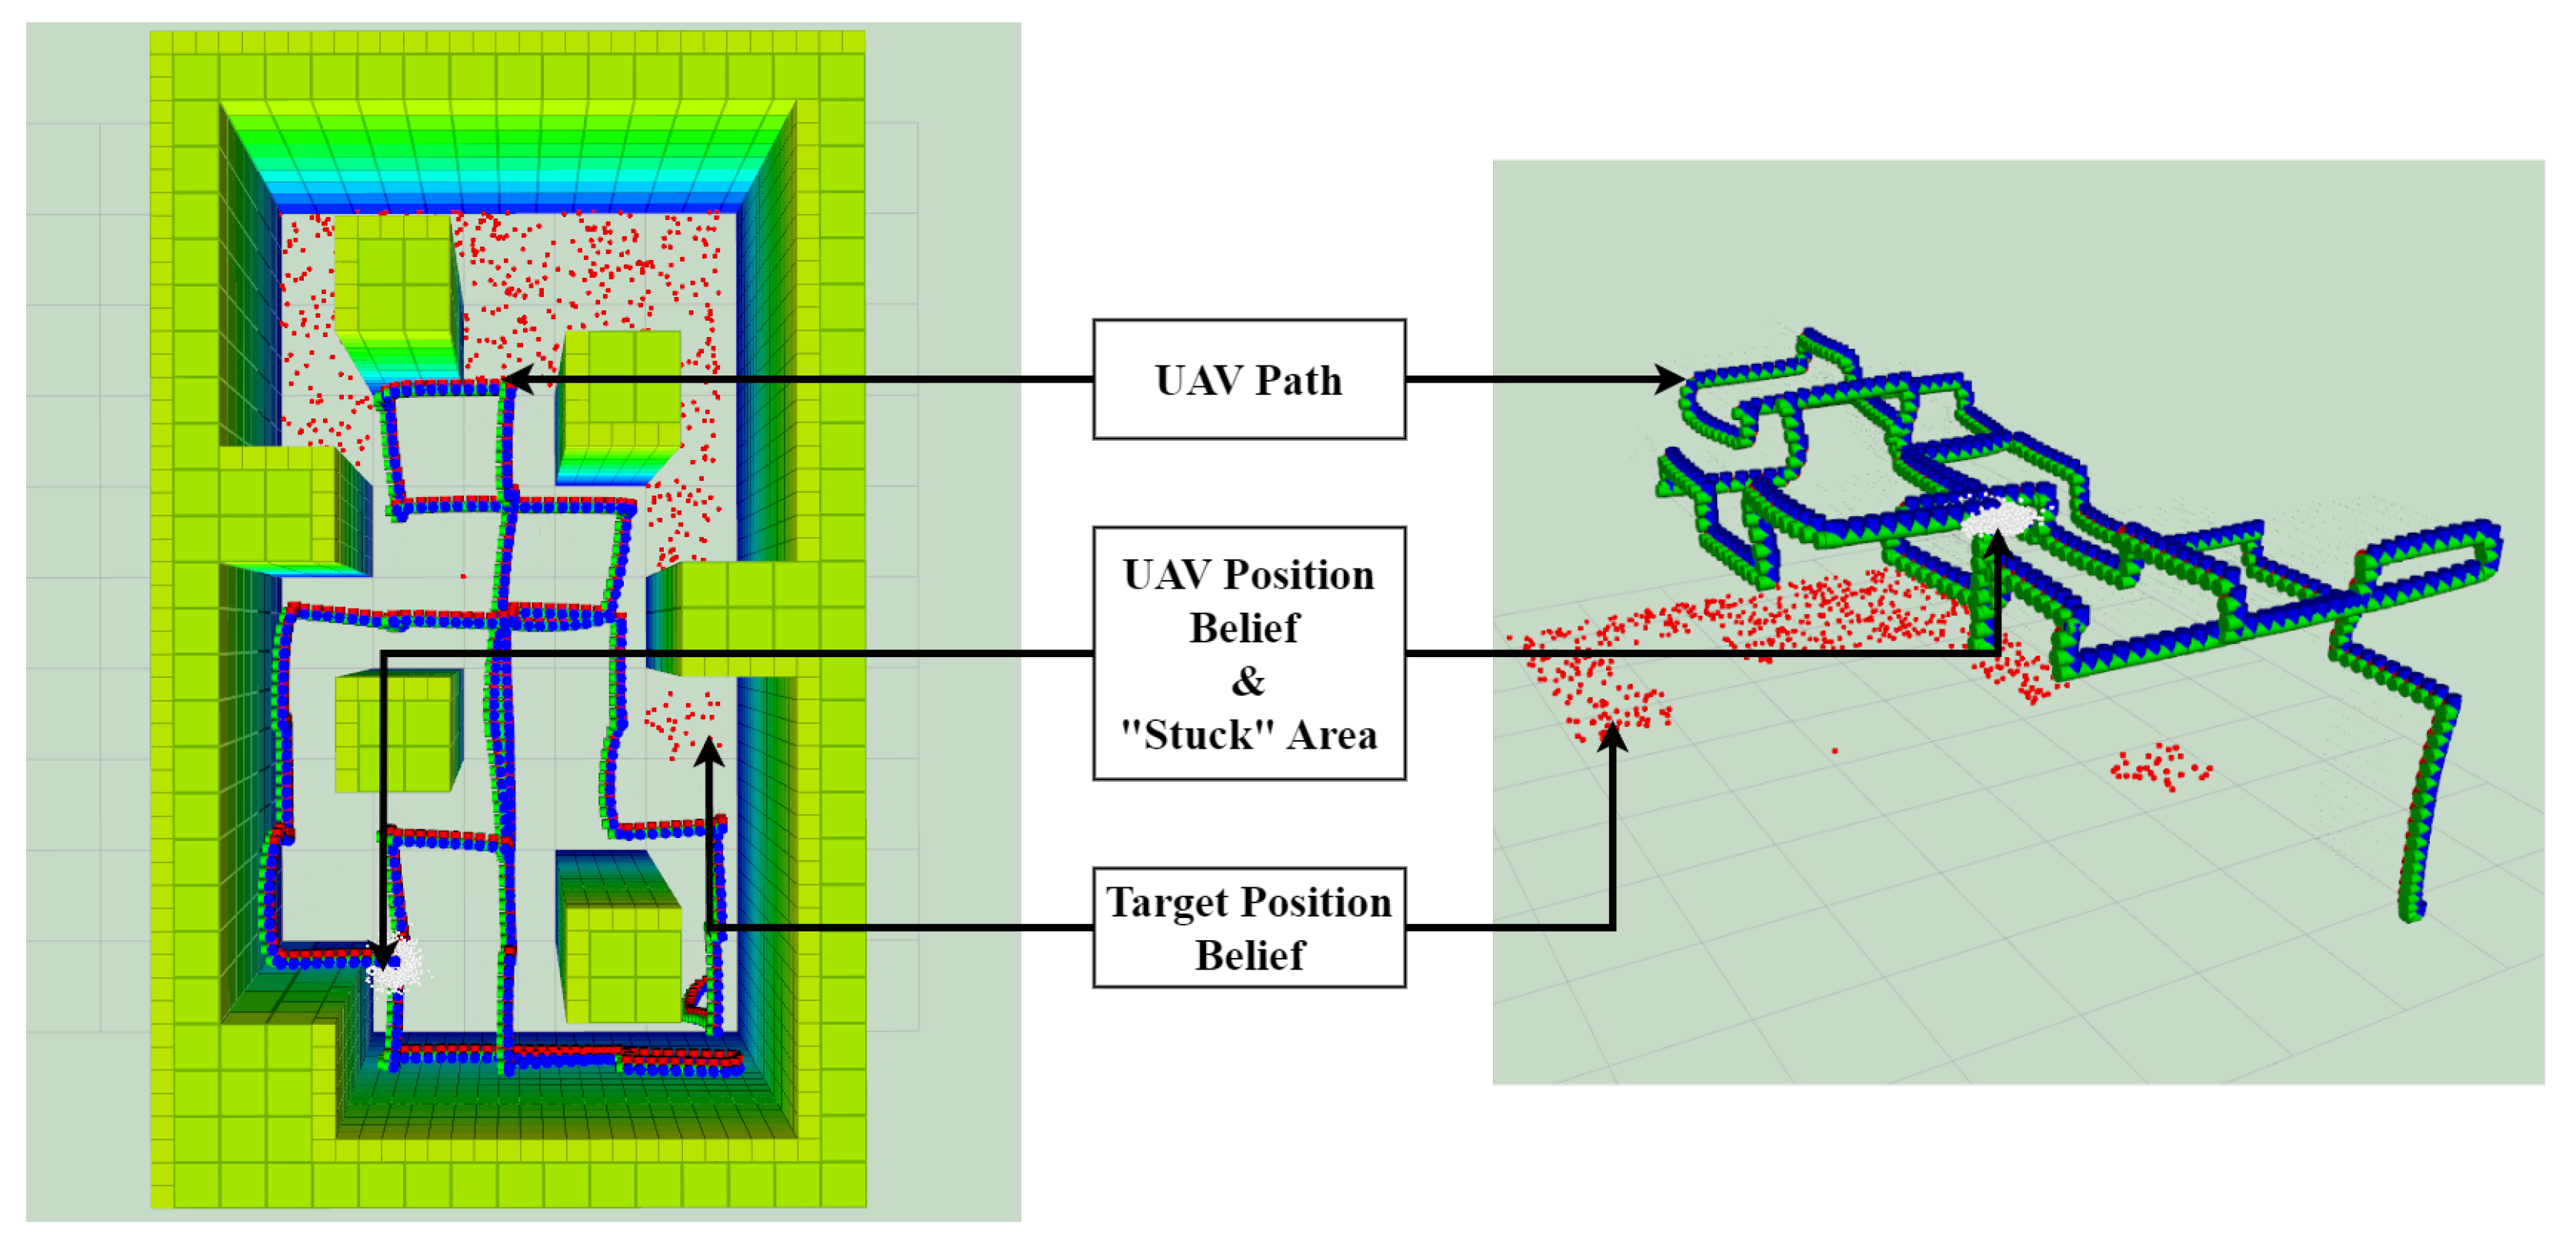
The “Out of ROI” state that occurred in M2 NV in real-life testing was caused by a known issue of the framework, which put the agent in an area far from other unexplored cells, causing it to repeat UP and DOWN actions, forcing the agent to go higher than the altitude limit. This is represented in
Figure 14. This issue was limited by the functionality of keeping track of the number of cells explored and resetting the explored cells when a percentage of exploration is attained, as explained in
Section 4.4.4.
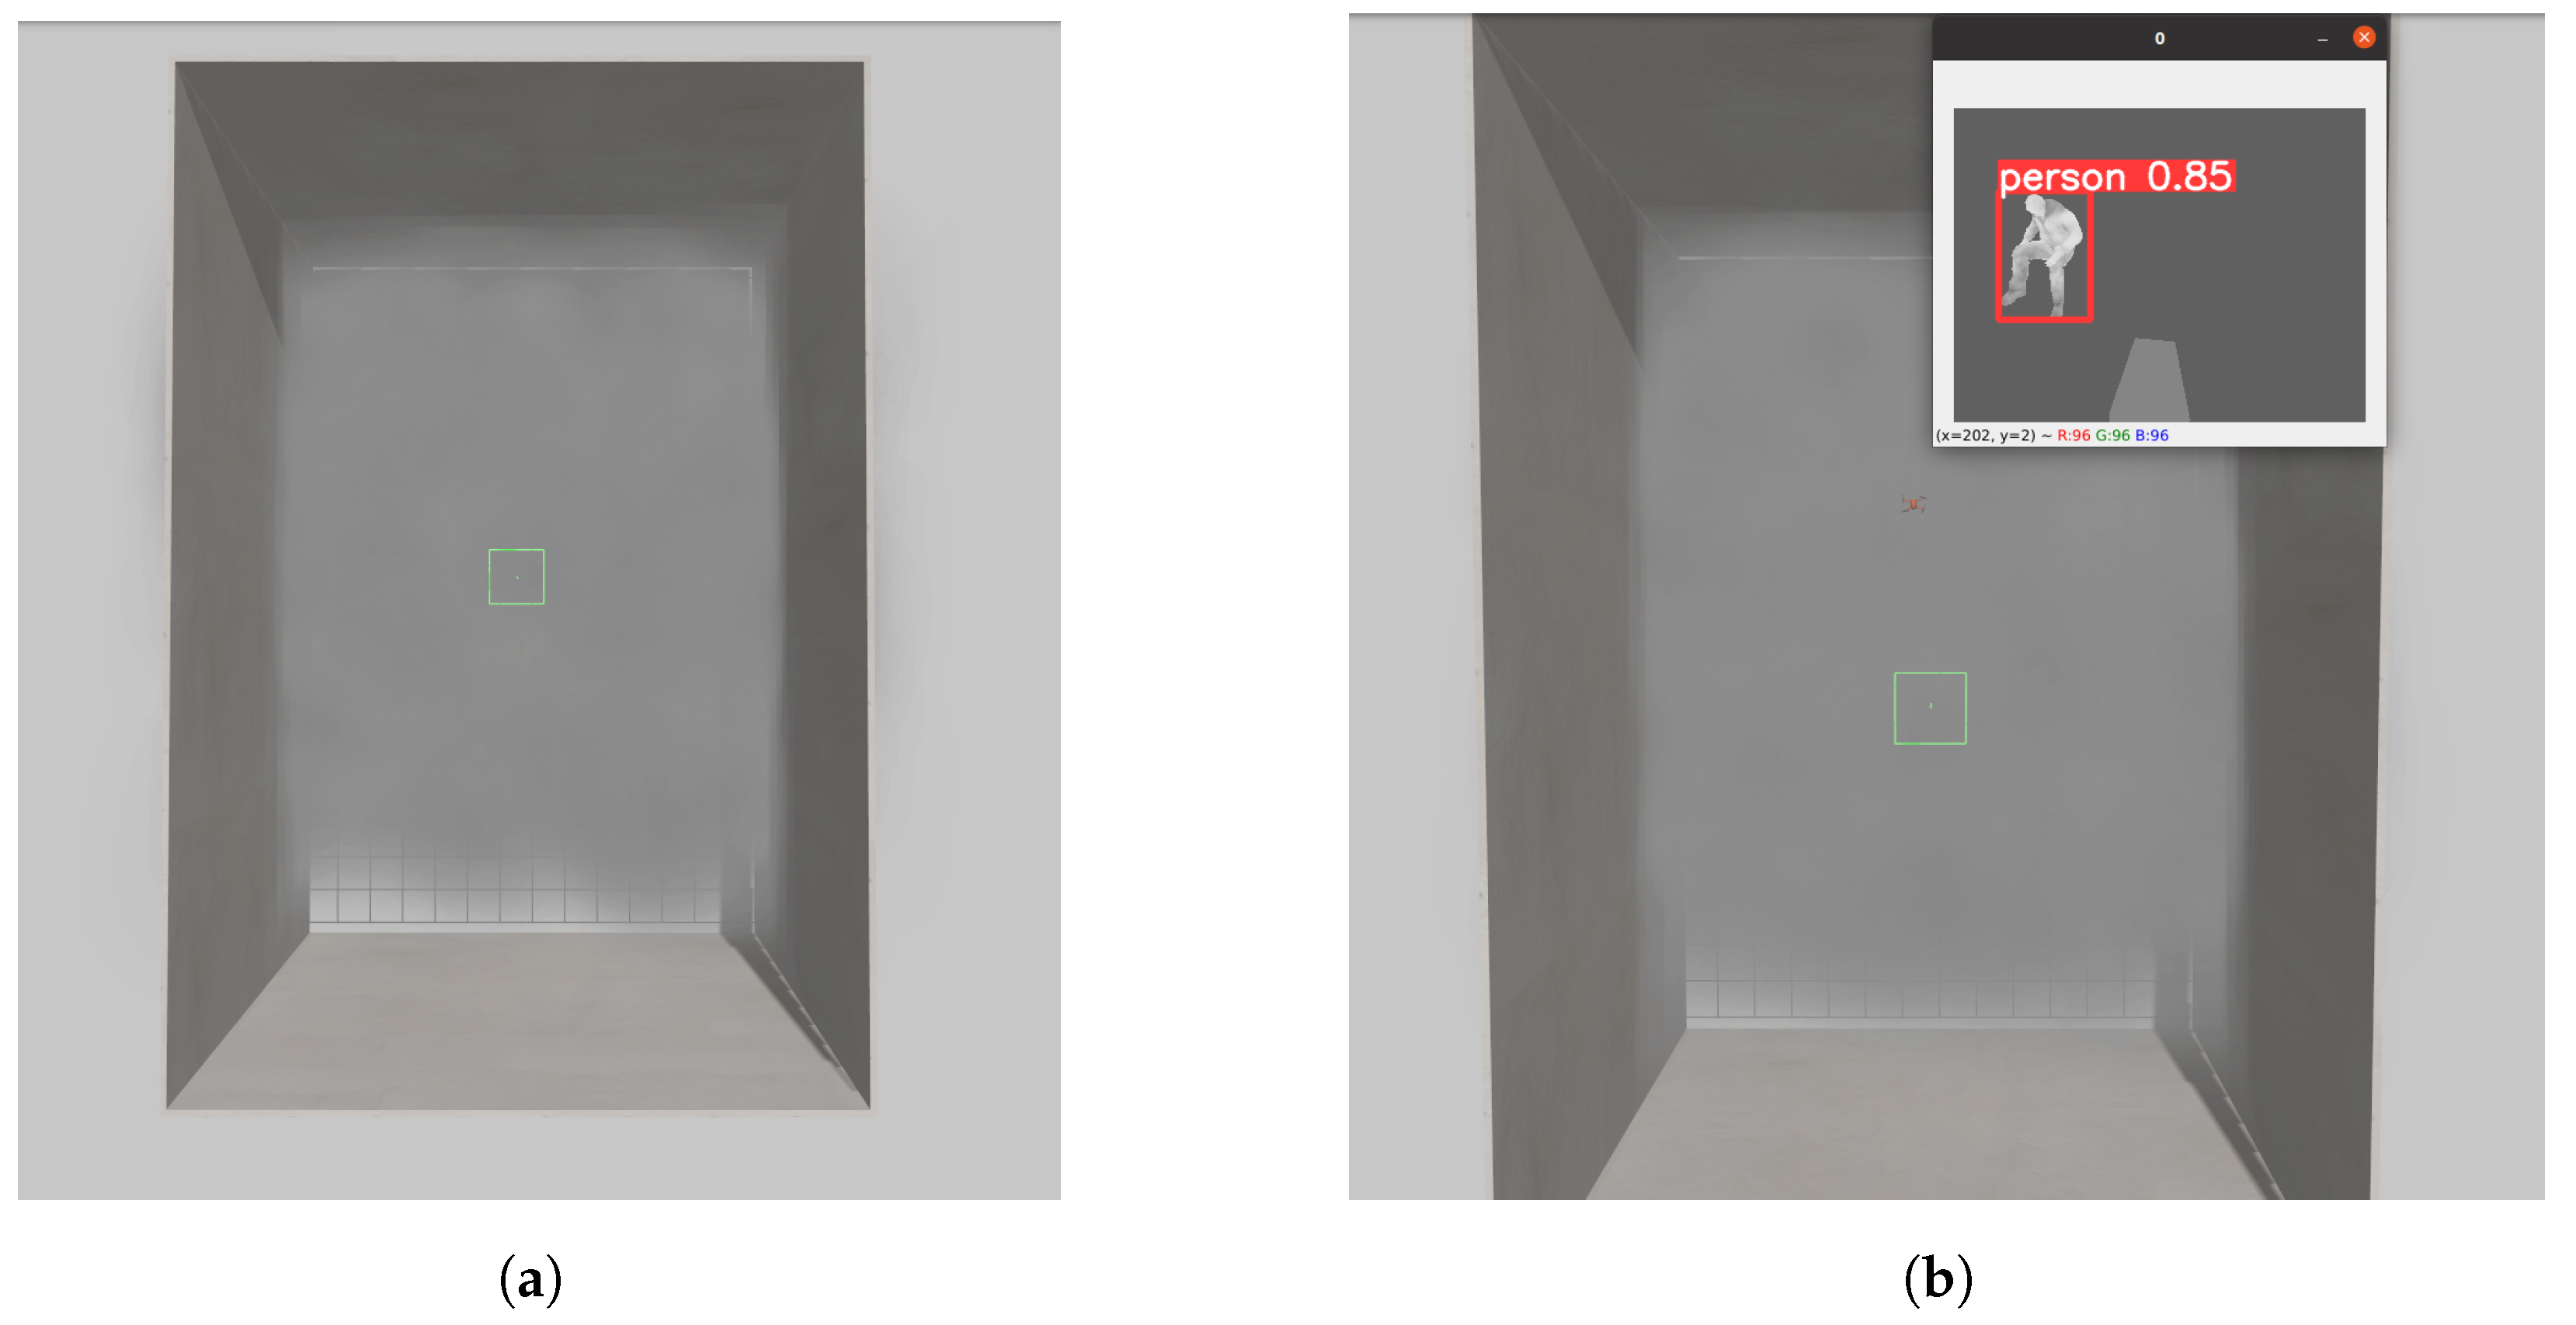
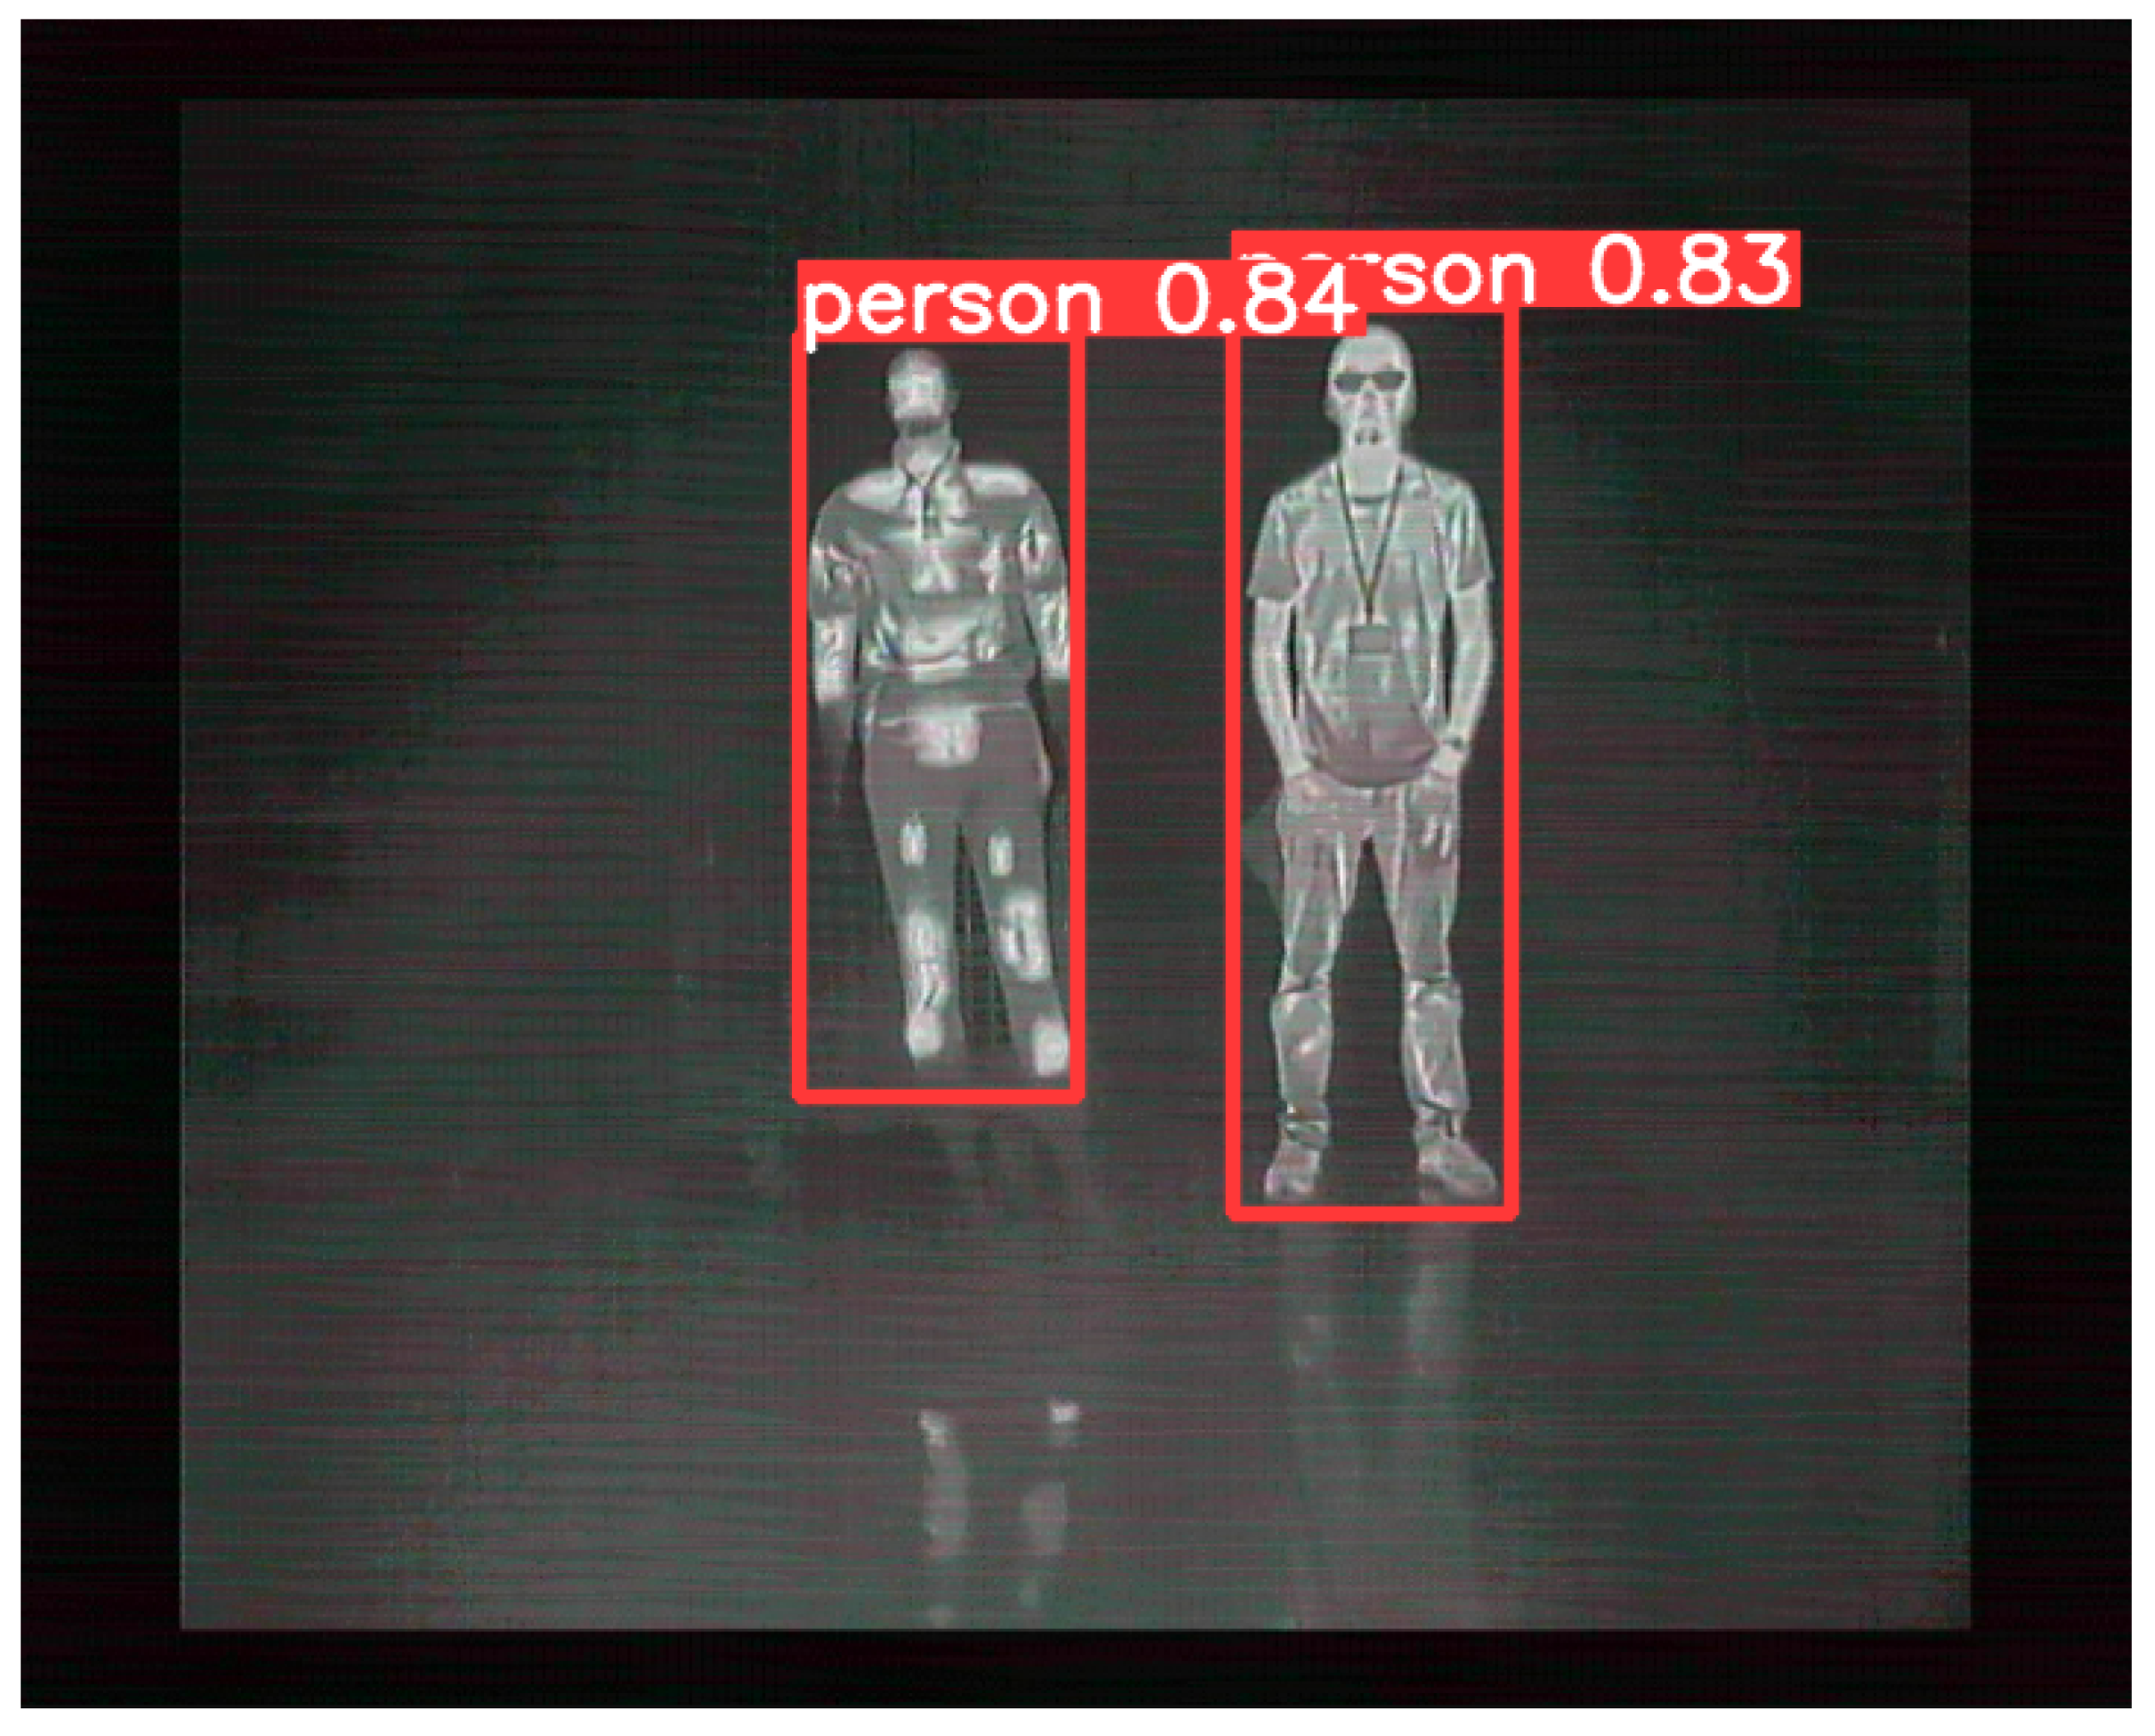
The detection model was trained using images from an external dataset detecting human beings. A mannequin was used in the experiments for safety purposes, hence creating differences between the model and the target.
Figure 15 highlights the differences between the heat signature of the mannequin and a person. These differences caused a few miss-detections, which are highlighted in
Figure 16. These miss-detections forced the agent to keep exploring the environment, often activating the functionality and resetting the states of the cells. In the few times this miss-detection happened, the agent was always able to explore a larger part of the map and come back to the target area for successful detection. These miss-detections were also caused by a loss of heat in the heat-packs and heated clothes after a long testing session, creating a noticeable difference between the mannequin and an actual human being.
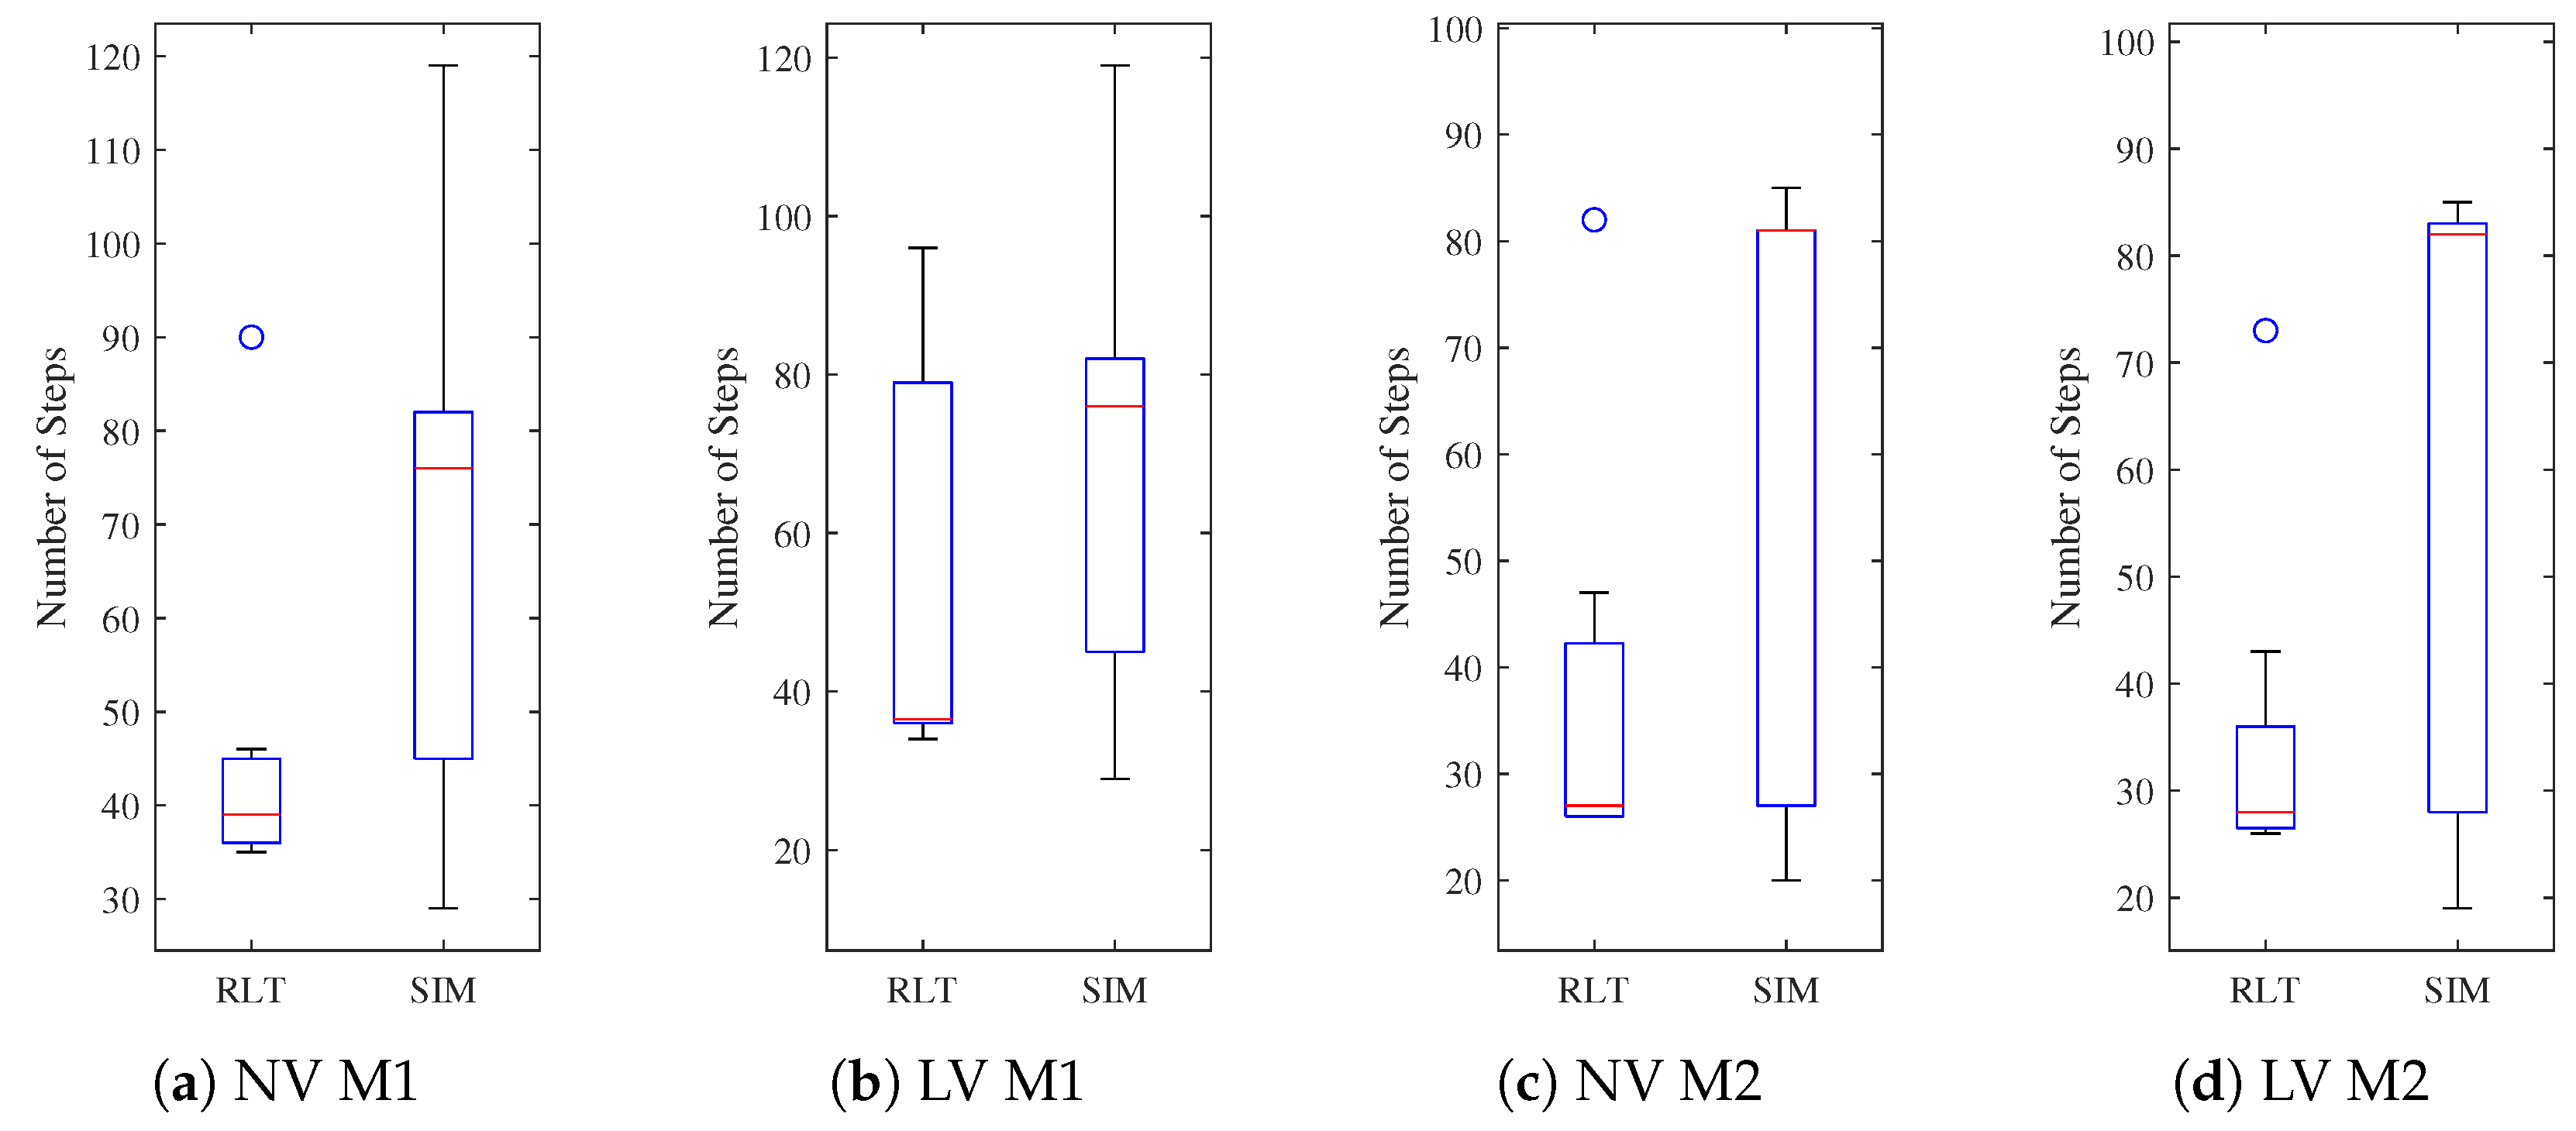
To assess the performance of the proposed framework, an analysis of the number of time steps taken by the agent to detect the target was conducted. Box plots were used to summarise the results of this analysis as shown in
Figure 17.
The difference between the lengths of the whiskers of the simulation and real-life results was caused by how the UAV motion in Gazebo is modelled. The equations modelling the motion in Gazebo approximate the behaviour of a generic quadcopter rather than the exact frame used in real-life testing, which in this case, was the Holybro X500 V2.
The main variance between each map is the height of the obstacles. The first map, with obstacles of 1.7 m and 3.5 m, offers the agent a larger range of choices to explore the environment as it has the possibility to fly over some obstacles. On the other hand, the second map, with obstacles of 3.5 m only, restricts the freedom of the agent. This is highlighted in
Figure 17, with the interquartile range of 90 steps for both M1 in NV M1 and LV M1, compared to 65 and 66 steps for NV M2 and LV M2, respectively, in simulations. The problem formulation did not include any change in behaviour between normal and low-visibility conditions. This is represented in the median for each boxplot, with a median of 76 for both NV M1 and LV M1 in simulations, and a median of 39 and 36.5 steps in real-life testing (
Figure 17a,b). For NV M2 and LV M2, a median of 81 steps and 82 steps, respectively, in simulations, and 27 and 28 steps for real-life testing (
Figure 17c,d) was determined. The mean altitude in M1 for simulations was 2.97 m and 2.91 m in real-life testing. For M2, the mean altitude was 2.98 m in simulations and 2.87 m in real-life testing.
7. Discussion
The framework proposed in this research paper offers a viable and interesting solution for autonomous UAV navigation and decision making in GNSS-denied and visually degraded environments. This work is a continuation of [
42], which itself was an extension of the contributions from Vanegas and Gonzalez [
23] and Sandino et al. [
24]. In [
42], a thermal camera was added to the framework to improve target detection under low-visibility conditions, some modifications to the problem formulation and TAPIR parameters were made to improve the performance (see below), and real-life experiments were performed to verify the simulation results.
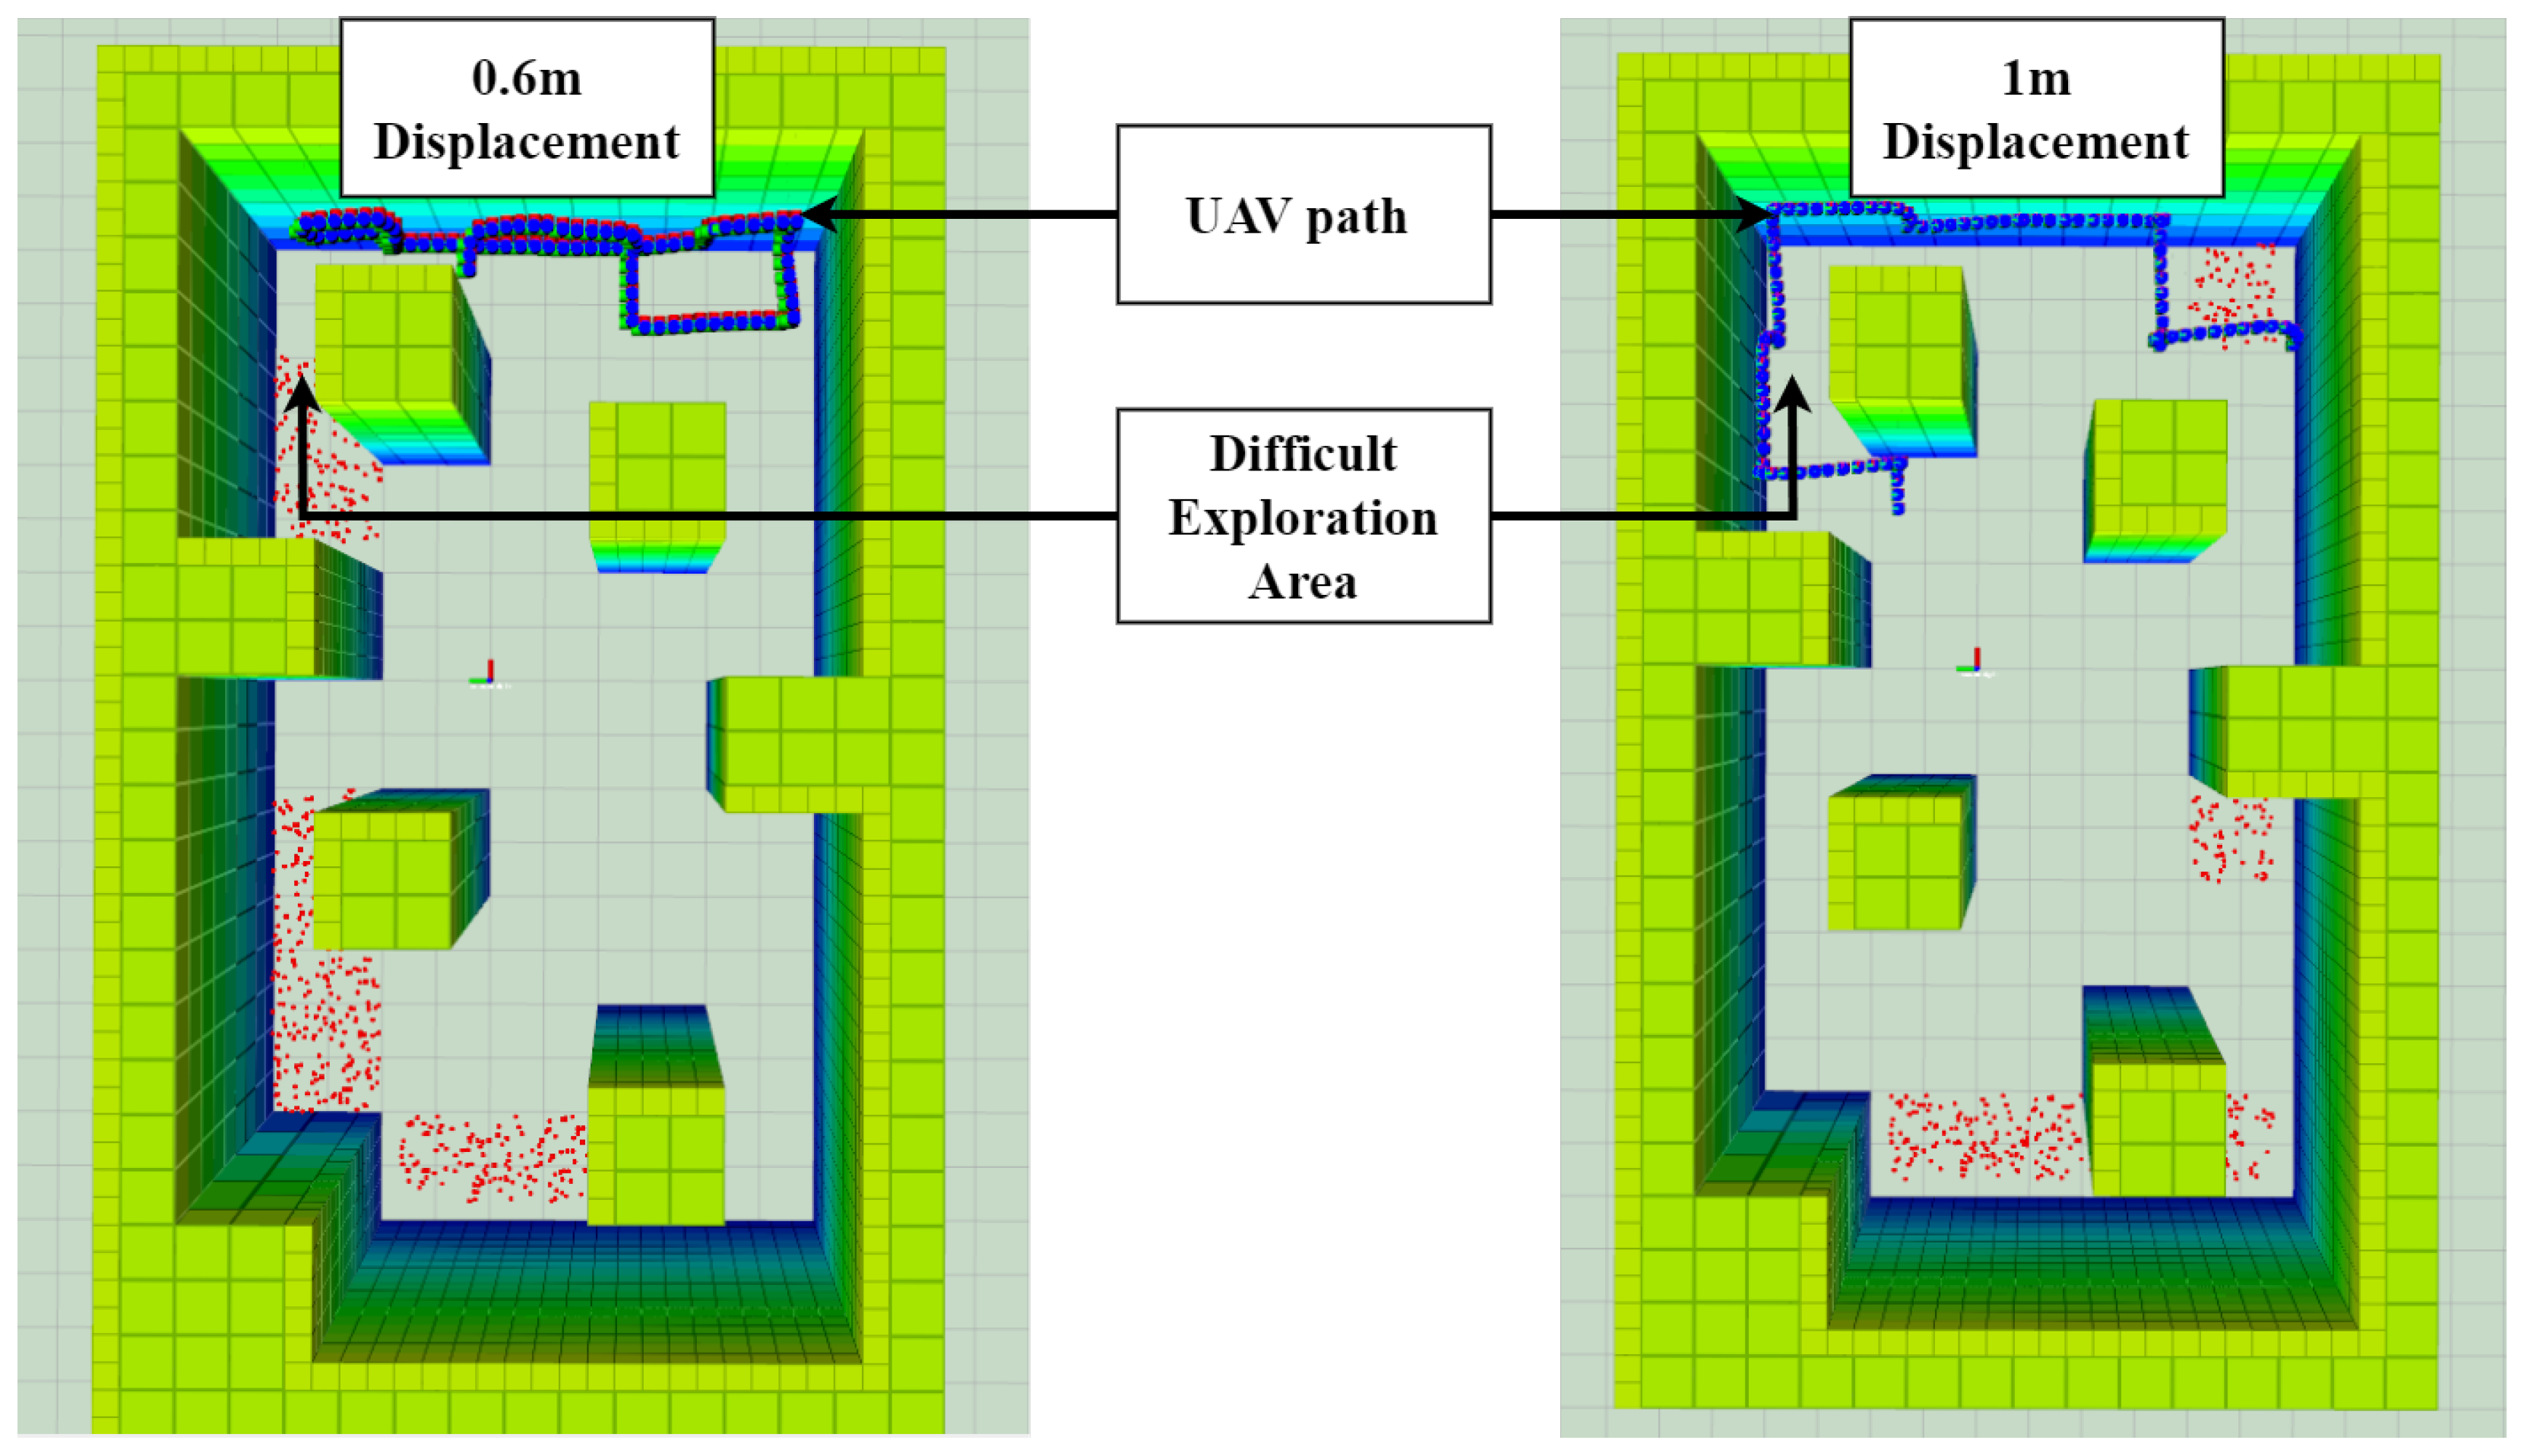
The first version of the framework was modelled with a velocity of 0.3 m/s and a time step of 2 s, resulting in a displacement of 0.6 m for the forward, backward, left, and right actions. This displacement was calculated by the transition function, modelling the transition from one state to another, which in this case, was the drone’s position state. This transition function is represented by the following equations:
This displacement of 0.6 m was later found to cause issues in more crowded environments, such as the map tested in the experiments. More precisely, a displacement of 0.6 m was not fully compatible with the environment representation of a 1 m × 1 m cell and 1 m × 1 m obstacles. For example, the cells located in the top left corner were difficult for the UAV to access. The obstacle created a single possible path, forcing the UAV along the wall and around the obstacle. However, a displacement of 0.6 m did not allow the agent to follow this path, as shown in
Figure 18. This misrepresentation of the displacement magnitude and the environment highlights the proper functioning of the POMDP. Exploration at the cost of collisions or exiting the ROI is not a possible output of the solver. However, the lack of compatibility between these two components produced unexplored areas, and often caused the UAV to be stuck in a series of opposite actions (UP, DOWN, UP, DOWN). To fix this problem, the x and y displacement was increased to 1 m per action. As the agent starting point is at the centre of a cell, each action would move the UAV from the centre of one cell to another. The uncertainty in action, represented by an uncertainty angle of one radian, would still result in an approximate position at the centre of the cells. To attain this displacement, the velocity was selected to be 0.5 m/s, with a time step of 2 s. These parameters allowed the UAV to explore most of the map while avoiding obstacles and staying inside the ROI, as shown in
Figure 18.
Overall, this study offers a flexible framework for autonomous UAV decision making in low-visibility environments with no GNSS. The framework is scalable, flexible, and portable depending on the selected sensors, mission goals, and algorithms used in the object detection and decision-making modules. The POMDP formulation was designed to work with other multi-rotor UAVs of larger or smaller sizes, thanks to the transition function modelling the dynamics of a UAV. The transition function was built based on a quadcopter dynamic model, but can easily be modified to model the dynamics of a hexacopter, for example. The reward function, state space, and other parameters of the problem formulation are not specific to the drone. Actions are modelled only for multi-rotor UAVs, as they can hover and move to waypoints. Larger environments can also be used to test this problem formulation, and will not impact the performance of the POMDP solvers or other algorithms. Thermal cameras also offer a robust solution for human detection in degraded visibility environments.
In terms of limitations, the current framework is dependent on the occupancy map provided before the mission and is not updated during the flight, therefore assuming a static environment. The aspect of the environment that can be assumed to be stochastic is the visibility conditions, as thermal cameras are efficient in both normal and low-visibility conditions for heat signature detection. Not updating the map during the mission forces the pose estimation system to be highly reliable, as a high uncertainty for position estimation will have higher chances of causing collisions. Furthermore, the representation of the environment as a 2D grid map with 1 × 1 m cells limits the obstacles to a “square” shape or to “danger areas” with variable heights. Another limitation of this framework is the restriction to translation motion, with no rotations. This was selected to facilitate the dynamics and motion of the UAV, as well as to ease the integration between the possible actions and the environment representation. It is however possible to include heading actions in the problem formulation and to ignore the left, right, and backward commands.
A successful implementation of this framework for real-life applications in SAR operations requires the examination of several challenges, including but not limited to:
The UAV flight autonomy, which will restrain the mission duration.
The implementation of the localisation module using a sensor able to estimate the pose estimation of the agent with a low uncertainty.
A localisation module that is efficient enough to perform even in low-visibility conditions, including smoke or low light.
Hazards which might damage the UAV, including but not limited to chemical, electrical, and poor weather conditions.
Proper handling of LiPo batteries to avoid fire hazards from possible impacts and sources of ignition.
The size of the UAV which will be able to handle a heavy payload constituting several sensors.
8. Conclusions and Future Work
This paper presented a problem formulation and a framework for autonomous UAV navigation and target detection in GNSS-denied and visually degraded environments. The problem formulation was developed as a Partially Observable Markov Decision Process, and the system performed a mission modelled as a Search and Rescue operation. The mission consisted of exploring an environment composed of obstacles and visual obstructions to find a victim in an unknown position. The POMDP allows for the modelling of the target and agent’s position uncertainty as belief states using probability distributions. Simulation and real-life experiments were used to assess the performance of the framework. The ABT solver used in this paper allowed the system to first compute an offline policy a few seconds before the start of the mission, as well as improve the previously computed policy during the flight to output the most optimal path. The system proposed in this research allowed a small UAV to autonomously explore and navigate an environment composed of obstacles under low-visibility conditions to successfully find and detect a human being with an unknown position using target detection based on thermal imagery.
The primary contributions of this paper are:
- 1.
A UAV framework for autonomous navigation and target detection in GNSS-denied environments with low visibility and obstacles. The problem is formulated as a POMDP and has possible applications in Search and Rescue operations.
- 2.
The framework was implemented, integrated, and tested in real life to verify the simulation results. The decision-making and object detection modules run on the on-board computer and are considered as resource-limited hardware. The sensors, onboard computer, and other hardware are safely mounted on a small UAV, considered as a weight-constrained platform.
- 3.
Integration of a deep learning detection model using a thermal camera with a POMDP framework onboard a UAV.
This paper offers a novel POMDP formulation for SAR operations in GNSS-denied, visually degraded, and cluttered environments. As highlighted in the literature review in
Section 1, efficient solutions to explore and navigate challenging environments using UAVs already exist. However, these solutions either do not model decision making under uncertainty or have not been tested in low-visibility environments. This research is innovative by using a POMDP to allow a drone to autonomously explore a cluttered environment in different visibility conditions without a GNSS with state and action uncertainty.
Future work includes the implementation of the localisation module using sensors such as LIDAR or depth cameras to fully rely on the hardware present onboard the UAV without the use of the GNSS. It also includes researching the use of unknown maps and/or dynamic environments and modifying the problem formulation for this new challenge. A study comparing the performance of the current framework using the ABT with that of other POMDP solvers would also be highly beneficial. Moreover, training and testing newer object detection systems like YOLOv8 could be advantageous, as the framework allows for other tools to be implemented. Integrating the results of the objection model in the observation model of the POMDP could enhance the robustness of the POMDP in real scenarios.


