1. Introduction
Interferometric Synthetic Aperture Radar (InSAR) is a well-established technique for measuring the displacement of the Earth’s crust. InSAR is characterized by its all-day and all-weather capability along with its large-scale and non-contact observations, which allow for surface deformations to be acquired over wide areas at a relatively low cost. Thus, it has been widely used in many geodetic fields, including seismology [
1], natural disaster monitoring [
2], underground hydrology [
3], and others. With the fast development of SAR techniques, multi-temporal InSAR (MTInSAR) [
4,
5] approaches have been proposed to improve the accuracy of deformation monitoring, of which Persistent Scatterers InSAR (PSI) [
6,
7] and Small Baseline Subset (SBAS) [
8,
9] are the most widely used time-series InSAR analysis methods. The PSI technique focuses on identifying permanent scatterers stabilized over long time intervals in SAR images, while the SBAS technique works by adopting small baseline differential interferograms to minimize spatial decorrelation.
Usai et al. [
10] first introduced the SBAS technique by constructing a series of interferograms with small spatiotemporal baselines and using the least squares approach to retrieve the cumulative deformation. In 2002, Berardino et al. [
9] introduced the singular value decomposition (SVD) algorithm to solve the rank deficit problem that can arise in least squares computations with multiple subsets of baselines. However, the classic SBAS method inevitably suffers from several shortcomings, such as modeling errors and a lack of sufficient stable points in specific areas. Thus, a variety of improved SBAS methods have been developed for application to different scenarios. These include the coherent point target analysis (CPTA) method [
11], which combines the ideas of PSI and SBAS to obtain more accurate deformation results from limited SAR images; the TCP-InSAR method [
12,
13,
14], which exploits the insensitivity of strong scatterers to window size and oversampling together with the selected temporary coherent point (TCP) by screening the standard deviation of the target offset; the full-resolution SBAS method [
8], which solves the problem of sparse coverage of coherent points in a large spatial region by separating and resolving the high- and low-frequency signals; and the constrained network propagation (C-NetP) scheme [
15], which improves the stable point density of the full-resolution SBAS method in the low-coherence region. In addition, the NSBAS technology [
16] proposed by Lopez-Quiroz and Doin has become one of the most popular SBAS tools. It uses deformation conforming to a relatively fixed functional pattern as a temporal constraint and adjusts the degree of constraint by varying the value of the constraint factor. Hong et al. [
17] have proposed using a small temporal baseline subset (STBAS), which is able to integrate multi-temporal and multi-track data to improve the time resolution of deformation monitoring. Additionally, an idea for long-term deformation monitoring has been proposed by Deng et al. [
18], who proposed a multi-platform long-time-sequence SBAS (MC-SBAS) method. In 2019, Liu et al. [
19,
20] proposed solving the rank deficit problem by incorporating the minimum norm benchmark equation and thus developed the constrained SBAS (CSBAS) method.
In this situation, sequential SBAS [
21] is very suitable for real-time and long-term deformation observations, as it only needs to solve the new data incrementally each time rather than re-processing all the data as in the traditional SBAS method. Thus, this method can greatly improve the computational efficiency of SBAS and provide the possibility of real-time online surface deformation monitoring. In 2021, Wang et al. [
22] used the sequential SBAS technique to analyze Sentinel-1 satellite data from the Yellow River Delta region over a three-year period and were able to reduce the solution time by 40% while maintaining acceptable accuracy. In the same year, their team [
23] used the sequential SBAS technique to monitor the land surface subsidence in the Xi’an area in near-real time using multi-satellite SAR data, further demonstrating the efficiency and reliability of the method. Xu et al. [
24] have verified the performance of the robust sequential estimation method with respect to unwrapping errors in the SAR data stack using both synthetic and real Sentinel-1 SAR data sets over the Echigo plain in Japan.
As microwave remote sensing technology has gradually entered the era of Big Data, the surge in the amount of the SAR data has posed a tremendous challenge to traditional InSAR methods. The inefficiency of sequentially implemented algorithms and the lack of high-performance computing (HPC) frameworks have become barriers to the further development and application of the current SBAS method. To deal with the amount of data and intensive computing associated with InSAR missions, researchers have focused on performance optimization of InSAR processing platforms in recent years. Some of them have developed multi-core parallel algorithms [
25,
26,
27] and GPU-based InSAR processing technology [
28,
29,
30,
31,
32] to improve the overall performance; however, the potential of parallelism is strongly limited by the platform hardware. Meanwhile, other researchers have introduced InSAR HPC environments based on supercomputing platforms [
33,
34,
35,
36] or cloud computing platforms [
37,
38,
39,
40,
41], which can utilize more computing power to realize large-scale or even national-scale remote sensing tasks. However, their need for unified and expensive resource consumption or extra virtualization waste has made them inaccessible to many small- and medium-sized teams.
In this study, a multi-node parallel sequential SBAS processing platform (P2SBAS) based on the Hadoop distributed computing framework is proposed; the platform includes a distributed environment with easy deployment and a series of parallelized InSAR algorithms with high efficiency for SAR image registration, interferogram generation, filtering, phase unwrapping, sequential deformation estimation, and geocoding. Through rational allocation and scheduling of data processing tasks, the platform is able to obtain scalable computing power and realize the combined utilization of numerous hardware resources with variable performance. Furthermore, P2SBAS has an acceptable cost and good potential while balancing efficiency, flexibility, and robustness, and its performance is well-demonstrated on a real satellite SAR data set. The proposed approach may find application in large-scale, long-duration surface deformation monitoring in the LuTan project as precursor research to future big-Earth data applications.
The main advantage of the P2SBAS framework over existing supercomputing or cloud computing platforms is its cost and flexibility, which make it more suitable for small- and medium-sized teams to perform research computing. Compared to GPU-based or other multi-core parallel methods, its main advantage is its greater scalability, which allows it to go beyond the performance limits of a single machine. In particular, for current enterprise processors, a single CPU may possess hundreds of cores to efficiently execute multi-threaded algorithms. The value of the P2SBAS framework is its flexibility and scalability. Faced with data processing tasks of different sizes, the framework can flexibly select the appropriate nodes to form a cluster to ensure the efficient use of resources. The cluster nodes can also be deployed on existing computers, greatly reducing the cost and difficulty of deployment. In addition, when the data scale reaches a certain level, the framework can integrate the enterprise-level servers mentioned above as super nodes into the cluster control, thus realizing multi-level parallel acceleration from multi-thread to multi-process.
With the implementation of the LuTan-1 mission and the continuous launching of other SAR satellites with large coverage, SAR data sources and data volume have been significantly enriched and increased, which promotes InSAR deformation monitoring for wide areas. The P2SBAS system is designed to provide an efficient and reliable data processing platform for China’s LuTan-1 satellites. The LuTan-1 satellite system consists of two fully polarized L-band SAR satellites (A and B); specifically, the A and B satellites can operate independently as well as in dual-star collaborative imaging. The LuTan-1 satellite system was successfully launched in early 2022 and has started to acquire remote sensing data on a continuous basis. Considering that the LuTan-1 satellite system will be an important source of SAR data in the present and near future, it is considered to be the main design target of the P2SBAS framework. However, as LuTan-1 has not been in operation for a long time and has not yet accumulated enough SAR data, TerraSAR data are temporarily chosen to validate the framework in the experimental part of this paper, as the processing steps are similar for both. Subsequently, after successful validation of the P2SBAS framework, it will be formalized to process LuTan data when the amount of accumulated data is sufficient. The LuTan system is currently in the in-orbit testing phase, and its satellite data will be collected and further tested before being distributed both nationally and internationally. At that time, researchers in related fields will be able to access the latest LuTan data through the Internet.
The remainder of this paper is organized as follows:
Section 2 describes the distributed computing architecture and the modifications made to adapt it to the InSAR data processing task.
Section 3 focuses on the parallelized implementation and performance analysis of the underlying algorithms for several key steps in the processing chain, including image registration, phase unwrapping, and geocoding.
Section 4 introduces the principles and parallel optimization of the sequential SBAS algorithm. In
Section 5, an experiment with real SAR data sets is described, for which a total of 32 TerraSAR images of Beijing, China, were used to analyze and verify the efficiency and accuracy of the proposed P2SBAS chain in the InSAR processing environment. Finally,
Section 6 provides our concluding remarks.
2. P2SBAS Distributed Processing Chain Architecture
The P2SBAS processing chain proposed in this paper is based on the Hadoop distributed computing framework. Hadoop is a widely used open-source framework that originated from the Google File System (GFS) [
42] and MapReduce model [
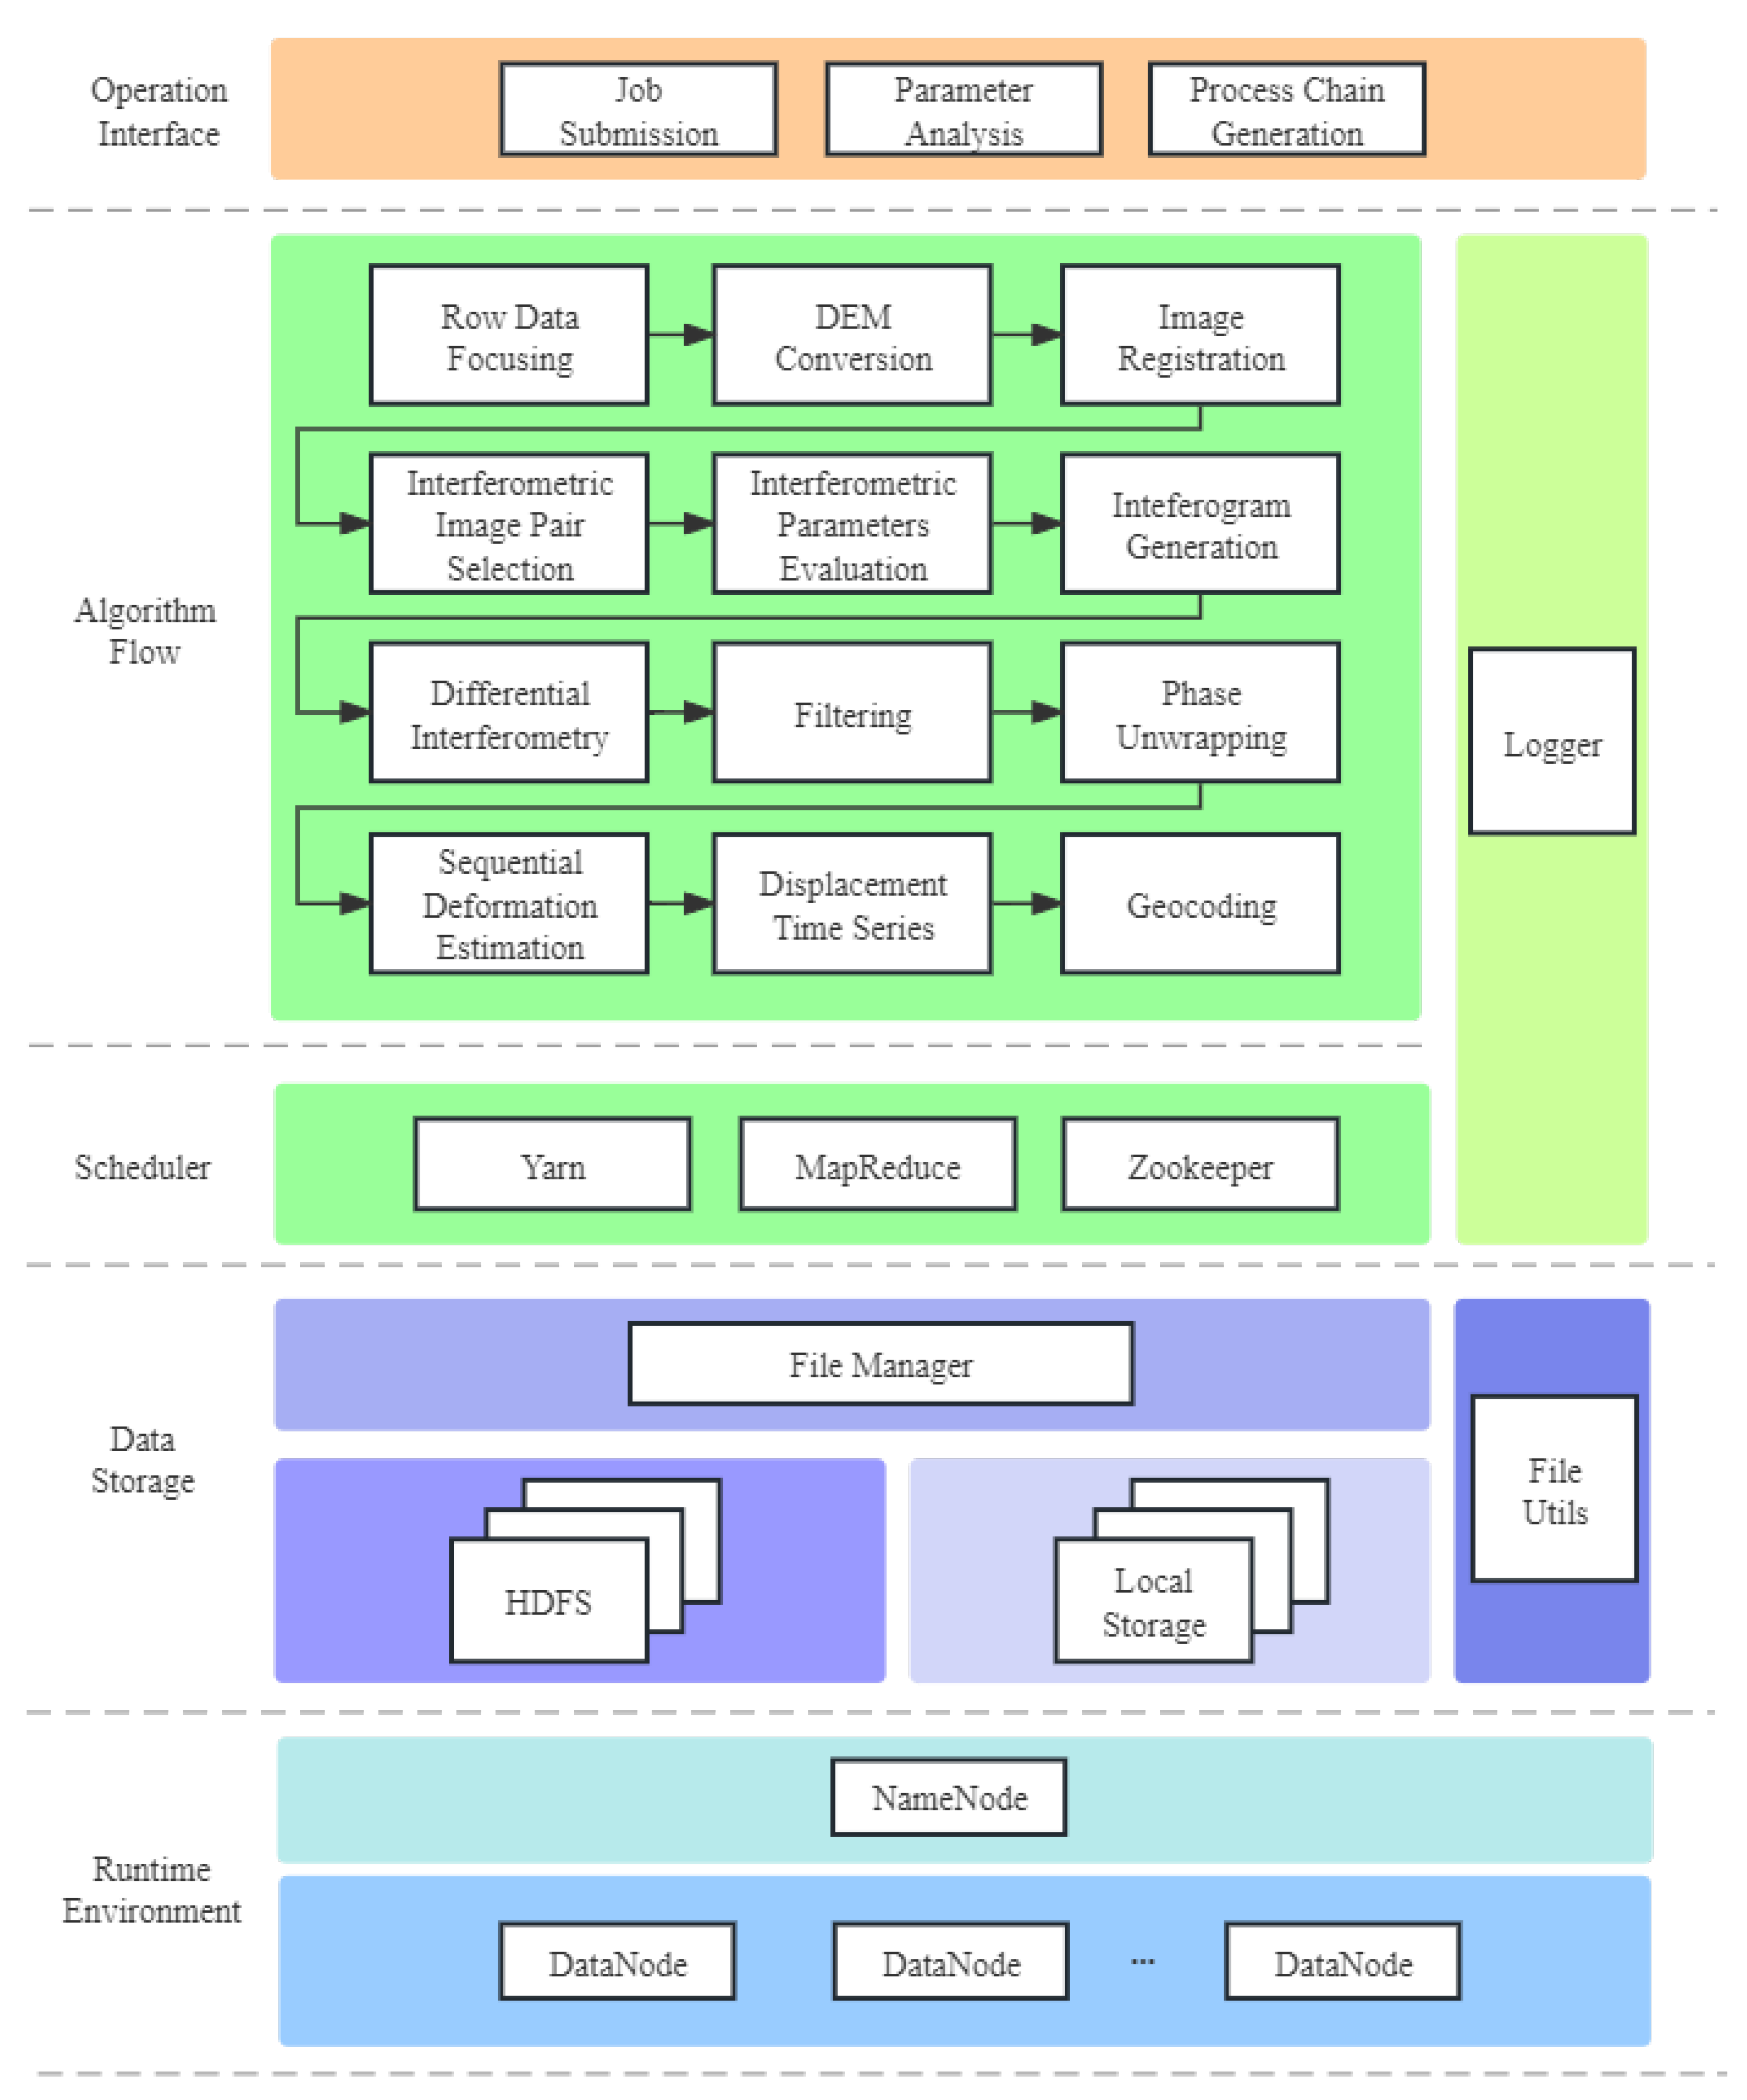
43] and that provides a solution for large-scale distributed data storage and computation. In this work, mature modules of Hadoop are used as the underlying infrastructure for InSAR distributed computing, with Hadoop Distributed File System (HDFS) as the distributed data storage and file system, MapReduce as the distributed computing model, Yarn as the cluster scheduler, and so on. In addition, the upper application layer of Hadoop was also modified, optimized, and implemented to adapt it to InSAR processing tasks. The algorithmic modules are designed to be completely decoupled from the processing platform, which allows for flexible reformation and iteration.
The system architecture of P2SBAS is shown in
Figure 1. Regarding the computing power allocation problem, mature Yarn in the Hadoop framework is used as the cluster scheduler and coordinates the node state through Zookeeper, which provides more efficient and stable scheduling performance. For the storage part, the file management module based on HDFS and local storage characteristics was rewritten to allow users to store pending data on a specific node and transfer them between nodes through HDFS. Furthermore, a file toolkit called File Utils is provided for users; it includes modules such as the snowflake algorithm, which is required for multi-tasking parallelism, thus improving the convenience and efficiency of InSAR data processing. NameNode and DataNode in Hadoop are carried along as the underlying node structure, which makes the interactions with other higher-level modules smoother. In particular, DataNodes are mainly responsible for data storage and processing tasks, while NameNodes also need to handle some of the task monitoring and resource management processes on top of DataNodes. Additionally, the platform of the proposed system is able to automatically serialize the execution of the algorithmic modules involved in the tasks submitted by users in the processing chain. The parameters for each algorithm step can be specified in the form of configuration files or command lines, and the missing pieces can be intelligently filled with the default values by the platform. Users can organize multiple algorithmic modules into appropriate processing chains and then execute them on the cluster with adapted parallel algorithms.
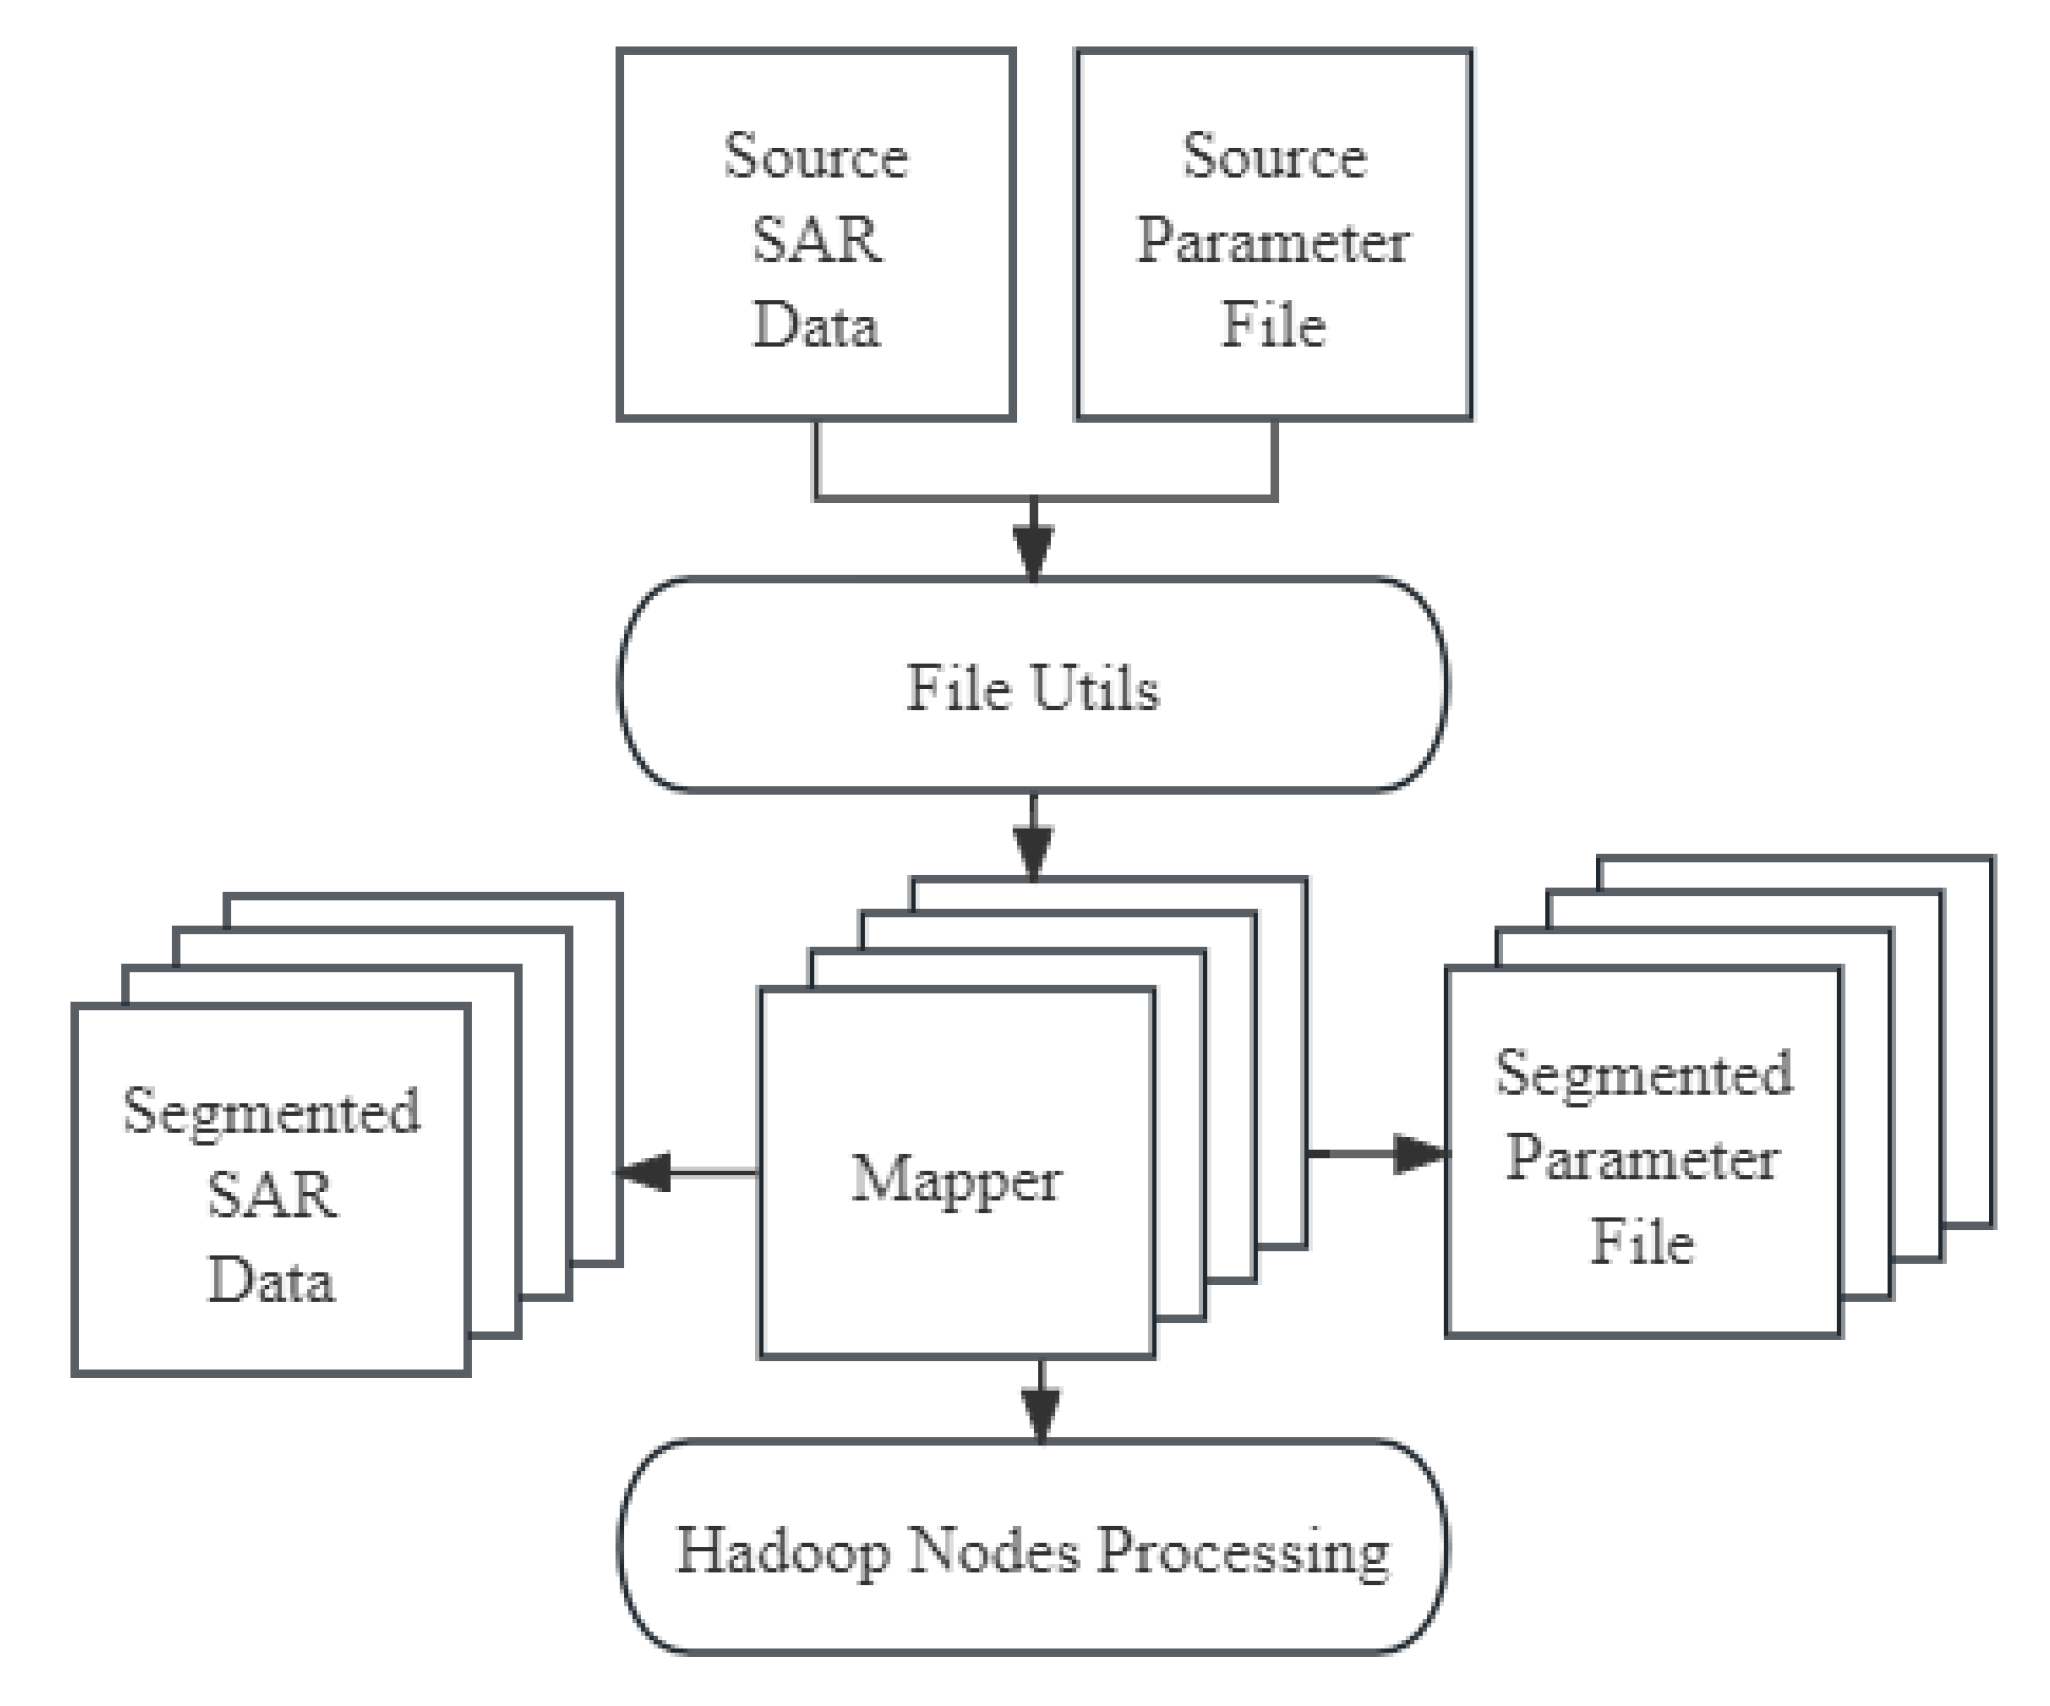
To parallelize specific InSAR algorithms, the features of the Hadoop framework are fully utilized and adapted to specific InSAR application scenarios through secondary development. As in the original Hadoop framework, the input files are specified as one or more folders. Hadoop segments all the files in these folders according to certain rules and identifies each slice as an independent sub-task. The Yarn scheduler then coordinates the idle nodes to fetch these sub-tasks and computes the results through the MapReduce model. In general, our idea of parallelization is to slice the input SAR data and parameter file. Each slice can be passed to different nodes for computation, and all sub-task outputs are finally merged into the task output. The whole procedure fits the MapReduce principles well, as slice processing can be considered as a map task and result merging can be considered as a reduce task. One of the most critical issues is that the processing of InSAR data is usually accompanied by multiple input SAR images and corresponding parameter files, but Hadoop does not provide an interface to package multiple inputs, which will result in incorrect execution of the algorithms. Moreover, the default slicing method of Hadoop is to directly truncate by file size, which will lead to corruption of the input SAR data. Therefore, new interfaces are developed to address these functionality shortcomings of Hadoop.
To construct a unified data division framework for the different InSAR algorithm steps, the proposed system includes a middle layer called the mapper to uniquely define and apply sub-tasks instead of the division of sub-tasks and the input data being directly related. Each mapper is uniquely bound to a sub-task and associated with the input SAR data and their parameter file. In addition, every mapper adaptively estimates the computation and storage resources required for the corresponding sub-task, enabling proper resource planning and scheduling by Hadoop in heterogeneous scenarios. In this design, Hadoop directly uses mappers as objects for resource allocation and node scheduling, which avoids the shortcomings of the original Hadoop framework regarding the handling of complex input sub-tasks. The module is shown in
Figure 2, where the mapper layer is designed to act as a bridge in the system that connects the data and their parameter files to the processing platform.
Replication of the P2SBAS System
P2SBAS is a high-performance InSAR parallel processing platform based on the open-source Hadoop framework, and this subsection provides some help with quickly reproducing the main features of P2SBAS. First, a Hadoop cluster needs to be deployed on a number of computers to ensure that the nodes can communicate properly with each other. A simple Hadoop script is then written to call the algorithmic interfaces sequentially, as shown in
Figure 3, as well as to realize the storage and transfer of relevant parameters. In addition, new parallel InSAR algorithms are written or existing InSAR algorithms are modified to fit these interfaces; the algorithms are coupled to the Hadoop scripts as modules.
Theoretically, any conventional InSAR algorithm can be adapted to the P2SBAS system through special parallelization modifications for efficient execution on the cluster. To reduce the limitations to other teams using this framework and to increase its compatibility at the algorithmic level, the calls made by the framework to the algorithmic modules are abstracted into three interfaces, as shown in
Figure 3. The framework calls the specific algorithmic implementations of the three interfaces in the order of the arrows in the figure, and the interfaces in the red box are executed in the cluster through the mapper mechanism. Therefore, for other researchers, the original InSAR processing algorithms can be implemented according to these three interfaces and run on distributed clusters using the framework. Specifically, the first interface is mainly responsible for the pre-processing steps of the algorithm, input data splitting, and generation of the mapper file; in the second interface, it is necessary to read the inputs and parameter lists of the sub-tasks from the customized mapper file and then execute the main body of the algorithm in parallel and store the output results; and the third interface can perform the merging of the results as well as the post-processing operations. It is worth noting that the Hadoop environment divides the storage space into two parts—namely, local storage and HDFS—so steps for transferring data and parameters between the two must be implemented.
3. Basic Parallel Algorithm Implementation
In this section, the implementation of the various processing algorithms required for the sequential SBAS method is introduced in detail. This work divides the P2SBAS processing chain into a number of relatively independent distributed algorithmic modules, including registration, phase unwrapping, filtering, and so on, with reference to the flow of the original sequential SBAS methods. For each algorithmic module, a novel parallel algorithm is proposed and is optimized based on the distributed cluster scenario, which significantly improves the computational efficiency under the premise of accuracy. The original stand-alone InSAR processors were all implemented by the research team except for the more complex phase unwrapping algorithm, which references the open-source SNAPHU algorithm for better results. Additionally, all the InSAR processors involved have been validated in the past on the team’s large-scale deformation monitoring applications. According to the different data and algorithm characteristics, specific parallelization and boundary processing strategies were employed to maximally optimize the efficiency and accuracy of algorithms. For different scenarios, the framework uses several sets of preset InSAR processing parameters based on past data processing experience as a basis. Then, the framework intelligently adjusts the parallel computing parameters, such as the splitting window size, overlapping region size, and so on, according to the scale of the input data, the free resources of the cluster, and the resource occupancy demand of the target algorithm module. Finally, the operator can manually adjust the processing parameters according to the output results of each algorithm module in order to obtain better results. A multi-machine cluster was built as the experimental environment to verify the performance of the investigated algorithms. The specific information of the cluster node is provided in
Table 1. All of the hardware used in the experiment was common, inexpensive computing servers, which was one of the original intentions of this research.
3.1. Image Registration
InSAR technology requires two or more SAR images for interferometric processing, and SAR images must first be co-registered with the reference image before subsequent processing steps. In this subsection, a parallel image registration method based on distributed clusters is proposed. SAR image registration is achieved by calculating the coordinate mapping relationship between the master and slave images in both the azimuth and range directions. Mainstream methods use this mapping relationship to perform a coordinate transformation on the slave image such that the resulting new image is aligned with the master image. For satellite-based SAR, the orbital offsets are relatively small with respect to the orbit altitude, and the coordinate offsets between homonymous points have a certain regularity. As such, higher-order polynomials are usually used to fit the coordinate mapping relationship.
Interferometry requires image registration accuracy at the sub-pixel level, so the processing method is typically performed in two steps: coarse and precise registration. Coarse registration can use the satellite orbit model and parameters to calculate the offset of some characteristic points between the master and slave images, providing an initial value for further processing. In the precise registration step, the following relationship is calculated by selecting a sufficient number of homonymous points with a uniform distribution from the master–slave image pairs, where
is the coordinate difference between the homonymous points of the master and slave images,
are the coordinates of the master image, and
are the band resolution parameters.
By solving for the parameters through least squares or other methods, the coordinate transformation relationship between the master and slave images can be obtained. Then, the registration process is completed by re-sampling and interpolating to generate the resultant SAR images. By analyzing the entire registration process, the computation of both coarse and precise registration is very simple and efficient. In addition, both of these steps involve cross-correlation operations, making them unsuitable for distributed computing scenarios.
As shown in
Table 2, the image registration algorithm was tested on a pair of 2.4 GB-sized images, and the proportion of the time consumed by each step was recorded. The first column of the table shows the steps in the image registration algorithm, the second column shows the time complexity of the corresponding step, and the last column shows the percentage of time spent on the corresponding step in the test experiment. The time complexity describes the rate at which the time consumed by the algorithm increases as the data size increases. For example, O(1) means that the time consumption of the orbit model calculation step is constant regardless of the data size, and O(n) means that the time consumption of the other steps increases linearly with an increase in data size. The test results indicated that almost 80% of the time was consumed in the final re-sampling and interpolation step. Due to the simple logic of the image registration algorithm, we ultimately decided to execute the previous processing steps serially and to introduce parallel computation only for the most time-consuming steps of re-sampling and interpolation.
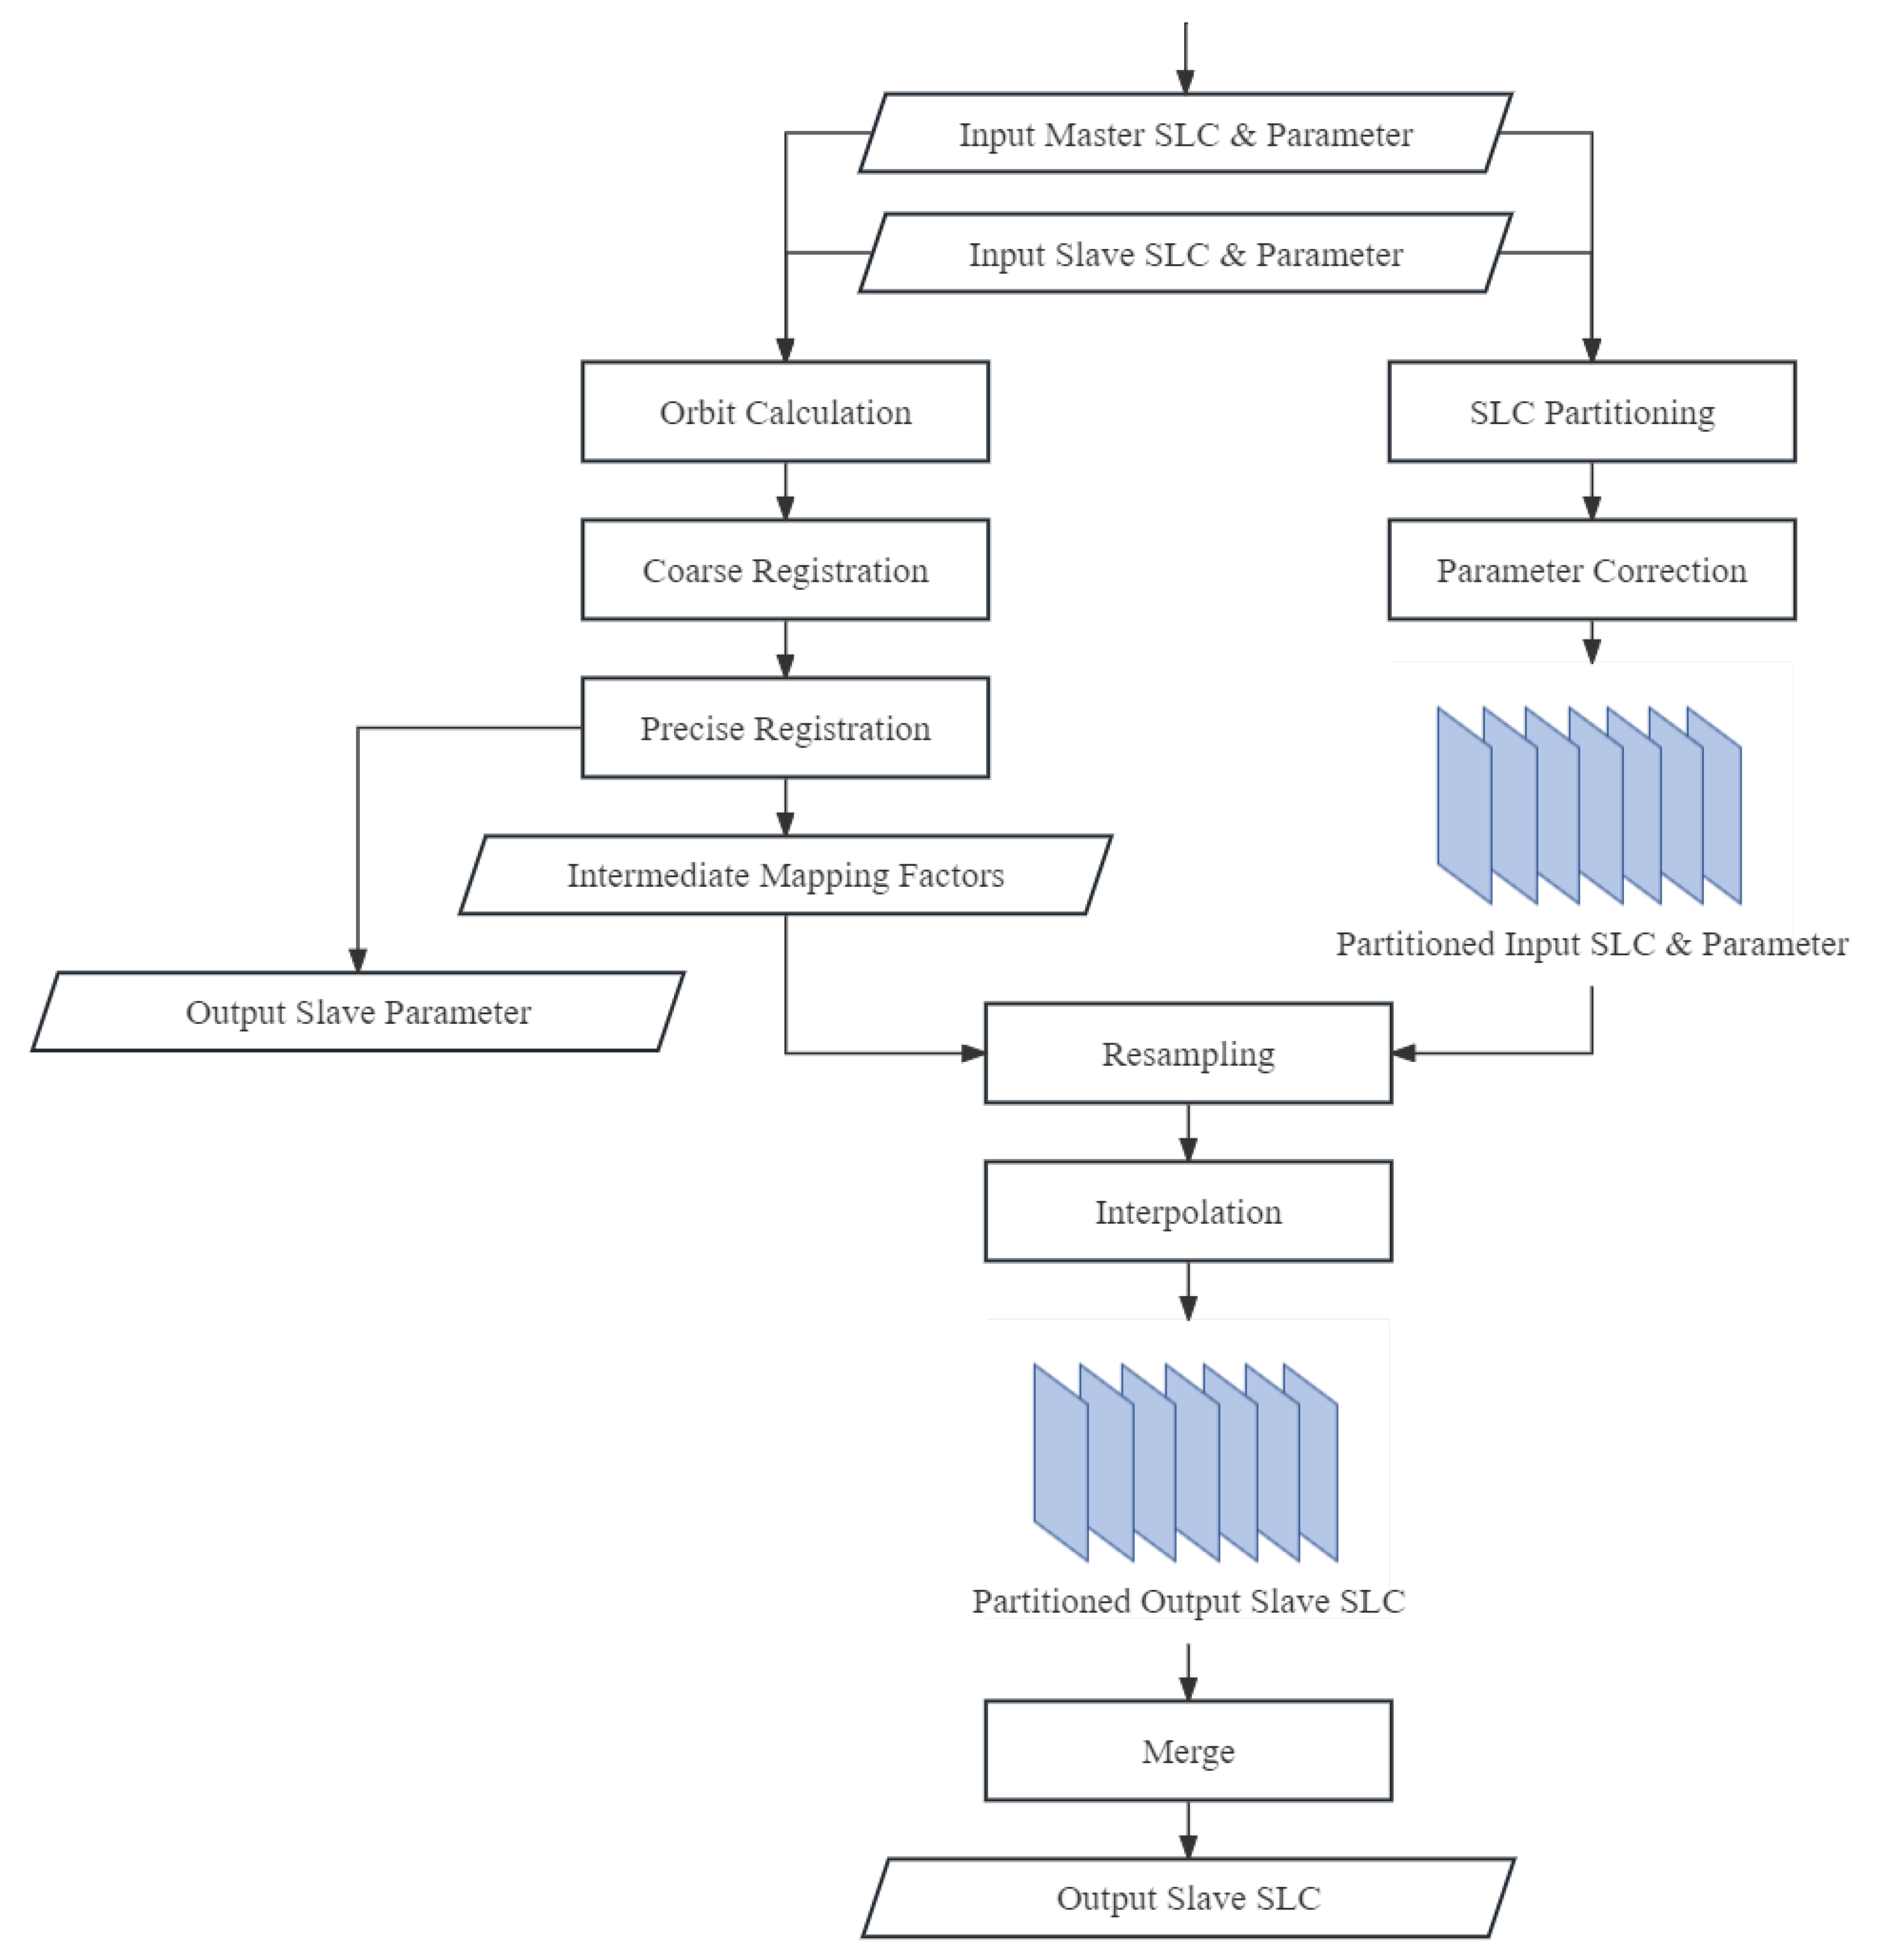
The flow of the parallel image registration algorithm proposed in this research is shown in
Figure 4. The overall flow of the algorithm is divided into two execution routes, which are used to compute the output SLC and its parameter file, respectively. First, the algorithm can quickly obtain the output parameter file as well as the required transformation parameters for the re-sampling and interpolation steps by serially executing the coarse and precise registration steps. At the same time, a splitting operation can be performed on the input SLC and parameter files: dividing the large-scaled SLC file into smaller blocks and assigning a new calibrated parameter file to each SLC block. In the splitting operation, a certain overlapping area needs to be preserved between neighboring blocks to provide a reference for the subsequent merging operation. It is significant to note that after splitting the input SLC files, the split parameter files of blocks must be corrected to ensure the accuracy of the subsequent steps. The subsequent computation is submitted to the distributed cluster, where each node performs re-sampling and interpolation operations on the blocks using the previously saved transformation parameters to obtain the output blocks. Eventually, the output blocks are merged into one large-size output SLC file through the reduce task in MapReduce. During the merging process, the offsets calculated from different data blocks will be averaged as the final calibration value, thus ensuring the consistency of the block registration process. The relative offsets between neighboring blocks will be corrected using the reserved overlap area to ensure sub-pixel level accuracy of the final output SLC image.
3.2. Phase Unwrapping
Phase unwrapping is one of the most important steps in the InSAR processing flow and is responsible for obtaining the surface elevation or deformation along the radar slant direction from the interferometric phase map. Over the past few decades, phase unwrapping research has spawned many different processing algorithms. In this subsection, the parallel network flow phase unwrapping algorithm is introduced; it incorporates many of the advantages of current approaches and combines them with the performance obtained through the use of a distributed cluster.
In network flow theory, the wrapped phase is defined as follows, where
denotes the wrapped phase,
denotes the unwrapped phase, and
denotes the remainder operation.
There are certain places in the network (known as residues) where the phase variation is discontinuous due to noise, among other reasons. Residues play an important role in the study of phase unwrapping. In two-dimensional phase unwrapping problems, residues are usually caused by the wrapping of phase values. When the phase changes by more than
, the phase value is added or subtracted by an integer multiple of
, making a reduction in the unwrapped phase complex and difficult. A residue is defined as follows:
The purpose of the network flow algorithm is to minimize the weighting of residues in the whole graph. The objective function is shown in Equation (
4), where
denotes the weight of the point.
The absolute value sign can be removed, and the original problem can be converted into a linear minimization problem:
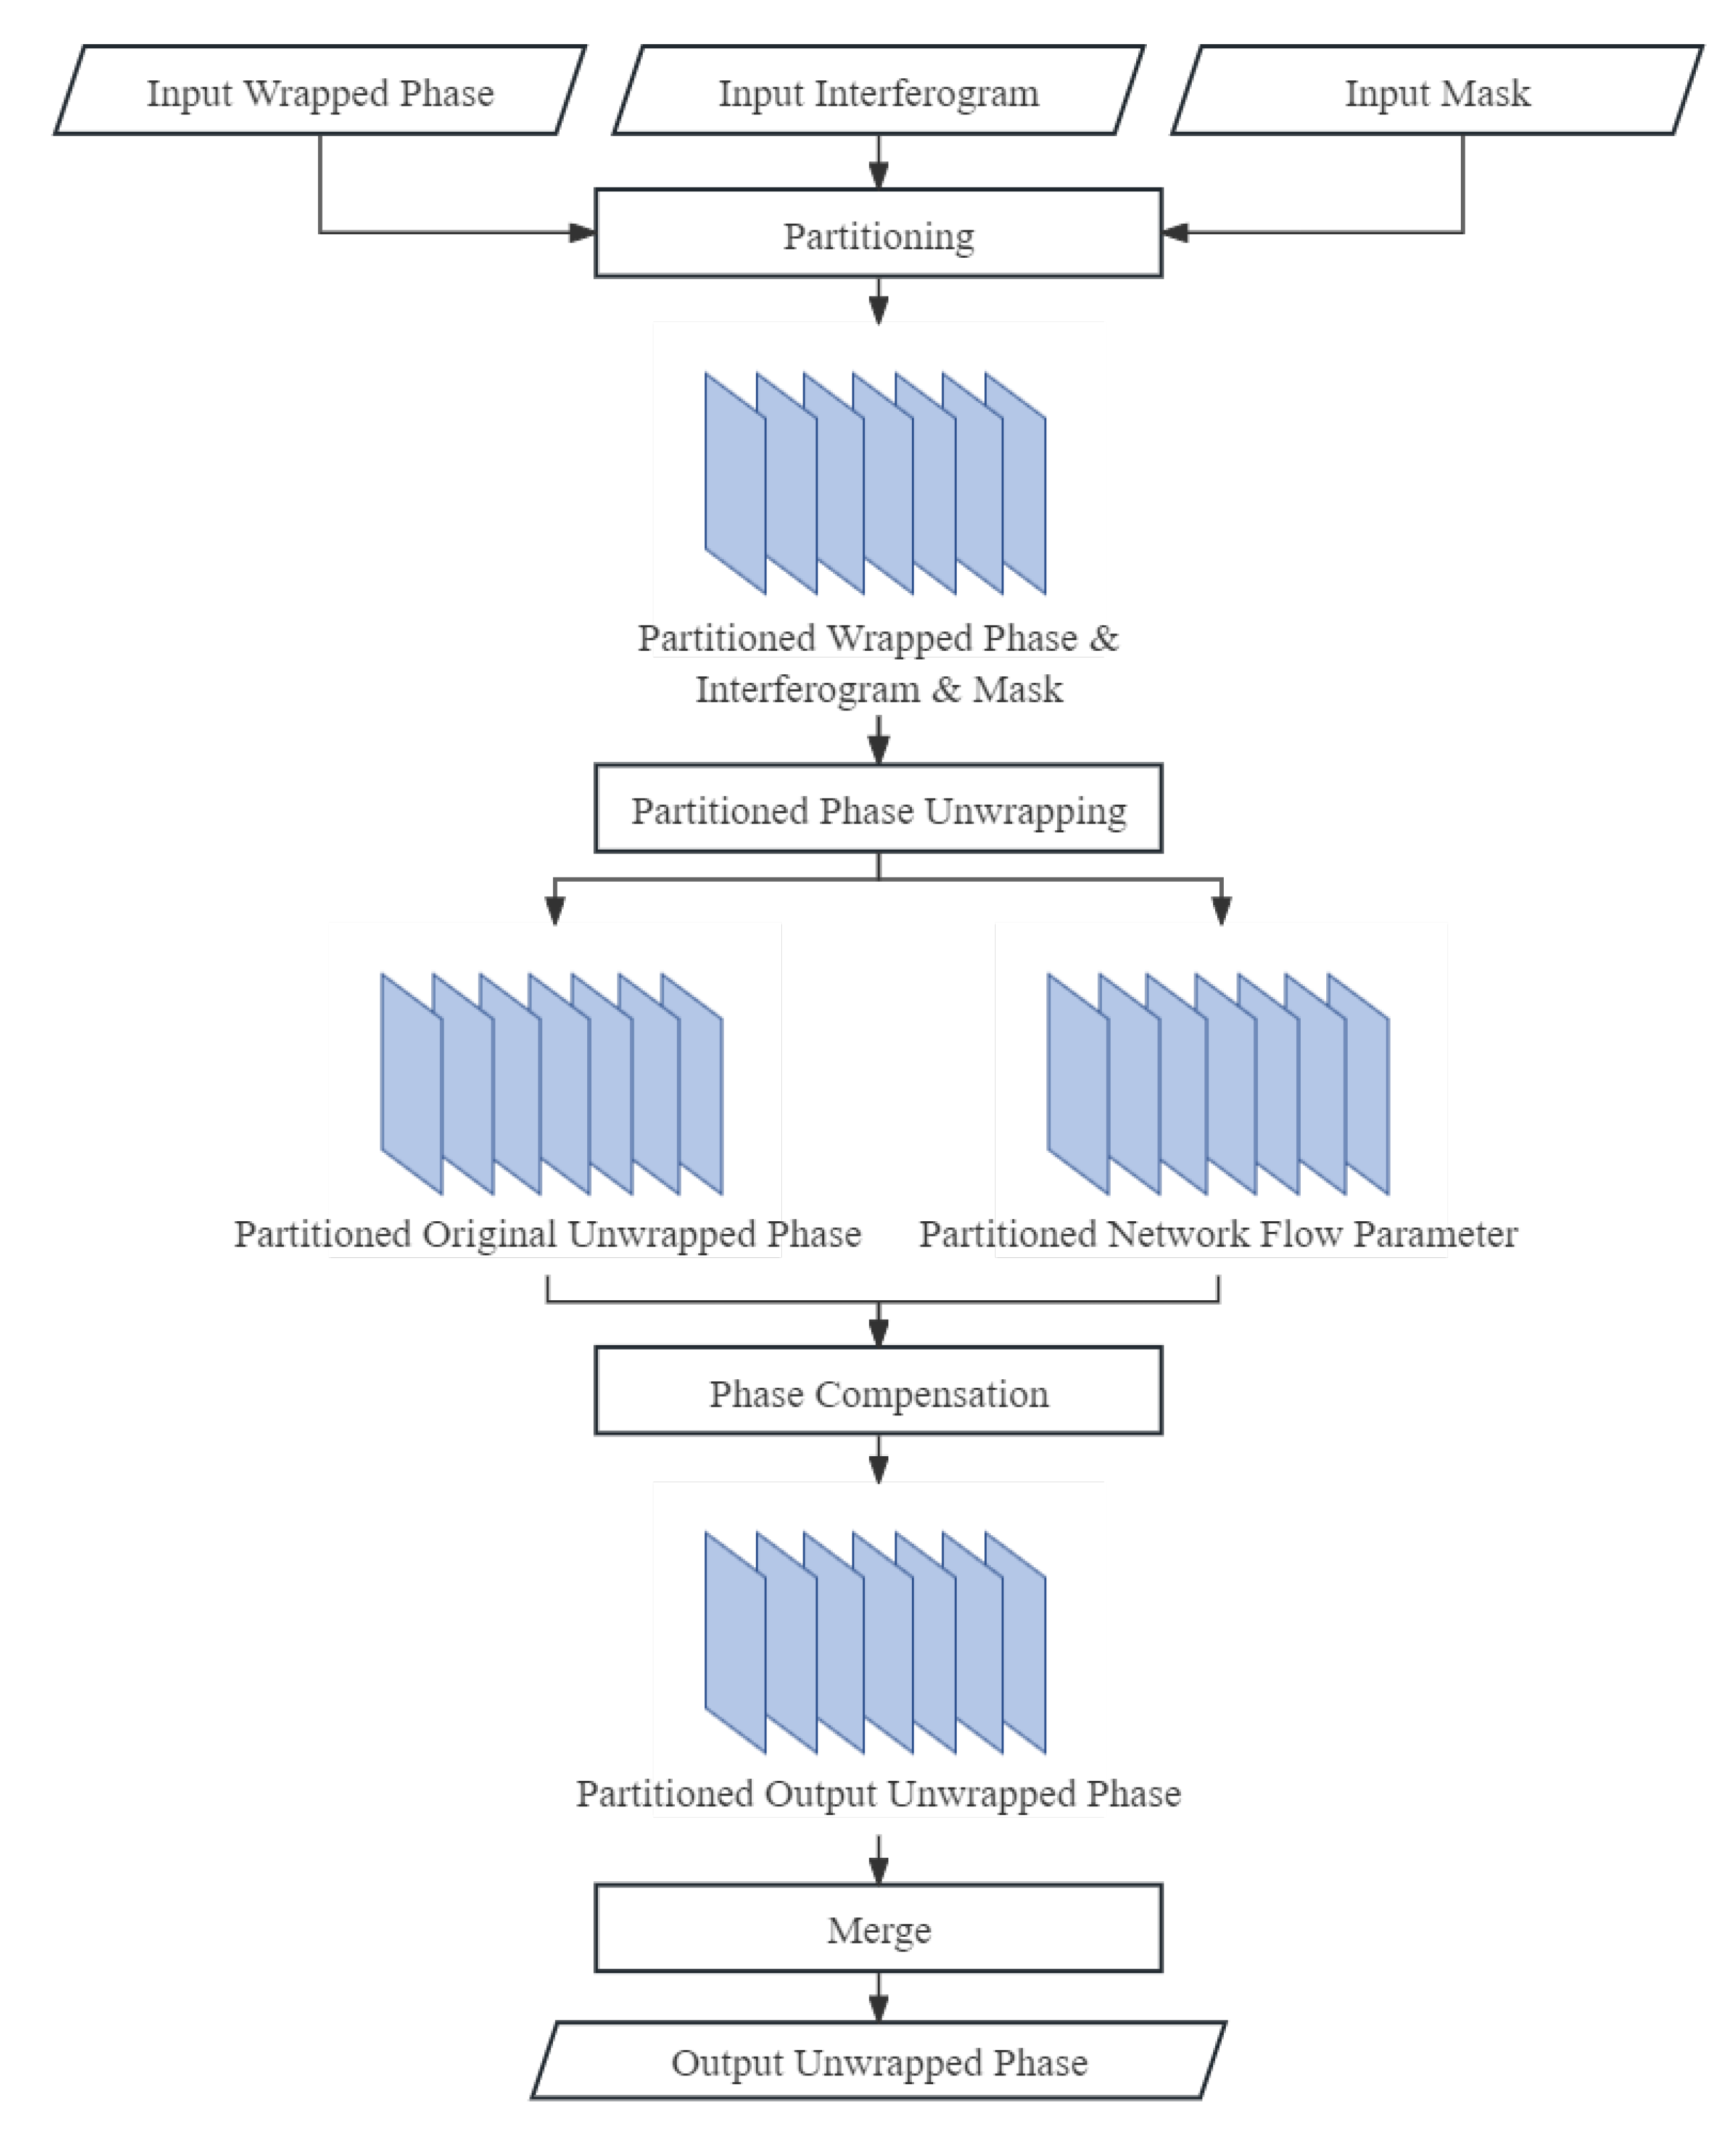
The phase unwrapping algorithmic module is one of the most demanding in terms of memory and computing power consumption. To get better results, we referred to the open-source SNAPHU algorithm and made some improvements in the division and merging part of the blocks to make it compatible with the P2SBAS system. The flow of the proposed phase unwrapping algorithm is shown in
Figure 5. Unlike image registration, the phase unwrapping algorithm requires direct adoption of the idea of partitioning the input data to reduce memory consumption. As shown in
Figure 5, the parallel network flow algorithm is executed in several steps. First, the algorithmic module calls the split program to split the input data, ensuring that different types of blocks still correspond after splitting. It is worth noting that a larger overlap needs to be reserved between neighboring blocks than in the registration algorithm, as the subsequent merging operation is more complex. Next, the corresponding input block files are packaged into a sub-task and submitted to the distributed cluster, which is assigned to the nodes of the cluster to execute the network stream phase unwrapping algorithm. Completing the above operations, the independent unwrapping results of all sub-tasks can be obtained. In order to further combine the results of all blocks, it is also necessary to obtain the relative phase offsets of each block, which can be calculated from the network flow parameters saved during the unwrapping process. By compensating the independent unwrapping results of each block with the calculated phase offset, the final output unwrapped phase of each block is obtained. Finally, using the previously reserved overlap between neighboring blocks as well as the special overlap processing strategy, all output blocks are merged into the output unwrapped phase data.
It is worth noting that there is a peculiarity in parallelizing the phase unwrapping problem, wherein merging the results of the independent unwrapped phase of each block becomes a complex problem due to the need to consider the effect of the unwrapping error situation within each block as well as in the block boundary region. Thus, the implementation of the algorithm refers to the block merging method [
44] proposed by the SNAPHU authors, which is explicitly shown in
Figure 5, for the phase compensation and result merging steps. Specifically, while each block is unwrapped independently, there is an initial cost flow difference between blocks, and the difference must be compensated. Therefore, the compensation value of the cost flow can be determined based on the difference between the in-degree and out-degree of the cost flow in the overlap area, which can be calculated as shown in Equation (
6), where
are the indices of the blocks:
The overlap regions are used to operate on all data blocks; we ultimately obtain an overall cost stream based on the data block in which the reference point is located.
3.3. Geocoding
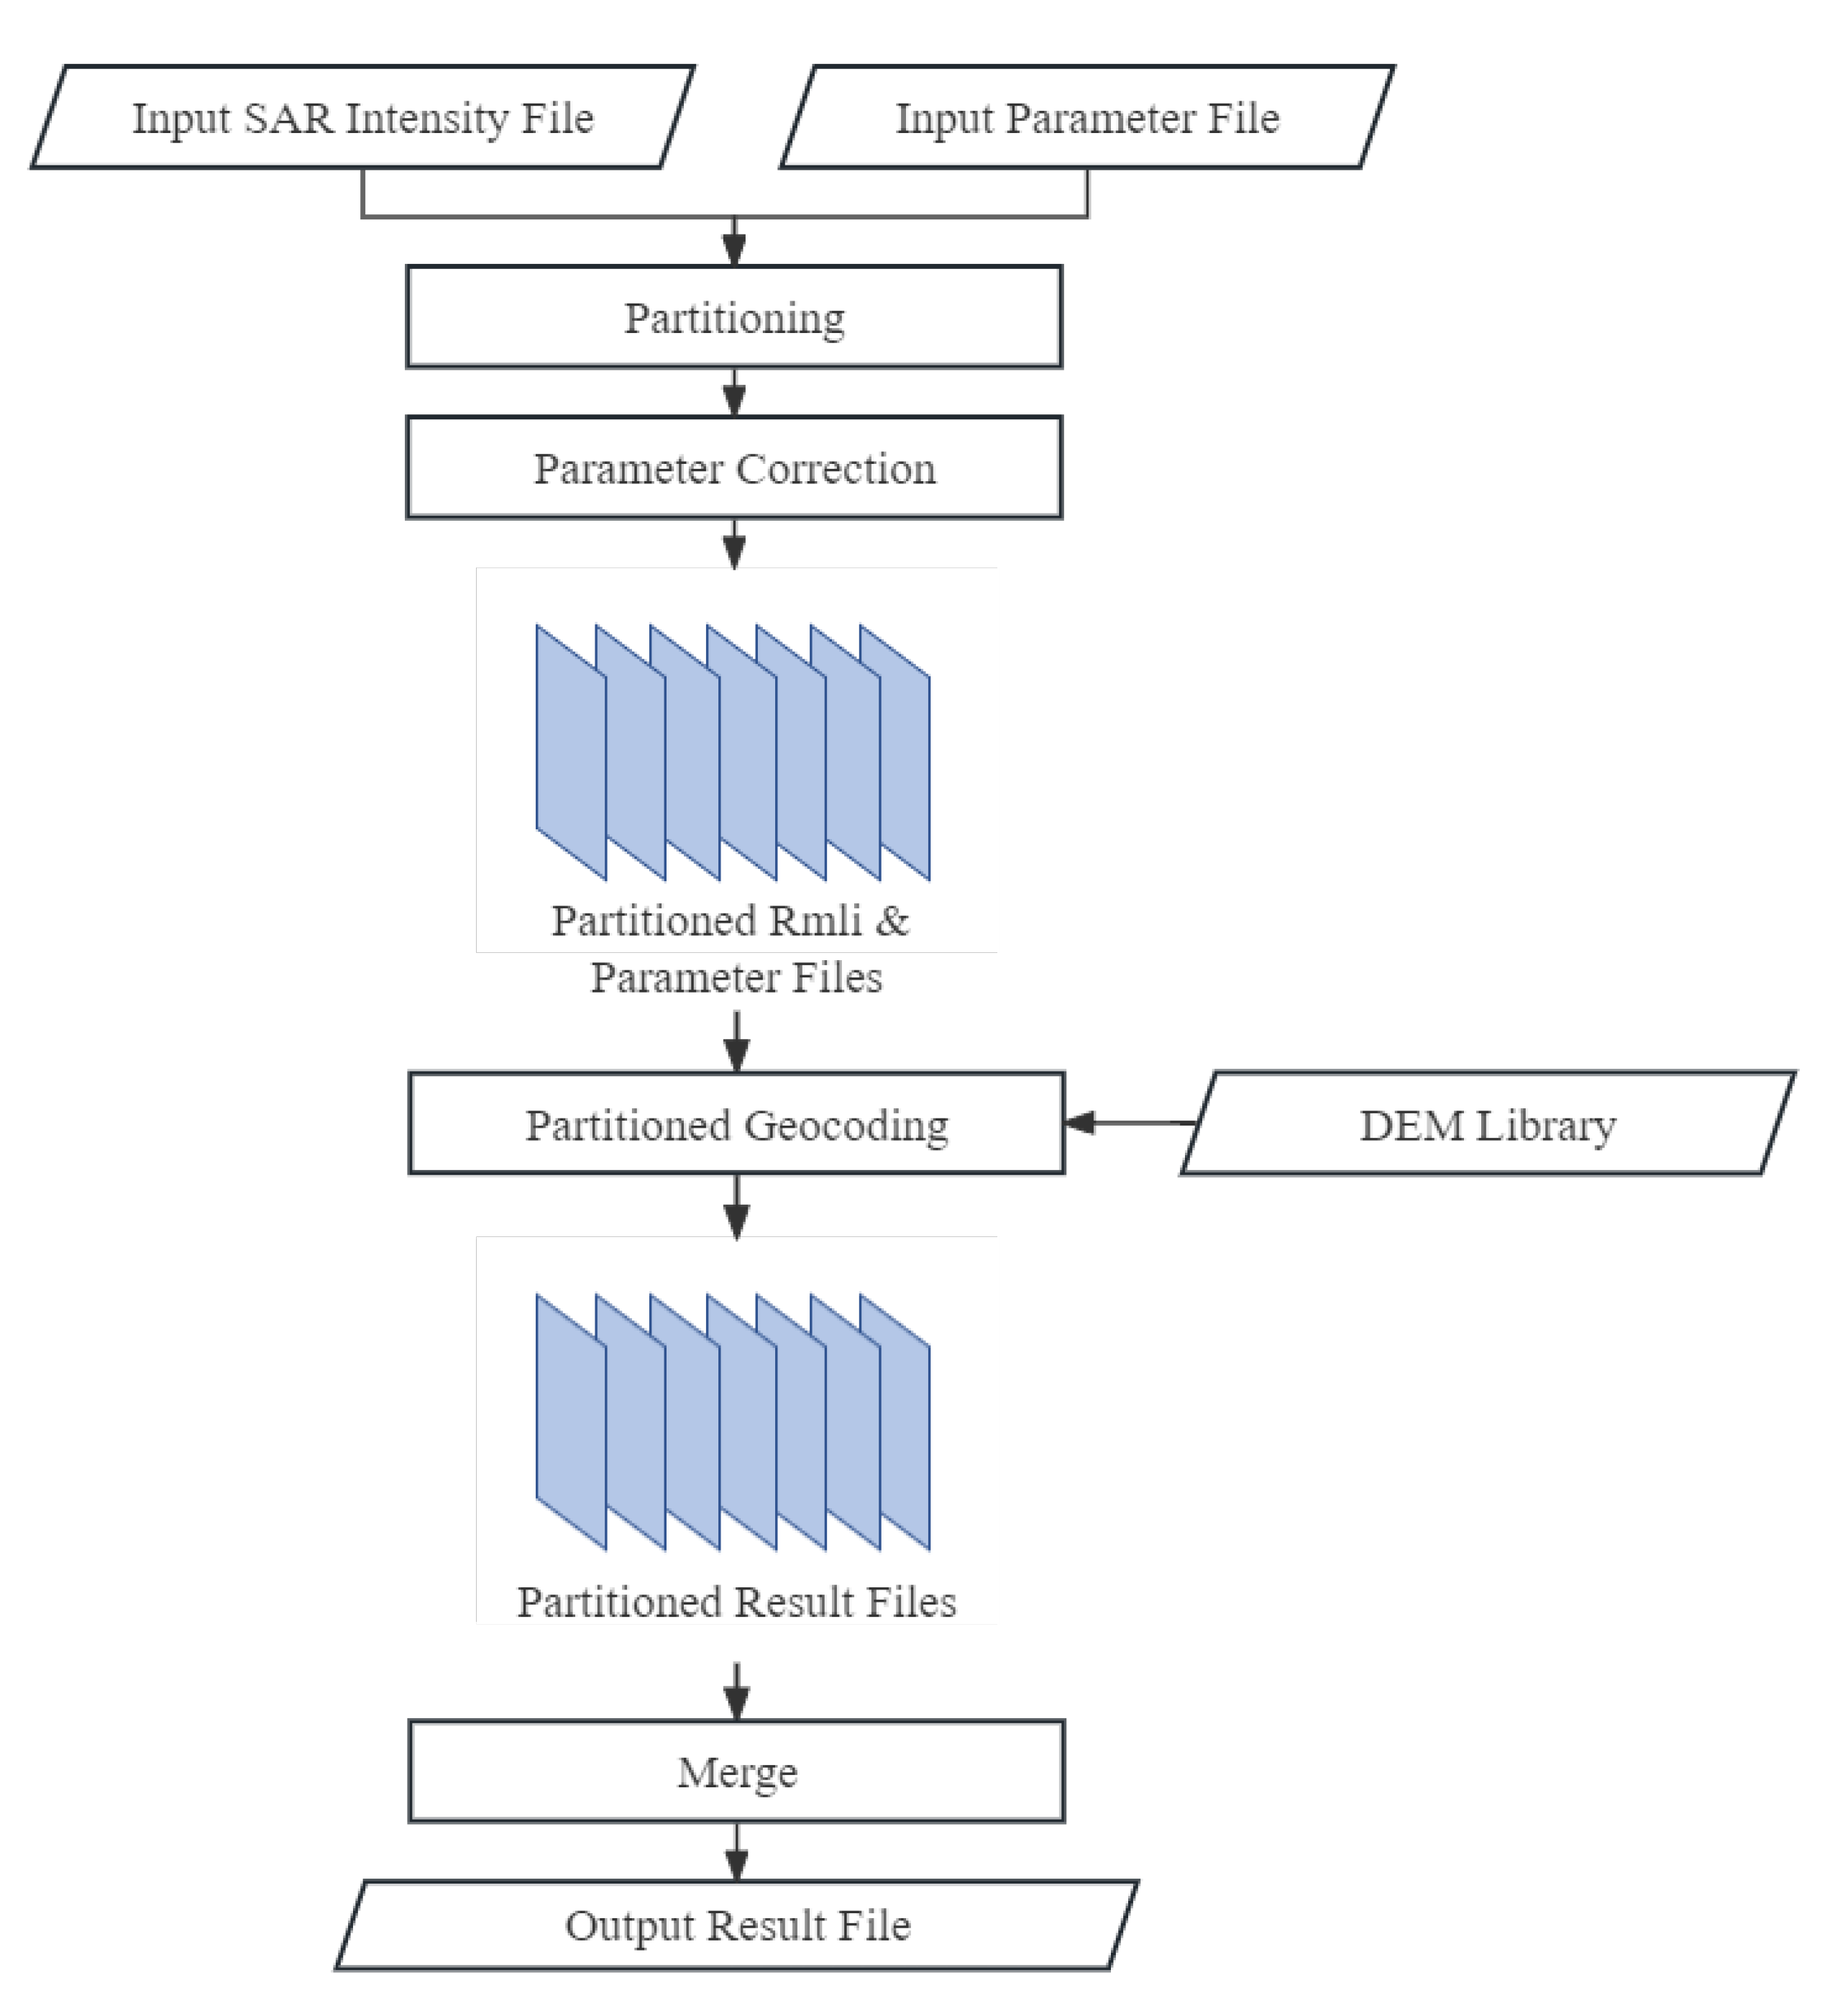
After completing the pre-processing steps, all data products need to be converted from the Doppler coordinate system to a map projection coordinate system, which is known as geocoding. In this subsection, a parallel geocoding algorithm optimized for distributed clusters is presented; it provides advantages over traditional algorithms in terms of simplicity and efficiency gains. First, geocoding can orthorectify the geometric variations due to radar side view or ground undulations. In addition, after conversion to the conventional ground coordinate system, the results can be more easily analyzed against conventional map products. At the algorithmic level, geocoding does not require complex logic and can be processed directly in parallel after splitting the input data.
As shown in
Figure 6, the input data are directly split, and a correction to the input parameters is performed. The overlaps between neighboring blocks can be controlled to be a similar size as the registration algorithm as they are only used to provide reference points for the merging operation. Then, all the data and parameter files are sent to the Hadoop cluster for distributed computation. Among them, complete DEM data are prepared on each node in advance such that the nodes can retrieve the corresponding DEM data directly from the local storage when performing geocoding tasks, saving the time associated with data transfer. Finally, all of the partitioned data are merged into the output result.
4. Parallel Sequential SBAS Algorithm
The sequential SBAS algorithm optimizes the computation of time-series deformation parameters for less memory consumption and higher computational efficiency. In simple terms, the traditional SBAS technique is used to calculate the deformation time series with single SBAS subset interferograms. When new SAR data are acquired, the previously estimated deformation parameters and their cofactor matrices are used, instead of the original interferograms, to update the deformation result as soon as possible. Therefore, sequential SBAS can greatly improve update efficiency by avoiding repeated calculation of existing interferograms, which is the main idea of online monitoring algorithms. In this section, a novel sequential SBAS algorithm based on distributed clusters is proposed, which further introduces the computing power support of distributed clusters in addition to the performance enhancement introduced using the sequential approach, allowing the overall algorithmic efficiency to reach a higher level.
As shown in the following equation, the previously proposed [
21] sequential SBAS method uses the unwrapped interferograms to estimate the deformation rate and digital elevation model (DEM) error, with the first matrix denoted as
, the second as
X, and the matrix on the right-hand side as
.
In the matrix
,
,
R, and
denote the radar wavelength, sensor-to-target distance, and incidence angle, respectively. Additionally, in the matrices
X and
,
V,
, and
denote the deformation rate, DEM error, and unwrapped interferometric phases, respectively. Furthermore,
M is the number of interferograms generated by the SBAS algorithm, and
and
are the perpendicular and temporal baselines, respectively.
In Equation (
8),
and
denote the measurement noise and the weight matrix, respectively. Additionally, the parameter
X is the deformation rate and the DEM error to be solved.
indicates the first estimation of the parameter
X, and
is the cofactor matrix.
In the sequential SBAS method, there is no need to resolve a new
X. When new image data are acquired, the previous result can be used as a priori information to recursively solve for the new
X.
and
can be viewed as following independent Gaussian distributions. Thus, the parameter
and its cofactor matrix
are updated as follows [
21]:
Sequential SBAS is a natural fit for the P2SBAS data processing platform, as new SAR image data can be continuously acquired from the Internet and used to update the Earth surface deformation calculations. For each step, the intermediate data are saved and quickly used for deformation solving for the next image.
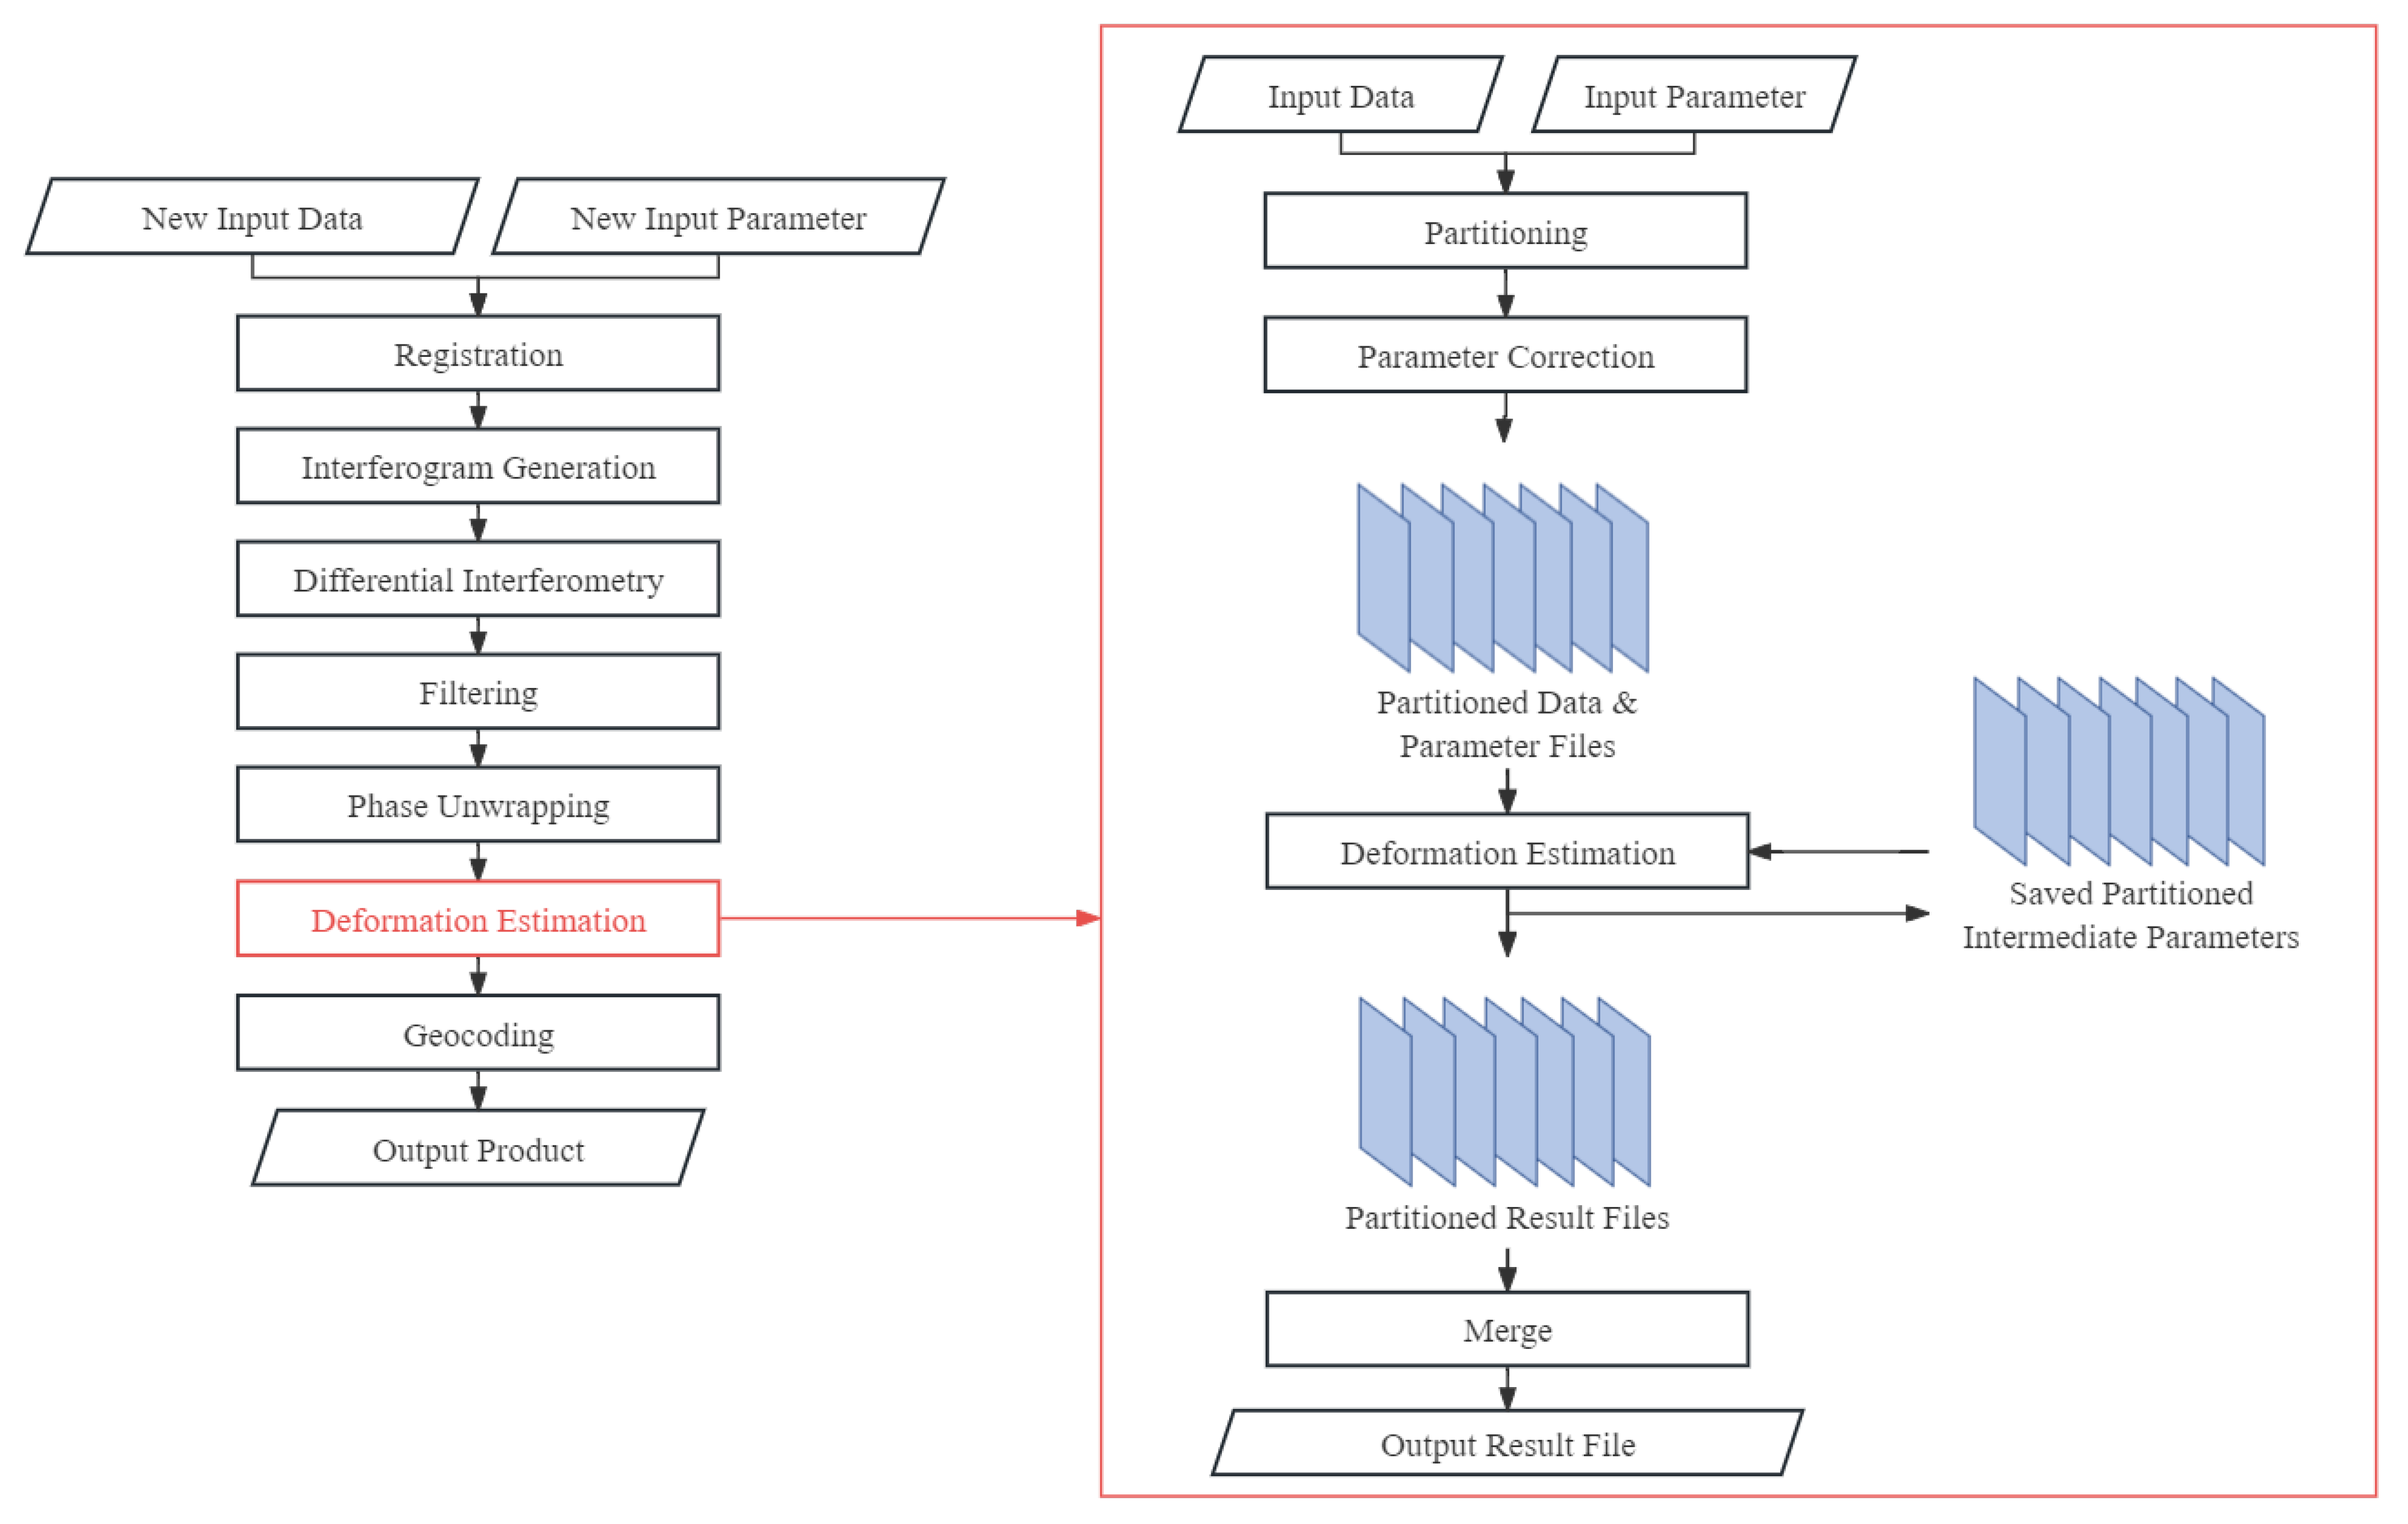
Figure 7 illustrates the simplified flow of the proposed novel distributed sequential SBAS algorithm. On the left side of the figure, a few key steps are selected to describe the whole P2SBAS processing flow, while on the right side, the details of the implementation of the sequential concept in distributed scenarios are specifically shown.
The SBAS task requires a series of algorithmic modules to be executed serially, including full-flow algorithm modules ranging from registration to geocoding. In the SBAS algorithm proposed in this study, the algorithms remain serially executed due to the causal dependencies between the algorithmic modules. However, the computational process within each module is optimized using distributed cluster and parallel techniques, referring to the design concept of the MapReduce model. Therefore, for the specific sequential deformation estimation algorithmic process, when new input data are acquired, splitting and parameter correction are first performed. Similar to other algorithms, certain overlap areas are reserved between neighboring blocks as a buffer. After that, the deformation estimation of each block is calculated by cluster nodes with the intermediate parameters, which are continuously updated after each computation and are saved in HDFS. Finally, the partitioned result files are merged into the final output image. With the help of the parallel sequential algorithm and the distributed platform, a large degree of efficiency improvement is finally obtained for the SBAS task.
5. Experimental Analysis
5.1. Experimental Results
For this study, experiments were performed on real data to address the theoretical issues of the distributed InSAR processing platform and the adaptive novel parallel algorithms. Additionally, the cluster information is shown in
Table 1, for which all nodes comprise commonly used computing hardware in order to verify the extensibility and flexibility of the distributed computing system.
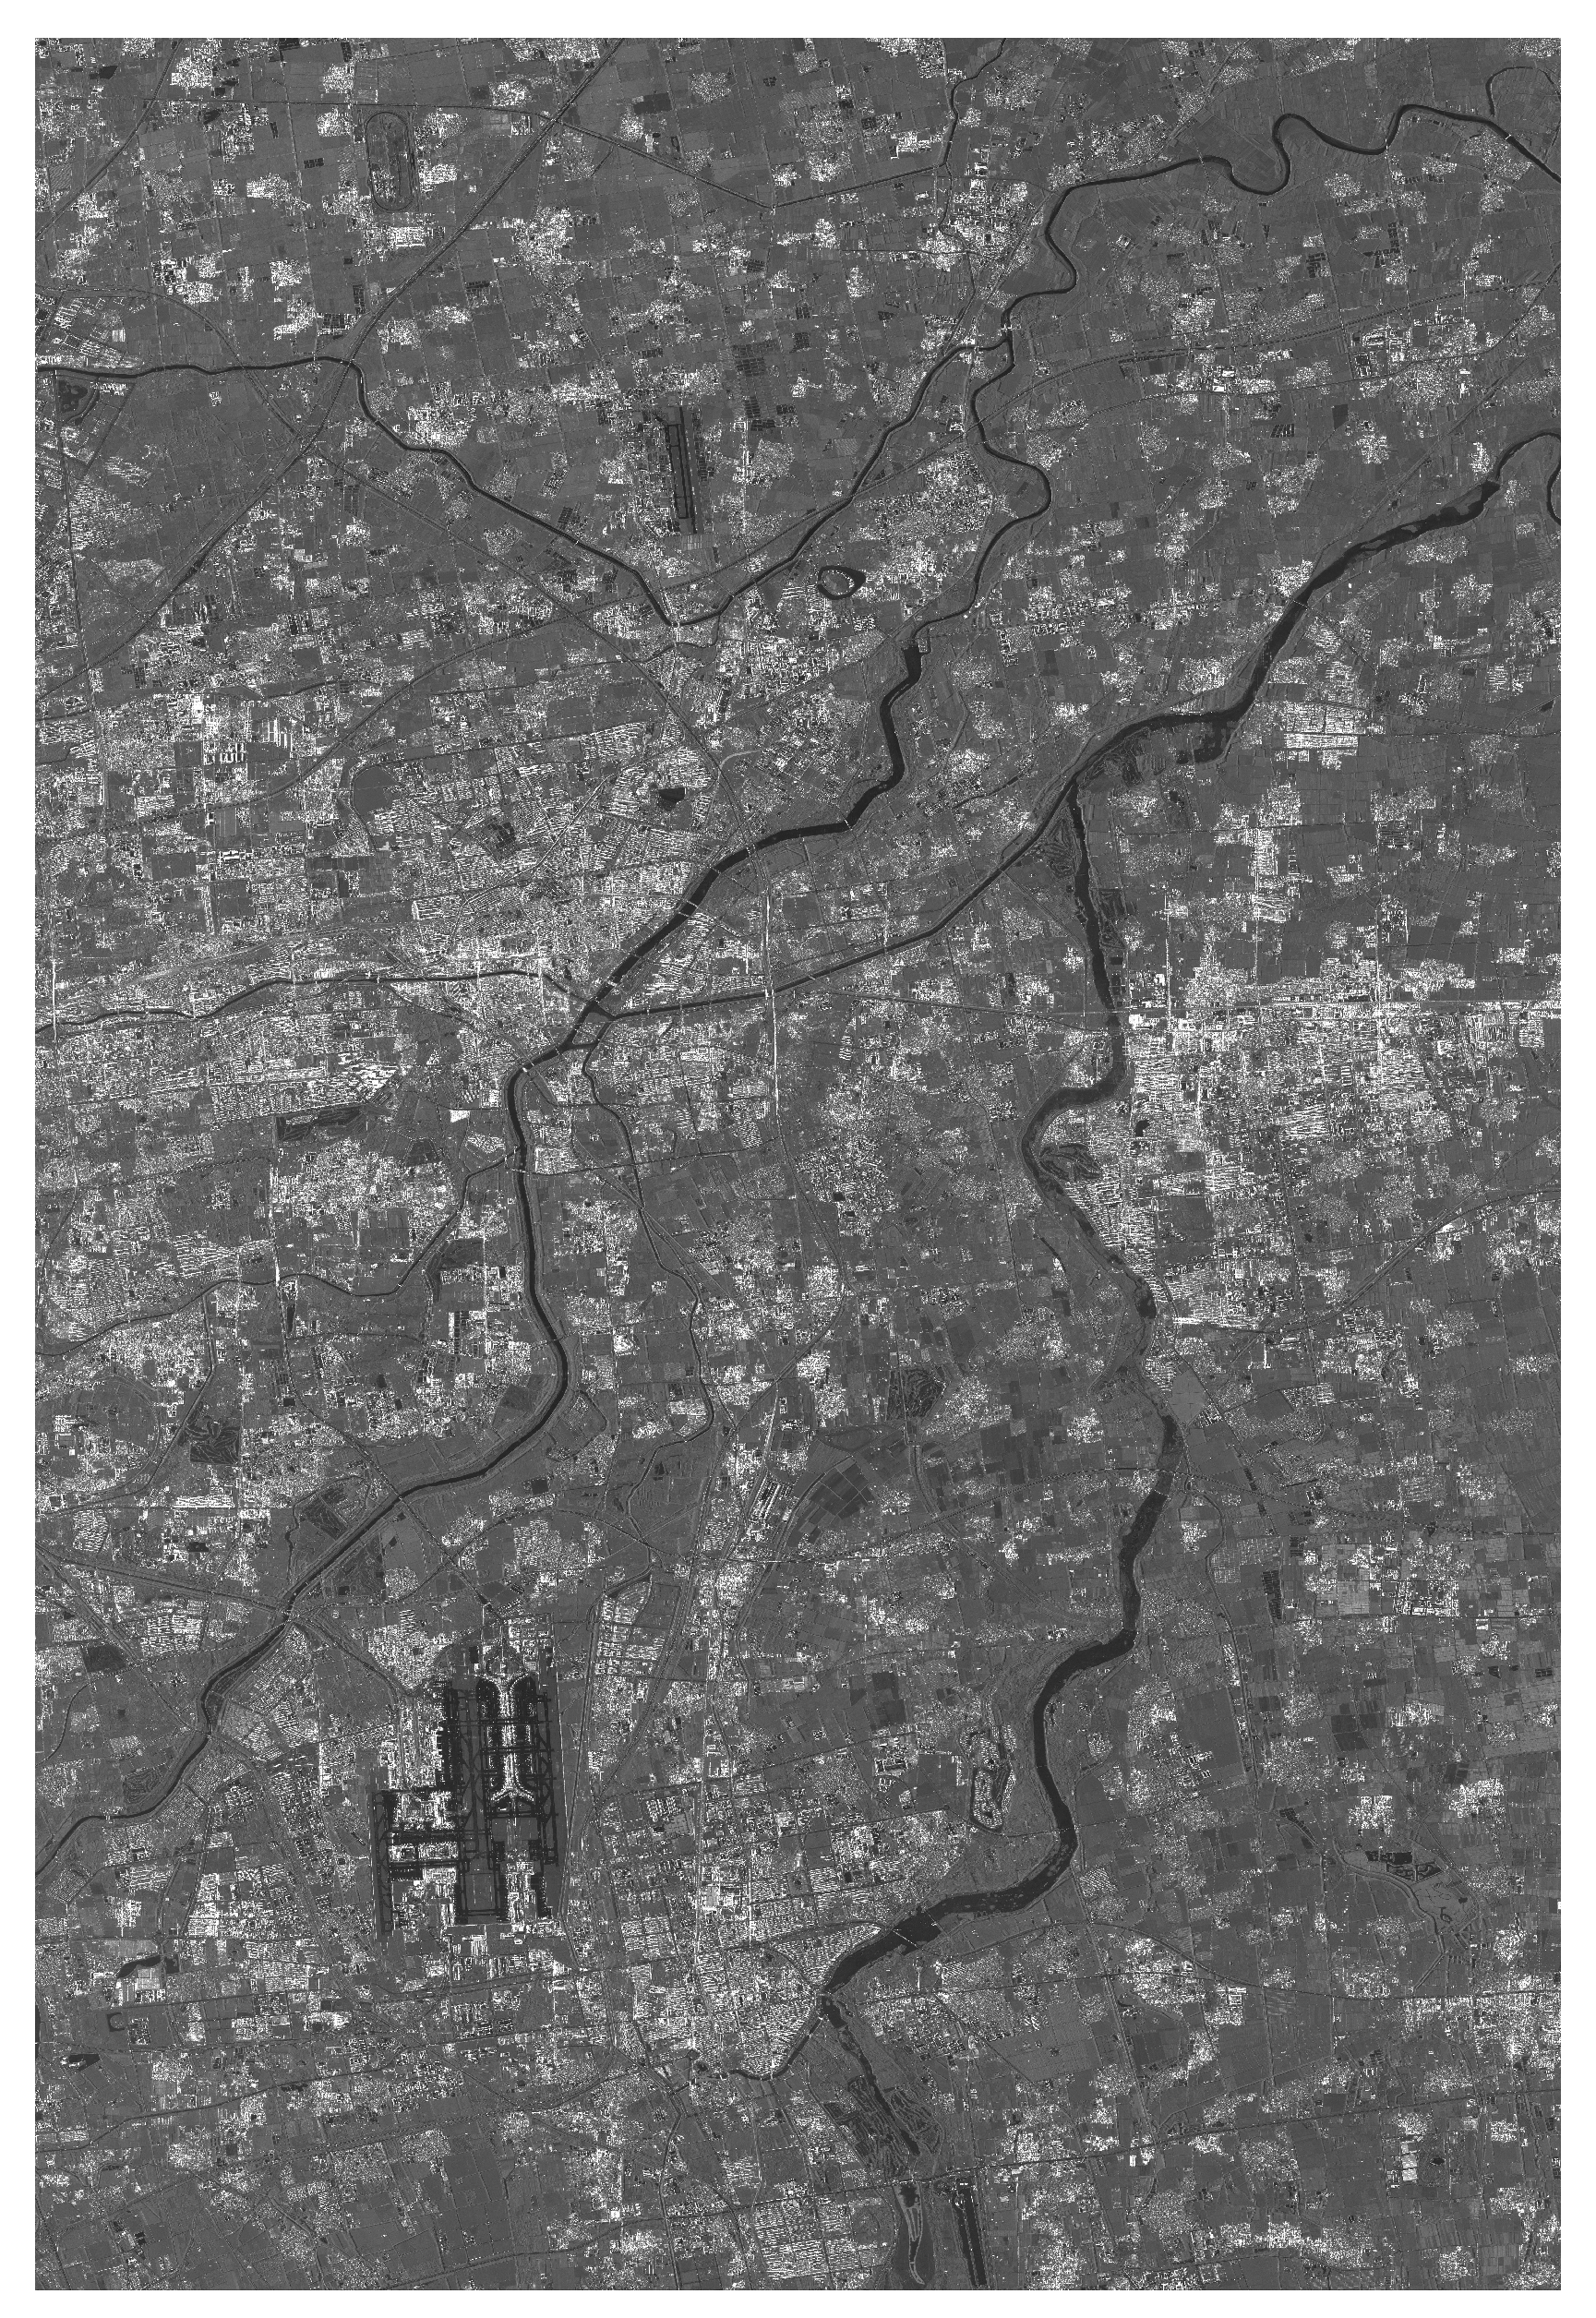
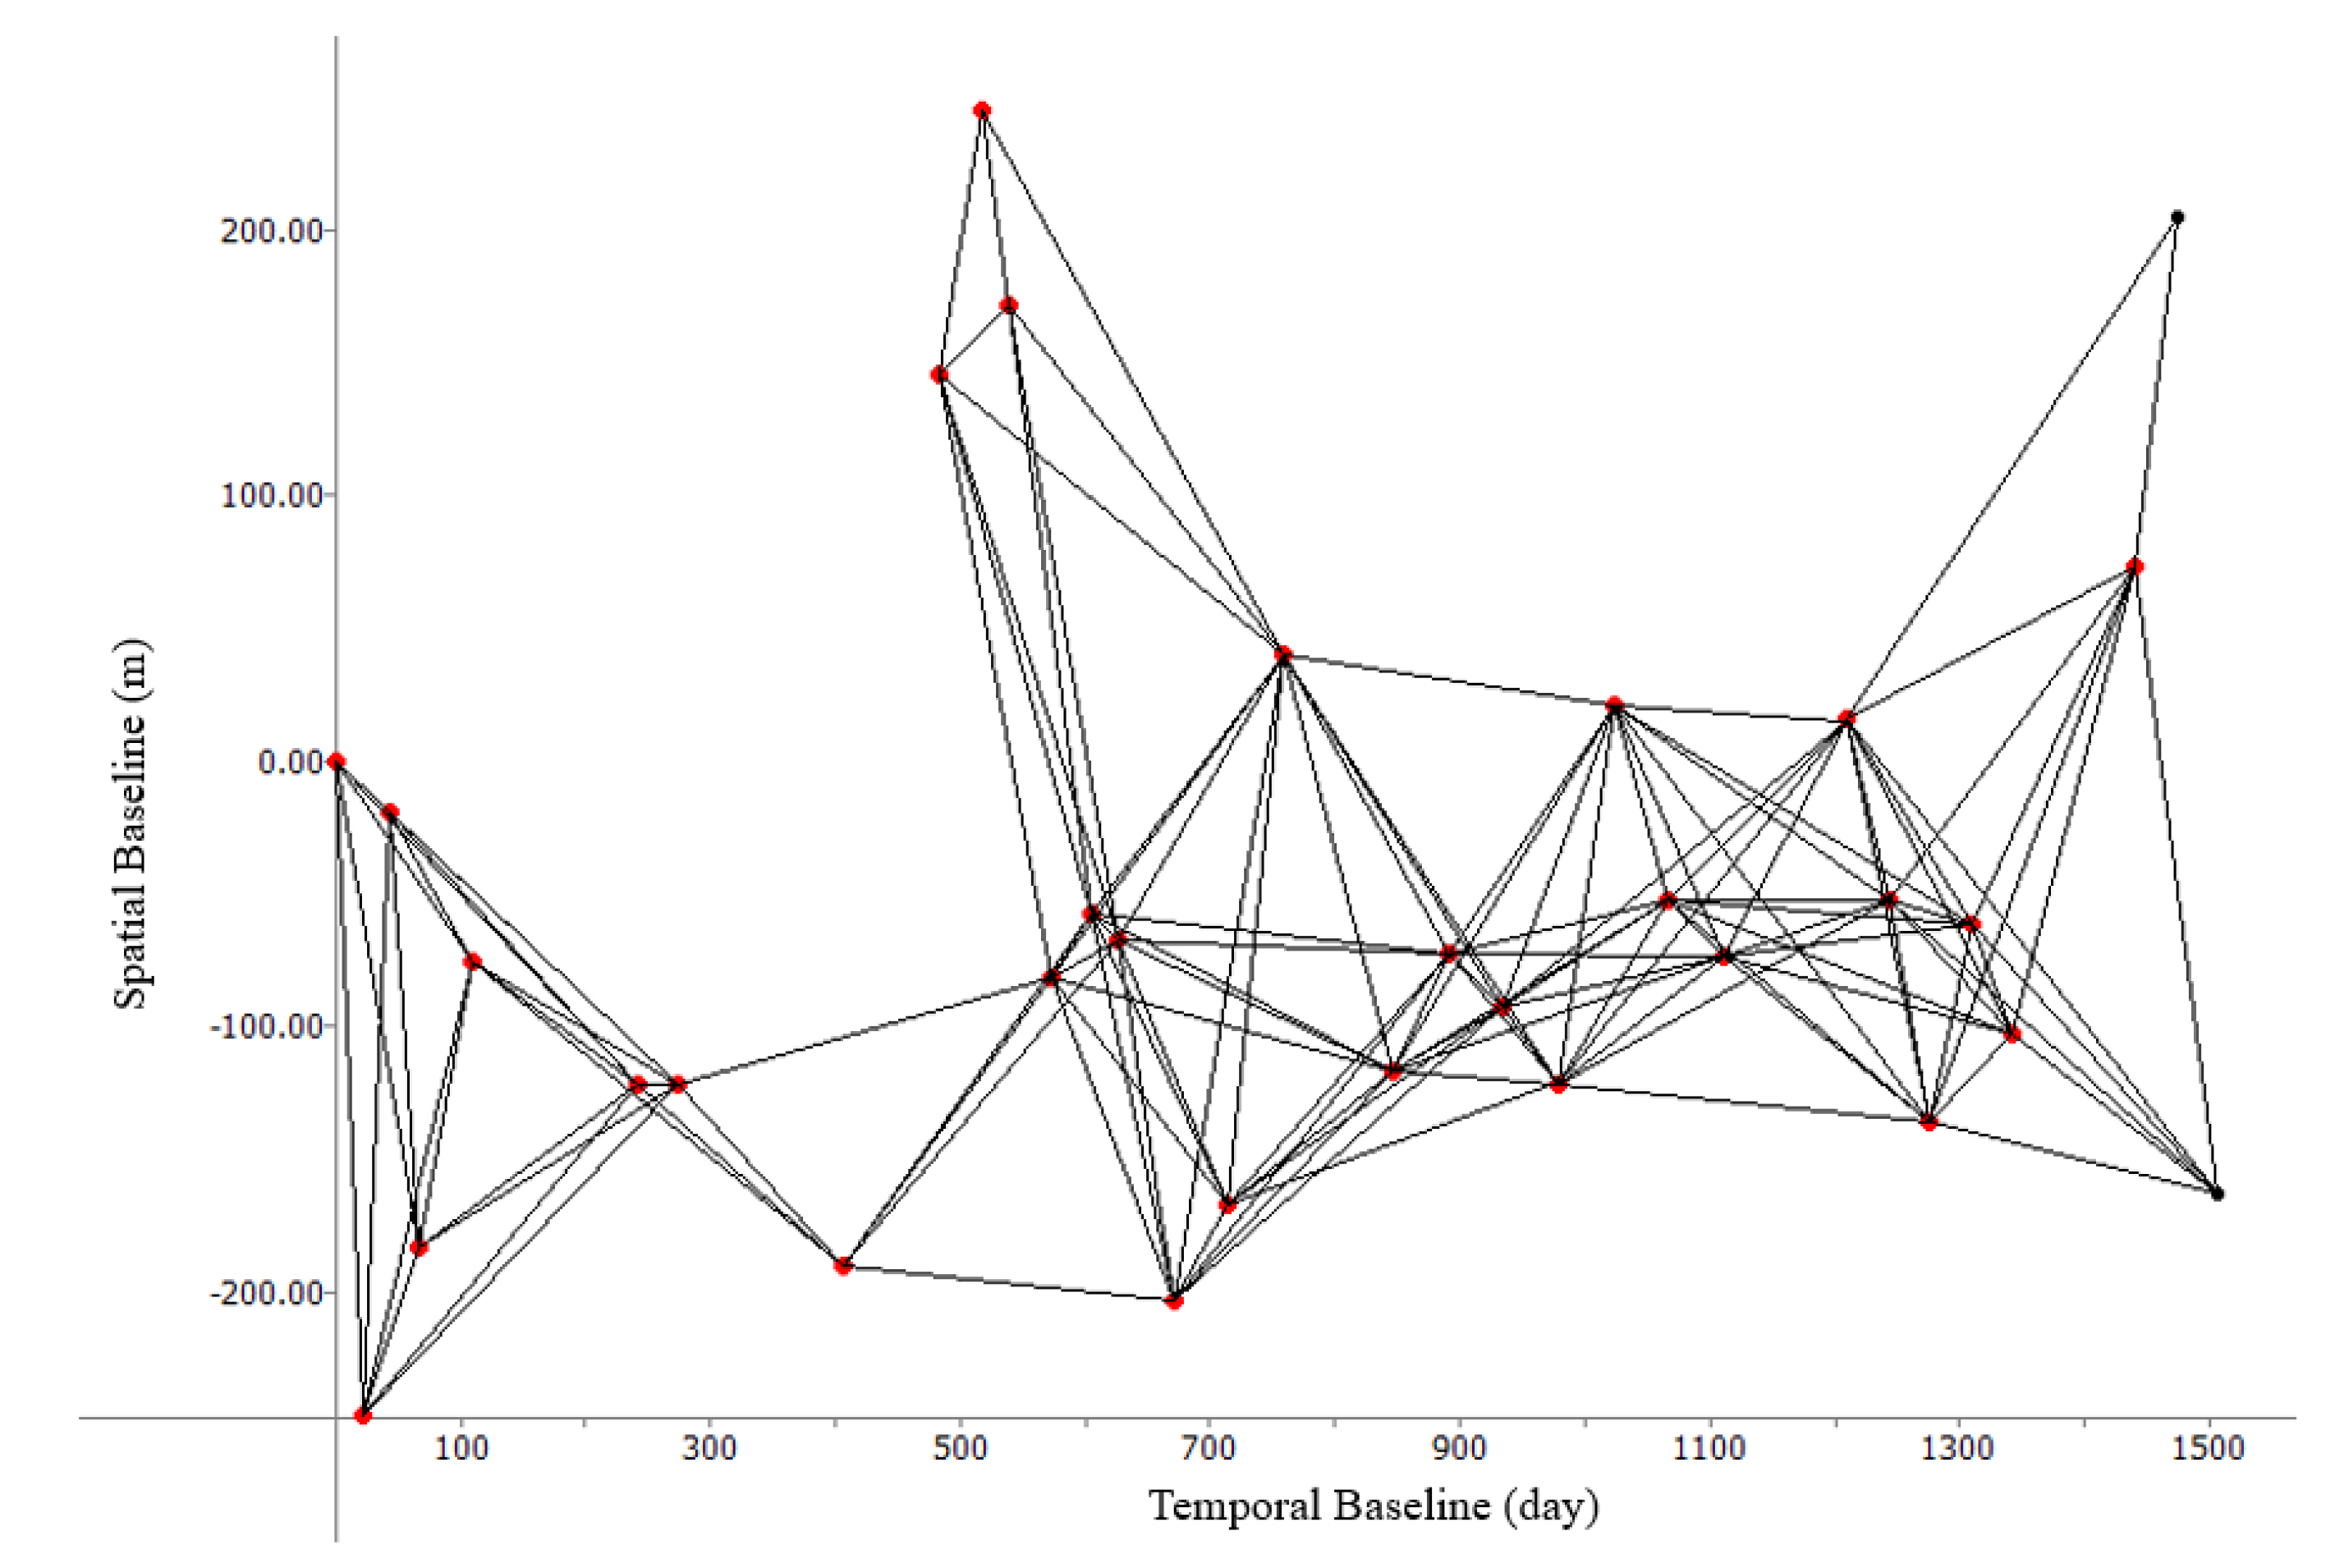
The experiments benefit from the availability of a sequence of TerraSAR images acquired of Beijing. In particular, the SAR data set was composed of 32 images collected from 22 January 2012 to 8 March 2016. The amplitude of a sample image of the research area is shown in
Figure 8, and the size of the original SAR images was about
(pixels). By analyzing the data set, the experiment constructed a SAR image network with a 250-day restriction as the temporal baseline and 300 m as the spatial baseline, as shown in
Figure 9. After co-registration and other data processing operations for each SAR image pair, 76 interferograms were finally obtained for further analysis.
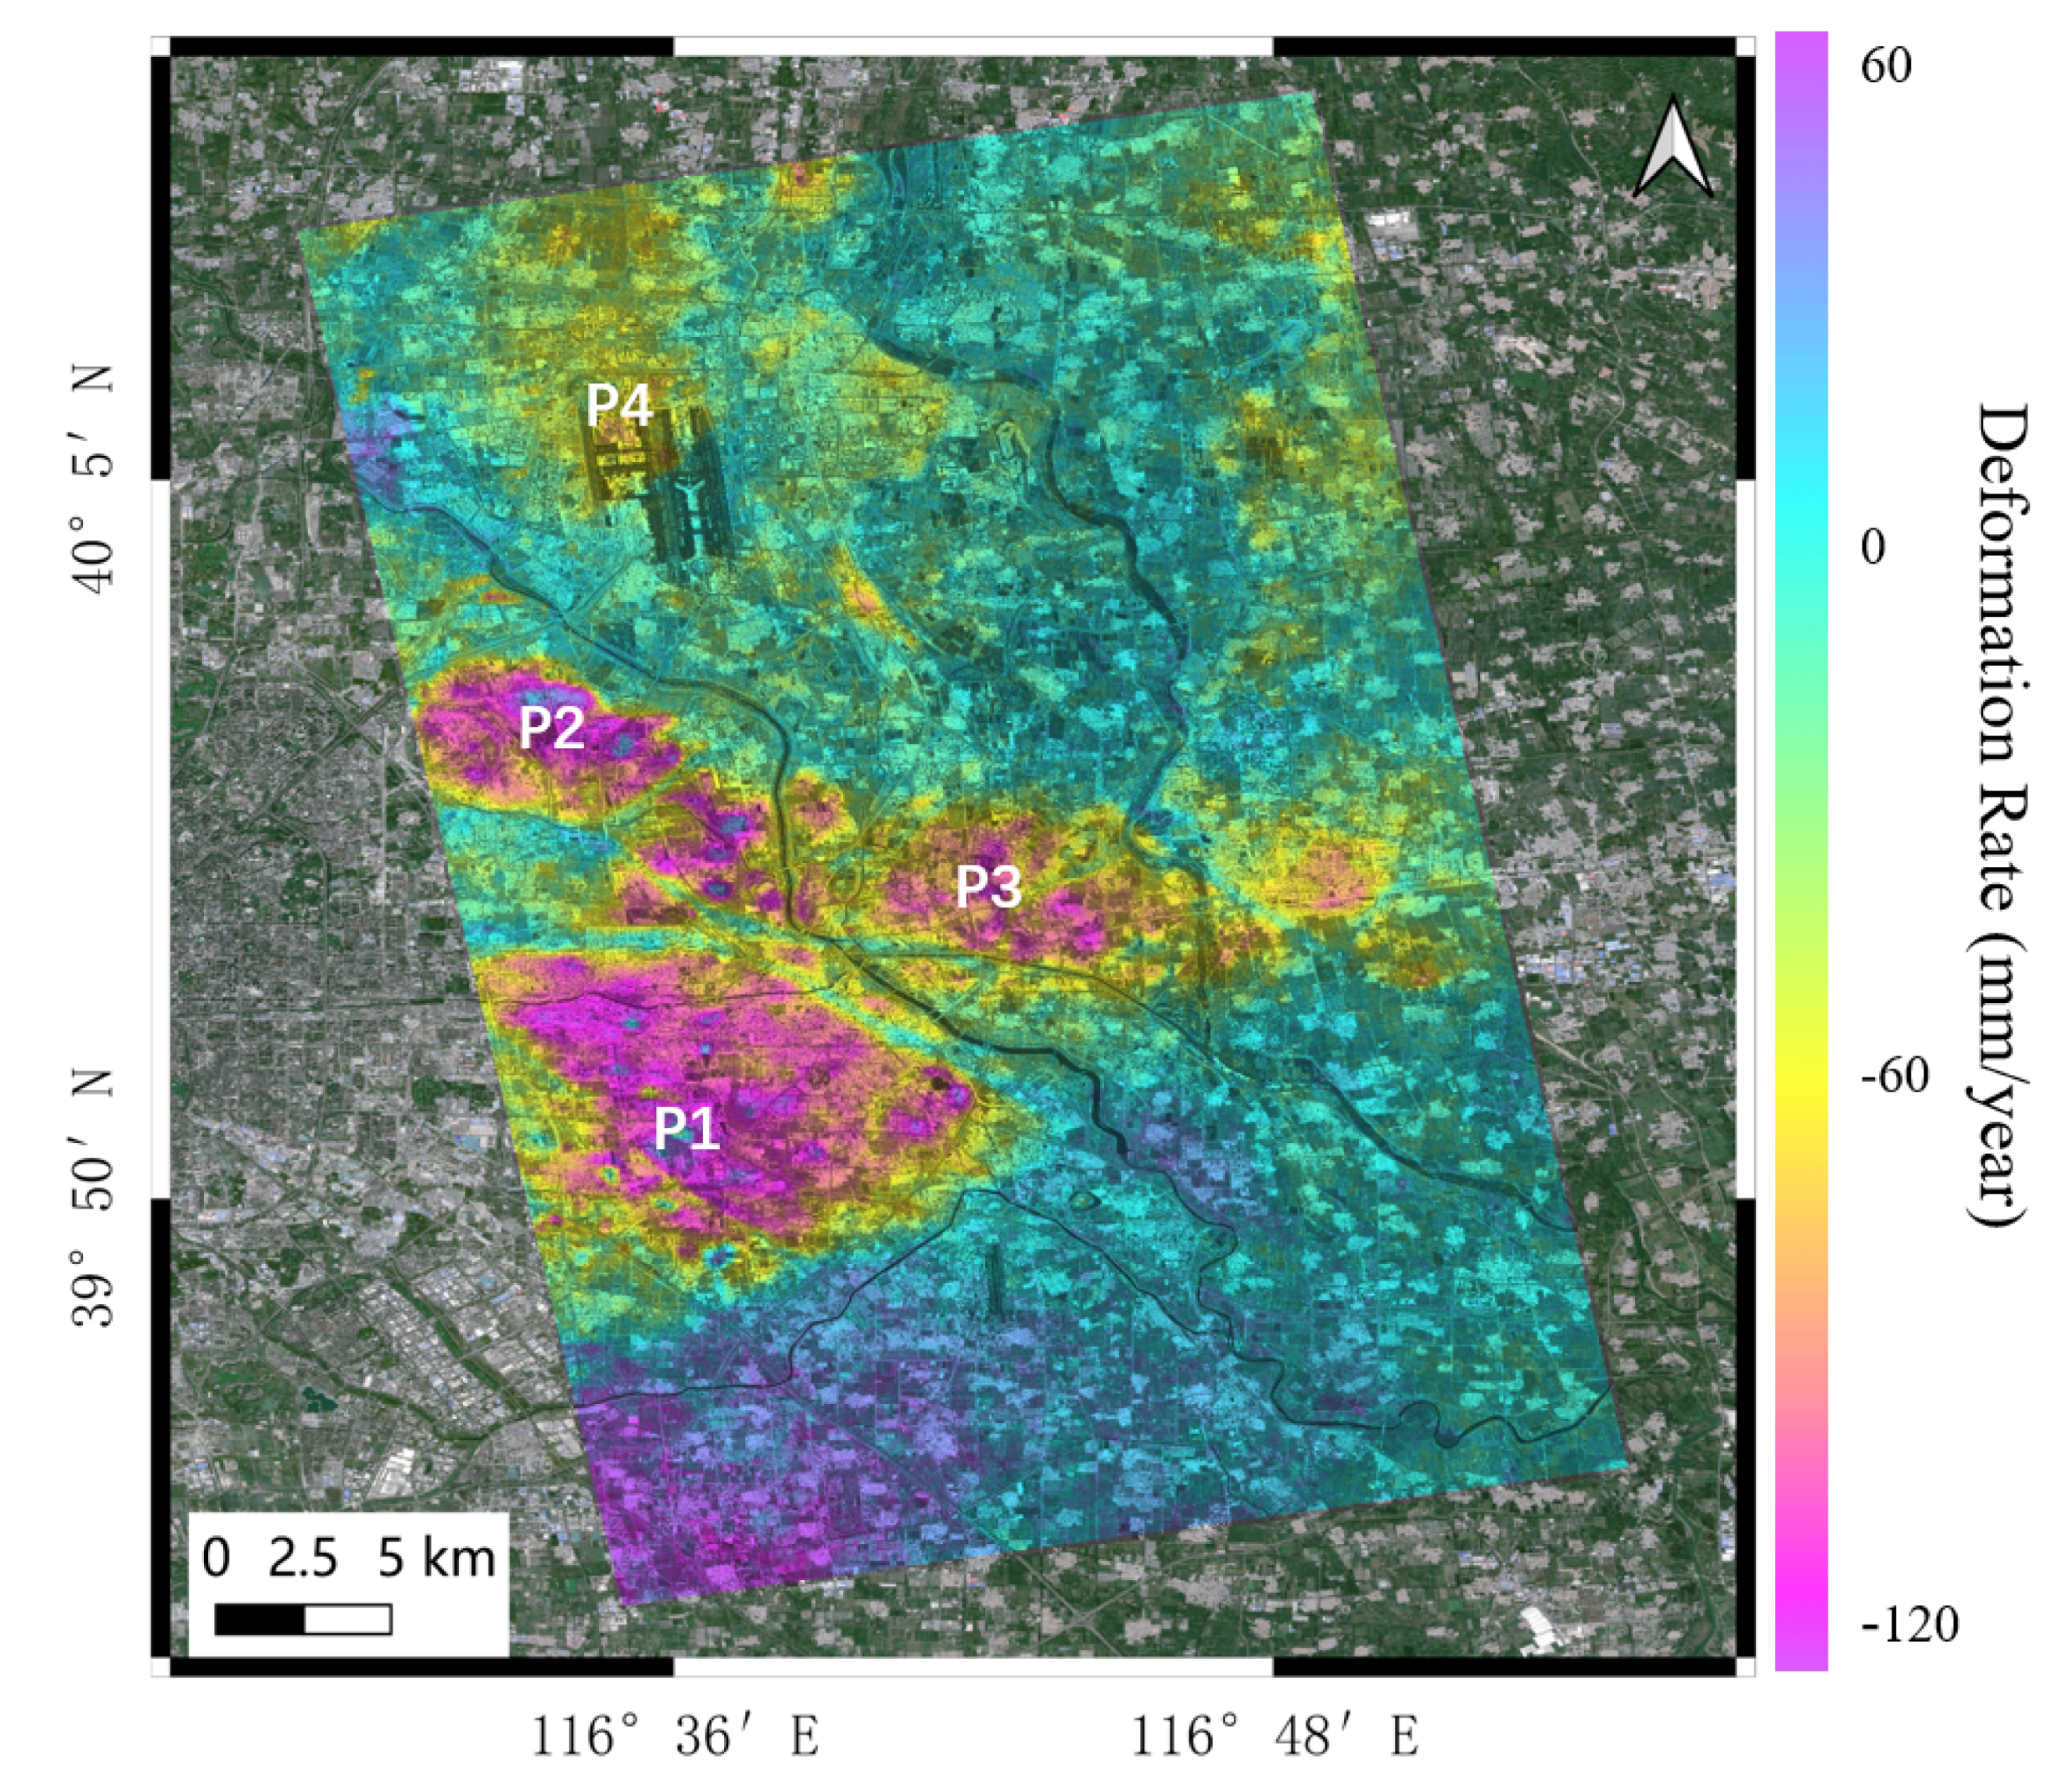
After the full P2SBAS process, the deformation rates for the investigated area are shown in
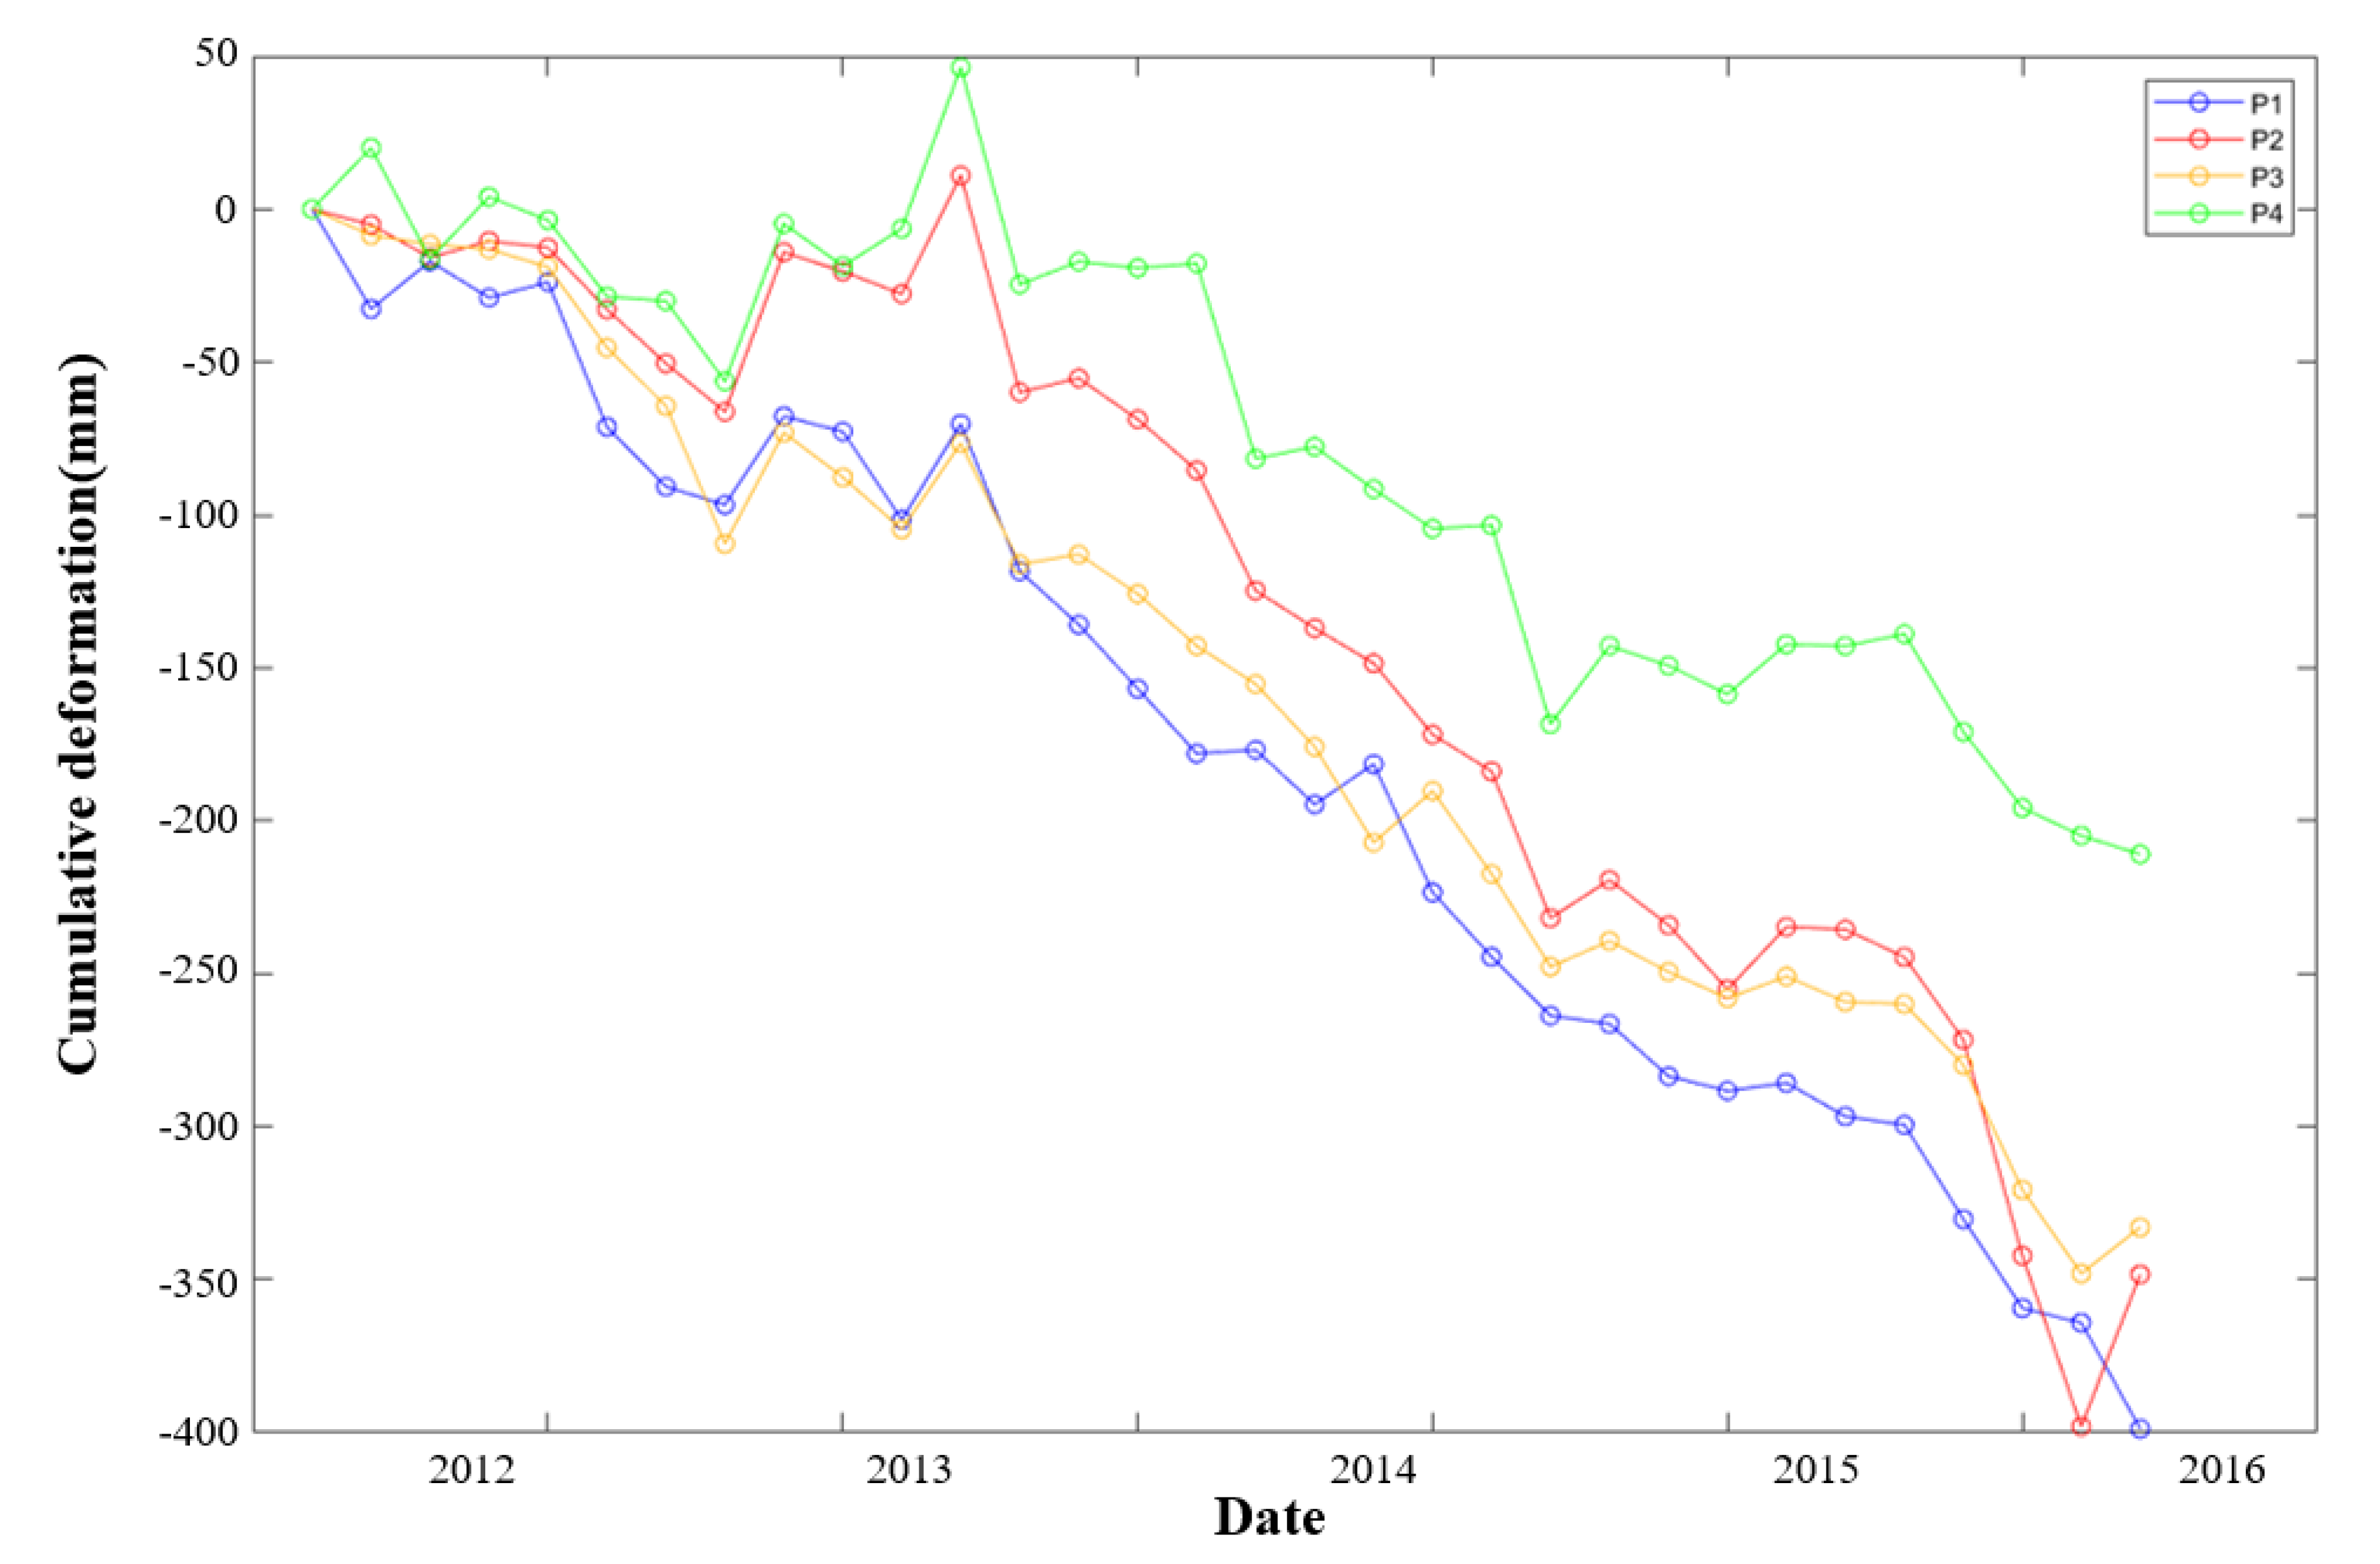
Figure 10. To further verify the reliability of the P2SBAS processing results, scattering points (P1–P4) were selected from several major subsidence areas in
Figure 10, and the cumulative deformation of these points over the period 2012–2016 are shown in
Figure 11. As can be seen in
Figure 10 and
Figure 11, P1–P3 were selected from the most severe subsidence areas, with a deformation rate of about 100 mm per year, while P4 presented more moderate subsidence, with only about half the deformation rate of the other points.
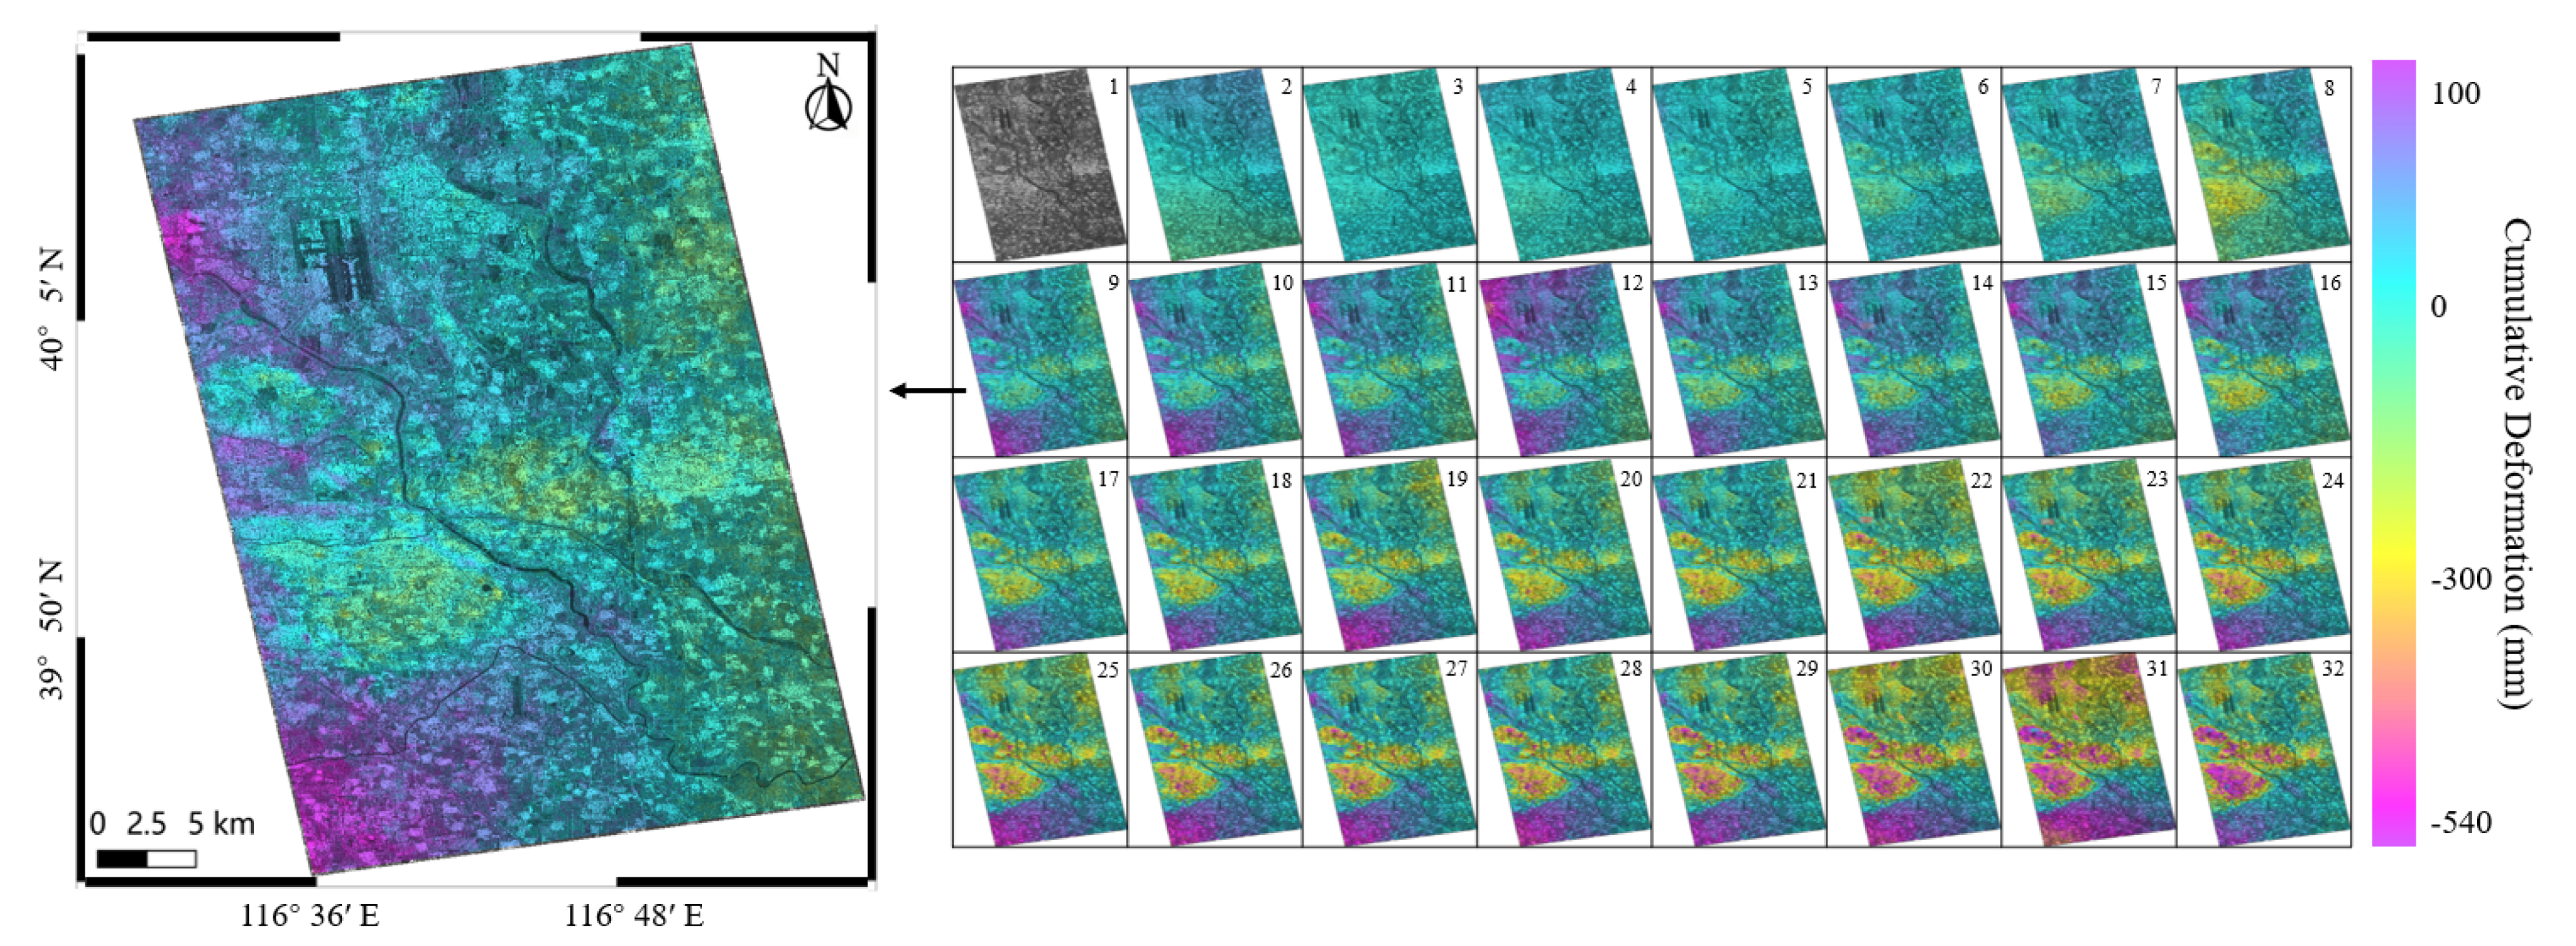
Additionally, the cumulative deformation for each SAR image is shown in
Figure 12, from which the surface deformation in the area at different times can be obtained. Through the time-series deformation results, it is possible to obtain the process and trend of ground deformation in the target area for a long period of time, thus accomplishing the task of long-term monitoring of ground deformation.
The deformation results illustrate that a wide range of ground subsidence occurred in the area. From the experimental results, it can be concluded that the most serious area of subsidence was located in the Tongzhou area of Beijing, with more than 100 square kilometers of the area suffering from different degrees of ground subsidence problems. This conclusion is consistent with the results of geological surveys, which confirmed that the main cause of ground subsidence in the area derived from over-exploitation of groundwater.
In order to further verify the accuracy and reliability of the P2SBAS platform, the experimental results were compared with leveling data from 2014 to 2016. The 17 leveling measurements were transformed into the InSAR LOS deformation rate, and a comparison between the InSAR and leveling data results is shown in
Figure 13. From the figure, it can be seen that the two measurements are in good agreement, with a maximum error of 6.03 mm, an average error of 0.314 mm, a standard deviation of 3.474, and an uncertainty of 5.756 mm, demonstrating that the results of the P2SBAS system for surface deformation monitoring tasks are credible.
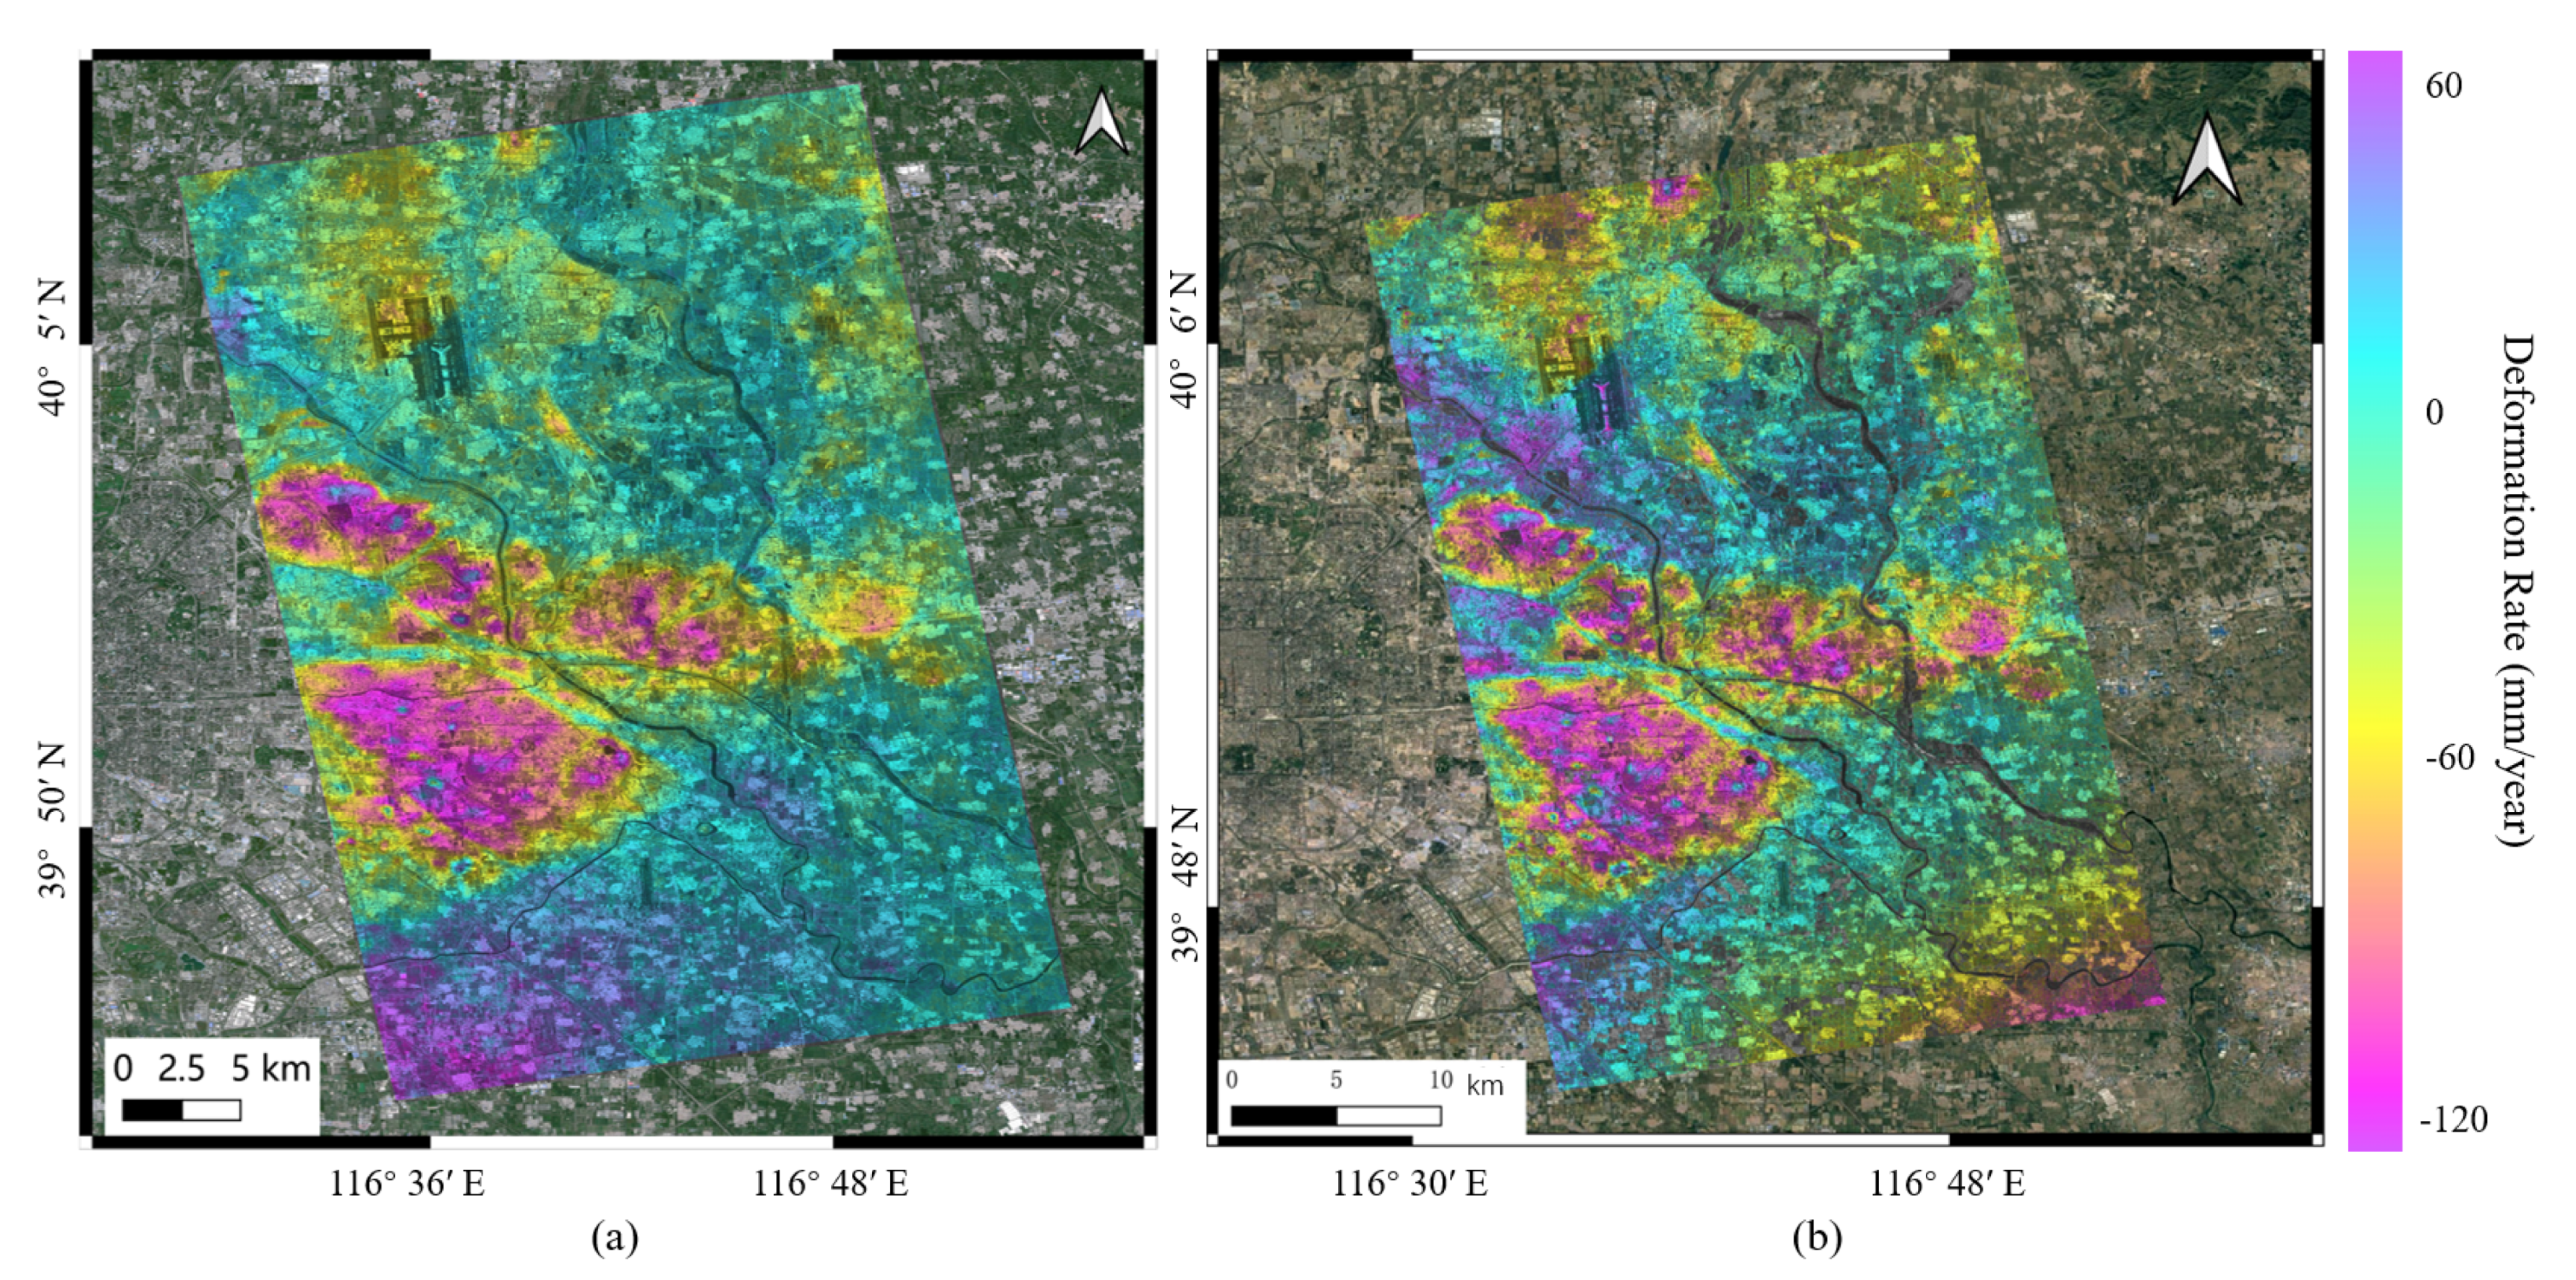
Additionally, the P2SBAS results were compared with the processing results of the open-source software GMTSAR. In the comparison experiment, the same data set was processed again using the SBAS method in GMTSAR, and a comparison of results was obtained, as shown in
Figure 14. As the figure shows, the overall deformation rates were generally similar, and a few major subsidence areas in the center and north could be matched. There were some minor differences in the southeast region of the investigated area, which may be due to atmospheric errors or different selections of interferograms. Finally, comparative experiments with the popular open-source software also demonstrated the reliability of the P2SBAS framework.
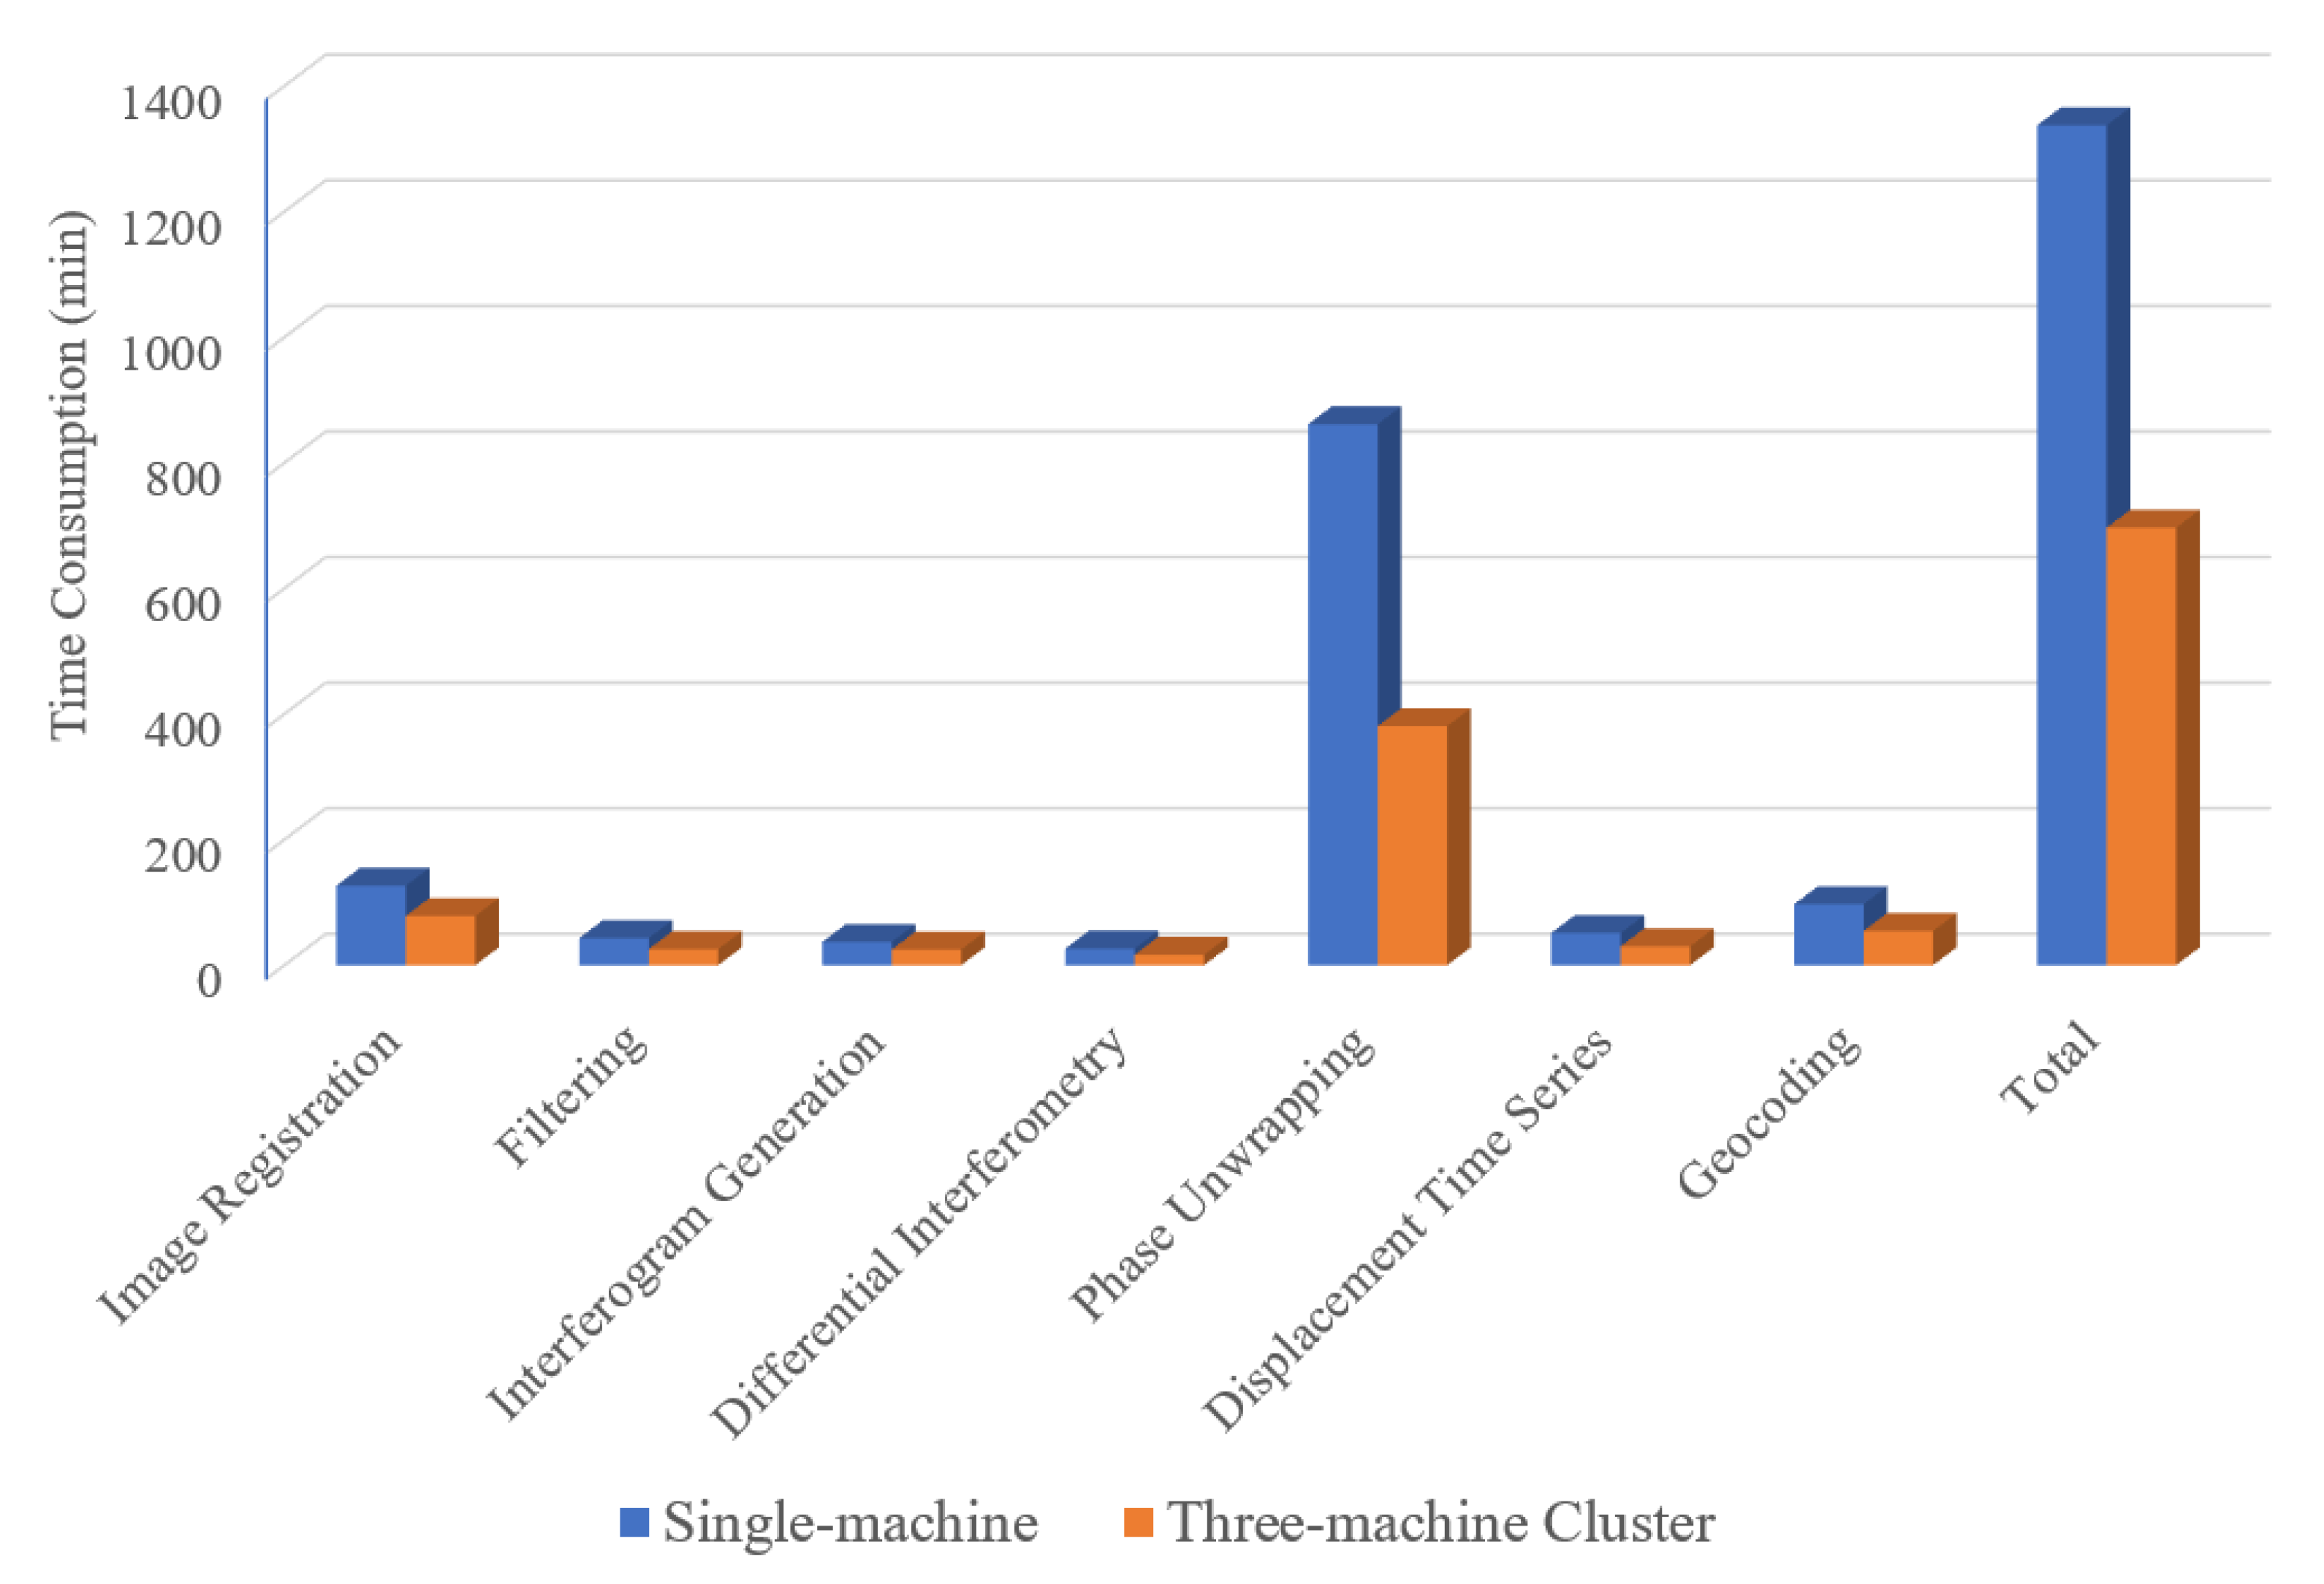
The time consumption for different algorithmic steps was measured for the whole process chain in both standalone and cluster environments. The algorithms in the standalone environment used multi-core multi-threaded parallel acceleration techniques (e.g., OpenMP), while in the clustered environment, the algorithms were executed at two levels of parallelism—multi-computer parallelism at the cluster level and multi-core multi-threaded parallelism within a single machine—demonstrating the ability of P2SBAS to be used in parallel with current rich multi-threaded acceleration techniques to achieve higher computational efficiency. As shown in
Table 3, computing tasks that took over 20 h on a single machine were efficiently scheduled and executed by a three-machine cluster, reducing the time consumption by nearly half. Furthermore, the two statistics of speed increase and efficiency are shown in the table, where speed increase represents the absolute value of the cluster’s acceleration effect. As shown in Equation (
10),
denotes the speed increase ratio of a cluster of
p nodes, and
denotes the time consumed by
i nodes to execute the algorithm in parallel:
In Equation (
11),
denotes the efficiency, which represents the proportion of effective working time for a multi-node cluster system. Both the speed increase and the efficiency indicate the performance of a distributed computing system, for which higher values mean that the system is better in terms of scheduling, computation, and so on.
The time consumption of algorithm modules is shown in
Table 3 and
Figure 15, the speed increase ratio of the phase unwrapping algorithm was as high as 2.26, while most of the other algorithms were in the range of 1.5–1.8. Due to the large percentage of time consumed by the phase unwrapping algorithm in the overall process, it pushed the overall speed increase ratio to near 2.
Overall, our P2SBAS processing chain was found to be efficient and reliable for SAR data processing tasks, but there is still potential for further improvement in the efficiency of the system as the number and quality of cluster nodes increase or the scheduling configuration is optimized. In the next subsection, the principles and methods for performance optimization of distributed algorithms are discussed in detail on a theoretical level.
5.2. Time Consumption Analysis
The proposed distributed algorithms all use the idea of splitting the input data; thus, some commonalities were observed in the time consumption analysis. Before further analysis, some details of the image registration and phase unwrapping algorithms are taken as examples.
Table 4 provides some information on the time consumption of the different steps of the algorithms. In the image registration algorithm, as both the coarse and the precise registration steps are taken to be executed serially, the difference between this part in the two execution methods can be temporarily ignored. In addition, the algorithm in the three-machine cluster approach adds steps such as splitting, uploading, downloading, and merging, which adversely affects the speed increase ratio and efficiency of parallelism. Another point worth noting is that a side-by-side comparison of the two algorithms revealed that when the algorithmic complexity is higher, a smaller percentage of time is spent on other steps, which thus improves parallel efficiency. Particularly, the time consumption of the phase unwrapping algorithm was affected by the characteristics of the data, such as region complexity, the coherence and distribution of residual points, and so on. In regions characterized by high complexity or weak coherence, computation of the phase unwrapping cost stream becomes very complex, reducing the overall execution efficiency of the algorithm.
In summary, the algorithm execution time can be modeled, as shown Equation (
12), where the total time consumption
is composed of several factors. Specifically,
denotes the elapsed time for data manipulation, including operations such as splitting and merging;
represents the time consumption associated with data transfer, mainly the process of distributing data among nodes;
is the execution elapsed time of the algorithm, which also includes the resource allocation and node scheduling process in the parallel situation; and, finally,
represents the elapsed time for other pre- or post-serial steps, such as coarse and precise registration in image registration algorithms, which are not useful for parallel acceleration but are objectively present in some algorithm modules.
Next, the impact of each component was analyzed specifically. It can be assumed that the number of nodes is
N, the image size is
S, the transmission bandwidth is
M, and
is the coefficient. For
, some overlap area on neighboring blocks is left when splitting and merging, which can be ignored compared to the overall size of the image. Therefore, this part of the time consumption can be considered to be proportional to the size of the image:
The transmission time is obviously affected by the image size
N and the node bandwidth
M. Additionally, in homogeneous clusters, each node performs a similar number of tasks, which means that the more nodes there are, the greater the proportion of data that the master node needs to distribute. Thus,
can be expressed as follows:
Note that the currently widely used bandwidths of 10 Gbps or higher can effectively reduce time consumption due to inter-node transmission.
and are related to the complexity of the algorithms. Typically, for well-designed distributed algorithms is the most time-consuming part and is the main target of our optimization through parallelism. When the algorithm complexity is high—especially when exceeding the order of magnitude—splitting input data can greatly reduce the algorithm execution time consumption in cases for which reliable algorithmic accuracy can be guaranteed.
It can be assumed, as the most common ideal case, that the complexity of the algorithm is
and the time consumption of other serial parts is fixed. If the execution time of the single-machine algorithm is
, the following formula can be derived:
where
C is a constant.
Thus, the total time consumption in this ideal situation is as follows:
It can be seen that the total time consumed reaches a bottleneck as
N increases, which means that adding nodes does not optimize efficiency in an unlimited manner. When
N is large enough, the above formula can be written as:
which can be viewed as a theoretical limit to time optimization. However, in real situations, when
N is too large, the overlap area between adjacent blocks and the scheduling time will make it unacceptable for users.
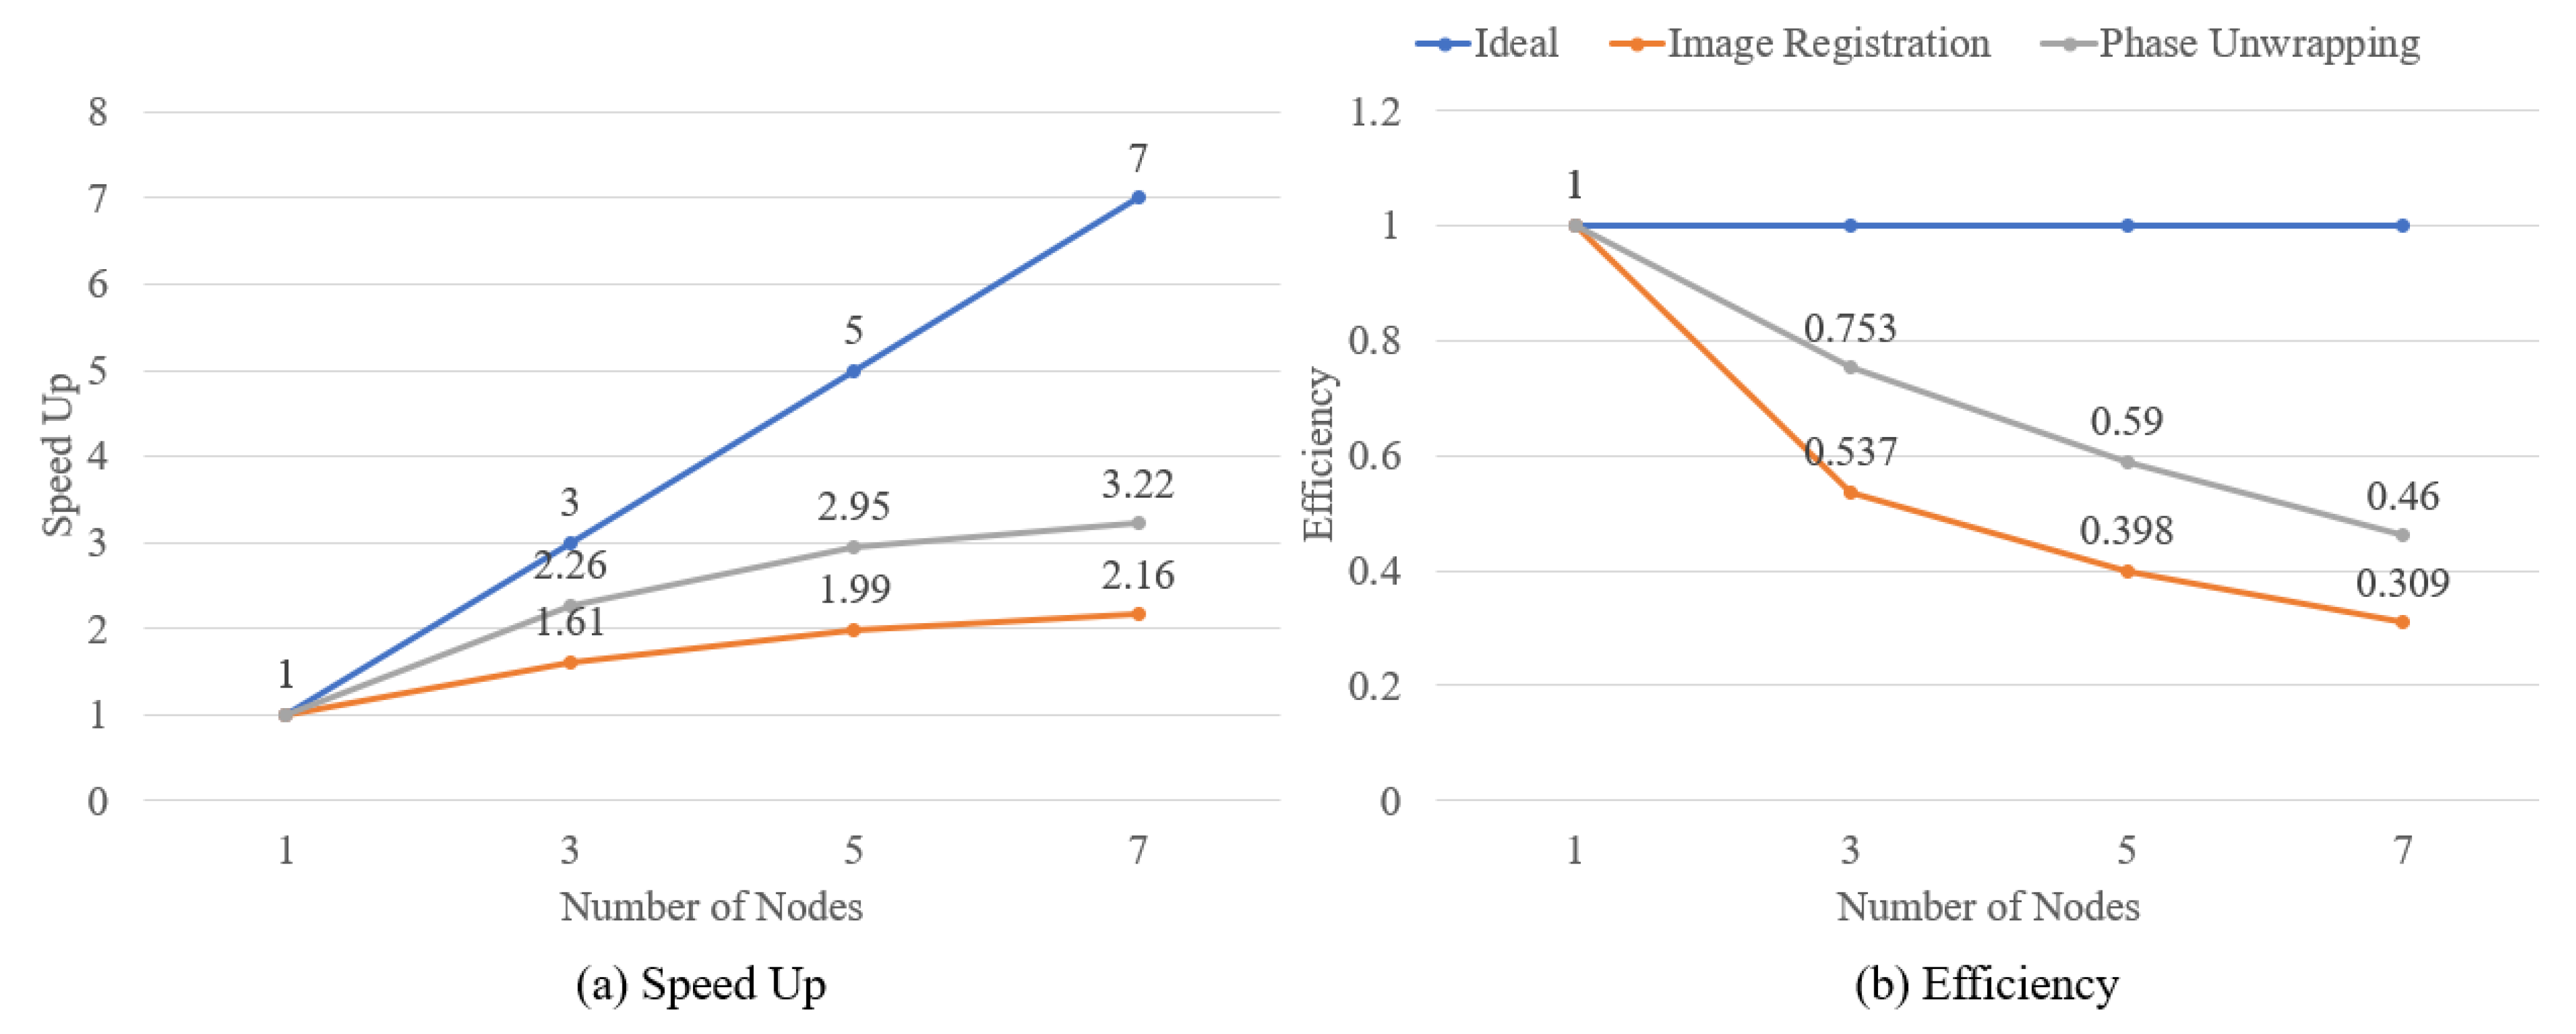
Some experiments were performed on a seven-nodes cluster to verify the above theoretical conclusions. It can be seen from
Figure 16 that when the number of nodes increased, the acceleration effect did not increase by the same proportion. In addition, the higher computational complexity of the phase unwrapping algorithm brings with it the potential for better parallel optimization, such that the efficiency degrades relatively slowly as the number of nodes increases. This experiment somewhat illustrates that parallel acceleration does not improve infinitely with an increase in the number of nodes. In practice, the processing chain automatically selects the number of nodes for computation according to the complexity of the chosen algorithm and the size of the input image data, which ensures better efficiency and computational power utilization.
5.3. Performance Optimization
This subsection focuses on improving the efficiency of distributed algorithms by optimizing cluster and task configurations. The core problem considered in this section is how to maintain load balancing of cluster computing in order to maximize the hardware utilization of the nodes.
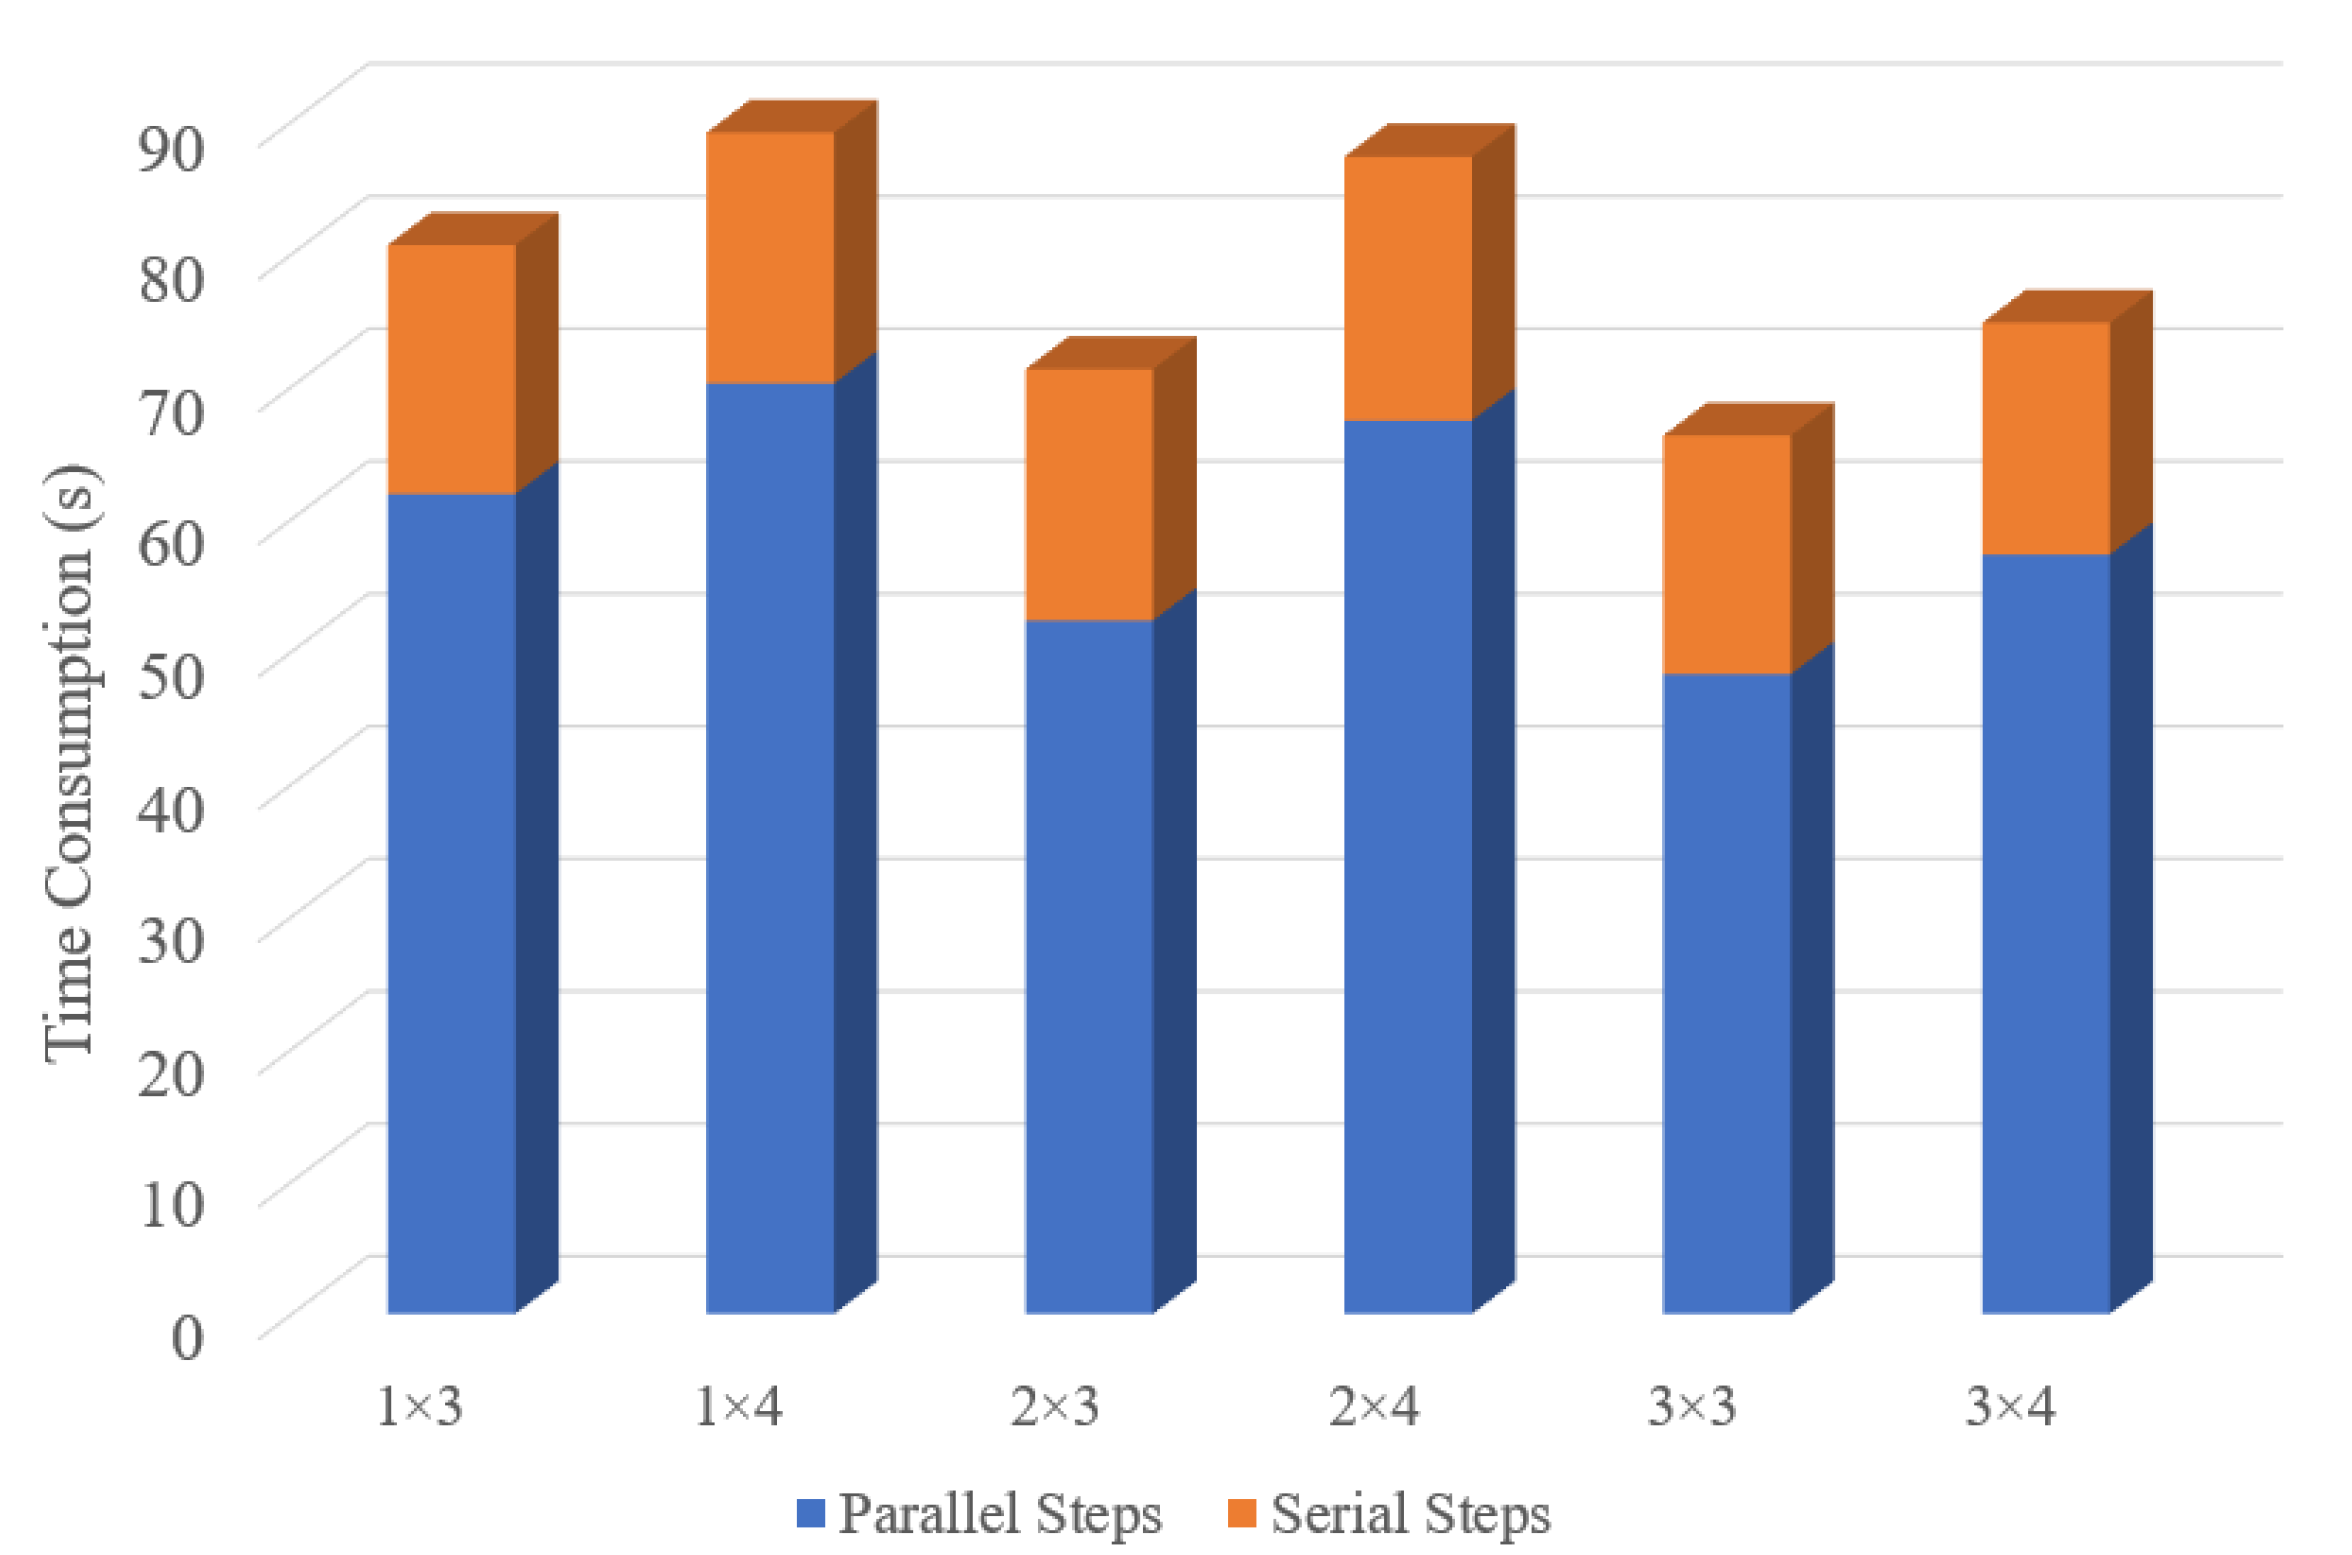
Comparative experiments were conducted on clusters consisting of three machines with the same hardware in order to study the effects of different splitting methods. For more detail, the image registration algorithm was selected as the experimental subject to record the parallel portion and overall time consumption under different splitting methods. The results are shown in
Table 5 and
Figure 17.
Ideally, in a homogeneous cluster, each node has approximately the same computing power, and so the number of blocks should be an integer multiple of the number of cluster nodes. Therefore, the and methods consumed more time than other methods. However, in real-world scenarios, the computing power of nodes may not be fully stabilized. If the granularity of the block division is too large, it is likely to lead to an imbalance in node operations. Some of the nodes that finish the task first may remain idle and waiting, while the overall elapsed time will be dragged down by a few blocking and slow nodes. Thus, the , , and methods were decreasingly time consuming. Therefore, appropriately reducing the division granularity is conducive to load balancing of the cluster. However, taking into account the existence of a certain overlap region between neighboring blocks and the time consumption associated with resource scheduling, a large number of small blocks are instead detrimental to cluster efficiency, as indicated by the increased time consumption under the method.
It can be summarized that in a homogeneous cluster, proper splitting of the input image can effectively improve efficiency. The number of blocks should ideally be an integer multiple of the number of cluster nodes, and the granularity of the blocks should be moderate. In addition, as some special algorithms impose requirements on the shape of the input data, it should be ensured that the shape of the blocks is as close to square as the situation allows.
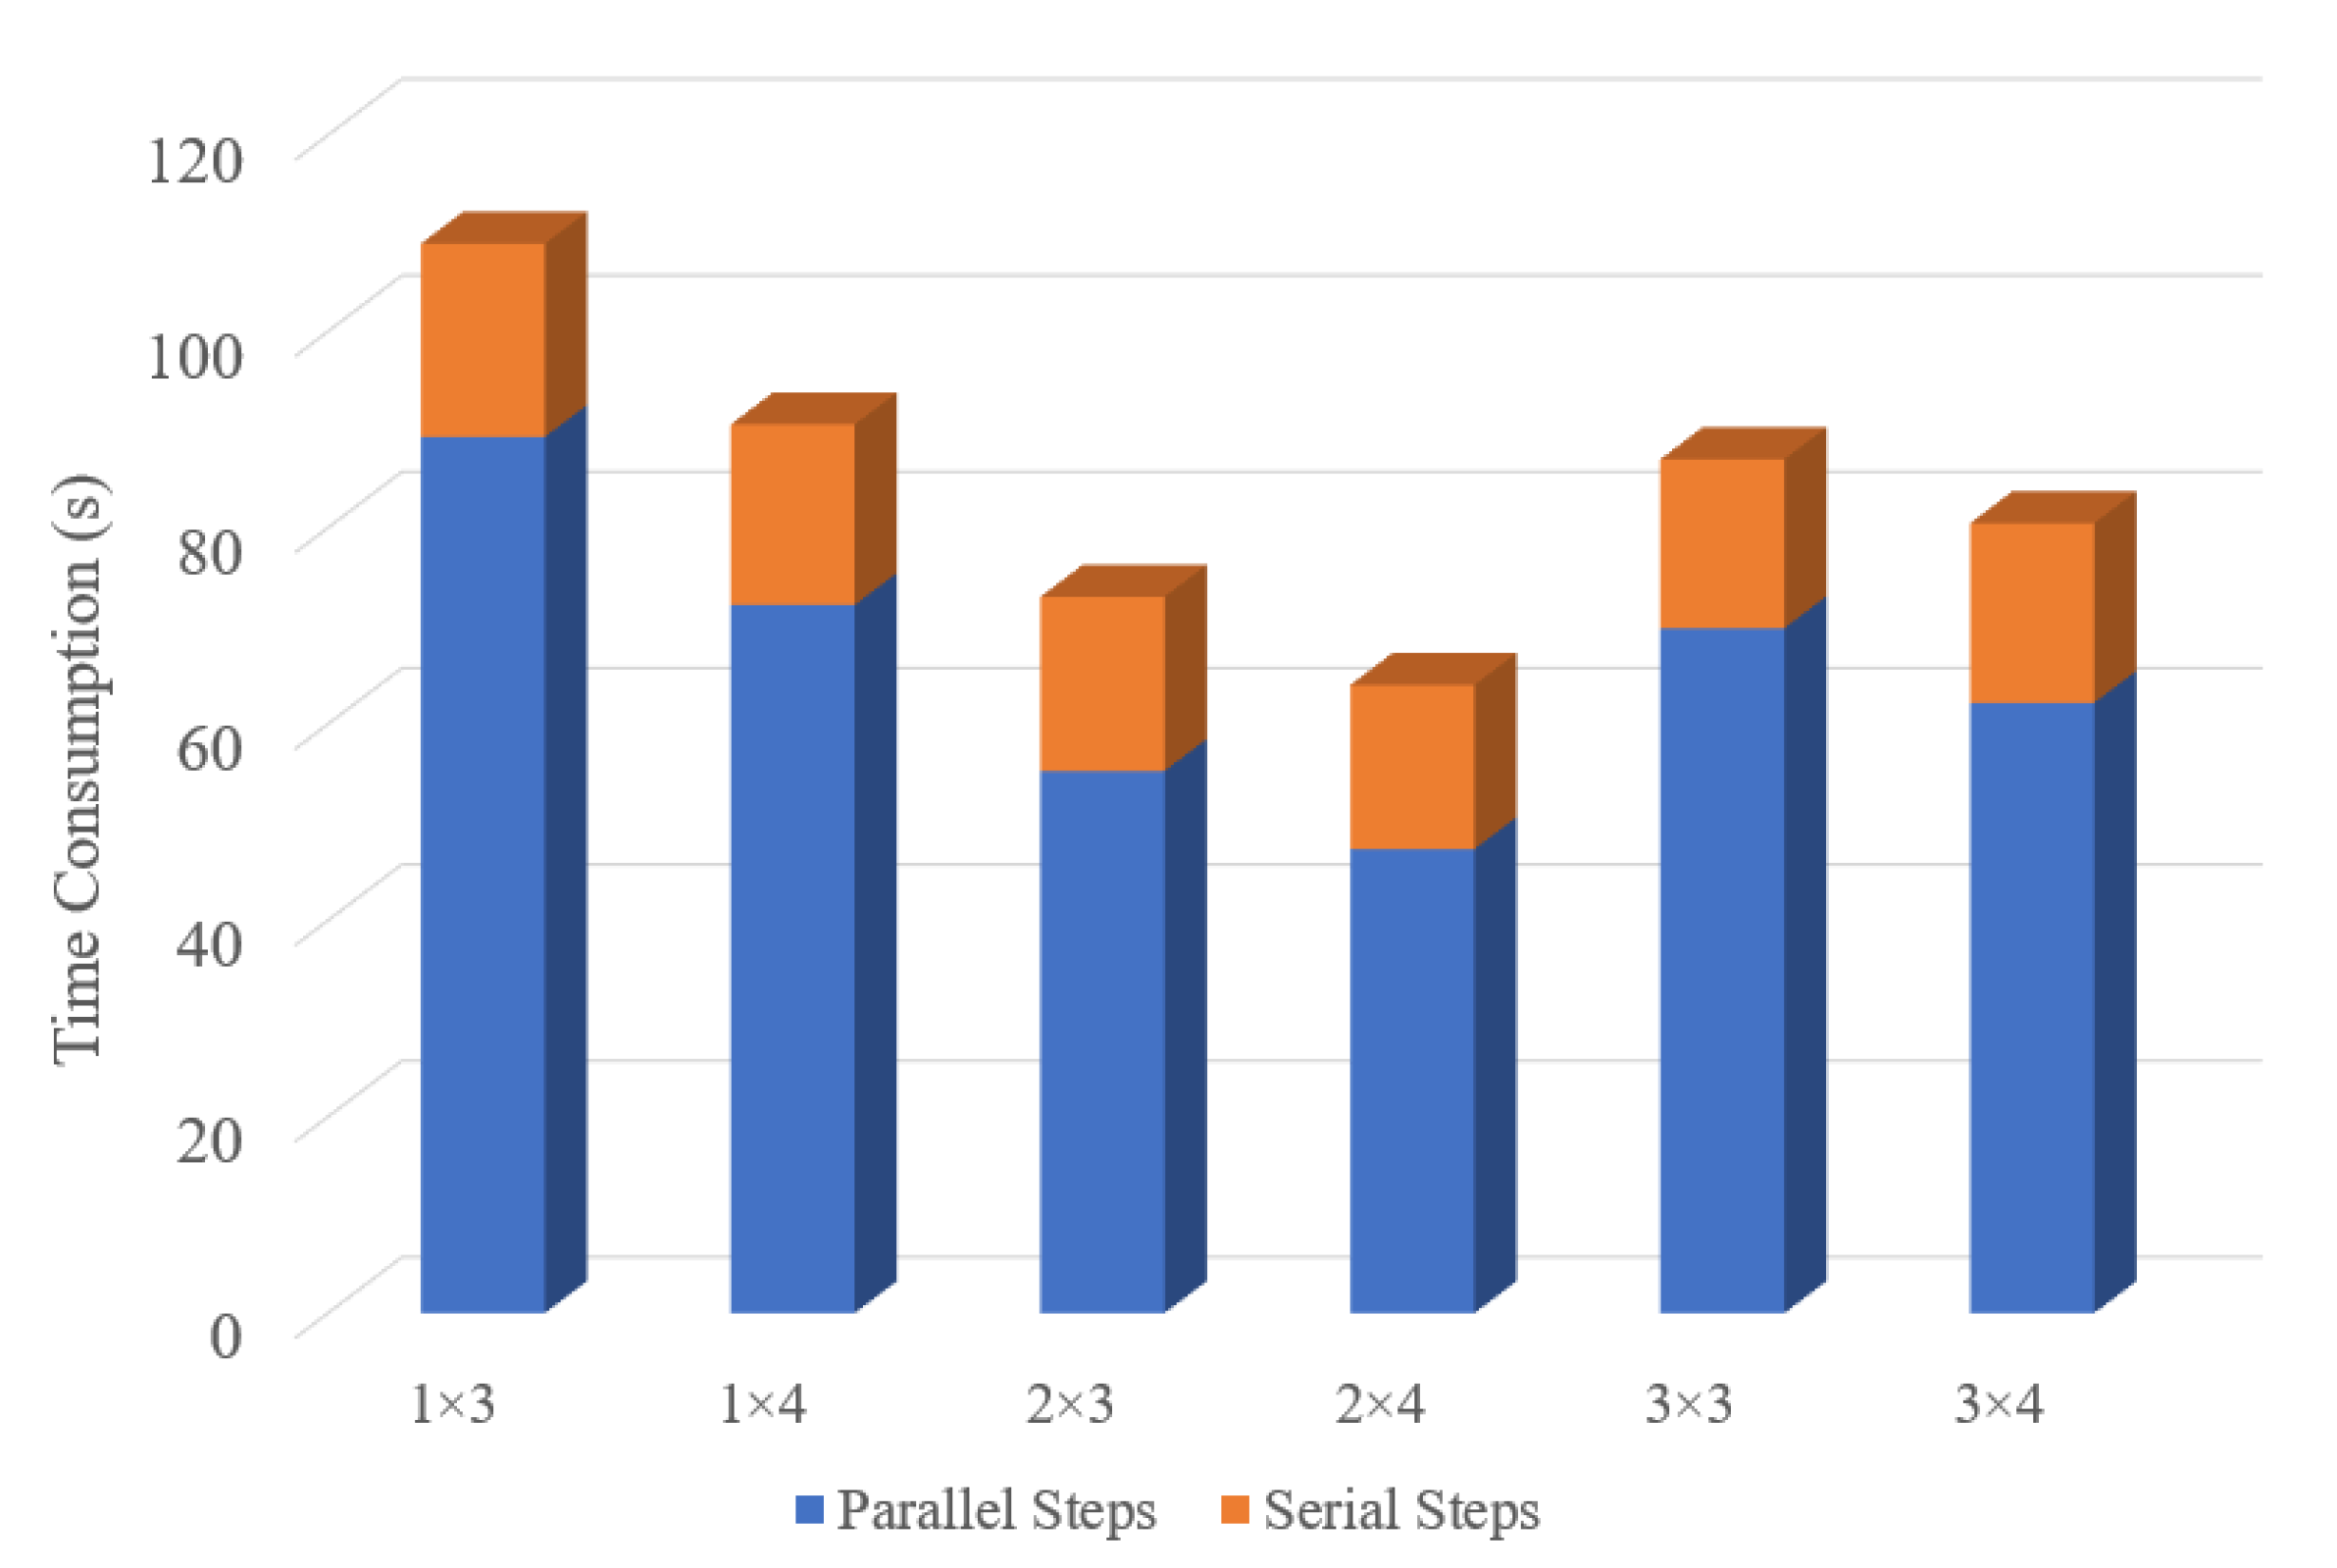
In real applications, more complex situations may be encountered, such as heterogeneous clusters. This scenario was also researched by limiting the node performance by technical means, obtaining a heterogeneous cluster consisting of 3 nodes with an computational power ratio of 1:2:5, and repeating the above experiments. The results are shown in
Table 6 and
Figure 18.
In computing clusters with heterogeneous hardware, load balancing will become challenging due to the imbalance of node power. In the worst case, the cluster is held up by the weakest-performing node, with all nodes waiting for it to compete its task. As shown in the above figure, for the case with a small number of blocks, the weaker nodes were assigned a volume of tasks that did not match their capacity, resulting in inefficient parallelism. Our solution is to estimate the ratio of the relative computing power of the nodes, take the weakest node as a benchmark, sum the computing power of all nodes, and then adjust the number of blocks to an integer multiple of that value. As an example, the node computing power ratio in the experiment was 1:2:5, so the total computing power was considered to be eight. As such, better load balancing was achieved when the number of blocks was an integer multiple of eight. The results of the experiment also validated our conclusion.
Aside from just configuration optimization, another mechanism employed to ensure the efficiency and robustness of the cluster is the monitoring and recovery mechanism of the Hadoop framework. Our processing chain is based on the Hadoop implementation, where Hadoop sends a heartbeat message to verify the node status while the task is running. If the running node times out or does not send a response several times, it will be considered to be a failure, in which case the node task process is killed and the task is re-assigned. This mechanism prevents a few blocking nodes from bringing down the entire task.
In addition, upgrading the hardware is one of the most direct ways to reduce the computation time. Taking the experimental platform in this paper as an example, with an increasing scale of data processing, the slow IO speed of the HDD, the lower clock frequency of DDR3 DRAM, and the limited performance of the old CPU may become bottlenecks that limit the efficiency of data processing. In particular, the IO performance of an HDD is only about 100 MB/s, which can become a serious performance bottleneck for SAR data processing tasks, which are often in the terabyte range. On the other hand, a current state-of-the-art PCIE-5.0 SSD has an IO speed of nearly 8 GB/s, which can dramatically reduce the time spent on reading and writing. Therefore, it makes sense to choose appropriate node hardware and the number of nodes based on the size of data that users need to process. In this regard, the P2SBAS framework inherits the flexible deployment of Hadoop, which is very flexible and scalable in terms of clustering. In particular, P2SBAS clusters can be built from any number of compute nodes on any hardware as well as supporting the dynamic addition and removal of nodes.


