
Multi-Sensor Precipitation Estimation from Space: Data Sources, Methods and Validation


Abstract
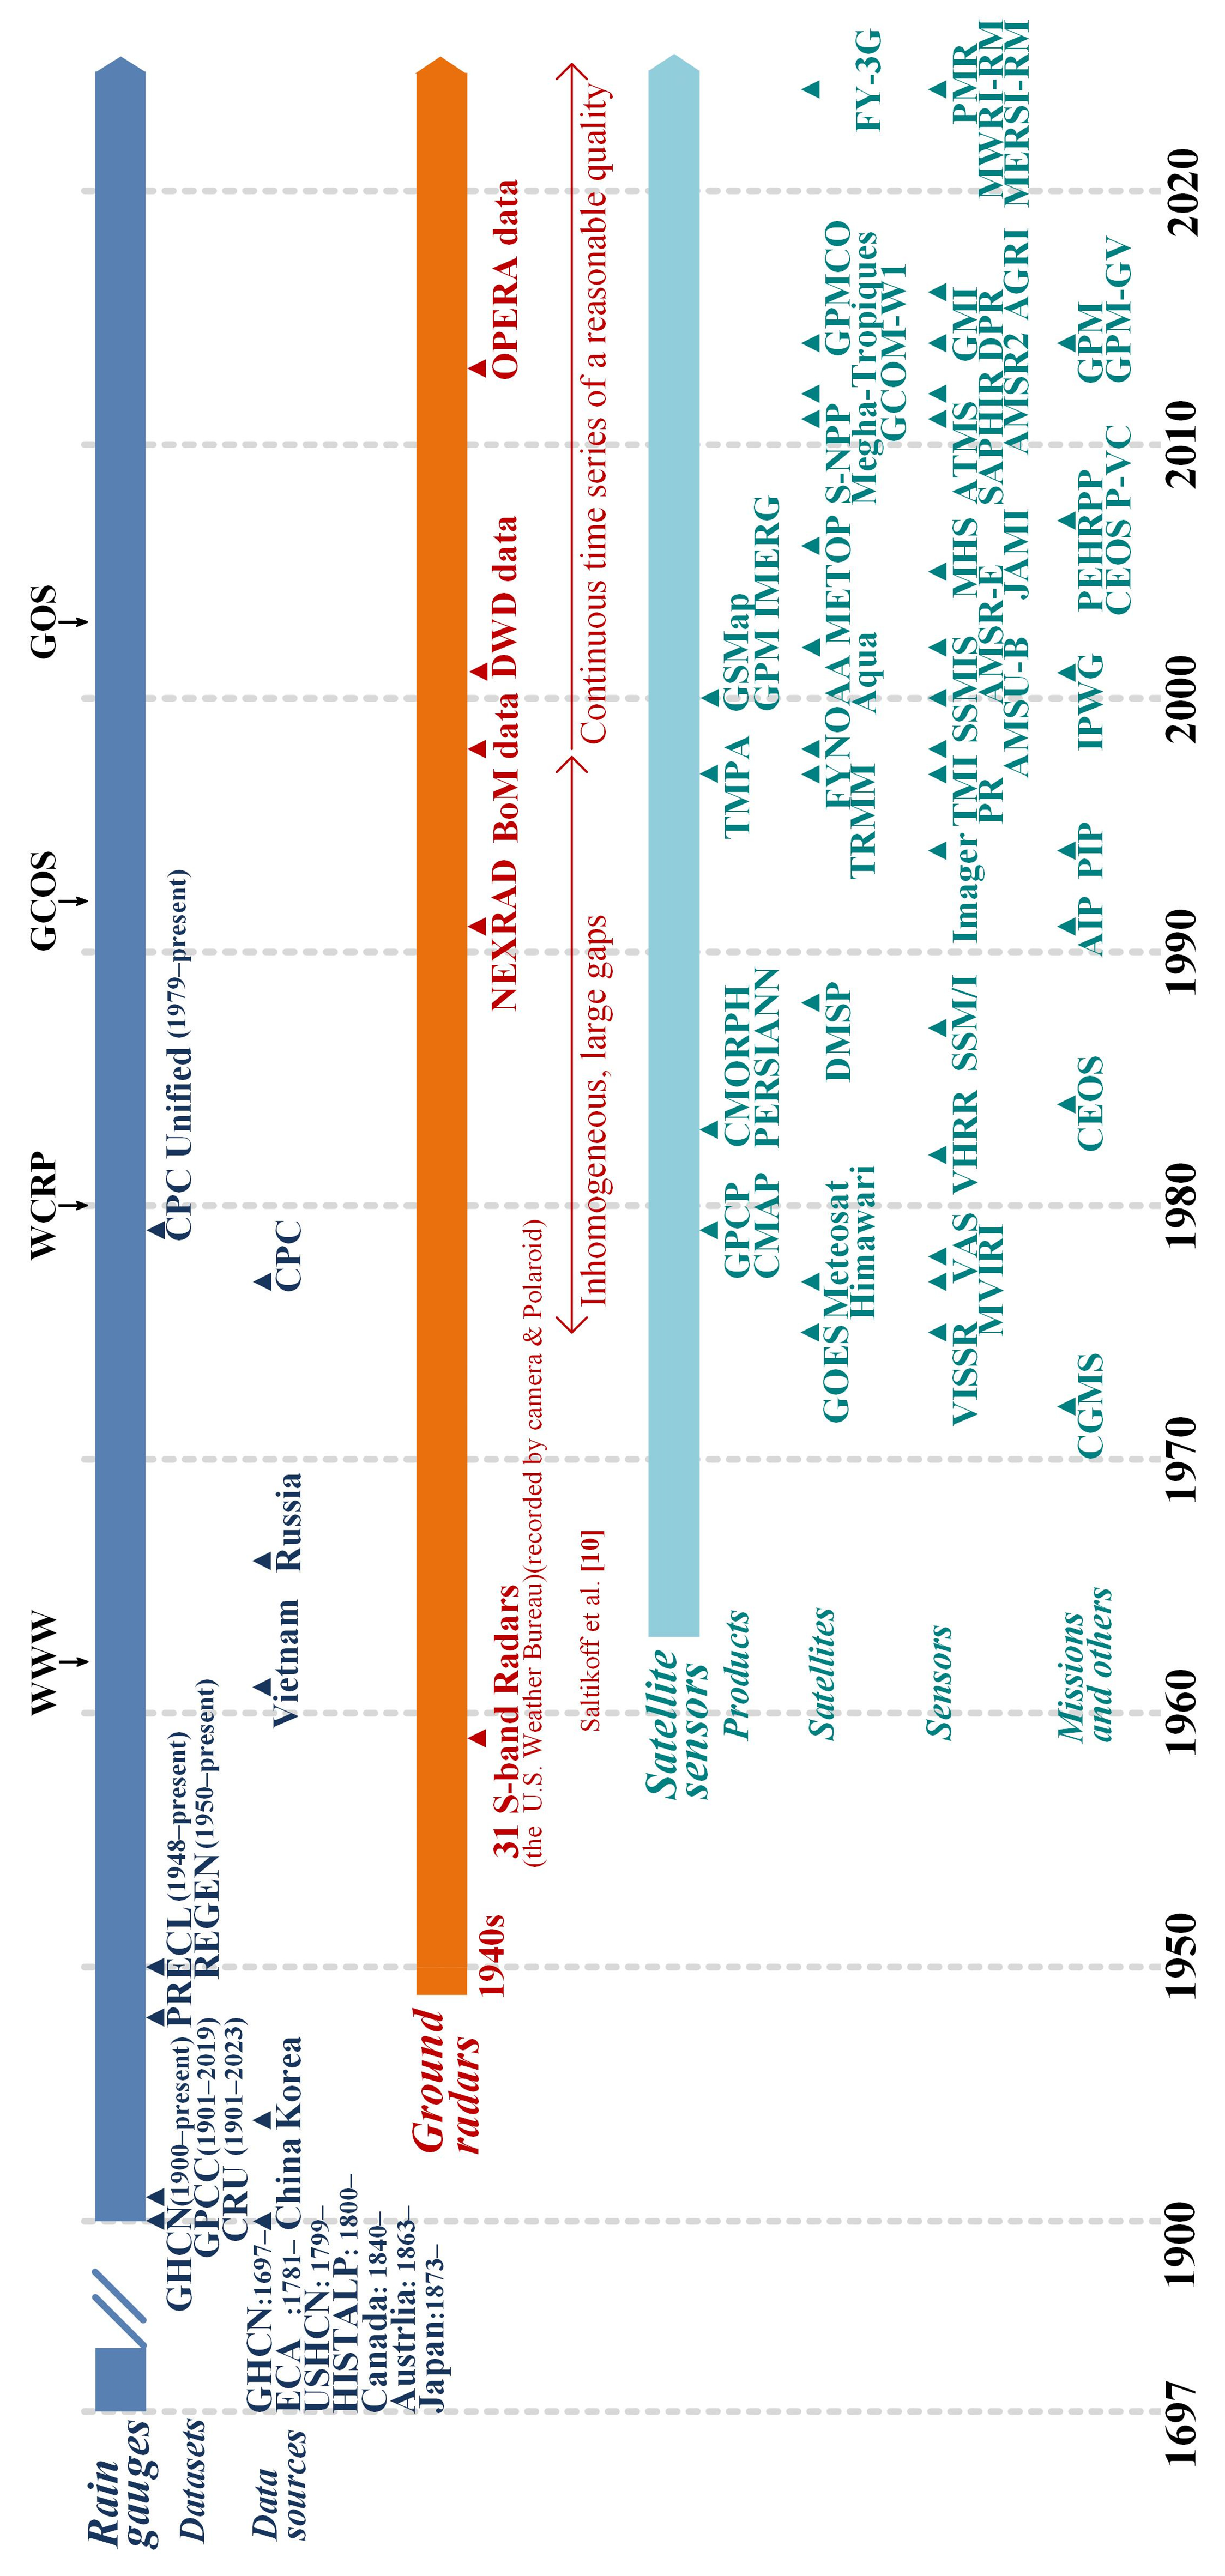
:1. Introduction
2. Satellites and Sensors
3. Physical Basis of Multi-Sensor Precipitation Estimation
3.1. IR-Based Precipitation Estimation
3.2. PMW-Based Precipitation Estimation
3.3. AMW-Based Precipitation Estimation
4. Combining MPE Methodologies
4.1. Probability Matching Method
4.2. Cloud-Motion-Based Method
4.3. Adjustment-Ratio-Based Method
4.4. Neural-Network-Based Method
4.5. Weighted-Average-Based Method
4.6. Regression-Based Method
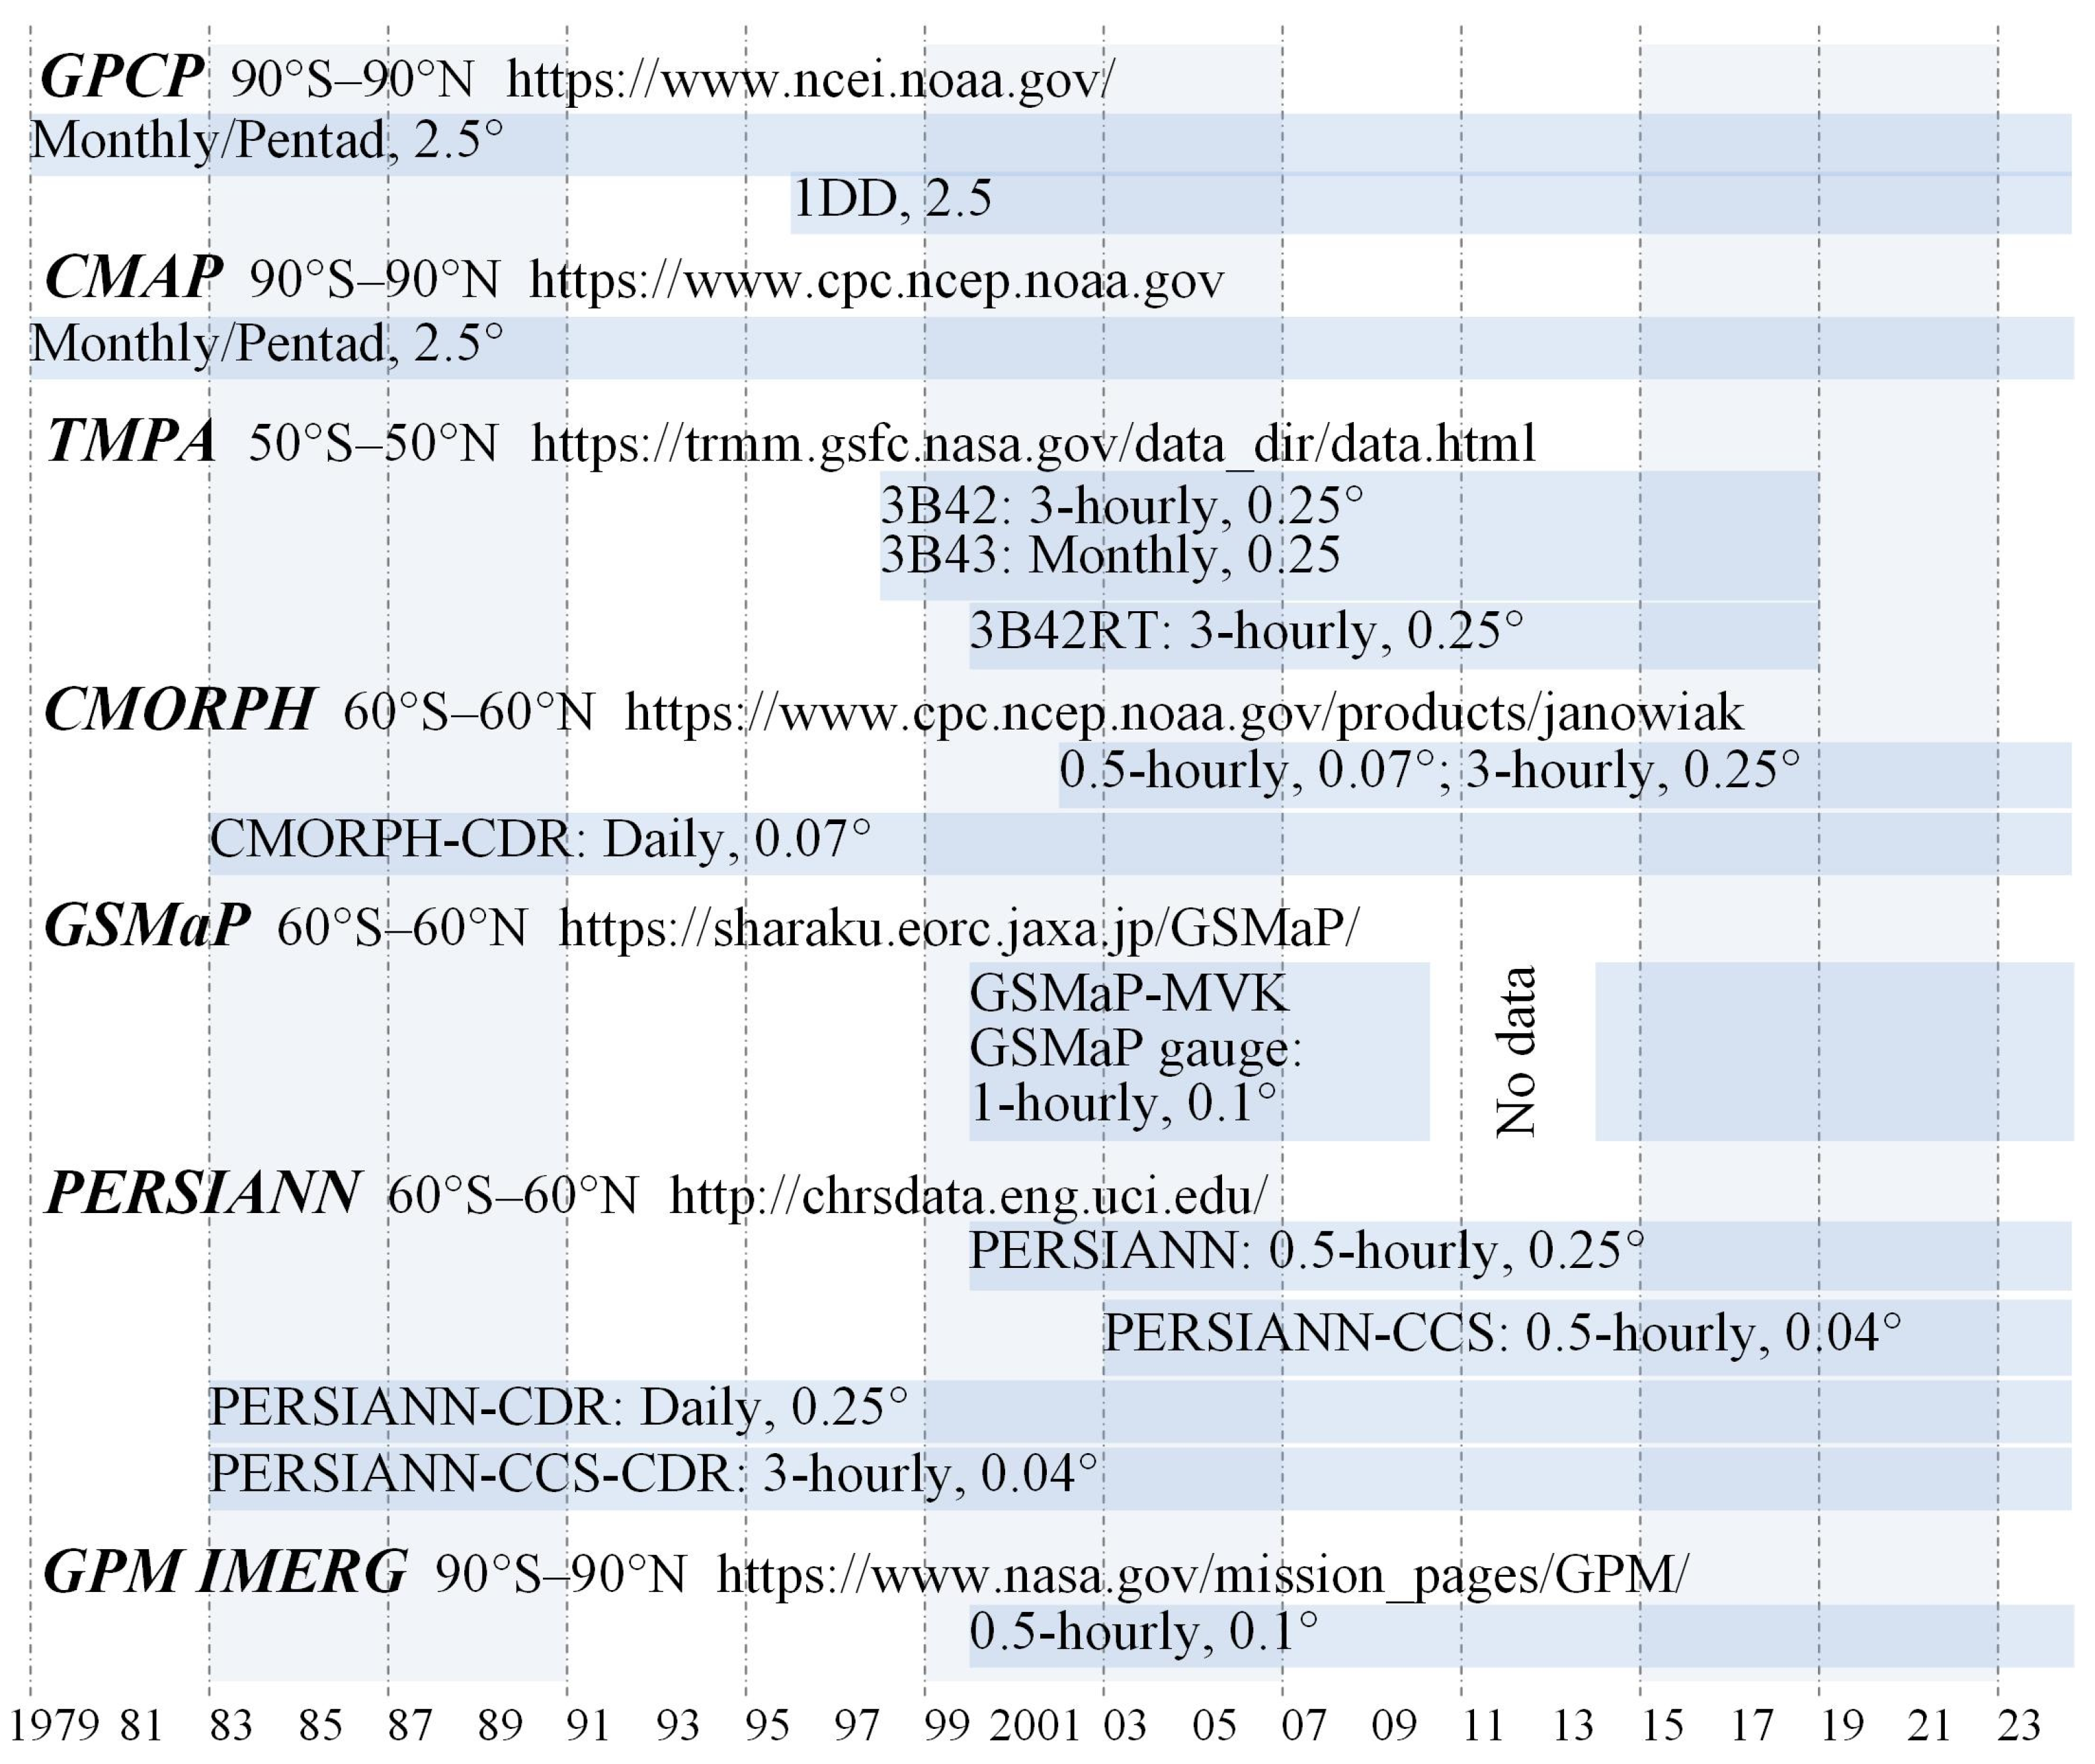
5. Satellite Precipitation Products
5.1. Precipitation Products with Low Spatiotemporal Resolution
5.2. Precipitation Products with High Spatiotemporal Resolution
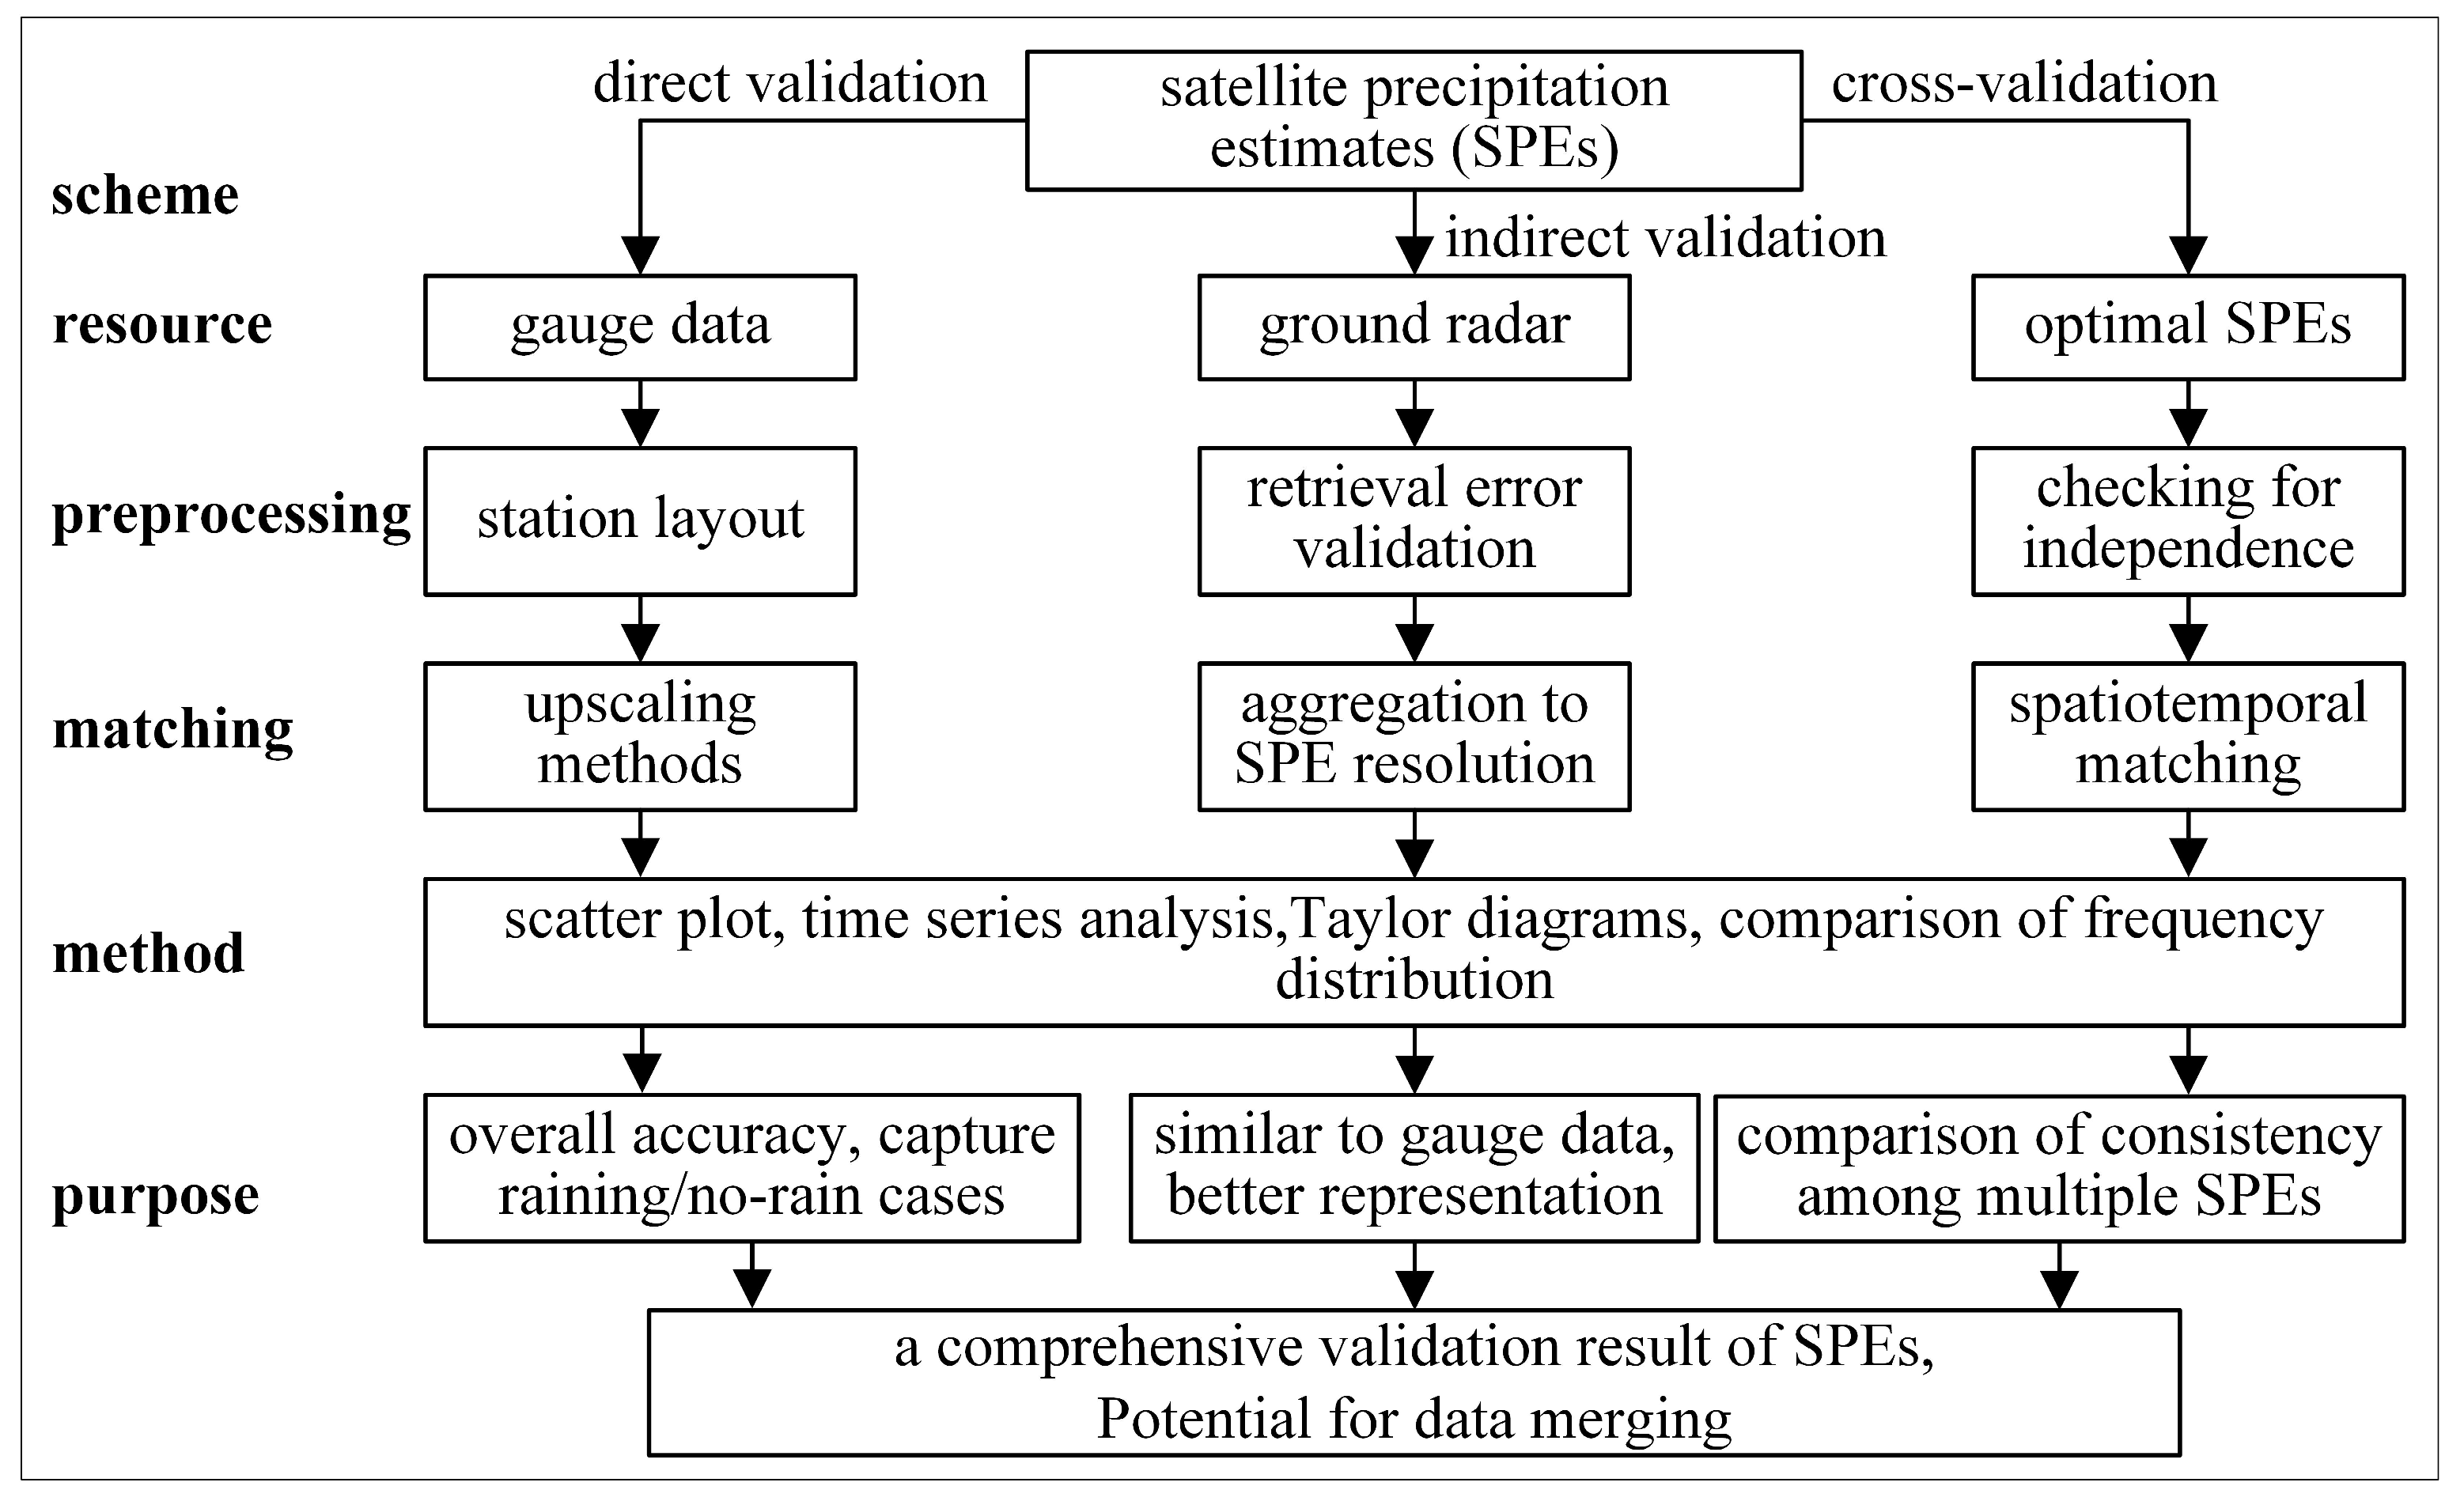
6. Validation
6.1. Validation Practices for Satellite Precipitation
6.2. Data Preprocessing and Statistical Metrics
6.3. Uncertainties and Recommendations for SPPs

| SPP | Region | Scale | Main Results | Reference | Remarks | ||||
|---|---|---|---|---|---|---|---|---|---|
| 3B42 V7 3B42 RT V7 | Global | Daily | Bias | U.S. | East Asia | Europe | Australia | [189] | All seasons |
| 3B42 | 0.27 | −6.96 | −6.76 | −16.89 | |||||
| RT | −12.57 | −38.63 | −28.09 | −41.28 | |||||
| 3B42RT V6 CMORPH V0.x | Australia | Daily | POD | FAR | RMSE/mm | [155] | validation for 5 Jan 2005 | ||
| CMORPH | 0.55 | 0.28 | 7.9 | ||||||
| Northwestern Europe | POD | FAR | RMSE/mm | validation for 18 Jan 2006 | |||||
| 3B42RT | 0.57 | 0.17 | 4.4 | ||||||
| GSMaP-MVK V4.8.4 CMORPH V0.x 3B42 V6 PERSIANN | Continental U.S. (CONUS) | Daily | Bias/% | GSMaP | CMORPH | 3B42 | PERSIANN | [209] | Winter |
| West | −50 | −75 | −41 | −27 | |||||
| East | −32 | −48 | −8 | −23 | |||||
| West | 77 | 88 | −8 | 72 | Summer | ||||
| East | 25 | 32 | −13 | 28 | |||||
| CMORPH V0.x PERSIANN 3B42 V6 3B42RT V6 | central U. S. | hourly | 3B42RT | CMORPH | 3B42 | PERSIANN | [179] | Except 3B42, all SPPs are unadjusted warm month | |
| POD | 0.41 | 0.74 | 0.42 | 0.55 | |||||
| FAR | 0.80 | 0.62 | 0.83 | 0.58 | |||||
| POD | 0.28 | 0.47 | 0.22 | 0.47 | |||||
| FAR | 0.63 | 0.46 | 0.46 | 0.14 | Cold month | ||||
| Bias/% | 56 | 50 | 2 | 43 | All data | ||||
| 3B42 V7 3B42RT V7 | CONUS | Daily | Mountainous areas | CONUS | [210] | - | |||
| bias/% | RMSE/mm | bias/% | RMSE/mm | ||||||
| 3B42 | −25.88 | 0.74 | −2.37 | 0.92 | |||||
| 3B42RT | −27.97 | 1.1 | 0.22 | 0.75 | |||||
| IMERG V03 3B42RT V7 | U.S. | Daily | IMERG: 8–30% 3B42RT: 2–18% | [205] | Uncalibrated SPPs | ||||
| IMERG V06 3B42 V7 | U.S., Mexico | Annual | IMERG: −1.25%; 3B42: −7.17% | [184] | all data | ||||
| hourly | IMERG: −50.1–54.9%; 3B42: 2.9–56.3% (TCP) (statistically significant differences (p < 0.05) | Tropical cyclone precipitation (TCP) | |||||||
| IMERG V05 3B42 V7 | China | Annual | bias | RMSE/mm | [183] | Extreme precipitation | |||
| IMERG | −0.07 | 42.51 | |||||||
| 3B42 | −0.07 | 23.35 | |||||||
| IMERG V06 3B42 V7 CMORPH V1.0 GSMaP-gauge V6/V7 PERSIANN-CDR | China | Daily | IMERG: ~5% (−5–10%); 3B42: ~5% (−5–10%) CMORPH: ~−5% (−10–5%) GSMaP: ~−5% (−10–1%) CDR: ~8% (−5–15%) | [168] | The 25th and 75th percentiles | ||||
| 3B42RT V7 PERSIANN-CCS CMOROH | Iran | 6-Hourly | bias/% | POD | FAR | [211] | 3B42RT V7 PERSIANN-CCS are near real-time, and CMOROH is after real time | ||
| 3B42RT | −56.06 | 0.05 | 0.89 | ||||||
| PERSIANN | 144.08 | 0.36 | 0.13 | ||||||
| CMOROH | −8.01 | 0.44 | 0.91 | ||||||
| Daily Monthly Annual | bias/% | Daily | Monthly | Annual | |||||
| 3B42RT | −56.12 | −56.13 | −56.14 | ||||||
| PERSIANN | 143.86 | 143.84 | 143.84 | ||||||
| CMOROH | −8.08 | −8.10 | −8.10 | ||||||
| 3B42 V7 3B42RT V7 CMORPH-RAW V1.0 CMORPH V1.0 GSMaP-MVK V6 GSMaP-gauge V6 PERSIANN-RAW PERSIANN-CDR | Central Asia | Daily | 3B42RT/3B42/CMORPH-RAW/CMORPH: POD < 30%, miss 70%; GSMaP_Gauge: POD > 60%; FAR < 30%; PERSIANN-CDR: POD > 60%, FAR > 40% | [212] | Winter | ||||
| all SPPs: the worst performance, POD < 30%, highest misses, FAR > 60% CMORPH_RAW, CMORPH:_miss up to 100% | Over the desert region in summer | ||||||||
| CMORPH V0.x 3B42 V6 3B42RT V6 | Mountainous | Monthly | 3B42: −14%; 3B42RT: 13%; CMORPH: 11% | [213] | |||||
| Highlands of Columbia | Monthly | 3B42: −16%; 3B42RT: −17%; CMORPH: −9% | |||||||
| IMERG CMORPH-RAW V1.0 GSMAP_NRT V6 PERSIANN-CDR-gauge | Africa | Daily | RMSE/mm IMERG: 0.6–4.1; CMORPH: 0.9–5.0 GSMAP: 0.8–4.5; PERSIANN: 0.7–5.2 Corrected satellite products depict notable agreement for POD and FAR | [171] | Heavy precipitation monitoring: all IMERG, uncorrected PERSIAN_CDR and GSMAP_NRT Flood monitoring: CMORPH and PERSIANN-CDR. | ||||
| 3B43 V6 3B42 V6 CMAP V1.2 GPCP V2 GPCP 1DD CMORPH V0.x | Complex topography, East Africa | Monthly | GPCP: 20%; CMAP: 9% 3B43: 8% | [173] | Data pairs = 168 | ||||
| 1DD: 23%; 3B42: 6%; CMORPH: 2% | Data pairs = 306 | ||||||||
| 3B42RT V6 CMORPH V0.x PERSIANN | Ethiopian river basins | Monthly | CMORPH: 11%; 3B42RT: 5%; PERSIANN: −43% | [175] | |||||
| CMORPH V1.0 3B42RT V7 3B42 V7 | Southern South America | Daily | 3B42: −30–32%; 3B42RT: −60–60% CMORPH: −73–81% | [214] | |||||
7. Conclusions and Outlook
Author Contributions
Funding
Acknowledgments
Conflicts of Interest
Relevant Abbreviations and Definitions of Satellites, Sensors, and Agencies
| Abbreviation | Definition |
| AMSR | Advanced Microwave Scanning Radiometer |
| AMSU-B | Advanced Microwave Sounding Unit-B |
| ATLID | Atmospheric Lidar |
| ATMS | Advanced Technology Microwave Sounder |
| BoM | Bureau of Meteorology |
| CEOS | Committee on Earth Observation Satellites |
| CGMS | Coordination Group for Meteorological Satellites |
| CMA | China Meteorological Administration |
| CPC | Climate Prediction Center |
| CPR | Cloud Profiling Radar |
| DMSP | Defense Meteorological Satellite Program |
| DOD | U.S. Department of Defense |
| DPR | Dual Frequency Precipitation Radar |
| DWD | German Weather Service (Deutscher Wetterdienst) |
| EarthCare | Earth Clouds, Aerosol and Radiation Explorer |
| EOSSDIS | Earth Observing System Science and Data Information System |
| ESA | European Space Agency |
| EUMETSAT | European Organisation for the Exploitation of Meteorological Satellites |
| FY | FengYun |
| GCOM-W | Global Change Observation Mission for Water |
| GEO | Geostationary |
| GMI | GPM Microwave Imager |
| GEWEX | Global Energy and Water Cycle Experiment |
| GMS | Geostationary Meteorological Satellite |
| GOES | Geostationary Operational Environmental Satellite |
| GOS | Global Observing System |
| GV | Ground validation |
| IPWG | International Precipitation Working Group |
| JAXA | Japan Aerospace Exploration Agency |
| JCAB | Japanese Ministry of Transport Civil Aviation Bureau |
| JMA | Japan Meteorological Agency |
| JPSS | Joint Polar Satellite System |
| LEO | Low-Earth orbit |
| Meteosats | Meteorological satellites |
| METOP | Meteorological operational satellite |
| MHS | Microwave Humidity Sounder |
| MTG | Meteosat Third-Generation |
| MTSAT | Multifunctional Transport Satellites series |
| MWI | Microwave Imager |
| MWRI-RM | Microwave Radiation Imager-Rainfall Mission |
| NASA | National Aeronautics and Space Administration |
| NASDA | Japan’s National Space Development Agency |
| NCEI | National Centers for Environmental Information |
| NEXRAD | Next-Generation Weather Radar |
| NOAA | National Oceanic and Atmospheric Administration |
| NRSCC | National Remote Sensing Center of China |
| OPERA | Operational Programme for the Exchange of Weather Radar Information in Europe |
| PMR | Precipitation Measurement Radar |
| PPS | Precipitation Process System |
| PR | Precipitation Radar |
| P-VC | Precipitation Virtual Constellation |
| SAPHIR | Sonder Atmospherique du Profil d’Humidite Intertropicale par Radiometrie |
| SMS | Synchronous Meteorological Satellites |
| S-NPP | Suomi National Polar-orbiting Partnership |
| SSM/I | Special Sensor Microwave Imager |
| SSMIS | Special Sensor Microwave Imager-Sounder |
| TMI | TRMM Microwave Imager |
| TRMM | Tropical Rainfall Measurement Mission |
| UDEL | University of Delaware |
| WCRP | World Climate Research Programme |
| WSF-M | Weather System Follow-on–Microwave |
| WMO | World Meteorological Organization |
Relevant Abbreviations and Definitions of Algorithms, Products, and Systems
| Abbreviation | Definition |
| AGPI | adjusted GOES precipitation index |
| AMW | Active Microwave |
| CDR | Climate Data Record |
| CMAP | Climate Prediction Center Merged Analysis of Precipitation |
| CMORPH | Climate Prediction Center Morphing method |
| CRU | Climatic Research Unit |
| GHCN | Global Historical Climatology Network |
| GPCC | Global Precipitation Climatology Centre |
| GPCP | Global Precipitation Climatology Project |
| GPI | Global Precipitation Index |
| GPM | Global Precipitation Measurement |
| GSMaP | Global Satellite Mapping of Precipitation |
| HRPPs | High Resolution Precipitation Products |
| IMERG | Integrated Multi-satellite Retrievals for GPM |
| IR | Infrared |
| MPE | Multi-sensor precipitation estimation |
| MW | Microwave |
| NEXRAD | Next-Generation Weather Radar |
| OPI | Outgoing Long-wave Radiation Precipitation Index |
| PERSIANN CCS | PERSIANN Cloud Classification System |
| PMW | Passive microwave |
| PREC | Precipitation Reconstruction |
| SPE | Satellite precipitation estimation |
| SPP | Satellite precipitation product |
| Tb | Brightness temperature |
| TMPA | TRMM Multi-Satellite Precipitation |
| UDEL | University of Delaware |
| USHCN | U.S. Historical Climatology Network |
| VIS/IR | Visible/infrared |
References
- Barrett, E.C.; Martin, D.W. The Use of Satellite Data in Rainfall Monitoring, 1st ed.; Academic Press: London, France, 1981; p. 340. [Google Scholar]
- Tobler, W. On the first law of geography: A reply. Ann. Assoc. Am. Geog. 2004, 94, 304–310. [Google Scholar] [CrossRef]
- Shepherd, J.M.; Burian, S.; Liu, C.; Bernardes, S. Satellite Precipitation Metrics to Study the Energy-Water-Food Nexus Within the Backdrop of an Urbanized Globe. Earthzine. Available online: https://earthzine.org/satellite-precipitation-metrics-to-study-the-energy-water-food-nexus-within-the-backdrop-of-an-urbanized-globe/ (accessed on 1 December 2024).
- Trenberth, K.E.; Dai, A.; Rasmussen, R.M.; Parsons, D.B. The changing character of precipitation. Bull. Am. Meteorol. Soc. 2003, 84, 1205–1217. [Google Scholar] [CrossRef]
- Kidd, C.; Becker, A.; Huffman, G.J.; Muller, C.L.; Joe, P.; Skofronick-Jackson, G.; Kirschbaum, D.B. So, how much of the Earth’s surface is covered by rain gauges? Bull. Am. Meteorol. Soc. 2017, 98, 69–78. [Google Scholar] [CrossRef] [PubMed]
- Trenberth, K.E.; Zhang, Y. How often does it really rain? Bull. Am. Meteorol. Soc. 2018, 99, 289–298. [Google Scholar] [CrossRef]
- Flossmann, A.I.; Manton, M.; Abshaev, A.; Bruintjes, R.; Murakami, M.; Prabhakaran, T.; Yao, Z. Review of Advances in Precipitation Enhancement Research. Bull. Am. Meteorol. Soc. 2019, 100, 1465–1480. [Google Scholar] [CrossRef]
- Barrett, E.C.; Beaumont, M.J. Satellite rainfall monitoring: An overview. Remote Sens. Rev. 1994, 11, 23–48. [Google Scholar] [CrossRef]
- New, M.; Todd, M.; Hulme, M.; Jones, P. Precipitation measurements and trends in the twentieth century. Int. J. Climatol. 2001, 21, 1889–1922. [Google Scholar] [CrossRef]
- Saltikoff, E.; Friedrich, K.; Soderholm, J.; Lengfeld, K.; Nelson, B.; Becker, A.; Tassone, C. An overview of using weather radar for climatological studies: Successes, challenges, and potential. Bull. Am. Meteorol. Soc. 2019, 100, 1739–1752. [Google Scholar] [CrossRef]
- Krajewski, W.F.; Smith, J.A. Radar hydrology: Rainfall estimation. Adv. Water Resour. 2002, 25, 1387–1394. [Google Scholar] [CrossRef]
- Smith, J.A.; Seo, D.J.; Baeck, M.L.; Hudlow, M.D. An intercomparison study of NEXRAD precipitation estimates. Water Resour. Res. 1996, 32, 2035–2045. [Google Scholar] [CrossRef]
- Young, C.B.; Nelson, B.R.; Bradley, A.A.; Smith, J.A.; Peters-Lidard, C.D.; Kruger, A.; Baeck, M.L. An evaluation of NEXRAD precipitation estimates in complex terrain. J. Geophys. Res. 1999, 104, 19691–19703. [Google Scholar] [CrossRef]
- Young, C.B.; Bradley, A.A.; Krajewski, W.F.; Kruger, A.; Morrissey, M.L. Evaluating NEXRAD multisensor precipitation estimates for operational hydrologic forecasting. J. Hydrometeorol. 2000, 1, 241–254. [Google Scholar] [CrossRef]
- Kucera, P.A.; Ebert, E.E.; Turk, J.F.; Levizzani, V.; Kirschbaum, D.; Tapiador, F.J.; Loew, A.; Borsche, M. Precipitation from space: Advancing Earth system science. Bull. Am. Meteorol. Soc. 2013, 94, 365–375. [Google Scholar] [CrossRef]
- Levizzani, V.; Kidd, C.; Kirschbaum, D.B.; Kummero, C.D.; Nakamura, K.; Turk, F.J. Satellite Precipitation Measurement, 1st ed.; Springer: Berlin/Heidelberg, Germany, 2020. [Google Scholar] [CrossRef]
- Kidd, C.; Kniveton, D.R.; Todd, M.C.; Bellerby, T.J. Satellite rainfall estimation using combined passive microwave and infrared algorithms. J. Hydrometeorol. 2003, 4, 1088–1104. [Google Scholar] [CrossRef]
- Ferraro, R.R. Past, present and future of microwave operational rainfall algorithms. In Measuring Precipitation From Space: EURAINSAT and the Future, 1st ed.; Levizzani, V., Bauer, P., Eds.; Springer: Dordrecht, The Netherlands, 2007; pp. 189–198. [Google Scholar] [CrossRef]
- Kozu, T.; Kawanishi, T.; Kuroiwa, H.; Kojima, M.; Oikawa, K.; Kumagai, H.; Okamoto, K.; Okumura, M.; Nakatsuka, H.; Nishikawa, K.K. Development of Precipitation Radar onboard the Tropical Rainfall Measuring Mission satellite. IEEE Geosci. Remote Sens. Lett. 2001, 39, 102–116. [Google Scholar] [CrossRef]
- Hou, A.Y.; Kakar, R.K.; Neeck, S.; Azarbarzin, A.A.; Kummerow, C.D.; Kojima, M.; Oki, R.; Nakamura, K.; Ighchi, T. The Global Precipitation Measurement mission. Bull. Am. Meteorol. Soc. 2014, 95, 701–722. [Google Scholar] [CrossRef]
- Skofronick-Jackson, G.; Petersen, W.A.; Berg, W.; Kidd, C.; Stocker, E.F.; Kirschbaum, D.B.; Kakar, R.; Braun, S.A.; Huffman, G.J.; Iguchi, T.; et al. The Global Precipitation Measurement (GPM) mission for science and society. Bull. Am. Meteorol. Soc. 2017, 98, 1679–1695. [Google Scholar] [CrossRef] [PubMed]
- Ebert, E.E.; Manton, M.J.; Arkin, P.A.; Allam, R.J.; Holpin, G.E.; Gruber, A. Results from the GPCP algorithm intercomparison programme. Bull. Am. Meteorol. Soc. 1996, 77, 2875–2888. [Google Scholar] [CrossRef]
- Ebert, E.E.; Manton, M.J. Performance of satellite rainfall estimation algorithms during TOGA COARE. J. Atmos. Sci. 1998, 55, 1537–1557. [Google Scholar] [CrossRef]
- Turk, F.J.; Ebert, E.E.; Oh, H.J.; Sohn, B.J.; Levizzani, V.; Smith, E.A.; Ferraro, R. Validation of an operational global precipitation analysis at short time scales. Proceedings of 12th Conference on Satellite Meteorology and Oceanography, Long Beach, CA, USA, 8–13 February 2003; Available online: https://ams.confex.com/ams/pdfpapers/56865.pdf (accessed on 1 December 2024).
- Huffman, G.J.; Adler, R.F.; Bolvin, D.T.; Gu, G.; Nelkin, E.J.; Bowman, K.P.; Hong, Y.; Stocker, E.F.; Wolff, D.B. The TRMM multisatellite precipitation analysis (TMPA): Quasi-global, multiyear, combined-sensor precipitation estimates at fine scales. J. Hydrometeorol. 2007, 8, 38–55. [Google Scholar] [CrossRef]
- Joyce, R.J.; Janowiak, J.E.; Arkin, P.A.; Xie, P. CMORPH: A method that produces global precipitation estimates from passive microwave and infrared data at high spatial and temporal resolution. J. Hydrometeorol. 2004, 5, 487–503. [Google Scholar] [CrossRef]
- Kubota, T.; Shige, S.; Hashizume, H.; Aonashi, K.; Takahashi, N.; Seto, S.; Hirose, M.; Takayabu, Y.N.; Ushio, T.; Nakagawa, K.; et al. Global Precipitation Map Using Satellite-Borne Microwave Radiometers by the GSMaP Project: Production and Validation. IEEE Trans. Geosci. Remote 2007, 45, 2259–2275. [Google Scholar] [CrossRef]
- Hsu, K.L.; Gao, X.; Sorooshian, S.; Gupta, H.V. Precipitation estimation from remotely sensed information using artificial neural networks. J. Appl. Meteorol. 1997, 36, 1176–1190. [Google Scholar] [CrossRef]
- Hong, Y. Precipitation Estimation from Remotely Sensed Information Using Artificial Neural Network-Cloud Classification System. Ph.D. Thesis, The University of Arizona, Tucson, AZ, USA, 2003. UMI Number 3108912. Available online: https://www.proquest.com/openview/d8936b9522c229acd98f158e15aa7755/1?pq-origsite=gscholar&cbl=18750&diss=y (accessed on 1 December 2024).
- Huffman, G.J.; Bolvin, D.T.; Braithwaite, D.; Hsu, K.; Joyce, R.; Kidd, C.; Nelkin, E.J.; Sorooshian, S.; Tan, J.; Xie, P. NASA Global Precipitation Measurement (GPM) Integrated Multi-satellite Retrievals for GPM (IMERG). In Algorithm Theoretical Basis Document (ATBD); NASA/GSFC: Greenbelt, MD, USA, 2018. Available online: https://gpm.nasa.gov/sites/default/files/document_files/IMERG_ATBD_V5.2_0.pdf (accessed on 1 December 2024).
- D’souza, G.; Barrett, E.C.; Power, C.H. Satellite rainfall estimation techniques using visible and infrared imagery. Remote Sens. Rev. 1990, 4, 379–414. [Google Scholar] [CrossRef]
- Kidd, C.; Barrett, E.C. The use of passive microwave imagery in rainfall monitoring. Remote Sens. Rev. 1990, 4, 415–450. [Google Scholar] [CrossRef]
- Wilheit, T.; Adler, R.; Avery, S.; Barrett, E.; Bauer, P.; Berg, W.; Chang, A.; Ferriday, J.; Grody, N.; Goodman, S.; et al. Algorithms for the retrieval of rainfall from passive microwave measurements. Remote Sens. Rev. 1994, 11, 163–194. [Google Scholar] [CrossRef]
- Arkin, P.A.; Ardanuy, P.E. Estimating climatic-scale precipitation from space: A review. J. Clim. 1989, 2, 1229–1238. [Google Scholar] [CrossRef]
- Barrett, E.C. Satellite rainfall monitoring for agrometeorology: Operational problems, practices and prospects. EARSeL Adv. Remote Sens. 1993, 2, 66–72. Available online: https://earsel.org/wp-content/uploads/2016/11/2-2_09_Barrett.pdf (accessed on 1 December 2024).
- Petty, G.W. The status of satellite-based rainfall estimation over land. Remote Sens. Environ. 1995, 51, 125–137. [Google Scholar] [CrossRef]
- Petty, G.W.; Krajewski, W.F. Satellite estimation of precipitation over land. Hydrol. Sci. J. 1996, 41, 433–451. [Google Scholar] [CrossRef]
- Levizzani, V. Satellite rainfall estimates: A look back and a perspective. In Proceedings of the 2000 EUMETSAT Meteorological Satellite Data User’s Conference, Bologna, Italy, 29 May–2 June 2000; pp. 344–353. Available online: https://www.researchgate.net/publication/257114602_Satellite_rainfall_estimates_a_look_back_and_a_perspective (accessed on 1 December 2024).
- Kidd, C. Satellite rainfall climatology: A review. Int. J. Climatol. 2001, 21, 1041–1066. [Google Scholar] [CrossRef]
- Levizzani, V.; Amorati, R.; Meneguzzo, F. A review of satellite-based rainfall estimation methods. In Multiple-Sensor Precipitation Measurements, Integration, Calibration and Flood Forecasting; 2002; Volume 66, Available online: https://www.academia.edu/download/45755676/A_Review_of_Satellite-based_Rainfall_Est20160518-31135-5xarl.pdf (accessed on 1 October 2022)European Commission Project MUSIC Report (EVK1-CT-2000-00058).
- Scofield, R.A.; Kuligowski, R.J. Status and outlook of operational satellite precipitation algorithms for extreme precipitation events. Weather Forecast. 2003, 18, 1037–1051. [Google Scholar] [CrossRef]
- Anagnostou, E.N. Overview of overland satellite rainfall estimation for hydro-meteorological applications. Surv. Geophys. 2004, 25, 511–537. [Google Scholar] [CrossRef]
- Stephens, G.L.; Kummerow, C.D. The remote sensing of clouds and precipitation from space: A review. J. Atmos. Sci. 2007, 64, 3742–3765. [Google Scholar] [CrossRef]
- Michaelides, S.; Levizzani, V.; Anagnostou, E.; Bauer, P.; Kasparis, T.; Lane, J.E. Precipitation: Measurement, remote sensing, climatology and modeling. Atmos. Res. 2009, 94, 512–533. [Google Scholar] [CrossRef]
- Kidd, C.; Levizzani, V.; Turk, J.; Ferraro, R. Satellite Precipitation Measurements for Water Resource Monitoring. J. Am. Water Resour. Assoc. 2009, 45, 567–579. [Google Scholar] [CrossRef]
- Kidd, C.; Levizzani, V.; Laviola, S. Quantitative precipitation estimation from Earth observation satellites, in Rainfall: State of the Science. Am. Geophys. Union 2010, 191, 127–158. [Google Scholar] [CrossRef]
- Durkee, J. Precipitation measurement and the advancement toward global observations. Geogr. Compass 2010, 4, 956–978. [Google Scholar] [CrossRef]
- Prigent, C. Precipitation retrieval from space: An overview. C. R. Geosci. 2010, 342, 380–389. [Google Scholar] [CrossRef]
- Kidd, C.; Levizzani, V. Status of satellite precipitation retrievals. Hydrol. Earth Syst. Sci. 2011, 15, 1109–1116. [Google Scholar] [CrossRef]
- Tapiador, F.J.; Turk, F.J.; Petersen, W.; Hou, A.Y.; García-Ortega, E.; Machado, L.A.T.; Angelis, C.F.; Salio, P.; Kidd, C.; Huffman, G.J.; et al. Global precipitation measurement: Methods, datasets and applications. Atmos. Res. 2012, 104–105, 70–97. [Google Scholar] [CrossRef]
- Hong, Y.; Tang, G.; Ma, Y.; Huang, Q.; Han, Z.; Zeng, Z.; Yang, Y.; Wang, C.; Guo, X. Remote sensing precipitation: Sensors, retrievals, validations, and applications. In Observation and Measurement of Ecohydrological Processes, 1st ed.; Li, X., Vereecken, H., Eds.; Springer: Berlin/Heidelberg, Germany, 2019; pp. 107–128. [Google Scholar] [CrossRef]
- Knapp, K.R.; Ansari, S.; Bain, C.L.; Bourassa, M.A.; Dickinson, M.J.; Funk, C.; Helms, C.D.; Hennon, C.C.; Holmes, C.D.; Huffman, G.J.; et al. Globally Gridded Satellite Observations for Climate Studies. Bull. Am. Meteorol. Soc. 2011, 92, 893–907. [Google Scholar] [CrossRef]
- Sun, Q.H.; Miao, C.Y.; Duan, Q.Y.; Ashouri, H.; Sorooshian, S.; Hsu, K. A review of global precipitation data sets: Data sources, estimation, and intercomparisons. Rev. Geophys. 2018, 56, 79–107. [Google Scholar] [CrossRef]
- Roca, R.; Alexander, L.V.; Potter, G.; Bador, M.; Jucá, R.; Contractor, S.; Bosilovich, M.G.; Cloché, S. FROGS: A daily 1° × 1° gridded precipitation database of rain gauge, satellite and reanalysis products. Hydrol. Earth. Syst. Sci. Data 2019, 11, 1017–1035. [Google Scholar] [CrossRef]
- Turk, F.J.; Arkin, P.; Ebert, E.E.; Sapiano, M.R. Evaluating high-resolution precipitation products. Bull. Am. Meteorol. Soc. 2008, 89, 1911–1916. [Google Scholar] [CrossRef]
- Maggioni, V.; Meyers, P.C.; Robinson, M.D. A review of merged high-resolution satellite precipitation product accuracy during the Tropical Rainfall Measuring Mission (TRMM) Era. J. Hydrometeorol. 2016, 17, 1101–1117. [Google Scholar] [CrossRef]
- Roca, R.; Haddad, Z.S.; Akimoto, F.F.; Alexander, L.; Behrangi, A.; Huffman, G.J.; Kato, S.; Kidd, C.; Kirstetter, P.E.; Kubota, T.; et al. The Joint IPWG/GEWEX Precipitation Assessment; World Climate Research Programme (WCRP): Geneva, Switzerland, 2021; 125p. [Google Scholar] [CrossRef]
- Pradhan, R.K.; Markonis, Y.; Godoy, M.R.V.; Villalba-Pradas, A.; Andreadis, K.M.; Nikolopoulos, E.I.; Papalexiou, S.M.; Rahim, A.; Tapiador, F.J.; Hanel, M. Review of GPM IMERG performance: A global perspective. Remote Sens. Environ. 2022, 268, 112754. [Google Scholar] [CrossRef]
- Fischer, F.K.; Winterrath, T. Precipitation measurement techniques, typical data sets, and their application in erosion research and extreme value statistics. In Precipitation, 1st ed.; Comino, J.R., Ed.; Elsevier: Amsterdam, The Netherlands, 2021; pp. 147–172. [Google Scholar] [CrossRef]
- Levizzani, V.; Gruber, A. The 1st International Precipitation Working Group (IPWG) Workshop. Proceedings of 1st IPWG Workshop, Madrid, Spain, 23–27 September 2003; EUMETSAT EUM P34. pp. VII–VIII, ISBN 92-9110-045-5. [Google Scholar]
- Turk, J.; Bauer, P. The international precipitation working group and its role in the improvement of quantitative precipitation measurements. Bull. Am. Meteorol. Soc. 2006, 87, 643–648. [Google Scholar] [CrossRef]
- Smith, E.A.; Asrar, G.; Furuhama, Y.; Ginati, A.; Mugnai, A.; Nakamura, K.; Adler, R.F.; Chou, M.D.; Desbois, M.; During, J.F.; et al. International global precipitation measurement (GPM) program and mission: An overview. In Measuring Precipitation From Space: EURAINSAT and the Future, 1st ed.; Levizzani, V., Bauer, P., Eds.; Springer: Dordrecht, The Netherlands, 2007; pp. 611–653. [Google Scholar] [CrossRef]
- Kidd, C.; Ferraro, R.; Levizzani, V. The Fourth International Precipitation Working Group Workshop. Bull. Am. Meteorol. Soc. 2010, 91, 1095–1099. [Google Scholar] [CrossRef]
- Huffman, G.J.; Klepp, C. Meeting Summary: Fifth workshop of the International Precipitation Working Group. Bull. Am. Meteorol. Soc. 2011, 92, ES54–ES57. [Google Scholar] [CrossRef]
- Levizzani, V.; Kidd, C.; Aonashi, K.; Bennartz, R.; Ferraro, R.R.; Huffman, G.J.; Roca, R.; Turk, F.J.; Wang, N.Y. The activities of the International Precipitation Working Group. Q. J. R. Meteorol. Soc. 2018, 144, 3–15. [Google Scholar] [CrossRef]
- Levizzani, V.; Bauer, P.; Turk, F.J. Satellite Precipitation Measurement, 1st ed.; Springer: Berlin/Heidelberg, Germany, 2007. [Google Scholar]
- Islam, T.; Hu, Y.; Kokhanovsky, A.; Wang, J. Remote Sensing of Aerosols, Clouds, and Precipitation, 1st ed.; Elsevier: Amsterdam, The Netherlands, 2017. [Google Scholar]
- Andronache, C. Remote Sensing of Clouds and Precipitation, 1st ed.; Springer: Berlin/Heidelberg, Germany, 2018. [Google Scholar] [CrossRef]
- Arkin, P.A.; Meisner, B.N. The relationship between large-scale convective rainfall and cold cloud over the western hemisphere during 1982–1984. Mon. Weather Rev. 1987, 115, 51–74. [Google Scholar] [CrossRef]
- Ba, M.B.; Gruber, A. GOES multispectral rainfall algorithm (GMSRA). J. Appl. Meteorol. 2001, 40, 1500–1514. [Google Scholar] [CrossRef]
- Ferraro, R.R. Special sensor microwave imager derived global rainfall estimates for climatological applications. J. Geophys. Res. 1997, 102, 16715–16736. [Google Scholar] [CrossRef]
- Kummerow, C.D.; Randel, D.L.; Kulie, M.; Wang, N.Y.; Ferraro, R.; Munchak, S.J.; Petkovic, V. The evolution of the Goddard profiling algorithm to a fully parametric scheme. J. Atmos. Ocean Technol. 2015, 32, 2265–2280. [Google Scholar] [CrossRef]
- Kummerow, C.D.; Barnes, W.; Kozu, T.; Shiue, J.; Simpson, J. The tropical rainfall measuring mission (TRMM) sensor package. J. Atmos. Ocean Technol. 1998, 15, 809–817. [Google Scholar] [CrossRef]
- Iguchi, T. Dual-Frequency Precipitation Radar (DPR) on the Global Precipitation Measurement (GPM) mission’s Core Observatory. In Satellite Precipitation Measurement, 1st ed.; Levizzani, V., Kidd, C., Eds.; Springer: Berlin/Heidelberg, Germany, 2020; pp. 183–192. [Google Scholar] [CrossRef]
- Kidd, C.; Huffman, G.; Maggioni, V.; Chambon, P.; Oki, R. The global satellite precipitation constellation: Current status and future requirements. Bull. Am. Meteorol. Soc. 2021, 102, E1844–E1861. [Google Scholar] [CrossRef]
- Barrett, E.C. The estimation of monthly rainfall from satellite data. Mon. Weather Rev. 1970, 98, 322–327. [Google Scholar] [CrossRef]
- Savage, R.C.; Weinman, J.A. Preliminary calculations of the upwelling radiance from rain clouds at 37.0 and 19.35 GHz. Bull. Am. Meteorol. Soc. 1975, 56, 1272–1274. [Google Scholar]
- Alishouse, J.C. Total precipitable water and rainfall determinations from the SeaSat Scanning Multichannel Microwave Radiometer. J. Geophys. Res. 1983, 88, 1929–1935. [Google Scholar] [CrossRef]
- Kummerow, C.D.; Olson, W.S.; Giglio, L. A simplified scheme for obtaining precipitation and vertical hydrometer profiles from passive microwave sensors. IEEE Trans. Geosci. Remote 1996, 34, 1213–1232. [Google Scholar] [CrossRef]
- Kummerow, C.D.; Hong, Y.; Olson, W.S.; Yang, S.; Adler, R.F.; Mccollum, J.; Mccollum, J.; Ferraro, R.; Petty, G.W.; Shin, D.; et al. The evolution of the Goddard Profiling Algorithm (GPROF) for rainfall estimation from passive microwave sensors. J. Appl. Meteorol. 2001, 40, 1801–1820. [Google Scholar] [CrossRef]
- Randel, D.L.; Kummerow, C.D.; Ringerud, S. The Goddard Profiling (GPROF) Precipitation Retrieval Algorithm. In Satellite Precipitation Measurement, 1st ed.; Levizzani, V., Kidd, C., Eds.; Springer: Berlin/Heidelberg, Germany, 2020; pp. 141–152. Available online: https://link.springer.com/chapter/10.1007/978-3-030-24568-9_8 (accessed on 1 December 2024).
- Petty, G.W. Dimensionality reduction in Bayesian estimation algorithms. Atmos. Meas. Tech. 2013, 6, 2267–2276. [Google Scholar] [CrossRef]
- Ferraro, R.; Weng, F.; Grody, N.C.; Zhao, L. Precipitation characteristics over land from the NOAA-15 AMSU sensor. Geophys. Res. Lett. 2000, 27, 2669–2672. [Google Scholar] [CrossRef]
- Kummerow, C.D.; Masunaga, H.; Bauer, P. A next-generation microwave rainfall retrieval algorithm for use by TRMM and GPM. In Measuring Precipitation From Space: EURAINSAT and the Future, 1st ed.; Levizzani, V., Bauer, P., Eds.; Springer: Dordrecht, The Netherlands, 2007; pp. 235–252. Available online: https://link.springer.com/chapter/10.1007/978-1-4020-5835-6_19 (accessed on 1 December 2024).
- Aonashi, K.; Awaka, J.; Hirose, M.; Kozu, T.; Kubota, T.; Liu, G.; Shige, S.; Kida, S.; Sinta, S.; Takahashi, N.; et al. GSMaP passive microwave precipitation retrieval algorithm: Algorithm description and validation. J. Meteorol. Soc. Jpn. Ser. II 2009, 87, 119–136. [Google Scholar] [CrossRef]
- Hilburn, K.A.; Wentz, F.J. Intercalibrated passive microwave rain products from the unified microwave ocean retrieval algorithm (UMORA). J. Appl. Meteorol. 2008, 47, 778–794. [Google Scholar] [CrossRef]
- Wentz, F.J.; Spencer, R.W. SSM/I rain retrievals within a unified all-weather ocean algorithm. J. Atmos. Sci. 1998, 55, 1613–1627. [Google Scholar] [CrossRef]
- Boukabara, S.A.; Garrett, K.; Chen, W.C.; Iturbide-Sanchez, F.; Grassotti, C.; Kongoli, C.; Chen, R.Y.; Liu, Q.H.; Yan, B.H.; Weng, F.Z.; et al. MiRS: An all-weather 1DVAR satellite data assimilation and retrieval system. IEEE Trans. Geosci. Remote Sens. 2011, 49, 3249–3272. [Google Scholar] [CrossRef]
- Iguchi, T.; Kozu, T.; Meneghini, R.K.; Okamoto, K. Rain-profiling algorithm for the TRMM precipitation radar. J. Appl. Meteorol. 2000, 39, 2038–2052. [Google Scholar] [CrossRef]
- Iguchi, T. Uncertainties in the rain profiling algorithm for the TRMM precipitation radar. J. Meteorol. Soc. Jpn. 2009, 87A, 1–30. [Google Scholar] [CrossRef]
- Iguchi, T.; Seto, S.; Meneghini, R.; Yoshida, N.; Awaka, J.; Le, M.; Chandrasekar, V.; Brodzik, S.; Kubota, T. GPM/DPR Level-2 Algorithm Theoretical Basis Document (ATBD). 2018. Available online: https://gpm.nasa.gov/sites/default/files/2019-05/ATBD_DPR_201811_with_Appendix3b.pdf (accessed on 1 December 2024).
- Masaki, T.; Iguchi, T.; Kanemaru, K.; Furukawa, K.; Yoshida, N.; Kubota, T.; Oki, R. Calibration of the Dual-frequency Precipitation Radar (DPR) onboard the Global Precipitation Measurement (GPM) core observatory. IEEE Trans. Geosci. Remote 2021, 60, 5100116. [Google Scholar] [CrossRef]
- Kubota, T.; Seto, S.; Satoh, M.; Nasuno, T.; Iguchi, T.; Masaki, T.; Kwiatkowski, J.M.; Oki, R. Cloud assumption of precipitation retrieval algorithms for the Dual-Frequency Precipitation Radar. J. Atmos. Ocean. Technol. 2020, 37, 2015–2031. [Google Scholar] [CrossRef]
- Seto, S.; Iguchi, T.; Oki, T. The basic performance of a precipitation retrieval algorithm for the global precipitation measurement mission’s single/dual-frequency radar measurements. IEEE Trans. Geosci. Remote 2013, 51, 5239–5251. [Google Scholar] [CrossRef]
- Seto, S.; Iguchi, T.; Meneghini, R.; Awaka, J.; Kubota, T.; Masaki, T.; Takahashi, N. The precipitation rate retrieval algorithms for the GPM Dual-frequency Precipitation Radar. J. Meteorol. Soc. Jpn. Ser II 2021, 99, 205–237. [Google Scholar] [CrossRef]
- Yamamoto, M.K.; Kubota, T. Implementation of rainfall normalization module for GSMaP microwave imagers and sounders. Int. Geosci. Remote Sens. 2022, 14, 4445. [Google Scholar] [CrossRef]
- Janowiak, J.E.; Xie, P. CAMS-OPI: A global satellite-rain gauge merged product for real-time precipitation monitoring applications. J. Clim. 1999, 12, 3335–3342. [Google Scholar] [CrossRef]
- Calheiros, R.V.; Zawadzki, I. Reflectivity-rain rate relationships for radar hydrology in Brazil. J. Appl. Meteorol. Clim. 1987, 26, 118–132. [Google Scholar] [CrossRef]
- Atlas, D.; Rosenfeld, D.; Wolff, D.B. Climatologically tuned reflectivity-rain rate relations and links to area-time integrals. J. Appl. Meteorol. Clim. 1990, 29, 1120–1135. [Google Scholar] [CrossRef]
- Barrett, E.C.; Beaumont, M.J.; Brown, K.A.; Kidd, C. Development and Testing of SSM/I Rainfall Algorithms for Regional and Global Use; NA86AA-H-RA001, Final Report to the US Department of Commerce; ASM: Washington, DC, USA, 1991; 77p. [Google Scholar]
- Manobianco, J.; Koch, S.; Karyampudi, V.M.; Negri, A.J. The impact of assimilating satellite-derived precipitation rates on numerical simulations of the ERICA IOP 4 cyclone. Mon. Weather Rev. 1994, 122, 341–365. [Google Scholar] [CrossRef]
- Kidd, C.; Muller, C.L. The Combined Passive Microwave-Infrared (PMIR) Algorithm. In Satellite Rainfall Applications for Surface Hydrology, 1st ed.; Gebremichael, M., Hossain, F., Eds.; Springer: Dordrecht, The Netherlands, 2010; pp. 69–83. [Google Scholar] [CrossRef]
- Anagnostou, E.N.; Negri, A.J.; Adler, R.F. A satellite infrared technique for diurnal rainfall variability studies. J. Geophys. Res. 1999, 104, 31477. [Google Scholar] [CrossRef]
- Todd, M.C.; Kidd, C.; Kniveton, D.R.; Bellerby, T.J. A combined satellite infrared and passive microwave technique for estimation of small-scale rainfall. J. Atmos. Ocean Technol. 2001, 18, 742–755. [Google Scholar] [CrossRef]
- Marzano, F.S.; Palmacci, M.; Cimini, D.; Giuliani, G.; Turk, F.J. Multivariate statistical integration of satellite infrared and microwave radiometric measurements for rainfall retrieval at the geostationary scale. IEEE Trans. Geosci. Remote 2004, 42, 1018–1032. [Google Scholar] [CrossRef]
- Marzano, F.S.; Cimini, D.; Turk, F.J. Multivariate probability matching for microwave infrared combined rainfall algorithm (MICRA). In Measuring Precipitation From Space: EURAINSAT and the Future, 1st ed.; Levizzani, V., Bauer, P., Eds.; Springer: Dordrecht, The Netherlands, 2007; pp. 269–279. [Google Scholar] [CrossRef]
- Turk, F.J.; Mehta, A.V. Toward improvements in short-time scale satellite-derived precipitation estimates using blended satellite techniques. In Measuring Precipitation From Space: EURAINSAT and the Future, 1st ed.; Levizzani, V., Bauer, P., Eds.; Springer: Dordrecht, The Netherlands, 2007; pp. 281–290. [Google Scholar] [CrossRef]
- Xie, P.; Joyce, R.; Wu, S.; Yoo, S.H.; Yarosh, Y.; Sun, F.; Lin, R. Reprocessed, bias-corrected CMORPH global high-resolution precipitation estimates from 1998. J. Hydrometeorol. 2017, 18, 1617–1641. [Google Scholar] [CrossRef]
- Guo, R.; Liu, Y.; Zhou, H.; Zhu, Y. Precipitation downscaling using a probability-matching approach and geostationary infrared data: An evaluation over six climate regions. Hydrol. Earth. Syst. Sci. 2018, 22, 3685–3699. [Google Scholar] [CrossRef]
- Ushio, T.; Sasashige, K.; Kubota, T.; Shige, S.; Okamoto, K.; Aonashi, K.; Inoue, T.; Takahashi, N.; Iguchi, T.; Kachi, M.; et al. A kalman filter approach to the Global Satellite Mapping of Precipitation (GSMaP) from combined passive microwave and infrared radiometric data. J. Meteorol. Soc. Jpn. 2009, 87, 137–151. [Google Scholar] [CrossRef]
- Joyce, R.J.; Xie, P. Kalman Filter–Based CMORPH. J. Hydrometeorol. 2011, 12, 1547–1563. [Google Scholar] [CrossRef]
- Tan, J.; Huffman, G.J.; Bolvin, D.T.; Nelkin, E.J. IMERG V06: Changes to the morphing algorithm. J. Atmos. Ocean. Technol. 2019, 36, 2471–2482. [Google Scholar] [CrossRef]
- Behrangi, A.; Imam, B.; Hsu, K.; Sorooshian, S.; Bellerby, T.J.; Huffman, G.J. REFAME: Rain estimation using forward-adjusted advection of microwave estimates. J. Hydrometeorol. 2010, 11, 1305–1321. [Google Scholar] [CrossRef]
- Adler, R.F.; Negri, A.J.; Hakkarinen, I.M. Rain estimation from combining Geosychronous IR and low-orbit microwave data. Glob. Planet Change 1991, 4, 87–92. [Google Scholar] [CrossRef]
- Adler, R.F.; Huffman, G.J.; Keehn, R. Global tropical rain estimates from microwave-adjusted geosynchronous IR data. Remote Sens. Rev. 1994, 11, 125–152. [Google Scholar] [CrossRef]
- Huffman, G.J.; Adler, R.F.; Rudolf, B.; Chneider, U.; Keehn, P. Global precipitation estimates based on a technique for combining satellite-based estimates, rain gauge analysis, and NWP model precipitation information. J. Clim. 1995, 8, 1284–1295. [Google Scholar] [CrossRef]
- Huffman, G.J.; Adler, R.F.; Arkin, P.A.; Chang, A.; Ferraro, R.; Gruber, A.; Janowiak, J.; Mcnab, A.; Rudolf, B.; Schneider, U. The Global Precipitation Climatology Project (GPCP) combined precipitation data set. Bull. Am. Meteorol. Soc. 1997, 78, 5–20. [Google Scholar] [CrossRef]
- Adler, R.F.; Huffman, G.J.; Chang, A.; Ferraro, R.; Xie, P.P.; Janowiak, J.; Rudolf, B.; Schneider, U.; Curtis, S.; Bolvin, D.; et al. The version-2 global precipitation climatology project (GPCP) monthly precipitation analysis (1979-present). J. Hydrometeorol. 2003, 4, 1147–1167. [Google Scholar] [CrossRef]
- Adler, R.F.; Sapiano, M.R.P.; Huffman, G.J.; Wang, J.J.; Gu, G.J.; Bolvin, D.; Chiu, L.; Schneider, U.; Becker, A.; Nelkin, E.; et al. The Global Precipitation Climatology Project (GPCP) monthly analysis (New Version 2.3) and a review of 2017 global precipitation. Atmosphere 2018, 9, 138. [Google Scholar] [CrossRef]
- Kummerow, C.; Giglio, L. A method for combining passive microwave and infrared rainfall observations. J. Atmos. Ocean. Technol. 1995, 12, 33–45. [Google Scholar] [CrossRef]
- Xu, L.; Gao, X.; Sorooshian, S.; Arkin, P.A.; Imam, B. A microwave infrared threshold technique to improve the GOES precipitation index. J. Appl. Meteorol. 1999, 38, 569–579. [Google Scholar] [CrossRef]
- Duan, Z.; Bastiaanssen, W.G.M. First results from Version 7 TRMM 3B43 precipitation product in combination with a new downscaling–calibration procedure. Remote Sens. Environ. 2013, 131, 1–13. [Google Scholar] [CrossRef]
- Sorooshian, S.; Hsu, K.L.; Gao, X.; Gupta, H.V.; Imam, B.; Braithwaite, D. Evaluation of PERSIANN system satellite-based estimates of tropical rainfall. Bull. Am. Meteorol. Soc. 2000, 81, 2035–2046. [Google Scholar] [CrossRef]
- Hamshaw, S.D.; Dewoolkar, M.M.; Schroth, A.W.; Wemple, B.C.; Rizzo, D.M. A new machine-learning approach for classifying hysteresis in suspended-sediment discharge relationships using high-frequency monitoring data. Water Resour. Res. 2018, 54, 4040–4058. [Google Scholar] [CrossRef]
- Tao, Y.; Hsu, K.; Ihler, A.; Gao, X.; Sorooshian, S. A two-stage deep neural network framework for precipitation estimation from Bispectral satellite information. J. Hydrometeorol. 2018, 19, 393–408. [Google Scholar] [CrossRef]
- Tang, G.; Long, D.; Behrangi, A.; Wang, C.; Hong, Y. Exploring deep neural networks to retrieve rain and snow in high latitudes using multisensor and reanalysis data. Water Resour. Res. 2018, 54, 8253–8278. [Google Scholar] [CrossRef]
- Xie, P.; Arkin, P.A. Analyses of global monthly precipitation using gauge observations, satellite estimates, and numerical model predictions. J. Clim. 1996, 9, 840–858. [Google Scholar] [CrossRef]
- Xie, P.; Arkin, P.A. Global precipitation: A 17-year monthly analysis based on gauge observations, satellite estimates, and numerical model outputs. Bull. Am. Meteorol. Soc. 1997, 78, 2539–2558. [Google Scholar] [CrossRef]
- Vicente, G.A.; Anderson, J.R. A new rain retrieval technique that combines geosynchronous IR and MW polar orbit data for hourly rainfall estimates. Proceedings of 7th Conference Satellite Meteorology and Oceanography, Monterey, CA, USA, 6–10 June 1994; pp. 34–37. [Google Scholar]
- Miller, S.W.; Arkin, P.A.; Joyce, R. A combined microwave/infrared rain rate algorithm. Int. J. Remote Sens. 2001, 22, 3285–3307. [Google Scholar] [CrossRef]
- Kuligowski, R.J. A self-calibrating real-time GOES rainfall algorithm for short-term rainfall estimates. J. Hydrometeorol. 2002, 3, 112–130. [Google Scholar] [CrossRef]
- Vicente, G.A.; Scofield, R.A.; Menzel, W.P. The operational GOES infrared rainfall estimation technique. Bull. Am. Meteorol. Soc. 1998, 79, 1883–1898. [Google Scholar] [CrossRef]
- Kuligowski, R.J. The Self-Calibrating Multivariate Precipitation Retrieval (SCaMPR) for high-resolution, low-latency satellite-based rainfall estimates. In Satellite Rainfall Applications for Surface Hydrology, 1st ed.; Gebremichael, M., Hossain, F., Eds.; Springer: Dordrecht, The Netherlands, 2010; pp. 39–48. [Google Scholar] [CrossRef]
- Kuligowski, R.J.; Li, Y.; Zhang, Y. Impact of TRMM data on a low-latency, high-resolution precipitation algorithm for flash-flood forecasting. J. Appl. Meteorol. Clim. 2013, 52, 1379–1393. [Google Scholar] [CrossRef]
- Kuligowski, R.J.; Li, Y.; Yan, H.; Yu, Z. Improvements to the goes-r rainfall rate algorithm. J. Hydrometeorol. 2016, 17, 1693–1704. [Google Scholar] [CrossRef]
- Huffman, G.J.; Adler, R.F.; Bolvin, D.T.; Gu, G. Improving the global precipitation record: GPCP Version 2.1. Geophys. Res. Lett. 2009, 36, L17808. [Google Scholar] [CrossRef]
- Huffman, G.J.; Adler, R.F.; Morrissey, M.M.; Curtis, S.; Joyce, R.J.; McGavock, B.; Susskind, J. Global precipitation at one-degree daily resolution from multi-satellite observations. J. Hydrometeorol. 2001, 2, 36–50. [Google Scholar] [CrossRef]
- Xie, P.; Janowiak, J.E.; Arkin, P.A.; Adler, R.F.; Gruber, A.; Ferraro, R.R.; Huffman, G.J.; Curtis, S. GPCP pentad precipitation analyses: An experimental dataset based on gauge observations and satellite estimates. J. Clim. 2003, 16, 2197–2214. [Google Scholar] [CrossRef]
- Huffman, G.J.; Bolvin, D.T.; Braithwaite, D.; Hsu, K.; Joyce, R.; Kidd, C.; Nelkin, E.; Sorooshian, S.; Tan, J.; Xie, P.P. Reaching for 20 Years with the IMERG Multi-Satellite Products. Proceedings of American Meteorological Society (AMS) Annual Meeting, Boston, MA, USA, 12 January 2020; No. GSFC-E-DAA-TN78383. Available online: https://ntrs.nasa.gov/search.jsp?R=20200002265 (accessed on 1 December 2024).
- Ushio, T.; Kachi, M. Near real time product of the gauge adjusted GSMaP (GSMaP_Gauge_NRT). In Proceedings of the 2016 IEEE J-STARS Symposium (IGARSS), Beijing, China, 10–15 July 2016; pp. 3919–3922. [Google Scholar] [CrossRef]
- Mega, T.; Ushio, T.; Matsuda, T.; Kubota, T.; Kachi, M.; Oki, R. Gauge-adjusted global satellite mapping of precipitation. IEEE Trans. Geosci. Remote 2018, 57, 1928–1935. [Google Scholar] [CrossRef]
- Ashouri, H.; Hsu, K.L.; Sorooshian, S.; Braithwaite, D.K.; Knapp, K.R.; Cecil, L.D.; Prat, O.P. PERSIANN-CDR: Daily precipitation climate data record from multisatellite observations for hydrological and climate studies. Bull. Am. Meteorol. Soc. 2015, 96, 69–83. [Google Scholar] [CrossRef]
- Nguyen, P.; Ombadi, M.; Sorooshian, S.; Hsu, K.; AghaKouchak, A.; Braithwaite, D.; Thorstensen, A.R. The PERSIANN family of global satellite precipitation data: A review and evaluation of products. Hydrol. Earth. Syst. Sci. 2018, 22, 5801–5816. [Google Scholar] [CrossRef]
- Sadeghi, M.; Nguyen, P.; Naeini, M.R.; Hsu, K.L.; Braithwaite, D.; Sorooshian, S. PERSIANN-CCS-CDR, a 3-hourly 0.04° global precipitation climate data record for heavy precipitation studies. Sci. Data 2021, 8, 1–11. [Google Scholar] [CrossRef]
- Maggioni, V.; Sapiano, M.R.; Adler, R.F. Estimating uncertainties in high-resolution satellite precipitation products: Systematic or random error? J. Hydrometeorol. 2016, 17, 1119–1129. [Google Scholar] [CrossRef]
- Justice, C.; Belward, A.; Morisette, J.; Lewis, P.; Privette, J.; Baret, F. Developments in the \”validation\” of satellite sensor products for the study of the land surface. Int. J. Remote Sens. 2000, 21, 3383–3390. [Google Scholar] [CrossRef]
- Gebremichael, M. Framework for Satellite Rainfall Product Evaluation, in Rainfall: State of the Science. Am. Geophys. Union 2010, 191, 265–275. [Google Scholar] [CrossRef]
- Arkin, P.A.; Xie, P. The Global Precipitation Climatology Project: First algorithm intercomparison project. Bull. Am. Meteorol. Soc. 1994, 75, 401–419. [Google Scholar] [CrossRef]
- Barrett, E.C.; Adler, R.F.; Arpe, K.; Bauer, P.; Berg, W.; Chang, A.; Ferraro, R.; Ferriday, J.; Goodman, S.; Hong, Y.; et al. The first WetNet precipitation intercomparison project (PIP-1): Interpretation of results. Remote Sens. Rev. 1994, 11, 303–373. [Google Scholar] [CrossRef]
- Barrett, E.C.; Dodge, J.; Goodman, H.M.; Janowiak, J.; Kidd, C.; Smith, E.A. The first WetNet precipitation intercomparison project (PIP-1). Remote Sens. Rev. 1994, 11, 49–60. [Google Scholar] [CrossRef]
- Kniveton, D.R.; Motta, B.C.; Goodman, H.M.; Smith, M.; LaFontaine, F.J. The first Wetnet precipitation intercomparison project: Generation of results. Remote Sens. Rev. 1994, 11, 243–301. [Google Scholar] [CrossRef]
- Smith, E.A.; Lamm, J.E.; Adler, R.; Adler, R.; Alishouse, J.; Aonashi, K.; Barrett, E.; Bauer, P.; Berg, W.; Chang, A.; et al. Results of WetNet PIP-2 project. J. Atmos. Sci. 1998, 55, 1483–1536. [Google Scholar] [CrossRef]
- Adler, R.; Kidd, C.; Petty, G.; Morissey, M.; Goodman, H.M. Intercomparison of global precipitation products: The third Precipitation Intercomparison Project (PIP-3). Bull. Am. Meteorol. Soc. 2000, 82, 1377–1396. [Google Scholar] [CrossRef]
- Arkin, P.; Turk, J.; Ebert, B.; Bauer, P.; Sapiano, M. Evaluation of high resolution precipitation forecasts and analyses from satellite observations. AGU Fall Meet. Abstr. 2006, 2006, H32A-04. [Google Scholar]
- Ebert, E.E.; Janowiak, J.E.; Kidd, C. Comparison of near-real-time precipitation estimates from satellite observations and numerical models. Bull. Am. Meteorol. Soc. 2007, 88, 47–64. [Google Scholar] [CrossRef]
- Gottschalck, J.; Meng, J.; Rodell, M.; Houser, P. Analysis of multiple precipitation products and preliminary assessment of their impact on global land data assimilation system land surface states. J. Hydrometeorol. 2005, 6, 573–598. [Google Scholar] [CrossRef]
- Brown, J.E. An analysis of the performance of hybrid infrared and microwave satellite precipitation algorithms over India and adjacent regions. Remote Sens. Environ. 2006, 101, 63–81. [Google Scholar] [CrossRef]
- Skofronick-Jackson, G.; Hudak, D.; Petersen, W.; Nesbitt, S.W.; Chandrasekar, V.; Durden, S.; Gleicher, K.J.; Huang, G.; Joe, P.; Kollias, P.; et al. Global precipitation measurement cold season precipitation experiment (GCPEX): For measurement sake, let it snow. Bull. Am. Meteorol. Soc. 2015, 96, 1719–1741. [Google Scholar] [CrossRef]
- Petersen, W.; Houze, J.R.; McMurdie, L.A. GPM Ground Validation OLYMPEX Field Campaign Data Collection; NASA EOSDIS Global Hydrology Resource Center Distributed Active Archive Center: Huntsville, AL, USA, 2018. [Google Scholar] [CrossRef]
- Anagnostou, E.N.; Maggioni, V.; Nikolopoulos, E.I.; Meskele, T.; Hossain, F.; Papadopoulos, A. Benchmarking high-resolution global satellite rainfall products to radar and rain-gauge rainfall estimates. IEEE Trans. Geosci. Remote 2009, 48, 1667–1683. [Google Scholar] [CrossRef]
- Schwaller, M.R.; Morris, K.R. A ground validation network for the global precipitation measurement mission. J. Atmos. Ocean Technol. 2011, 28, 301–319. [Google Scholar] [CrossRef]
- Stevenson, S.N.; Schumacher, R.S. A 10-year survey of extreme rainfall events in the central and eastern United States using gridded multisensor precipitation analyses. Mon. Weather Rev. 2014, 142, 3147–3162. [Google Scholar] [CrossRef]
- Kidd, C.; Bauer, P.; Turk, J.; Xie, G.J.; Joyce, R.; Hsu, K.L.; Braithwaite, D. Intercomparison of high-resolution precipitation products over northwest Europe. J. Hydrometeorol. 2012, 13, 67–82. [Google Scholar] [CrossRef]
- Li, Z.; Yang, D.; Hong, Y. Multi-scale evaluation of high-resolution multi-sensor blended global precipitation products over the Yangtze river. J. Hydrol. 2013, 500, 157–169. [Google Scholar] [CrossRef]
- Prakash, S.; Sathiyamoorthy, V.; Mahesh, C.; Gairola, R.M. An evaluation of high-resolution multisatellite rainfall products over the Indian monsoon region. Int. J. Remote Sens. 2014, 35, 3018–3035. [Google Scholar] [CrossRef]
- Tan, M.L.; Santo, H. Comparison of GPM IMERG, TMPA 3B42 and PERSIANN-CDR satellite precipitation products over Malaysia. Atmos. Res. 2018, 202, 63–76. [Google Scholar] [CrossRef]
- Yu, C.; Hu, D.; Liu, M.; Wang, S.; Di, Y. Spatio-temporal accuracy evaluation of three high-resolution satellite precipitation products in China area. Atmos. Res. 2020, 241, 104952. [Google Scholar] [CrossRef]
- Tang, G.; Clark, M.P.; Papalexiou, S.M.; Ma, Z.; Hong, Y. Have satellite precipitation products improved over last two decades? A comprehensive comparison of GPM IMERG with nine satellite and reanalysis datasets. Remote Sens. Environ. 2020, 240, 111697. [Google Scholar] [CrossRef]
- Guilloteau, C.; Foufoula-Georgiou, E.; Kirstetter, P.; Tan, J.; Huffman, G.J. How well do multisatellite products capture the space-time dynamics of precipitation? Part I: Five products assessed via a wavenumber-frequency decomposition. J. Hydrometeorol. 2021, 22, 2805–2823. [Google Scholar] [CrossRef]
- Guilloteau, C.; Foufoula-Georgiou, E.; Kirstetter, P.E.; Tan, J.; Huffman, G.J. How Well do Multisatellite Products Capture the Space-Time Dynamics of Precipitation? Part II: Building an Error Model Through Spectral System Identification. J. Hydrometeorol. 2022, 23, 1383–1399. [Google Scholar] [CrossRef]
- Ayugi, B.O.; Chung, E.S.; Babaousmail, H.; Sian, K.T. Characterizing the performances of different observational precipitation products and their uncertainties over Africa. Environ. Res. Lett. 2024, 19, 64009. [Google Scholar] [CrossRef]
- Kim, K.; Park, J.; Baik, J.; Choi, M. Evaluation of topographical and seasonal feature using GPM IMERG and TRMM 3B42 over far-east Asia. Atmos. Res. 2016, 187, 95–105. [Google Scholar] [CrossRef]
- Dinku, T.; Ceccato, P.; Grover-Kopec, E.; Lemma, M.; Connor, S.J.; Ropelewski, C.F. Validation of satellite rainfall products over East Africa’s complex topography. Int. J. Remote Sens. 2007, 28, 1503–1526. [Google Scholar] [CrossRef]
- Hirpa, F.A.; Gebremichael, M.; Hopson, T. Evaluation of high-resolution satellite precipitation products over very complex terrain in Ethiopia. J. Appl. Meteorol. Clim. 2010, 49, 1044–1051. [Google Scholar] [CrossRef]
- Romilly, T.G.; Gebremichael, M. Evaluation of satellite rainfall estimates over Ethiopian river basins. Hydrol. Earth Syst. Sci. 2011, 15, 1505–1514. [Google Scholar] [CrossRef]
- Thiemig, V.; Rojas, R.; Zambrano-Bigiarini, M.; Levizzani, V.; De Roo, A. Validation of satellite-based precipitation products over sparsely gauged African river basins. J. Hydrometeorol. 2012, 13, 1760–1783. [Google Scholar] [CrossRef]
- Anjum, M.N.; Ding, Y.; Shangguan, D.; Ahmad, I.; Ijaz, M.W.; Farid, H.U.; Yagoub, Y.E.; Zaman, M.; Adnan, M. Performance evaluation of latest integrated multi-satellite retrievals for global precipitation measurement (IMERG) over the northern highlands of Pakistan. Atmos. Res. 2018, 205, 134–146. [Google Scholar] [CrossRef]
- Habib, E.; Henschke, A.; Adler, R.F. Evaluation of TMPA satellite-based research and real-time rainfall estimates during six tropical-related heavy rainfall events over Louisiana, USA. Atmos. Res. 2009, 94, 373–388. [Google Scholar] [CrossRef]
- Aghakouchak, A.; Behrangi, A.; Sorooshian, S.; Hsu, K.; Amitai, E. Evaluation of satellite-retrieved extreme precipitation rates across the central united states. J. Geophys. Res. Atmos. 2011, 116, D02115. [Google Scholar] [CrossRef]
- Stampoulis, D.; Anagnostou, E.N.; Nikolopoulos, E.I. Assessment of high-resolution satellite-based rainfall estimates over the mediterranean during heavy precipitation events. J. Hydrometeorol. 2013, 14, 1500–1514. [Google Scholar] [CrossRef]
- Miao, C.; Ashouri, H.; Hsu, K.; Sorooshian, S.; Duan, Q. Evaluation of the PERSIANN-CDR daily rainfall Estimates in capturing the behavior of extreme precipitation events over China. J. Hydrometeorol. 2015, 16, 1387–1396. [Google Scholar] [CrossRef]
- He, Z.; Yang, L.; Tian, F.; Ni, G.; Hou, A.; Lu, H. Intercomparisons of rainfall estimates from TRMM and GPM multisatellite products over the upper Mekong River basin. J. Hydrometeorol. 2017, 18, 413–430. [Google Scholar] [CrossRef]
- Fang, J.; Yang, W.; Luan, Y.; Du, J.; Lin, A.; Zhao, L. Evaluation of the TRMM 3B42 and GPM IMERG products for extreme precipitation analysis over China. Atmos. Res. 2019, 223, 24–38. [Google Scholar] [CrossRef]
- Yuan, S.; Zhu, L.; Quiring, S.M. Comparison of two multi-satellite algorithms for estimation of tropical cyclone precipitation in the United States and Mexico: TMPA and IMERG. J. Hydrometeorol. 2021, 22, 923–939. [Google Scholar] [CrossRef]
- Li, D.; Min, X.; Xu, J.; Xue, J.; Shi, Z. Assessment of three gridded satellite-based precipitation products and their performance variabilities during typhoons over Zhejiang, southeastern China. J. Hydrol. 2022, 610, 127985. [Google Scholar] [CrossRef]
- Gao, Y.C.; Liu, M.F. Evaluation of high-resolution satellite precipitation products using rain gauge observations over the Tibetan Plateau. Hydrol. Earth Syst. Sci. 2013, 17, 837–849. [Google Scholar] [CrossRef]
- Asong, Z.E.; Razavi, S.; Wheater, H.S.; Wong, J.S. Evaluation of Integrated Multisatellite Retrievals for GPM (IMERG) over Southern Canada against ground precipitation observations: A preliminary assessment. J. Hydrometeorol. 2016, 18, 1033–1050. [Google Scholar] [CrossRef]
- Tian, Y.; Peters-Lidard, C.D. A global map of uncertainties in satellite-based precipitation measurements. Geophys. Res. Lett. 2010, 37, L24407. [Google Scholar] [CrossRef]
- Yong, B.; Liu, D.; Gourley, J.J.; Tian, Y.; Huffman, G.J.; Ren, L.; Hong, Y. Global view of real-time TRMM multisatellite precipitation analysis: Implications for its successor global precipitation measurement mission. Bull. Am. Meteorol. Soc. 2015, 96, 283–296. [Google Scholar] [CrossRef]
- Bowman, K.P. Comparison of TRMM precipitation retrievals with rain gauge data from ocean buoys. J. Clim. 2005, 18, 178–190. [Google Scholar] [CrossRef]
- Guo, R.; Liu, Y. validation of satellite precipitation products with rain gauge data at different scales: Implications for hydrological applications. Water 2016, 8, 281. [Google Scholar] [CrossRef]
- Gebremichael, M.; Krajewski, W.F.; Morrissey, M.L.; Huffman, G.J.; Adler, R.F. A detailed evaluation of GPCP 1 daily rainfall estimates over the Mississippi River Basin. J. Appl. Meteorol. 2005, 44, 665–681. [Google Scholar] [CrossRef]
- Zeweldi, D.A.; Gebremichael, M. Evaluation of CMORPH precipitation products at fine space–time scales. J. Hydrometeorol. 2009, 10, 300–307. [Google Scholar] [CrossRef]
- Fan, X.; Liu, Y. A generalized model for intersensor ndvi calibration and its comparison with regression approaches. IEEE Trans. Geosci. Remote 2017, 55, 1842–1852. [Google Scholar] [CrossRef]
- Taylor, K.E. Summarizing multiple aspects of model performance in a single diagram. J. Geophys. Res. 2001, 106, 7183–7192. [Google Scholar] [CrossRef]
- Loew, A.; Bell, W.; Brocca, L.; Bulgin, C.E.; Burdanowitz, J.; Calbet, X.; Donner, R.V.; Ghent, D.; Gruber, A.; Kaminski, T.; et al. Validation practices for satellite based earth observation data across communities. Rev. Geophys. 2017, 55, 779–817. [Google Scholar] [CrossRef]
- Krajewski, W.F. Ground Networks: Are we doing the right thing. In Measuring Precipitation From Space: EURAINSAT and the Future, 1st ed.; Levizzani, V., Bauer, P., Eds.; Springer: Dordrecht, The Netherlands, 2007; pp. 403–417. Available online: https://link.springer.com/chapter/10.1007/978-1-4020-5835-6_32 (accessed on 1 December 2024).
- Alemohammad, S.H.; McColl, K.A.; Konings, A.G.; Entekhabi, D.; Stoffelen, A. Characterization of precipitation product errors across the United States using multiplicative triple collocation. Hydrol. Earth Syst. Sci. 2015, 19, 3489–3503. [Google Scholar] [CrossRef]
- Tang, G. Characterization of the systematic and random errors in satellite precipitation using the multiplicative error model. IEEE Trans. Geosci. Remote 2020, 59, 5407–5416. [Google Scholar] [CrossRef]
- Tang, S.; Li, R.; He, J. Modeling and evaluating systematic and random errors in multiscale GPM IMERG summer precipitation estimates over the Sichuan Basin. IEEE J. Sel. Top. Appl. Earth Obs. Remote Sens. 2021, 14, 4709–4719. [Google Scholar] [CrossRef]
- Chambon, P.; Jobard, I.; Roca, R.; Viltard, N. An investigation of the error budget of tropical rainfall accumulation derived from merged passive microwave and infrared satellite measurements. Q. J. R. Meteorol. Soc. 2013, 139, 879–893. [Google Scholar] [CrossRef]
- Ayat, H.; Evans, J.P.; Behrangi, A. How do different sensors impact IMERG precipitation estimates during hurricane days? Remote Sens. Environ. 2021, 259, 112417. [Google Scholar] [CrossRef]
- Li, Y.; Zhang, K.; Bardossy, A.; Shen, X.; Cheng, Y. Evaluation and error decomposition of IMERG product based on multiple satellite sensors. Remote Sens. 2023, 15, 1710. [Google Scholar] [CrossRef]
- Kirstetter, P.E.; Karbalaee, N.; Hsu, K.; Hong, Y. Probabilistic precipitation rate estimates with space-based infrared sensors. Q. J. R. Meteorol. Soc. 2018, 144, 191–205. [Google Scholar] [CrossRef]
- Gebregiorgis, A.S.; Kirstetter, P.E.; Hong, Y.E.; Gourley, J.J.; Huffman, G.J.; Petersen, W.A.; Xue, X.; Schwaller, M.R. To what extent is the day 1 GPM IMERG satellite precipitation estimate improved as compared to TRMM TMPA-RT? J. Geophys. Res. Atmos. 2018, 123, 1694–1707. [Google Scholar] [CrossRef]
- Sunilkumar, K.; Rao, T.N.; Saikranthi, K.; Rao, M.P. Comprehensive evaluation of multisatellite precipitation estimates over India using gridded rainfall data. J. Geophys. Res. Atmos. 2015, 120, 8987–9005. [Google Scholar] [CrossRef]
- Fan, X.; Liu, Y. Multisensor normalized difference vegetation index intercalibration: A comprehensive overview of the causes of and solutions for multisensor differences. IEEE Trans. Geosci. Remote 2018, 6, 23–45. [Google Scholar] [CrossRef]
- AghaKouchak, A.; Mehran, A.; Norouzi, H.; Behrangi, A. Systematic and random error components in satellite precipitation data sets. Geophys. Res. Lett. 2012, 39, L09406. [Google Scholar] [CrossRef]
- Tian, Y.; Peters-Lidard, C.D.; Adler, R.F.; Kubota, T.; Ushio, T. Evaluation of GSMaP precipitation estimates over the contiguous United States. J. Hydrometeorol. 2010, 11, 566–574. [Google Scholar] [CrossRef]
- Chen, S.; Hong, Y.; Gourley, J.J.; Huffman, G.J.; Tian, Y.; Cao, Q.; Yong, B.; Kirstetter, P.E.; Hu, J.; Hardy, J.; et al. Evaluation of the successive V6 and V7 TRMM multisatellite precipitation analysis over the Continental United States. Water Resour. Res. 2013, 49, 8174–8186. [Google Scholar] [CrossRef]
- Dehaghani, A.M.; Gohari, A.; Zareian, M.J.; Haghighi, A.T. A comprehensive evaluation of the satellite precipitation products across Iran. J. Hydrol. Reg. Stud. 2023, 46, 101360. [Google Scholar] [CrossRef]
- Guo, H.; Bao, A.; Ndayisaba, F.; Liu, T.; Kurban, A.; Philippe, D.M. Systematical evaluation of satellite precipitation estimates over central Asia using an improved error-component procedure. J. Geophys. Res. Atmos. 2017, 122, 10–906. [Google Scholar] [CrossRef]
- Dinku, T.; Connor, S.J.; Ceccat, P. Comparison of CMORPH and TRMM-3B42 over mountainous regions of Africa and South America. In Satellite Rainfall Applications for Surface Hydrology, 1st ed.; Gebremichael, M., Hossain, F., Eds.; Springer: Dordrecht, The Netherlands, 2010; pp. 193–204. [Google Scholar] [CrossRef]
- Salio, P.; Hobouchiand, M.P.; Skabar, Y.G.; Vila, D. Evaluation of high-resolution satellite precipitation estimates over southern South America using a dense rain gauge network. Atmos. Res. 2015, 163, 146–161. [Google Scholar] [CrossRef]
- Tian, Y.; Peters-Lidard, C.D.; Eylander, J.B.; Joyce, R.J.; Huffman, G.J.; Adler, R.F.; Hsu, K.L.; Turk, F.J.; Garcia, M.; Zeng, J. Component analysis of errors in satellite-based precipitation estimates. J. Geophys. Res. Atmos. 2009, 114, 1–15. [Google Scholar] [CrossRef]
- Zhu, Z.; Yong, B.; Ke, L.; Wang, G.; Ren, L.; Chen, X. Tracing the error sources of global satellite mapping of precipitation for GPM (GPM-GSMaP) over the Tibetan Plateau, China. IEEE J. Sel. Top. Appl. Earth Obs. Remote Sens. 2018, 11, 2181–2191. [Google Scholar] [CrossRef]
- Chen, H.; Yong, B.; Gourly, J.J.; Liu, J.; Ren, L.; Wang, W.; Hong, Y.; Zhang, J. Impact of the crucial geographical and climatic factors on the input source errors of GPM-based global satellite precipitation estimates. J. Hydrol. 2019, 575, 1–16. [Google Scholar] [CrossRef]
- Sui, X.; Li, Z.; Ma, Z.; Xu, J.; Zhu, S.; Liu, H. Ground validation and error sources identification for GPM IMERG product over the southeast coastal regions of China. Remote Sens. 2000, 12, 4154. [Google Scholar] [CrossRef]
- Li, Z.; Tang, G.; Kirstetter, P.; Gao, S.; Li, J.L.; Wen, Y.; Hong, Y. Evaluation of GPM IMERG and its constellations in extreme events over the conterminous United States. J. Hydrol. 2022, 606, 127357. [Google Scholar] [CrossRef]
- Foufoula-Georgiou, E.; Guilloteau, C.; Nguyen, P.; Aghakouchak, A.; Hsu, K.; Busalacchi, A.; Turk, F.J.; Peters-Lidard, C.; Oki, T.; Duan, Q.; et al. Advancing Precipitation Estimation, Prediction and Impact Studies. Bull. Am. Meteorol. Soc. 2020, 101, E1584–E1592. [Google Scholar] [CrossRef]
- Kummerow, C.D.; Berg, W.; Thomas-Stahle, J.; Masunaga, H. Quantifying global uncertainties in a simple microwave rainfall algorithm. J. Atmos. Ocean. Technol. 2006, 23, 23–37. [Google Scholar] [CrossRef]
- IPWG. 11th Workshop of International Precipitation Working Group, Tokyo, Japan, 15–18 July 2024; Available online: https://www.eorc.jaxa.jp/IPWG/meetings/tokyo-2024/Tokyo2024.html (accessed on 1 December 2024).
- Tan, J.; Petersen, W.A.; Kirstetter, P.E.; Tian, Y. Performance of IMERG as a function of spatiotemporal scale. J. Hydrometeorol. 2017, 18, 307–319. [Google Scholar] [CrossRef]
- Zhang, P.; Gu, S.; Chen, L.; Shang, J.; Lin, M.; Zhu, A.; Yin, H.; Wu, Q.; Shou, Y.; Sun, F.; et al. FY-3G Satellite Instruments and Precipitation Products: First Report of China’s Fengyun Rainfall Mission In-Orbit. J. Remote Sens. 2023, 3, 97. [Google Scholar] [CrossRef]


| Theme | References |
|---|---|
| VIS/IR | [31] |
| PMW | [18,32,33] |
| VIS/IR, PMW | [8,34,35,36,37] |
| VIS/IR, PMW, AMW, MPE | [38,39,40,41,42,43,44,45,46,47,48,49,50,51] |
| Products | [52,53,54] |
| Validation | [55,56,57,58] |
| Applications | [15,59] |
| Programs/Projects | [60,61,62,63,64,65] |
| Books | [66,67,68] |
| Satellite | Sensor | IFOV at Nadir (km) | Revisit Time | Agency | Temporal Coverage | Source |
|---|---|---|---|---|---|---|
| GOES 1–19 | VISSR, VAS, Imager, ABI | 2–6.9 (IR) | 15–30 min | NOAA/ NASA | 1975–present | https://www.goes-r.gov/products/samples.html (accessed on 1 December 2024) |
| Meteosat 1–11 (MOP/ MSG/MTG) | MVIRI, SEVIRI | 3–5 (IR) | 15–25 min | ESA/ EUMETSAT | 1977–present | https://space.skyrocket.de/directories/sat_met_eur.htm (accessed on 1 December 2024) |
| Himawari (GMS/ MTSAT) | VISSR, JAMI, Imager, AHI | 2–5 (IR) | 10–30 min | JMA/JCAB/ JAXA | 1977–present | http://www.data.jma.go.jp/mscweb/en/index.html (accessed on 18 Decem-ber 2024) |
| FY | VISSR-1/2, AGRI | 4–5.76 (IR) | 15–30 min | CMA/ NRSCC | 1997–present | http://data.nsmc.org.cn/DataPortal/en/home/index.html (accessed on 1 December 2024) |
| DMSP | SSM/I, SSMIS | 11–73 km (19–183 GHz), 28 × 37 km (37 GHz), 13 × 15 km (85 GHz) | × | DoD/NOAA | 1987–present | https://rammb.cira.colostate.edu/dev/hillger/DMSP.html (accessed on 1 December 2024) |
| TRMM | TMI | 4–37 km (10–86 GHz) | × | NASA/ JAXA | 1997–2015.04 | https://gpm.nasa.gov/missions/TRMM/satellite (accessed on 1 December 2024) |
| PR | 5 km (13.8 GHz) | |||||
| NOAA | AMSU-B, MHS, ATMS | 16–75 km (23–183 GHz), | × | NASA/ NOAA | 1998–present | https://www.nesdis.noaa.gov/our-satellites/related-information/history-of-noaa-satellites (accessed on 1 December 2024) |
| Aqua | AMSR-E | 4–75 km (6.9–89 GHz) | × | NASA | 2002.06–2011.10 | https://aqua.nasa.gov/content/amsr-e (accessed on 1 December 2024) |
| METOP | MHS(A–C) | 16 × 16 km (89–190 GHz) | × | EUMETSAT/ESA | 2006– present | https://space.skyrocket.de/doc_sdat/metop.htm (accessed on 1 December 2024) |
| S-NPP | ATMS | 16–75 km (23–183 GHz) | × | NASA/ NOAA | 2011– present | https://rammb.cira.colostate.edu/projects/npp/ (accessed on 1 December 2024) |
| Megha-Tropiques | SAPHIR | 10 × 10 km (183 GHz) | × | CNES/ ISRO/ | 2011– present | https://space.skyrocket.de/doc_sdat/megha-tropiques.htm (accessed on 1 December 2024) |
| GCOM-W1 | AMSR-2 | 3–62 km (7–89 GHz) | × | JAXA | 2012–present | https://suzaku.eorc.jaxa.jp/GCOM_W/w_amsr2/amsr2_body_main.html (accessed on 1 December 2024) |
| GPMCO | GMI | 4–32 km (10–183 GHz) | × | NASA/ JAXA | 2014– present | https://gpm.nasa.gov/missions/GPM (accessed on 1 December 2024) |
| DPR | 5 × 7 km (13.6, 36.5 GHz) |
| Methodology | Advantages | Limitations | Usage in SPEs |
|---|---|---|---|
| Cloud motion | Assumption: no relation between IR Tb and underlying rainfall | Assumption: precipitation linearly evolves during the time between PMW images; ground rainfall and cloud tops move at different speeds. | IMERG, MORPH, GSMaP |
| Probability matching | Latency of PMW data less critical; a reasonable measure of cloud movement; Computationally fast | Indirectness of the IR to sense rainfall itself; subjective rain-no-rain threshold | TMPA, AGPI, PERSIANN-CCS, CMORPH-CDR |
| Adjustment ratio | GPCP | ||
| Regression-based | MIRRA; SCaMPR | ||
| neural network | PERSIANN, IMERG | ||
| Weighted average | Flexible input data | Definitions of the bias and error structures | GPCP, CMAP |
Disclaimer/Publisher’s Note: The statements, opinions and data contained in all publications are solely those of the individual author(s) and contributor(s) and not of MDPI and/or the editor(s). MDPI and/or the editor(s) disclaim responsibility for any injury to people or property resulting from any ideas, methods, instructions or products referred to in the content. |
© 2024 by the authors. Licensee MDPI, Basel, Switzerland. This article is an open access article distributed under the terms and conditions of the Creative Commons Attribution (CC BY) license (https://creativecommons.org/licenses/by/4.0/).
Share and Cite
Guo, R.; Fan, X.; Zhou, H.; Liu, Y. Multi-Sensor Precipitation Estimation from Space: Data Sources, Methods and Validation. Remote Sens. 2024, 16, 4753. https://doi.org/10.3390/rs16244753
Guo R, Fan X, Zhou H, Liu Y. Multi-Sensor Precipitation Estimation from Space: Data Sources, Methods and Validation. Remote Sensing. 2024; 16(24):4753. https://doi.org/10.3390/rs16244753
Chicago/Turabian StyleGuo, Ruifang, Xingwang Fan, Han Zhou, and Yuanbo Liu. 2024. "Multi-Sensor Precipitation Estimation from Space: Data Sources, Methods and Validation" Remote Sensing 16, no. 24: 4753. https://doi.org/10.3390/rs16244753
APA StyleGuo, R., Fan, X., Zhou, H., & Liu, Y. (2024). Multi-Sensor Precipitation Estimation from Space: Data Sources, Methods and Validation. Remote Sensing, 16(24), 4753. https://doi.org/10.3390/rs16244753