1. Introduction
As attitude sensors, star cameras have the advantages of high accuracy, light mass, low power consumption, no drift, and multiple operating modes [
1,
2]. Due to their small field of view and long focal length, these cameras have a higher measurement accuracy than other types of star sensors. They are widely used in aerospace technology fields such as Earth remote sensing, Earth measurement, planetary exploration, planetary mapping, interstellar communication, and intercontinental missiles [
3,
4,
5]. In view of the high precision requirements, they are very sensitive to temperature changes [
6]. The external heat flux of the camera, particularly due to periodic variations in solar radiation, can lead to temperature fluctuations that ultimately affect the measurement accuracy of the optical system [
7].
These fluctuations can cause the expansion or contraction of various components within the optical system, resulting in changes in focal length and principal point position [
8,
9]. This not only affects the imaging quality of the optical system but also impacts the overall structural stability [
10,
11]. Through the combination of finite element analysis and optical tracking methods, Liu Haibo and Tan Wei et al. [
12,
13] determined the relationship between the temperature distribution of the star camera and the attitude measurement error, which provided theoretical support for the thermal design of a star camera optical system. Hu Xiongchao et al. [
14] discussed and studied the influence of temperature on the lens distortion of star cameras, and they proposed a method to measure the effect of temperature on the measurement error of star points, in addition to a method to compensate for this effect. Podbreznik et al. [
15] found that when the camera temperature increases, the images and parameters used in the imaging model change, and a model to eliminate the measurement error caused by certain temperature conditions was thus proposed. Jiang Guangwen [
16] studied the temperature effect and a method to eliminate this effect in camera measurements by combining semi-physical simulations and finite element analysis. In summary, the influence of the thermal deformation of star cameras cannot be ignored. However, current research mainly focuses on the effect of the deformation of star sensors’ optical systems on imaging. Therefore, to ensure the high precision of star sensors, it is necessary to carry out comprehensive on-orbit thermal stability and thermal control analyses. These analyses should not only consider the components of the optical system but should also consider the installation, actual operations in the on-orbit environment, and the interaction with other devices. Guan Zhichao [
17,
18] and Tang Yujie [
19] also mentioned that the precise installation relationship between the star camera and the star sensor is a key factor in the geometric positioning accuracy of optical remote sensing satellites.
In this study, thermal design and thermal deformation analyses are performed for a star camera that is about to be launched on a satellite platform. The attitude accuracy requirement for the camera is less than 1″. Through simulation analysis and experimental research, the thermal deformation factors affecting the on-orbit attitude measurement error of the star camera are analyzed. The main error sources during installation of the camera are identified and quantitatively analyzed. In addition, the thermal balance test and on-orbit temperature measurement are completed and compared with the thermal simulation analysis results, aiming to guide the thermal stability analysis of the star camera.
2. Structure of the Star Camera
2.1. The Overall Structure of the Star Camera
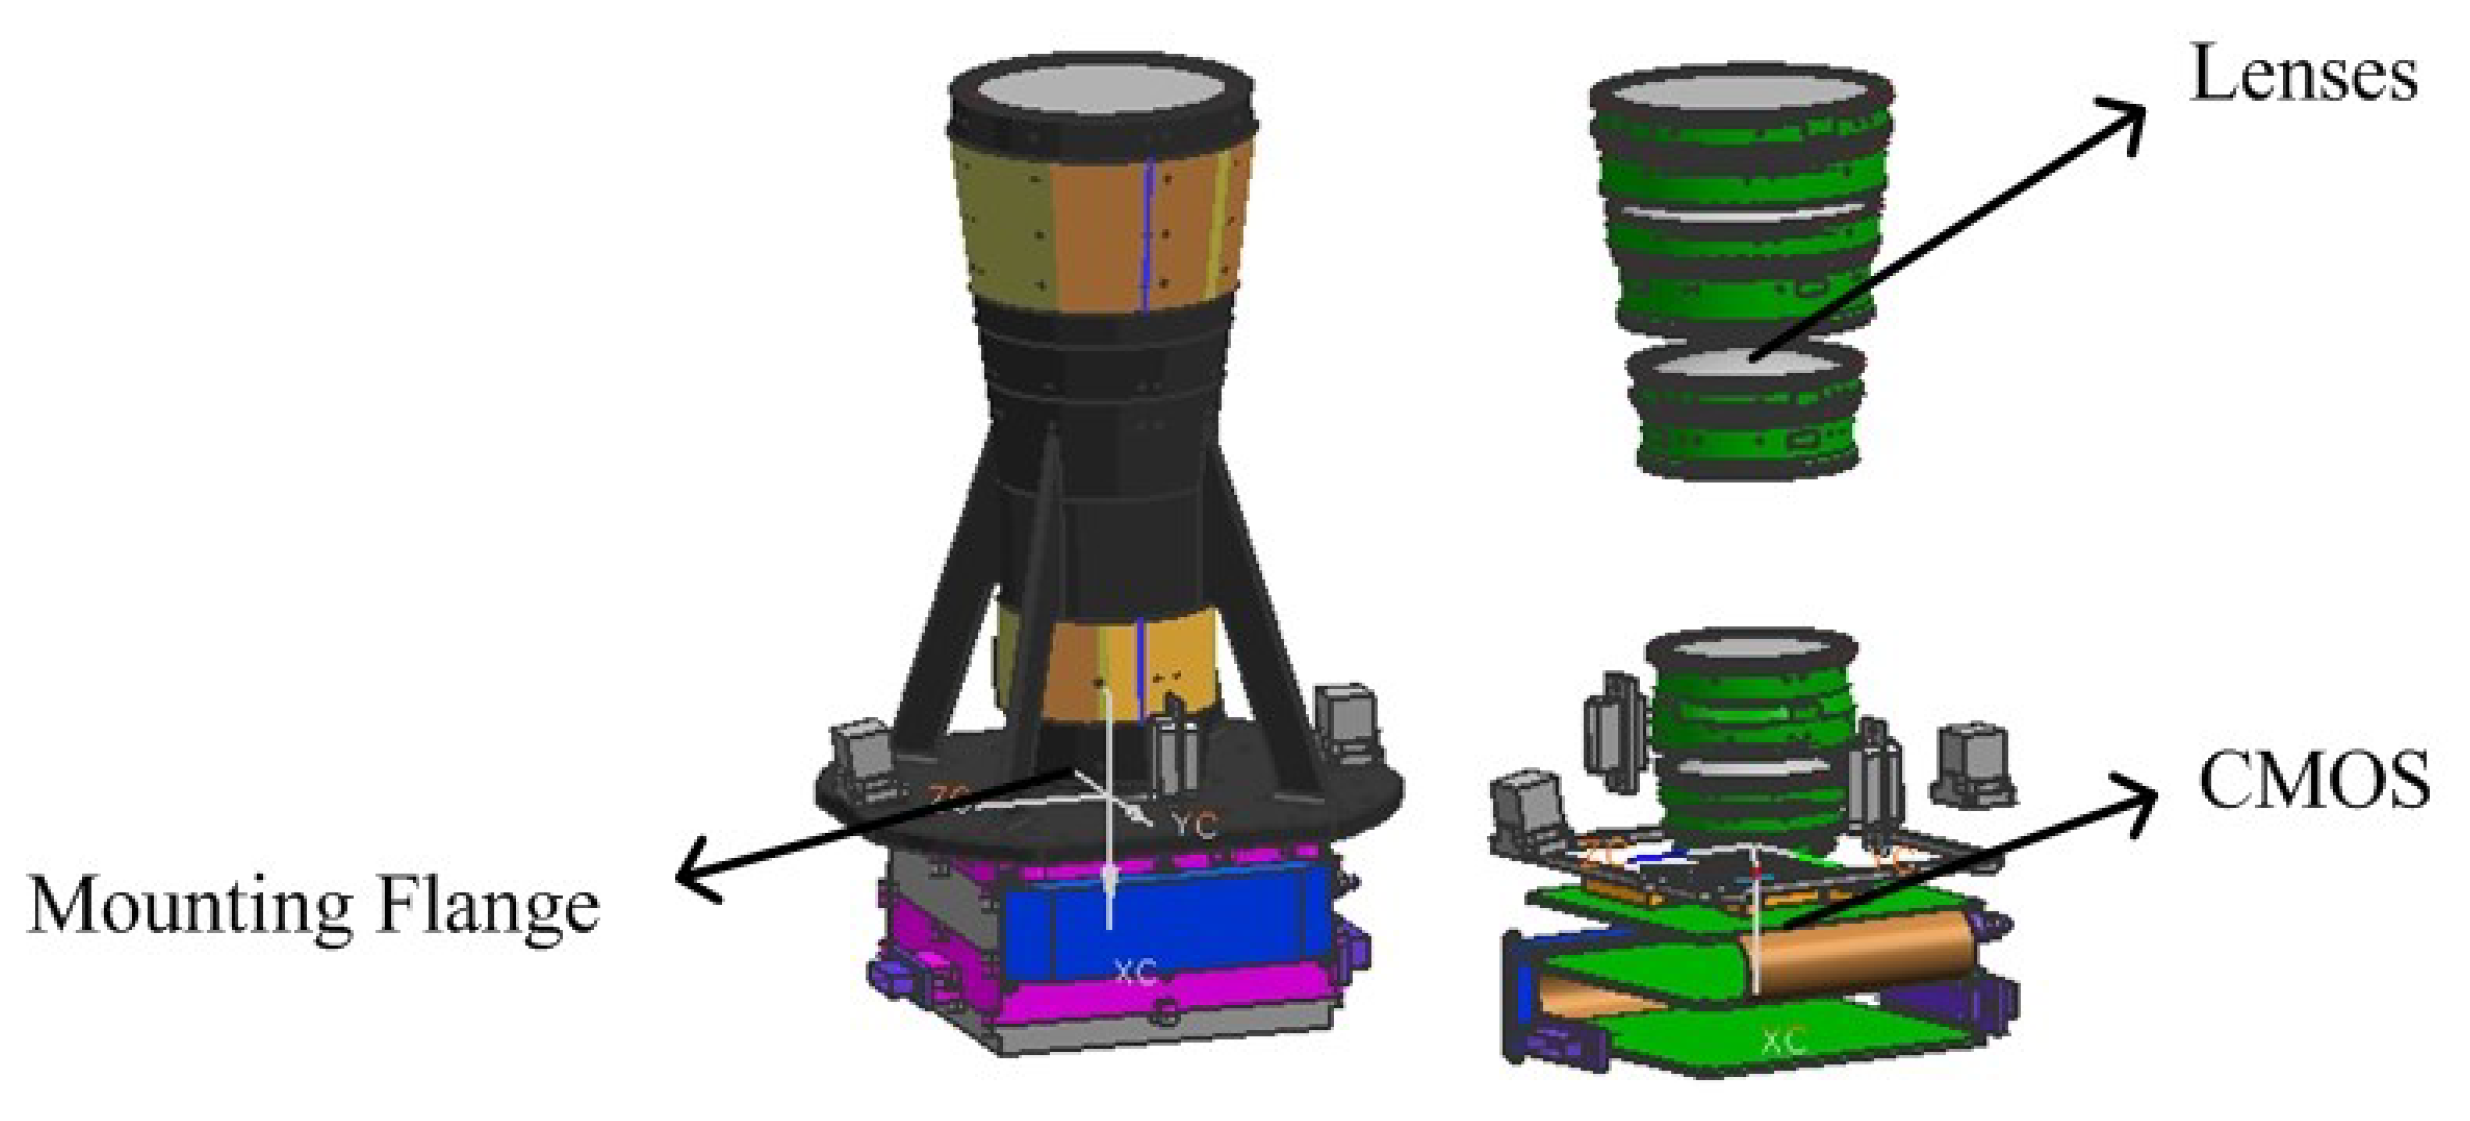
The star camera consists of a baffle, a lens tube, a mounting flange, CMOS components, and an electronics assembly. The lens tube and the mounting flange have integrated casting. The lens group and the electronics assembly are located in the upper and lower parts of the mounting flange, respectively. The main structure of the star camera without the baffle is shown in
Figure 1.
2.2. Optical System of the Star Camera
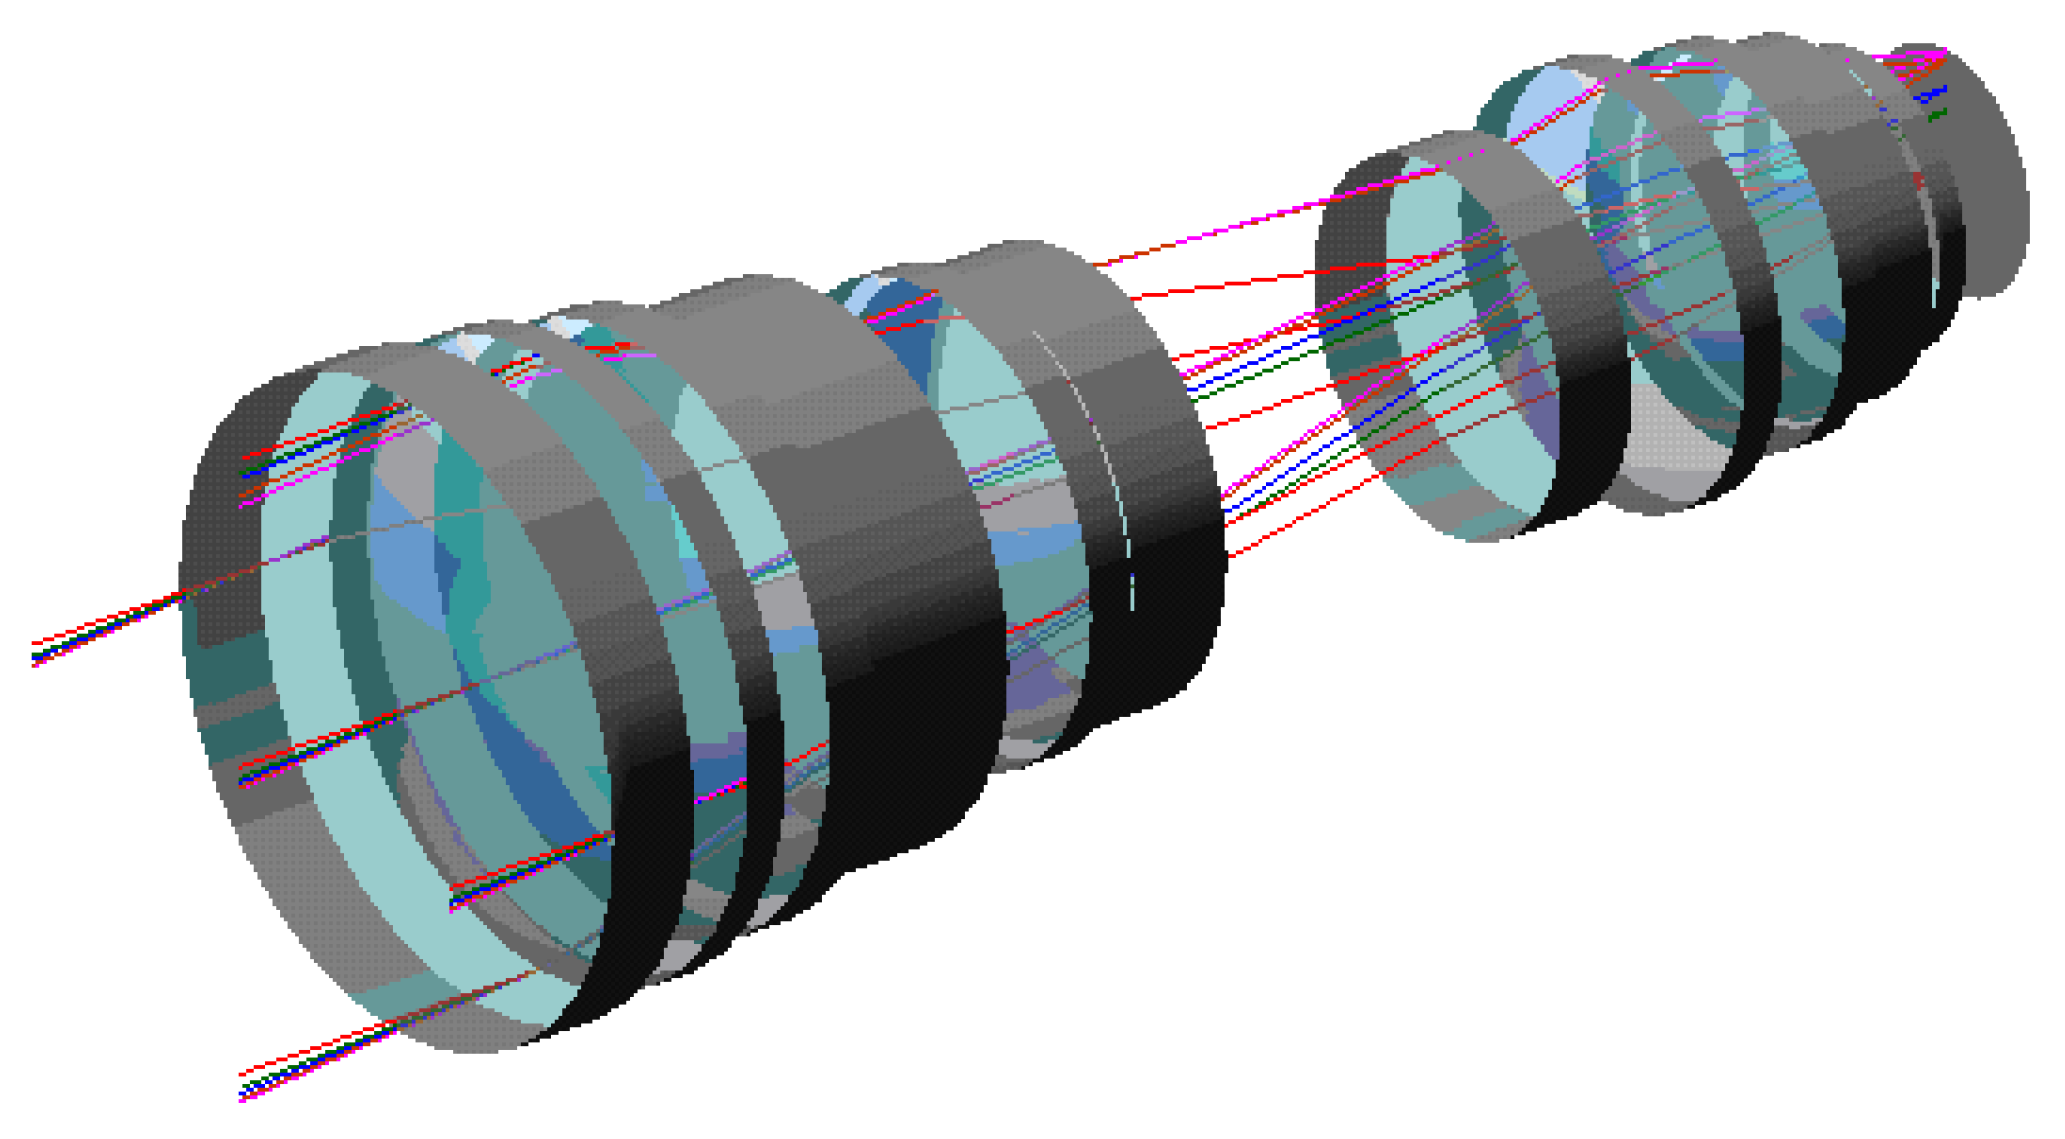
The optical system of the camera is shown in
Figure 2. It is a refractive optical system composed of 10 lenses, including window glass and filters. The aperture is 78 mm and the focal length is 170 mm. Star cameras usually feature a telecentric optical path design to effectively correct distortion. This design can greatly reduce the influence of aberrations on system performance.
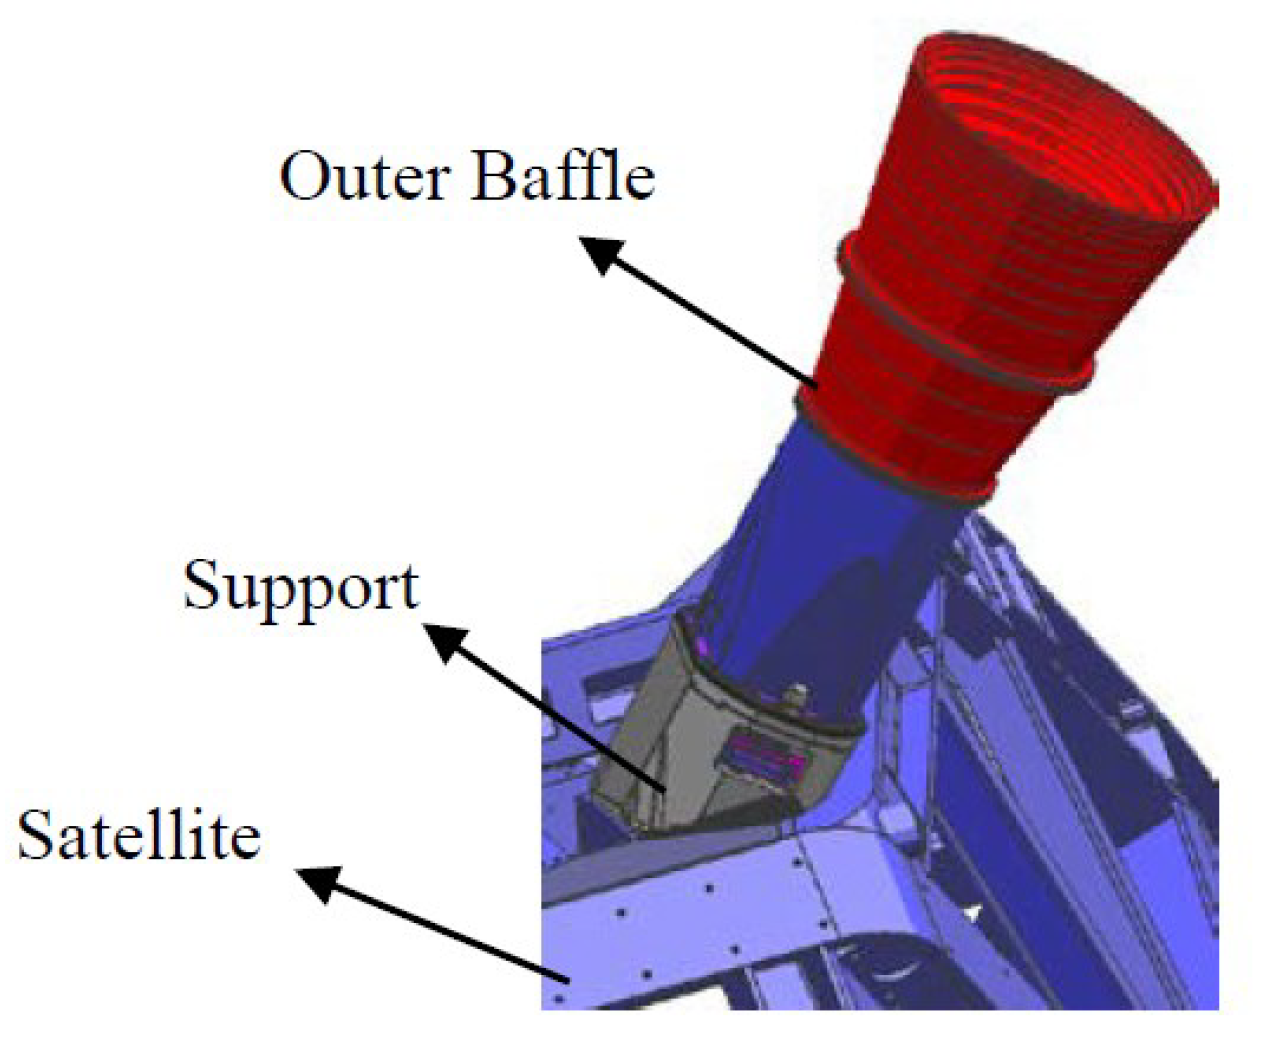
2.3. Installation of the Star Camera on the Satellite
A support is designed to adjust the line of sight of the camera to avoid it being directly affected by solar radiation. According to
Figure 3, the camera tilts from the front of the satellite to the shadow side through the support.
3. Measurement Errors Caused by Thermal Deformations
Studies have shown that when the root mean square wave difference (RMS) overall error is allocated, the thermal deformation error accounts for about half of the total error in numerical terms [
20]. Temperature has the following effects on the star camera: First, a change in temperature field causes the thermal deformation of its optical system, mainly the eccentricity, surface inclination, change in surface shape, and change in spherical radius of each lens. These effects can be quantitatively assessed by evaluating the changes in the principal point and the focal length of the optical system. Secondly, temperature changes can lead to thermal deformation of the mounting surface, including deformations in the star camera flange and the reference mounting surface. Temperature changes cause expansion or contraction of the mounting structure, which in turn changes the geometry and may lead to optical axis deviation and coordinate system misalignment.
Thermal deformation of an optical system in a star camera can be analyzed by tracking the light as it passes through the lens group. Assessing changes in focal length across different fields of view and variations in light height allows us to determine the angle change, which represents the thermal deformation error, and the thermal deformation of the mounting surface of the star camera can be combined with thermal and structural analyses. First, the temperature distribution under various conditions is obtained through thermal analysis. Subsequently, the structural analysis provides the changes in the spatial coordinates of nodes on each mounting surface based on these temperature distributions. The least-squares method is employed to fit the plane equation of the deformed installation surface. Finally, the normal angle of the installation surface is determined, representing the thermal deformation error.
It is necessary to conduct sufficient thermal design and thermal simulation analysis for the star camera to predict the on-orbit temperature and reduce the influence of temperature on the camera’s measurement accuracy.
4. Thermal Deformation Simulation Analysis of the Star Camera
4.1. Simulation Model
To analyze the thermal deformation of the star camera, a finite element model is created, as shown in
Figure 4. The structural analysis is performed using MSC NASTRAN2012, while THERMAL DESKTOP 5.3 is utilized for thermal analysis.
According to the orbit parameters and the thermal-physics parameters of multi-layer insulations (MLIs) coated on the outer side of the star camera, the worst cases are set and calculated by the software. The worst case with regard to heat is maximum external heat flow in orbit.
The boundary conditions of the worst heat case in the simulation analysis of the software are defined as follows. When the sun’s orbit angle
β is at a maximum, the solar constant is 1412 W/m
2, the Earth’s albedo coefficient is 0.35, and the Earth’s infrared radiation is 237 W/m
2. The solar absorptance and the infrared emissivity of the external surfaces of MLIs are
(the material properties at the end of life are taken). The heat generated by the star camera during on-orbit operation is 4.5 W. The mounting plate temperature of the star camera support is 21 °C. The material parameters used in the thermal simulation analysis are shown in
Table 1.
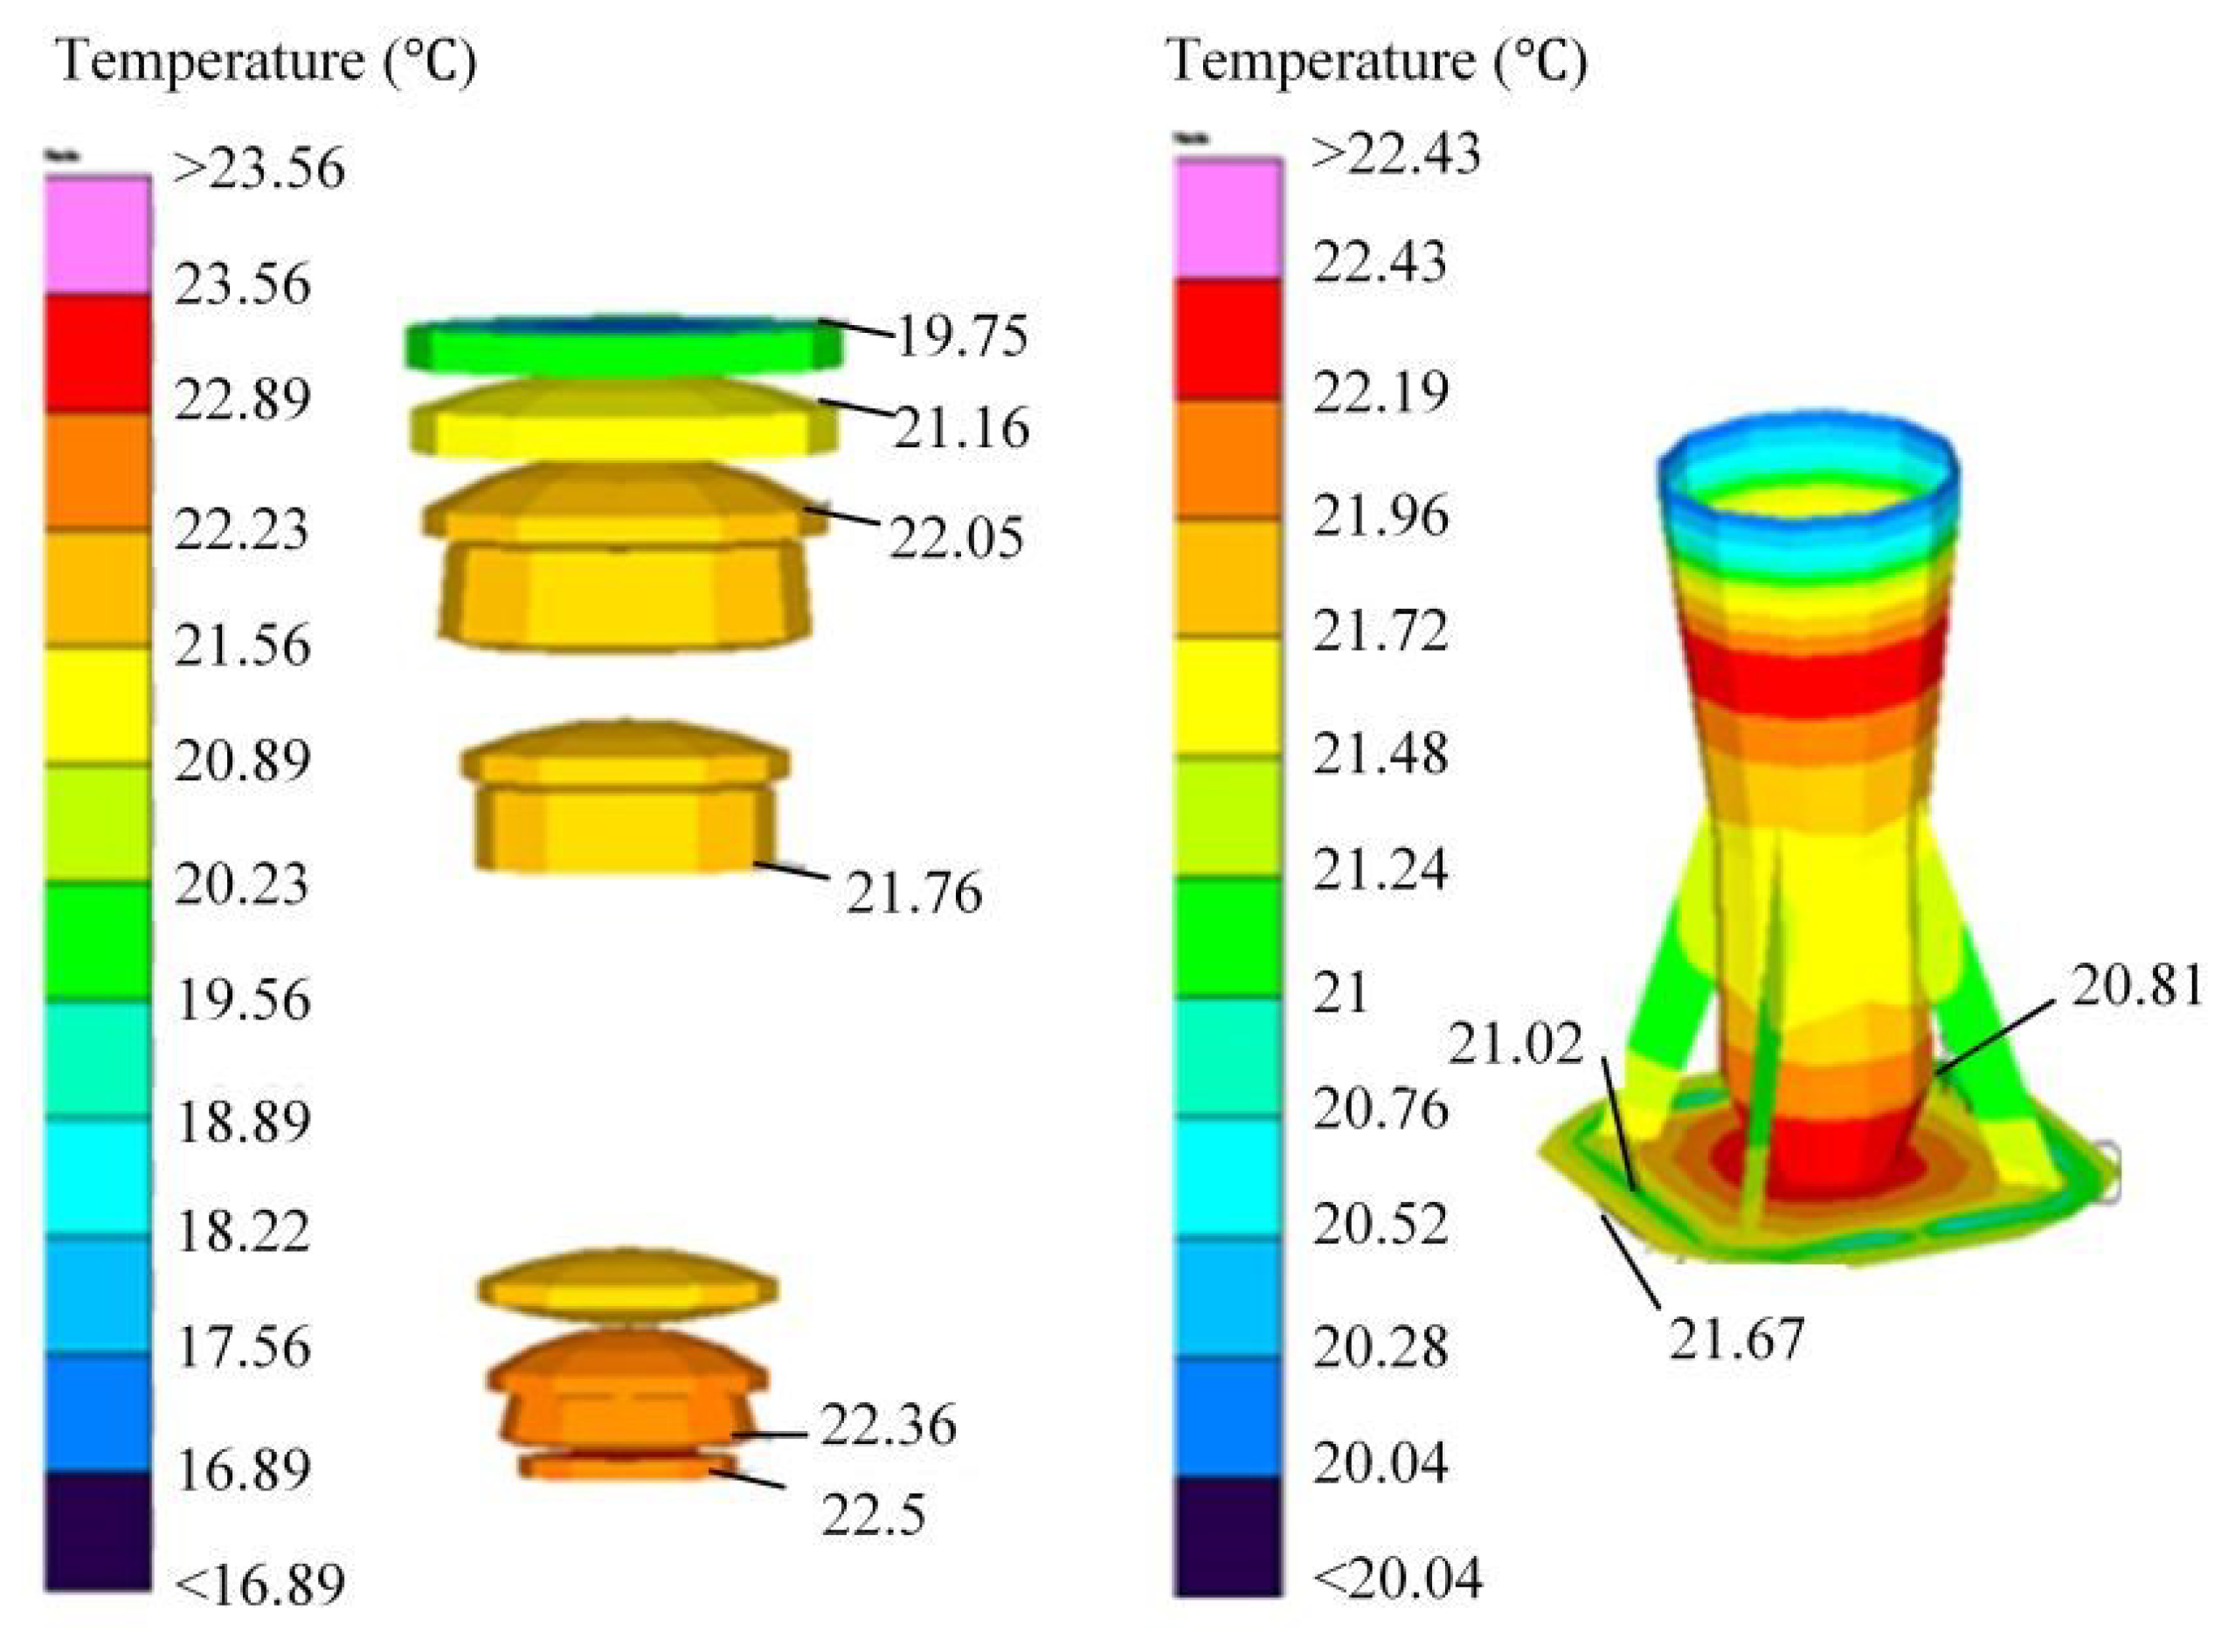
4.2. Thermal Analysis of the Optical System
Thermal simulation of the optical system is carried out for the worst heat case. The temperature of the lens group and the lens tube in this case is shown in
Figure 5. It can be seen that the temperature range of the lens group is 19.75~22.50 °C. The temperature gradient of the lens tube is 2.39 °C, as shown on the right side of
Figure 5. This result shows that the temperature difference in the lens group mainly occurs axially, and that of the single lens mainly occurs radially.
The temperature data of the lens group are imported into the structural model for thermal deformation analysis to obtain lens surface inclinations, surface shape changes, and radius changes of each lens.
The result in the worst heat case is shown in
Table 2. Each lens has an upper and lower surface. These surfaces on the first lens are named 1 and 2, those of the second lens are named 3 and 4, and so on, respectively. In
Table 2,
and
represent the title angle of the lens surface in two directions perpendicular to the optical axis. The surface shape errors are represented by the peak-to-valley (PV) and root mean square (RMS) values of the wave front error and adjustment error after removal, respectively. The last two columns correspond to the curvature radius changes before and after the calculation. The changes in
,
, PV, and RMS indicate how thermal deformation impacts the lens, including the extent of surface tilt and deformation. These factors can significantly influence the curvature radius of the optical system, which ultimately affects its focusing and imaging abilities.
Both the first and last lenses are planar, so there is no change in the radius of curvature. Through optical analysis, the focal length variation and the deviation in the chief ray in the full field of view can be obtained from the data in
Table 2. The focal length of the optical system is 167.9827 mm, and this design is considered to have a relatively large depth of field, which helps to optimize the accuracy performance of the star camera. The height difference of the chief ray in the full field of view before and after thermal deformation was calculated and converted to the angle change (the attitude error), as shown in
Table 3. The attitude error
of a single star caused by thermal deformation of the optical system does not exceed 0.24″ in the full field of view.
4.3. Thermal Analysis of the Mounting Surface
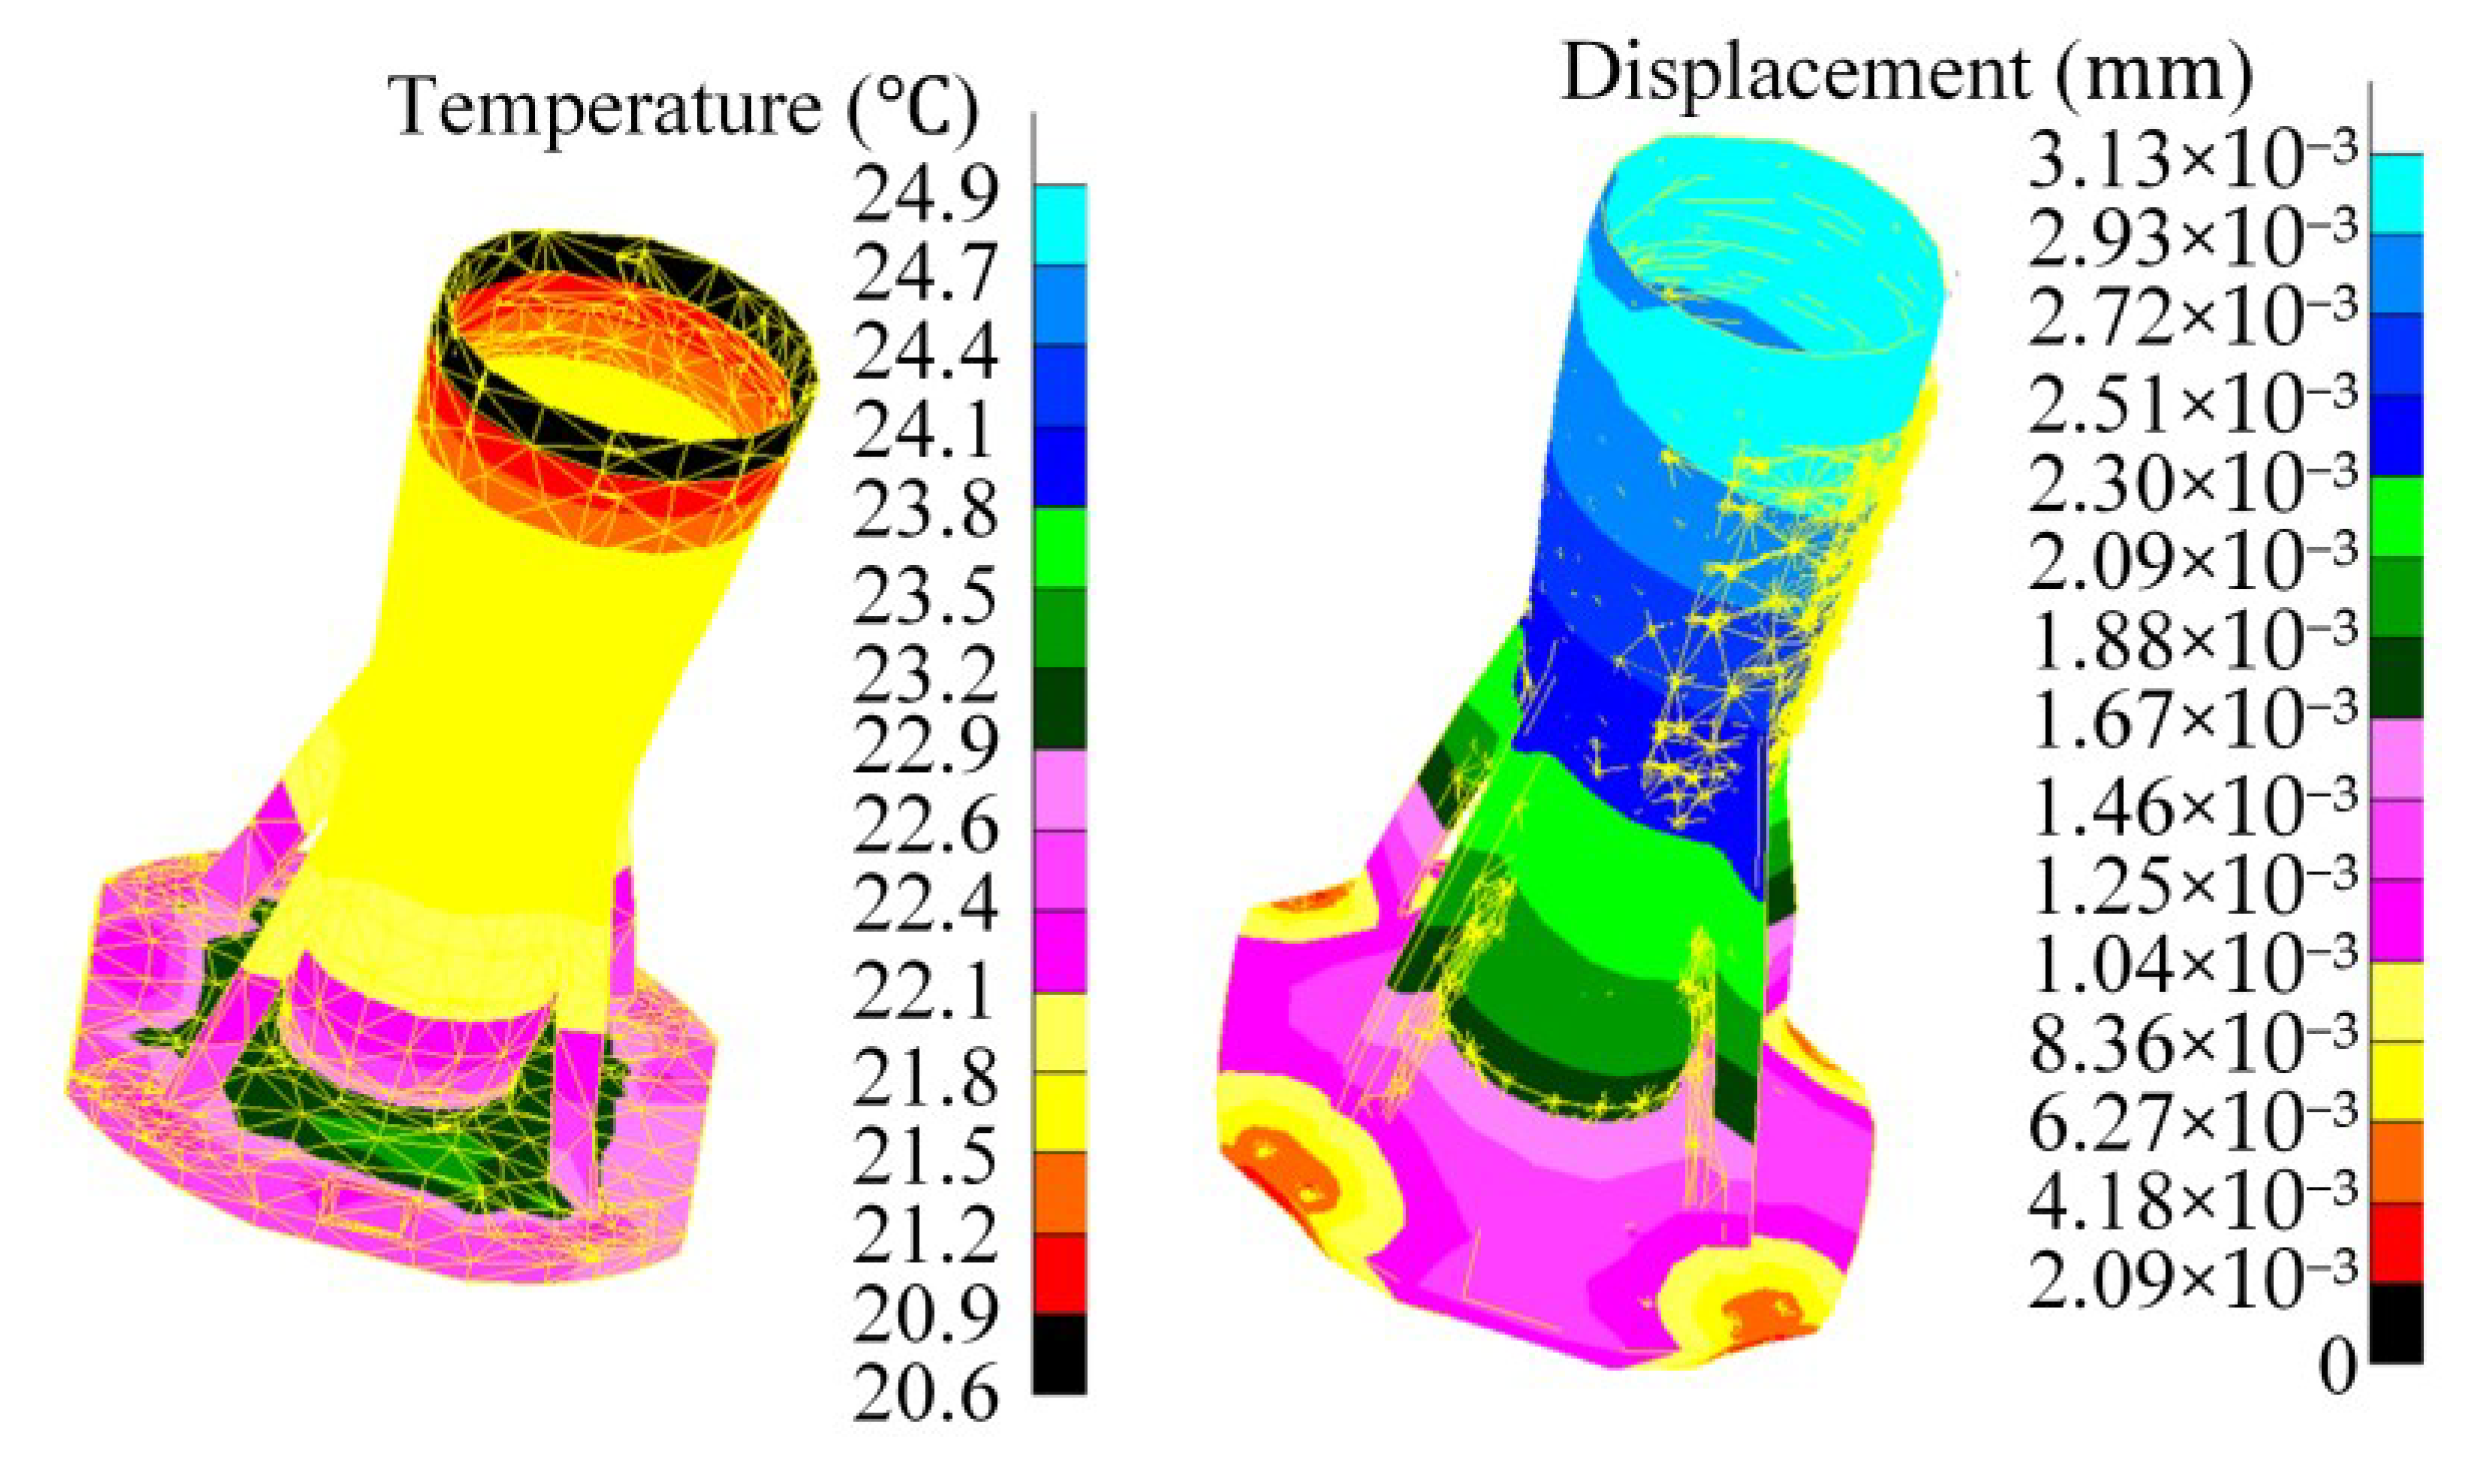
The variation in external heat flux and the degradation of MLI cause changes in the temperature of the star camera’s mounting surface, resulting in thermal stress and deformation. As shown in
Figure 6, the temperature range of the mounting surface in the worst heat case is 22.10~23.20 °C, revealing a maximum temperature gradient of 2.0 °C on the mounting surface.
By mapping the temperature data onto the structure model, the thermal deformation can be calculated through structural analysis. The total displacements of all finite element nodes are recorded, as illustrated in
Figure 6. The surface equation after deformation is fitted to determine the angle change relative to the original surface.
The thermal deformation data of the mounting surface of the star camera are counted. The spatial coordinate variations of the nodes on each installation surface under different temperature distributions are obtained through structural analysis. The deformed installation surface is then fitted using the least-squares method to derive the plane equation. Finally, the change in the normal angle of the installation surface is calculated. The angles between the normal direction of the mounting surface and the x and y axes of the coordinate system change by 0.25 and 0.18″, respectively. According to calculations, the change in the normal direction of the mounting surface by thermal deformation is 0.31″.
4.4. Thermal Analysis of the Support
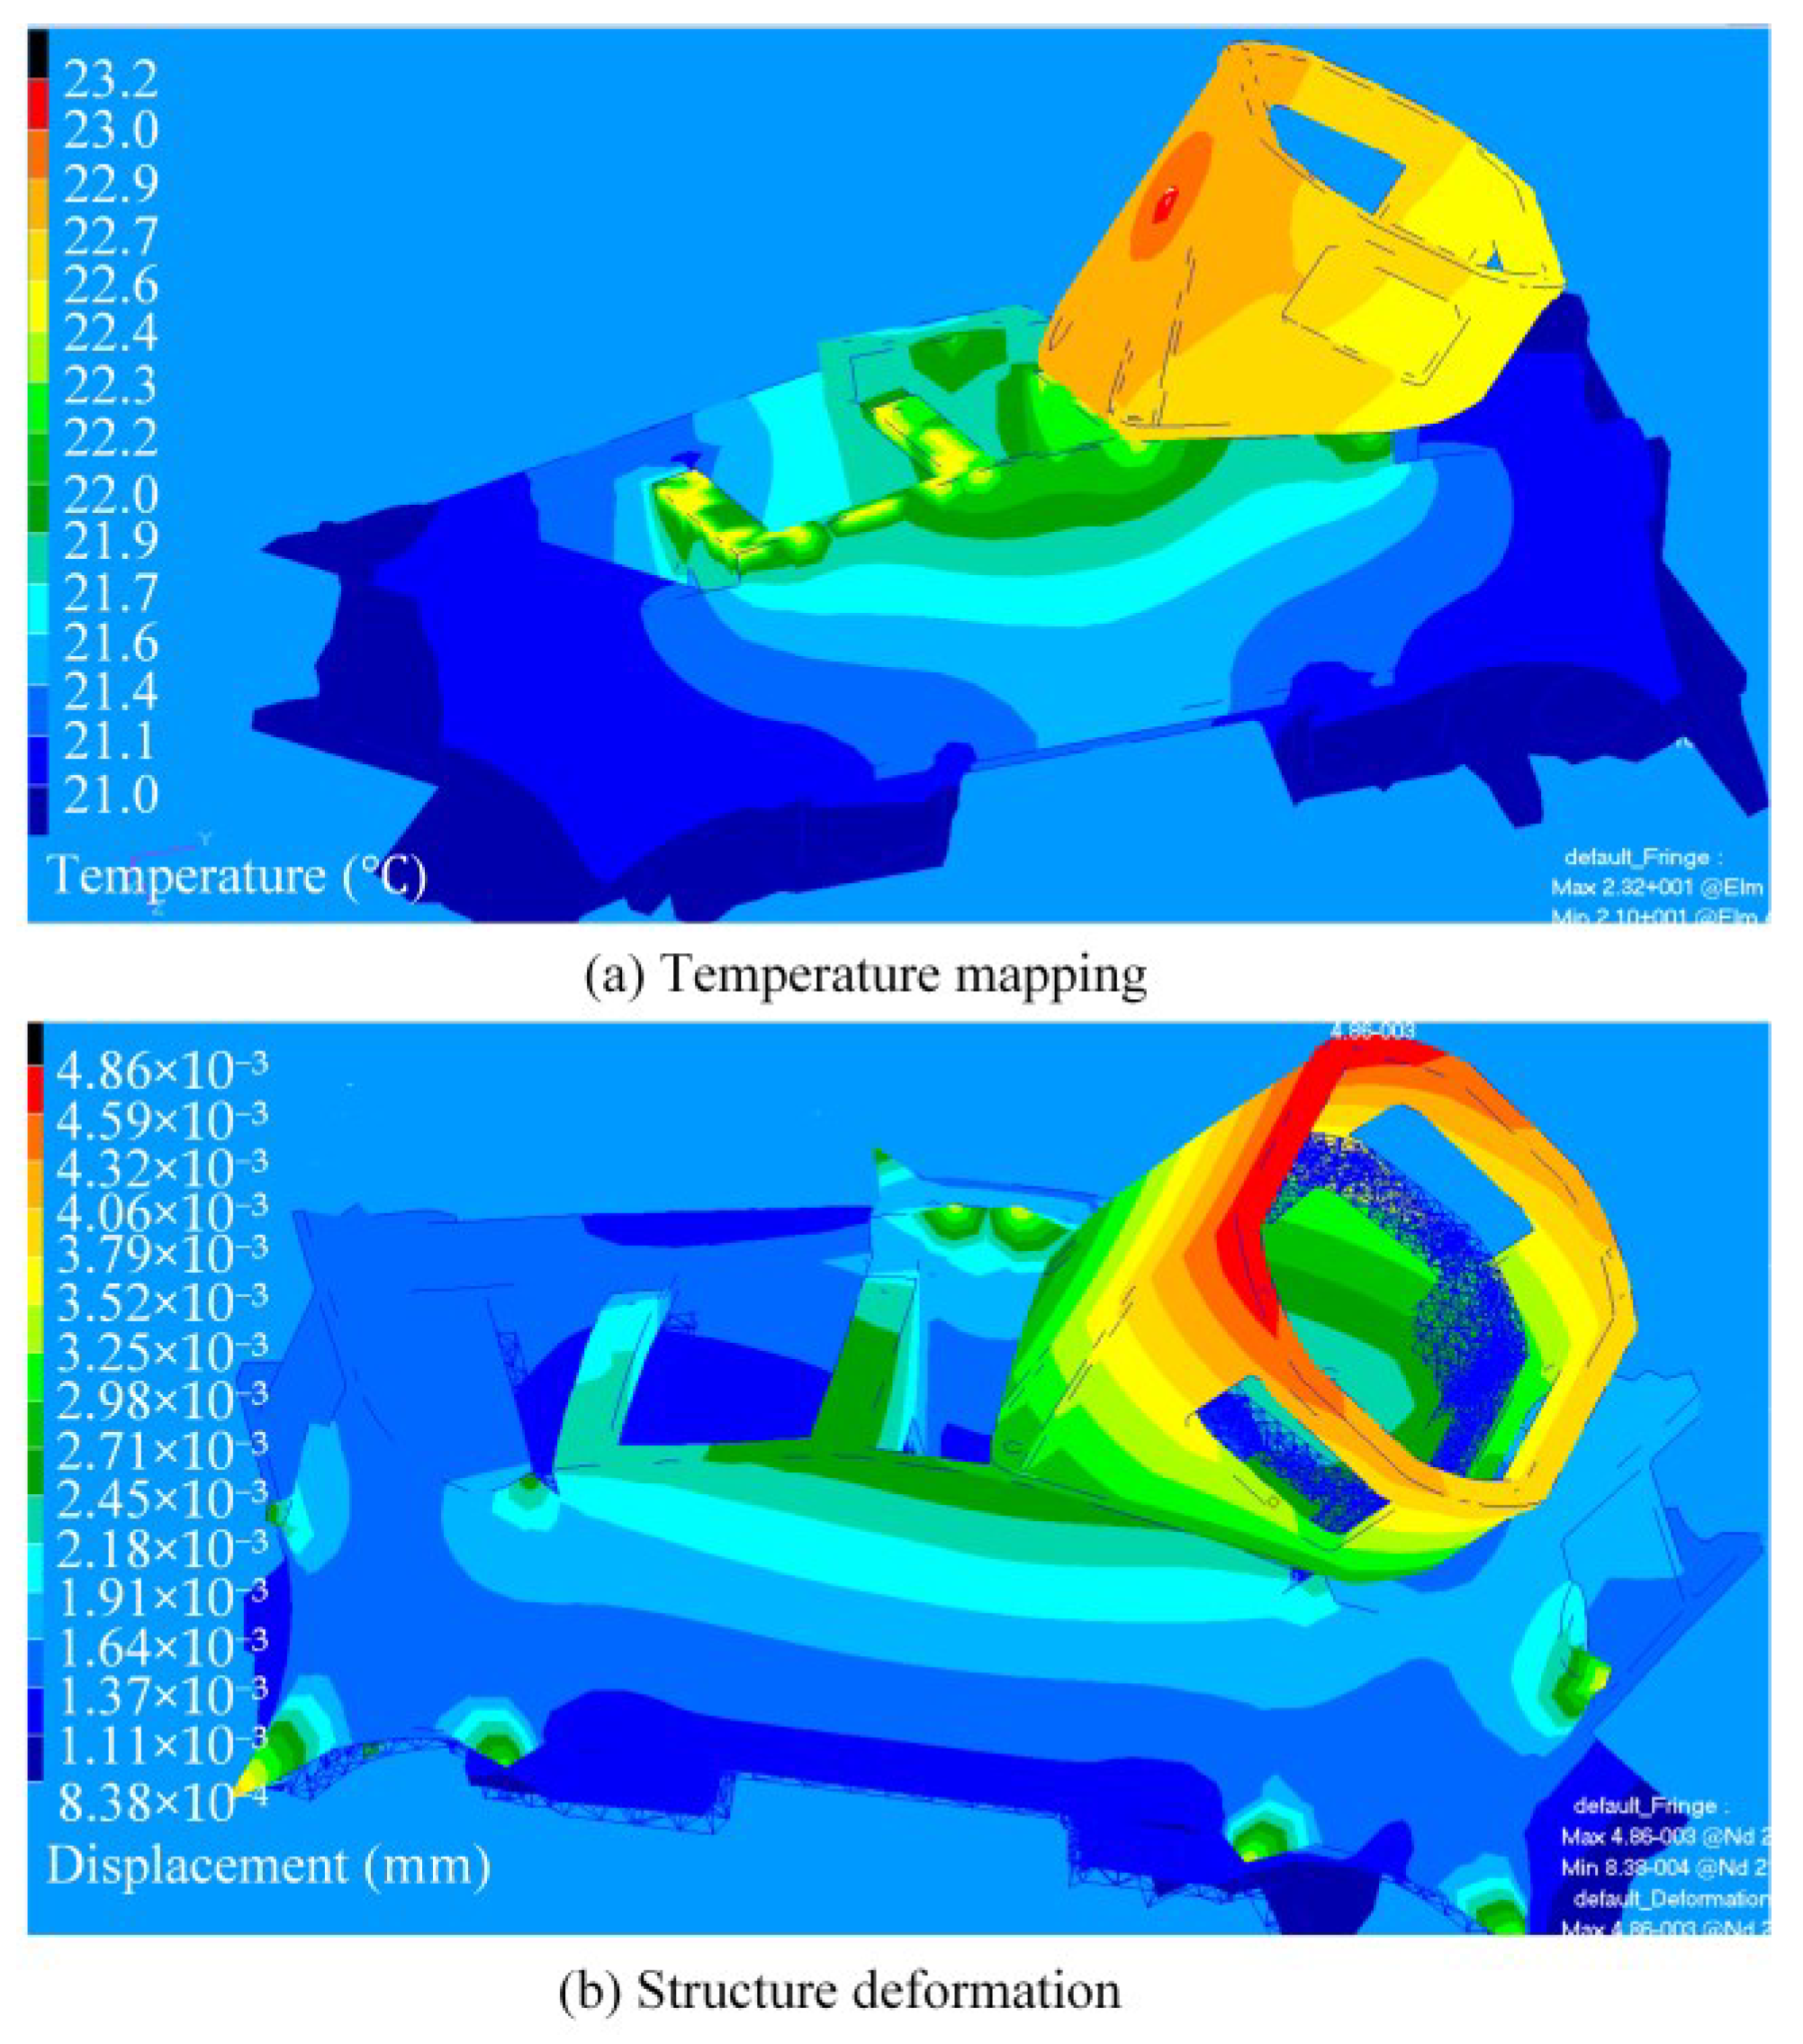
The thermal deformation analysis of the star camera support follows the same methodology as that used for the same analysis of the mounting surface. The temperature data are mapped onto the structural model to determine the displacement of each node, as illustrated in
Figure 7. The initial temperature is 21 °C. The temperature range of the support is 22.40~23.26 °C. It can be observed that the maximum temperature gradient of the star camera support is 0.86 °C. Relative to the initial temperature, the maximum temperature rises by 2.26 °C.
The angles between the normal direction of the mounting surface and the x- and y-axes of the coordinate system change by 0.25″ and 0.19″, respectively. The angle change can be calculated by rotating the coordinate system, which is 0.31″.
4.5. Results Analysis
4.5.1. Temperature Results Analysis
Thermal simulation analysis shows that the temperature gradient of the lens tube is 2.39 °C under extreme temperature conditions. The temperature range of the mounting surface in the worst heat case is 22.10~23.20 °C, revealing a maximum temperature gradient of 2.0 °C. The temperature of the lens tube meets the temperature requirement of 21 ± 3 °C. The temperature difference between the top and bottom of the lens tube does not exceed 3 °C, which verifies the thermal design.
4.5.2. Error Analysis
The three thermal deformation errors obtained from the simulation analysis are the maximum errors under the extreme temperature conditions in orbit, which belong to the limit errors. . According to error synthesis theory, the composite limit error of on-orbit thermal deformation is 0.50″, as determined by the square sum root method.
The star camera uses a quadratic 2000 × 2000 pixel CMOS as the focal plane. The size of a single pixel is 11 μm × 11 μm. The star centroid noise is 1/16 of a pixel, and there are 52 stars on average in the FOV. Thus, the noise-equivalent angle is 0.12″ (pitch or yaw). Combined with the thermal deformation error and the noise-equivalent angle, the limit error prediction value in orbit is 0.62″, which is less than 1″.
The results of our research indicate that thermal deformation significantly affects the attitude measurement accuracy of star cameras. Consequently, it is crucial to identify and analyze the sources of thermal deformation errors. By quantitatively assessing these error sources, effective preventive measures can be developed for thermal design. Moreover, robust thermal design plays a vital role in minimizing thermal deformation errors.
5. Experimental Study
The correctness of the thermal and thermal simulation temperature results was verified by the thermal balance test, and that of the predicted value of on-orbit thermal deformation error was also verified.
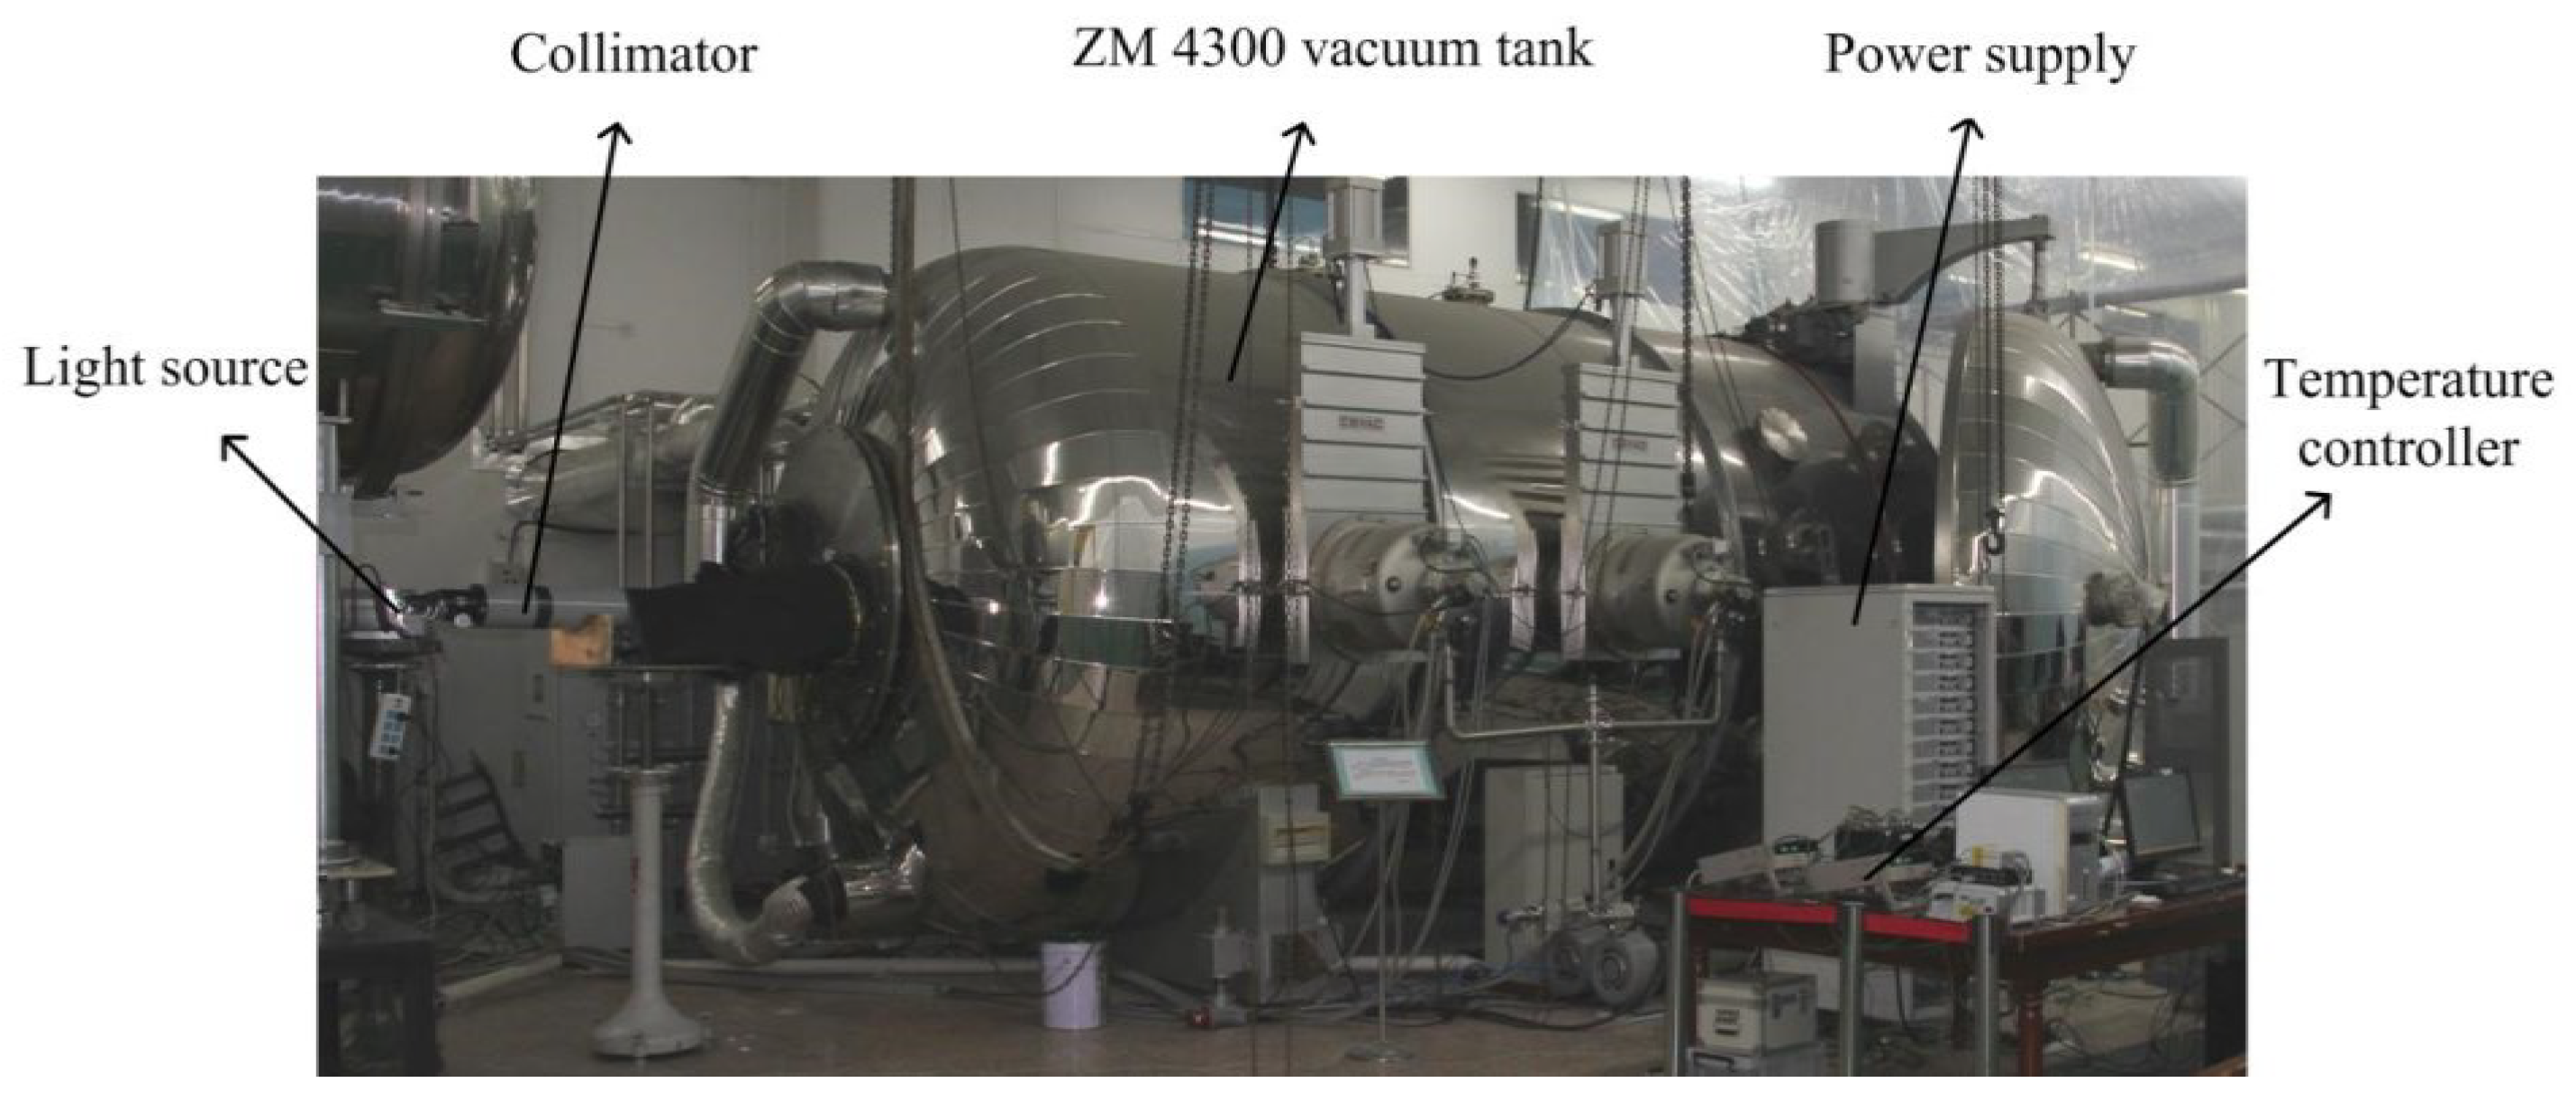
The test was carried out in a ZM4300 vacuum tank (Changchun Institute of Optics, Fine Mechanics and Physics, Chinese Academy of Sciences, Changchun, China). The temperature of the heat sink was 100 ± 5 K, and the vacuum degree was better than 1.33 × 10
−3 Pa. In the test, a light source, an integrating sphere, and a collimator were used to simulate stars, as shown in
Figure 8.
5.1. Simulation of Thermal Boundary Conditions
The star camera was installed on the rear frame of the Earth observation camera through the star camera support. In the test, a device composed of several thin plates was designed as the satellite cabin, as shown in
Figure 9. The installation interface temperature was controlled at 21 °C in the worst heat case. The inner and outer surfaces of the satellite cabin plates and the upper and lower surfaces of the simulated mounting panels were covered with 20 layers of insulation components.
5.2. External Heat Flux
The star camera was divided into three parts according to the condition of receiving external heat flux: the light entrance, the baffle, and the lens tube. The heat fluxes absorbed by the baffle and the lens tube were both set as the average value of one orbital period. The parameters of the orbital heat flux are shown in
Table 4.
5.3. Temperature Results and Analysis
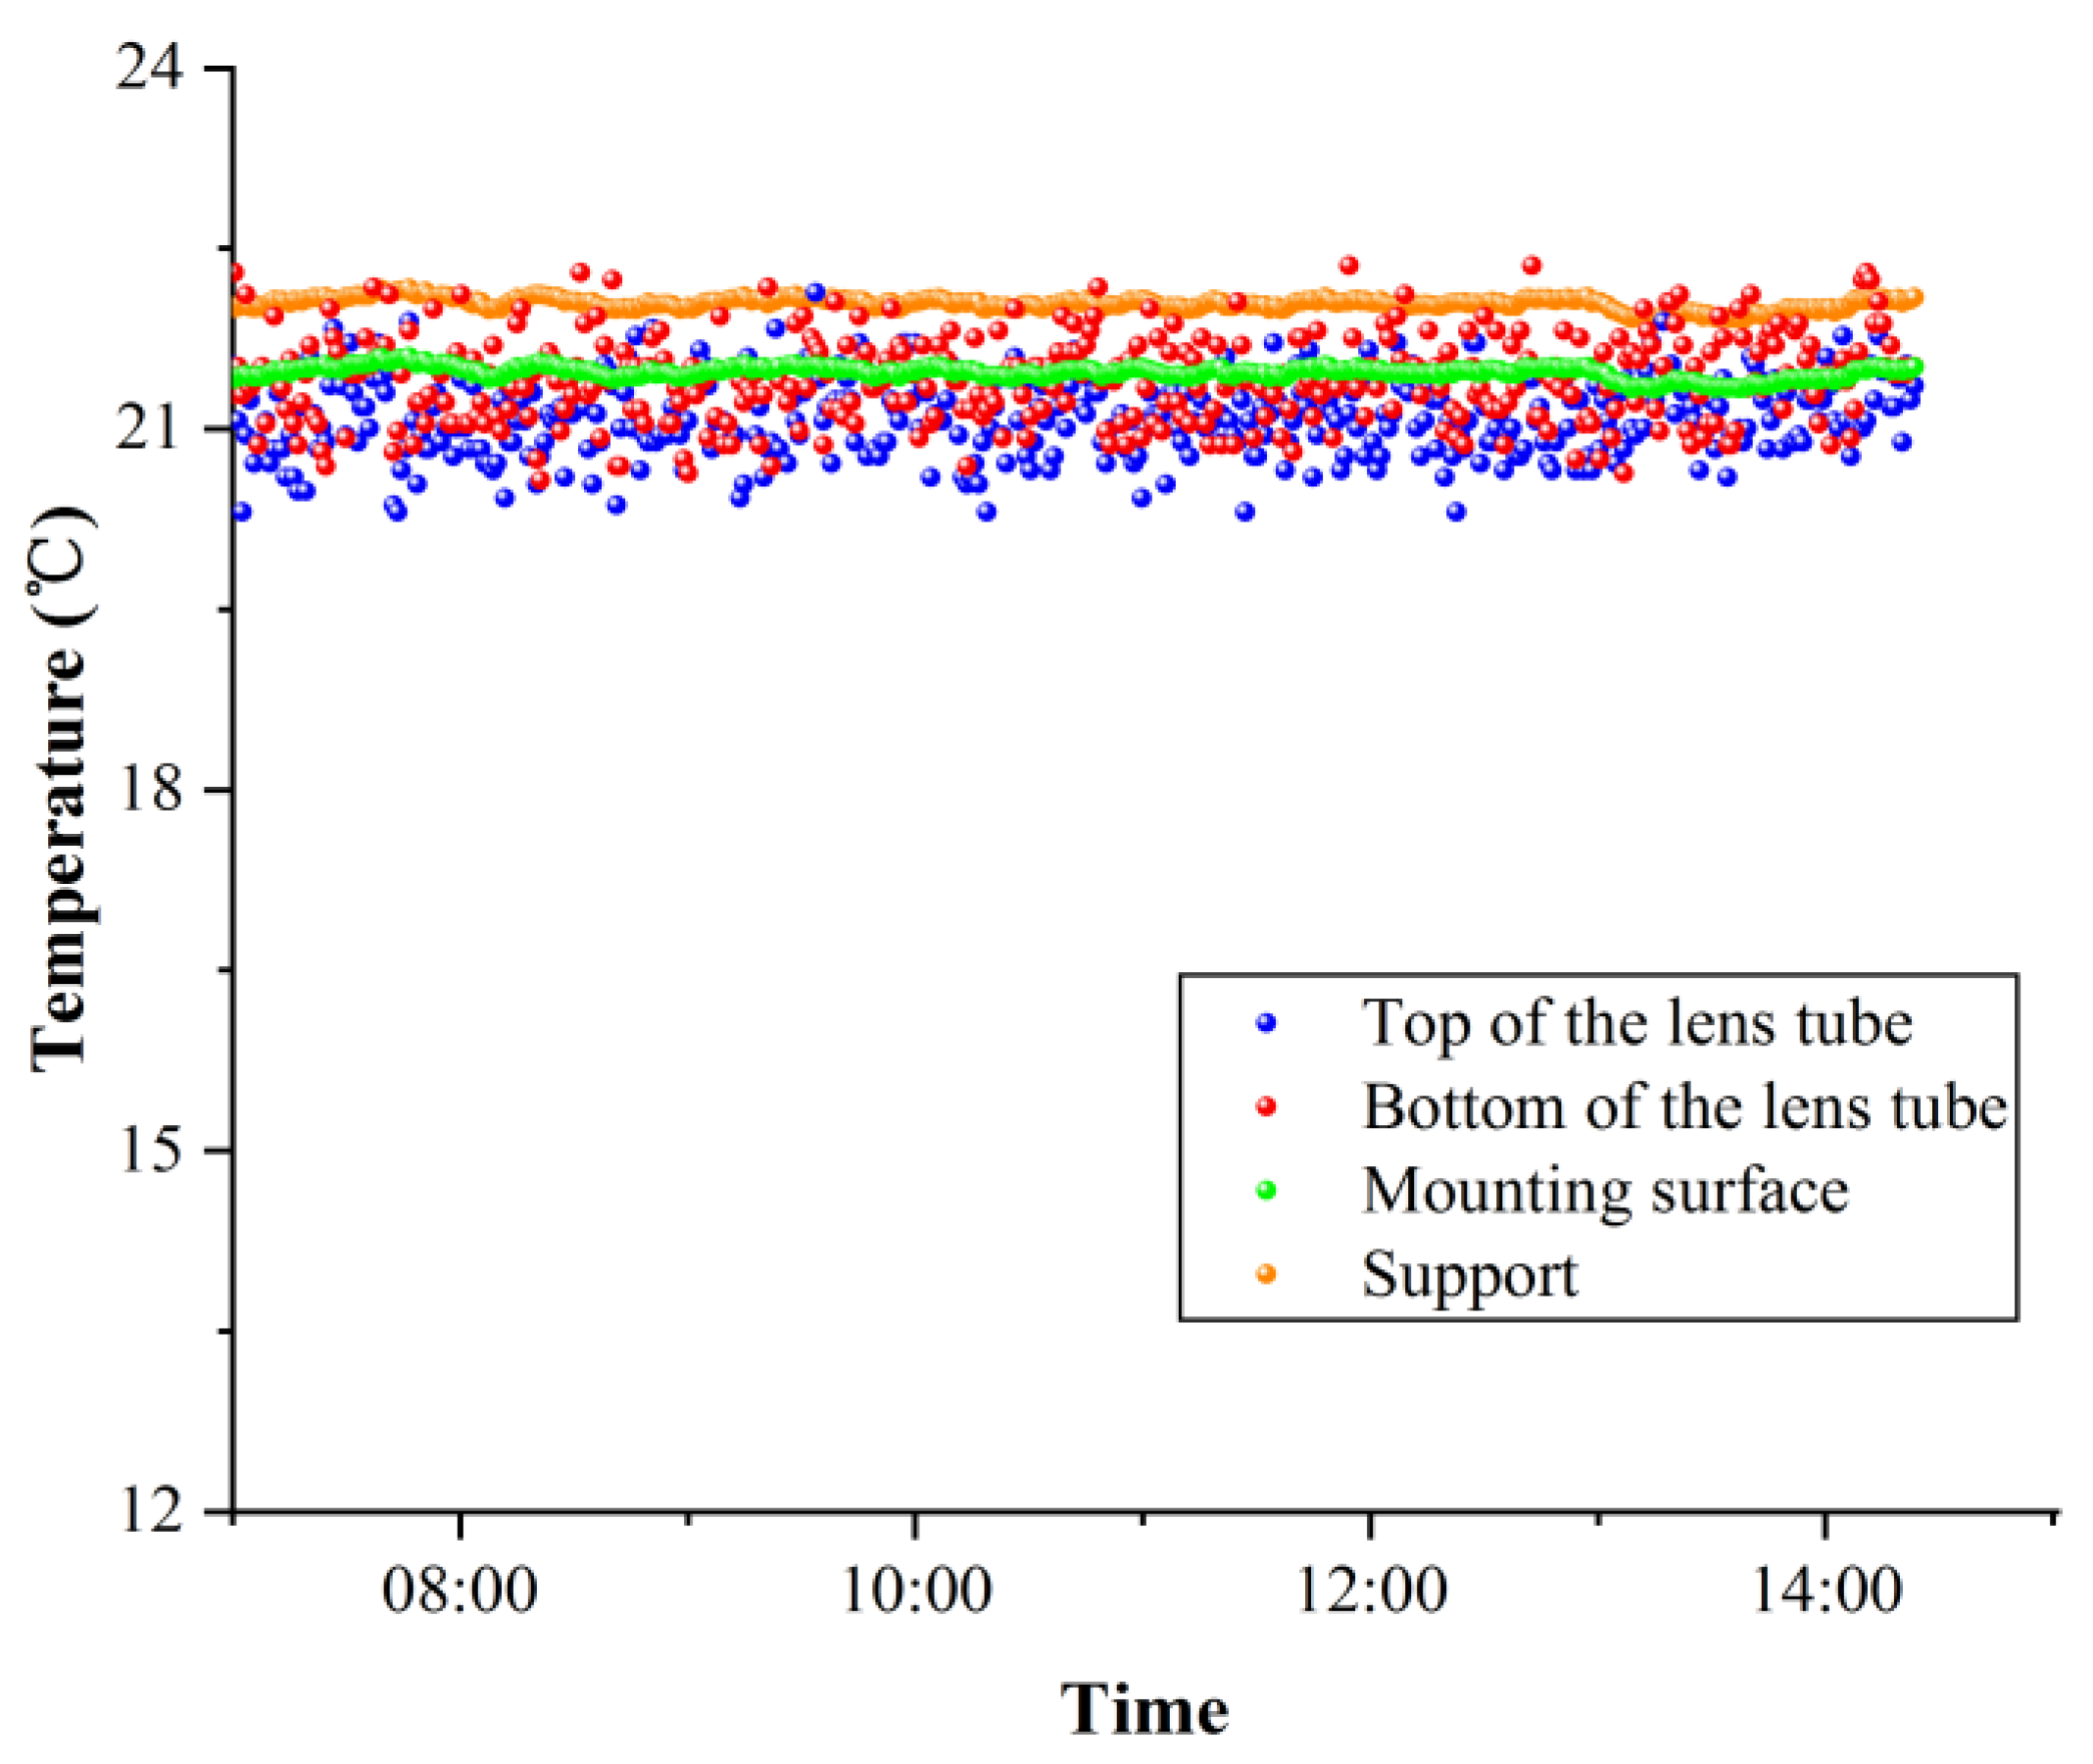
At 07:45 on the third day of testing, the worst heat case reached equilibrium, and the temperatures of the star camera are shown in
Figure 10 and
Table 5. The temperature difference between the top and bottom of the lens tube did not exceed 3 °C. The maximum absolute difference between the test results and the thermal simulation was 1.8 °C. Discrepancies between the test results and the simulation analysis primarily arise from the simplifications made in the simulation model, errors related to the vacuum environment, and data acquisition inaccuracies.
6. On-Orbit Temperature Results and Analysis
Since its launch into orbit in 2018, the star camera has been operating well so far. The retrieved telemetry temperature data in comparison to thermal simulation data are shown in
Table 6. The maximum absolute difference between the telemetry data and the thermal simulation analysis is only 1.18 °C, which proves the correctness of the thermal design.
The image of a star detected by the star camera in orbit is shown in
Figure 11. Some attitude accuracy tests have been carried out in orbit, and the results show that the attitude accuracy of the camera is better than 0.54″, which is below our predicted maximum error of 0.62″.
Therefore, the correctness of the thermal design scheme and the thermal simulation analysis is verified, and the prediction value of the maximum thermal deformation error of the orbiting camera is also significant and correct.
7. Conclusions
In this study, the thermal design of a star camera and the thermal deformation of this camera in orbit are studied using simulation analysis. Then, the thermal balance test and on-orbit temperature analysis are carried out to verify the effectiveness of the thermal design scheme and the accuracy of the thermal simulation analysis. The major conclusions are listed as follows:
(1) The thermal deformation error significantly impacts the on-orbit attitude accuracy of the star camera. Specifically, the thermal deformation of the optical system is 0.24″, while that of the mounting surface and the support surface is 0.31″. The comprehensive limit error due to on-orbit thermal deformation is determined to be 0.5″. Combined with the thermal deformation error and the noise-equivalent angle, the limit error prediction value in orbit is 0.62″.
(2) During the thermal balance test, the temperature difference between the top and bottom of the lens tube does not exceed 3 °C. The temperature range of the mounting surface is 21.40 to 21.50 °C, while that of the star camera support is 22.00 to 22.10 °C. Notably, the maximum absolute difference between the test results and the thermal simulation analysis results is only 1.80 °C.
(3) Temperature data during orbit show that the maximum absolute difference between real-life conditions and the thermal simulation analysis is only 1.18 °C, and the attitude accuracy of the star camera is better than 0.54″. These results fully demonstrate the accuracy of the thermal design and the necessity of predicting thermal deformation errors in orbit.
Author Contributions
Conceptualization, F.J. and L.W.; methodology, H.D.; software, L.Z.; validation, D.K., H.G. and J.L.; formal analysis, H.D.; investigation, Z.W.; writing—original draft preparation, L.W.; writing—review and editing, L.W.; visualization, F.J.; supervision, Z.W.; project administration, J.L. All authors have read and agreed to the published version of the manuscript.
Funding
This research received no external funding.
Data Availability Statement
The original contributions presented in this study are included in the article/
Supplementary Materials. Further inquiries can be directed to the corresponding author(s).
Conflicts of Interest
The authors declare no conflicts of interest.
References
- Ji, Y.; Shi, R.; He, H.; Xu, L.; Liu, X.; Jin, Y.; Shen, W. Compact optical imaging system for star tracker with long focal length and perfect thermal adaptability. Proc. SPIE Int. Soc. Opt. Eng. 2012, 8557, 19. [Google Scholar]
- Janson, S.W.; Welle, R.P.; Rose, T.S.; Rowen, D.W.; Hinkley, D.A.; Hardy, B.S.; La Lumondiere, S.D.; Maul, G.A.; Werner, N.I. The NASA Optical Communication and Sensors Demonstration Program: Preflight Up-Date; NASA: Washington, DC, USA, 2015. [Google Scholar]
- Liebe, C.C. Accuracy performance of star trackers—A tutorial. IEEE Trans. Aerosp. Electron. Syst. 2002, 38, 587–599. [Google Scholar] [CrossRef]
- Wang, X.; Guan, X.; Fang, J.; Li, H. A high accuracy multiplex two-position alignment method based on SINS with the aid of star sensor. Aerosp. Sci. Technol. 2015, 42, 66–73. [Google Scholar] [CrossRef]
- Sun, Y.; Xiao, Y.; Geng, Y. On-orbit calibration of star sensor based on a new lens distortion model. In Proceedings of the 32nd Chinese Control Conference, Xi’an, China, 26–28 July 2013. [Google Scholar]
- Blarre, L.; Ouaknine, J.; Oddos-Marcel, L.; Martinez, P.E. High Accuracy Sodern Star Trackers: Recent Improvements Proposed on SED36 and HYDRA Star Trackers. In Proceedings of the AIAA Guidance, Navigation, and Control Conference and Exhibit, Keystone, CO, USA, 21–24 August 2006. [Google Scholar]
- Huang, H. Research on Thermal Flow Calculation and Internal Thermal Analysis of Satellites in Orbit; Jilin University: Changchun, China, 2024. [Google Scholar]
- Tan, W.; Luo, J.; Hao, Y.; Jia, H. Study on the Influence of Temperature on the Image Surface Displacement of Star Sensor Optical System. Opt. Technol. 2009, 35, 186–193. [Google Scholar]
- Zhong, H.; Zhang, Z.; Liang, S.; Lu, X.; Yang, J.; Li, X.; Li, Y. Analysis and test of solar irradiation effect of APS star sensor. Space Control. Technol. Appl. 2014, 40, 53–62. [Google Scholar]
- Bass, M.; De Cusatis, C.; Li, G.; Enoch, J.; Lakshminarayanan, V.; MacDonald, C.; Mahajan, V.N.; Van Stryland, E. Handbook of Optics: Volume IV—Opticcal Properties of Materials, Nonlinear Optics, Quantum Optics; McGraw Hill: New York, NY, USA, 2010. [Google Scholar]
- Baeumer, S.M.; Timmers, W.A.; Krichever, M.; Gurevich, V. Temperature-compensated plastic lens for visible light. Proc. SPIE Int. Soc. Opt. Eng. 1999, 3737, 354–362. [Google Scholar]
- Liu, H.; Tan, J.; Shen, B. Thermal/structural/optical analysis of star sensor optical system. J. Astronaut. 2010, 31, 875–879. [Google Scholar]
- Tan, W.; Yang, J.; Zhu, M.; Shen, D.; Zen, W. Study on Temperature Distribution Function of Star Sensor. Laser Optoelectron. Prog. 2010, 47, 70801. [Google Scholar] [CrossRef]
- Hu, X.; Wu, Y.; Ren, P.; Wu, B.; Lu, J. The Influence of Temperature on Vacuum Calibration Accuracy of Star Sensor and Its Compensation; Major Special Management Office of High Resolution Earth Observation System; Chinese Academy of Sciences: Beijing, China, 2017. [Google Scholar]
- Podbreznik, P.; Potocnik, B. The influence of temperature variations on calibrated cameras. Int. J. Comput. Inf. Sci. Eng. 2008, 2. [Google Scholar]
- Jiang, G.; Wu, Z.; Chao, Z.; Fu, S. Analysis on temperature effect of typical structure of lens in vision measurement. Proc. SPIE—Int. Soc. Opt. Eng. 2014, 9142, 2458–2462. [Google Scholar]
- Guan, Z.C.; Zhang, G.; Jiang, Y.; Zhong, X.; Deng, M.; Li, B.; Zhang, H. Detection of the angle change between camera and star tracker based on star observation. Annals of the Photogrammetry. Remote Sens. Spat. Inf. Sci. 2022, 1, 77–83. [Google Scholar]
- Guan, Z.C.; Zhang, G.; Jiang, Y.; Shen, X. Low-Frequency Attitude Error Compensation for the Jilin-1 Satellite Based on Star Observation. IEEE Trans. Geosci. Remote Sens. 2023, 61, 1. [Google Scholar] [CrossRef]
- Tang, Y.J.; Wei, Z.; Wei, X.; Li, J.; Wang, G. On-Orbit Calibration of Installation Matrix between Remote Sensing Camera and Star Camera Based on Vector Angle Invariance. Sensors 2020, 20, 5667. [Google Scholar] [CrossRef] [PubMed]
- Liu, H.; Tan, J.; Hao, Y.; Jia, H.; Tan, W.; Yang, J. The Influence of Environmental Temperature on the Measurement Accuracy of Star Sensors. Optoelectron. Eng. 2008, 35, 5. [Google Scholar] [CrossRef]
| Disclaimer/Publisher’s Note: The statements, opinions and data contained in all publications are solely those of the individual author(s) and contributor(s) and not of MDPI and/or the editor(s). MDPI and/or the editor(s) disclaim responsibility for any injury to people or property resulting from any ideas, methods, instructions or products referred to in the content. |
© 2024 by the authors. Licensee MDPI, Basel, Switzerland. This article is an open access article distributed under the terms and conditions of the Creative Commons Attribution (CC BY) license (https://creativecommons.org/licenses/by/4.0/).

 ,
, 


